Embed Size (px)
Citation preview

Bioenergy: Large-Scale Production and Climate Change Implications
Jerome Weingart and Judy SiegelEnergy and Security Group
Reston, Virginia (USA)
International Conference on Sustainable Bioenergy
Bonn, Germany October 12-13, 2006

Focus of presentation• Principal climate impact areas: large-scale
biomass production and use for energy • Research and analysis necessary to
understand these impacts• Case example: potential of liquid biofuels
to offset GHG emissions in the road transport sector of developing Asia (excludes Japan, S. Korea, Singapore).

Constraints: Biofuels Production and Use• Environmental impacts (land conversion)
– Tropical forest replacement by monocrops– Deforestation– Diminished ecological diversity and resilience;
destruction of wildlife habitat– Nutrient leaching– Pollution from chemicals– Loss of watersheds– Soil erosion, mud slides, and forest fires
• Need to protect soil productivity, water quality, and other ecosystem services (WRI)

Constraints: Biofuels Production and Use
• Potential competition for food production
• Availability of suitable land

Land required for long-term global biofuels feedstock production (10% substitution) *
* IEA (2004) Automotive Fuels for the Future (pp 75-76)
Biofuel 107 ha % world cropland
Ethanol
(cellulose)
15 10 %
Ethanol
(sugar beet)
16 11 %
Ethanol
(sugar beet)
6 4 %
Biodiesel 17 12 %
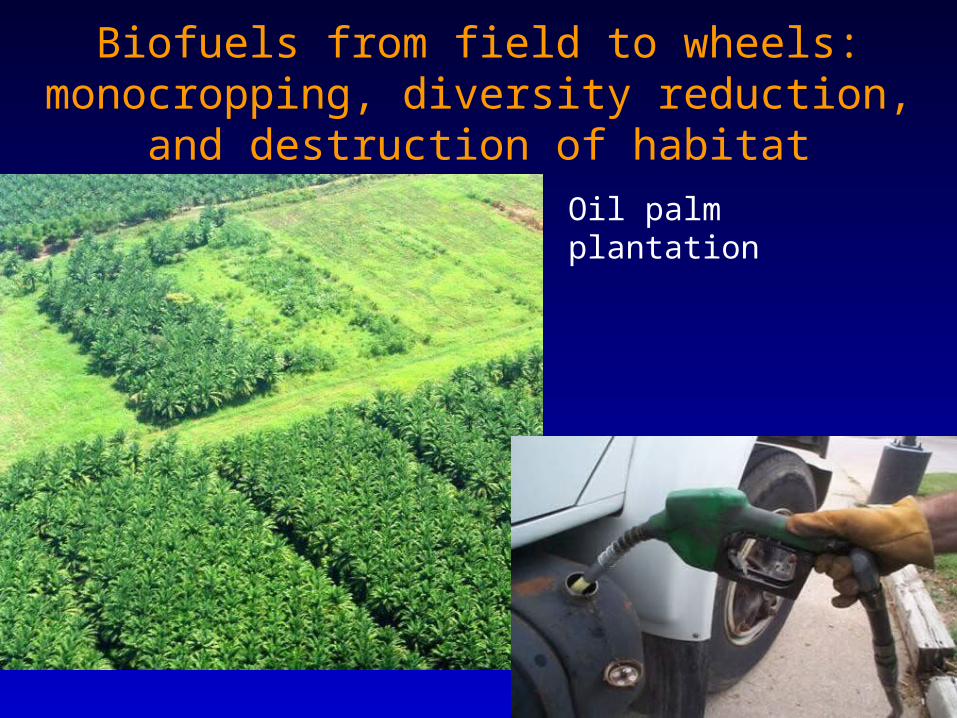
Biofuels from field to wheels: monocropping, diversity reduction, and destruction of habitat
Oil palm plantation
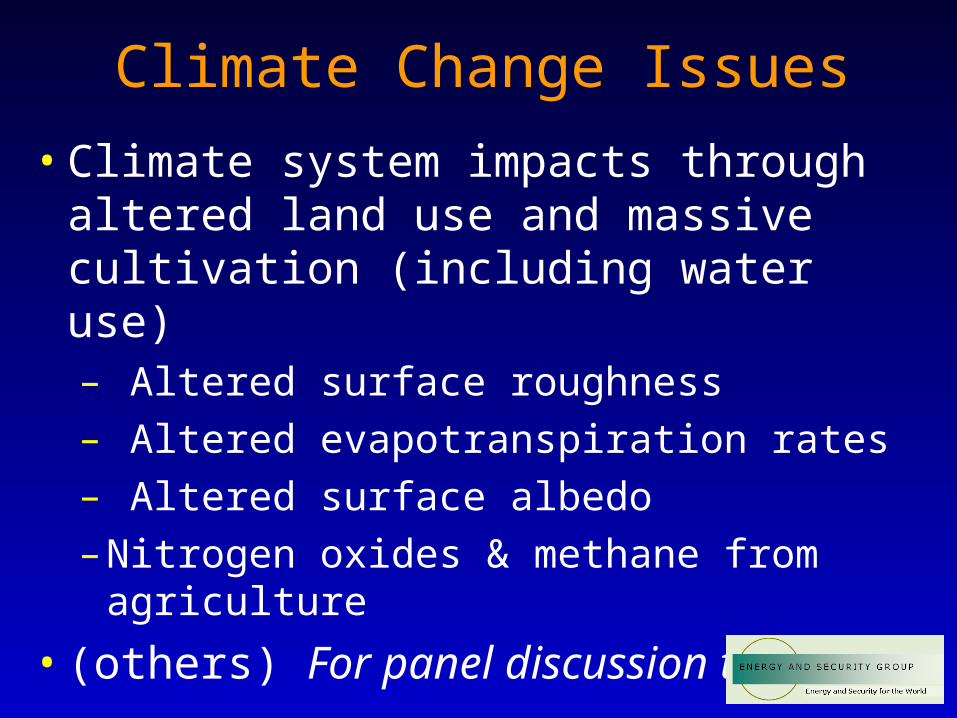
Climate Change Issues
• Climate system impacts through altered land use and massive cultivation (including water use)– Altered surface roughness
– Altered evapotranspiration rates
– Altered surface albedo
– Nitrogen oxides & methane from agriculture
• (others) For panel discussion today

Biofuels Climate Benefits
• GHG emissions displacement
• Improved air quality (tailpipe emissions reductions)
• Reclamation of degraded land (e.g. via Jatropha)
• Reduction of sand storms and atmospheric dust
• Slowing of desertification (eventual reversal?)

Greenhouse Gas Emissions from the Asia Vehicle Transport Sector *
Scenarios for market penetration of low-GHG biofuels
J. Weingart (2006). Analysis for the Asian Development Bank

Global GHG Emissions from Energy
* World Resources Institute (2005). Navigating the Numbers

Global GHG Emissions from Transport
* World Resources Institute (2005). Navigating the Numbers

Road fuels global production in 2005
Fuel Production (billion liters/year)
Crude oil 4,705
Gasoline (road sector) IEA model 1,289
Diesel (road sector) IEA model 668
Bioethanol (1.7% energy basis) 33
Biodiesel (0.5% energy basis) 4

World-wide demand for liquid fuels for road transport (IEA/SMP) 2000 - 2050
ChinaIndiaOther Asia
OECD North America
OECD EuropeOECD Pacific
Rest of World
0
500
1,000
1,500
2,000
2,500
3,000
3,500
2000 2010 2020 2030 2040 2050
Year
MM
toe
/ye
ar
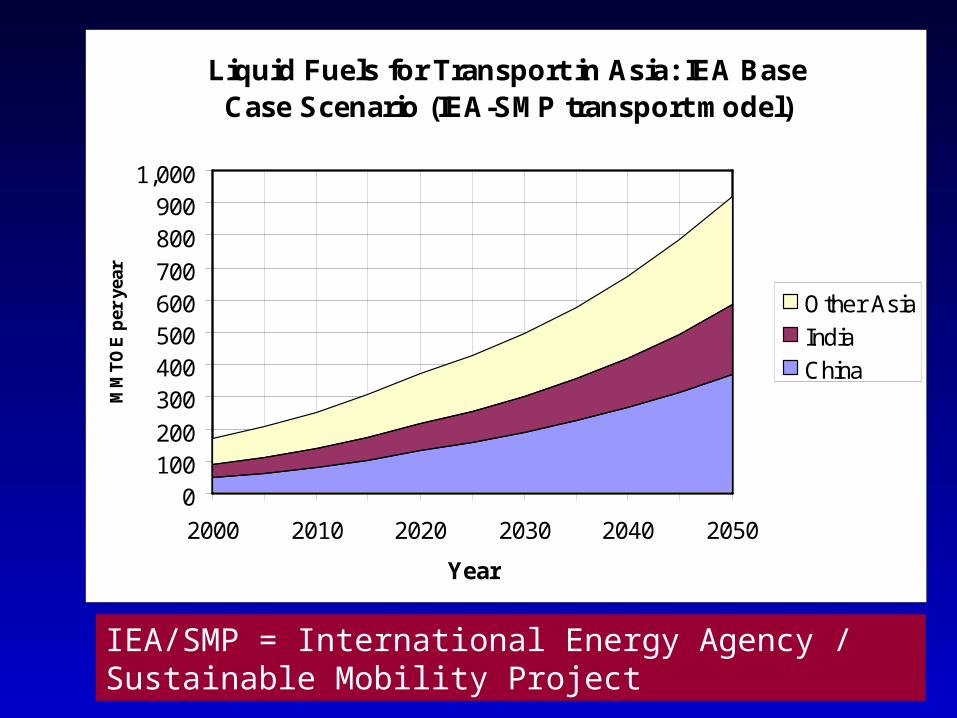
Liquid Fuels for Transport in Asia: IEA Base Case Scenario (IEA-SMP transport model)
0100200
300400500600700
800900
1,000
2000 2010 2020 2030 2040 2050
Year
MM
TO
E p
er y
ear
Other Asia
India
China
IEA/SMP = International Energy Agency / Sustainable Mobility Project

Vehicle Ownership Rate Estimates for China and India
0
50
100
150
200
250
1990 2000 2010 2020 2030 2040 2050 2060
Veh
icle
s p
er 1
,000
peo
ple
China
India

China – from this, to …

this, and to …

This!

The future (?): 6-fold GHG emissions growth from Asia road transport
MMT CO2-e per year for China, India, and emerging Asia road transport fuels
0
500
1000
1500
2000
2500
3000
3500
2000 2010 2020 2030 2040 2050
MM
T C
O2
-e/y
ea
r
Gasoline
Diesel
* Reference case (from IEA/SMP model)

Why are we interested in biofuels for the Asian road transport sector?
• Potentially competitive with petrofuels• Indigenous, can offset imported petroleum • Significant reduction in tailpipe emissions • Potential for major reduction (80 – 95%) in
net unit life-cycle GHG emissions compared with petrofuels, and
• Potential for large-scale sustainable production (perhaps)

What is a scenario?
• A scenario is like a screen play for the future.
• A scenario is NOT a prediction; it asks “what if”, using rules that reflect real world market dynamics and constraints

What is a market penetration scenario?
• Model of a possible future • Analytic – logistic penetration model for
increasing market share of an “intruder” into an “incumbent” market (“S”-shaped curve)
• Permits specification of key parameters to assess impacts of alternative penetration rates and ultimate market fraction for new options

Stages of market penetration
Logistic Penetration (1% to 50% in 20 years)
-0.10.20.30.40.50.60.70.80.91.0
0 5 10 15 20 25 30 35 40 45
Year
Fra
cti
on
of
ma
rke
t p
en
etr
ati
on Maturation
Market dynamism
Expansion
Prototype
Pioneering
Illustrative phases of market development
Takeoff

Two illustrative scenarios: biofuels penetration of road fuel markets in Asia
• 10% to 90% penetration in 50 years
• Logistic (“S”-shaped) penetration
• “Extreme” biofuels market penetration S1– Potential market = 50% road fuels– 75% lower associated GHG emissions
• “Ultimate” biofuels market penetration S2– Potential market = 100% road fuels– 90% lower associated GHG emissions

25
GHG Emissions Impacts of BiofuelsField-to-wheel CO2-equivalent GHG emissions
from biofuels, per km, relative to base fuel
-120%
-100%
-80%
-60%
-40%
-20%
0%
Ethanolfrom grains,
US/EU
Ethanolfrom sugarbeets, EU
Ethanolfrom sugar
cane, Brazil
Ethanolfrom
cellulosicfeedstocks
Biodieselfrom
rapeseed,EU
Source: L. Fulton (2004), IEA (currently at UNEP Nairobi)

Asia road transport GHG emissions with and without accelerated biofuels penetration S1
-
500
1,000
1,500
2,000
2,500
3,000
3,500
1990 2000 2010 2020 2030 2040 2050 2060
Year
MM
T C
O2-e
/yea
rPetroleum fuels With biofuels
Business as usual GHG emissions
Biofuels and reduced GHG emissions

Asia road transport GHG emissions with and without extreme biofuels penetration S2
-
500
1,000
1,500
2,000
2,500
3,000
3,500
1990 2000 2010 2020 2030 2040 2050 2060
Year
MM
T C
O2
-e/y
ea
rBase case 100% petro fuels Aggressive penetration low GHG biofuels
Business as usual GHG emissions
High biofuels penetration GHG emissions

How to maximize biofuels offsets of GHG emissions
• Reduce growth in transport fuel demand
• Increased end use efficiency is much less expensive than expanding supply
• This is the “golden rule” for renewables

Potential next steps
• Consistent life-cycle analysis for large-scale bio-ethanol and biodiesel production/use (“platform” for climate impact analysis and assessment)
• Collaboration among national biofuels working groups using compatible LCA and environmental impact methodologies
• Establishment of biofuels collaboratives for collaboration, coordination, technical assistance, and knowledge management

New Bioenergy Center (Washington, DC)
• International NGO Renew the Earth has established a bioenergy center
• Purposes include– Bioenergy information clearinghouse– Analysis of alternative bioenergy options– Assessment of bioenergy sustainability
requirements and opportunities