Embed Size (px)
Citation preview
www.wjpr.net Vol 7, Issue 13, 2018.
991
Shweta et al. World Journal of Pharmaceutical Research
BIOETHANOL PRODUCTION FROM RICE & WHEAT HUSKS
AFTER ACID HYDROLYSIS & YEAST FERMENTATION
Sabina Bano1, Dr. Shweta Sao*
2 and Dr. Harit Jha
3
1M.Phil. Scholar, Department of Microbiology, Dr. C.V.Raman University, Kargi Road, Kota
Bilaspur-495113(C.G.), India.
2Professor & Head, Department of Life Science, Dr. C.V.Raman University, Kargi Road,
Kota Bilaspur-495113(C.G.), India.
3*Assistant Professor, Department of Biotechnology, Guru Ghasidas University, Koni,
Bilaspur, (C.G.), India.
ABSTRACT
Bioethanol is a renewable resource that can be produced from
fermented cellulosic biomass. The use of lignocellulosic materials
from agricultural wastes provides a low-cost fermentative substrate.
The aim of this study is to produce bioethanol from rice & wheat husks
using fermentation process and to determine the effect of temperature
on bioethanol yield. The samples were pre-treated with conc. Sulphuric
acid at hydrolysis time (15-30 min.). After acid hydrolysis, the
fermentation is carried out by yeast Saccharomyces cerevisiae. Six
samples of rice & wheat were prepared at different temperatures to
determine the effect of temperature on ethanol yield, the pH was kept
constant at 6.0. Sugar concentrations were determined by
dinitrosalicylic acid (DNS) spectrophotometric method. Total
carbohydrates were determined by Anthrone test. The ethanol concentrations were
determined by hydrometer. Sugar concentrations after hydrolysis and bioethanol production
of rice and wheat husks were 1.39-2.10 mg/ml and 1.69-1.97 mg/ml, respectively. Total
carbohydrates after hydrolysis and bioethanol production of rice and wheat husks were 2.33-
2.69 mg/ml and 3.02-6.57 mg/ml, respectively. Highest ethanol concentrations were obtained
at temperature 350c. This indicates that pH 6.0 and 35
0c was the optimum parameter for the
yeast to produce ethanol. Data were analysed using 1 way Anova.
World Journal of Pharmaceutical Research SJIF Impact Factor 8.074
Volume 7, Issue 13, 991-1004. Research Article ISSN 2277– 7105
Article Received on
16 May 2018,
Revised on 07 June 2018,
Accepted on 28 June 2018,
DOI: 10.20959/wjpr201813-12772
*Corresponding Author
Dr. Shweta Sao
Professor & Head,
Department of Life
Science, Dr. C.V.Raman
University, Kargi Road,
Kota Bilaspur-495113
(C.G.), India.

www.wjpr.net Vol 7, Issue 13, 2018.
992
Shweta et al. World Journal of Pharmaceutical Research
KEYWORDS: Bioethanol, Biomass, Sugar concentration, Hydrometer.
INTRODUCTION
With rapid depletion of the world’s fuel, (petroleum, diesel etc.) in recent years, ethanol has
emerged as one of the alternative liquid fuel and has greater environmental impact. Bio
ethanol production is one of the best ways for crude oil reduction and environmental
compliance. It can be used as fuel having features like high octane number, low cetane
number and high heat of vaporization. It can be produced through fermentation of sugars.
Today worldwide interest is in the usage of bioethanol as an energy source & its concern on
the efficiency for bioethanol production. Development of fermentation processes using cheap
carbon sources is important for commercial scale production. Bioethanol is a renewable
resource produced from lignocellulosic biomass. This is today’s fuel which doesn’t contribute
to global warming. It reduces greenhouse gasses, as combustion of ethanol gives low
emission of carbon monoxide and nitrogen oxides (Park et al. 2010). Using less valuable
materials, like agricultural waste, could reduce the expense significantly, which means
requires less cost for its production.
The hydrolysis is carried out by conc. H2SO4 and the fermentation is carried out by yeasts or
bacteria. Pre-treatment of lignocellulosic biomass prior to hydrolysis can significantly
improve the hydrolysis efficiency by removal of lignin and hemicelluloses, reduction of
cellulose crystallinity and increase of porosity (McMillan, 1994; Palmqvist and Hahn-
Hagerdal,).
Lignocellulosic plant biomass is an important renewable carbon resource for the bio refinery
industry and is thus considered a sustainable and environment friendly alternative to the
current petroleum platform (Wongwilaiwalina et al., 2010). The use of lignocellulosic
materials from agricultural wastes provides a low-cost fermentative substrate. Using
agricultural wastes as lignocellulosic feed stocks for bioethanol production was greatly
promising. One of the advantages of the use of lignocellulosic biomass is not interfering food
production.
Ethanol represents closed carbon dioxide cycle because after burning of ethanol, the released
carbon dioxide is recycled back into plant material because plants use CO2 to synthesize
cellulose during photosynthesis cycle (Wyman, 1999). Ethanol production process only uses
energy from renewable energy sources; no net carbon dioxide is added to the atmosphere,
www.wjpr.net Vol 7, Issue 13, 2018.
993
Shweta et al. World Journal of Pharmaceutical Research
making ethanol an environmentally beneficial energy source. In addition, the toxicity of the
exhaust emissions from ethanol is lower than that of petroleum sources (Wyman and Hinman,
1990). Ethanol derived from biomass is the only liquid transportation fuel that does not
contribute to the green house gas effect.
Bioethanol produces only carbon dioxide and water as the waste products on burning, and the
carbon dioxide released during fermentation and combustion equals the amount removed
from the atmosphere while the crop is growing. It reduces greenhouse gas emissions by as
much as 59 percent relative to gasoline and keeps harmful chemicals like MTBE and benzene
out of air. As a renewable fuel, ethanol is doing more for the environment. Indeed, ethanol
seems to have many things going for it: it’s biodegradable, it produces slightly less
greenhouse emissions than fossil fuel, it can replace harmful fuel additives (e.g., methyl
tertiary butyl ether; MTBE).
The main objective of this study is to successfully produce bioethanol from rice and wheat
husks by acidic hydrolysis and fermentation process. It emerges as a demanding renewable
energy source. The demand for oil is expected to increase to 57% from 2002 to 2030.
MATERIALS AND METHODS
The rice husks were obtained from hanuman rice mill, Torwa, Bilaspur. Whereas wheat husks
were obtained from the agricultural farm land of Masturi & Ratanpur area. Baker's yeasts are
obtained from poonam bakery, in front of city kotwali, Bilaspur (c.g.).
Sample Preparation
The rice and wheat husks were washed properly. After washing, husks were allowed to sun-
dry for 7 days. The samples were packed in the seal bag or jute bag and stored at room
temperature (± 38°C). Each husks samples were treated by acid hydrolysis and followed by
yeasts fermentation.
Sample Hydrolysis
The samples were treated with conc. H2SO4 for 20-30 mins. The slurry was separated by
filtration; the filtrate was collected to determine sugars concentrations after being washed
with distilled water. Total carbohydrates were determined by Anthrone test.
www.wjpr.net Vol 7, Issue 13, 2018.
994
Shweta et al. World Journal of Pharmaceutical Research
Yeast Fermentation
The two hydrolysis samples (80 ml each) from hydrolysis were sterilized by autoclaves
(121°C, 15 min). In fermentation process, Saccharomyces cerevisiae (Baker’s yeasts) was
used to ferment the simple sugar to ethanol and carbon dioxide. To determine the effects of
temperature on ethanol yield, the pH was kept constant at 6.0 while the temperature was
varied at 350
C, 560C & at room temperature. The fermentation process continued for 6 days
(72 hrs).
Sugar determination
The hydrolysis samples of rice & wheat husks were used to determined the sugar
concentrations by dinitrosalicylic acid (DNS) spectrophotometric method. The samples of
two, four, and six fermentation days from each hydrolysis treatment previously were also
determined the reducing sugar by DNS method. Total carbohydrates were determined by
Anthrone test. The presence of sugar was tested by Benedict test.
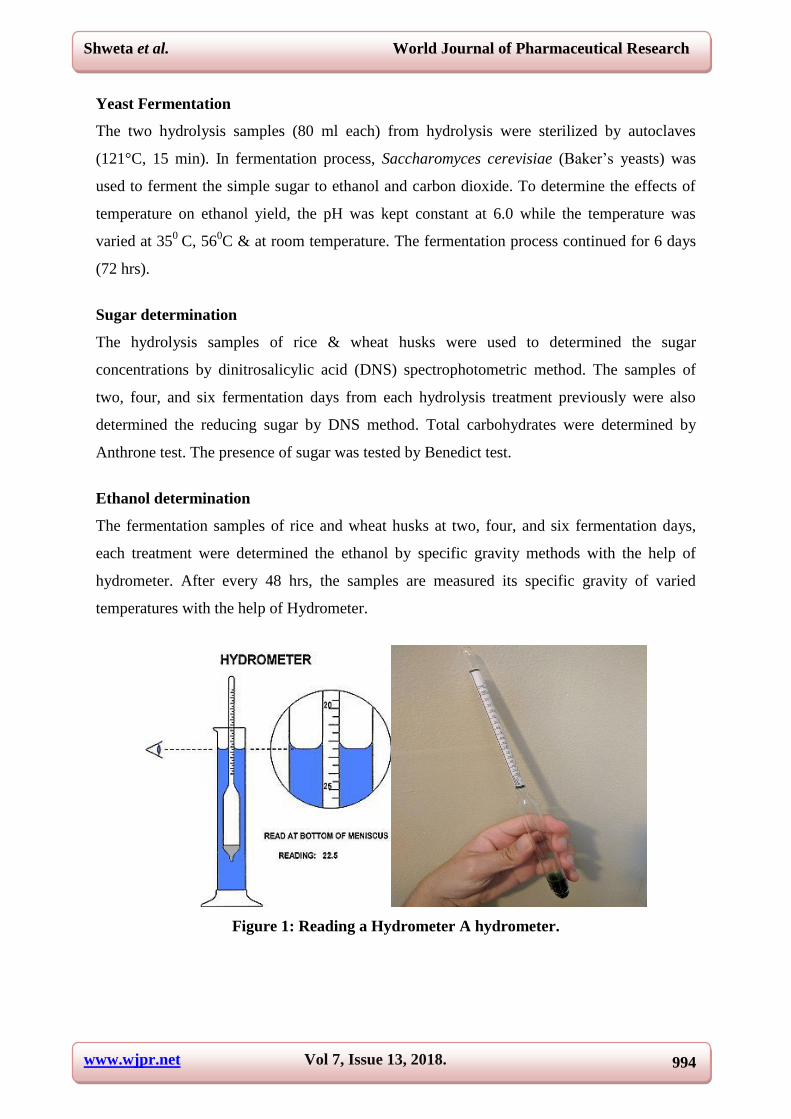
Ethanol determination
The fermentation samples of rice and wheat husks at two, four, and six fermentation days,
each treatment were determined the ethanol by specific gravity methods with the help of
hydrometer. After every 48 hrs, the samples are measured its specific gravity of varied
temperatures with the help of Hydrometer.
Figure 1: Reading a Hydrometer A hydrometer.

www.wjpr.net Vol 7, Issue 13, 2018.
995
Shweta et al. World Journal of Pharmaceutical Research
Data analysis
Data were analysed using 1 way Anova method. Reducing sugar and bioethanol data from
fermentation samples were analyzed with 1 way Anova.
RESULTS AND DISCUSSION
The result of the investigation showed that the rice and wheat husks produced a significant
amount of ethanol. The volumetric production of ethanol varied according to the variations in
temperatures. It also varied according to fermentation time. The effects of sulphuric acid on
hydrolysis of rice and wheat husks were investigated. Hydrolysis time for the rice and wheat
husks were 20-30 min. Purpose of this optimization is to break the rigid lignin structure and
matrix conformation of cellulose. Each hydrolysis at specified acid concentration followed a
trend where concentration of total sugar increased when the hydrolysis time increasing.
Longer time is required by acid to carry out hydrolytic chemical reaction, which is the
cleavage of β-1-4- glycosidic bond, before converting cellulose into glucose.
The target is to produce maximum yield of sugar. The sugar concentration produced from
acid dose on pre treatment for 20-30 minutes. Pretreatment with an acid dose for 30 minutes
generated 2.10 mg/ml sugars from rice husks. The effects of acid dose and hydrolysis time
are illustrated.
In general, Yeast is an acidophilic organism and as such, grows better under acidic condition.
The optimum pH range for yeast growth can vary from pH 4.0 to 6.0, depending on the
temperature, the presence of oxygen and strain of yeast. Optimum pH values are required for
the activity of plasma membrane bound proteins. During growth, it is important for the yeast
to maintain a constant intercellular pH. There are many enzymes functioning during within
the yeast cell during growth and its metabolism.
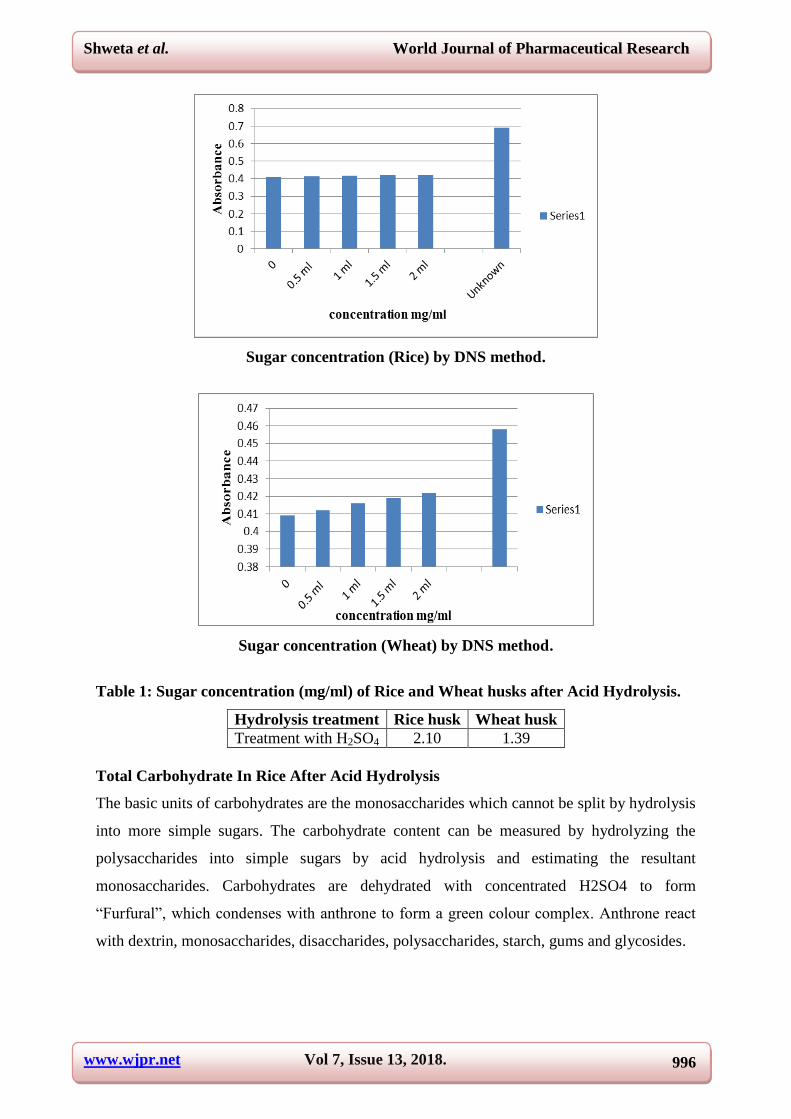
Sugar Concentrations after Acid Hydrolysis
Sugar concentration of rice and wheat husks slurry after acid hydrolysis was low. Since the
substrate complexity, it is not easy to degrade both the substrates. Acid hydrolyze
lignocelluloses of rice and wheat husks into simple sugars. Therefore, there are increasing
sugar concentrations after hydrolysis treatment compared to before hydrolysis treatment.
Table 1 showed that sugar concentrations of rice after hydrolysis treatment was 2.10 mg/ml,
whereas sugar concentrations of wheat after hydrolysis treatment were 1.29 mg/ml.
www.wjpr.net Vol 7, Issue 13, 2018.
996
Shweta et al. World Journal of Pharmaceutical Research
Sugar concentration (Rice) by DNS method.
Sugar concentration (Wheat) by DNS method.
Table 1: Sugar concentration (mg/ml) of Rice and Wheat husks after Acid Hydrolysis.
Hydrolysis treatment Rice husk Wheat husk
Treatment with H2SO4 2.10 1.39
Total Carbohydrate In Rice After Acid Hydrolysis
The basic units of carbohydrates are the monosaccharides which cannot be split by hydrolysis
into more simple sugars. The carbohydrate content can be measured by hydrolyzing the
polysaccharides into simple sugars by acid hydrolysis and estimating the resultant
monosaccharides. Carbohydrates are dehydrated with concentrated H2SO4 to form
“Furfural”, which condenses with anthrone to form a green colour complex. Anthrone react
with dextrin, monosaccharides, disaccharides, polysaccharides, starch, gums and glycosides.
www.wjpr.net Vol 7, Issue 13, 2018.
997
Shweta et al. World Journal of Pharmaceutical Research
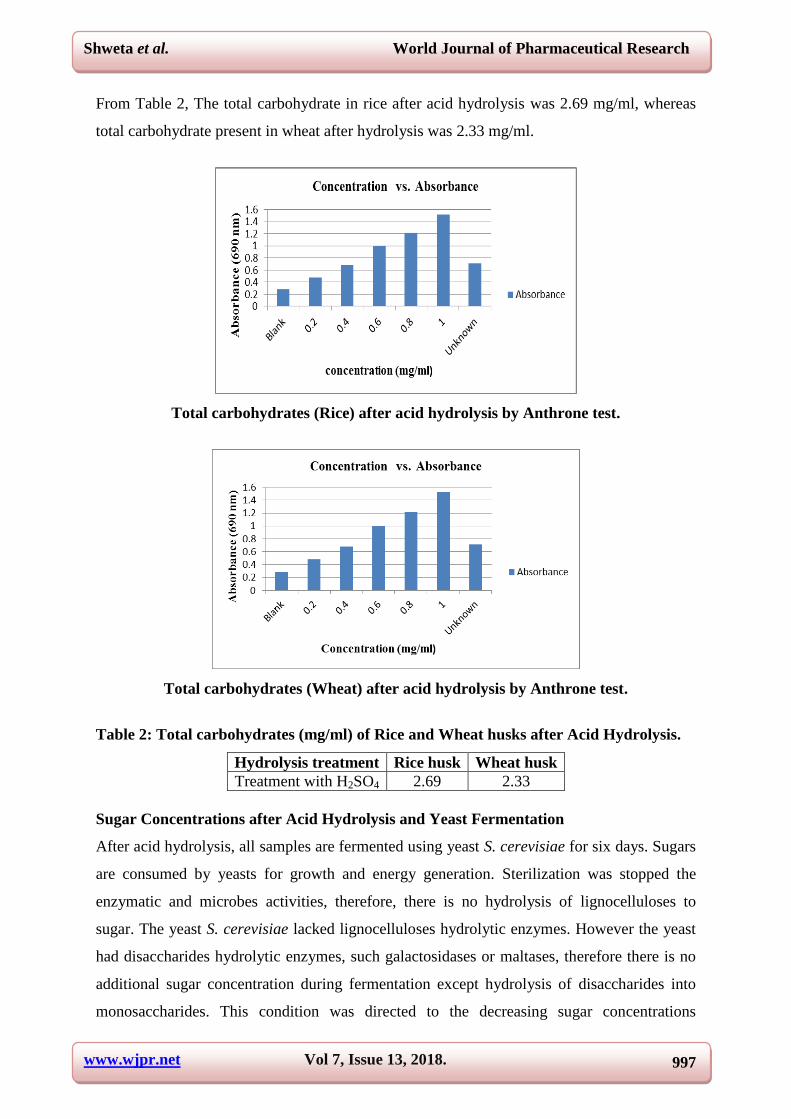
From Table 2, The total carbohydrate in rice after acid hydrolysis was 2.69 mg/ml, whereas
total carbohydrate present in wheat after hydrolysis was 2.33 mg/ml.
Total carbohydrates (Rice) after acid hydrolysis by Anthrone test.
Total carbohydrates (Wheat) after acid hydrolysis by Anthrone test.
Table 2: Total carbohydrates (mg/ml) of Rice and Wheat husks after Acid Hydrolysis.
Hydrolysis treatment Rice husk Wheat husk
Treatment with H2SO4 2.69 2.33
Sugar Concentrations after Acid Hydrolysis and Yeast Fermentation
After acid hydrolysis, all samples are fermented using yeast S. cerevisiae for six days. Sugars
are consumed by yeasts for growth and energy generation. Sterilization was stopped the
enzymatic and microbes activities, therefore, there is no hydrolysis of lignocelluloses to
sugar. The yeast S. cerevisiae lacked lignocelluloses hydrolytic enzymes. However the yeast
had disaccharides hydrolytic enzymes, such galactosidases or maltases, therefore there is no
additional sugar concentration during fermentation except hydrolysis of disaccharides into
monosaccharides. This condition was directed to the decreasing sugar concentrations

www.wjpr.net Vol 7, Issue 13, 2018.
998
Shweta et al. World Journal of Pharmaceutical Research
following increasing fermentation days (Table 2). Sugar concentrations of rice at varied
temperatures for six fermentation days were given in table 3. Decreasing sugar concentrations
following increasing fermentation days were due to the metabolism of the yeasts. The yeasts
were used sugars for growth and generating energy.
Table 3: Sugar concentration (mg/ml) of Rice and Wheat husks after acid Hydrolysis
and Yeast Fermentation.
S.No. Temperature Rice Wheat
1.
350c 1.97 1.84
560c 1.64 1.61
Room Temp. 1.80 1.74
Sugar concentration of Rice.
Sugar concentration of Wheat.
Table 4: Total carbohydrate (mg/ml) of Rice and Wheat husks after acid Hydrolysis
and Yeast Fermentation.
S.No. Temperature Rice Wheat
1. 35
0c 6.57 3.78
560c 3.02 3.28
Room Temp. 3.15 3.68
www.wjpr.net Vol 7, Issue 13, 2018.
999
Shweta et al. World Journal of Pharmaceutical Research
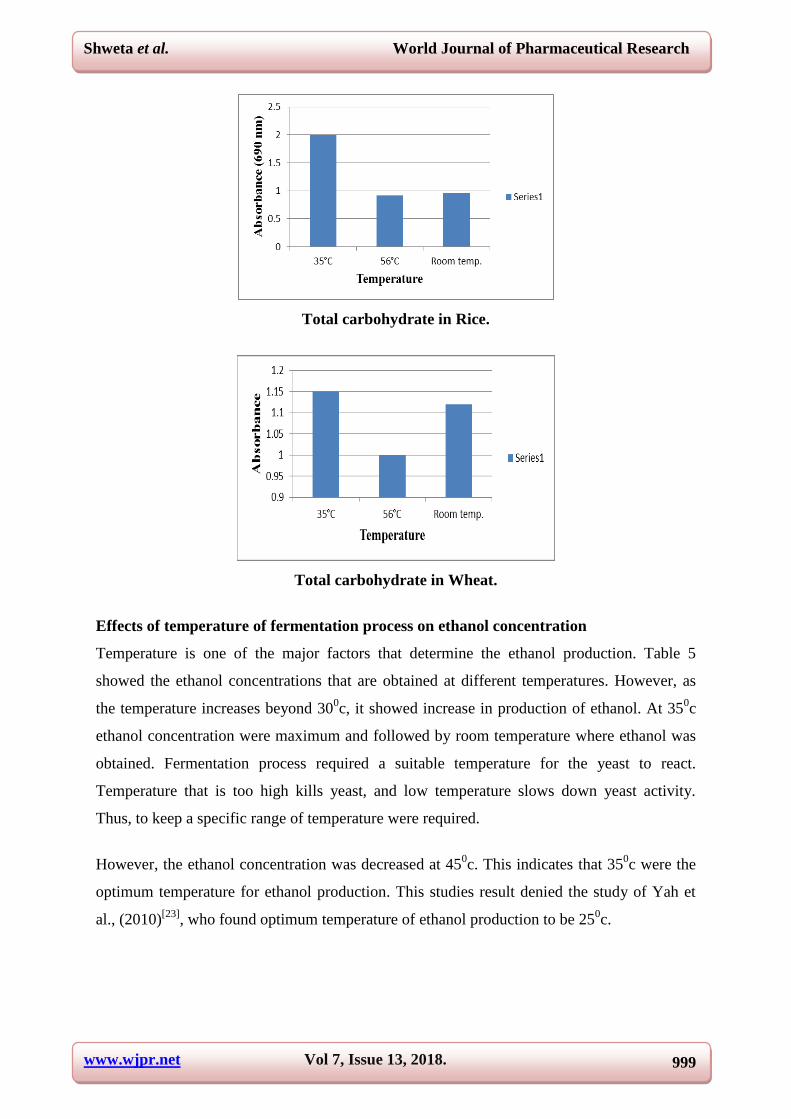
Total carbohydrate in Rice.
Total carbohydrate in Wheat.
Effects of temperature of fermentation process on ethanol concentration
Temperature is one of the major factors that determine the ethanol production. Table 5
showed the ethanol concentrations that are obtained at different temperatures. However, as
the temperature increases beyond 300c, it showed increase in production of ethanol. At 35
0c
ethanol concentration were maximum and followed by room temperature where ethanol was
obtained. Fermentation process required a suitable temperature for the yeast to react.
Temperature that is too high kills yeast, and low temperature slows down yeast activity.
Thus, to keep a specific range of temperature were required.
However, the ethanol concentration was decreased at 450c. This indicates that 35
0c were the
optimum temperature for ethanol production. This studies result denied the study of Yah et
al., (2010)[23]
, who found optimum temperature of ethanol production to be 250c.

www.wjpr.net Vol 7, Issue 13, 2018.
1000
Shweta et al. World Journal of Pharmaceutical Research
Table 5: Bioethanol concentration at different temperature measured by Hydrometer.
S.No. Agricultural Wastes Temperature Fermentation Days
2 Days 4 Days 6 Days
1. Rice Husk
350c 0.21 0.18 0.22
560c 0.25 0.27 0.24
Room Temp. 0.24 0.27 0.28
2. Wheat Husk
350c 0.26 0.24 0.27
560c 0.30 0.28 0.3
Room Temp. 0.28 0.26 0.28
From the result we can conclude that higher the temperature, lower the ethanol concentration.
The rate of enzyme catalyzed reaction increases with temperature up to a certain temperature
and then the enzyme begins to denature. Higher temperature inhibits the growth of the cells
and fermentation significantly decreases. In this study, ethanol concentration declined
considerably at above 500c, which showed the inhibition effects on the cell growth at higher
temperature.
Based on the high temperature might denature the ribosome and enzymes. Furthermore,
higher temperature would alter the structure of the membrane and decrease its functionality.
Above the optimum temperature, the enzyme reaction drops precipitously as the enzyme
denatures.
Enzymes are sensitive to temperature change. At temperature above 400C, the rate of
respiration slows down and drops. This was because all the enzyme are made up of the
protein chains of amino acid. It exists in the form of a helix structure with the hydrogen
bonds holding them together. When heat was applied to the enzyme, energy was given off.
The active enzyme cell deforms and the hydrogen bonds break, denature the yeast enzyme.
This process called as denaturizing. The optimum temperature in which yeast enzyme work
best is around 350C, below this temperature the rate of reaction was slow and above 40 or 45-
500C the yeast enzyme would denature.
At low temperature the cells showed no ethanol concentration. This may be due to the
enzymes low tolerance to produce ethanol at lower temperature. Furthermore, at low
temperature the enzyme deactivated and reaction slows down stop altogether. At low
temperature, the molecules moves slower than at higher temperature. These explain that the
enzyme may not have enough energy to cause chemical reaction. Overall we can conclude
that temperature 350c was the optimum temperature for ethanol production.
www.wjpr.net Vol 7, Issue 13, 2018.
1001
Shweta et al. World Journal of Pharmaceutical Research
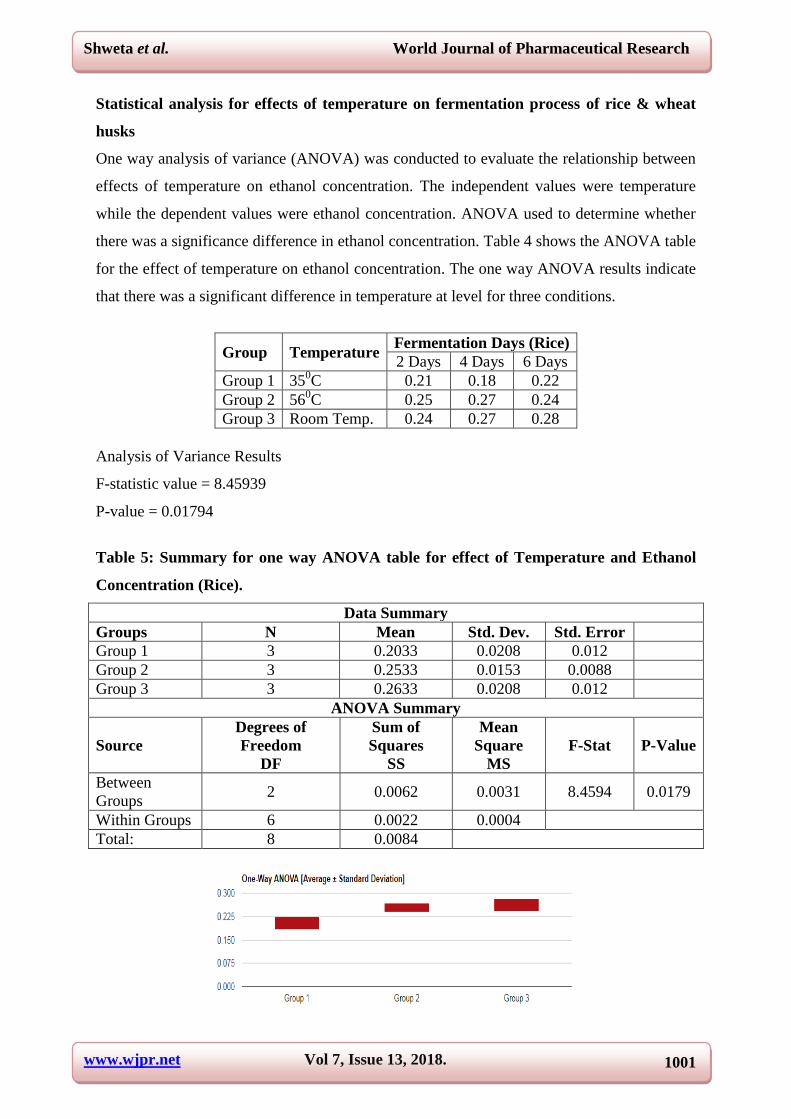
Statistical analysis for effects of temperature on fermentation process of rice & wheat
husks
One way analysis of variance (ANOVA) was conducted to evaluate the relationship between
effects of temperature on ethanol concentration. The independent values were temperature
while the dependent values were ethanol concentration. ANOVA used to determine whether
there was a significance difference in ethanol concentration. Table 4 shows the ANOVA table
for the effect of temperature on ethanol concentration. The one way ANOVA results indicate
that there was a significant difference in temperature at level for three conditions.
Group Temperature Fermentation Days (Rice)
2 Days 4 Days 6 Days
Group 1 350C 0.21 0.18 0.22
Group 2 560C 0.25 0.27 0.24
Group 3 Room Temp. 0.24 0.27 0.28
Analysis of Variance Results
F-statistic value = 8.45939
P-value = 0.01794
Table 5: Summary for one way ANOVA table for effect of Temperature and Ethanol
Concentration (Rice).
Data Summary
Groups N Mean Std. Dev. Std. Error
Group 1 3 0.2033 0.0208 0.012
Group 2 3 0.2533 0.0153 0.0088
Group 3 3 0.2633 0.0208 0.012
ANOVA Summary
Source
Degrees of
Freedom
DF
Sum of
Squares
SS
Mean
Square
MS
F-Stat P-Value
Between
Groups 2 0.0062 0.0031 8.4594 0.0179
Within Groups 6 0.0022 0.0004
Total: 8 0.0084
www.wjpr.net Vol 7, Issue 13, 2018.
1002
Shweta et al. World Journal of Pharmaceutical Research
Group Temperature Fermentation Days (Wheat)
2 Days 4 Days 6 Days
Group 1 350C 0.26 0.24 0.27
Group 2 560C 0.30 0.28 0.3
Group 3 Room Temp. 0.28 0.26 0.28
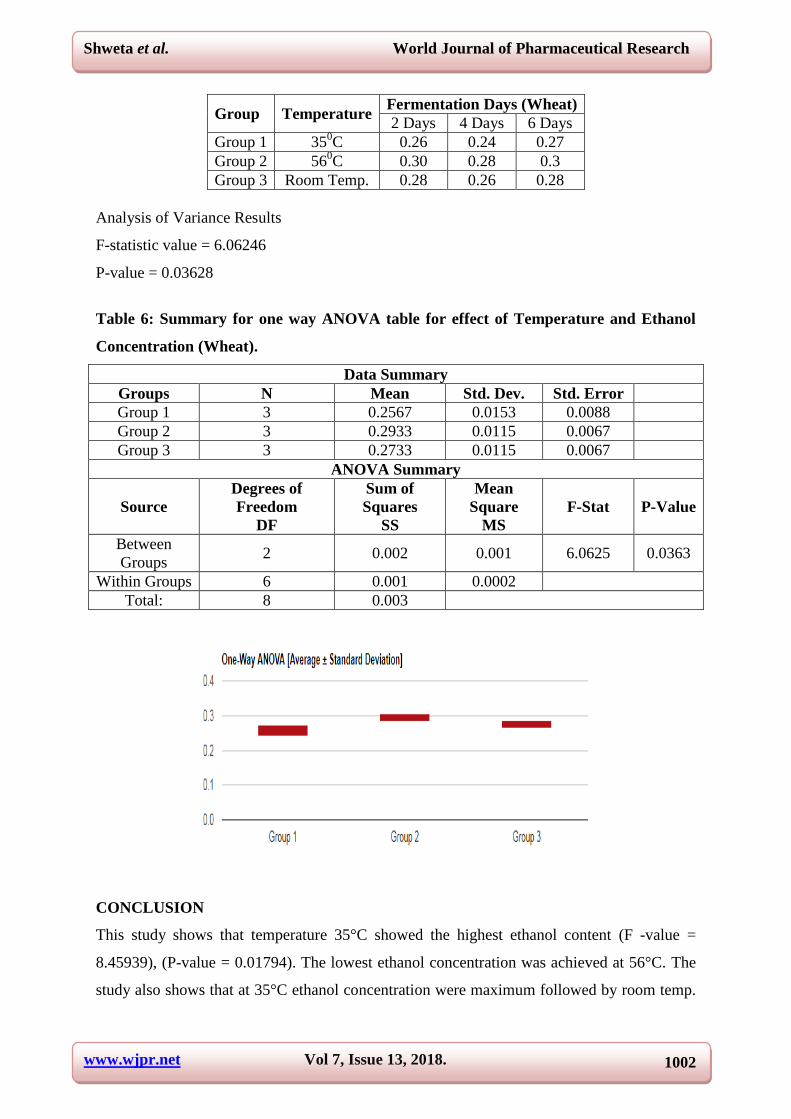
Analysis of Variance Results
F-statistic value = 6.06246
P-value = 0.03628
Table 6: Summary for one way ANOVA table for effect of Temperature and Ethanol
Concentration (Wheat).
Data Summary
Groups N Mean Std. Dev. Std. Error
Group 1 3 0.2567 0.0153 0.0088
Group 2 3 0.2933 0.0115 0.0067
Group 3 3 0.2733 0.0115 0.0067
ANOVA Summary
Source
Degrees of
Freedom
DF
Sum of
Squares
SS
Mean
Square
MS
F-Stat P-Value
Between
Groups 2 0.002 0.001 6.0625 0.0363
Within Groups 6 0.001 0.0002
Total: 8 0.003
CONCLUSION
This study shows that temperature 35°C showed the highest ethanol content (F -value =
8.45939), (P-value = 0.01794). The lowest ethanol concentration was achieved at 56°C. The
study also shows that at 35°C ethanol concentration were maximum followed by room temp.

www.wjpr.net Vol 7, Issue 13, 2018.
1003
Shweta et al. World Journal of Pharmaceutical Research
(42°C). However there is very less ethanol production at 56°C. Statistical analysis one way
ANOVA results indicate that there was a significant difference in temperature at level for
three conditions (F -value = 8.45939). The one way ANOVA results for temperature indicate
that there was a significant difference in temperature at (p<o.o1) level for three conditions (F
-value = 8.45939). Further study should conduct on more parameter that effect the
fermentation process on ethanol production. There are other parameter such as amount of
substrate, time and glucose concentration which affects ethanol production during
fermentation. This will gives overall view how ethanol production affected. In conclusion, at
temperature 35°C is the optimum temperature or condition for ethanol production.
REFERENCE
1. Gong-Yuan Wel, Wa Gao, II-Hyuck Jin, Su-Young Yoo, Jai-Heon Lee, Chung-Han
Chung, and Jin-Woo Lee Pretreatment and Saccharification of Rice Hulls for the
Production of Fermentable Sugars, 14 edn., Busan, Korea: Biotechnology and Bioprocess
Engineering, 2009.
2. TJAHJADI PURWOKO, SITI LUSI ARUM SARI, EDWI MAHADJOENO,
SUNARTO Bioethanol production from rice and corn husks after enzymatic and
microbes hydrolysis and yeast fermentation, edn., Central Java, Indonesia:
BIOTEKNOLOGI, 2017; 14.
3. Y.C.WONG and V.SANGGARI Bioethanol Production from Sugarcane Bagasse using
Fermentation Process, edn., Kelantan, Malaysia: ORIENTAL JOURNAL OF
CHEMISTRY, 2014; 30: 507-513.
4. M N Salimi, S E Lim, A H M Yusoff and M F Jamlos Conversion of rice husk into
fermentable sugar by two stage hydrolysis, 908 edn., Perlis, Malaysia: IOP Publishing
2017; 012056.
5. Sanat Rath, Ajay Kumar Singh, Harison Masih,Yashab Kumar, Jyotsana Kiran Peter,
Pankaj Singh, Santosh Kumar Mishra Bioethanol production from wates potatoes as an
environmental waste management and sustainable energy by using cocultures Aspergillus
niger and Saccharomyces cerevisiae, edn., Uttar Pradesh: International Journal of
Advanced Research, 2014; 2: 553-563.
6. Tehmina Saleem Khan and Umarah Mubeen Wheat Straw: A Pragmatic Overview, edn.,
Pakistan: Current Research Journal of Biological Sciences, 2012; 4(6): 673-675.

www.wjpr.net Vol 7, Issue 13, 2018.
1004
Shweta et al. World Journal of Pharmaceutical Research
7. Diana L. Vullo and Mónica B. Wachsman A Simple Laboratory Exercise for Ethanol
Production by Immobilized Bakery Yeasts (Saccharomyces cerevisiae), edn., Buenos
Aires, Argentina: JOURNAL OF FOOD SCIENCE EDUCATION, 2005; 4: 53.
8. ARTHUR CAPUTI, JR., MASAO UEDA, and THOMAS BROWN
SPECTROPHOTOMETRIC DETERMINATION OF ETHANOL IN WINE, Modesfo,
California: E. & J. Gallo Winery, 1968; 95353.
9. JAMES A. HAWKISS AND DONALD D. VAN SLYKE. COMPARISON OF RATES
OF SUGAR DISAPPEARANCE AND CARBON DIOXIDE FORMATION DURING
FERMENTATION OF GLUCOSE, 84 edn., Rockejeller Institute for Medical Research,
New York.): J. Biol. Chem. 1929; 243-247.
10. Zhaoyang XuEmail authorFang Huang Pretreatment Methods for Bioethanol Production,
edn., china: National Natural Science Foundation of China, 2014; 174: 31300483.
11. Devendra Prasad Maurya Ankit Singla Email author Sangeeta Negi An overview of key
pretreatment processes for biological conversion of lignocellulosic biomass to
bioethanol, edn., Allahabad.: Springer Berlin Heidelberg, 2015; 5: 2190-572X.
12. Spyridon Achinas, Gerrit Jan willem Euverink Consolidated briefing of biochemical
ethanol production from lignocellulosic biomass, edn., Groningen, Netherlands:
ELECTRONIC JOURNAL OF BIOTECHNOLOGY, 2016; 23: 44-53.
13. Kexun Li, Shun Liu, Xianhua Liu An overview of algae bioethanol production, 38 edn.,
Tianjin, China: International Journal of Energy Research, 2014; 965-977.
14. Thippa Reddy K. S.* and Agrawal Pushpa STUDIES ON CHARACTERIZATIONS OF
AGRICULTURE WASTE (RICE HUSK) FOR THE PRODUCTION OF ETHANOL, edn.,
Bangalore, Karnataka: Journal of Environmental Research And Development., 2012; 7.
15. Mushimiyimana and P Tallapragada Bioethanol Production from Agrowastes by Acid
Hydrolysis and Fermentation Process, edn., Bangalore: Journal of Scientific & Industrial
Research, 2016; 75: 383-388.
16. www.newagepublishers.com/samplechapter/000091.pdf


![McCook Weekly Tribune. (McCook, NE) 1884-11-27 [p ].of corn, husks and smut. ... Orleans exposition 20 barrels of apples, 15 bushels of potatoes, assorted, 13 bushels of wheat, 35](https://img.pdfslide.net/doc/110x75/5ea85b88a15a6e7d03428ae6/mccook-weekly-tribune-mccook-ne-1884-11-27-p-of-corn-husks-and-smut-.jpg)