Embed Size (px)
Citation preview

Utrecht, 18 June 2010
Biofuels in road transport and effects on air pollutants
Workshop 'Synergies and Trade-offs between Climate and Air Pollution Policies: Optimizing Opportunities and Preventing Risks‘ 18 June 2010
TNO & CE DelftRuud Verbeek

Utrecht, 18 June 20102
Objective
• Evaluation of the effects of 3 biofuel scenarios on the national emissions of road transport in 2020
• Evaluation of measures to minimise risks of negative emission effects

Utrecht, 18 June 20103
Structure project
1. Scenarios
2. Technical risks
3. Consulting stakeholders
4. Emission factors
5. Vehicle fleet assessment

Utrecht, 18 June 20104
Contents
• Fuel mix scenario’s
• Technical compatibility / stakeholders consultation
• Emission factors for biofuel blends
• Emissions on a national level
• Conclusions and recommendations

Utrecht, 18 June 20105
Biofuel options
100%100%100%
0 - 7 %0 - 30% 0 - 30%
“diesel replacement”:Biodiesel: methyl esters: FAME. FAEEHVO: Hydrotreatment Vegetable OilBTL: Biomass to Liquid
15%100%
0 -10%0 - 85%0 - 100%
“gasoline replacement”:Ethanol: low blend in standard vehiclesEthanol: high blend in FFVBiogas (upgraded to NG quality)
maximumWithin fuel specification
Popular biofuels (blends)

Utrecht, 18 June 20106
Fuel mix scenario’s for 2020
1. Focus on single (& double) counting biodiesel and ethanol.Bulk fuels are B7 and E10High blend for heavy-duty vehicles: • B30 (scenario 1a): 10% market share• B100 (scenario 1b): 2.3% market share
2. Focus on double counting ethanol and biodiesel.2% market share by energy of E85 for passenger cars and biodiesel only in low blend (<B5)
3. Focus on air quality.5.6% market share by energy of natural gas / biogas for passenger cars bulk diesel with low blend biodiesel, HVO and BTL.Largest share of plug in hybrids and electric (4.2% by energy, 660.000 vehicles)

Utrecht, 18 June 20107
Fuel mix scenario’s for 2020
0%
2%
4%
6%
8%
10%
12%
Scenarios 1a
and 1b
Scenario 2 Scenario 3
Bio-ethanol; single
Bio-ethanol; double
Bio-diesel, single
Bio-diesel; double
Fisher-Tropsch diesel, double
HVO diesel; single
Biogas; double
Renewable electricity

Utrecht, 18 June 20108
Contents
• Fuel mix scenario’s
• Technical compatibility / stakeholders consultation
• Emission factors for biofuel blends
• Emissions on a national level
• Conclusions and recommendations
Utrecht, 18 June 20109
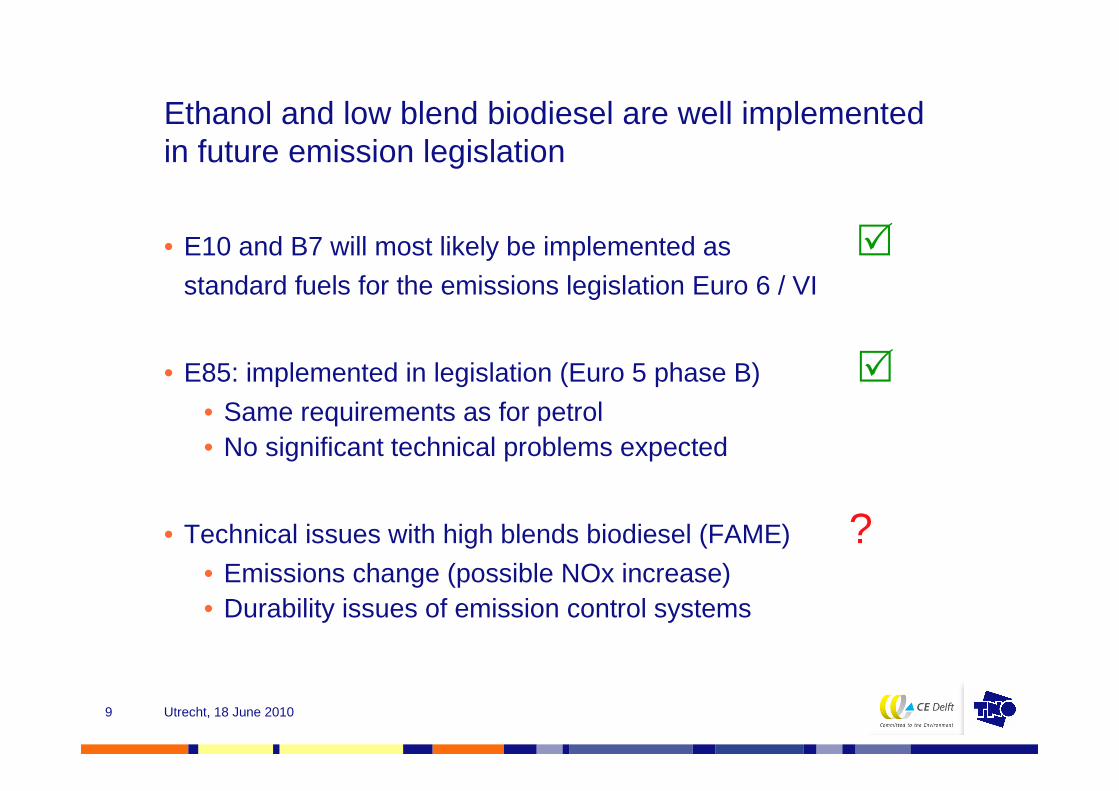
Ethanol and low blend biodiesel are well implemented in future emission legislation
• E10 and B7 will most likely be implemented as �standard fuels for the emissions legislation Euro 6 / VI
• E85: implemented in legislation (Euro 5 phase B) �• Same requirements as for petrol• No significant technical problems expected
• Technical issues with high blends biodiesel (FAME) ?• Emissions change (possible NOx increase)• Durability issues of emission control systems
Utrecht, 18 June 201010
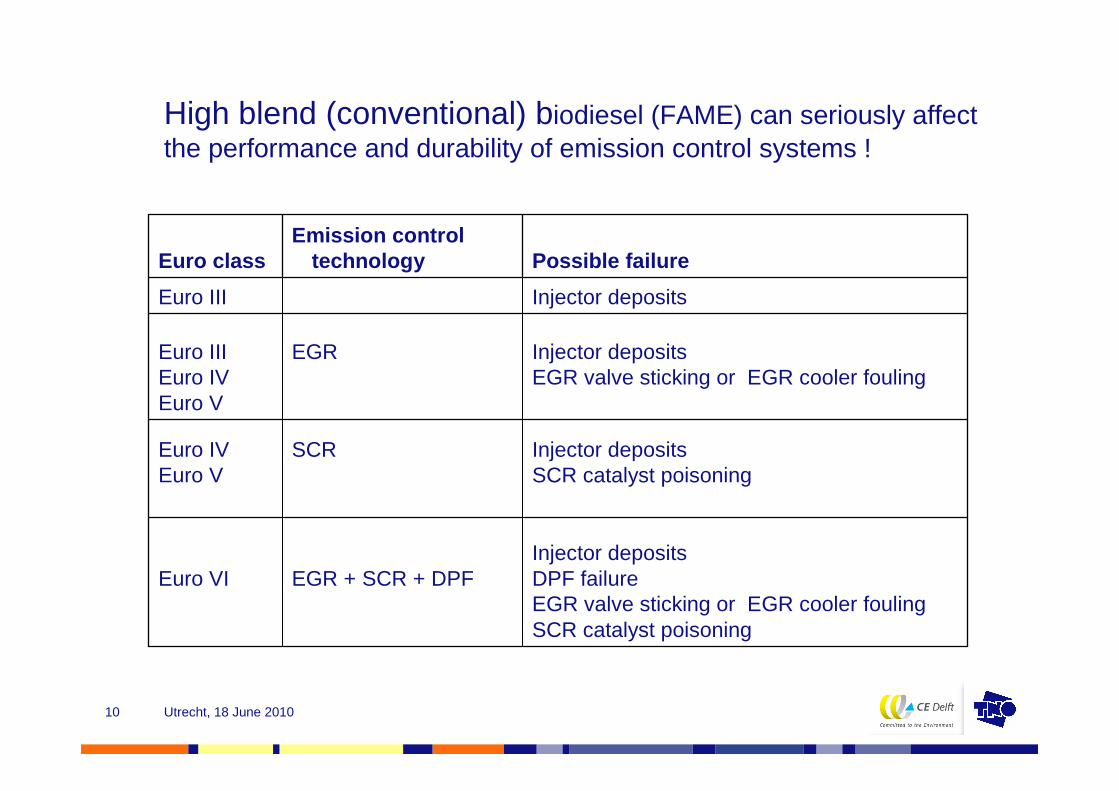
High blend (conventional) biodiesel (FAME) can seriously affect the performance and durability of emission control systems !
Injector depositsSCR catalyst poisoning
SCREuro IVEuro V
Injector depositsDPF failureEGR valve sticking or EGR cooler foulingSCR catalyst poisoning
EGR + SCR + DPFEuro VI
Injector depositsEGR valve sticking or EGR cooler fouling
EGREuro IIIEuro IVEuro V
Injector depositsEuro III
Possible failureEmission control
technologyEuro class

Utrecht, 18 June 201011
Contents
• Fuel mix scenario’s
• Technical compatibility
• Emission factors for biofuel blends
• Emissions on a national level
• Conclusions and recommendations

Utrecht, 18 June 201012
Emission Factors for biofuels blends
CAR II B10 – B100 B10 – B100 E85
increase or increasedecrease 1% - 5%
failures
x x = Emission
Factorbiofuel
Emission
Factorconvention
Standard
Factorbiofuel
Failure
Factorbiofuel

Utrecht, 18 June 201013
Biodiesel (FAME) increases NOx and reduces PM emissions
NOx PM
Influence of biodiesel blend % on PM emissions for HD vehicles
y = -0,5737x + 1
R2 = 0,3158
0%
20%
40%
60%
80%
100%
120%
140%
0% 20% 40% 60% 80% 100% 120%
biodiesel blend percentage (volume %)
rela
tive
exh
aust
gas
em
issi
on
s
Influence of biodiesel blend % on NOx emissions for HD vehicles
y = 0,1249x + 1
R2 = 0,21020%
20%
40%
60%
80%
100%
120%
140%
0% 20% 40% 60% 80% 100% 120%
biodiesel blend percentage (volume %)
rela
tive
exh
aust
gas
em
issi
on
s

Utrecht, 18 June 201014
Contents
• Fuel mix scenario’s
• Technical compatibility
• Emission factors for biofuel blends
• Emissions on a national level
• Conclusions and recommendations
Utrecht, 18 June 201015
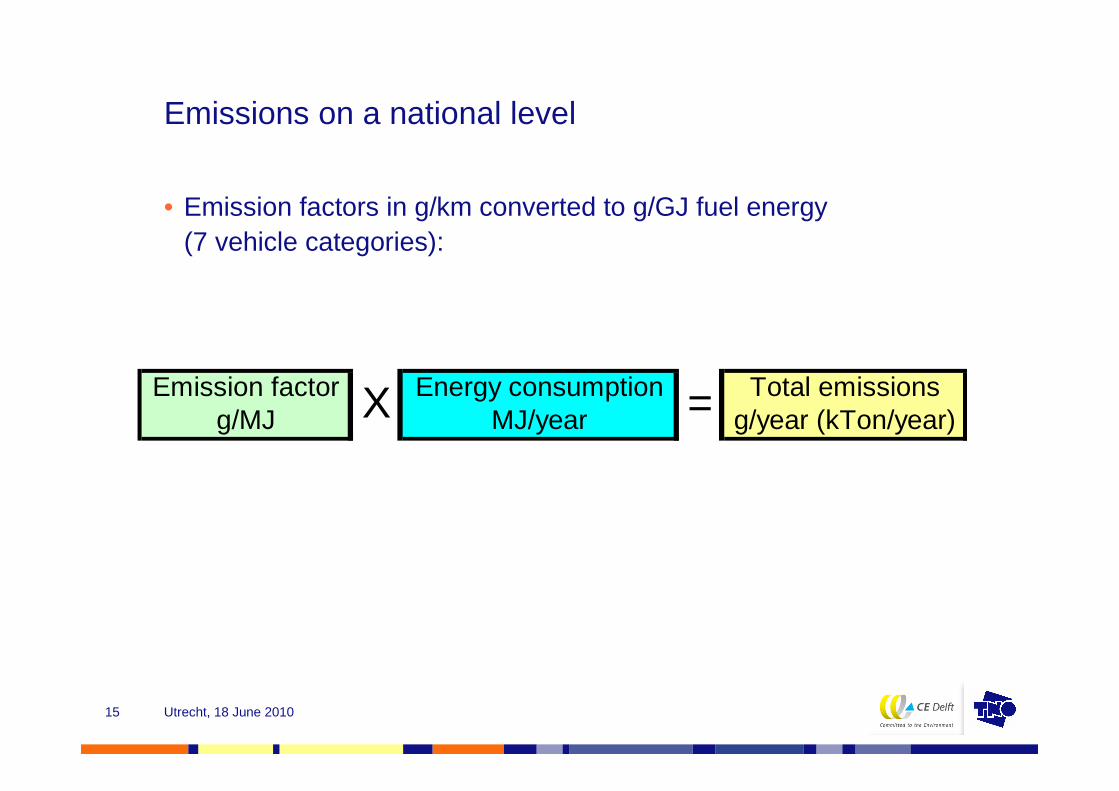
Emissions on a national level
• Emission factors in g/km converted to g/GJ fuel energy (7 vehicle categories):
Emission factor Energy consumption Total emissionsg/MJ MJ/year g/year (kTon/year)X =

Utrecht, 18 June 201016
Small effects on emissions on a national level
• Influence of biofuel scenarios on emissions [kiloton/year]
NOx PMup to 2% reduction up to 2-5% reduction
of tailpipe emissions
NOx, difference from baseline scenario
-1.50
-1.00
-0.50
0.00
0.50
1.00
scenario1a
scenario1b
scenario2
scenario3
[kil
oto
n/y
ear]
best case average case w orst case
Particulates, difference from baseline scenario
-0.04
-0.02
0.00
0.02
0.04
scenario1a
scenario1b
scenario2
scenario3
[kil
oto
n/y
ear]
best case average case w orst case

Utrecht, 18 June 201017
Contents
• Fuel mix scenario’s
• Technical compatibility
• Emission factors for biofuel blends
• Emissions on a national level
• Conclusions and recommendations

Utrecht, 18 June 201018
Conclusion / Key message
Effects of 10% biofuel target on NOx and PM emissions for 2020 are very small, provided that the potential issues with high blends of FAME type biodiesel can be controlled or avoided.

Utrecht, 18 June 201019
Recommendations
• High blends of FAME type biodiesel are not recommended, also not for trucks
• Stimulate double counting biofuel because it reduces the need for high blends?
• Stimulate and monitor fleets with trucks on high blends of biodiesel and passenger cars on biogas/natural gas
• Provide technical guidelines and requirements for high blends biodiesel for trucks
• Monitor failure rates and quality of all fuels extensively.