Embed Size (px)
Citation preview
Biofuels on the Dutch market
Ranking oil companies in the Netherlands
Report Delft, February 2013 Author(s): Anouk van Grinsven Bettina Kampman
2 February 2013 4.786.1 - Biofuels on the Dutch market
Publication Data
Bibliographical data: Anouk van Grinsven, Bettina Kampman Biofuels on the Dutch market Ranking oil companies in the Netherlands Delft, CE Delft, november 2012February 2013 Publication code: 13.4786.09 CE publications are available from www.cedelft.eu Commissioned by: BirdLife Europe, Transport & Environment, the European Environmental Bureau and Natuur & Milieu. Further information on this study can be obtained from the contact person, Bettina Kampman. © copyright, CE Delft, Delft
CE Delft Committed to the Environment CE Delft is an independent research and consultancy organisation specialised in developing structural and innovative solutions to environmental problems. CE Delft’s solutions are characterised in being politically feasible, technologically sound, economically prudent and socially equitable.
3 February 2013 4.786.1 - Biofuels on the Dutch market
Contents
Summary 5
1 Introduction 9 1.1 Introduction 9 1.2 Aim of this study 9 1.3 Scope 10 1.4 Outline of the report 10
2 Policy context and sustainability issues of the Dutch biofuel market 11
2.1 Introduction 11 2.2 Biofuel policy European level 11 2.3 Biofuel policy in the Netherlands 15
3 Ranking of Dutch biofuel suppliers 19 3.1 Introduction 19 3.2 Overview of biofuels blended, per company 19 3.3 Methodology 20 3.4 Ranking of fuel suppliers based on available data 24 3.5 Analysis including unknown feedstocks 27 3.6 Conclusions 29
4 Wider sustainability issues 31 4.1 Introduction 31 4.2 Land use 31 4.3 Nutrient losses 32 4.4 Level of assurance 34 4.5 Conclusions 35
5 A comparison between the Netherlands and the United Kingdom 37
5.1 Introduction 37 5.2 The Renewable Transport Fuel Obligation (RTFO) 37 5.3 Biofuels supplied in the United Kingdom from April 2010–April 2011 37 5.4 Differences between the Netherlands and the United Kingdom 39 5.5 Conclusion 40
6 Options to increase data transparency 41 6.1 Introduction 41 6.2 Data gaps in 2011 41 6.3 Options to improve data transparency for consumers 43 6.4 Conclusions 44
7 Conclusions and recommendations 45 7.1 Main conclusions and policy recommendations 45 7.2 The conclusions in greater detail 45
4 February 2013 4.786.1 - Biofuels on the Dutch market
References 49
Annex A Argos 53
Annex B BP 55
Annex C Den Hartog 57
Annex D Esso 59
Annex E Gulf 61
Annex F Kuwait 63
Annex G Salland 65
Annex H Shell 67
Annex I Total 69
Annex J Abbrevations certification schemes 71
5 February 2013 4.786.1 - Biofuels on the Dutch market
Summary
Introduction Under the Dutch biofuels obligation, fuel suppliers are required to include a minimum share of biofuels in their overall sales of road transport fuels: 4.25% in 2011 and 5% in 2012. From 2011 onwards they have also had to submit an annual report detailing the biofuels they sell on the Dutch market. The data from these various sources are then compiled by the Dutch Emissions Authority (NEa), which publishes a selection of the results. The first report, with data for 2011, was published in 2012. The Netherlands is the second EU country (after the United Kingdom) to make data on biofuels publically available. BirdLife Europe, Transport & Environment, the European Environmental Bureau and the Dutch NGO Natuur & Milieu commissioned the present study to assess these data by comparing the environmental performance of the biofuels sold by the various fuel suppliers and rank them based on the average greenhouse gas (GHG) emissions of their biofuel blends in 2011. The aim is to identify differences in the companies’ performance and raise the awareness of Dutch consumers. It should be noted that the study is limited to the environmental performance of biofuels. There is currently no reporting in place for fossil transport fuels, which still account for about 97% of total fuel sales.
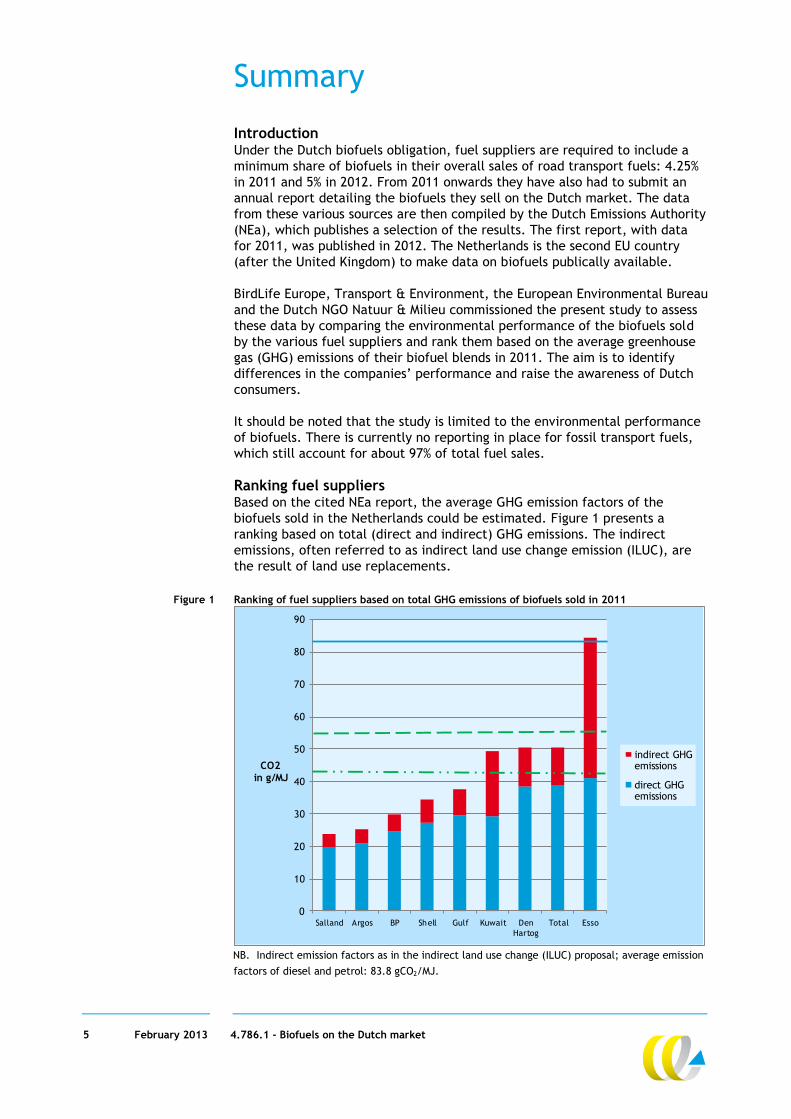
Ranking fuel suppliers Based on the cited NEa report, the average GHG emission factors of the biofuels sold in the Netherlands could be estimated. Figure 1 presents a ranking based on total (direct and indirect) GHG emissions. The indirect emissions, often referred to as indirect land use change emission (ILUC), are the result of land use replacements.
Figure 1 Ranking of fuel suppliers based on total GHG emissions of biofuels sold in 2011
0
10
20
30
40
50
60
70
80
90
Salland Argos BP Shell Gulf Kuwait DenHartog
Total Esso
CO2in g/MJ
indirect GHGemissions
direct GHGemissions
NB. Indirect emission factors as in the indirect land use change (ILUC) proposal; average emission factors of diesel and petrol: 83.8 gCO2/MJ.
6 February 2013 4.786.1 - Biofuels on the Dutch market
Salland, a very small supplier, delivered the best biofuels to the Dutch market, closely followed by Argos, a much larger supplier. On average they achieve a GHG reduction of almost 70%. Esso supplied biofuels with the highest GHG emissions to this market, resulting in average GHG emissions close to or even higher than the fossil fuel reference (83.8 gCO2/MJ), so that these biofuels hardly reduce GHG emissions at all or even increase GHG emissions. This stems from the use of biodiesel produced from rapeseed, a biofuel with high direct and indirect land use change (ILUC) emissions. The second worst score, that of Total, is due to the high proportion of corn ethanol in their biofuel mix. Overall, the differences in average GHG emission factors can be explained by two factors: The share of biofuels from waste and residues: biofuels from these
sources achieve high direct emission savings and cause no indirect Land use changes (ILUC) emissions. Biofuels produced from crops grown on land have much higher life cycle emissions and also score higher with respect to ILUC.
The type of crops used: the crops used to produce bioethanol typically have lower direct GHG emissions and lower ILUC emissions compared with those used for biodiesel production.
In 2011 the average emission factor of the biodiesel on the Dutch market was lower than that of bioethanol and other biofuels replacing petrol (bio-ethanols). This is due to the relatively large share of biodiesel from used cooking oil and animal fat. The bioethanols were produced mainly from food crops such as corn, which require farmland and hence have higher direct and indirect emissions. The Netherlands implemented the double-counting rules for biofuels from waste and residues relatively early, in 2009. This provided an effective incentive that led to an early adoption of waste-derived biofuels. Almost 25% of the total biofuels sold in the Netherlands is based on wastes and residues, much higher than in most other EU Member States (NEa, 2012a).1 For this reason, the Netherlands are probably not a representative country.
Data transparency Comparison of the Dutch report with the most recent report of the United Kingdom’s Renewable Transport Fuel Obligation (RTFO) brought to light significant differences in level of detail. The UK provides more absolute data and an assessment of performance against national targets, in general as well as at the company level. The report therefore already contains some form of ranking. The Dutch report does not contain any assessment of performance. Overall, the following main data gaps have been identified in the Netherlands. Transition year 2011: The reporting system was not yet fully in place at
the start of the year, so that the 2011 review is incomplete. This should be resolved over 2012.
Lack of absolute biofuel volumes: Only relative data were reported, making it impossible to determine the absolute GHG reduction achieved per fuel supplier. A small fuel supplier with a high average emission factor has less impact than a large fuel supplier with the same emission factor. However, these differences could not be identified due to the lack of data.
Missing link with filling stations: Data are provided for the 12 fuel suppliers that blend biofuels. However, these data are not directly related to the far larger number of fuel suppliers that go on to sell these fuels to consumers. It is therefore currently unknown what biofuels the various fuel brands sell at their filling stations.
1 40% in case the administrative double-counting is taken into account.
7 February 2013 4.786.1 - Biofuels on the Dutch market
Making up-to-date biofuels data available to consumers at filling stations would require significant efforts by the parties involved. A simpler option would be to request or require fuel suppliers to report on their biofuel sales. This would allow consumers to reward better performance by filling up their vehicles at suppliers that sell biofuels with better environmental performance.
Main conclusions and policy recommendations There are large differences in the sustainability of the biofuels sold on the Dutch market. A high share of fuels produced from waste and residues typically results in a better score. Because ILUC is not yet included in the RED, fuel suppliers can market biofuels that do not actually reduce GHG emissions. Therefore, first recommendation is to resolve this issue and ensure that only biofuels that achieve actual GHG savings, also with ILUC included, can count towards the target of the RED. The level of data transparency could be greatly improved by the Dutch government requesting or requiring inclusion of absolute volumes and linkage of type of biofuels to feedstocks and country of origin, and by their assessing companies’ performance against the national target. A high level of transparency would provide a strong incentive for fuel suppliers to opt for biofuels from waste and residues instead of crop-based biofuels. Preferably, the level of transparency should be uniform across all EU Member States in order to avoid a shift of crop-based biofuels to countries with a low level of transparency. Biofuels currently constitute about 3% of the transport fuels sold on the Dutch market. Information on fossil fuels, the remaining 97%, is currently entirely lacking. Transparency for fossil fuels would ensure a level playing field among different sources of fuels and provide an incentive for fuel suppliers to enhance the environmental performance of these fuels as well.

8 February 2013 4.786.1 - Biofuels on the Dutch market
9 February 2013 4.786.1 - Biofuels on the Dutch market
1 Introduction
1.1 Introduction
In the last few years the share of biofuels blended into conventional fuels has gradually increased in the Netherlands. This growth is driven by EU policy and the implementation in Dutch national legislation. Also in the next years this growth will continue to grow as a result of the annually increasing blending obligation of 4.25% in 2011 to 10% in 2020. In order to fulfil this obligation, fuel suppliers must annually submit an overview of the biofuels sold on the Dutch market. In June and September 2012, the Dutch Emissions Authority has published two publications summarising the information provided by the Dutch obliged fuel suppliers over the year 2011. Although all biofuels that count for the Dutch blending quota and the European target of 10% have to meet sustainability criteria, there are still concerns with respect to the sustainability of these alternative fuels. The main reason for these concerns is the fact that the current calculation methodology does not yet include the emissions related to indirect land use change (ILUC). It is therefore still possible to sell biofuels on the market with very limited or no environmental benefits. On the contrary, these biofuels might even harm the environment by for example an increase in greenhouse gas emissions. With respect to land use, a study of Profundo for Oxam Novib has estimated the amount of worldwide land use as result of Dutch biofuel consumption to be 200,000 hectare in 2011 (based on the current average blending percentage of 4.31% and average harvests for different crops; Profundo, 2012). Despite the differences in sustainability between the biofuels sold on the Dutch market, most Dutch consumers are not aware of the biofuels in the fuel mix they consume. They are therefore not able to make conscious decisions, and cannot influence the type of biofuels on the market with their purchasing behaviour. To improve this situation, BirdLife Europe, Transport & Environment, EEB and Natuur & Milieu have commissioned this study, to make this information publically available and to raise awareness among the Dutch consumers.
1.2 Aim of this study
The overall objective of this study is to provide insight in the sustainability of the biofuels sold on the market in 2011 by Dutch fuel suppliers and rank the fuel suppliers according to their level of sustainability. The specific aims of this study are: To deliver a ranking of oil companies based on the sustainability of the mix
of biofuels that they have blended into the Dutch road transport fuels in 2011. The ranking will be based on the direct and indirect greenhouse gas emissions of this biofuel mix, using the latest scientific data on ILUC.
To assess the wider sustainability aspects, including land use, nutrient losses and level of transparency. Attention will also be paid to the level of assurance of the sustainability certification systems used per oil company in the Netherlands.
10 February 2013 4.786.1 - Biofuels on the Dutch market
To compare the results of the Dutch situation with the situation in the UK where biofuels sustainability reporting is in place since 2008.
To make a case for transparency of this type of information to consumers, to allow them to choose which fuels they buy.
1.3 Scope
The scope of this study is limited to the Dutch biofuel market and the year 2011, with the main focus on the environmental aspects of biofuels sustainability. With respect to other European countries this study only includes a comparison with the biofuel market in the United Kingdom.
1.4 Outline of the report
Chapter 2 provides a description of the policy context of the Dutch biofuel market and the current sustainability issues on this market.
In Chapter 3 we describe the methodology and provide the ranking of fuel suppliers with respect to the average GHG emissions based on the information of the publications of the Dutch Emissions Authority.
Chapter 4 includes a wider assessment on the sustainability of biofuels being sold on the Dutch market, including land use, nutrient losses, level of transparency and level of assurance.
A comparison between the Dutch biofuel market and the biofuel market in the United Kingdom is provided in Chapter 5.
Chapter 6 identifies options to increase data transparency on the Dutch biofuel market.
This report finally ends with an overview of the main conclusions in Chapter 7.
11 February 2013 4.786.1 - Biofuels on the Dutch market
2 Policy context and sustainability issues of the Dutch biofuel market
2.1 Introduction
Biofuels consumption in the Netherlands is mostly driven by European policy and the implementation at the national level. Section 2.2 in this chapter describes the relevant directives at the European level. The Dutch policy context, which is strongly related to the European policy, is discussed in Section 2.3.
2.2 Biofuel policy European level
Since 2009, two Directives, the Renewable Energy Directive (RED) and the Fuel Quality Directive (FQD), affect the type of energy used in the transport sector. The RED sets a 10% target for the share of renewable energy in the transport sector for the year 2020. The FQD obliges fuel suppliers to reduce the average GHG intensity of the fuels sold on the market with 6% by 2020 compared to the baseline year 2010 (EC, 2009a; EC, 2009b). It is expected that the targets of both Directives will be mostly fulfilled with the use of biofuels due to a lack of other alternatives to ‘green’ the transport sector. In order to ensure the sustainability of the biofuels, sustainability criteria are included in both the RED and FQD. These directives determine to a large extent which types of biofuels and biofuel quantities are consumed on the European market. Both Directives and the earlier Biofuel Directive are discussed in more detail in the following.
2.2.1 Biofuel Directive Before the Renewable Energy Directive (RED), the consumption of biofuels has been stimulated by the Biofuel Directive of 2003. The reasons for the European Commission to initiate this Directive were threefold: support for the agricultural sector; improving energy security supplies; greenhouse gas emission reductions. This Directive prescribed Member States to set indicative targets for biofuels: a share of 2% biofuels should have been reached in 2005 and a share of 5.75% in 2010. These shares (based on energy content) were however not mandatory. (Agentschap NL, 2011; EC, 2003) Many Member States have implemented national targets in line with this Directive in order to ensure market growth. However, in the next years the sustainability of biofuels was often questioned. While biofuels should contribute to the reduction of greenhouse gas emission reduction, NGOs and research institutes published reports describing the negative environmental impacts as a result of biofuel production. Concerns were raised regarding rising food prices, negative impacts on biodiversity and GHG emissions caused by crop cultivation and land use changes as consequences of biofuel production. Due to these concerns, organisations asked for the inclusion of sustainability criteria in European legislation.
12 February 2013 4.786.1 - Biofuels on the Dutch market
2.2.2 Renewable Energy Directive (RED) The Renewable Energy Directive (2009/28/EC) came into force on 25 June 2009 and replaced the Biofuel Directive of 2003. According to this Directive, 20% of total energy in the EU should consist of renewable energy in 2020. Individual Member State goals were defined, depending on the potential to increase the overall share of renewable energy per Member State. For the Netherlands the renewable energy target is 14%. The current Dutch government has set a new ambitious target of 16% renewable energy in 2020. 10% target for the transport sector Besides an overall target the RED also includes a separate goal for the transport sector: 10% of energy in transport should be renewable by 2020. Each Member State has to meet this 10% share. The share of renewable energy in transport will be calculated in line with Article 3(4) of the RED, which is: All types of energy from
renewable sources consumed in all forms of transport Share of RE = Energy consumption of petrol, diesel, biofuels consumed in road and rail transport, and electricity in the transport sector
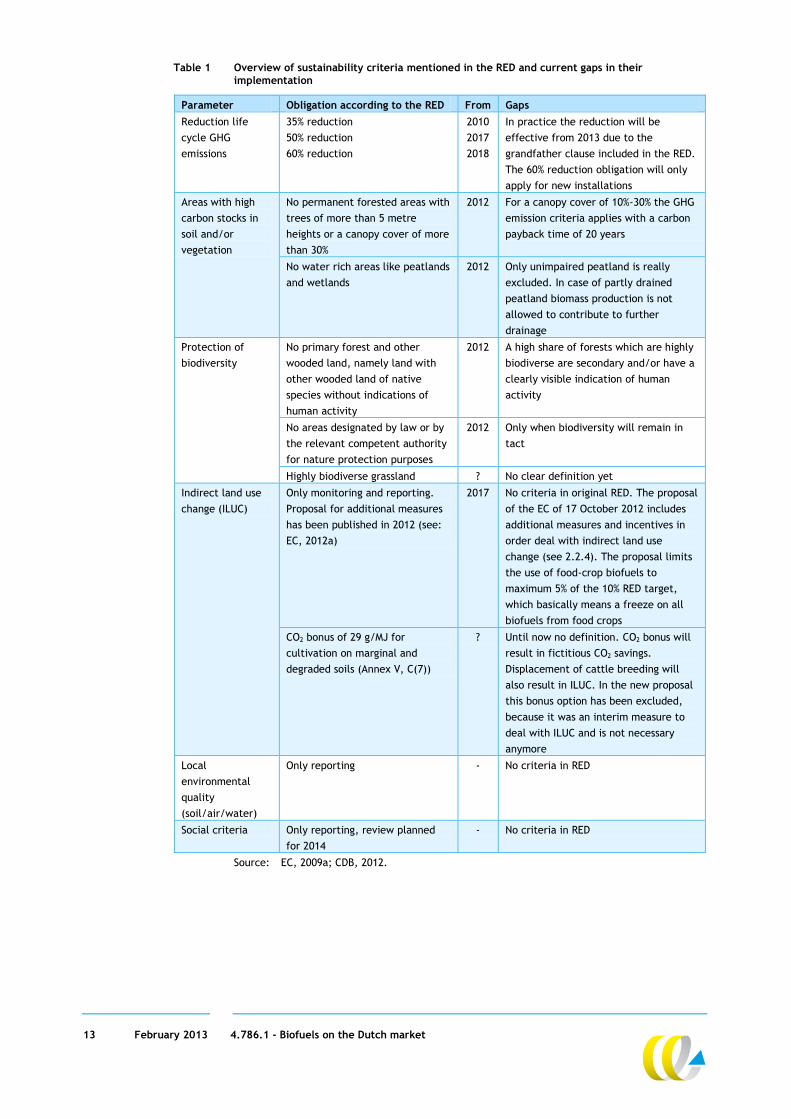
Sustainability criteria In order to count towards the target biofuels and bioliquids should meet the sustainability criteria as laid down in Article 17 of the Directive. In Table 1 an overview of the sustainability criteria is presented together with the gaps as identified by the Dutch Commissie Duurzaamheidsvraagstukken Biomassa (in short CDB. EC, 2009a; CDB, 2012).
Multiplication factors The RED also includes multiplication factors in order to stimulate biofuels from waste and residues and to correct for the higher efficiency of electric vehicles. According to Article 21(2) of the RED the contribution of residues, non-food cellulosic material, and lignocellulosic material shall be considered to be twice that made by other biofuels. For the calculation of the electricity from renewable energy sources consumed by electric road vehicles, that consumption shall be considered to be 2.5 the energy content of the input of the electricity from renewable energy sources, according to Article 3(4)(c).
13 February 2013 4.786.1 - Biofuels on the Dutch market
Table 1 Overview of sustainability criteria mentioned in the RED and current gaps in their implementation
Parameter Obligation according to the RED From Gaps Reduction life cycle GHG emissions
35% reduction 50% reduction 60% reduction
2010 2017 2018
In practice the reduction will be effective from 2013 due to the grandfather clause included in the RED. The 60% reduction obligation will only apply for new installations
Areas with high carbon stocks in soil and/or vegetation
No permanent forested areas with trees of more than 5 metre heights or a canopy cover of more than 30%
2012 For a canopy cover of 10%-30% the GHG emission criteria applies with a carbon payback time of 20 years
No water rich areas like peatlands and wetlands
2012 Only unimpaired peatland is really excluded. In case of partly drained peatland biomass production is not allowed to contribute to further drainage
Protection of biodiversity
No primary forest and other wooded land, namely land with other wooded land of native species without indications of human activity
2012 A high share of forests which are highly biodiverse are secondary and/or have a clearly visible indication of human activity
No areas designated by law or by the relevant competent authority for nature protection purposes
2012 Only when biodiversity will remain in tact
Highly biodiverse grassland ? No clear definition yet
Indirect land use change (ILUC)
Only monitoring and reporting. Proposal for additional measures has been published in 2012 (see: EC, 2012a)
2017 No criteria in original RED. The proposal of the EC of 17 October 2012 includes additional measures and incentives in order deal with indirect land use change (see 2.2.4). The proposal limits the use of food-crop biofuels to maximum 5% of the 10% RED target, which basically means a freeze on all biofuels from food crops
CO2 bonus of 29 g/MJ for cultivation on marginal and degraded soils (Annex V, C(7))
? Until now no definition. CO2 bonus will result in fictitious CO2 savings. Displacement of cattle breeding will also result in ILUC. In the new proposal this bonus option has been excluded, because it was an interim measure to deal with ILUC and is not necessary anymore
Local environmental quality (soil/air/water)
Only reporting - No criteria in RED
Social criteria Only reporting, review planned for 2014
- No criteria in RED
Source: EC, 2009a; CDB, 2012.
14 February 2013 4.786.1 - Biofuels on the Dutch market
2.2.3 Fuel Quality Directive (FQD) The FQD sets technical standards for transport fuels, but also requires fuel suppliers to gradually reduce the average life cycle GHG emissions of the transport fuels that they sell on the EU market. From 2011 onwards, suppliers shall report annually on the GHG intensity of the fuel and energy supplied. Fuel suppliers are also obliged to reduce the life cycle greenhouse gas emissions per unit of energy by up to 10% by December 31st, 2020 compared to the fuel baseline of 83.8 gCO2eq/MJ. 6% of this reduction is mandatory. The remaining 4% can be met by, for example, the use of carbon capture
and storage and credits purchased through the Clean Development Mechanism of the Kyoto Protocol, for reductions in the fuel supply sector.
‘Suppliers’ are, in general, the entities responsible for passing fuel or energy through an excise duty point.
The scope of the Directive are the fuels used by road vehicles, non-road mobile machinery (including inland waterway vessels when not at sea), agricultural and forestry tractors, and recreational craft when not at sea.
The calculation methodology to determine the life cycle GHG emissions of biofuels is the same as the one used in the RED (and thus does not yet include ILUC emissions).
Although the targets have been set in the Directive itself, the methodology to calculate the contribution to this target has not been fully defined so far. In October 2011, the Commission published a draft proposal to fill these gaps, but that has not been agreed on yet2.
2.2.4 Proposal of EC for a Directive to amend the RED In the RED the Commission has obliged itself to submit a report to the European Parliament and to the Council reviewing the impact of indirect land-use change on greenhouse gas emissions and addressing ways to minimise that impacts, by 31 December 2010. According to the RED, this report should be accompanied by a proposal for a new calculation methodology to take indirect land use change emissions into account, but should also include necessary safeguards for investments before the end of 2013, the so-called ‘grand fathering clausule’ (Ecofys, 2012). This proposal was delayed several times, but has been published on the 17th of October 2012. The proposal's main elements regarding the RED are (EC, 2012a): Limitation of foodcrop-based3 biofuels to average ‘current consumption’
levels in the EU, which is estimated to be 5%. Quadruple counting for biofuels from certain waste and residues (double
counting is kept in place for biofuels from energy crops and used cooking oil).
Increase of the minimum greenhouse gas saving threshold for biofuels and bioliquids produced in new installations with effect from 1st July 2014.
Introduction of GHG emissions factors for three feedstock groups in order to include GHG emissions as a result of ILUC. These factors are, however, not included in the calculation methodology of the directives itself, but only need to be used in the Member State reports to the Commission.
2 End of April 2011, it was decided that the Commission would first carry out an Impact
Assessment before submitting a new proposal; http://www.upi.com/Business_News/Energy-Resources/2012/04/23/EU-pushes-back-oil-sands-decision/UPI-81101335107688/.
3 Note that this proposal specifically focus on foodcrop-based biofuels. However, other energy crops also result in indirect land use change emissions. Therefore when we write biofuels from food crops we in fact mean all land-based biofuels.
15 February 2013 4.786.1 - Biofuels on the Dutch market
2.3 Biofuel policy in the Netherlands
The Dutch legislation that transposes the European directives in national legislation is introduced in the following, followed by a paragraph related to the reporting obligations of Dutch fuel suppliers.
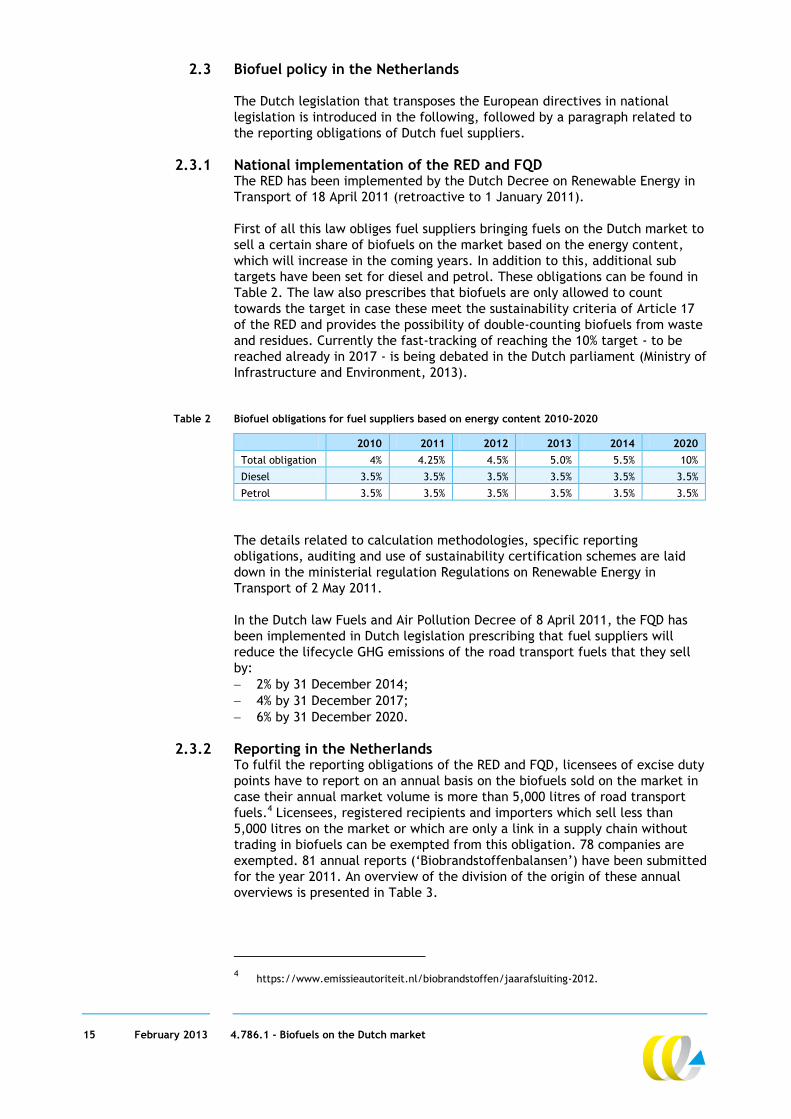
2.3.1 National implementation of the RED and FQD The RED has been implemented by the Dutch Decree on Renewable Energy in Transport of 18 April 2011 (retroactive to 1 January 2011). First of all this law obliges fuel suppliers bringing fuels on the Dutch market to sell a certain share of biofuels on the market based on the energy content, which will increase in the coming years. In addition to this, additional sub targets have been set for diesel and petrol. These obligations can be found in Table 2. The law also prescribes that biofuels are only allowed to count towards the target in case these meet the sustainability criteria of Article 17 of the RED and provides the possibility of double-counting biofuels from waste and residues. Currently the fast-tracking of reaching the 10% target - to be reached already in 2017 - is being debated in the Dutch parliament (Ministry of Infrastructure and Environment, 2013).
Table 2 Biofuel obligations for fuel suppliers based on energy content 2010-2020
2010 2011 2012 2013 2014 2020 Total obligation 4% 4.25% 4.5% 5.0% 5.5% 10%
Diesel 3.5% 3.5% 3.5% 3.5% 3.5% 3.5%
Petrol 3.5% 3.5% 3.5% 3.5% 3.5% 3.5% The details related to calculation methodologies, specific reporting obligations, auditing and use of sustainability certification schemes are laid down in the ministerial regulation Regulations on Renewable Energy in Transport of 2 May 2011. In the Dutch law Fuels and Air Pollution Decree of 8 April 2011, the FQD has been implemented in Dutch legislation prescribing that fuel suppliers will reduce the lifecycle GHG emissions of the road transport fuels that they sell by: 2% by 31 December 2014; 4% by 31 December 2017; 6% by 31 December 2020.
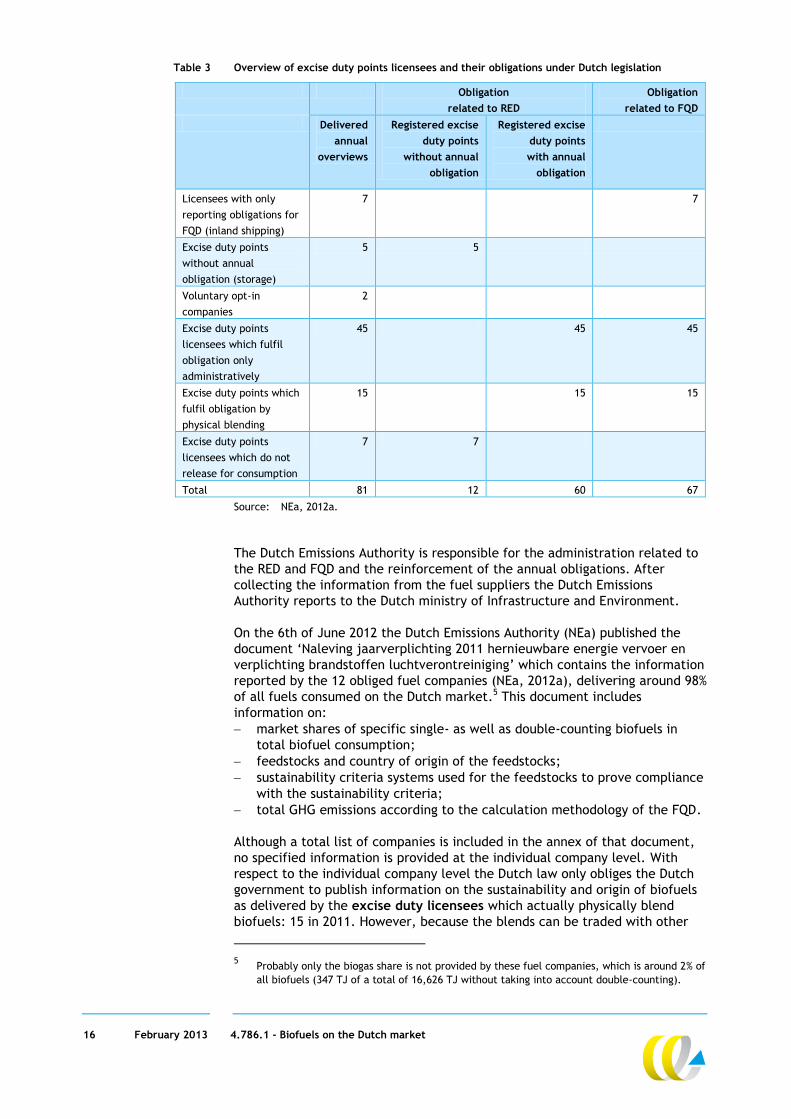
2.3.2 Reporting in the Netherlands To fulfil the reporting obligations of the RED and FQD, licensees of excise duty points have to report on an annual basis on the biofuels sold on the market in case their annual market volume is more than 5,000 litres of road transport fuels.4 Licensees, registered recipients and importers which sell less than 5,000 litres on the market or which are only a link in a supply chain without trading in biofuels can be exempted from this obligation. 78 companies are exempted. 81 annual reports (‘Biobrandstoffenbalansen’) have been submitted for the year 2011. An overview of the division of the origin of these annual overviews is presented in Table 3.
4 https://www.emissieautoriteit.nl/biobrandstoffen/jaarafsluiting-2012.
16 February 2013 4.786.1 - Biofuels on the Dutch market
Table 3 Overview of excise duty points licensees and their obligations under Dutch legislation
Obligation related to RED
Obligation related to FQD
Delivered annual
overviews
Registered excise duty points
without annual obligation
Registered excise duty points with annual
obligation
Licensees with only reporting obligations for FQD (inland shipping)
7 7
Excise duty points without annual obligation (storage)
5 5
Voluntary opt-in companies
2
Excise duty points licensees which fulfil obligation only administratively
45 45 45
Excise duty points which fulfil obligation by physical blending
15 15 15
Excise duty points licensees which do not release for consumption
7 7
Total 81 12 60 67
Source: NEa, 2012a. The Dutch Emissions Authority is responsible for the administration related to the RED and FQD and the reinforcement of the annual obligations. After collecting the information from the fuel suppliers the Dutch Emissions Authority reports to the Dutch ministry of Infrastructure and Environment. On the 6th of June 2012 the Dutch Emissions Authority (NEa) published the document ‘Naleving jaarverplichting 2011 hernieuwbare energie vervoer en verplichting brandstoffen luchtverontreiniging’ which contains the information reported by the 12 obliged fuel companies (NEa, 2012a), delivering around 98% of all fuels consumed on the Dutch market.5 This document includes information on: market shares of specific single- as well as double-counting biofuels in
total biofuel consumption; feedstocks and country of origin of the feedstocks; sustainability criteria systems used for the feedstocks to prove compliance
with the sustainability criteria; total GHG emissions according to the calculation methodology of the FQD. Although a total list of companies is included in the annex of that document, no specified information is provided at the individual company level. With respect to the individual company level the Dutch law only obliges the Dutch government to publish information on the sustainability and origin of biofuels as delivered by the excise duty licensees which actually physically blend biofuels: 15 in 2011. However, because the blends can be traded with other
5 Probably only the biogas share is not provided by these fuel companies, which is around 2% of
all biofuels (347 TJ of a total of 16,626 TJ without taking into account double-counting).
17 February 2013 4.786.1 - Biofuels on the Dutch market
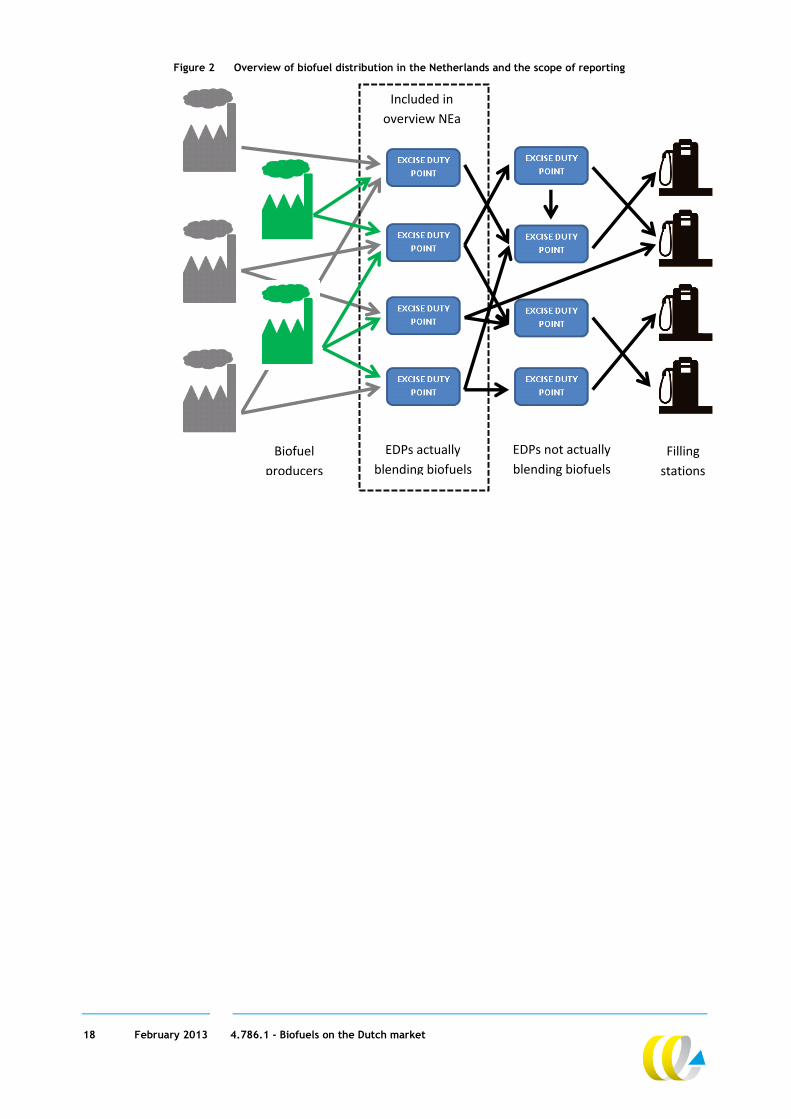
market actors before a consumer will buy these blends at filling stations this information does not provide insight in the type of biofuels or the sustainability of blends provided at individual filling stations or by specific brands. This is also shown in Figure 2, providing an overview of biofuel distribution in the Netherlands including the scope of reporting in the Netherlands. At the end of September 2012, some key data of the information provided by these 12 ‘blenders’ has been published by the NEa which included relative shares of the type of feedstocks, origin of the feedstocks (country) and type of sustainability criteria systems used, at a company level (NEa, 2012b). However, type of feedstocks, origin of biofuels and used certification systems are not linked in this report, while this combination of data is essential to assess the differences in the sustainability of the biofuels used to meet the obligations. In addition, only relative data are given for each company, not absolute volumes. The first publication of the Dutch Emissions Authority included absolute data at a more detailed level from which the link between biofuel, feedstock and country of origin could be derived, but only on a national level, not on the company level. As market sales data are not publically available, absolute impacts of the biofuels cannot be determined. The data cover all biofuels sold in the Netherlands, except those delivered by opt-in companies that sell biomethane6. Note that the biofuels covered here only represent around 3% of overall fuel consumption (without taking the administrative contribution of double-counting biofuels into account). The other 97% consists of fossil fuels with different GHG emission performances. Although this share represents the majority of the GHG emissions, these emissions are not analysed in this report. In order to assess the sustainability of overall fuel use, information on these fuels should be reported and made publically available.
6 In theory, small fuels suppliers that are excluded from the reporting obligation might also sell
biofuels, but that would be only attractive if they would opt-in, and trade biotickets. We do not expect this to occur in practice, at least not on a significant scale.
18 February 2013 4.786.1 - Biofuels on the Dutch market
Figure 2 Overview of biofuel distribution in the Netherlands and the scope of reporting
Refineries
Biofuel
producers
EDPs actually
blending biofuels
EDPs not actually
blending biofuels Filling
stations
Included in
overview NEa
19 February 2013 4.786.1 - Biofuels on the Dutch market
3 Ranking of Dutch biofuel suppliers
3.1 Introduction
Based on the two overviews published by the Dutch Emissions Authority we can estimate the environmental impacts of the biofuels sold on the market by the various fuel blenders, and rank them accordingly. This chapter will start with a summary of the available data on type of feedstocks and origin per fuel supplier, followed by a description of the methodology used. Section 3.4 then provides the ranking of the fuel suppliers based on average GHG emissions.
3.2 Overview of biofuels blended, per company
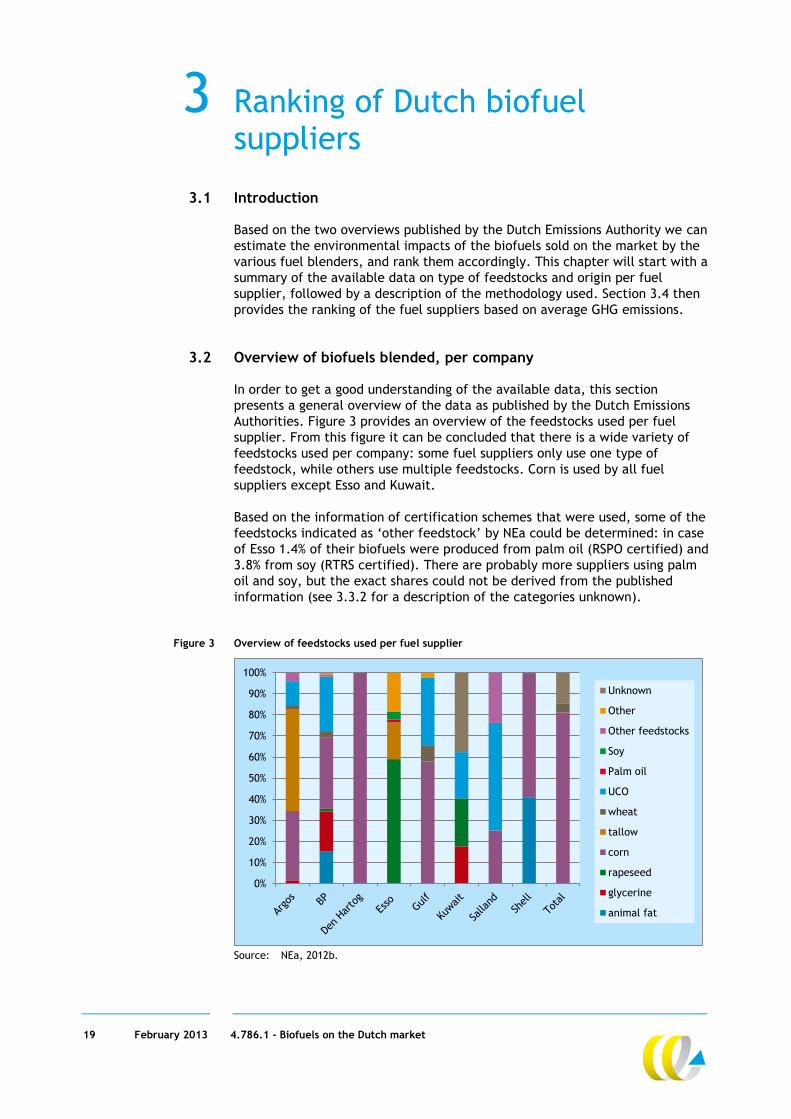
In order to get a good understanding of the available data, this section presents a general overview of the data as published by the Dutch Emissions Authorities. Figure 3 provides an overview of the feedstocks used per fuel supplier. From this figure it can be concluded that there is a wide variety of feedstocks used per company: some fuel suppliers only use one type of feedstock, while others use multiple feedstocks. Corn is used by all fuel suppliers except Esso and Kuwait. Based on the information of certification schemes that were used, some of the feedstocks indicated as ‘other feedstock’ by NEa could be determined: in case of Esso 1.4% of their biofuels were produced from palm oil (RSPO certified) and 3.8% from soy (RTRS certified). There are probably more suppliers using palm oil and soy, but the exact shares could not be derived from the published information (see 3.3.2 for a description of the categories unknown).
Figure 3 Overview of feedstocks used per fuel supplier
0%
10%
20%
30%
40%
50%
60%
70%
80%
90%
100%
Unknown
Other
Other feedstocks
Soy
Palm oil
UCO
wheat
tallow
corn
rapeseed
glycerine
animal fat
Source: NEa, 2012b.
20 February 2013 4.786.1 - Biofuels on the Dutch market
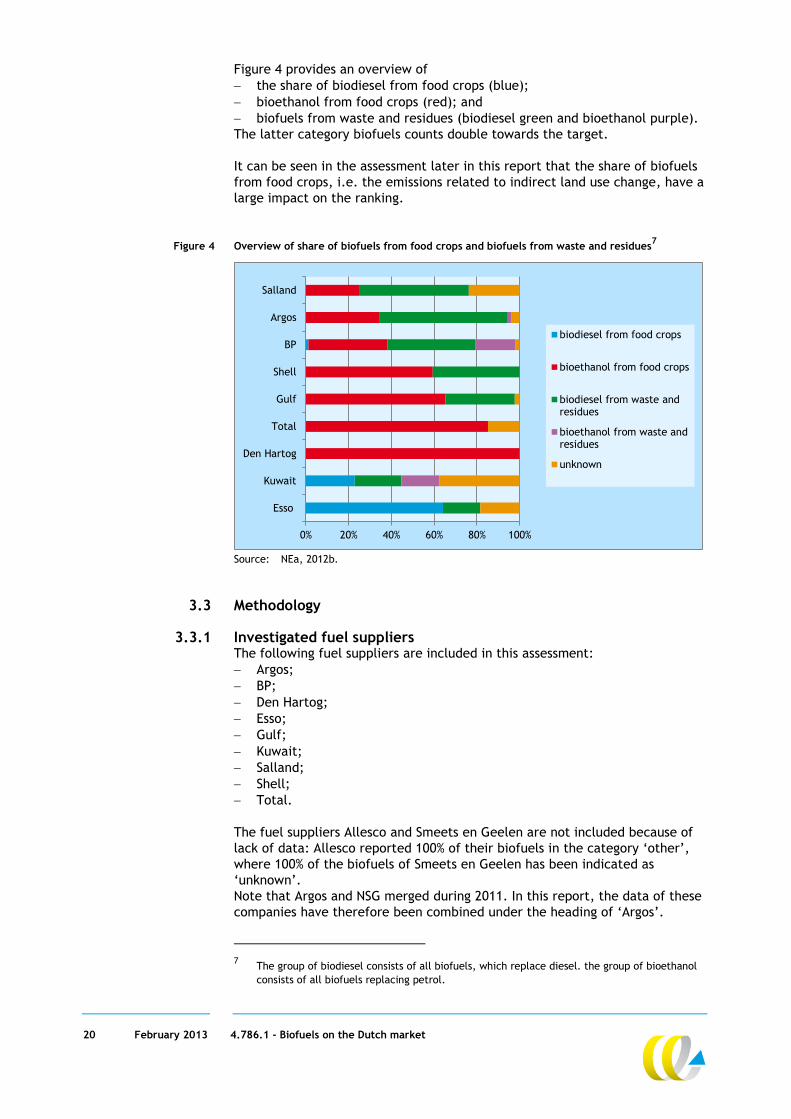
Figure 4 provides an overview of the share of biodiesel from food crops (blue); bioethanol from food crops (red); and biofuels from waste and residues (biodiesel green and bioethanol purple). The latter category biofuels counts double towards the target. It can be seen in the assessment later in this report that the share of biofuels from food crops, i.e. the emissions related to indirect land use change, have a large impact on the ranking.
Figure 4 Overview of share of biofuels from food crops and biofuels from waste and residues7
0% 20% 40% 60% 80% 100%
Esso
Kuwait
Den Hartog
Total
Gulf
Shell
BP
Argos
Salland
biodiesel from food crops
bioethanol from food crops
biodiesel from waste andresidues
bioethanol from waste andresidues
unknown
Source: NEa, 2012b.
3.3 Methodology
3.3.1 Investigated fuel suppliers The following fuel suppliers are included in this assessment: Argos; BP; Den Hartog; Esso; Gulf; Kuwait; Salland; Shell; Total. The fuel suppliers Allesco and Smeets en Geelen are not included because of lack of data: Allesco reported 100% of their biofuels in the category ‘other’, where 100% of the biofuels of Smeets en Geelen has been indicated as ‘unknown’. Note that Argos and NSG merged during 2011. In this report, the data of these companies have therefore been combined under the heading of ‘Argos’.
7 The group of biodiesel consists of all biofuels, which replace diesel. the group of bioethanol
consists of all biofuels replacing petrol.
21 February 2013 4.786.1 - Biofuels on the Dutch market
The overviews of NEa do not contain absolute data per fuel supplier, which means that, for example, data on biofuels volumes sold by each supplier are lacking. Only relative data are provided. As statistics regarding sales per fuel blender are also lacking, the differences in fuel sales between the different fuel suppliers could not be taken into account.
3.3.2 Investigated biofuel categories Looking at the various fuel suppliers, there are only two fuel suppliers (Den Hartog and Shell) where all feedstocks are known. The other fuel suppliers also have a share of unknown feedstocks. The report of the Dutch Emissions Authority uses three categories of unknown biofuels: Other feedstocks: the Dutch Emissions Authority has used the RTFO
method, where only the seven largest biofuels categories are presented in the report. Other less used feedstocks are classified as ‘other feedstocks’. Based on the information of the first report of the Dutch Emissions Authority it can be concluded that at least the following feedstocks are classified as other feedstocks: palm oil, soy, sugar beet, sugar cane and tall oil (whether or not refined).
Other and unknown: there are four reasons why a share of the feedstocks is classified as other or unknown: In the first half year of 2011 sustainability certification schemes were
not approved yet. Due to the lack of approved certification schemes the information
exchange between fuel suppliers and other market actors was not optimal. In case of a lack of information the fuel suppliers used ‘other’ or ‘unknown’.
The category ‘other’ also has been used in case of the use of multiple certification schemes.
Not all possible feedstocks have been included in the spreadsheet of the Dutch Emissions Authority used by the fuel suppliers to report on the feedstocks. The category ‘other’ has also been used for feedstocks not listed in the spreadsheet (personal communication Dutch Emissions Authority).
In Figure 5, an overview of the shares of unknown biofuels per supplier is depicted. Because 2011 was a transition year, the expectation for the future is that the shares of the three unknown categories will decrease in the coming years.
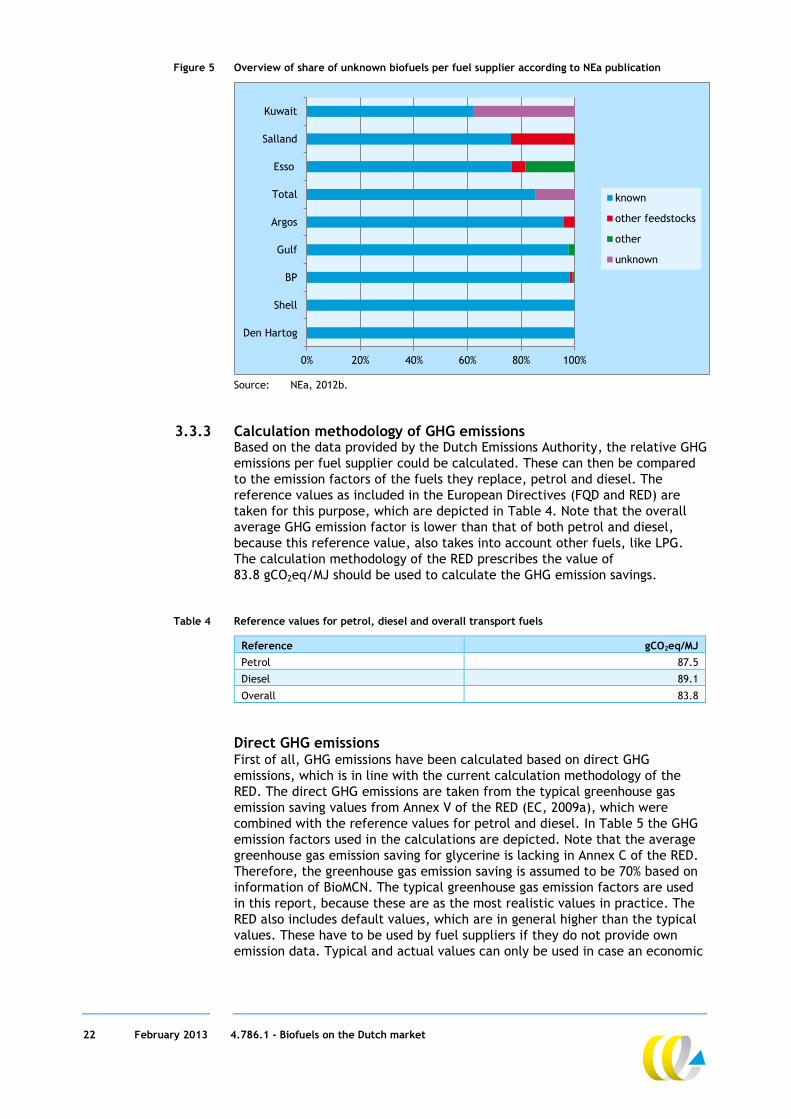
22 February 2013 4.786.1 - Biofuels on the Dutch market
Figure 5 Overview of share of unknown biofuels per fuel supplier according to NEa publication
0% 20% 40% 60% 80% 100%
Den Hartog
Shell
BP
Gulf
Argos
Total
Esso
Salland
Kuwait
known
other feedstocks
other
unknown
Source: NEa, 2012b.
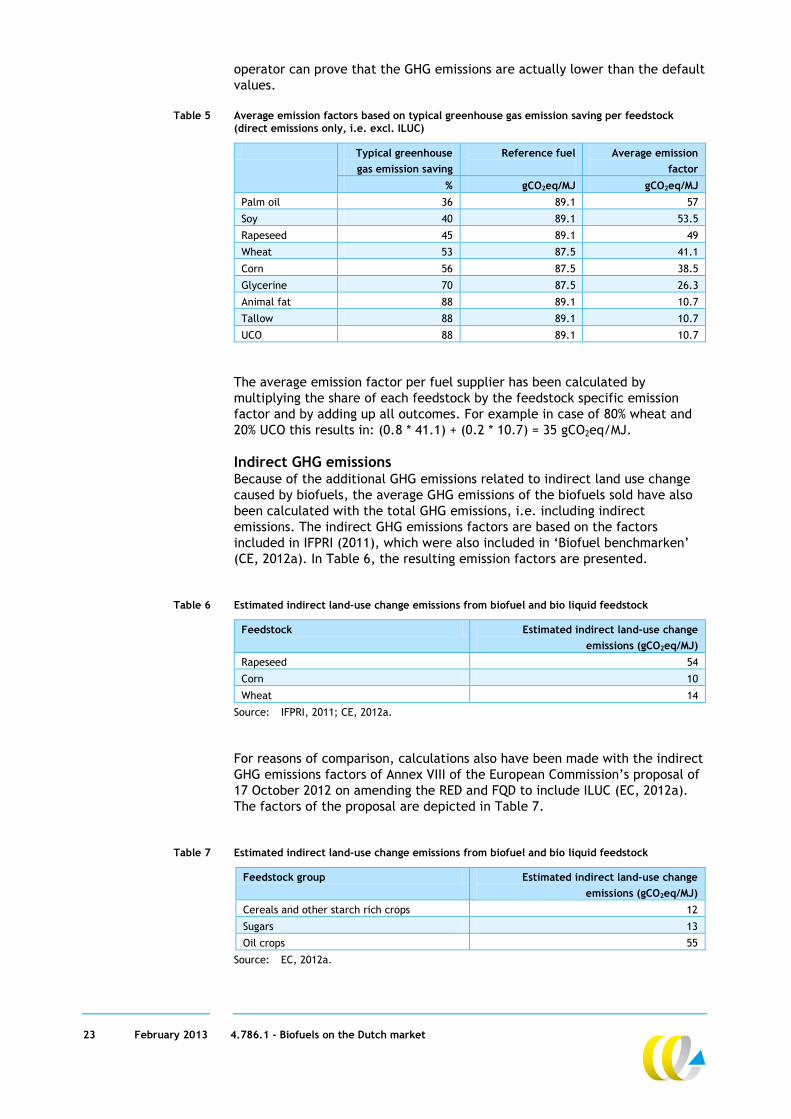
3.3.3 Calculation methodology of GHG emissions Based on the data provided by the Dutch Emissions Authority, the relative GHG emissions per fuel supplier could be calculated. These can then be compared to the emission factors of the fuels they replace, petrol and diesel. The reference values as included in the European Directives (FQD and RED) are taken for this purpose, which are depicted in Table 4. Note that the overall average GHG emission factor is lower than that of both petrol and diesel, because this reference value, also takes into account other fuels, like LPG. The calculation methodology of the RED prescribes the value of 83.8 gCO2eq/MJ should be used to calculate the GHG emission savings.
Table 4 Reference values for petrol, diesel and overall transport fuels
Reference gCO2eq/MJ Petrol 87.5
Diesel 89.1
Overall 83.8
Direct GHG emissions First of all, GHG emissions have been calculated based on direct GHG emissions, which is in line with the current calculation methodology of the RED. The direct GHG emissions are taken from the typical greenhouse gas emission saving values from Annex V of the RED (EC, 2009a), which were combined with the reference values for petrol and diesel. In Table 5 the GHG emission factors used in the calculations are depicted. Note that the average greenhouse gas emission saving for glycerine is lacking in Annex C of the RED. Therefore, the greenhouse gas emission saving is assumed to be 70% based on information of BioMCN. The typical greenhouse gas emission factors are used in this report, because these are as the most realistic values in practice. The RED also includes default values, which are in general higher than the typical values. These have to be used by fuel suppliers if they do not provide own emission data. Typical and actual values can only be used in case an economic
23 February 2013 4.786.1 - Biofuels on the Dutch market
operator can prove that the GHG emissions are actually lower than the default values.
Table 5 Average emission factors based on typical greenhouse gas emission saving per feedstock (direct emissions only, i.e. excl. ILUC)
Typical greenhouse gas emission saving
Reference fuel
Average emission factor
% gCO2eq/MJ gCO2eq/MJ Palm oil 36 89.1 57
Soy 40 89.1 53.5
Rapeseed 45 89.1 49
Wheat 53 87.5 41.1
Corn 56 87.5 38.5
Glycerine 70 87.5 26.3
Animal fat 88 89.1 10.7
Tallow 88 89.1 10.7
UCO 88 89.1 10.7 The average emission factor per fuel supplier has been calculated by multiplying the share of each feedstock by the feedstock specific emission factor and by adding up all outcomes. For example in case of 80% wheat and 20% UCO this results in: (0.8 * 41.1) + (0.2 * 10.7) = 35 gCO2eq/MJ.
Indirect GHG emissions Because of the additional GHG emissions related to indirect land use change caused by biofuels, the average GHG emissions of the biofuels sold have also been calculated with the total GHG emissions, i.e. including indirect emissions. The indirect GHG emissions factors are based on the factors included in IFPRI (2011), which were also included in ‘Biofuel benchmarken’ (CE, 2012a). In Table 6, the resulting emission factors are presented.
Table 6 Estimated indirect land-use change emissions from biofuel and bio liquid feedstock
Feedstock Estimated indirect land-use change emissions (gCO2eq/MJ)
Rapeseed 54
Corn 10
Wheat 14
Source: IFPRI, 2011; CE, 2012a. For reasons of comparison, calculations also have been made with the indirect GHG emissions factors of Annex VIII of the European Commission’s proposal of 17 October 2012 on amending the RED and FQD to include ILUC (EC, 2012a). The factors of the proposal are depicted in Table 7.
Table 7 Estimated indirect land-use change emissions from biofuel and bio liquid feedstock
Feedstock group Estimated indirect land-use change emissions (gCO2eq/MJ)
Cereals and other starch rich crops 12
Sugars 13
Oil crops 55
Source: EC, 2012a.
24 February 2013 4.786.1 - Biofuels on the Dutch market
Ranking based on known feedstocks In first instance a ranking will be performed taking only the known biofuel feedstocks into account (i.e. excluding the three unknown categories). Fuel suppliers are ranked based on their relative average GHG emission factors. As said before, absolute GHG emission savings as result of the blending of biofuels cannot be estimated for each specific fuel blender, because absolute volumes are unknown. However, information on total GHG emission savings can be derived on a national level, from the first NEa report, using the calculation methodology of the FQD. According to NEa the total GHG emissions during the life cycle of all transport fuels (542,648 TJ) in the Netherlands is 46.9 Mton CO2eq. This results in an average GHG emission factor of 86.35 gCO2eq/MJ, which is 2.2% higher than the reference value of 83.8 gCO2eq/MJ. No specific calculations are available for road transport fuels or the emission reduction as result of biofuel consumption.
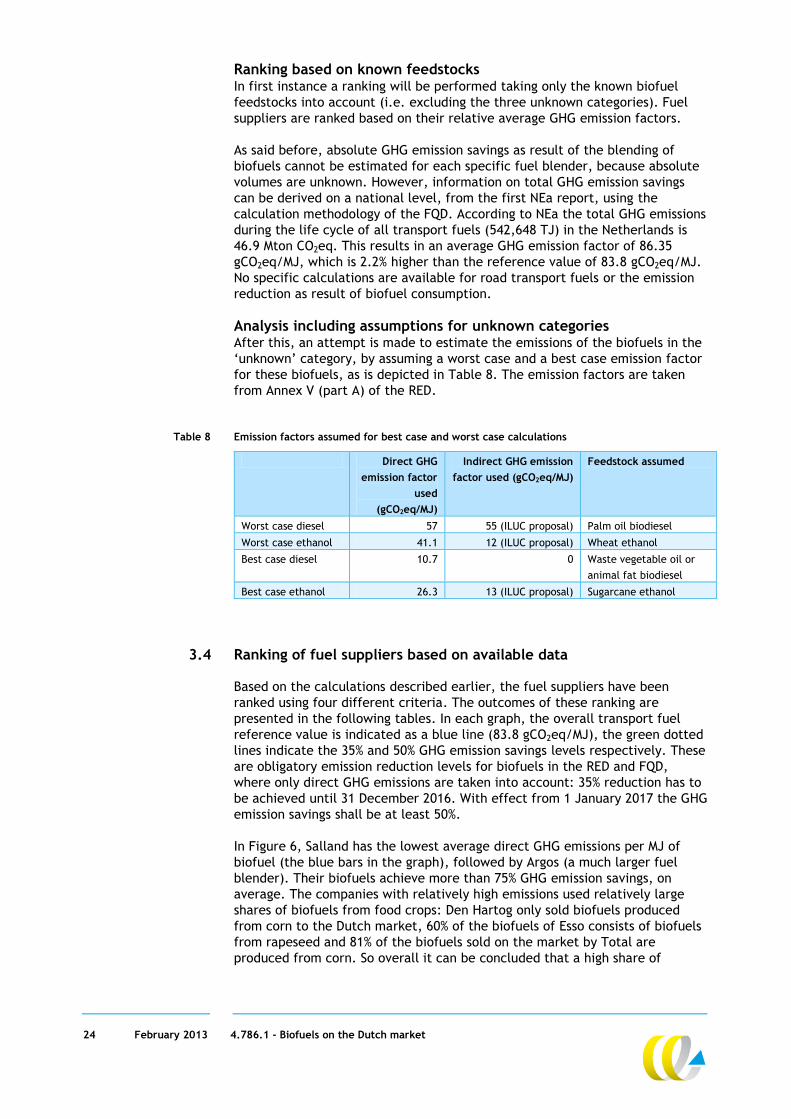
Analysis including assumptions for unknown categories After this, an attempt is made to estimate the emissions of the biofuels in the ‘unknown’ category, by assuming a worst case and a best case emission factor for these biofuels, as is depicted in Table 8. The emission factors are taken from Annex V (part A) of the RED.
Table 8 Emission factors assumed for best case and worst case calculations
Direct GHG emission factor
used (gCO2eq/MJ)
Indirect GHG emission factor used (gCO2eq/MJ)
Feedstock assumed
Worst case diesel 57 55 (ILUC proposal) Palm oil biodiesel
Worst case ethanol 41.1 12 (ILUC proposal) Wheat ethanol
Best case diesel 10.7 0 Waste vegetable oil or animal fat biodiesel
Best case ethanol 26.3 13 (ILUC proposal) Sugarcane ethanol
3.4 Ranking of fuel suppliers based on available data
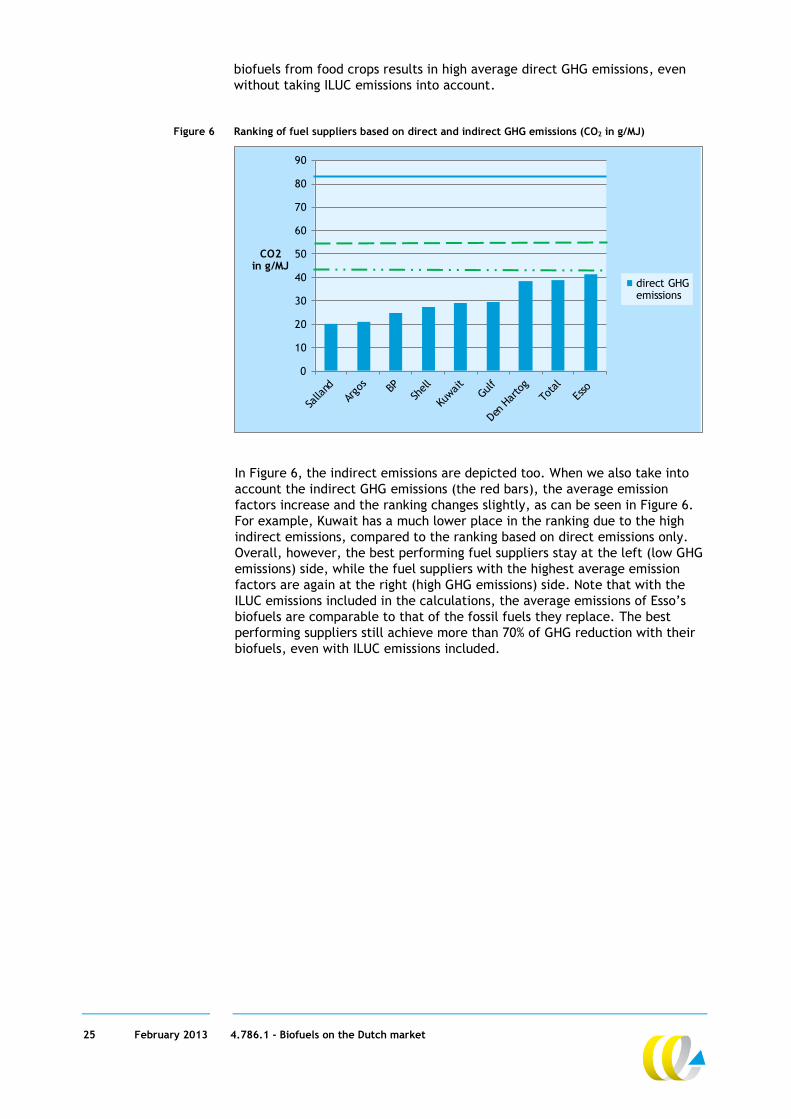
Based on the calculations described earlier, the fuel suppliers have been ranked using four different criteria. The outcomes of these ranking are presented in the following tables. In each graph, the overall transport fuel reference value is indicated as a blue line (83.8 gCO2eq/MJ), the green dotted lines indicate the 35% and 50% GHG emission savings levels respectively. These are obligatory emission reduction levels for biofuels in the RED and FQD, where only direct GHG emissions are taken into account: 35% reduction has to be achieved until 31 December 2016. With effect from 1 January 2017 the GHG emission savings shall be at least 50%. In Figure 6, Salland has the lowest average direct GHG emissions per MJ of biofuel (the blue bars in the graph), followed by Argos (a much larger fuel blender). Their biofuels achieve more than 75% GHG emission savings, on average. The companies with relatively high emissions used relatively large shares of biofuels from food crops: Den Hartog only sold biofuels produced from corn to the Dutch market, 60% of the biofuels of Esso consists of biofuels from rapeseed and 81% of the biofuels sold on the market by Total are produced from corn. So overall it can be concluded that a high share of
25 February 2013 4.786.1 - Biofuels on the Dutch market
biofuels from food crops results in high average direct GHG emissions, even without taking ILUC emissions into account.
Figure 6 Ranking of fuel suppliers based on direct and indirect GHG emissions (CO2 in g/MJ)
0
10
20
30
40
50
60
70
80
90
CO2 in g/MJ
direct GHGemissions
In Figure 6, the indirect emissions are depicted too. When we also take into account the indirect GHG emissions (the red bars), the average emission factors increase and the ranking changes slightly, as can be seen in Figure 6. For example, Kuwait has a much lower place in the ranking due to the high indirect emissions, compared to the ranking based on direct emissions only. Overall, however, the best performing fuel suppliers stay at the left (low GHG emissions) side, while the fuel suppliers with the highest average emission factors are again at the right (high GHG emissions) side. Note that with the ILUC emissions included in the calculations, the average emissions of Esso’s biofuels are comparable to that of the fossil fuels they replace. The best performing suppliers still achieve more than 70% of GHG reduction with their biofuels, even with ILUC emissions included.
26 February 2013 4.786.1 - Biofuels on the Dutch market
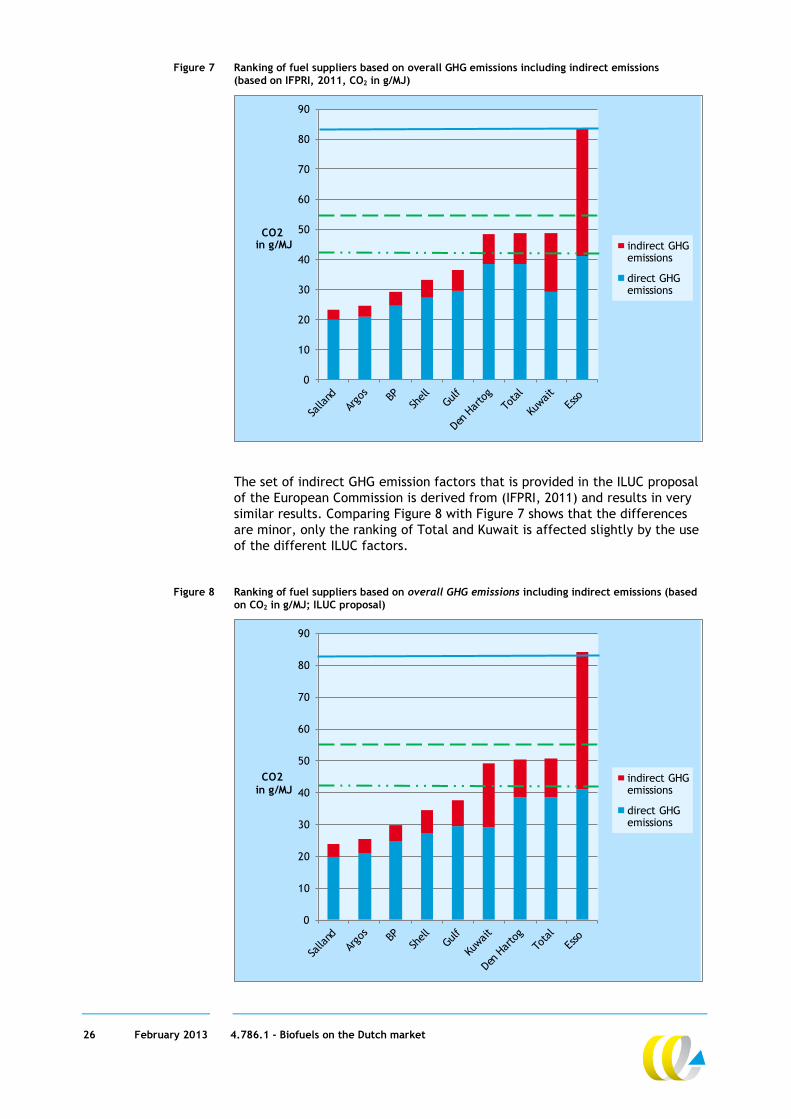
Figure 7 Ranking of fuel suppliers based on overall GHG emissions including indirect emissions (based on IFPRI, 2011, CO2 in g/MJ)
0
10
20
30
40
50
60
70
80
90
CO2in g/MJ indirect GHG
emissions
direct GHGemissions
The set of indirect GHG emission factors that is provided in the ILUC proposal of the European Commission is derived from (IFPRI, 2011) and results in very similar results. Comparing Figure 8 with Figure 7 shows that the differences are minor, only the ranking of Total and Kuwait is affected slightly by the use of the different ILUC factors.
Figure 8 Ranking of fuel suppliers based on overall GHG emissions including indirect emissions (based on CO2 in g/MJ; ILUC proposal)
0
10
20
30
40
50
60
70
80
90
CO2in g/MJ
indirect GHGemissions
direct GHGemissions
27 February 2013 4.786.1 - Biofuels on the Dutch market
3.5 Analysis including unknown feedstocks
As described in the methodology the unknown feedstock categories have not been taken into account yet in the ranking in Section 3.4. To estimate the potential impact of these feedstocks, for some blenders 20-40% of the biofuels, calculations also have been performed including the unknown categories by assuming best and worst case GHG emissions factors. Separate calculations haven been made for the ‘biodiesel’ and ‘bioethanol’ shares, indicating which fossil fuels are replaced (here biodiesel is FAME or HVO that replaces diesel, bioethanol is bioethanol, ETBE, MTBE and methanol which replace petrol). As reference values the reference values as included in the European Directives are taken, which are depicted in Table 4.
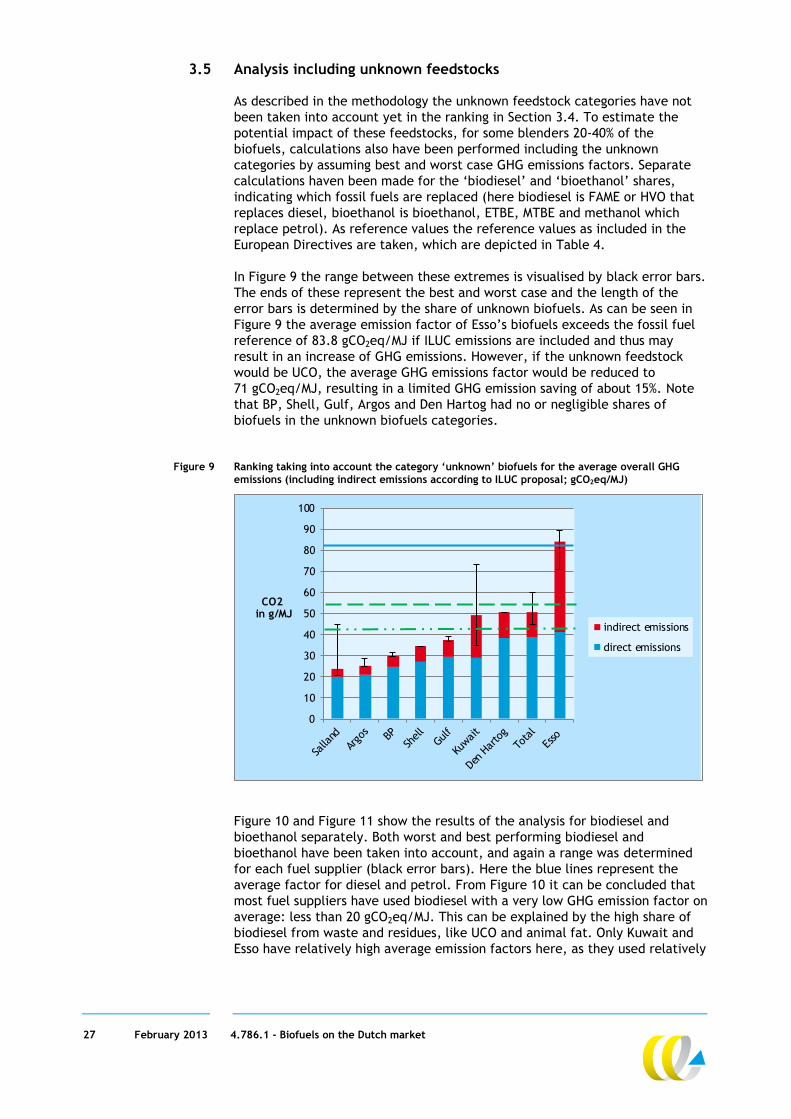
In Figure 9 the range between these extremes is visualised by black error bars. The ends of these represent the best and worst case and the length of the error bars is determined by the share of unknown biofuels. As can be seen in Figure 9 the average emission factor of Esso’s biofuels exceeds the fossil fuel reference of 83.8 gCO2eq/MJ if ILUC emissions are included and thus may result in an increase of GHG emissions. However, if the unknown feedstock would be UCO, the average GHG emissions factor would be reduced to 71 gCO2eq/MJ, resulting in a limited GHG emission saving of about 15%. Note that BP, Shell, Gulf, Argos and Den Hartog had no or negligible shares of biofuels in the unknown biofuels categories.
Figure 9 Ranking taking into account the category ‘unknown’ biofuels for the average overall GHG emissions (including indirect emissions according to ILUC proposal; gCO2eq/MJ)
0
10
20
30
40
50
60
70
80
90
100
CO2in g/MJ
indirect emissions
direct emissions
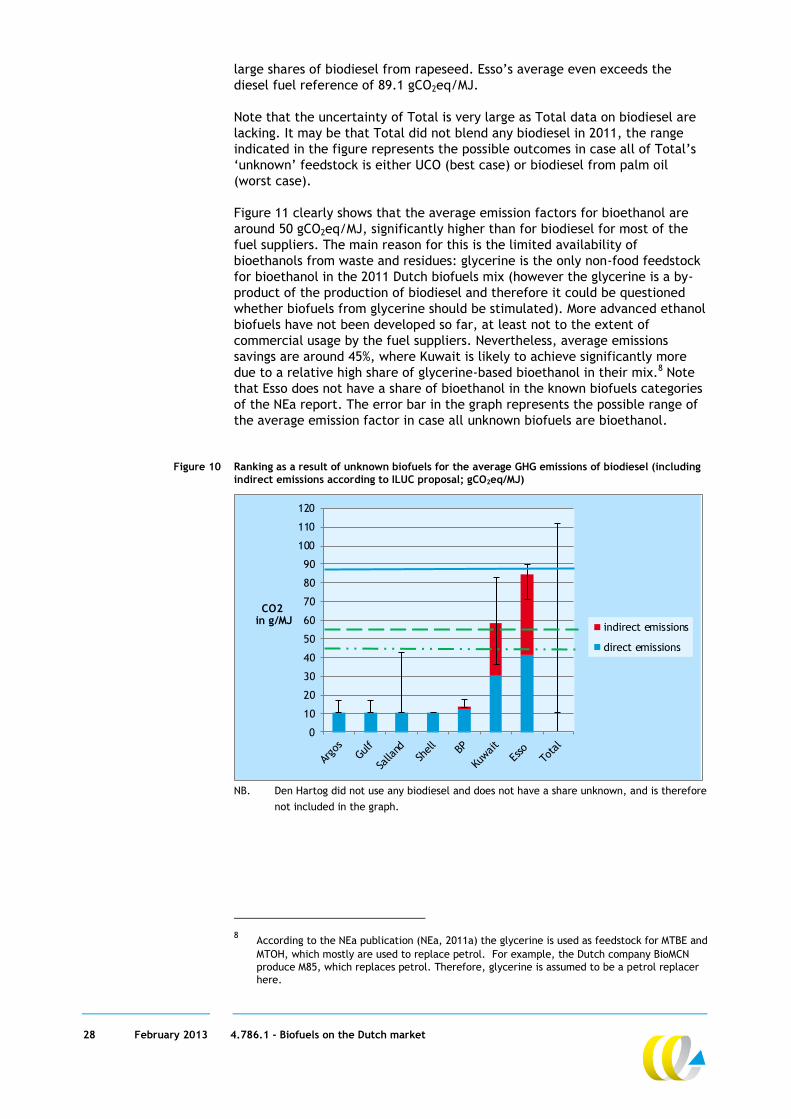
Figure 10 and Figure 11 show the results of the analysis for biodiesel and bioethanol separately. Both worst and best performing biodiesel and bioethanol have been taken into account, and again a range was determined for each fuel supplier (black error bars). Here the blue lines represent the average factor for diesel and petrol. From Figure 10 it can be concluded that most fuel suppliers have used biodiesel with a very low GHG emission factor on average: less than 20 gCO2eq/MJ. This can be explained by the high share of biodiesel from waste and residues, like UCO and animal fat. Only Kuwait and Esso have relatively high average emission factors here, as they used relatively
28 February 2013 4.786.1 - Biofuels on the Dutch market
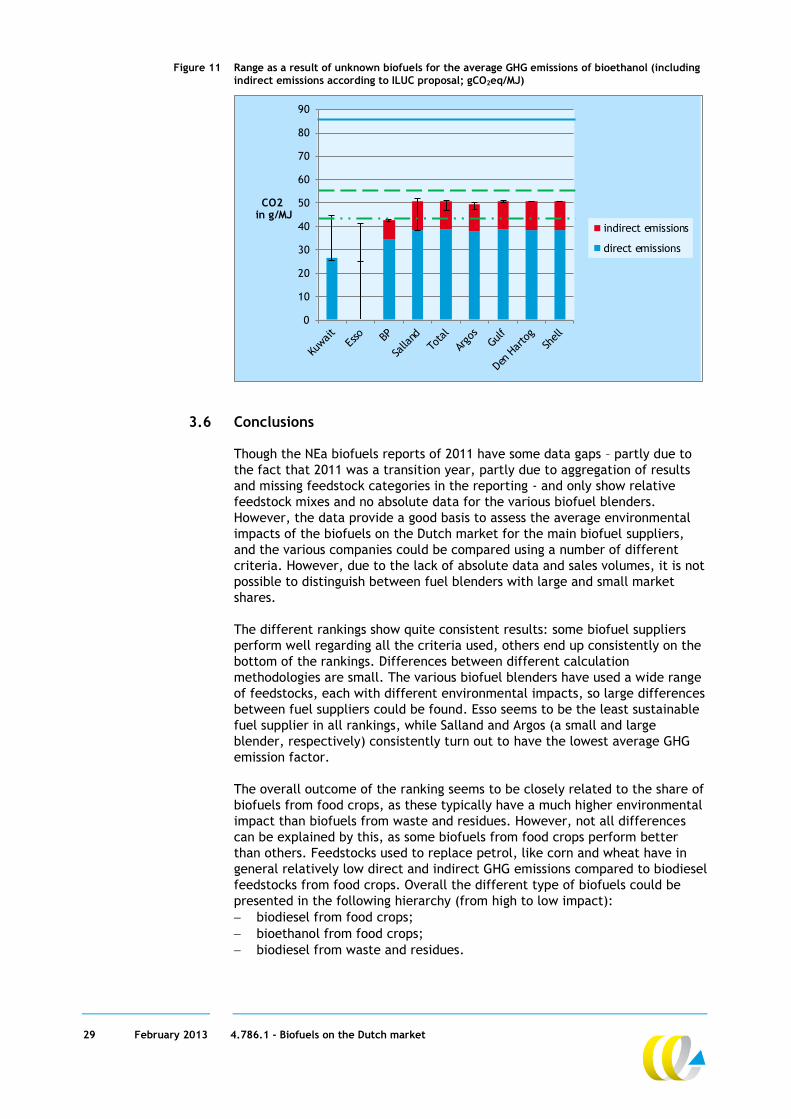
large shares of biodiesel from rapeseed. Esso’s average even exceeds the diesel fuel reference of 89.1 gCO2eq/MJ. Note that the uncertainty of Total is very large as Total data on biodiesel are lacking. It may be that Total did not blend any biodiesel in 2011, the range indicated in the figure represents the possible outcomes in case all of Total’s ‘unknown’ feedstock is either UCO (best case) or biodiesel from palm oil (worst case). Figure 11 clearly shows that the average emission factors for bioethanol are around 50 gCO2eq/MJ, significantly higher than for biodiesel for most of the fuel suppliers. The main reason for this is the limited availability of bioethanols from waste and residues: glycerine is the only non-food feedstock for bioethanol in the 2011 Dutch biofuels mix (however the glycerine is a by-product of the production of biodiesel and therefore it could be questioned whether biofuels from glycerine should be stimulated). More advanced ethanol biofuels have not been developed so far, at least not to the extent of commercial usage by the fuel suppliers. Nevertheless, average emissions savings are around 45%, where Kuwait is likely to achieve significantly more due to a relative high share of glycerine-based bioethanol in their mix.8 Note that Esso does not have a share of bioethanol in the known biofuels categories of the NEa report. The error bar in the graph represents the possible range of the average emission factor in case all unknown biofuels are bioethanol.
Figure 10 Ranking as a result of unknown biofuels for the average GHG emissions of biodiesel (including indirect emissions according to ILUC proposal; gCO2eq/MJ)
0
10
20
30
40
50
60
70
80
90
100
110
120
CO2in g/MJ
indirect emissions
direct emissions
NB. Den Hartog did not use any biodiesel and does not have a share unknown, and is therefore not included in the graph.
8 According to the NEa publication (NEa, 2011a) the glycerine is used as feedstock for MTBE and
MTOH, which mostly are used to replace petrol. For example, the Dutch company BioMCN produce M85, which replaces petrol. Therefore, glycerine is assumed to be a petrol replacer here.
29 February 2013 4.786.1 - Biofuels on the Dutch market
Figure 11 Range as a result of unknown biofuels for the average GHG emissions of bioethanol (including indirect emissions according to ILUC proposal; gCO2eq/MJ)
0
10
20
30
40
50
60
70
80
90
CO2in g/MJ
indirect emissions
direct emissions
3.6 Conclusions
Though the NEa biofuels reports of 2011 have some data gaps – partly due to the fact that 2011 was a transition year, partly due to aggregation of results and missing feedstock categories in the reporting - and only show relative feedstock mixes and no absolute data for the various biofuel blenders. However, the data provide a good basis to assess the average environmental impacts of the biofuels on the Dutch market for the main biofuel suppliers, and the various companies could be compared using a number of different criteria. However, due to the lack of absolute data and sales volumes, it is not possible to distinguish between fuel blenders with large and small market shares. The different rankings show quite consistent results: some biofuel suppliers perform well regarding all the criteria used, others end up consistently on the bottom of the rankings. Differences between different calculation methodologies are small. The various biofuel blenders have used a wide range of feedstocks, each with different environmental impacts, so large differences between fuel suppliers could be found. Esso seems to be the least sustainable fuel supplier in all rankings, while Salland and Argos (a small and large blender, respectively) consistently turn out to have the lowest average GHG emission factor. The overall outcome of the ranking seems to be closely related to the share of biofuels from food crops, as these typically have a much higher environmental impact than biofuels from waste and residues. However, not all differences can be explained by this, as some biofuels from food crops perform better than others. Feedstocks used to replace petrol, like corn and wheat have in general relatively low direct and indirect GHG emissions compared to biodiesel feedstocks from food crops. Overall the different type of biofuels could be presented in the following hierarchy (from high to low impact): biodiesel from food crops; bioethanol from food crops; biodiesel from waste and residues.
30 February 2013 4.786.1 - Biofuels on the Dutch market
Bioethanol from waste and residues is not available, except for glycerine. However, glycerine itself is a by-product of biodiesel production. Therefore, the question can be raised to what extent this by-product is desired or provides an incentive for biodiesel for food crops. Biodiesel from waste and residues seems to be the best option, but the availability of these types of waste and residues is limited, as was also mentioned in CE (2012b).
The average GHG emission factor of the diesel replacers is found to be relatively low due to the extensive use of biodiesels from waste and residues in 2011. However, differences between the fuel blenders are quite significant, especially Esso and, to a lesser extent, Kuwait, have used biodiesel from food crops which result in much higher emissions – comparable to that of the fossil fuels they replace. The average GHG emission factor of petrol replacers is still dominated by bioethanol from food crops, although some blenders, notably Kuwait, achieve much lower emissions of this category of biofuels, by blending glycerine-based biofuels. The bioethanol from food crops that was used results in about 43% GHG reduction (incl. ILUC emissions).
31 February 2013 4.786.1 - Biofuels on the Dutch market
4 Wider sustainability issues
4.1 Introduction
Besides greenhouse gas emission savings there are other sustainability indicators to assess the sustainability of biofuels. In this section those wider sustainability issues are addressed, focussing on land use, nutrient losses, the level of transparency and the level of assurance. The assessment of the indicators land use and nutrient losses are based on the benchmark study of CE Delft, called ‘Biobrandstoffen Benchmarken’ (CE, 2012a) The feedstock categories ‘other’, ‘other feedstocks’ and ‘unknown’ have not been taken into account in this section.
4.2 Land use
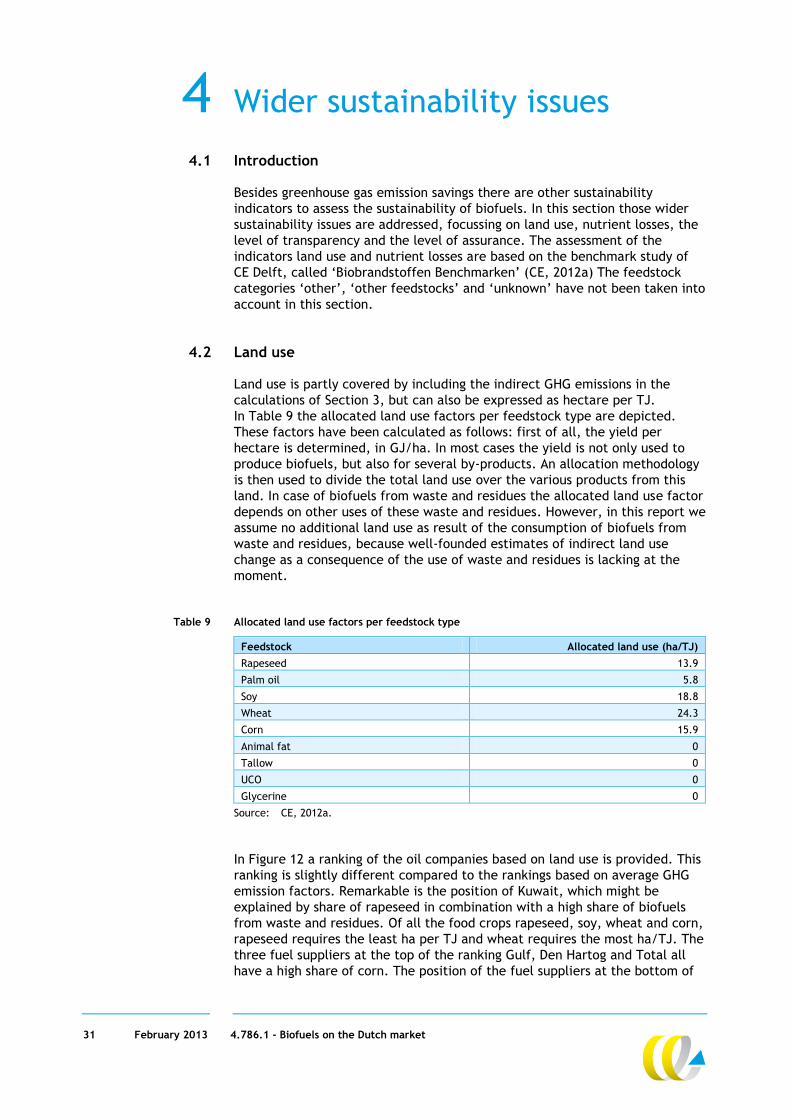
Land use is partly covered by including the indirect GHG emissions in the calculations of Section 3, but can also be expressed as hectare per TJ. In Table 9 the allocated land use factors per feedstock type are depicted. These factors have been calculated as follows: first of all, the yield per hectare is determined, in GJ/ha. In most cases the yield is not only used to produce biofuels, but also for several by-products. An allocation methodology is then used to divide the total land use over the various products from this land. In case of biofuels from waste and residues the allocated land use factor depends on other uses of these waste and residues. However, in this report we assume no additional land use as result of the consumption of biofuels from waste and residues, because well-founded estimates of indirect land use change as a consequence of the use of waste and residues is lacking at the moment.
Table 9 Allocated land use factors per feedstock type
Feedstock Allocated land use (ha/TJ) Rapeseed 13.9
Palm oil 5.8
Soy 18.8
Wheat 24.3
Corn 15.9
Animal fat 0
Tallow 0
UCO 0
Glycerine 0
Source: CE, 2012a. In Figure 12 a ranking of the oil companies based on land use is provided. This ranking is slightly different compared to the rankings based on average GHG emission factors. Remarkable is the position of Kuwait, which might be explained by share of rapeseed in combination with a high share of biofuels from waste and residues. Of all the food crops rapeseed, soy, wheat and corn, rapeseed requires the least ha per TJ and wheat requires the most ha/TJ. The three fuel suppliers at the top of the ranking Gulf, Den Hartog and Total all have a high share of corn. The position of the fuel suppliers at the bottom of
32 February 2013 4.786.1 - Biofuels on the Dutch market
the ranking can be explained by their high share of biofuels from waste and residues.
Figure 12 Ranking of oil companies based on allocated land use of biofuels
0
2
4
6
8
10
12
14
16
18
Kuwait Salland Argos BP Shell Esso Gulf DenHartog
Total
ha/TJ
4.3 Nutrient losses
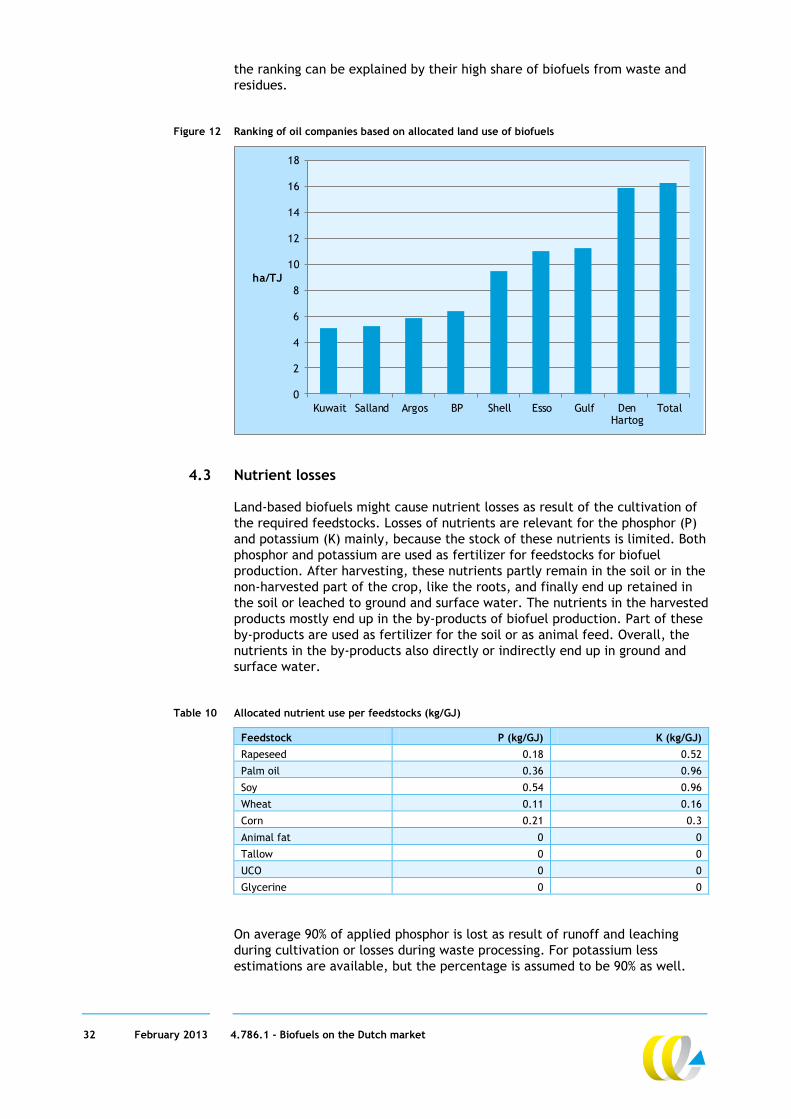
Land-based biofuels might cause nutrient losses as result of the cultivation of the required feedstocks. Losses of nutrients are relevant for the phosphor (P) and potassium (K) mainly, because the stock of these nutrients is limited. Both phosphor and potassium are used as fertilizer for feedstocks for biofuel production. After harvesting, these nutrients partly remain in the soil or in the non-harvested part of the crop, like the roots, and finally end up retained in the soil or leached to ground and surface water. The nutrients in the harvested products mostly end up in the by-products of biofuel production. Part of these by-products are used as fertilizer for the soil or as animal feed. Overall, the nutrients in the by-products also directly or indirectly end up in ground and surface water.
Table 10 Allocated nutrient use per feedstocks (kg/GJ)
Feedstock P (kg/GJ) K (kg/GJ) Rapeseed 0.18 0.52
Palm oil 0.36 0.96
Soy 0.54 0.96
Wheat 0.11 0.16
Corn 0.21 0.3
Animal fat 0 0
Tallow 0 0
UCO 0 0
Glycerine 0 0 On average 90% of applied phosphor is lost as result of runoff and leaching during cultivation or losses during waste processing. For potassium less estimations are available, but the percentage is assumed to be 90% as well.
33 February 2013 4.786.1 - Biofuels on the Dutch market
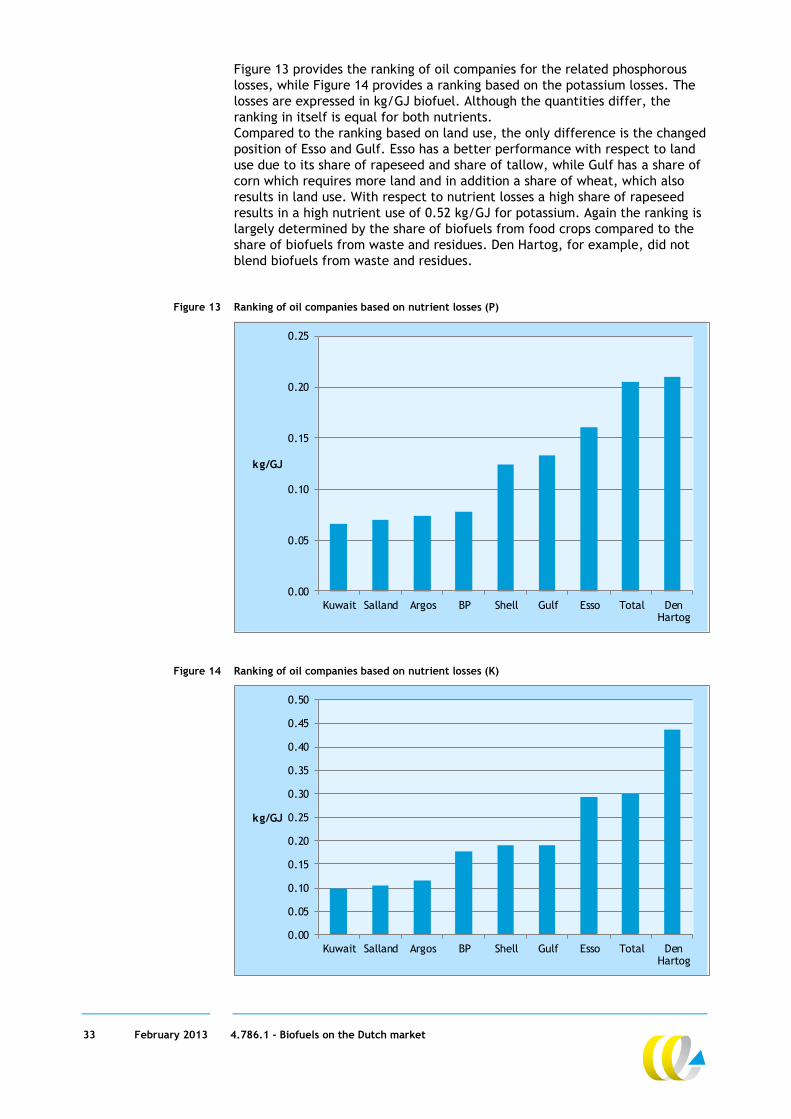
Figure 13 provides the ranking of oil companies for the related phosphorous losses, while Figure 14 provides a ranking based on the potassium losses. The losses are expressed in kg/GJ biofuel. Although the quantities differ, the ranking in itself is equal for both nutrients. Compared to the ranking based on land use, the only difference is the changed position of Esso and Gulf. Esso has a better performance with respect to land use due to its share of rapeseed and share of tallow, while Gulf has a share of corn which requires more land and in addition a share of wheat, which also results in land use. With respect to nutrient losses a high share of rapeseed results in a high nutrient use of 0.52 kg/GJ for potassium. Again the ranking is largely determined by the share of biofuels from food crops compared to the share of biofuels from waste and residues. Den Hartog, for example, did not blend biofuels from waste and residues.
Figure 13 Ranking of oil companies based on nutrient losses (P)
0.00
0.05
0.10
0.15
0.20
0.25
Kuwait Salland Argos BP Shell Gulf Esso Total DenHartog
kg/GJ
Figure 14 Ranking of oil companies based on nutrient losses (K)
0.00
0.05
0.10
0.15
0.20
0.25
0.30
0.35
0.40
0.45
0.50
Kuwait Salland Argos BP Shell Gulf Esso Total DenHartog
kg/GJ
34 February 2013 4.786.1 - Biofuels on the Dutch market
4.4 Level of assurance
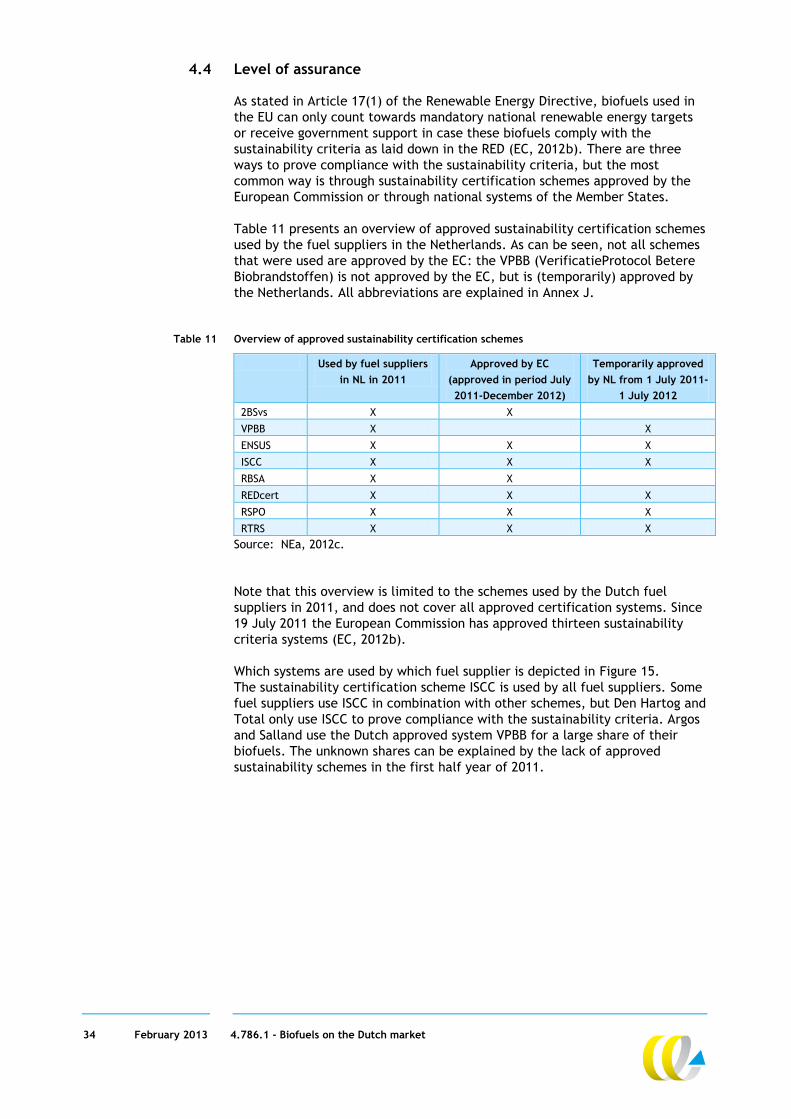
As stated in Article 17(1) of the Renewable Energy Directive, biofuels used in the EU can only count towards mandatory national renewable energy targets or receive government support in case these biofuels comply with the sustainability criteria as laid down in the RED (EC, 2012b). There are three ways to prove compliance with the sustainability criteria, but the most common way is through sustainability certification schemes approved by the European Commission or through national systems of the Member States. Table 11 presents an overview of approved sustainability certification schemes used by the fuel suppliers in the Netherlands. As can be seen, not all schemes that were used are approved by the EC: the VPBB (VerificatieProtocol Betere Biobrandstoffen) is not approved by the EC, but is (temporarily) approved by the Netherlands. All abbreviations are explained in Annex J.
Table 11 Overview of approved sustainability certification schemes
Used by fuel suppliers in NL in 2011
Approved by EC (approved in period July 2011-December 2012)
Temporarily approved by NL from 1 July 2011-
1 July 2012 2BSvs X X
VPBB X X
ENSUS X X X
ISCC X X X
RBSA X X
REDcert X X X
RSPO X X X
RTRS X X X
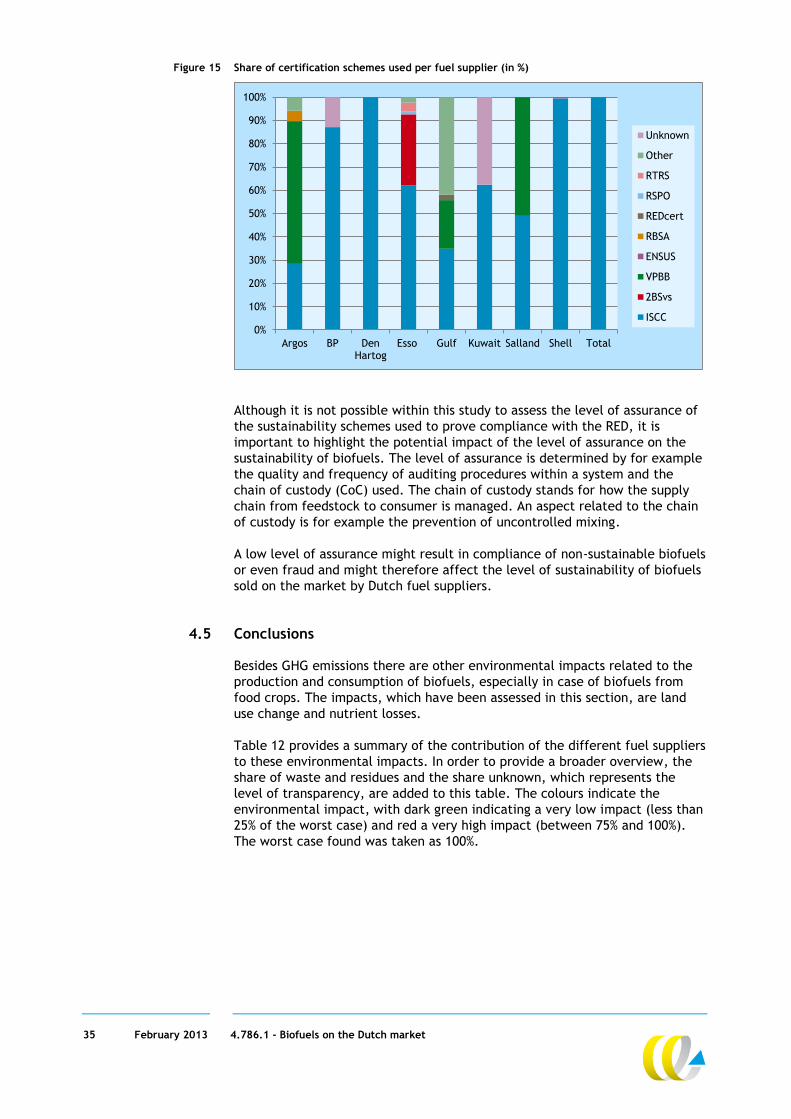
Source: NEa, 2012c. Note that this overview is limited to the schemes used by the Dutch fuel suppliers in 2011, and does not cover all approved certification systems. Since 19 July 2011 the European Commission has approved thirteen sustainability criteria systems (EC, 2012b). Which systems are used by which fuel supplier is depicted in Figure 15. The sustainability certification scheme ISCC is used by all fuel suppliers. Some fuel suppliers use ISCC in combination with other schemes, but Den Hartog and Total only use ISCC to prove compliance with the sustainability criteria. Argos and Salland use the Dutch approved system VPBB for a large share of their biofuels. The unknown shares can be explained by the lack of approved sustainability schemes in the first half year of 2011.
35 February 2013 4.786.1 - Biofuels on the Dutch market
Figure 15 Share of certification schemes used per fuel supplier (in %)
0%
10%
20%
30%
40%
50%
60%
70%
80%
90%
100%
Argos BP DenHartog
Esso Gulf Kuwait Salland Shell Total
Unknown
Other
RTRS
RSPO
REDcert
RBSA
ENSUS
VPBB
2BSvs
ISCC
Although it is not possible within this study to assess the level of assurance of the sustainability schemes used to prove compliance with the RED, it is important to highlight the potential impact of the level of assurance on the sustainability of biofuels. The level of assurance is determined by for example the quality and frequency of auditing procedures within a system and the chain of custody (CoC) used. The chain of custody stands for how the supply chain from feedstock to consumer is managed. An aspect related to the chain of custody is for example the prevention of uncontrolled mixing. A low level of assurance might result in compliance of non-sustainable biofuels or even fraud and might therefore affect the level of sustainability of biofuels sold on the market by Dutch fuel suppliers.
4.5 Conclusions
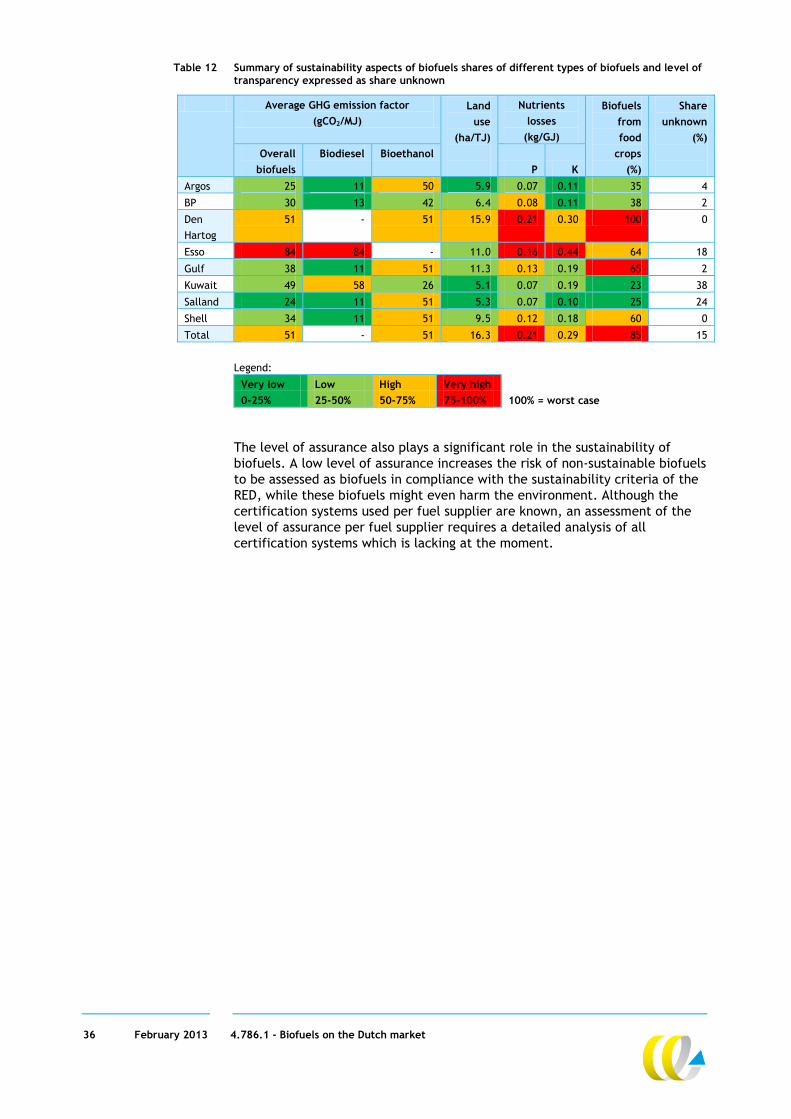
Besides GHG emissions there are other environmental impacts related to the production and consumption of biofuels, especially in case of biofuels from food crops. The impacts, which have been assessed in this section, are land use change and nutrient losses. Table 12 provides a summary of the contribution of the different fuel suppliers to these environmental impacts. In order to provide a broader overview, the share of waste and residues and the share unknown, which represents the level of transparency, are added to this table. The colours indicate the environmental impact, with dark green indicating a very low impact (less than 25% of the worst case) and red a very high impact (between 75% and 100%). The worst case found was taken as 100%.
36 February 2013 4.786.1 - Biofuels on the Dutch market
Table 12 Summary of sustainability aspects of biofuels shares of different types of biofuels and level of transparency expressed as share unknown
Average GHG emission factor (gCO2/MJ)
Land use
(ha/TJ)
Nutrients losses
(kg/GJ)
Biofuels from food
crops (%)
Share unknown
(%)
Overall
biofuels Biodiesel Bioethanol
P K Argos 25 11 50 5.9 0.07 0.11 35 4
BP 30 13 42 6.4 0.08 0.11 38 2
Den Hartog
51 - 51 15.9 0.21 0.30 100 0
Esso 84 84 - 11.0 0.16 0.44 64 18
Gulf 38 11 51 11.3 0.13 0.19 65 2
Kuwait 49 58 26 5.1 0.07 0.19 23 38
Salland 24 11 51 5.3 0.07 0.10 25 24
Shell 34 11 51 9.5 0.12 0.18 60 0
Total 51 - 51 16.3 0.21 0.29 85 15
Legend:
Very low Low High Very high 0-25% 25-50% 50-75% 75-100% 100% = worst case
The level of assurance also plays a significant role in the sustainability of biofuels. A low level of assurance increases the risk of non-sustainable biofuels to be assessed as biofuels in compliance with the sustainability criteria of the RED, while these biofuels might even harm the environment. Although the certification systems used per fuel supplier are known, an assessment of the level of assurance per fuel supplier requires a detailed analysis of all certification systems which is lacking at the moment.
37 February 2013 4.786.1 - Biofuels on the Dutch market
5 A comparison between the Netherlands and the United Kingdom
5.1 Introduction
The RED and FQD have also been transposed in national legislation of other Member States, although public reporting such as that discussed in this report is still very rare. In this chapter the Dutch situation will be compared with that of the United Kingdom, to compare sustainability and reporting practices in these two countries. In Section 5.1 a general description of the relevant UK policy, the Renewable Transport Fuel Obligation (RTFO), is provided. An overview of the feedstocks used and their country of origin is presented in Section 5.2. In Section 5.3 the differences between reporting in the Netherlands and United Kingdom are identified.
5.2 The Renewable Transport Fuel Obligation (RTFO)
The relevant policy in the United Kingdom, which is officially called the Renewable Transport Fuel Obligation (RTFO) Programme, has been developed since 2005 and already came into force in 2008. In line with the EU Biofuel Directive of 2003, the RTFO obliged fuel suppliers to ensure a 5% share of renewable energy by 2010 and also obliged fuel suppliers to report on the net GHG reduction and the sustainability of the biofuels (Van Grinsven, 2009). The RTFO was amended in December 2011 to implement the mandatory sustainability criteria of the RED, as well as the double-counting of biofuels from waste and residues. The RTFO requires fuel suppliers to report on a monthly basis. Like in the Netherlands, a system of tradable biotickets is in place, called Renewable Transport Fuel Certificates (RTFCs) (DfT, 2012).
5.3 Biofuels supplied in the United Kingdom from April 2010–April 2011
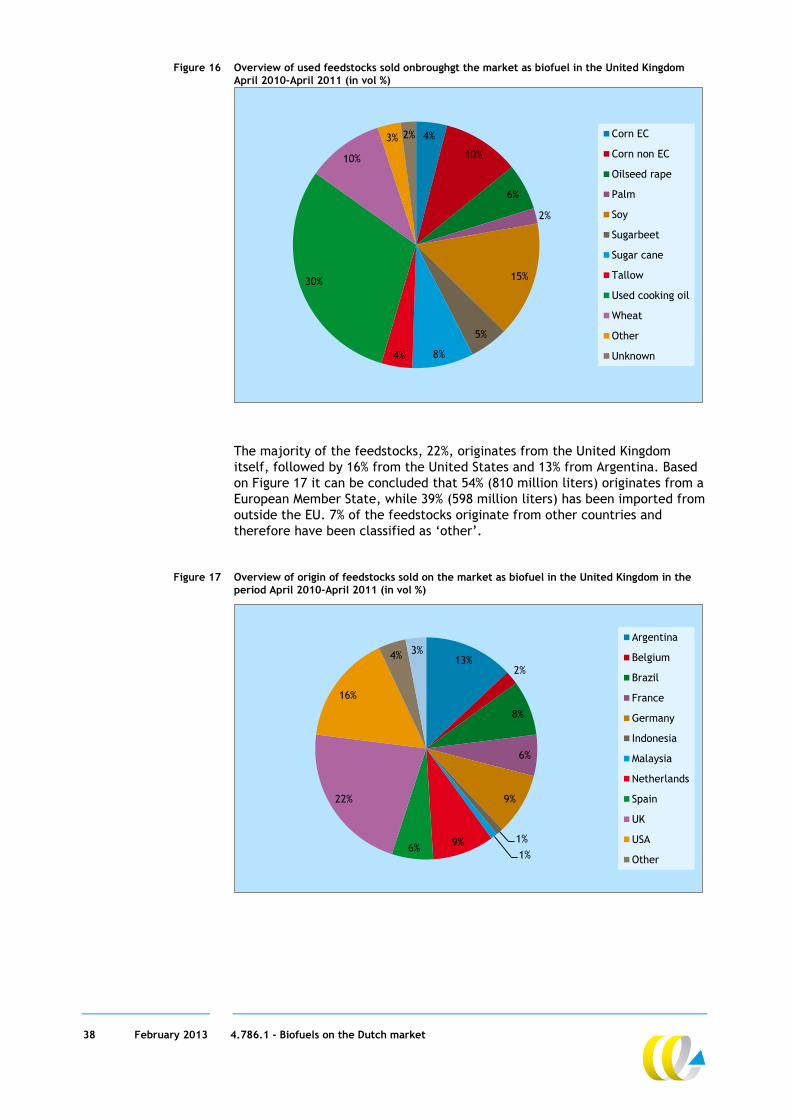
Like in the Netherlands, a report has been published summarising the data provided by fuel supplier. The most recent report of the RTFO is the Year 3 Verified Report: 15 April 2010 – 14 April 2011 (RTFO, 2011). In Figure 16 an overview of the feedstocks used is provided. Used cooking oil (495 million litres) represents the highest share of the used feedstocks: 30%. The category ‘unknown’ only represents 2%, implying that the feedstock is known for 98% of the fuels supplied. This seems to be a much higher level than in the Dutch report over 2011, although the absolute share of unknown biofuels could not be derived from the Dutch publications.
Although used cooking oil is the feedstock with the highest share, the majority of biofuels are produced from food crops: 60% (928 million litres). The used cooking oil and tallow can be categorised as biofuels from waste and residues and represent a share of 34% or 514 million litres. Another 5% (76 million litres) is unknown (3% other feedstocks, 2% unknown).
38 February 2013 4.786.1 - Biofuels on the Dutch market
Figure 16 Overview of used feedstocks sold onbroughgt the market as biofuel in the United Kingdom April 2010-April 2011 (in vol %)
4%
10%
6%
2%
15%
5%
8%4%
30%
10%
3% 2% Corn EC
Corn non EC
Oilseed rape
Palm
Soy
Sugarbeet
Sugar cane
Tallow
Used cooking oil
Wheat
Other
Unknown
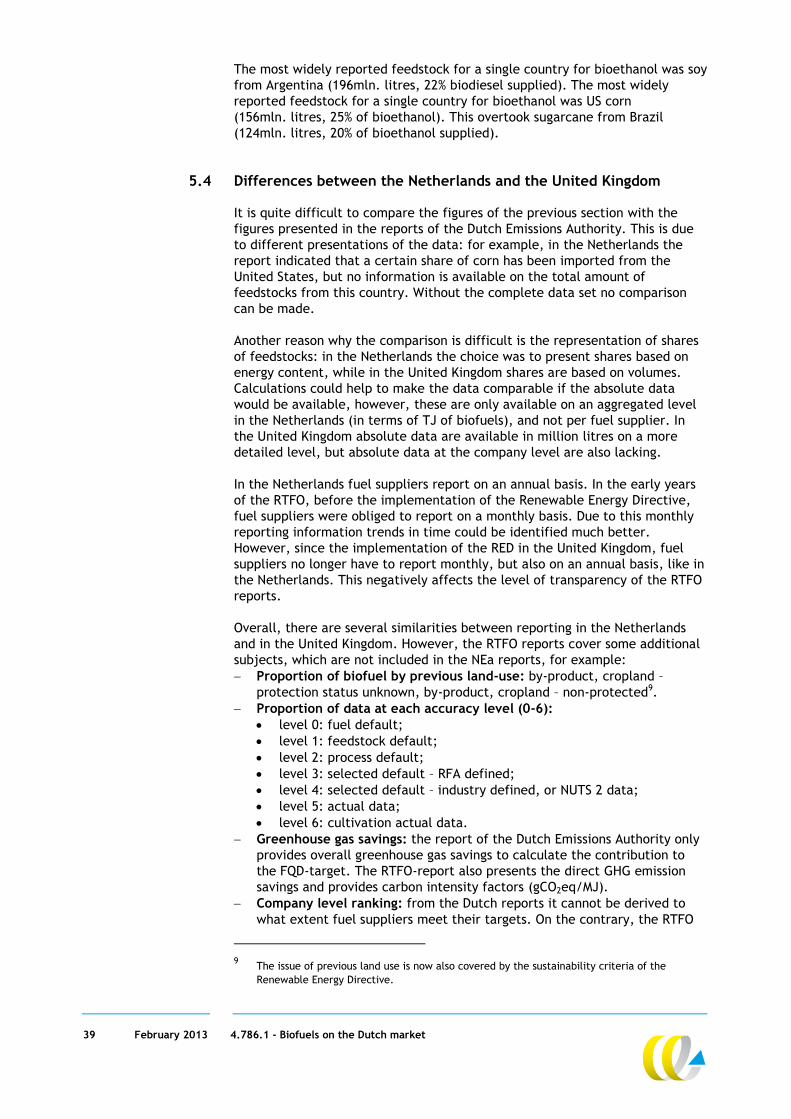
The majority of the feedstocks, 22%, originates from the United Kingdom itself, followed by 16% from the United States and 13% from Argentina. Based on Figure 17 it can be concluded that 54% (810 million liters) originates from a European Member State, while 39% (598 million liters) has been imported from outside the EU. 7% of the feedstocks originate from other countries and therefore have been classified as ‘other’.
Figure 17 Overview of origin of feedstocks sold on the market as biofuel in the United Kingdom in the period April 2010-April 2011 (in vol %)
13%2%
8%
6%
9%
1%1%
9%6%
22%
16%
4% 3%Argentina
Belgium
Brazil
France
Germany
Indonesia
Malaysia
Netherlands
Spain
UK
USA
Other
39 February 2013 4.786.1 - Biofuels on the Dutch market
The most widely reported feedstock for a single country for bioethanol was soy from Argentina (196mln. litres, 22% biodiesel supplied). The most widely reported feedstock for a single country for bioethanol was US corn (156mln. litres, 25% of bioethanol). This overtook sugarcane from Brazil (124mln. litres, 20% of bioethanol supplied).
5.4 Differences between the Netherlands and the United Kingdom
It is quite difficult to compare the figures of the previous section with the figures presented in the reports of the Dutch Emissions Authority. This is due to different presentations of the data: for example, in the Netherlands the report indicated that a certain share of corn has been imported from the United States, but no information is available on the total amount of feedstocks from this country. Without the complete data set no comparison can be made. Another reason why the comparison is difficult is the representation of shares of feedstocks: in the Netherlands the choice was to present shares based on energy content, while in the United Kingdom shares are based on volumes. Calculations could help to make the data comparable if the absolute data would be available, however, these are only available on an aggregated level in the Netherlands (in terms of TJ of biofuels), and not per fuel supplier. In the United Kingdom absolute data are available in million litres on a more detailed level, but absolute data at the company level are also lacking. In the Netherlands fuel suppliers report on an annual basis. In the early years of the RTFO, before the implementation of the Renewable Energy Directive, fuel suppliers were obliged to report on a monthly basis. Due to this monthly reporting information trends in time could be identified much better. However, since the implementation of the RED in the United Kingdom, fuel suppliers no longer have to report monthly, but also on an annual basis, like in the Netherlands. This negatively affects the level of transparency of the RTFO reports. Overall, there are several similarities between reporting in the Netherlands and in the United Kingdom. However, the RTFO reports cover some additional subjects, which are not included in the NEa reports, for example: Proportion of biofuel by previous land-use: by-product, cropland –
protection status unknown, by-product, cropland – non-protected9. Proportion of data at each accuracy level (0-6):
level 0: fuel default; level 1: feedstock default; level 2: process default; level 3: selected default – RFA defined; level 4: selected default – industry defined, or NUTS 2 data; level 5: actual data; level 6: cultivation actual data.
Greenhouse gas savings: the report of the Dutch Emissions Authority only provides overall greenhouse gas savings to calculate the contribution to the FQD-target. The RTFO-report also presents the direct GHG emission savings and provides carbon intensity factors (gCO2eq/MJ).
Company level ranking: from the Dutch reports it cannot be derived to what extent fuel suppliers meet their targets. On the contrary, the RTFO
9 The issue of previous land use is now also covered by the sustainability criteria of the
Renewable Energy Directive.
40 February 2013 4.786.1 - Biofuels on the Dutch market
contains different overviews of performance trends against the RTFO’s targets for the following targets and trends: greenhouse gas saving trend (general and at the company level;
min. 50%); qualifying environmental standard trend (general and at the company
level; min. 80%); data capture trend (general and at the company level; min. 90%); data provision by data category (standard, land use, country and
feedstock) at the company level. Traded RTFCs: the RTFO report also provided an overview of RTFCs trader
per quarter by type of account holder, while the Dutch Emissions Authority has not included any data on biotickets.
5.5 Conclusion
The information publicly available on the biofuels used to meet the RED obligations is more detailed in the United Kingdom than in the Netherlands. This allows more in-depth analysis of the differences between the fuel suppliers and how they meet their obligations. In Table 13 the main differences between the United Kingdom and the Netherlands are shown.
Table 13 Summary of differences between reporting in the Netherlands and in the United Kingdom
The Netherlands United Kingdom Quantities Relative shares at the company
level, general quantitative data based on energy content
General quantitative data based on volumes, relative shares at the company level
Type of feedstocks Relative share of feedstocks Division between bioethanol by feedstock, biodiesel by feedstock
Origin Relative share, no information on feedstock in combination with origin
Volumes by origin and feedstock
GHG savings Only total savings Percentage of GHG emission savings at the company level, emission factors
Accuracy level of data provided
Not available Available
Performance against the targets
Not available, only at the national level
Available per month
41 February 2013 4.786.1 - Biofuels on the Dutch market
6 Options to increase data transparency
6.1 Introduction
Now that the Dutch biofuels reporting obligation is in place, the question arises whether the data transparency is sufficient to: 1. Get a full picture of the origin and type of biofuel that the various fuel
suppliers sell on the market, enabling a comparison of environmental benefits achieved by the various suppliers.
2. Allow consumers (i.e. customers of the fuel suppliers) to make an informed choice regarding the fuels that they buy.
Note that the focus of this report is biofuels. As mentioned earlier, the environmental performance of the fossil fuels – still more than 95% of the road transport fuels sold in the Netherlands, and even more in the non-road modes – may also vary between fuel suppliers. This is currently not being monitored or reported, although this is expected to be required in the coming years, when the Fuel Quality Directive (FQD) is developed further and is implemented in EU and national policies. The information in this chapter regarding the fuel blending and distribution practice in the Netherlands is mainly based on interviews with the Netherlands Petroleum Industry Association (VNPI) and Argos.
6.2 Data gaps in 2011
2011 has been the first year of the biofuels reporting obligations of fuel blenders. Not all biofuels origins and types have been recorded yet as the sustainability criteria and reporting system were not in place at the start of the year. This resulted in an incomplete data overview of 2011, as shown earlier, in Figure 5. Smeets en Geelen could not even be included in this overview due to complete lack of data (although they are expected to have a very small or even insignificant market share). In addition, NEa only reported seven feedstocks that were used most, and one fuel blender, Allesco, had all feedstocks in the category ‘other’. We expect the first issue to be resolved in 2012, as the system has been fully operational now for some time, the second issue could be resolved by NEa quite easily as the data are available. There are two data gaps that are likely to remain also in the coming years: Information regarding biofuels volumes per fuel blender is lacking, as this
is considered to be confidential information due to concerns related to competitiveness of the companies.
Only fuel blenders have to report the details about the biofuels they sell, not the fuel suppliers that actually sell the fuels to the consumers.
The first data gap makes it impossible to determine, for example, the overall GHG reduction achieved per fuel supplier, the companies can now only be compared using relative data such as the gram CO2 reduction per MJ of the different biofuels.
42 February 2013 4.786.1 - Biofuels on the Dutch market
The effect of the second point is that the current reporting obligation does not allow to gain insight into what the actual filling stations of the various fuel suppliers have sold to consumers. As was shown in Section 1, there are much more companies that supply fuel to consumers than there are fuel blenders, and only the latter are included in the public NEa report. In 2011, there were 12 biofuels blenders in the Netherlands that are included in the NEa report, but a total of about 60 fuel suppliers are active which have to comply with the biofuels blending obligation and in total 70 companies have a reporting obligation with respect to the FQD10. These 60 fuel suppliers with a blending obligation sell the biofuels to consumers and/or buy biotickets to meet the blending obligation administratively. They purchase their fuel from the fuel blenders and sell them under their own brand name, but information regarding what they sell is confidential. Biofuels origin and types are not reported publically, and information on the actual share of biofuels in a certain fuel at a given filling station is not available.
6.2.1 Biofuels blending and fuel distribution in the Netherlands When looking at the logistics of transport fuel distribution, it can be seen that it will not be easy to make that type of detailed information available to consumers, especially at each individual filling station level. Transport fuels are typically distributed as illustrated in Figure 2 from the refineries via depots to the filling stations. The 70 fuel suppliers (in Dutch often depicted as ‘AGP houders’) typically receive their fuels from these depots, which are supplied and operated by one or more fuel blenders. The fuel in the depots may already contain a certain share of biofuels, for example FAME, HVO and/or bio-MTBE that can be blended at the refinery. Depots may also have the facilities to blend biofuels (or certain additives) during loading of the trucks that distribute the fuel to the filling station. This is typically the point where bioethanol is blended into the base petrol. Filling stations are then supplied from these depots. These may be filling stations of the same company that supplies the fuels to the depot, but it may also be other companies. For example, a depot is filled with fuel from Shell, which is then further distributed (by truck) to various filling stations in the region. These may be from many different brands, some of which may be operated by Shell but others could be from other fuel suppliers such as Esso, Gulf, etc. The actual biofuels content of the fuel in the depot may vary with every delivery of fuel. The fuel in the trucks may thus contain biofuels that were blended at the refinery, it may also have biofuels blended during loading of the truck at the depot. At this point of transfer of biofuels from one company to another, information is passed on about the biofuels volume (or rather energy content) that is being transferred, as well as other relevant information such including whether the biofuels are single or double counting. This information is used by the fuel supplier to submit proof that they fulfil their biofuels blending obligation.
10 These are the companies with ‘accijnsgoederenplaatsen’.
43 February 2013 4.786.1 - Biofuels on the Dutch market
6.3 Options to improve data transparency for consumers
Making data about actual biofuels origin, type and volume available to consumers could take place at fuel supplier level, for example quarterly or annually on an aggregated level, or real-time at the filling station. The first would seem easy, as data are already being transferred at the point of biofuels blending or trade. Data on biofuels origin and type would simply have to be added to the administrative monitoring and reporting system that is already in place in the various companies. However, the current biofuel system is administrative mainly (based on mass balance, as described in the RED) and not always in line with the physical delivery of biofuels, whereas consumers might expect the information to reflect the physical fuel that they buy. The second option would require much more intensive data transfer and regular update of the information at every filling station: every fuel delivery might change the biofuel content in the station’s tanks. A relevant question to be asked here is whether these efforts could lead to significant benefits. As explained above, the fuels delivered at filling stations may be quite similar in a given region, as filling stations of different brands may actually sell the same biofuel blends - especially further away from the refineries depots may supply quite a large range of fuel suppliers with the same base fuels. In that case, consumers may be given information about the biofuels content at different filling stations, but they will have only limited choice, as neighbouring filling stations are likely to offer very similar biofuel content. Furthermore, individual filling stations will have limited opportunity to choose the origin of the biofuels they sell, as changing to a different fuel supplier (and thus depot) may have significant financial implications. Providing quarterly or annual information about the fuel suppliers’ biofuels sales might be a more attractive route, as it would enable consumers to compare different fuel suppliers, and choose to fill their vehicles mainly in filling stations of those suppliers that they think sell the best biofuels - where consumers may of course decide for themselves what they think is ‘best’. This allows consumers to reward fuel suppliers that put effort into buying and selling biofuels with good environmental performance, as well as avoid those suppliers that do not. Using this system, they will not, however, get a guarantee that they fill up their vehicles with a specific type of biofuel, as they can only base their choice on aggregated sales data. If the reporting period is relatively long, for example, annual, the data may also be quite outdated. As the biofuels market is very dynamic, the biofuels mix may vary significantly over time (throughout the year and from one year to the other). The data over 2011 may thus not be representative for the situation in 2012.
44 February 2013 4.786.1 - Biofuels on the Dutch market
6.4 Conclusions
2011 has been the first year of the Dutch biofuels reporting obligation, and the publication of the resulting data in aggregated form, by NEa. The data in these reports are not yet complete, but do provide an insight in the Dutch biofuels market of 2011, and the differences between the various fuels blenders in the Netherlands. A number of data gaps were identified: 1. Some are due to the start-up phase of the process – these should be
resolved next year. 2. Some data gaps are due to the reporting format for the fuel suppliers
which only includes a limited number of feedstocks to choose from. This could be resolved in the future by expanding the number of potential feedstocks in the format or by replacing the ‘other’ category by an option to fill in a different type of feedstock.
3. A more fundamental data gap is the lack of information about the biofuels volumes that the various blenders have sold on the market, so that the contribution of the various blenders to the total is not known. Clearly, the choice of biofuels of the larger blenders will thus have a much larger environmental impact than that of the smaller blenders. NEa is currently not obliged to report these volumes or market shares, and fuel suppliers deem these data to be confidential. Not all Member States, like the United Kingdom and Denmark, agree that absolute volumes are confidential and provide more insight in the absolute volumes in their publically available reports. The absolute volumes are important, because these provide information about the absolute GHG emission savings of a fuel blender. The use of absolute volumes in calculations also provides insight in the market share of fuel blenders. In this study we have calculated the average GHG emission factors, but we could not differentiate between large and small fuel blenders. The biofuels mix of large blenders will, of course, have much more impact on overall GHG emissions of the Dutch biofuels than that of smaller blenders.
4. Another issue is that the data are not reported on the level of filling stations but rather on a level further upstream in the fuel distribution system, the fuel blenders that supply biofuels to the Dutch market. These fuel blenders distribute to the various filling stations and it might be that, for example, Shell distributes blends to filling stations of Total, and the other way around. Therefore, there is no clear link between these data and the actual type of biofuels that a consumer receives at a filling station of a certain brand. However, the results give good insight into the sustainability of the biofuels supplied to the Dutch market, and of the way the various fuel blenders have operated in 2011.
It seems (technically) feasible to provide actual information about the biofuel sold at a specific filling station, but that would require significant additional administrative effort in many cases, probably with limited benefits. Providing quarterly or annual aggregated data on a fuel supplier level would be a less complex option that would enhance data transparency to consumers, and would allow them to select the fuel supplier that, on average, sells the biofuels with better environmental performance.
45 February 2013 4.786.1 - Biofuels on the Dutch market
7 Conclusions and recommendations
7.1 Main conclusions and policy recommendations
There are large differences in the sustainability of the biofuels sold on the Dutch market, with fuels containing a high proportion of waste- and residue-derived fuel generally resulting in a better score. Because indirect land use change (ILUC) is not yet included in the Renewable Energy Directive, fuel suppliers can currently market biofuels that only achieve very limited GHG emission savings, or even increase overall GHG emissions. The level of data transparency could be greatly improved by the Dutch government by including absolute volumes and linkage of type of biofuels to feedstocks and country of origin in the annual report, and by assessing companies’ performance against the national target. A high level of transparency would provide an incentive for fuel suppliers to opt for biofuels from waste and residues instead of crop-based biofuels. Preferably, the level of transparency should be uniform across all EU countries in order to avoid a shift of crop-based biofuels to Member States with a low level of transparency. It should be noted that this study is limited to the environmental performance of biofuels. There is currently no reporting in place for fossil transport fuels, which still account for about 97% of total fuel sales.
7.2 The conclusions in greater detail
In fulfilling their annual obligation, the various fuel suppliers blending biofuels in the Netherlands all market a different mix of biofuels, with some companies clearly opting for more sustainable biofuels, in particular those produced from waste and residues. These choices lead to differences in environmental performance, allowing fuel suppliers to be ranked according to which biofuels they blend and supply to filling stations. The reasons behind the choices for certain types of biofuels have not been investigated in this study and could be subject of further research. One reason for the high share of biofuels from waste and residues might be the early implementation of the double-counting incentive in the Netherlands. Studies on indirect land use change have shown that cultivated biodiesel feedstocks such as rapeseed, palm and soy oil typically have very high well-to-wheel emissions when ILUC is included. The average GHG emission factor of the biofuels replacing biodiesel on the Dutch market is low, however, owing to the high share of biodiesel from waste and residues, like UCO. Although ethanol has a lower ILUC factor than biodiesel, the biofuels replacing petrol on the Dutch market are found to have higher average GHG emissions than biodiesel. This is due to the high share of crops used in producing ethanol and the high share of waste and residues used in producing biodiesel. The options for alternative feedstocks to replace crops by waste and residues for producing bioethanol are limited. Still, a GHG emission reduction of around 45% can be achieved, because the indirect emissions of these crop-based
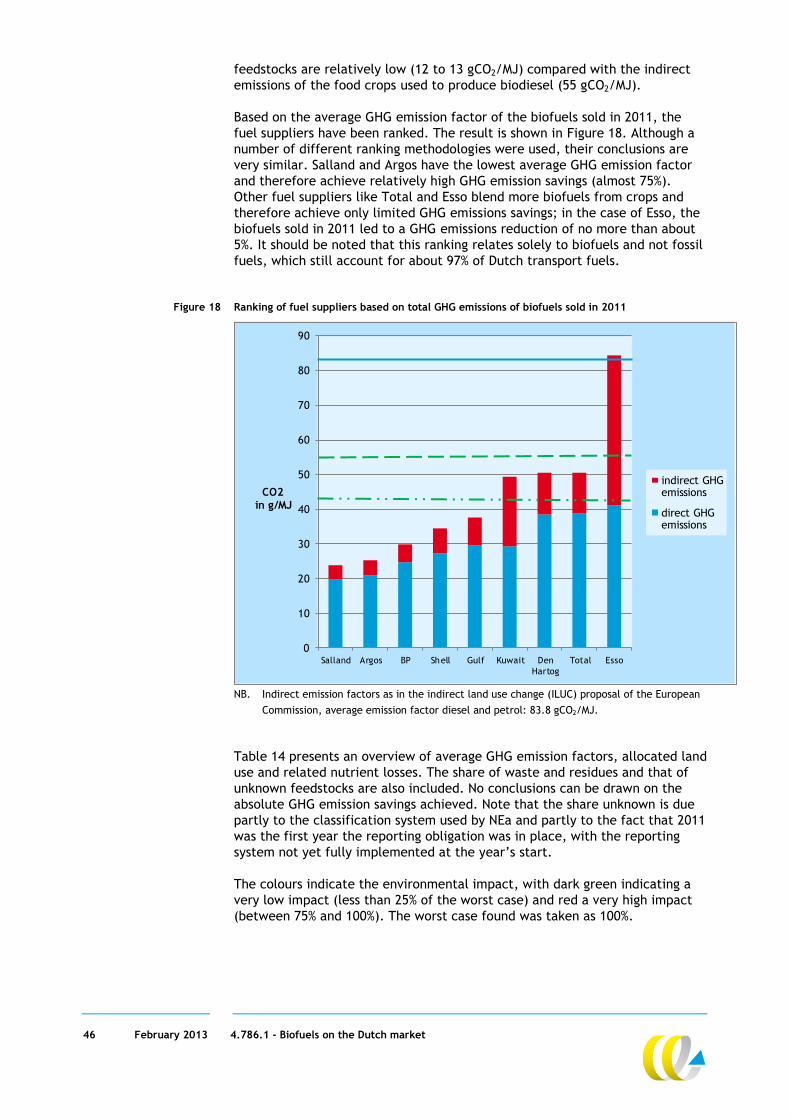
46 February 2013 4.786.1 - Biofuels on the Dutch market
feedstocks are relatively low (12 to 13 gCO2/MJ) compared with the indirect emissions of the food crops used to produce biodiesel (55 gCO2/MJ). Based on the average GHG emission factor of the biofuels sold in 2011, the fuel suppliers have been ranked. The result is shown in Figure 18. Although a number of different ranking methodologies were used, their conclusions are very similar. Salland and Argos have the lowest average GHG emission factor and therefore achieve relatively high GHG emission savings (almost 75%). Other fuel suppliers like Total and Esso blend more biofuels from crops and therefore achieve only limited GHG emissions savings; in the case of Esso, the biofuels sold in 2011 led to a GHG emissions reduction of no more than about 5%. It should be noted that this ranking relates solely to biofuels and not fossil fuels, which still account for about 97% of Dutch transport fuels.
Figure 18 Ranking of fuel suppliers based on total GHG emissions of biofuels sold in 2011
0
10
20
30
40
50
60
70
80
90
Salland Argos BP Shell Gulf Kuwait DenHartog
Total Esso
CO2in g/MJ
indirect GHGemissions
direct GHGemissions
NB. Indirect emission factors as in the indirect land use change (ILUC) proposal of the European Commission, average emission factor diesel and petrol: 83.8 gCO2/MJ. Table 14 presents an overview of average GHG emission factors, allocated land use and related nutrient losses. The share of waste and residues and that of unknown feedstocks are also included. No conclusions can be drawn on the absolute GHG emission savings achieved. Note that the share unknown is due partly to the classification system used by NEa and partly to the fact that 2011 was the first year the reporting obligation was in place, with the reporting system not yet fully implemented at the year’s start. The colours indicate the environmental impact, with dark green indicating a very low impact (less than 25% of the worst case) and red a very high impact (between 75% and 100%). The worst case found was taken as 100%.
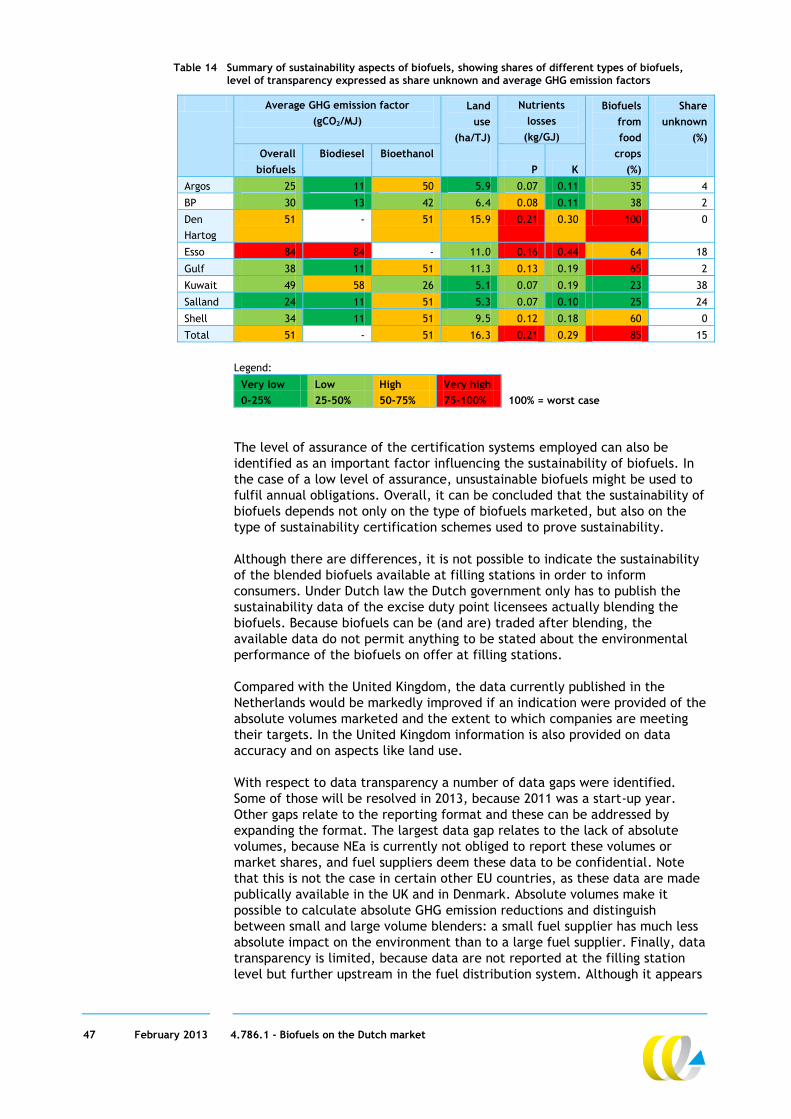
47 February 2013 4.786.1 - Biofuels on the Dutch market
Table 14 Summary of sustainability aspects of biofuels, showing shares of different types of biofuels, level of transparency expressed as share unknown and average GHG emission factors
Average GHG emission factor (gCO2/MJ)
Land use
(ha/TJ)
Nutrients losses
(kg/GJ)
Biofuels from food
crops (%)
Share unknown
(%)
Overall
biofuels Biodiesel Bioethanol
P K Argos 25 11 50 5.9 0.07 0.11 35 4
BP 30 13 42 6.4 0.08 0.11 38 2
Den Hartog
51 - 51 15.9 0.21 0.30 100 0
Esso 84 84 - 11.0 0.16 0.44 64 18
Gulf 38 11 51 11.3 0.13 0.19 65 2
Kuwait 49 58 26 5.1 0.07 0.19 23 38
Salland 24 11 51 5.3 0.07 0.10 25 24
Shell 34 11 51 9.5 0.12 0.18 60 0
Total 51 - 51 16.3 0.21 0.29 85 15
Legend:
Very low Low High Very high 0-25% 25-50% 50-75% 75-100% 100% = worst case
The level of assurance of the certification systems employed can also be identified as an important factor influencing the sustainability of biofuels. In the case of a low level of assurance, unsustainable biofuels might be used to fulfil annual obligations. Overall, it can be concluded that the sustainability of biofuels depends not only on the type of biofuels marketed, but also on the type of sustainability certification schemes used to prove sustainability. Although there are differences, it is not possible to indicate the sustainability of the blended biofuels available at filling stations in order to inform consumers. Under Dutch law the Dutch government only has to publish the sustainability data of the excise duty point licensees actually blending the biofuels. Because biofuels can be (and are) traded after blending, the available data do not permit anything to be stated about the environmental performance of the biofuels on offer at filling stations. Compared with the United Kingdom, the data currently published in the Netherlands would be markedly improved if an indication were provided of the absolute volumes marketed and the extent to which companies are meeting their targets. In the United Kingdom information is also provided on data accuracy and on aspects like land use. With respect to data transparency a number of data gaps were identified. Some of those will be resolved in 2013, because 2011 was a start-up year. Other gaps relate to the reporting format and these can be addressed by expanding the format. The largest data gap relates to the lack of absolute volumes, because NEa is currently not obliged to report these volumes or market shares, and fuel suppliers deem these data to be confidential. Note that this is not the case in certain other EU countries, as these data are made publically available in the UK and in Denmark. Absolute volumes make it possible to calculate absolute GHG emission reductions and distinguish between small and large volume blenders: a small fuel supplier has much less absolute impact on the environment than to a large fuel supplier. Finally, data transparency is limited, because data are not reported at the filling station level but further upstream in the fuel distribution system. Although it appears
48 February 2013 4.786.1 - Biofuels on the Dutch market
(technically) feasible to provide up-to-date information on the biofuels sold at specific filling stations, providing quarterly or annual aggregated data at the fuel supplier level seems to be the best workable alternative that would allow consumers to select the fuel supplier that, on average, sells the biofuels they prefer.
49 February 2013 4.786.1 - Biofuels on the Dutch market
References
Agentschap NL, 2011 EU biofuels policy 18 May of 2011 Accessed via: http://www.agentschapnl.nl/node/113095 Last retrieved: 16 July 2012 CDB, 2012 Biomassa en beleid: hoe sturen op minder CO2? Utrecht/Den Haag : Commissie Duurzaamheidsvraagstukken Biomassa (Commissie Corbey, CDB), 21 mei 2012 CE Delft, 2012a H.J. (Harry) Croezen, B.E. (Bettina) Kampman, G.C. (Geert) Bergsma Biobrandstoffen benchmarken Delft : CE Delft, 2012 CE Delft, 2012b Bettina Kampman, Anouk van Grinsven, Harry Croezen Sustainable alternatives for land-based biofuels in the European Union Assessment of options and development of a policy strategy Delft ; CE Delft, 2012 DfT, 2012 Renewable Transport Fuels Obligation London : Department for Transport (DfT), 5 November 2012 Accessed via: https://www.gov.uk/renewable-transport-fuels-obligation Last retrieved: 26 November 2012 EC, 2003 Directive 2009/28/EC of 23 April 2009 on the promotion of the use of energy from renewable sources and amending and subsequently repealing Directives 2001/77/EC and 2003/30/EC Brussels : European Commission (EC), 2003 EC, 2009a Directive of the European Parliament and of the Council on the promotion of the use of energy from renewable sources amending and subsequently repealing Directives 2001/77/EC and 2003/30/EC Brussels : European Commission (EC), 2009 EC, 2009b Directive 2009/30/EC of the European Parliament and of the Council of 23 April 2009 amending Directive 98/70/EC as regards the specification of petrol, diesel and gas-oil and introducing a mechanism to monitor and reduce greenhouse gas emissions and amending Council Directive 1999/32/EC as regards the specification of fuel used by inland waterway vessels and repealing Directive 93/12/EEC Brussels : European Commission (EC), 2009
50 February 2013 4.786.1 - Biofuels on the Dutch market
EC, 2012a Proposal for a Directive of the European Parliament and of the Council Amending Directive 98/70/EC relating to the quality of petrol and diesel fuels and amending Directive 2009/28/EC on the promotion of the use of energy from renewable sources, (COM(2012) 595 final Brussels : European Commission (EC), 17 October 2012 EC, 2012b Biofuels - Sustainability schemes Accessed via: http://ec.europa.eu/energy/renewables/biofuels/sustainability _schemes_en.htm Last retrieved: 16 July 2012 Ecofys, 2012 Daan Peters, Arno van den Bos, Jasper van de Staaij Assessing grandfathering options under an EU ILUC policy Utrecht : Ecofys, 2012 IFPRI, 2011 David Laborde Assessing the Land Use Change Consequences of European Biofuel Policies Washington DC : International Food Policy Institute (IFPRI), 2011
ISEAL, 2011 Code of Good Practice for Assuring Compliance with Social and Environmental Standards, Public Draft for Consultation, Version 0.1 – 31, October 2011 Accessed via: http://www.isealalliance.org/sites/default/files/Assurance%20 Code_v01_Oct312011.pdf Ministry of Infrastructure and Environment, 2013 Percentages conventionele biobrandstoffen’ of 14 January 2013, IenM/BSK-2013/3302; Letter to the Dutch parliament Den Haag : Ministry of Infrastructure and Environment, 2013 Accessed via: http://www.rijksoverheid.nl/ministeries/ienm/documenten-en-publicaties/kamerstukken/2013/01/14/percentages-conventionele-biobrandstoffen.html NEa, 2012a Naleving jaarverplichting 2011 hernieuwbare energie vervoer en verplichting brandstoffen luchtverontreiniging Den Haag : Nederlandse Emissieautoriteit (NEa), 2012 NEa, 2012b Aard, herkomst en duurzaamheidsaspecten van biobrandstoffen bestemd voor vervoer – Rapportage 2011 Den Haag : Nederlandse Emissieautoriteit (NEa), 2012 NEa, 2012c Nederlandse acceptatie duurzaamheidssystemen Nederlandse Emissieautoriteit (NEa),12 October 2012 Accessed via: https://www.emissieautoriteit.nl/mediatheek/biobrandstoffen/ publicaties/20121018_Geaccepteerde%20systemen%20NL.pdf
51 February 2013 4.786.1 - Biofuels on the Dutch market
NEa, 2012e Dutch assessment protocol for voluntary sustainability systems for biofuels Nederlandse Emissieautoriteit (NEa), January 2012 Accessed via: https://www.emissieautoriteit.nl/mediatheek/biobrandstoffen/ publicaties/Dutch%20assessmentprotocol%20publicversion%201.1.pdf NL Agency, 2011 Peter Vissers, Ander Paz, Emiel Hanekamp How to select a biomass certification scheme Utrecht : Agentschap NL (NL Agency), 2011 NL Agency, 2012 Jinke van Dam, Sergio Ugarte, Sjors van Iersel Selecting a biomass certification system – a benchmark on level of assurance, costs and benefits Utrecht : Agentschap NL (NL Agency), 2012 Profundo, 2012 Jan Willem van Gelder, Ilse Zeemeijer, Joeri de Wilde Voedsel in de tank? Een onderzoeksrapport voor Oxfam Novib Amsterdam : Profundo, 2012

52 February 2013 4.786.1 - Biofuels on the Dutch market
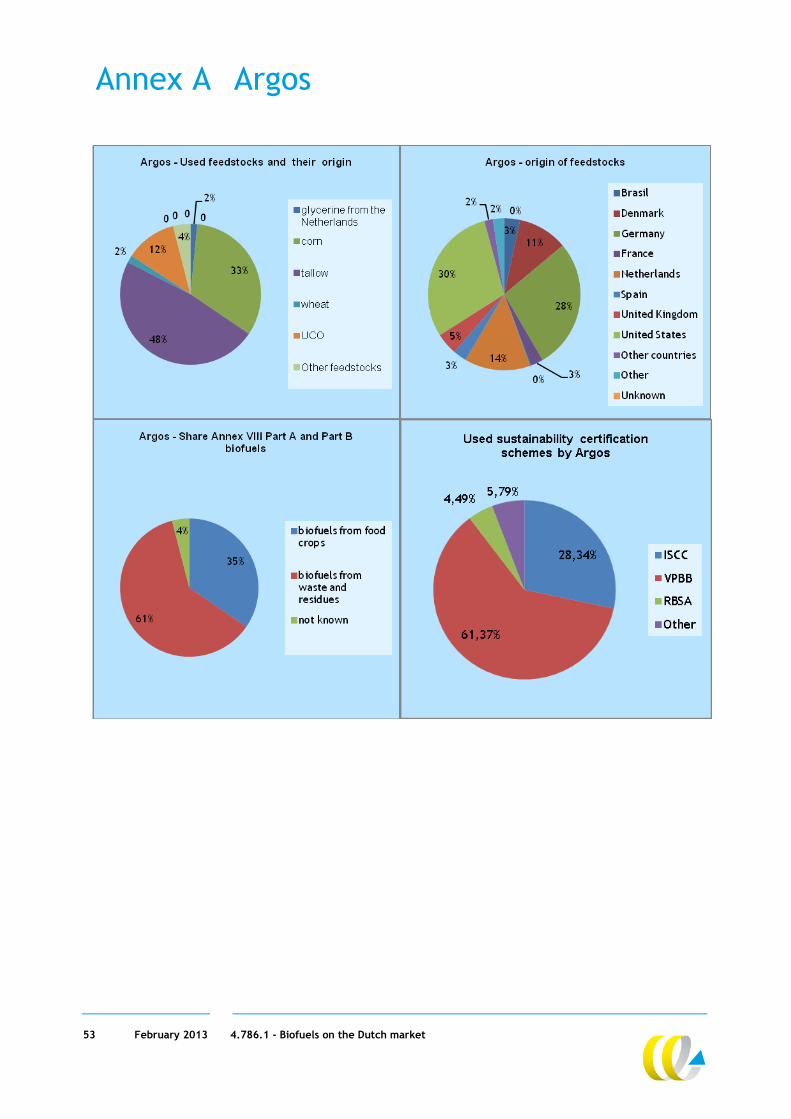
53 February 2013 4.786.1 - Biofuels on the Dutch market
Annex A Argos

54 February 2013 4.786.1 - Biofuels on the Dutch market
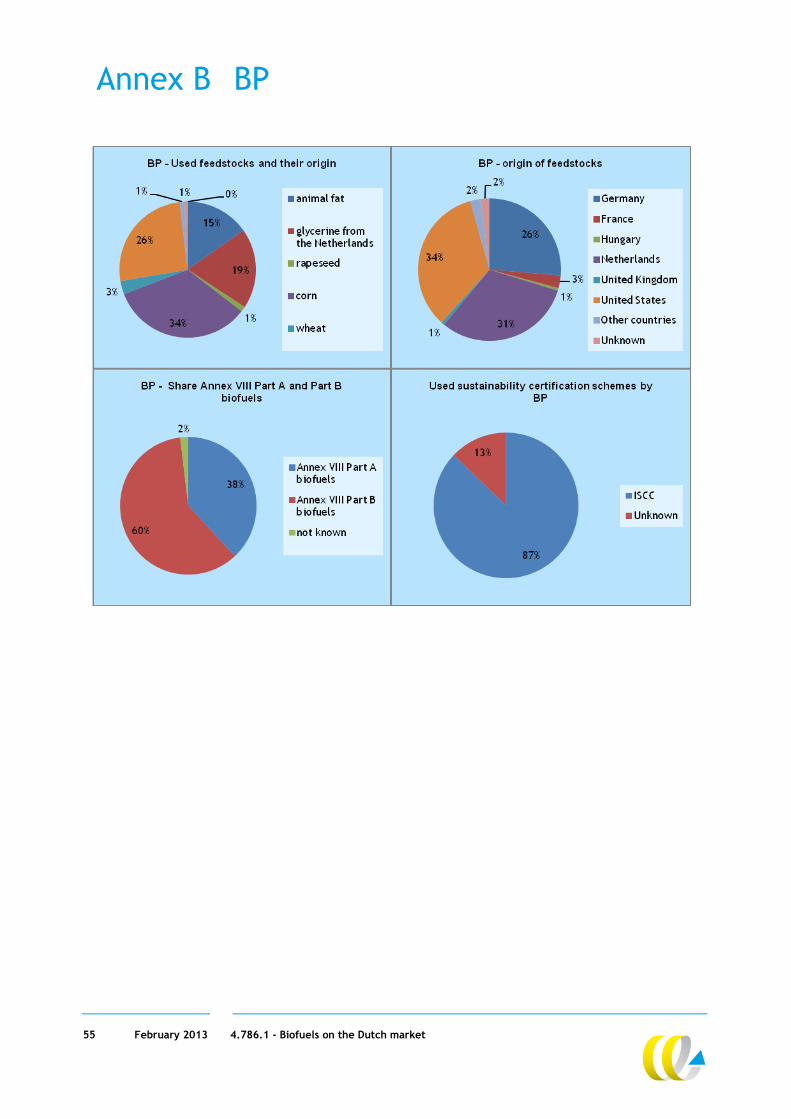
55 February 2013 4.786.1 - Biofuels on the Dutch market
Annex B BP

56 February 2013 4.786.1 - Biofuels on the Dutch market
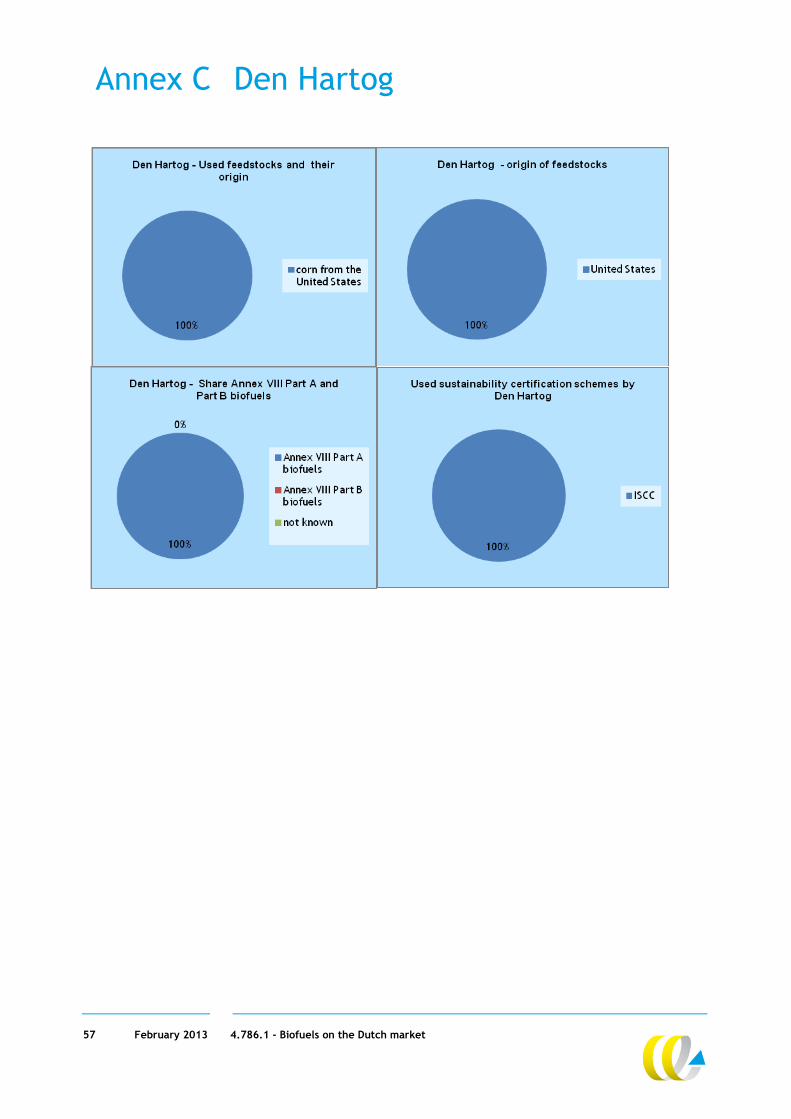
57 February 2013 4.786.1 - Biofuels on the Dutch market
Annex C Den Hartog

58 February 2013 4.786.1 - Biofuels on the Dutch market
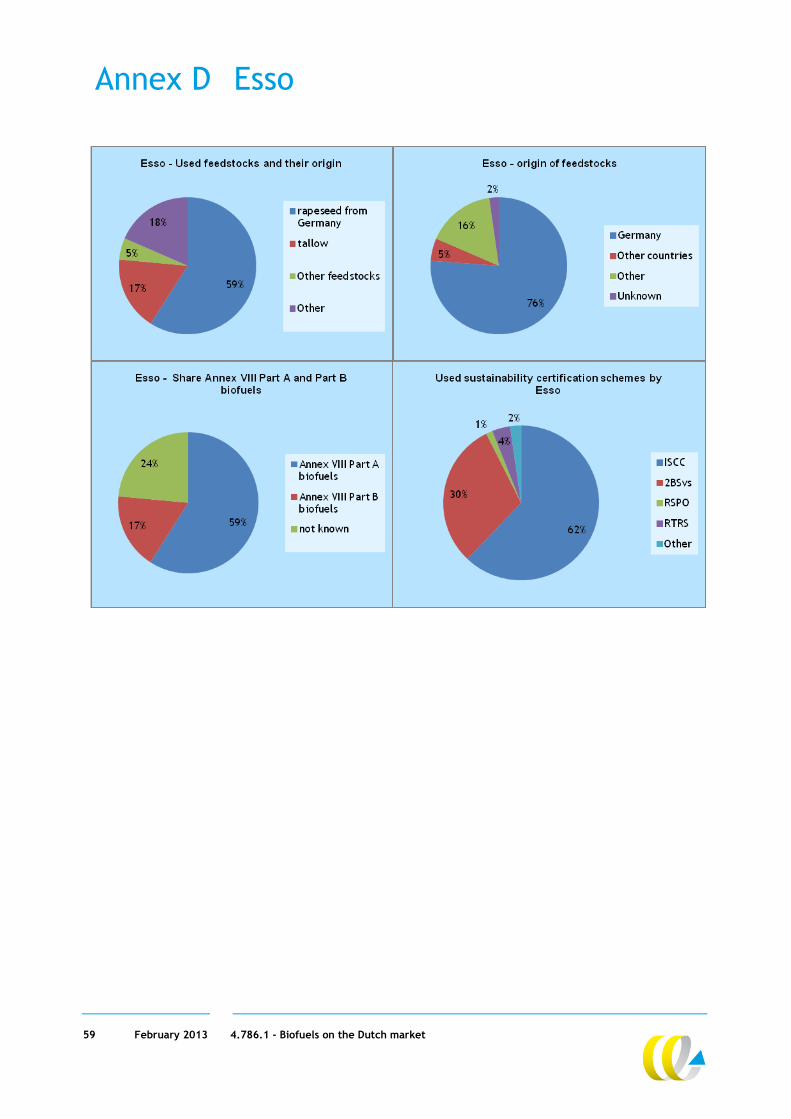
59 February 2013 4.786.1 - Biofuels on the Dutch market
Annex D Esso

60 February 2013 4.786.1 - Biofuels on the Dutch market
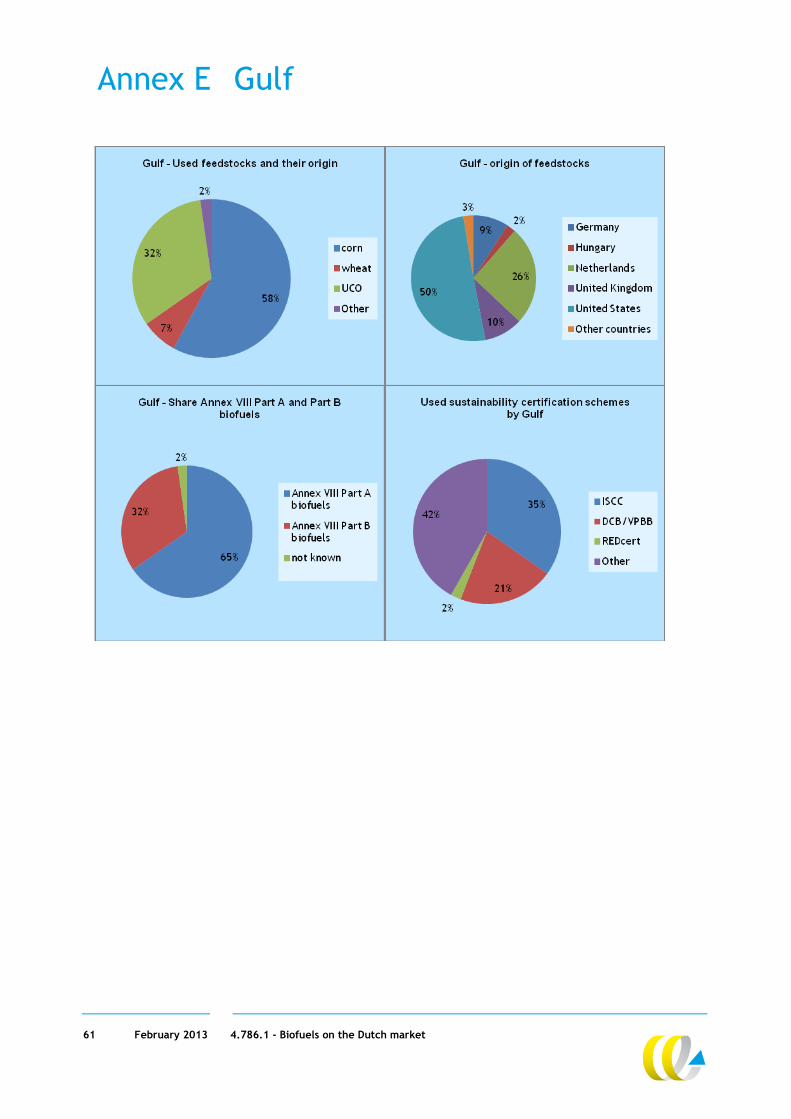
61 February 2013 4.786.1 - Biofuels on the Dutch market
Annex E Gulf

62 February 2013 4.786.1 - Biofuels on the Dutch market
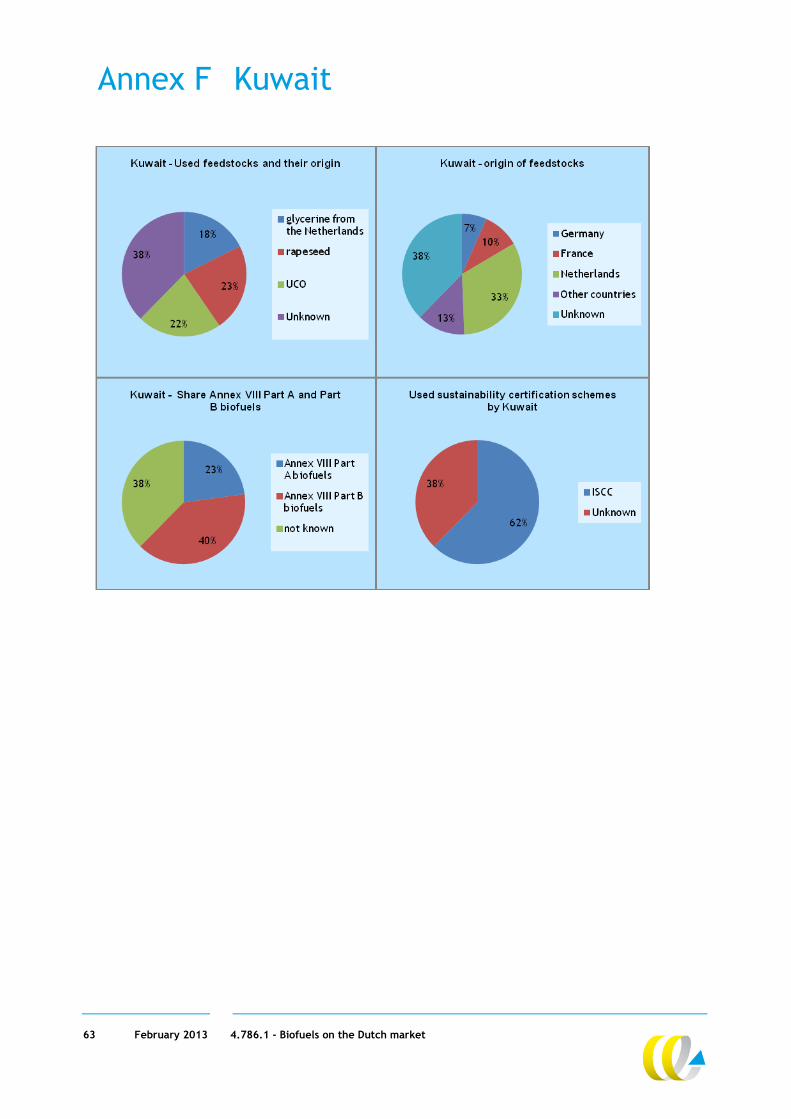
63 February 2013 4.786.1 - Biofuels on the Dutch market
Annex F Kuwait

64 February 2013 4.786.1 - Biofuels on the Dutch market
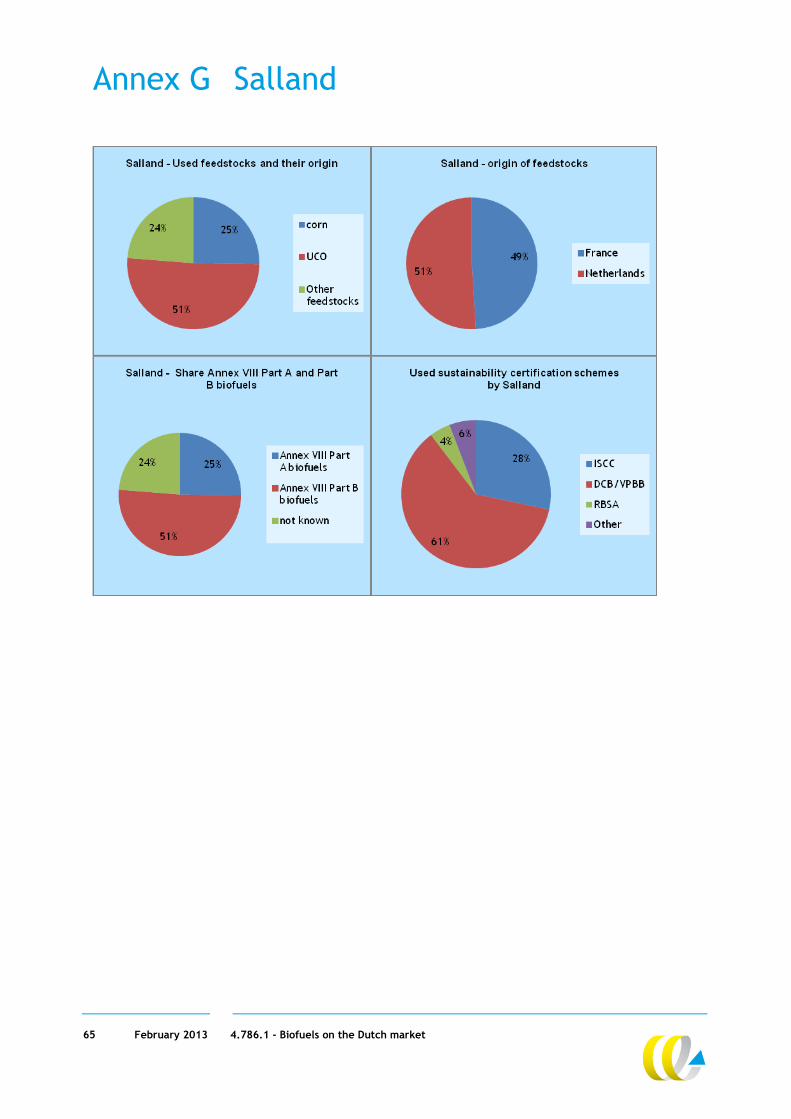
65 February 2013 4.786.1 - Biofuels on the Dutch market
Annex G Salland

66 February 2013 4.786.1 - Biofuels on the Dutch market
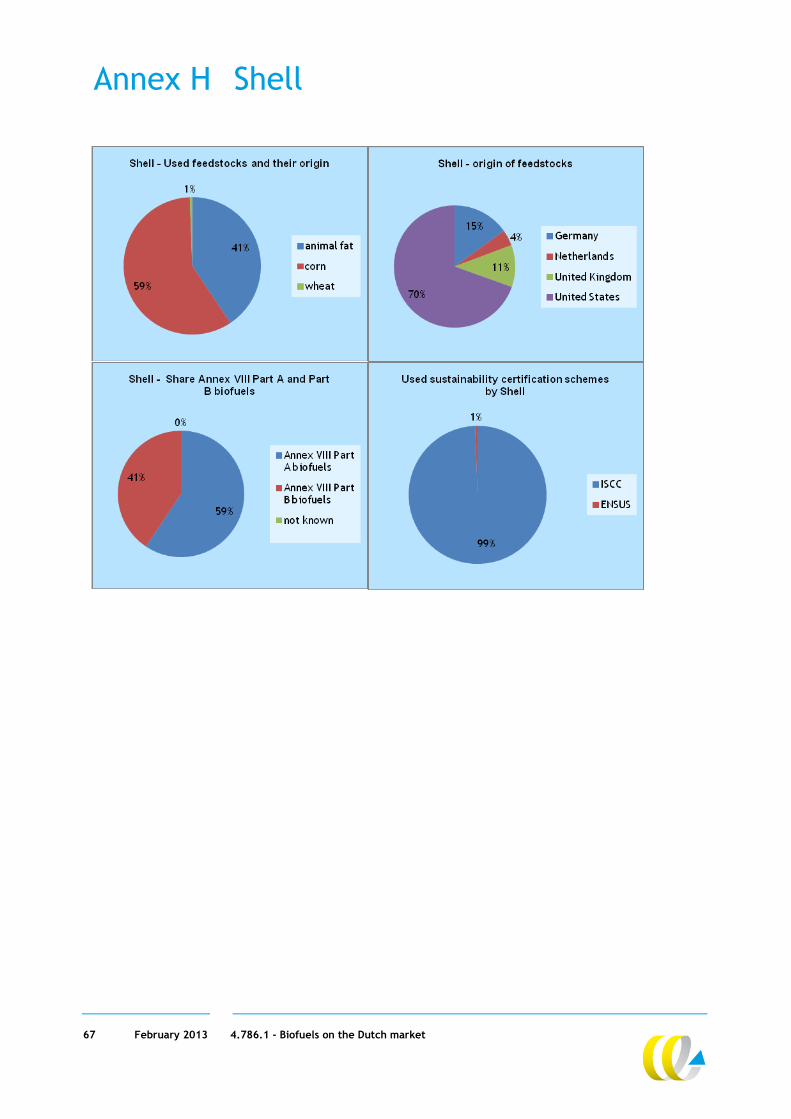
67 February 2013 4.786.1 - Biofuels on the Dutch market
Annex H Shell

68 February 2013 4.786.1 - Biofuels on the Dutch market
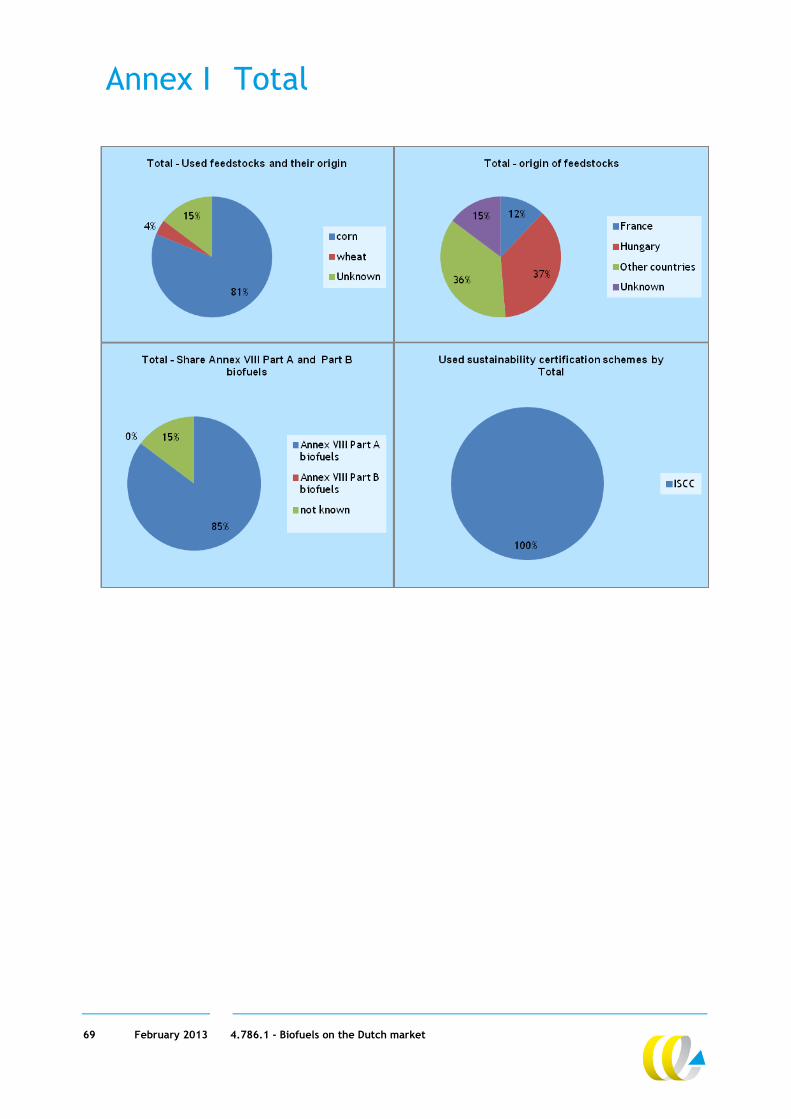
69 February 2013 4.786.1 - Biofuels on the Dutch market
Annex I Total

70 February 2013 4.786.1 - Biofuels on the Dutch market
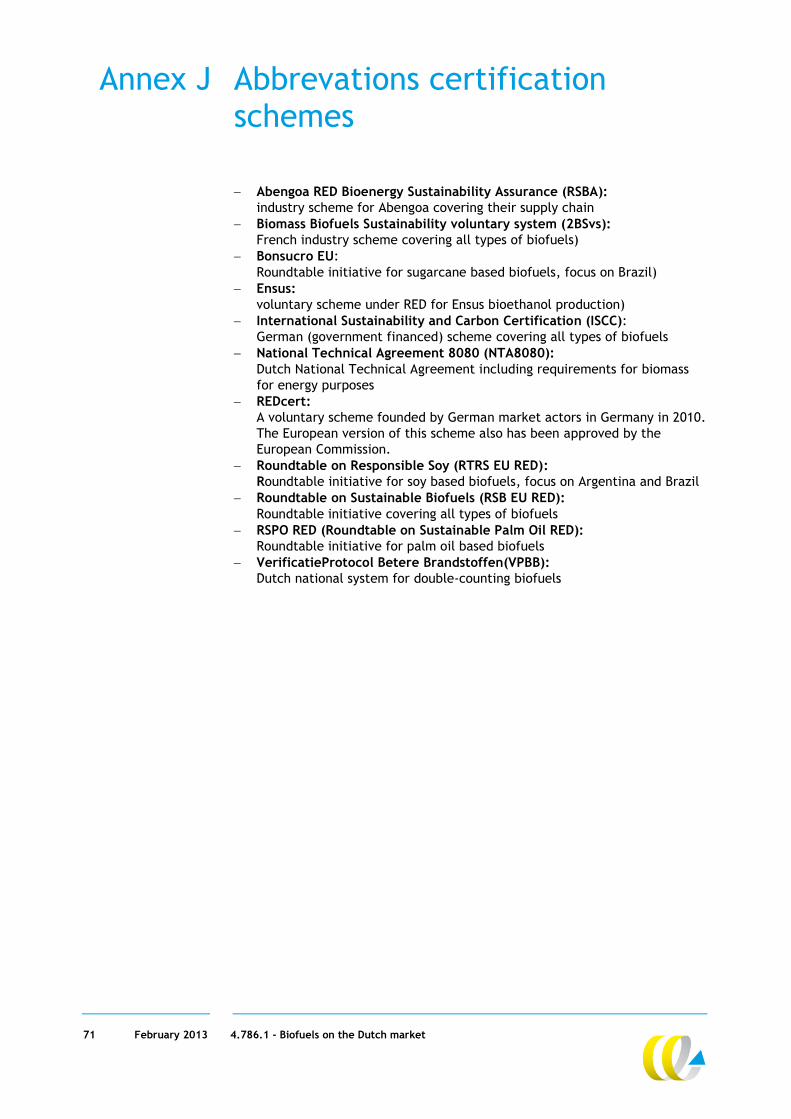
71 February 2013 4.786.1 - Biofuels on the Dutch market
Annex J Abbrevations certification schemes
Abengoa RED Bioenergy Sustainability Assurance (RSBA):
industry scheme for Abengoa covering their supply chain Biomass Biofuels Sustainability voluntary system (2BSvs):
French industry scheme covering all types of biofuels) Bonsucro EU:
Roundtable initiative for sugarcane based biofuels, focus on Brazil) Ensus:
voluntary scheme under RED for Ensus bioethanol production) International Sustainability and Carbon Certification (ISCC):
German (government financed) scheme covering all types of biofuels National Technical Agreement 8080 (NTA8080):
Dutch National Technical Agreement including requirements for biomass for energy purposes
REDcert: A voluntary scheme founded by German market actors in Germany in 2010. The European version of this scheme also has been approved by the European Commission.
Roundtable on Responsible Soy (RTRS EU RED): Roundtable initiative for soy based biofuels, focus on Argentina and Brazil
Roundtable on Sustainable Biofuels (RSB EU RED): Roundtable initiative covering all types of biofuels
RSPO RED (Roundtable on Sustainable Palm Oil RED): Roundtable initiative for palm oil based biofuels
VerificatieProtocol Betere Brandstoffen(VPBB): Dutch national system for double-counting biofuels