Embed Size (px)
Citation preview
Biogeochemical Consequences of Land Use Transitions Along Brazil’s
Agricultural Frontier
Gillian Galford*1,2, John Mustard1, Jerry Melillo2, Carlos C. Cerri3, C.E.P. Cerri3, David Kicklighter2, Benjamin Felzer2
*[email protected] 1) Geological Sciences, Brown University, Providence, RI 2) The Ecosystems Center, MBL, Woods Hole, MA 3) Centro de Agricultura na Energia, Universidade de São Paulo, Piracicaba, SP, Brazil NASA Land Cover Land Use Change Science Meeting, April 4-6, 2007
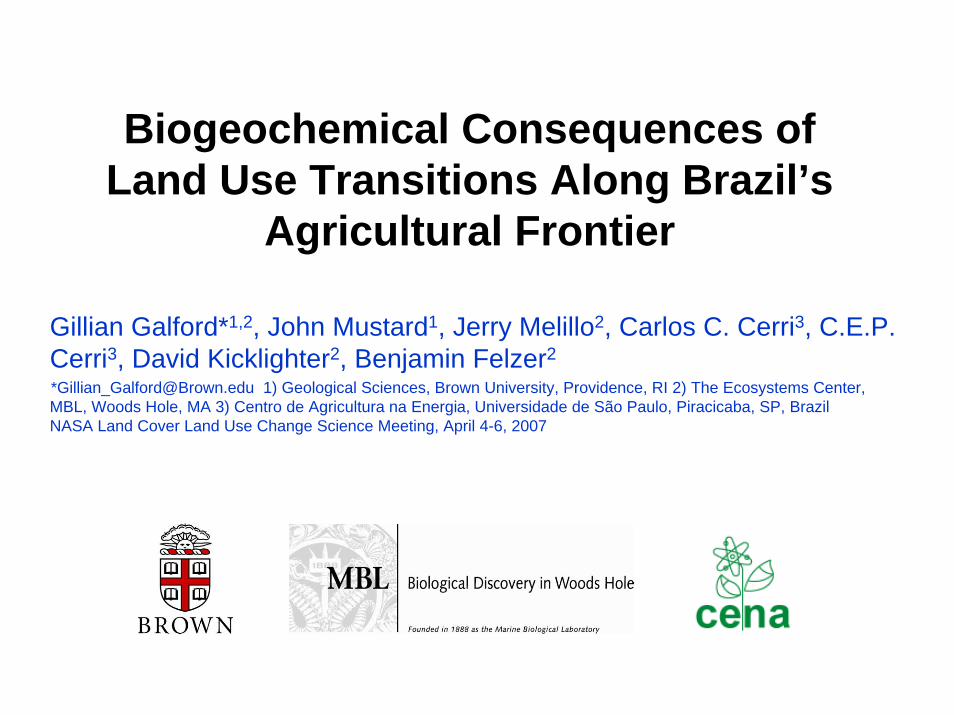
II. Study Area & BackgroundII.A. Land Cover and Land Use ChangeMato Grosso state (Figure 1) is home of some of the largest contiguous row-crop plantations in the world. The pace and scale of conversion is impressive: - From 1990 to 2000, soybean cover doubled while production has nearly quadrupled due to farm mechanization in the southwestern Amazon [1]. - In Mato Grosso the area planted in soybean has increased on average 19.4% annually since 1999 [1].
- By 2004 over 5 million hectares, or about 6% of Mato Grosso, was soybean plantations [1].
Figure 1: The states of Rondônia and Mato Grosso, frontiers of agricultural development (row crops) in the southwestern Brazilian Amazon.
II. Study Area & Background
Forest
Row- Crop
Pasture
Cerrado
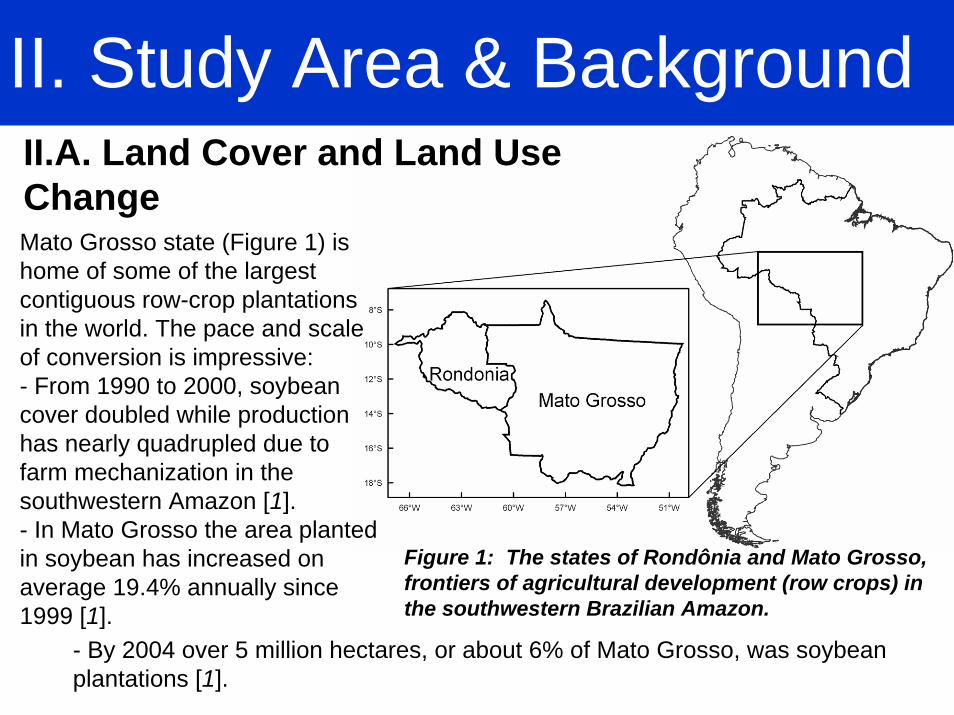
II. B. Land-use trajectoriesIn Mato Grosso, there are three major natural vegetation types: forests, cerradão (woody savanna) and cerrado (open savanna). Land-use transitions (Figure 2) from forest involve a two-step pathway: forest to pasture, and then pasture to row crops. There are two pathways to row crops in cerradão and cerrado (Figure 2): natural vegetation to pasture to row crops; and natural vegetation directly to row crops. Row crops are subject to a variety of management regimes -types and sequences of crops; types, timing and amounts of fertilizer and other chemicals; and tillage versus no-tillage.
Figure 2: The major pathways of row-crop land use in the study area. Primary pathways are in bold. The pathways of emphasis forthis study are shown in red.
III. Methods
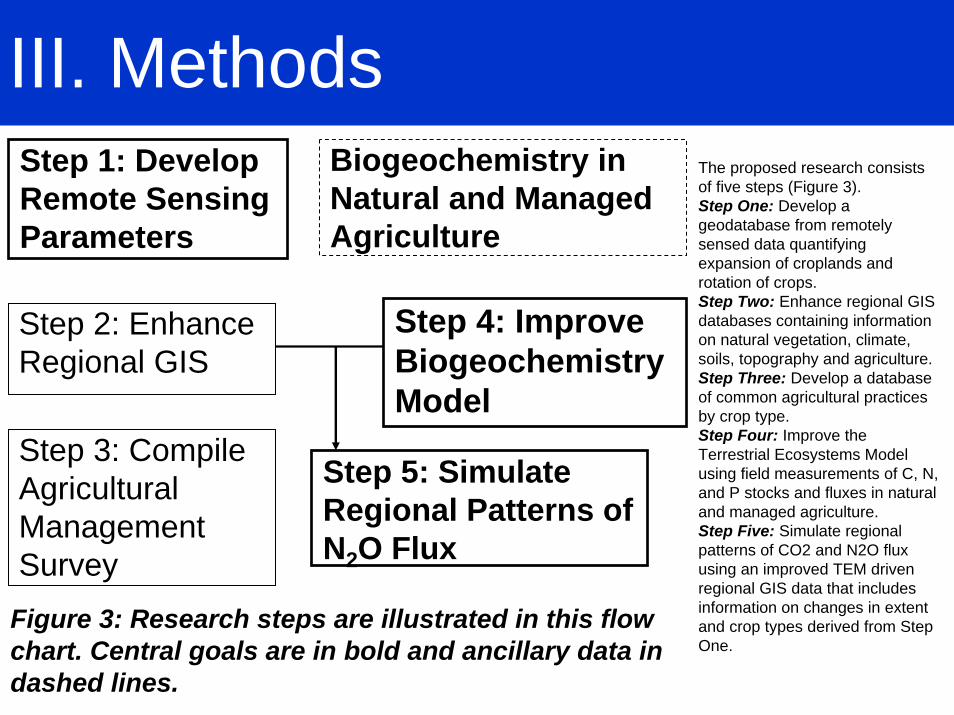
Figure 3: Research steps are illustrated in this flow chart. Central goals are in bold and ancillary data in dashed lines.
Step 4: Improve Biogeochemistry Model
Step 5: Simulate Regional Patterns of N2O Flux
Biogeochemistry in Natural and Managed Agriculture
Step 3: Compile Agricultural Management Survey
Step 1: Develop Remote Sensing Parameters
Step 2: Enhance Regional GIS
The proposed research consists of five steps (Figure 3).Step One: Develop a geodatabase from remotely sensed data quantifying expansion of croplands and rotation of crops. Step Two: Enhance regional GIS databases containing information on natural vegetation, climate, soils, topography and agriculture.Step Three: Develop a database of common agricultural practices by crop type. Step Four: Improve the Terrestrial Ecosystems Model using field measurements of C, N, and P stocks and fluxes in natural and managed agriculture. Step Five: Simulate regional patterns of CO2 and N2O flux using an improved TEM driven regional GIS data that includes information on changes in extent and crop types derived from Step One.
IV. Land Cover & Land UseIV. A. Remote sensing inputsThree inputs to the ecosystems model are derived from remotely sensed data:
(1) Land-cover classifications for forest, pasture and row-crop agriculture(2) Sub-classifications within row-crop agriculture (soy, corn, millet, rice and other)(3) phenological data.
These goals are achieved through modeling phenology in green vegetation (GV) time series. We use the 500m MODIS 8-day surface reflectance product (MOD09--7 spectral bands between 0.4-2.4 µm), atmospherically corrected and filtered for cloud cover to calculate the Enhanced Vegetation Index (EVI) for the GV time series.
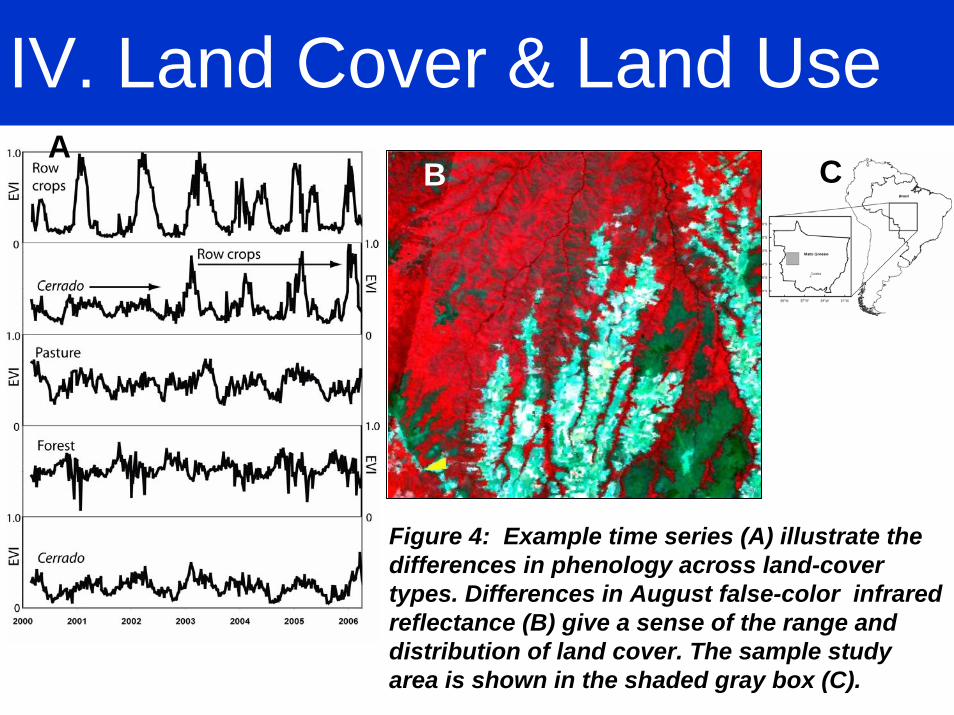
IV. B. Land-cover and land-use classificationsLand-cover classifications for forest, pasture and row-crop agriculture are derived through GV phenology modeling and decision tree classification. Enhanced Vegetation Index (EVI) phenologies of several land cover types are shown in Figure 4. With GV phenology we can parameterize the magnitude of green vegetation activity and annual timing of transitions between green-up and senescence which helps identify land cover types.
IV. Land Cover & Land UseA
B C
Figure 4: Example time series (A) illustrate the differences in phenology across land-cover types. Differences in August false-color infrared reflectance (B) give a sense of the range and distribution of land cover. The sample study area is shown in the shaded gray box (C).
IV. Land Cover & Land UseB
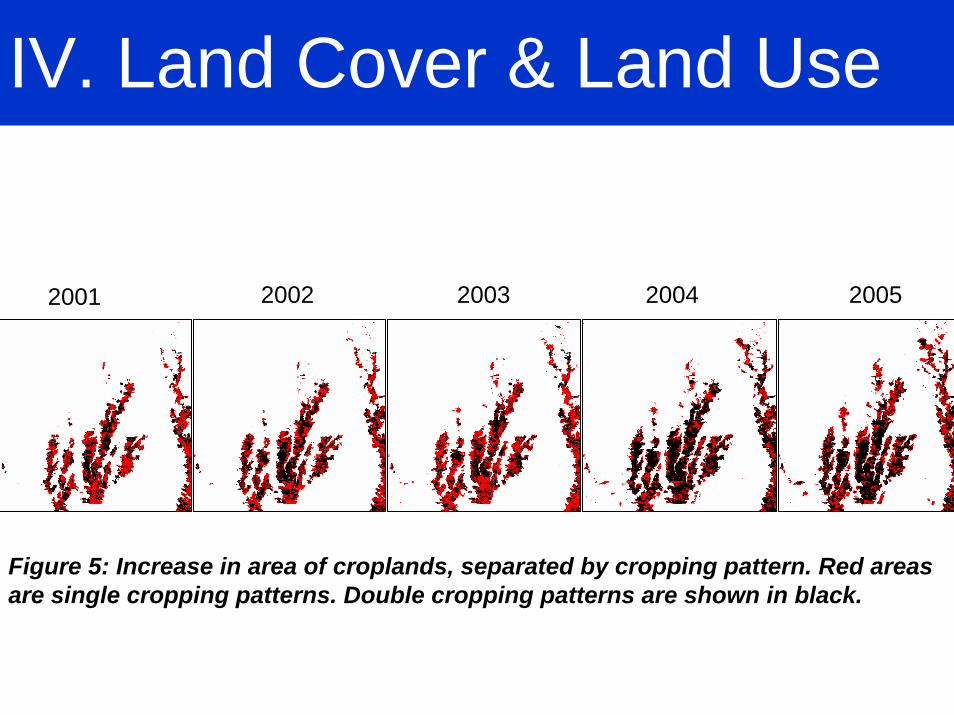
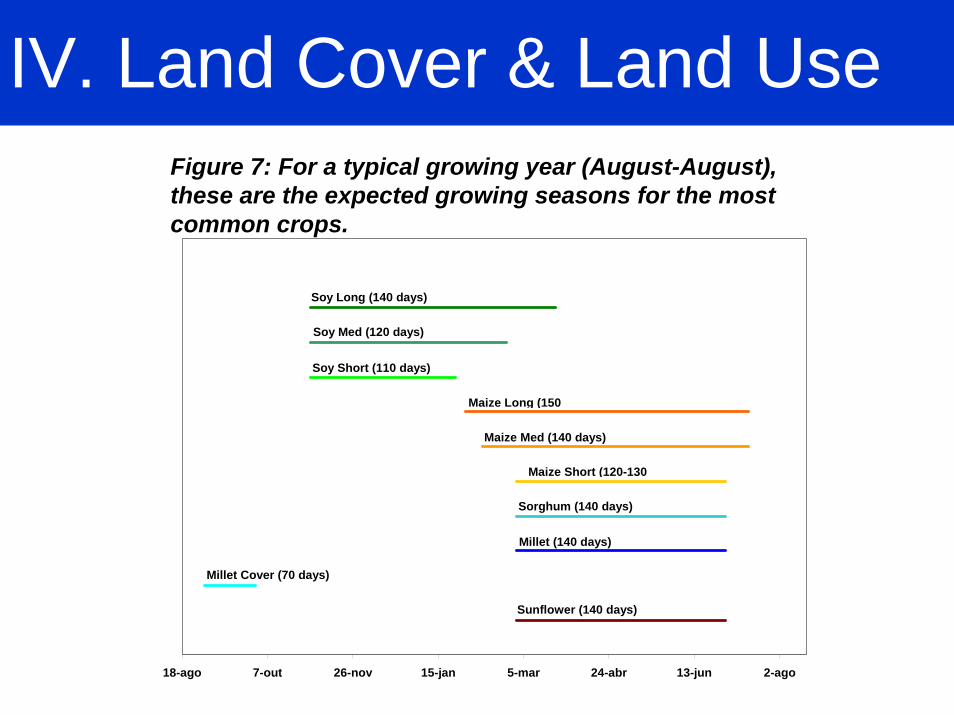
IV. C. Sub-classifications within row-crop agricultureWe use a wavelet-smoothed EVI time series to distinguish cropland subtypes, beginning with single and double cropping patterns (Figure 5). Expansion of croplands converted 3, 821 km2 in our study site from 2000-2005 (Figure 6). We see an intensification of agriculture as well, as lands are converted first to single cropping and, later, to double cropping systems. From the smoothed time series, it appears there is sufficient information on the timing of agricultural planting and harvest to separate most row-crop subclasses. Although interannual and regional timing varies based on individual management choices and weather conditions, soy crops are typically planted in September-October and short cycle beans are harvested in January. Corn is planted later and usually harvested in late April. Double cropping is widely used with plantings after soy harvests in January and May-June. An agronomic calendar is presented in Figure 7. Detecting subclasses of crop types will be carried out over the states of Rondônia and Mato Grosso.
IV. D. Phenology input to the biogeochemical modelGV phenology data is a direct spatial and temporal input to the biogeochemical model. Modeled GV phenology is used to determine seasonal variation in the plants’ ability to capture sunlight in the calculation of Gross Primary Production (GPP).
IV. Land Cover & Land UseB
Figure 5: Increase in area of croplands, separated by cropping pattern. Red areas are single cropping patterns. Double cropping patterns are shown in black.
2001 2002 2003 2004 2005
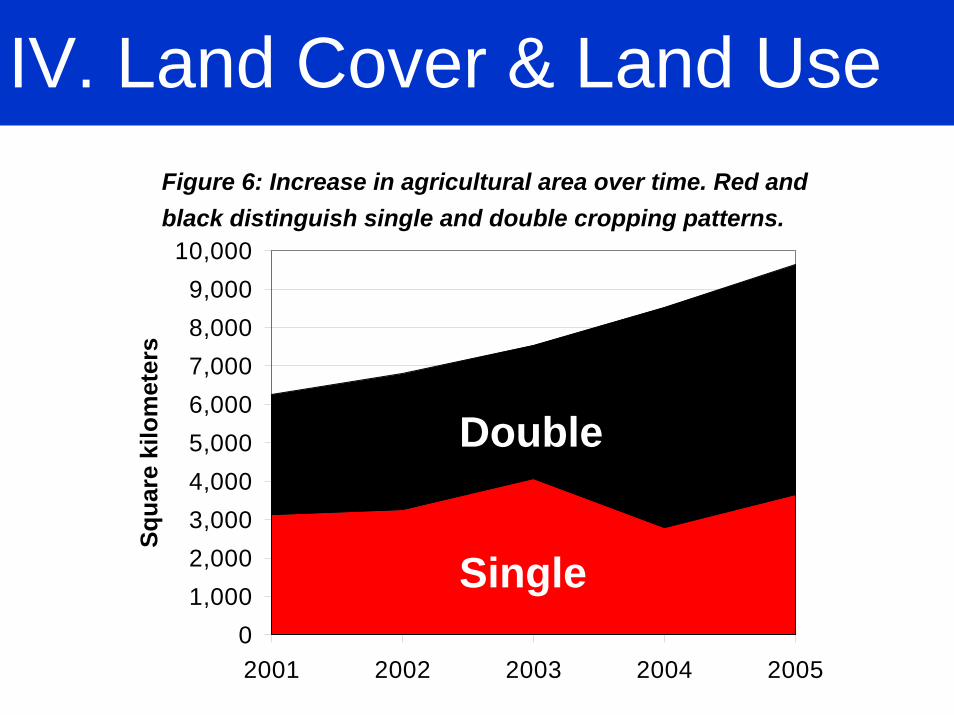
IV. Land Cover & Land UseBFigure 6: Increase in agricultural area over time. Red and
black distinguish single and double cropping patterns.
01,0002,0003,0004,0005,0006,0007,0008,0009,000
10,000
2001 2002 2003 2004 2005
Squa
re k
ilom
eter
s
Double
Single
IV. Land Cover & Land UseB
Soy Long (140 days)
Soy Med (120 days)
Soy Short (110 days)
Maize Med (140 days)
Sorghum (140 days)
Millet (140 days)
Millet Cover (70 days)
Sunflower (140 days)
18-ago 7-out 26-nov 15-jan 5-mar 24-abr 13-jun 2-ago
Maize Short (120-130
Maize Long (150
Figure 7: For a typical growing year (August-August), these are the expected growing seasons for the most common crops.
V. Regional GIS databaseB
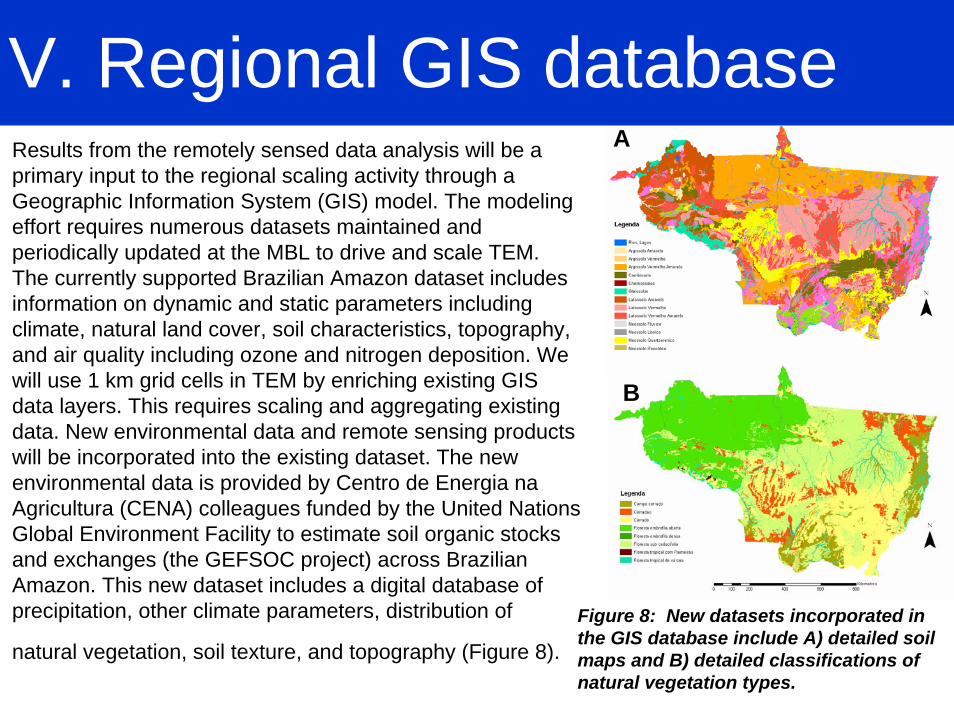
Results from the remotely sensed data analysis will be a primary input to the regional scaling activity through a Geographic Information System (GIS) model. The modeling effort requires numerous datasets maintained and periodically updated at the MBL to drive and scale TEM. The currently supported Brazilian Amazon dataset includes information on dynamic and static parameters including climate, natural land cover, soil characteristics, topography, and air quality including ozone and nitrogen deposition. We will use 1 km grid cells in TEM by enriching existing GIS data layers. This requires scaling and aggregating existing data. New environmental data and remote sensing products will be incorporated into the existing dataset. The new environmental data is provided by Centro de Energia na Agricultura (CENA) colleagues funded by the United Nations Global Environment Facility to estimate soil organic stocks and exchanges (the GEFSOC project) across Brazilian Amazon. This new dataset includes a digital database of precipitation, other climate parameters, distribution of
natural vegetation, soil texture, and topography (Figure 8).
Figure 8: New datasets incorporated in the GIS database include A) detailed soil maps and B) detailed classifications of natural vegetation types.
A
B
VI. Agricultural ManagementBCrop management has implications for greenhouse gas fluxes.
Despite differences among farm managers, there are general practices common throughout the study area. We have are defining the common management practices for the main crops with the assistance of colleagues at CENA and Empresa Brasileira de Pesquisa Agropecuária (EMBRAPA). EMBRAPA scientists have extensive knowledge of each crops’ standard management practices. I will develop an inventory of management practices including the use of herbicides, pesticidesand fertilizers through access to farm records and interviews with farm managers. I will associate this new information on management practices with crops (e.g. average amount of fertilization with corn crops or millet cultivation associated largely with no-tillage practices) in the regional GIS model.
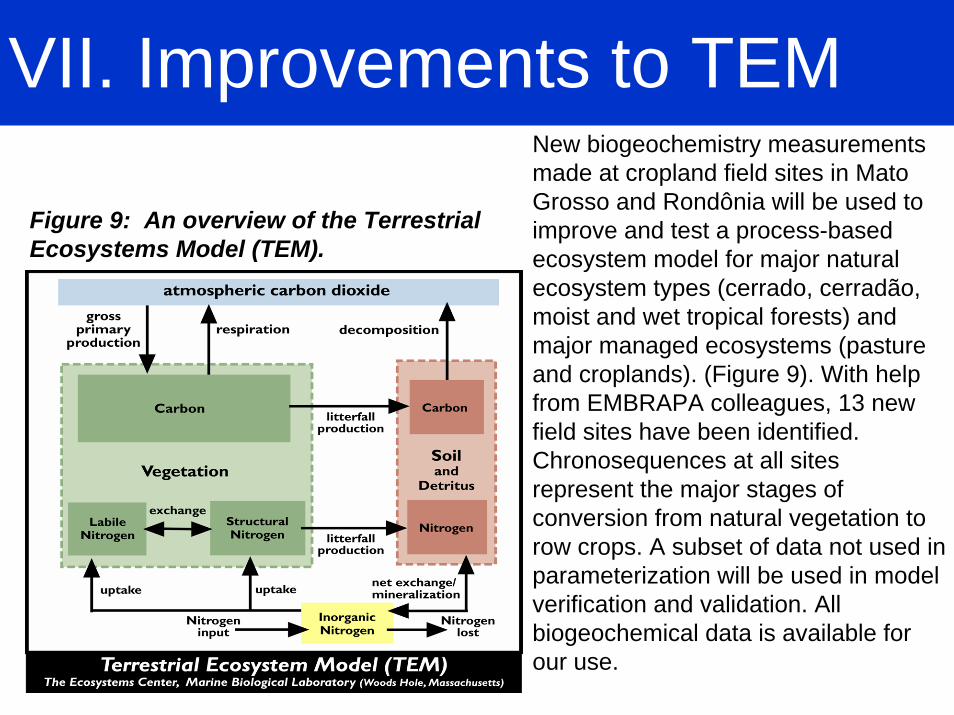
VII. Improvements to TEMNew biogeochemistry measurements made at cropland field sites in Mato Grosso and Rondônia will be used to improve and test a process-based ecosystem model for major natural ecosystem types (cerrado, cerradão, moist and wet tropical forests) and major managed ecosystems (pasture and croplands). (Figure 9). With help from EMBRAPA colleagues, 13 new field sites have been identified. Chronosequences at all sites represent the major stages of conversion from natural vegetation to row crops. A subset of data not used in parameterization will be used in model verification and validation. All biogeochemical data is available for our use.
BFigure 9: An overview of the Terrestrial Ecosystems Model (TEM).
VIII. Simulation ModelingB
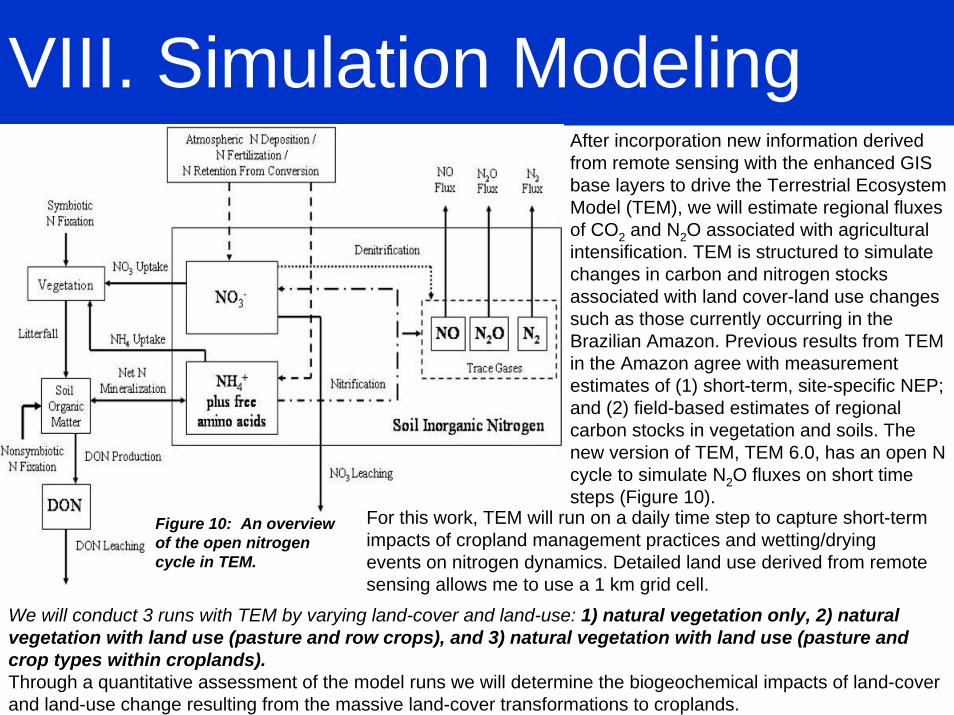
After incorporation new information derived from remote sensing with the enhanced GIS base layers to drive the Terrestrial Ecosystem Model (TEM), we will estimate regional fluxes of CO2 and N2O associated with agricultural intensification. TEM is structured to simulate changes in carbon and nitrogen stocks associated with land cover-land use changes such as those currently occurring in the Brazilian Amazon. Previous results from TEM in the Amazon agree with measurement estimates of (1) short-term, site-specific NEP; and (2) field-based estimates of regional carbon stocks in vegetation and soils. The new version of TEM, TEM 6.0, has an open N cycle to simulate N2O fluxes on short time steps (Figure 10).
Figure 10: An overview of the open nitrogen cycle in TEM.
We will conduct 3 runs with TEM by varying land-cover and land-use: 1) natural vegetation only, 2) natural vegetation with land use (pasture and row crops), and 3) natural vegetation with land use (pasture and crop types within croplands).Through a quantitative assessment of the model runs we will determine the biogeochemical impacts of land-cover and land-use change resulting from the massive land-cover transformations to croplands.
For this work, TEM will run on a daily time step to capture short-term impacts of cropland management practices and wetting/drying events on nitrogen dynamics. Detailed land use derived from remote sensing allows me to use a 1 km grid cell.
ReferencesB
References: 1) CONAB (Companhia Nacional de Abastecimento) (2004). Homepage: www.conab.gov.br.


![Using Land Use Change Models to Assess Biophysical and Biogeochemical Consequences: The Future is Not Like the Past R. DeFries, [ rd63@umail.umd.edu] Department](https://img.pdfslide.net/doc/110x75/56649ec85503460f94bd558e/using-land-use-change-models-to-assess-biophysical-and-biogeochemical-consequences.jpg)