Embed Size (px)
Citation preview
Proc. Nat. Acad. Sci. USAVol. 69, No. 11, pp. 3199-3203, November 1972
Biogeographic Kinetics: Estimation of Relaxation Times for Avifaunas ofSouthwest Pacific Islands
(immigration/extinction/birds/tropical rainforest/conservation)
JARED M. DIAMOND
Physiology Department, UCLA Medical Center, Los Angeles, California 90024
Communicated by Robert MacArthur, June 28, 1972
ABSTRACT When species diversity S on an island isdisplaced from the equilibrium value by injection or re-moval of species, S relaxes to equilibrium by an imbalancebetween immigration and extinction rates. Estimates ofexponential relaxation times, tr, for avifaunas of NewGuinea satellite islands are calculated from analysis offour "experiments of nature": recolonization of explodedvolcanoes, contraction in island area due to rising sealevel, severing of land bridges, and disappearance of land-bridge relict species. t, is in the range 3,000-18,000 yearsfor avifaunas of islands of 50-3000 square miles (130-7800kM2), and increases with island area. Immigration coeffi-cients decrease and extinction coefficients increase withincreasing S. The results may be relevant to the design ofrainforest preserves.
If one compares the faunal or floral diversity on differentislands, one finds that the number of species increases withisland area, but decreases with distance from the mainland.MacArthur and Wilson (1, 2) interpreted this pattern tomean that insular species diversities represent an equilibriumbetween immigration rates and extinction rates. Immigrationrates due to random dispersal of individuals from the main-land should fall off with increasing distance, and extinctionrates due to fluctuations in small populations should fall offwith increasing area (hence, increasing population size). Com-parisons of bird censuses taken several decades apart on theCalifornia Channel Islands (3), on Karkar Island off NewGuinea (4), and on Mona Island in the Caribbean (5) haveconfirmed that the avifaunas of these islands actually are indynamic equilibrium, and have provided estimates of im-migration and extinction rates under steady-state conditions.An alternative approach to these studies under steady-state
conditions depends upon displacing an island fauna fromequilibrium and measuring the "relaxation time" with whichspecies diversity returns to the equilibrium value or "re-laxes." For example, Simberloff and Wilson (6) fumigatedmangrove trees near the Florida coast and measured therates at which insects and other arthropods recolonized thetrees. The present paper reports methods for estimatingrelaxation times of avifaunas on the satellite islands of NewGuinea, utilizing "experiments of nature" or natural relaxa-tion processes, rather than experimental manipulation of thefauna. Four sets of conditions are identified under whichboth a nonequilibrium species diversity at some time in thepast and the expected species diversity at equilibrium canbe estimated and compared with the species diversity atpresent, providing three points on the relaxation curve.
Theory
We describe faunal relaxation by a highly schematic treat-ment that the present paper will show to represent an over-
simplification, but that nevertheless serves as a useful startingpoint.The measured relaxation times of island faunas are a re-
sultant of two relaxation processes, immigration and extinc-tion, whose respective rates I and E (expressed in species peryear) depend on the instantaneous species diversity S(t) (trepresents time). Let us assume constant coefficients K1 andKe (expressed in year-') of immigration and extinction, re-spectively:
E = KeS(t) [1]
dS/dt = I - E = (K1 + Ke)
X [K1 S*/(K1 + Ke) - S(t)] [3]
where S* is the mainland species pool. Straightforward in-tegration under various boundary conditions yields the fol-lowing equations:At equilibrium (dS/dt = 0), the species diversity Seq is
given by
Seq = Ki S*/(K1 + Ke).
Furthermore,
[4]
I = E = Ki Ke S*/(Ki + Ke). [5]
Relaxation to equilibrium from an initial species diversityS(O) that differs from Seq is described by:
[6][S(t) - Seq]/[S(O) - Seq] = e-tlt,where the relaxation time t, is given by
tr = (Ki + Ke)-1. [7]
The relaxation time is the length of time required for thedeparture of species diversity from equilibrium, S(t) -Seqj, to relax to l/e (or 36.8%) of the initial departure,5(0) - Seql, where e is the base of natural logarithms. Re-
laxation is 90% complete after 2.303 relaxation times.
Species diversity at equilibrium
First, we need a formula predicting Seq, the bird species di-versity on New Guinea satellite islands at equilibrium. Weassume that most tropical islands of the southwest Pacificresemble Karkar, the California Channel Islands, and Monain being at avifaunal equilibrium, except for those few islandsrecently perturbed by the four "experiments of nature" tobe discussed. The number of land and fresh-water bird speciescoexisting on each tropical island of the southwest Pacificvaries from 1 for some isolated atolls up to 513 for New Guineaitself. These differences in S are predictable from an island'sarea, A (expressed in square miles), its distance from NewGuinea, d (expressed in miles), and its elevation, L (expressed
3199
I = Ki [S* - S(t) 1 [21
Proc. Nat. Acad. Sci. USA 69 (1972)
320-
160- +478+5X
9 +6+
a) 80- 201J '3 0141
LL 0
o 40-
z 20- **
+12/
10410.1 1 10 100 1,000 10,000 100,000 1,000,000
AREA (square miles)
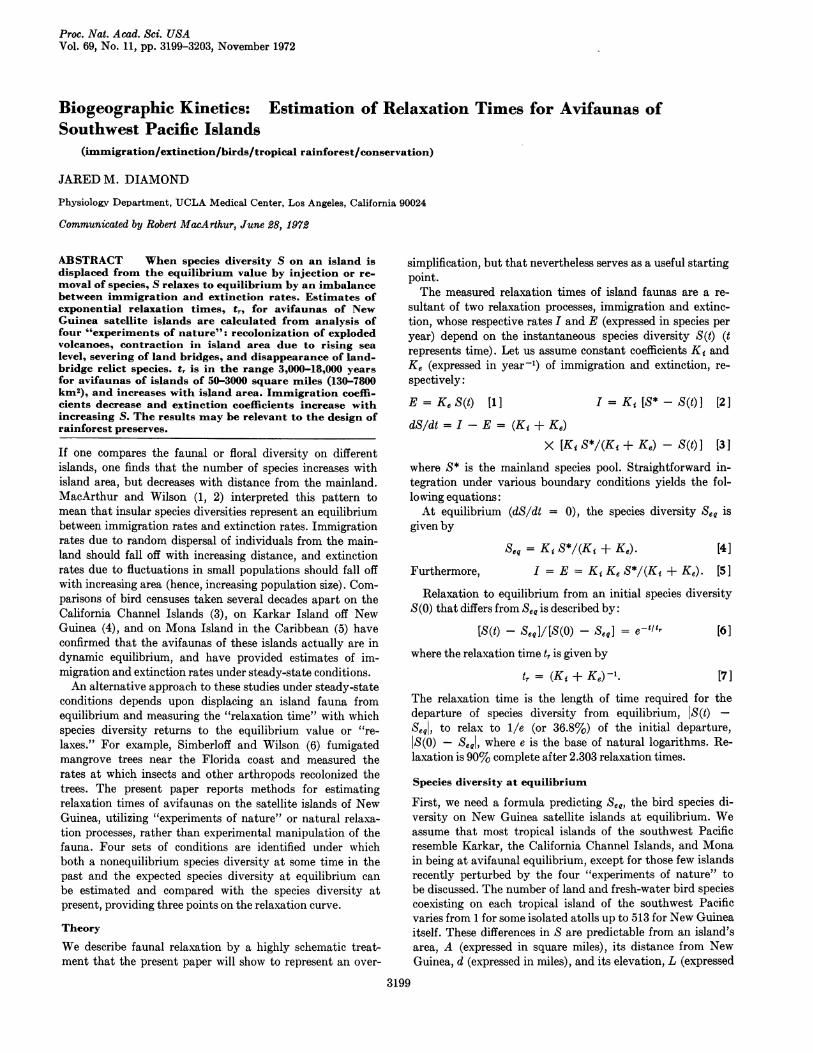
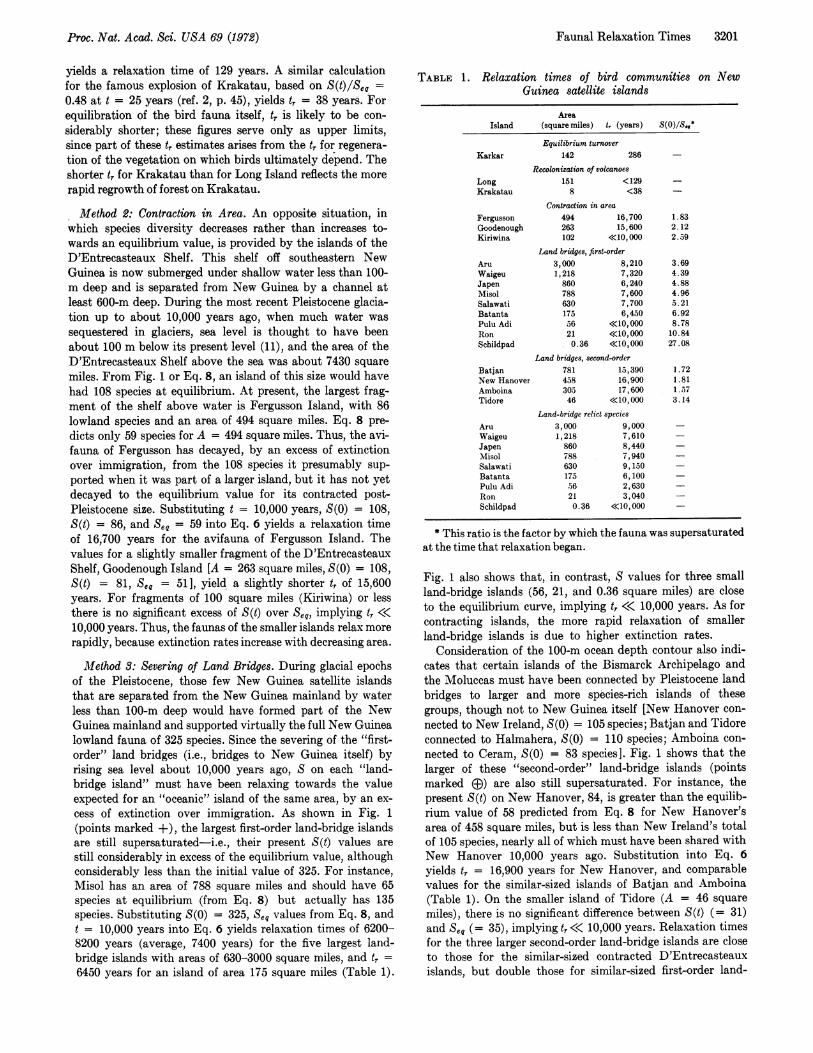
FIG. 1. Number of resident land and fresh-water bird specieson New Guinea satellite islands, plotted as a function of islandarea on a log-log scale. 0, Islands whose avifaunas are presumedto be at equilibrium. The avifaunas of the numbered, remainingislands are in various stages of relaxation. A, Exploded volcanoes:1 = Long. O, Contracted islands: 2 = Goodenough, 3 = Fer-gusson. +, First-order land-bridge islands: 4 = Aru, 5 = Waigeu,6 = Japen, 7 = Salawati, 8 = Misol, 9 = Batanta, 10 = PuluAdi, 11 = Ron, 12 = Schildpad. ED, Second-order land-bridgeislands: 13 = Batjan, 14 = Amboina, 16 = New Hanover,16 = Tidore. The straight line is Eq. 8, the least-mean-squaresfit to all points except the first-order land-bridge islands. Notethat large land-bridge and contracted islands deviate in the direc-tion of an excess of species, that small islands do not, and that thedeviation is more marked for the first-order land-bridge islandsthan for second-order land-bridge islands or contracted ones.
in feet). The present analysis of the empirical dependence ofS on A, d, and L is similar to previous analyses by others (1,2, 7), but is based on more extensive data, derived from theunpublished journals of the Whitney South Sea Expedition,from published literature, and from my expeditions (8-10).
Fig. 1 depicts the number of bird species, S, occurring atsea level on islands between 5 and 300 miles from New Guinea,as a function of island area, A. Over a three-millionfold rangeof areas the results fit the exponential equation
S = 15.1 A0 22 [8]
with an average error of 19%. The numbered deviant pointsrepresent islands undergoing various types of relaxation,as discussed later.
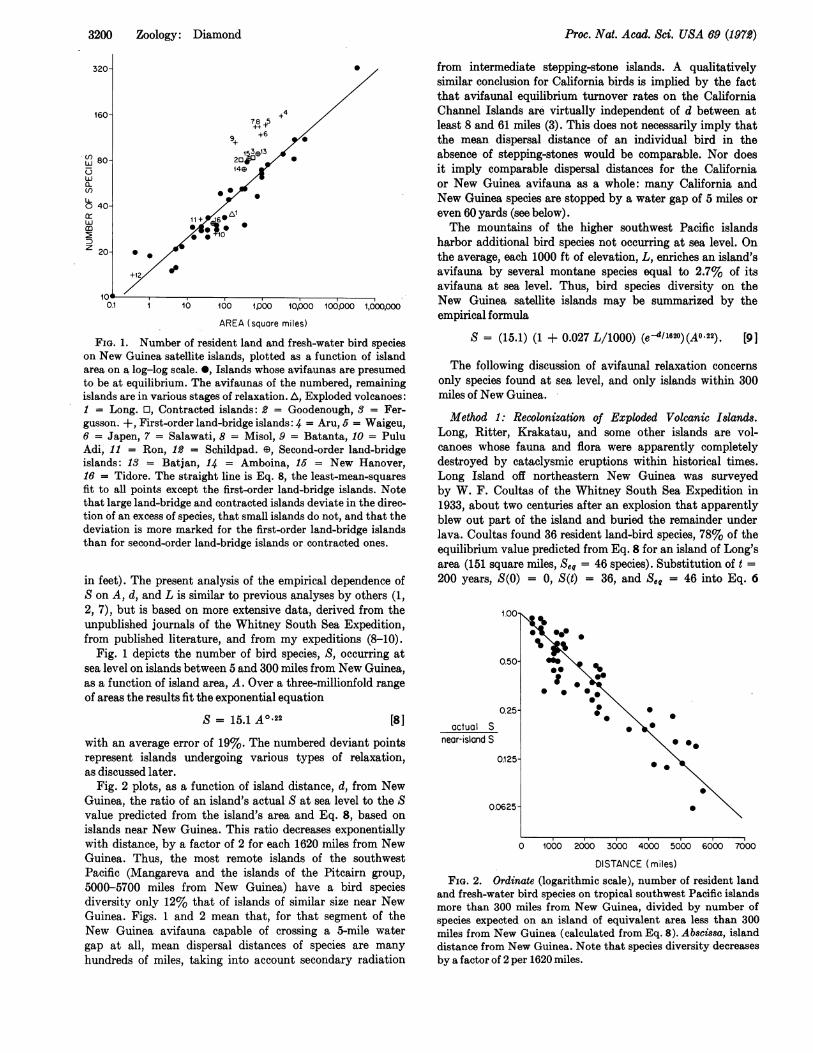
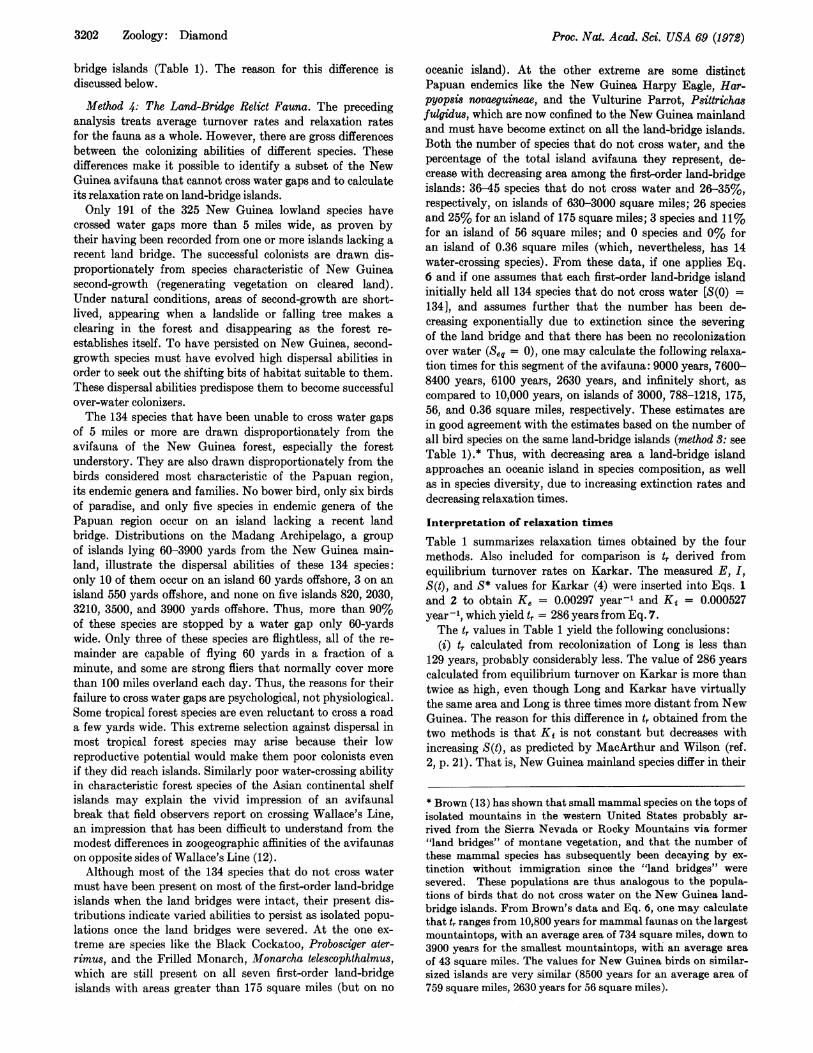
Fig. 2 plots, as a function of island distance, d, from NewGuinea, the ratio of an island's actual S at sea level to the Svalue predicted from the island's area and Eq. 8, based onislands near New Guinea. This ratio decreases exponentiallywith distance, by a factor of 2 for each 1620 miles from NewGuinea. Thus, the most remote islands of the southwestPacific (Mangareva and the islands of the Pitcairn group,5000-5700 miles from New Guinea) have a bird speciesdiversity only 12% that of islands of similar size near NewGuinea. Figs. 1 and 2 mean that, for that segment of theNew Guinea avifauna capable of crossing a 5-mile watergap at all, mean dispersal distances of species are manyhundreds of miles, taking into account secondary radiation
from intermediate stepping-stone islands. A qualitativelysimilar conclusion for California birds is implied by the factthat avifaunal equilibrium turnover rates on the CaliforniaChannel Islands are virtually independent of d between atleast 8 and 61 miles (3). This does not necessarily imply thatthe mean dispersal distance of an individual bird in theabsence of stepping-stones would be comparable. Nor doesit imply comparable dispersal distances for the Californiaor New Guinea avifauna as a whole: many California andNew Guinea species are stopped by a water gap of 5 miles oreven 60 yards (see below).The mountains of the higher southwest Pacific islands
harbor additional bird species not occurring at sea level. Onthe average, each 1000 ft of elevation, L, enriches an island'savifauna by several montane species equal to 2.7% of itsavifauna at sea level. Thus, bird species diversity on theNew Guinea satellite islands may be summarized by theempirical formula
S = (15.1) (1 + 0.027 L/1000) (e-/1620)(Ao.22). [9]
The following discussion of avifaunal relaxation concernsonly species found at sea level, and only islands within 300miles of New Guinea.
Method 1: Recolonization of Exploded Volcanic Islands.Long, Ritter, Krakatau, and some other islands are vol-canoes whose fauna and flora were apparently completelydestroyed by cataclysmic eruptions within historical times.Long Island off northeastern New Guinea was surveyedby W. F. Coultas of the Whitney South Sea Expedition in1933, about two centuries after an explosion that apparentlyblew out part of the island and buried the remainder underlava. Coultas found 36 resident land-bird species, 78% of theequilibrium value predicted from Eq. 8 for an island of Long'sarea (151 square miles, S, = 46 species). Substitution of t =200 years, S(0) = 0, S(t) = 36, and See = 46 into Eq. 6
1.00-
0.50-
0.25-
actual Snear-island S
0.125
0.0625-
0*t* 0. *\
000
* 0 0.0
40 00 0
000 0.
0.
0 1000 2000 3000 4000 5000 6000 7000
DISTANCE (miles)FIG. 2. Ordinate (logarithmic scale), number of resident land
and fresh-water bird species on tropical southwest Pacific islandsmore than 300 miles from New Guinea, divided by number ofspecies expected on an island of equivalent area less than 300miles from New Guinea (calculated from Eq. 8). Abscissa, islanddistance from New Guinea. Note that species diversity decreasesby a factor of 2 per 1620 miles.
3200 Zoology: Diamond
Proc. Nat. Acad. Sci. USA 69 (1972)
yields a relaxation time of 129 years. A similar calculationfor the famous explosion of Krakatau, based on S(t)/Seq =0.48 at t = 25 years (ref. 2, p. 45), yields tr = 38 years. Forequilibration of the bird fauna itself, t, is likely to be con-siderably shorter; these figures serve only as upper limits,since part of these t, estimates arises from the t, for regenera-tion of the vegetation on which birds ultimately depend. Theshorter t, for Krakatau than for Long Island reflects the morerapid regrowth of forest on Krakatau.
Method 2: Contraction in Area. An opposite situation, inwhich species diversity decreases rather than increases to-wards an equilibrium value, is provided by the islands of theD'Entrecasteaux Shelf. This shelf off southeastern NewGuinea is now submerged under shallow water less than 100-m deep and is separated from New Guinea by a channel atleast 600-m deep. During the most recent Pleistocene glacia-tion up to about 10,000 years ago, when much water wassequestered in glaciers, sea level is thought to have beenabout 100 m below its present level (11), and the area of theD'Entrecasteaux Shelf above the sea was about 7430 squaremiles. From Fig. 1 or Eq. 8, an island of this size would havehad 108 species at equilibrium. At present, the largest frag-ment of the shelf above water is Fergusson Island, with 86lowland species and an area of 494 square miles. Eq. 8 pre-dicts only 59 species for A = 494 square miles. Thus, the avi-fauna of Fergusson has decayed, by an excess of extinctionover immigration, from the 108 species it presumably sup-ported when it was part of a larger island, but it has not yetdecayed to the equilibrium value for its contracted post-Pleistocene size. Substituting t = 10,000 years, S(0) = 108,S(t) = 86, and Seq = 59 into Eq. 6 yields a relaxation timeof 16,700 years for the avifauna of Fergusson Island. Thevalues for a slightly smaller fragment of the D'EntrecasteauxShelf, Goodenough Island [A = 263 square miles, S(0) = 108,S(t) = 81, Seq = 51], yield a slightly shorter t, of 15,600years. For fragments of 100 square miles (Kiriwina) or lessthere is no significant excess of S(t) over Seq, implying t, <<10,000 years. Thus, the faunas of the smaller islands relax morerapidly, because extinction rates increase with decreasing area.
Method 3: Severing of Land Bridges. During glacial epochsof the Pleistocene, those few New Guinea satellite islandsthat are separated from the New Guinea mainland by waterless than 100-m deep would have formed part of the NewGuinea mainland and supported virtually the full New Guinealowland fauna of 325 species. Since the severing of the "first-order" land bridges (i.e., bridges to New Guinea itself) byrising sea level about 10,000 years ago, S on each "land-bridge island" must have been relaxing towards the valueexpected for an "oceanic" island of the same area, by an ex-cess of extinction over immigration. As shown in Fig. 1(points marked +), the largest first-order land-bridge islandsare still supersaturated-i.e., their present S(t) values arestill considerably in excess of the equilibrium value, althoughconsiderably less than the initial value of 325. For instance,Misol has an area of 788 square miles and should have 65species at equilibrium (from Eq. 8) but actually has 135species. Substituting S(0) = 325, Seq values from Eq. 8, andt = 10,000 years into Eq. 6 yields relaxation times of 6200-8200 years (average, 7400 years) for the five largest land-bridge islands with areas of 630-3000 square miles, and tG =6450 years for an island of area 175 square miles (Table 1).
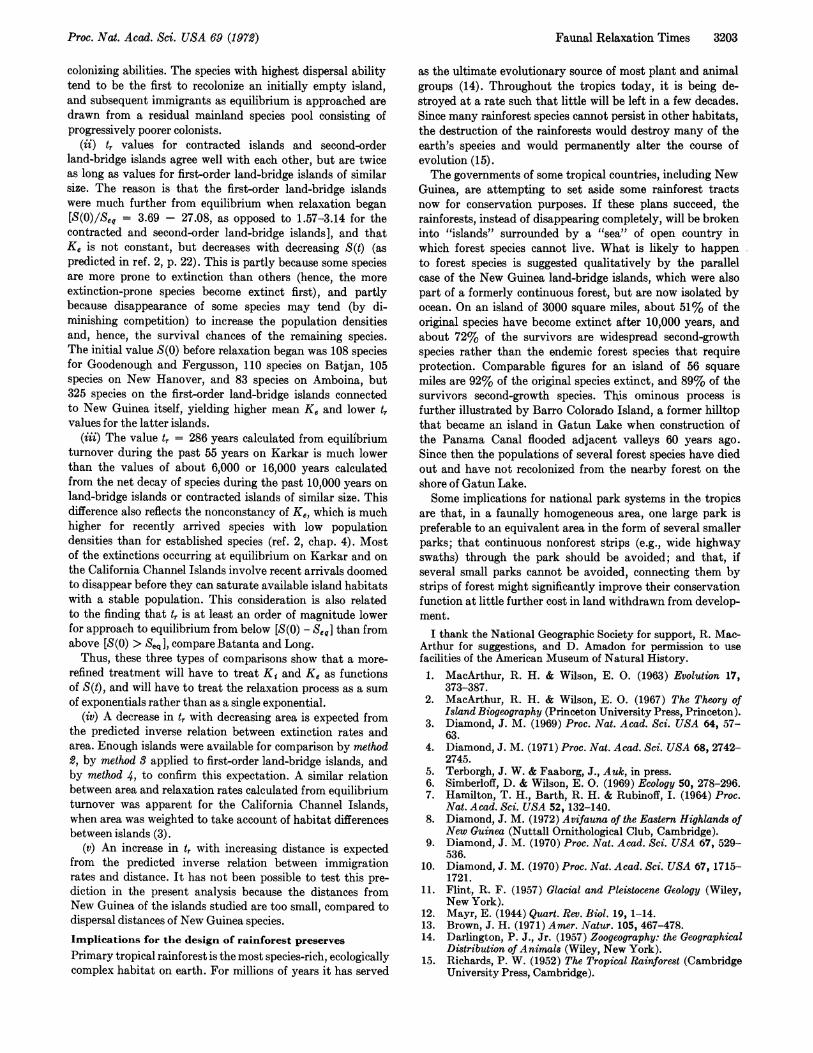
TABLE 1. Relaxation times of bird communities on NewGuinea satellite islands
AreaIsland (square miles) t4 (years)
Equilibrium turnoverKarkar 142 286
Recolonization of volcanoesLong 151 <129Krakatau 8 <38
Contraction in areaFergusson 494 16,700Goodenough 263 15,600Kiriwina 102 <<10,000
Land bridges, first-orderAru 3,000 8,210Waigeu 1,218 7,320Japen 860 6,240Misol 788 7,600Salawati 630 7,700Batanta 175 6,450Pulu Adi 56 <<10,000Ron 21 <<10,000Schildpad 0.36 <<10,000
BatjanNew HanoverAmboinaTidore
AruWaigeuJapenMisolSalawatiBatantaPulu AdiRonSchildpad
Land bridges, second-order781 15,390458 16,900305 17,60046 <<10, 000
Land-bridge relict species3,000 9,0001,218 7,610860 8,440788 7,940630 9,150173 6,10056 2,63021 3,0400.36 <<10,000
1.832.122.59
3.694.394.884.963.216.928.7810.8427.08
1.721.811.373.14
* This ratio is the factor by which the fauna was supersaturatedat the time that relaxation began.
Fig. 1 also shows that, in contrast, S values for three smallland-bridge islands (56, 21, and 0.36 square miles) are closeto the equilibrium curve, implying tr << 10,000 years. As forcontracting islands, the more rapid relaxation of smallerland-bridge islands is due to higher extinction rates.
Consideration of the 100-m ocean depth contour also indi-cates that certain islands of the Bismarck Archipelago andthe Moluccas must have been connected by Pleistocene landbridges to larger and more species-rich islands of thesegroups, though not to New Guinea itself [New Hanover con-nected to New Ireland, S(0) = 105 species; Batjan and Tidoreconnected to Halmahera, S(0) = 110 species; Amboina con-nected to Ceram, S(0) = 83 species]. Fig. 1 shows that thelarger of these "second-order" land-bridge islands (pointsmarked 8) are also still supersaturated. For instance, thepresent S(t) on New Hanover, 84, is greater than the equilib-rium value of 58 predicted from Eq. 8 for New Hanover'sarea of 458 square miles, but is less than New Ireland's totalof 105 species, nearly all of which must have been shared withNew Hanover 10,000 years ago. Substitution into Eq. 6yields tr = 16,900 years for New Hanover, and comparablevalues for the similar-sized islands of Batjan and Amboina(Table 1). On the smaller island of Tidore (A = 46 squaremiles), there is no significant difference between S(t) (= 31)and Seq (= 35), implying tr << 10,000 years. Relaxation timesfor the three larger second-order land-bridge islands are closeto those for the similar-sized contracted D'Entrecasteauxislands, but double those for similar-sized first-order land-
Faunal Relaxation Times 3201
Proc. Nat. Acad. Sci. USA 69 (1972)
bridge islands (Table 1). The reason for this difference isdiscussed below.
Method 4: The Land-Bridge Relict Fauna. The precedinganalysis treats average turnover rates and relaxation ratesfor the fauna as a whole. However, there are gross differencesbetween the colonizing abilities of different species. Thesedifferences make it possible to identify a subset of the NewGuinea avifauna that cannot cross water gaps and to calculateits relaxation rate on land-bridge islands.Only 191 of the 325 New Guinea lowland species have
crossed water gaps more than 5 miles wide, as proven bytheir having been recorded from one or more islands lacking arecent land bridge. The successful colonists are drawn dis-proportionately from species characteristic of New Guineasecond-growth (regenerating vegetation on cleared land).Under natural conditions, areas of second-growth are short-lived, appearing when a landslide or falling tree makes aclearing in the forest and disappearing as the forest re-establishes itself. To have persisted on New Guinea, second-growth species must have evolved high dispersal abilities inorder to seek out the shifting bits of habitat suitable to them.These dispersal abilities predispose them to become successfulover-water colonizers.The 134 species that have been unable to cross water gaps
of 5 miles or more are drawn disproportionately from theavifauna of the New Guinea forest, especially the forestunderstory. They are also drawn disproportionately from thebirds considered most characteristic of the Papuan region,its endemic genera and families. No bower bird, only six birdsof paradise, and only five species in endemic genera of thePapuan region occur on an island lacking a recent landbridge. Distributions on the Madang Archipelago, a groupof islands lying 60-3900 yards from the New Guinea main-land, illustrate the dispersal abilities of these 134 species:only 10 of them occur on an island 60 yards offshore, 3 on anisland 550 yards offshore, and none on five islands 820, 2030,3210, 3500, and 3900 yards offshore. Thus, more than 90%of these species are stopped by a water gap only 60-yardswide. Only three of these species are flightless, all of the re-mainder are capable of flying 60 yards in a fraction of aminute, and some are strong fliers that normally cover morethan 100 miles overland each day. Thus, the reasons for theirfailure to cross water gaps are psychological, not physiological.Some tropical forest species are even reluctant to cross a roada few yards wide. This extreme selection against dispersal inmost tropical forest species may arise because their lowreproductive potential would make them poor colonists evenif they did reach islands. Similarly poor water-crossing abilityin characteristic forest species of the Asian continental shelfislands may explain the vivid impression of an avifaunalbreak that field observers report on crossing Wallace's Line,an impression that has been difficult to understand from themodest differences in zoogeographic affinities of the avifaunason opposite sides of Wallace's Line (12).Although most of the 134 species that do not cross water
must have been present on most of the first-order land-bridgeislands when the land bridges were intact, their present dis-tributions indicate varied abilities to persist as isolated popu-lations once the land bridges were severed. At the one ex-trenme are species like the Black Cockatoo, Probosciger ater-rimus, and the Frilled Monarch, Monarcha telescophthalmus,which are still present on all seven first-order land-bridgeislands with areas greater than 175 square miles (but on no
oceanic island). At the other extreme are some distinctPapuan endemics like the New Guinea Harpy Eagle, Har-pyopsis novaeguineae, and the Vulturine Parrot, Psittrichasfulgidus, which are now confined to the New Guinea mainlandand must have become extinct on all the land-bridge islands.Both the number of species that do not cross water, and thepercentage of the total island avifauna they represent, de-crease with decreasing area among the first-order land-bridgeislands: 36-45 species that do not cross water and 26-35%,respectively, on islands of 630-3000 square miles; 26 speciesand 25% for an island of 175 square miles; 3 species and 11%for an island of 56 square miles; and 0 species and 0% foran island of 0.36 square miles (which, nevertheless, has 14water-crossing species). From these data, if one applies Eq.6 and if one assumes that each first-order land-bridge islandinitially held all 134 species that do not cross water [S(0) =134], and assumes further that the number has been de-creasing exponentially due to extinction since the severingof the land bridge and that there has been no recolonizationover water (Seq = 0), one may calculate the following relaxa-tion times for this segment of the avifauna: 9000 years, 7600-8400 years, 6100 years, 2630 years, and infinitely short, ascompared to 10,000 years, on islands of 3000, 788-1218, 175,56, and 0.36 square miles, respectively. These estimates arein good agreement with the estimates based on the number ofall bird species on the same land-bridge islands (method 3: seeTable 1).* Thus, with decreasing area a land-bridge islandapproaches an oceanic island in species composition, as wellas in species diversity, due to increasing extinction rates anddecreasing relaxation times.
Interpretation of relaxation times
Table 1 summarizes relaxation times obtained by the fourmethods. Also included for comparison is tr derived fromequilibrium turnover rates on Karkar. The measured E, I,S(t), and S* values for Karkar (4) were inserted into Eqs. 1and 2 to obtain Ke = 0.00297 year-' and Ki = 0.000527year-', which yield t, = 286 years from Eq. 7.The tr values in Table 1 yield the following conclusions:(i) t, calculated from recolonization of Long is less than
129 years, probably considerably less. The value of 286 yearscalculated from equilibrium turnover on Karkar is more thantwice as high, even though Long and Karkar have virtuallythe same area and Long is three times more distant from NewGuinea. The reason for this difference in tr obtained from thetwo methods is that Ki is not constant but decreases withincreasing S(t), as predicted by MacArthur and Wilson (ref.2, p. 21). That is, New Guinea mainland species differ in their
* Brown (13) has shown that small mammal species on the tops ofisolated mountains in the western United States probably ar-rived from the Sierra Nevada or Rocky Mountains via former"land bridges" of montane vegetation, and that the number ofthese mammal species has subsequently been decaying by ex-tinction without immigration since the "land bridges" weresevered. These populations are thus analogous to the popula-tions of birds that do not cross water on the New Guinea land-bridge islands. From Brown's data and Eq. 6, one may calculatethat tr ranges from 10,800 years for mammal faunas on the largestmountaintops, with an average area of 734 square miles, down to3900 years for the smallest mountaintops, with an average areaof 43 square miles. The values for New Guinea birds on similar-sized islands are very similar (8500 years for an average area of759 square miles, 2630 years for 56 square miles).
3202 Zoology: Diamond
Proc. Nat. Acad. Sci. USA 69 (1972)
colonizing abilities. The species with highest dispersal abilitytend to be the first to recolonize an initially empty island,and subsequent immigrants as equilibrium is approached aredrawn from a residual mainland species pool consisting ofprogressively poorer colonists.
(ii) t, values for contracted islands and second-orderland-bridge islands agree well with each other, but are twiceas long as values for first-order land-bridge islands of similarsize. The reason is that the first-order land-bridge islandswere much further from equilibrium when relaxation began[S(O)/Seq = 3.69 - 27.08, as opposed to 1.57-3.14 for thecontracted and second-order land-bridge islands], and thatKe is not constant, but decreases with decreasing S(t) (aspredicted in ref. 2, p. 22). This is partly because some speciesare more prone to extinction than others (hence, the moreextinction-prone species become extinct first), and partlybecause disappearance of some species may tend (by di-minishing competition) to increase the population densitiesand, hence, the survival chances of the remaining species.The initial value S(0) before relaxation began was 108 speciesfor Goodenough and Fergusson, 110 species on Batjan, 105species on New Hanover, and 83 species on Amboina, but325 species on the first-order land-bridge islands connectedto New Guinea itself, yielding higher mean Ke and lower tovalues for the latter islands.
(iii) The value tT = 286 years calculated from equilibriumturnover during the past 55 years on Karkar is much lowerthan the values of about 6,000 or 16,000 years calculatedfrom the net decay of species during the past 10,000 years onland-bridge islands or contracted islands of similar size. Thisdifference also reflects the nonconstancy of Ke, which is muchhigher for recently arrived species with low populationdensities than for established species (ref. 2, chap. 4). Mostof the extinctions occurring at equilibrium on Karkar and onthe California Channel Islands involve recent arrivals doomedto disappear before they can saturate available island habitatswith a stable population. This consideration is also relatedto the finding that t, is at least an order of magnitude lowerfor approach to equilibrium from below [S(0) - Sea] than fromabove [S(0) > Seq ], compare Batanta and Long.
Thus, these three types of comparisons show that a more-refined treatment will have to treat K1 and Ke as functionsof S(t), and will have to treat the relaxation process as a sumof exponentials rather than as a single exponential.
(iv) A decrease in tT with decreasing area is expected fromthe predicted inverse relation between extinction rates andarea. Enough islands were available for comparison by method2, by method S applied to first-order land-bridge islands, andby method 4, to confirm this expectation. A similar relationbetween area and relaxation rates calculated from equilibriumturnover was apparent for the California Channel Islands,when area was weighted to take account of habitat differencesbetween islands (3).
(v) An increase in tT with increasing distance is expectedfrom the predicted inverse relation between immigrationrates and distance. It has not been possible to test this pre-diction in the present analysis because the distances fromNew Guinea of the islands studied are too small, compared todispersal distances of New Guinea species.Implications for the design of rainforest preservesPrimary tropical rainforest is the most species-rich, ecologicallycomplex habitat on earth. For millions of years it has served
as the ultimate evolutionary source of most plant and animalgroups (14). Throughout the tropics today, it is being de-stroyed at a rate such that little will be left in a few decades.Since many rainforest species cannot persist in other habitats,the destruction of the rainforests would destroy many of theearth's species and would permanently alter the course ofevolution (15).The governments of some tropical countries, including New
Guinea, are attempting to set aside some rainforest tractsnow for conservation purposes. If these plans succeed, therainforests, instead of disappearing completely, will be brokeninto "islands" surrounded by a "sea" of open country inwhich forest species cannot live. What is likely to happento forest species is suggested qualitatively by the parallelcase of the New Guinea land-bridge islands, which were alsopart of a formerly continuous forest, but are now isolated byocean. On an island of 3000 square miles, about 51% of theoriginal species have become extinct after 10,000 years, andabout 72% of the survivors are widespread second-growthspecies rather than the endemic forest species that requireprotection. Comparable figures for an island of 56 squaremiles are 92% of the original species extinct, and 89% of thesurvivors second-growth species. This ominous process isfurther illustrated by Barro Colorado Island, a former hilltopthat became an island in Gatun Lake when construction ofthe Panama Canal flooded adjacent valleys 60 years ago.Since then the populations of several forest species have diedout and have not recolonized from the nearby forest on theshore of Gatun Lake.Some implications for national park systems in the tropics
are that, in a faunally homogeneous area, one large park ispreferable to an equivalent area in the form of several smallerparks; that continuous nonforest strips (e.g., wide highwayswaths) through the park should be avoided; and that, ifseveral small parks cannot be avoided, connecting them bystrips of forest might significantly improve their conservationfunction at little further cost in land withdrawn from develop-ment.
I thank the National Geographic Society for support, R. Mac-Arthur for suggestions, and D. Amadon for permission to usefacilities of the American Museum of Natural History.1. MacArthur, R. H. & Wilson, E. 0. (1963) Evolution 17,
373-387.2. MacArthur, R. H. & Wilson, E. 0. (1967) The Theory of
Island Biogeography (Princeton University Press, Princeton).3. Diamond, J. M. (1969) Proc. Nat. Acad. Sci. USA 64, 57-
63.4. Diamond, J. M. (1971) Proc. Nat. Acad. Sci. USA 68, 2742-
2745.5. Terborgh, J. W. & Faaborg, J., Auk, in press.6. Simberloff, D. & Wilson, E. 0. (1969) Ecology 50, 278-296.7. Hamilton, T. H., Barth, R. H. & Rubinoff, I. (1964) Proc.
Nat. Acad. Sci. USA 52, 132-140.8. Diamond, J. M. (1972) Avifauna of the Eastern Highlands of
New Guinea (Nuttall Ornithological Club, Cambridge).9. Diamond, J. M. (1970) Proc. Nat. Acad. Sci. USA 67, 529-
536.10. Diamond, J. M. (1970) Proc. Nat. Acad. Sci. USA 67, 1715-
1721.11. Flint, R. F. (1957) Glacial and Pleistocene Geology (Wiley,
New York).12. Mayr, E. (1944) Quart. Rev. Biol. 19, 1-14.13. Brown, J. H. (1971) Amer. Natur. 105, 467-478.14. Darlington, P. J., Jr. (1957) Zoogeography: the Geographical
Distribution of Animals (Wiley, New York).15. Richards, P. W. (1952) The Tropical Rainforest (Cambridge
University Press, Cambridge).
Faunal Relaxation Times 3203