Embed Size (px)
Citation preview

L E T T E RBiogeography and variability of eleven mineral elements in plantleaves across gradients of climate, soil and plant functional typein China
W. X. Han,1,2 J. Y. Fang,1,*
P. B. Reich,3,4 F. Ian Woodward5
and Z. H. Wang1
AbstractUnderstanding variation of plant nutrients is largely limited to nitrogen and to a lesser extent phosphorus. Herewe analyse patterns of variation in 11 elements (nitrogen ⁄ phosphorus ⁄ potassium ⁄ calcium ⁄ magnesium ⁄sulphur ⁄ silicon ⁄ iron ⁄ sodium ⁄ manganese ⁄ aluminium) in leaves of 1900 plant species across China. Theconcentrations of these elements show significant latitudinal and longitudinal trends, driven by significantinfluences of climate, soil and plant functional type. Precipitation explains more variation than temperature forall elements except phosphorus and aluminium, and the 11 elements differentiate in relation to climate, soil andfunctional type. Variability (assessed as the coefficient of variation) and environmental sensitivity (slope ofresponses to environmental gradients) are lowest for elements that are required in the highest concentrations,most abundant and most often limiting in nature (the Stability of Limiting Elements Hypothesis). Our findingscan help initiate a more holistic approach to ecological plant nutrition and lay the groundwork for the eventualdevelopment of multiple element biogeochemical models.
KeywordsBiogeochemistry, biogeography of plant chemistry, climate, plant nutrients, plant functional type, soil nutrientavailability, soil pH, stability of limiting elements, stoichiometry, variability in leaf mineral elements.
Ecology Letters (2011) 14: 788–796
INTRODUCTION
Mineral nutrients sustain all plant life on our planet (Aerts & Chapin2000; Epstein & Bloom 2004). It is necessary to maintain sufficientconcentrations and relatively stable nutrient ratios in plant tissues(stoichiometric balance) for healthy growth (Marschner 1995).However, taxa may differ in the need for, and capability of obtainingand maintaining, specific ranges of concentrations and ratios ofdifferent nutrient elements in the plant body (stoichiometric homeo-stasis) (Sterner & Elser 2002). A better understanding of variation ofall essential plant nutrients is critical to the development of a broad(rather than nitrogen-centric) perspective on the ecology of plantnutrition, as well as in long-range, holistic biogeochemical models.However, such understanding to date is largely limited to nitrogen (N)and to some extent phosphorus (P).
As all essential nutrient elements play a role in plant health andecosystem function, a nuanced framework for understanding currentbiogeochemical cycles, including carbon (C) and N, and how they willchange in the future, requires improved understanding of theseelements and their interactions. Although globally N and P areconsidered of paramount importance to plant function, it is widelyknown that many other elements are also important in specificcontexts or regions, either due to limitations or toxicity, or impacts on
C ⁄ N ⁄ P cycling (Lynch & St. Clair 2004; Vitousek et al. 2010). Forexample, tissue calcium (Ca) and magnesium (Mg) deficiency andmanganese (Mn) and aluminium (Al) toxicity are common in certainhighly leached tropical soils (Lynch & St. Clair 2004); tissue Ca can actas a regulator of soil pH and cation exchange capacity (Reich et al.2005); tissue molybdenum (Mo) and iron (Fe) can influence N fixationresponse to rising CO2 (Hungate et al. 2004; Van Groenigen et al.2006; Barron et al. 2009), and micronutrients added to a tropical forestenhance leaf litter decomposition and leaf nitrogen content (Kaspariet al. 2008). Thus it is imperative that we begin to focus our attentionin the direction of the full set of mineral elements (Lynch & St. Clair2004; Agren 2008; Townsend et al. 2011).
Despite the examples given above of the importance of elementsbeyond C and N, their broad patterns of tissue concentration andstoichiometry are very poorly documented compared with C and N(McGroddy et al. 2004; Reich 2005; Elser et al. 2007). Broadlyspeaking, it is not well understood how or why the biogeography(including both means and variation) of different plant minerals iscreated and maintained, nor whether patterns should differ fordifferent elements (Lynch & St. Clair 2004; Marschner & Rengel2007).
China spans large gradients of climate and vegetation, from tropicalrainforest to cold alpine meadow or dry Gobi desert, covering nearly
1Key Laboratory for Earth Surface Processes, Ministry of Education, Department
of Ecology, Peking University, Beijing 100871, China2Key Laboratory of Plant-Soil Interactions, Ministry of Education, Key Labora-
tory of Plant Nutrition, Ministry of Agriculture, College of Resources and
Environmental Sciences, China Agricultural University, Beijing 100193, China3Department of Forest Resources and Institute on the Environment, University
of Minnesota, Minnesota 55108, USA
4Hawkesbury Institute for the Environment, University of Western Sydney,
Richmond, NSW 2753, Australia5Department Animal & Plant Sciences, University of Sheffield, Sheffield,
S10 2TN, UK
*Correspondence: E-mail: [email protected]
Ecology Letters, (2011) 14: 788–796 doi: 10.1111/j.1461-0248.2011.01641.x
! 2011 Blackwell Publishing Ltd/CNRS

all the vegetation types in the world (Fang et al. 2002; Zhang 2007).It thus provides a good representation of much of global biomeheterogeneity and a unique opportunity to examine how climate, soiland plant species interact in controlling leaf chemistry. The variationresults from north-south and east-west gradients in climate, as well asvariation in geomorphology and soil substrate materials, and resultingplant compositional variation (Hou 1983). Over a prolonged period, alarge body of plant nutrient data has been accumulated in China.These data were obtained for leaves of nearly 2000 plant speciesacross China (Fig. S1), coupled with information on location, climateand soil nutrients, involving concentrations of 11 mineral elements[N, P, potassium (K), Mg, Ca, sulphur (S), silicon (Si), Fe, sodium(Na), Mn and Al].
Herein, we first explore the biogeographic patterns of multipleelements in plants at the national scale; and whether and how theseelements show similar or differential heterogeneity among plantfunctional groups and sensitivity to environmental factors (e.g. climateand soil nutrient availability). We then investigate variations in theseelements and their possible differential responses to the environmen-tal factors. We hypothesise that nutrients required in higherconcentrations in leaves and considered most frequently limiting innature should show smaller variations in their concentration and lowersensitivity along environmental gradients than the elements at theopposite end of the spectra (Stability of Limiting Elements Hypoth-esis). We examine the hypothesis by analysing the variation in the11 plant minerals and their responses to the gradients of climate andsoils.
MATERIAL AND METHODS
Concentrations of 11 plant leaf minerals
The concentrations of 11 leaf minerals (N, P, K, Ca, Mg, S, Si, Fe, Na,Mn and Al) in 1900 higher terrestrial plant species, belonging to 788genera and 175 families, at 752 sites across China, were obtained fromour field measurements and published literature (Fig. S1; see alsoData S1 for details). In total, 4796 records on the whole, or about2392 observations for each mineral on average, are involved in thedataset. The leaves for mineral analyses in this dataset were sampledduring the growing season (June to September, mostly July andAugust). Site-related information, including the longitudes, latitudes,climate and soil mineral background values, were also documented inthe dataset.
Climatic variables, soil data and functional types
Geographic patterns of leaf minerals may be related to climaticvariables, including temperature, precipitation, length of growthseason and climatic variability (Reich & Oleksyn 2004). In this study,five climatic variables were employed to analyse the climatic controlson leaf mineral spatial patterns: mean annual temperature (MAT, "C),mean annual precipitation (MAP, mm), growing season length (GSL,days), and average diurnal range of temperature (DRT, "C) and annualprecipitation seasonality (coefficient of variation of monthly meanprecipitations) (APS, %).
For sites where MAT ⁄ MAP and latitude ⁄ longitude were recorded,these values were used for the analyses. For the records lackingdetailed geographic coordinates, we used the latitude ⁄ longitude ofthe geographical centre of the sample areas. For the sites where
MAT ⁄ MAP were not recorded, estimates of MAT ⁄ MAP wereextracted from a global climate dataset with a resolution of0.0083 · 0.0083 (ca. 1 km · 1 km) obtained from http://www.worldclim.org/. GSL was defined as the number of days with diurnalmean temperature > 5 "C, and together with DRT and APS, wasestimated with records of 740 climatic stations in China (during 1950–1999) using a Kriging extrapolation method.
Soil N, P and K data were obtained from the national soil surveyand our field measurements; other soil minerals were from anothernational soil survey, except that soil S data cover only part of thecountry and were collected from several separate studies (fordetails, see Fig. S2 and the corresponding Supplementary refer-ences).
All species in the dataset were primarily classified into seed plantsand ferns; seed plants were further divided into six groups accordingto their respective functional types. The four woody plant groups aredeciduous broadleaves, deciduous conifers, evergreen broadleaves andevergreen conifers; the herbaceous groups are grasses (families ofCyperaceae and Gramineae) and forbs (all others).
Indices of physiological requirement and relative limitation
Both physiological (Ingestad 1997) and ecological (Sterner & Elser2002) stoichiometry should increasingly constrain variability aselemental relative supply limitations grow and requirements increase.To explore such a trend, we used an index of physiologicalconcentration requirement (following Marschner 1995; also seesupplementary Appendix S1). We use this without implying that theabsolute values hold for all taxa and all conditions, but insteadproposing that the index is useful because it provides a relativemeasure of general physiological requirement. We also used a rankingof the elements (index of relative limitation) from those consideredmost (1) to least (8) frequently limiting in terrestrial plants(N > P > K > Ca > Mg > S > Fe > Mn). This relative limitationorder differs from the rank order by requirement only in that P ismoved ahead of K and Ca. We developed this ranking based on oursynthesis of information from various sources (e.g. Marschner 1995;Jobbagy & Jackson 2001; White & Brown 2010; Townsend et al.2011). Because this ranking is somewhat subjective, we developed twoother rankings for comparison: (1) searching the number of fertiliserstudies by individual elements as well as the relative amount offertiliser consumption, and (2) using total soil contents of theseelements as an indicator of soil supply potential (see supplementaryAppendix S1 for details). Both the indices (of physiologicalrequirement and of relative limitation) are limited to the eightelements known to have specific physiological requirementsand whose limitations in soils are best understood. Results shownherein are similar if rank order of some elements is reversed, so theconclusions are not dependent on either choice of or the absoluteaccuracy of the rank order. The coefficient of variation (CV) wascalculated for each element as the metric for the variation in chemicalconcentration.
Data analysis
All leaf mineral concentrations were log10-transformed before analysesto improve the data normality. The leaf mineral concentrations wereaveraged at the species or species-by-site (site-species) level in thesame way as Han et al. (2005). As carbon concentration is relatively
Letter Biogeography and variability of leaf chemistry 789
! 2011 Blackwell Publishing Ltd/CNRS

stable, we use elemental concentrations as our index of stoichiometryrelative to carbon.
Stepwise multiple regressions were applied to identify the mostinfluential climatic variables among the five climate variables (MAP,MAT, GSL, APS and DRT). To explore the possible effects of soilson leaf minerals, Spearman!s rank correlations were performedbetween leaf minerals and the corresponding soil mineral backgroundcontents at the national scale; Student–Newman–Keuls (S–N–K)post hoc tests were then employed to compare the leaf mineralconcentrations among plants growing in soils with different soilmineral levels for each single element. To demonstrate the relativeeffects of climate, soil and species composition (functional type),partial general linear model (GLM) analyses were applied. PartialGLM separates the variance explained by different factors into theindependent effects of each individual factor and interactive effectsbetween factors.
Considering that global scale modelling and understanding ofvegetation function is confined to functional type groups (e.g.Woodward 1987), it is important to analyse the data at this level ofclassification and given the study goals it is also a useful attempt toassess the indirect effect of climate on plant nutrient status throughclimate impacts on the distribution of functional types. For suchpurposes, we analysed how leaf chemistry responds to climate and soilchemistry by functional type. Because the reduced major axis (RMA)regression slopes of the relationship between leaf chemical concen-tration and temperature, precipitation and soil chemistry can be usedto indicate the response of leaf chemistry to variation in climate andsoil chemistry (Sokal & Rohlf 1995), we calculated these slopes for allthe 11 elements for five functional types (deciduous broadleaf,evergreen broadleaf, evergreen conifer, grass, and forb) but not fordeciduous conifers and ferns due to their small sample sizes. PositiveRMA slopes at the functional-type level indicate increases in chemicalconcentration with increasing temperature, precipitation or soilelemental content level, and vice versa. RMA slopes for the threevariables (temperature, precipitation, and soil) were transformed toeliminate effects of the different unit of MAT, MAP and soil nutrientlevel (For full details, see supplementary Appendix S1).
All analyses were conducted with statistical software SPSS 13.0 (SPSSInc., Chicago, IL, USA, 2004) and R 2.2.1 (R Development CoreTeam, 2005). For full details, supplementary Appendix S1.
RESULTS
Statistics and biogeographic patterns of leaf minerals
The mean concentrations of the 11 leaf minerals in China!s plants varygreatly – from 0.11 mg g)1 (or 0.002 mol kg)1) for Mn to20.5 mg g)1 (or 1.463 mol kg)1) for N (Fig. 1 and Table S1), withratios of N : P : K : Ca : Mg : S : Si : Fe : Na : Mn : Al = 100 :6.8 : 50 : 43 : 11 : 7.7 : 19 : 1.4 : 7.0 : 0.54 : 2.2. These are generallywithin the normal range for healthy growth of plants (Marschner1995; Epstein & Bloom 2004) [for the ratios, also see Knecht &Goransson (2004) and Watanabe et al. (2007)].
These leaf minerals show significant latitudinal trends (in the unit ofkilometres, see supplementary Appendix S1 for full details)(P < 0.001; Fig. S3a): Nine minerals (N, P, K, Ca, Mg, S, Si, Fe,and Na) increase from south to north, whereas Mn and Al display anopposite trend. Similar to the latitudinal patterns, longitudinal (west-to-east) gradients also exhibit a decrease from west to east for all theminerals but Mn (P < 0.001 for all but except Al with P = 0.43)(Fig. S3b).
Climatic influence on leaf minerals
Temperature and precipitation are the two most critical climaticvariables that shape vegetation distribution and structure (Woodward1987; Brown & Lomolino 1998), but there are a number of ways theycan be presented, including both the means and variability at annualand growing season scales (Reich & Oleksyn 2004). Considering thesignificant correlations among climatic variables (Table S2), we firstquantify the role of MAT and MAP in shaping the biogeographicpatterns of leaf minerals and then incorporate other climatic variablesinto the analysis.
We found that all leaf minerals were significantly correlated withboth MAT and MAP (all P < 0.01; models 1 and 2 in Table S3;Fig. 2a, b). On average, MAP and MAT explained 10% and 6% oftotal variation in the 11 elements, respectively. When both climaticvariables were entered into a stepwise multiple regression (SMR), witheach of the leaf minerals as the dependent variable, MAP playeda significant role for all elements except P and Al, whereas MAT hadno significant influence on Mg, Si, Fe and Mn (i.e. MAT was removedfrom SMR; P > 0.10), or explained much less of the variance than
25
15
10
5
0
0.4
N K Mg
20
0.2
0.0
Ca Si
Con
cent
ratio
n (g
kg–1
)
1.5
1.2
0.9
0.6
0.3
0.0
Atom
number (m
ol kg–1)
S Na FeP A l MnLeaf mineral
1137
11401227
681678 733 819 1475 678 1161 1060
0.6
0.015
Al
0.010
0.005
0.000
0.020
Fe Mn
Mass
Atom
Figure 1 The average concentration of 11 leaf minerals (N, P, K,
Ca, Mg, S, Si, Fe, Na, Mn and Al) in China!s plants. Green bars
and blue solid circles are the geometric means on mass and atom
basis, respectively; and the whisker and number on each bar
denote geometric standard error and species number.
790 W. X. Han et al. Letter
! 2011 Blackwell Publishing Ltd/CNRS
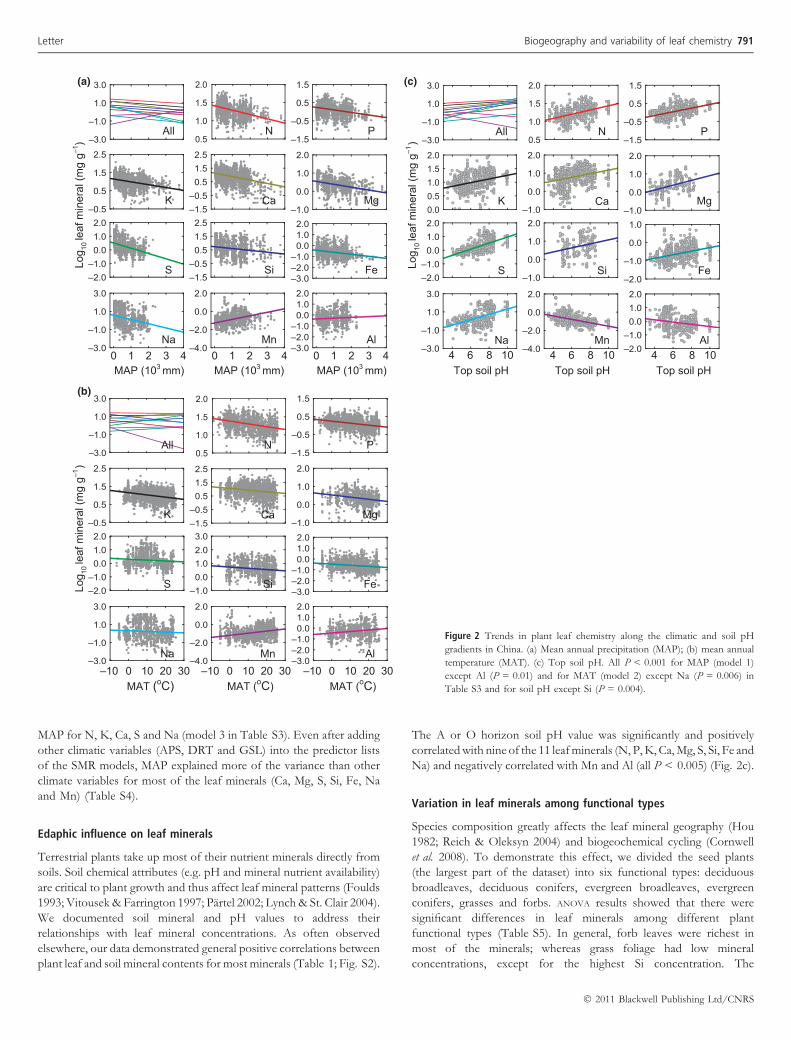
MAP for N, K, Ca, S and Na (model 3 in Table S3). Even after addingother climatic variables (APS, DRT and GSL) into the predictor listsof the SMR models, MAP explained more of the variance than otherclimate variables for most of the leaf minerals (Ca, Mg, S, Si, Fe, Naand Mn) (Table S4).
Edaphic influence on leaf minerals
Terrestrial plants take up most of their nutrient minerals directly fromsoils. Soil chemical attributes (e.g. pH and mineral nutrient availability)are critical to plant growth and thus affect leaf mineral patterns (Foulds1993; Vitousek & Farrington 1997; Partel 2002; Lynch & St. Clair 2004).We documented soil mineral and pH values to address theirrelationships with leaf mineral concentrations. As often observedelsewhere, our data demonstrated general positive correlations betweenplant leaf and soil mineral contents for most minerals (Table 1; Fig. S2).
The A or O horizon soil pH value was significantly and positivelycorrelated with nine of the 11 leaf minerals (N, P, K, Ca, Mg, S, Si, Fe andNa) and negatively correlated with Mn and Al (all P < 0.005) (Fig. 2c).
Variation in leaf minerals among functional types
Species composition greatly affects the leaf mineral geography (Hou1982; Reich & Oleksyn 2004) and biogeochemical cycling (Cornwellet al. 2008). To demonstrate this effect, we divided the seed plants(the largest part of the dataset) into six functional types: deciduousbroadleaves, deciduous conifers, evergreen broadleaves, evergreenconifers, grasses and forbs. ANOVA results showed that there weresignificant differences in leaf minerals among different plantfunctional types (Table S5). In general, forb leaves were richest inmost of the minerals; whereas grass foliage had low mineralconcentrations, except for the highest Si concentration. The
–3.0
–1.0
1.0
3.0
–1.5–0.5
0.51.52.5
Ca –0.5
0.5
1.5
2.5
0.5
1.0
1.5
2.0
–1.5
–0.5
0.5
1.5
–2.0–1.0
0.01.02.0
–1.5–0.5
0.51.52.5
–3.0–2.0–1.0
0.01.02.0
Log 10
leaf
min
eral
(mg
g–1)
–3.0
–1.0
1.0
3.0
–4.0
–2.0
0.0
2.0
–3.0–2.0–1.0
0.01.02.0
MAP (103 mm)
–1.0
0.0
1.0
2.0
Mg
S Si
N P
K
Mn Al
Fe
Na
All
0 1 2 3 4 0 1 2 3 4 0 1 2 3 4MAP (103 mm) MAP (103 mm)
–1.0
0.0
1.0
2.0
–1.5–0.5
0.51.52.5
Log 10
leaf
min
eral
(mg
g–1)
MAT (oC)MAT (oC) MAT (oC)
–0.5
0.5
1.5
2.5
0.5
1.0
1.5
2.0
–1.5
–0.5
0.5
1.5
–2.0–1.0
0.01.02.0
–1.00.01.02.03.0
–3.0–2.0–1.0
0.01.02.0
–3.0
–1.0
1.0
3.0
–4.0
–2.0
0.0
2.0
–3.0–2.0–1.0
0.01.02.0
–3.0
–1.0
1.0
3.0
–10 300 10 20 –10 300 10 20 –10 300 10 20
Ca Mg
S Si
N P
K
Mn Al
Fe
Na
All
–3.0
–1.0
1.0
3.0
0.00.51.01.52.0
0.5
1.0
1.5
2.0
–1.5
–0.5
0.5
1.5
–1.0
0.0
1.0
2.0
–1.0
0.0
1.0
2.0
–2.0–1.0
0.01.02.0
–1.0
0.0
1.0
2.0
–2.0
–1.0
0.0
1.0
–3.0
–1.0
1.0
3.0
–4.0
–2.0
0.0
2.0
–2.0–1.0
0.01.02.0
Top soil pH Top soil pH Top soil pH 4 6 8 10
Log 10
leaf
min
eral
(mg
g–1)
Ca Mg
S Si
N P
K
Mn Al
Fe
Na
All
4 6 8 10 4 6 8 10
(a)
(b)
(c)
Figure 2 Trends in plant leaf chemistry along the climatic and soil pH
gradients in China. (a) Mean annual precipitation (MAP); (b) mean annual
temperature (MAT). (c) Top soil pH. All P < 0.001 for MAP (model 1)
except Al (P = 0.01) and for MAT (model 2) except Na (P = 0.006) in
Table S3 and for soil pH except Si (P = 0.004).
Letter Biogeography and variability of leaf chemistry 791
! 2011 Blackwell Publishing Ltd/CNRS
deciduous angiosperms (with short leaf life-span) had generallymineral-rich (except for Mn and Al) leaves in contrast with theevergreen ones; while conifers were lower in most of the leafminerals, compared with the broadleaved counterparts (see Table S5for details).
Differences in stability and sensitivity of limiting elements
The relative variability (or stability) of the 11 mineral concentrationscan be demonstrated by their coefficient of variation (CV, %): the CVsincrease from 41, 67, 77, 81, 94, 126, 159, 175, 188, 266 to 479 for N,P, K, Mg, Ca, Si, Fe, S, Al, Na and Mn, respectively (Table S1).A similar pattern of CV still holds for the functional-type averagedconcentration of each element: from 29, 36, 38, 39, 44, 53, 60, 60, 63,85 to 101 (%) for N, P, K, Mg, Fe, Ca, Al, Si, S, Mn and Na, despitethe small sample size (n = 7, fern and six seed-plant groups). The CV
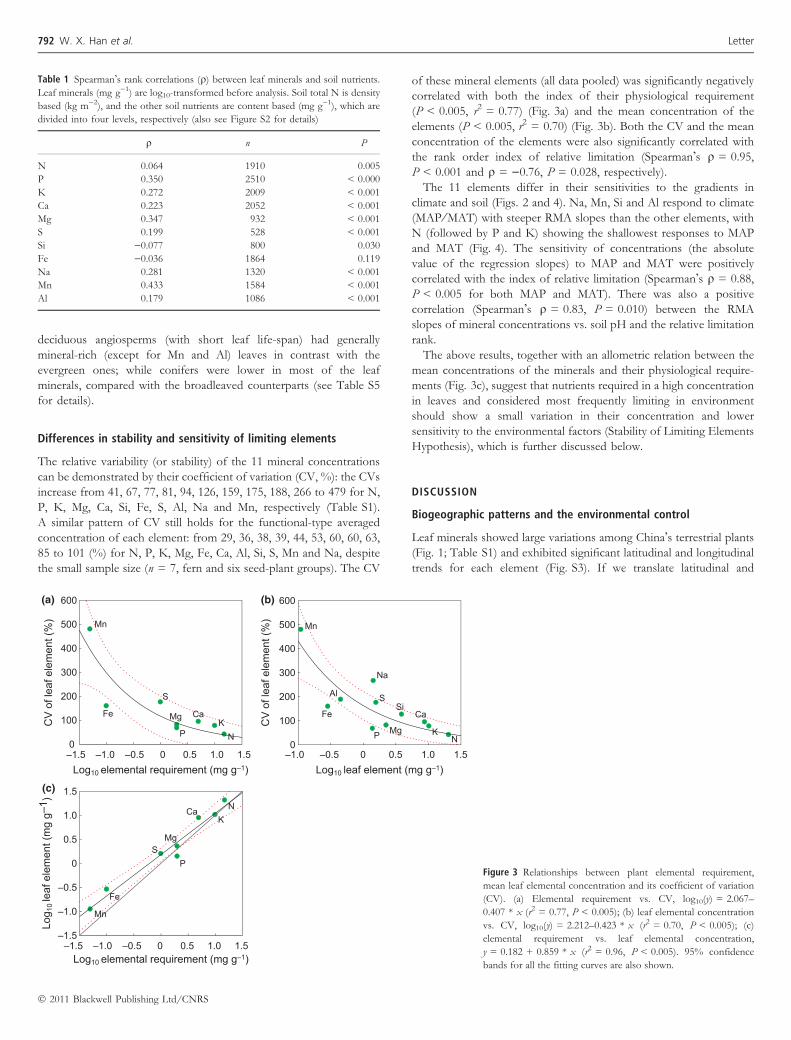
of these mineral elements (all data pooled) was significantly negativelycorrelated with both the index of their physiological requirement(P < 0.005, r2 = 0.77) (Fig. 3a) and the mean concentration of theelements (P < 0.005, r2 = 0.70) (Fig. 3b). Both the CV and the meanconcentration of the elements were also significantly correlated withthe rank order index of relative limitation (Spearman!s q = 0.95,P < 0.001 and q = )0.76, P = 0.028, respectively).
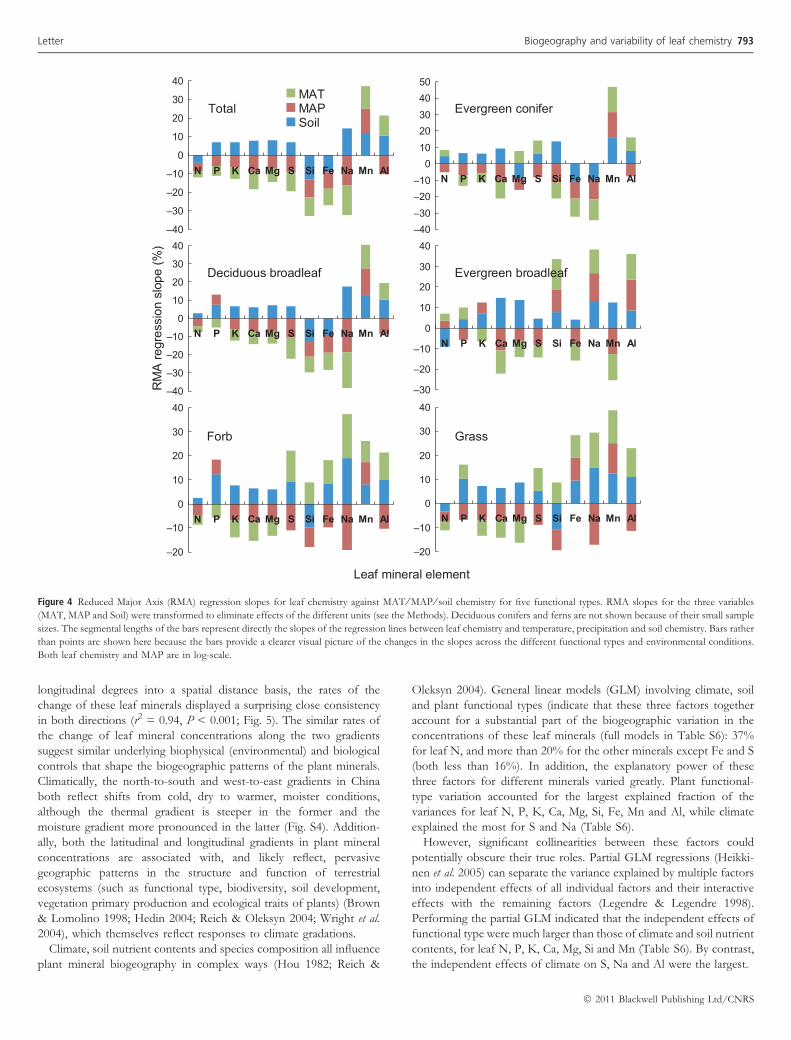
The 11 elements differ in their sensitivities to the gradients inclimate and soil (Figs. 2 and 4). Na, Mn, Si and Al respond to climate(MAP ⁄ MAT) with steeper RMA slopes than the other elements, withN (followed by P and K) showing the shallowest responses to MAPand MAT (Fig. 4). The sensitivity of concentrations (the absolutevalue of the regression slopes) to MAP and MAT were positivelycorrelated with the index of relative limitation (Spearman!s q = 0.88,P < 0.005 for both MAP and MAT). There was also a positivecorrelation (Spearman!s q = 0.83, P = 0.010) between the RMAslopes of mineral concentrations vs. soil pH and the relative limitationrank.
The above results, together with an allometric relation between themean concentrations of the minerals and their physiological require-ments (Fig. 3c), suggest that nutrients required in a high concentrationin leaves and considered most frequently limiting in environmentshould show a small variation in their concentration and lowersensitivity to the environmental factors (Stability of Limiting ElementsHypothesis), which is further discussed below.
DISCUSSION
Biogeographic patterns and the environmental control
Leaf minerals showed large variations among China!s terrestrial plants(Fig. 1; Table S1) and exhibited significant latitudinal and longitudinaltrends for each element (Fig. S3). If we translate latitudinal and
Table 1 Spearman!s rank correlations (q) between leaf minerals and soil nutrients.
Leaf minerals (mg g)1) are log10-transformed before analysis. Soil total N is density
based (kg m)2), and the other soil nutrients are content based (mg g)1), which are
divided into four levels, respectively (also see Figure S2 for details)
q n P
N 0.064 1910 0.005
P 0.350 2510 < 0.000
K 0.272 2009 < 0.001
Ca 0.223 2052 < 0.001
Mg 0.347 932 < 0.001
S 0.199 528 < 0.001
Si )0.077 800 0.030
Fe )0.036 1864 0.119
Na 0.281 1320 < 0.001
Mn 0.433 1584 < 0.001
Al 0.179 1086 < 0.001
Log10 elemental requirement (mg g–1)
–1.5 –1.0 –0.5 0 0.5 1.0 1.5
Log 1
0 le
af e
lem
ent (
mg
g–1 )
–1.5
–1.0
–0.5
0
0.5
1.0
1.5N
P
K
Mg
Ca
Fe
S
Mn
Log10 elemental requirement (mg g–1)
–1.5 –1.0 –0.5 0 0.5 1.0 1.5
CV
of l
eaf e
lem
ent (
%)
0
100
200
300
400
500
600
Mn
S
Fe CaMgK
P N
Log10 leaf element (mg g–1)–1.0 –0.5 0 0.5 1.0 1.5
CV
of l
eaf e
lem
ent (
%)
0
100
200
300
400
500
600
Mn
Na
Al S
FeSi
Ca
Mg KP N
(a) (b)
(c)
Figure 3 Relationships between plant elemental requirement,
mean leaf elemental concentration and its coefficient of variation
(CV). (a) Elemental requirement vs. CV, log10(y) = 2.067–
0.407 * x (r2 = 0.77, P < 0.005); (b) leaf elemental concentration
vs. CV, log10(y) = 2.212–0.423 * x (r2 = 0.70, P < 0.005); (c)
elemental requirement vs. leaf elemental concentration,
y = 0.182 + 0.859 * x (r2 = 0.96, P < 0.005). 95% confidence
bands for all the fitting curves are also shown.
792 W. X. Han et al. Letter
! 2011 Blackwell Publishing Ltd/CNRS
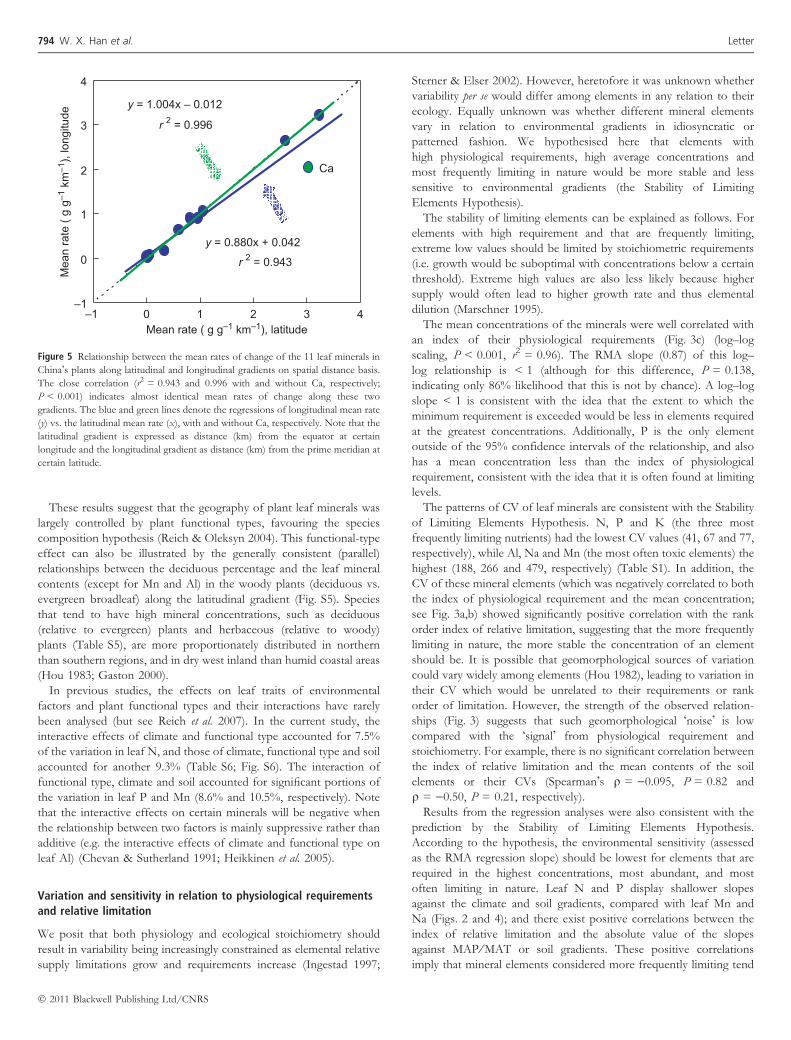
longitudinal degrees into a spatial distance basis, the rates of thechange of these leaf minerals displayed a surprising close consistencyin both directions (r2 = 0.94, P < 0.001; Fig. 5). The similar rates ofthe change of leaf mineral concentrations along the two gradientssuggest similar underlying biophysical (environmental) and biologicalcontrols that shape the biogeographic patterns of the plant minerals.Climatically, the north-to-south and west-to-east gradients in Chinaboth reflect shifts from cold, dry to warmer, moister conditions,although the thermal gradient is steeper in the former and themoisture gradient more pronounced in the latter (Fig. S4). Addition-ally, both the latitudinal and longitudinal gradients in plant mineralconcentrations are associated with, and likely reflect, pervasivegeographic patterns in the structure and function of terrestrialecosystems (such as functional type, biodiversity, soil development,vegetation primary production and ecological traits of plants) (Brown& Lomolino 1998; Hedin 2004; Reich & Oleksyn 2004; Wright et al.2004), which themselves reflect responses to climate gradations.
Climate, soil nutrient contents and species composition all influenceplant mineral biogeography in complex ways (Hou 1982; Reich &
Oleksyn 2004). General linear models (GLM) involving climate, soiland plant functional types (indicate that these three factors togetheraccount for a substantial part of the biogeographic variation in theconcentrations of these leaf minerals (full models in Table S6): 37%for leaf N, and more than 20% for the other minerals except Fe and S(both less than 16%). In addition, the explanatory power of thesethree factors for different minerals varied greatly. Plant functional-type variation accounted for the largest explained fraction of thevariances for leaf N, P, K, Ca, Mg, Si, Fe, Mn and Al, while climateexplained the most for S and Na (Table S6).
However, significant collinearities between these factors couldpotentially obscure their true roles. Partial GLM regressions (Heikki-nen et al. 2005) can separate the variance explained by multiple factorsinto independent effects of all individual factors and their interactiveeffects with the remaining factors (Legendre & Legendre 1998).Performing the partial GLM indicated that the independent effects offunctional type were much larger than those of climate and soil nutrientcontents, for leaf N, P, K, Ca, Mg, Si and Mn (Table S6). By contrast,the independent effects of climate on S, Na and Al were the largest.
Leaf mineral element
RM
A re
gres
sion
slo
pe (%
)
–40
–30
–20
–10
0
10
20
30
40
N P K Ca Mg S Si Fe Na Mn Al
–40
–30
–20
–10
0
10
20
30
40
N P K Ca Mg S Si Fe Na Mn Al
–40–30–20–10
01020304050
N P K Ca Mg S Si Fe Na Mn Al
–20
–10
0
10
20
30
40
N P K Ca Mg S Si Fe Na Mn Al
–30
–20
–10
0
10
20
30
40
N P K Ca Mg S Si Fe Na Mn Al
–20
–10
0
10
20
30
40
N P K Ca Mg S Si Fe Na Mn Al
Evergreen conifer MAT MAP Soil
Total
Evergreen broadleaf Deciduous broadleaf
ssarGbroF
Figure 4 Reduced Major Axis (RMA) regression slopes for leaf chemistry against MAT ⁄ MAP ⁄ soil chemistry for five functional types. RMA slopes for the three variables
(MAT, MAP and Soil) were transformed to eliminate effects of the different units (see the Methods). Deciduous conifers and ferns are not shown because of their small sample
sizes. The segmental lengths of the bars represent directly the slopes of the regression lines between leaf chemistry and temperature, precipitation and soil chemistry. Bars rather
than points are shown here because the bars provide a clearer visual picture of the changes in the slopes across the different functional types and environmental conditions.
Both leaf chemistry and MAP are in log-scale.
Letter Biogeography and variability of leaf chemistry 793
! 2011 Blackwell Publishing Ltd/CNRS
These results suggest that the geography of plant leaf minerals waslargely controlled by plant functional types, favouring the speciescomposition hypothesis (Reich & Oleksyn 2004). This functional-typeeffect can also be illustrated by the generally consistent (parallel)relationships between the deciduous percentage and the leaf mineralcontents (except for Mn and Al) in the woody plants (deciduous vs.evergreen broadleaf) along the latitudinal gradient (Fig. S5). Speciesthat tend to have high mineral concentrations, such as deciduous(relative to evergreen) plants and herbaceous (relative to woody)plants (Table S5), are more proportionately distributed in northernthan southern regions, and in dry west inland than humid coastal areas(Hou 1983; Gaston 2000).
In previous studies, the effects on leaf traits of environmentalfactors and plant functional types and their interactions have rarelybeen analysed (but see Reich et al. 2007). In the current study, theinteractive effects of climate and functional type accounted for 7.5%of the variation in leaf N, and those of climate, functional type and soilaccounted for another 9.3% (Table S6; Fig. S6). The interaction offunctional type, climate and soil accounted for significant portions ofthe variation in leaf P and Mn (8.6% and 10.5%, respectively). Notethat the interactive effects on certain minerals will be negative whenthe relationship between two factors is mainly suppressive rather thanadditive (e.g. the interactive effects of climate and functional type onleaf Al) (Chevan & Sutherland 1991; Heikkinen et al. 2005).
Variation and sensitivity in relation to physiological requirementsand relative limitation
We posit that both physiology and ecological stoichiometry shouldresult in variability being increasingly constrained as elemental relativesupply limitations grow and requirements increase (Ingestad 1997;
Sterner & Elser 2002). However, heretofore it was unknown whethervariability per se would differ among elements in any relation to theirecology. Equally unknown was whether different mineral elementsvary in relation to environmental gradients in idiosyncratic orpatterned fashion. We hypothesised here that elements withhigh physiological requirements, high average concentrations andmost frequently limiting in nature would be more stable and lesssensitive to environmental gradients (the Stability of LimitingElements Hypothesis).
The stability of limiting elements can be explained as follows. Forelements with high requirement and that are frequently limiting,extreme low values should be limited by stoichiometric requirements(i.e. growth would be suboptimal with concentrations below a certainthreshold). Extreme high values are also less likely because highersupply would often lead to higher growth rate and thus elementaldilution (Marschner 1995).
The mean concentrations of the minerals were well correlated withan index of their physiological requirements (Fig. 3c) (log–logscaling, P < 0.001, r2 = 0.96). The RMA slope (0.87) of this log–log relationship is < 1 (although for this difference, P = 0.138,indicating only 86% likelihood that this is not by chance). A log–logslope < 1 is consistent with the idea that the extent to which theminimum requirement is exceeded would be less in elements requiredat the greatest concentrations. Additionally, P is the only elementoutside of the 95% confidence intervals of the relationship, and alsohas a mean concentration less than the index of physiologicalrequirement, consistent with the idea that it is often found at limitinglevels.
The patterns of CV of leaf minerals are consistent with the Stabilityof Limiting Elements Hypothesis. N, P and K (the three mostfrequently limiting nutrients) had the lowest CV values (41, 67 and 77,respectively), while Al, Na and Mn (the most often toxic elements) thehighest (188, 266 and 479, respectively) (Table S1). In addition, theCV of these mineral elements (which was negatively correlated to boththe index of physiological requirement and the mean concentration;see Fig. 3a,b) showed significantly positive correlation with the rankorder index of relative limitation, suggesting that the more frequentlylimiting in nature, the more stable the concentration of an elementshould be. It is possible that geomorphological sources of variationcould vary widely among elements (Hou 1982), leading to variation intheir CV which would be unrelated to their requirements or rankorder of limitation. However, the strength of the observed relation-ships (Fig. 3) suggests that such geomorphological "noise! is lowcompared with the "signal! from physiological requirement andstoichiometry. For example, there is no significant correlation betweenthe index of relative limitation and the mean contents of the soilelements or their CVs (Spearman!s q = )0.095, P = 0.82 andq = )0.50, P = 0.21, respectively).
Results from the regression analyses were also consistent with theprediction by the Stability of Limiting Elements Hypothesis.According to the hypothesis, the environmental sensitivity (assessedas the RMA regression slope) should be lowest for elements that arerequired in the highest concentrations, most abundant, and mostoften limiting in nature. Leaf N and P display shallower slopesagainst the climate and soil gradients, compared with leaf Mn andNa (Figs. 2 and 4); and there exist positive correlations between theindex of relative limitation and the absolute value of the slopesagainst MAP ⁄ MAT or soil gradients. These positive correlationsimply that mineral elements considered more frequently limiting tend
–1–1
0
0
1
1
2
2
3
3
4
4
y = 1.004x – 0.012
r 2 = 0.996
r 2 = 0.943y = 0.880x + 0.042
Mean rate ( g g–1 km–1), latitude
Ca
Mea
nra
te(g
g–1km
–1),
long
itude
Figure 5 Relationship between the mean rates of change of the 11 leaf minerals in
China!s plants along latitudinal and longitudinal gradients on spatial distance basis.
The close correlation (r2 = 0.943 and 0.996 with and without Ca, respectively;
P < 0.001) indicates almost identical mean rates of change along these two
gradients. The blue and green lines denote the regressions of longitudinal mean rate
(y) vs. the latitudinal mean rate (x), with and without Ca, respectively. Note that the
latitudinal gradient is expressed as distance (km) from the equator at certain
longitude and the longitudinal gradient as distance (km) from the prime meridian at
certain latitude.
794 W. X. Han et al. Letter
! 2011 Blackwell Publishing Ltd/CNRS

to vary less across the climate (e.g. precipitation) or soil (e.g. pH)gradients.
Implications of mineral variation across functional types
The RMA analyses indicated some similarity of overall functional typeresponses to MAP, MAT and soil nutrient concentration, but alsoconsiderable variation (Fig. 4). The analysis by functional typeindicates that grasses and forbs respond in a similar fashion toMAP, MAT and soil nutrients. However, the tree functional typesdiffer in all of these aspects, with evergreen broadleaf trees the mostdivergent. Therefore, if gradient analyses are any indication, futurechanges in climate will exert idiosyncratic effects on plant functionaltypes, as well as modifying nutrient biogeography by altering spatialpatterns of composition. Recent experimental imposition of warming,and reduced precipitation, on Mediterranean vegetation (Penuelaset al. 2008; Sardans et al. 2009) led to species-specific differences in theresponse of a range of plant macro- and micro-nutrients. Thosespecies that showed the greatest change in nutrients were also mostaffected in terms of growth.
CONCLUSION
Our study is, to our knowledge, the first to comprehensivelydocument the foliar chemistry of multiple mineral elements andquantify the potential controls and variability at a large scale. Of thethree major factors considered to influence the biogeographicdistribution, functional type shows the greatest direct influence formost leaf minerals. However, climate and soil are both directly andindirectly influential, as they contribute substantially to shaping thedistribution of vegetation (species composition) (Brown & Lomolino1998; Chapin et al. 2002) (Fig. S7). In addition, we found thatvariation in elemental concentrations was more constrained (morestable and less sensitive to the environment) for nutrients with highestrequirements, generally present in the highest concentrations andconsidered the generally most limiting to plant growth (the Stability ofLimiting Elements Hypothesis).
Our findings broaden the knowledge of the biogeochemical cyclingof elements through plants and the fundamental constraints on plantstoichiometry across wide gradients of environmental factors. Theyalso provide a beginning of synthetic data compilation and analysesthat will eventually make it possible to better parameterise complexmulti-element biogeochemical models, that should be developed inthe future (Hedin 2004; Wright et al. 2004; Lambers et al. 2008).As nutrients with highest requirements and most limiting in naturealso are globally concentrated in shallower soil horizons (Jobbagy &Jackson 2001), it appears that physiological requirements in conjunc-tion with biogeochemical availability influence elemental distributionspatially in soils and biogeographically across climate gradients, as wellas constraining general levels of variability. Other signatures of relativerequirements and availability of elements likely remain to bediscovered at local to global scales.
ACKNOWLEDGMENTS
We thank Y. Zhang, Y.H. Chen, J. S. He, L. Y. Tang and L. P. Li fromPeking University, M. L. Huang, A. H. Tang and X. J. Liu from ChinaAgriculture University, X. L. Di and W. Lin from Beijing ForestryUniversity, J. P. Cui from Beijing Botanical Garden and Y. D. Li from
Hainan Station of Chinese Academy of Forest Sciences, for assistingdata collection and field sampling and measurement. The authors alsothank P. Vitousek at Stanford University and the anonymous refereesfor their valuable comments on the manuscript. The project wasfunded by National Natural Science Foundation of China (ProjectNos. 40973054, 31021001, 30821003), the National Basic ResearchProgram of China on Global Change (2010CB50600), the U.S.National Science Foundation LTER Program (DEB-0080382) and theUniversity of Minnesota Institute on the Environment.
REFERENCES
Aerts, R. & Chapin, F.S. III (2000). The mineral nutrition of wild plants revisited: a
re-evaluation of processes and patterns. Adv. Ecol. Res., 30, 1–67.
Agren, G.I. (2008). Stoichiometry and nutrition of plant growth in natural com-
munities. Ann. Rev. Ecol. Evol. Syst., 39, 153–170.
Barron, A.R., Wurzburger, N., Bellenger, J.P., Wright, S.J. & Hedin, L.O. (2009).
Molybdenum limitation of asymbiotic nitrogen fixation in tropical forest soils.
Nat. Geosci., 2, 42–45.
Brown, J.H. & Lomolino, M.V. (1998). Biogeography. Sinauer Associates, Sunderland,
MA.
Chapin, F.S. III, Matson, P.A. & Mooney, H.A. (2002). Principles of Terrestrial Eco-
system Ecology. Springer-Verlag, New York, NY.
Chevan, A. & Sutherland, M. (1991). Hierarchical partitioning. The American Statis-
tician, 45, 90–96.
Cornwell, W.K., Cornelissen, J.H.C., Amatangelo, K., Dorrepaal, E., Eviner,
V.T., Godoy, O. et al. (2008). Plant species traits are the predominant control
on litter decomposition rates within biomes worldwide. Ecol. Lett., 11, 1065–
1071.
Elser, J.J., Borer, E.T., Bracken, M.E., Cleland, E.E., Gruner, D.S., Harpole, W.S.
et al. (2007). Global analysis of nitrogen and phosphorus limitation of primary
producers in freshwater, marine and terrestrial ecosystems. Ecol. Lett., 10, 1135–
1142.
Epstein, E. & Bloom, A.J. (2004). Mineral Nutrition of Plants: Principles and Perspectives.
2nd edn Sinauer Associates, Sunderland, MA.
Fang, J.Y., Song, Y.C., Liu, H.Y. & Piao, S.L. (2002). Vegetation-climate relation-
ship and its application in the division of vegetation zone in China. Acta Bot. Sin.,
44, 1105–1122.
Foulds, W. (1993). Nutrient concentrations of foliage and soil in south-western
Australia. New Phytol., 125, 529–546.
Gaston, K.J. (2000). Global patterns in biodiversity. Nature, 405, 220–227.
Han, W.X., Fang, J.Y., Guo, D.L. & Zhang, Y. (2005). Leaf nitrogen and phos-
phorus stoichiometry across 753 terrestrial plant species in China. New Phytol.,
168, 377–385.
Hedin, L.O. (2004). Global organization of terrestrial plant-nutrient interactions.
Proc. Nat. Acad. Sci. USA, 101, 10849–10850.
Heikkinen, R.K., Luoto, M., Kuussaari, M. & Poyry, J. (2005). New insights into
butterfly-environment relationships using partitioning methods. Proc. Royal Soc.
(B), 272, 2203–2210.
Hou, H.Y. (1982). The Vegetation Geography of China with Reference to the Chemical
Composition of Dominant Plants. Science Press, Beijing.
Hou, H.Y. (1983). Vegetation of China with reference to its geographical distri-
bution. Ann. Mo. Bot. Gard., 70, 509–549.
Hungate, B.A., Stiling, P.D., Dijkstra, P., Johnson, D.W., Ketterer, M.E., Hymus,
G.J. et al. (2004). CO2 elicits long-term decline in nitrogen fixation. Science, 304,
1291.
Ingestad, T. (1997). A shift of paradigm is needed in plant science. Physiol. Plant.,
101, 446–450.
Jobbagy, E.G. & Jackson, R.B. (2001). The distribution of soil nutrients with depth:
global patterns and the imprint of plants. Biogeochemistry, 53, 51–77.
Kaspari, M., Garcia, M.N., Harms, K.E., Santana, M., Wright, S.J. & Yavitt, J.B.
(2008). Multiple nutrients limit litterfall and decomposition in a tropical forest.
Ecol. Lett., 11, 35–43.
Knecht, M. & Goransson, A. (2004). Terrestrial plants require nutrients in similar
proportions. Tree Physiol., 24, 447–460.
Letter Biogeography and variability of leaf chemistry 795
! 2011 Blackwell Publishing Ltd/CNRS
Lambers, H., Raven, J.A., Shaver, G.R. & Smith, S.E. (2008). Plant nutrient-
acquisition strategies change with soil age. Trends Ecol. Evol., 23, 95–103.
Legendre, P. & Legendre, L. (1998). Numerical Ecology, 2nd edn. Elsevier Science
BV, Amsterdam.
Lynch, J.P. & St. Clair, S.B. (2004). Mineral stress: the missing link in understanding
how global climate change will affect plants in real world soils. Field Crops Res.,
90, 101–115.
Marschner, H. (1995). Mineral Nutrition of Higher Plants. Academic Press, New York,
NY.
Marschner, P. & Rengel, Z. (2007). Nutrient Cycling in Terrestrial Ecosystems. Springer-
Verlag, Heidelberg.
McGroddy, M.E., Daufresne, T. & Hedin, L.O. (2004). Scaling of C:N:P stoichi-
ometry in forests worldwide: implications of terrestrial redfield-type ratios.
Ecology, 85, 2390–2401.
Partel, M. (2002). Local plant diversity patterns and evolutionary history at the
regional scale. Ecology, 83, 2361–2366.
Penuelas, J., Sardans, J., Ogaya, R. & Estiarte, M. (2008). Nutrient stoichiometric
relations and biogeochemical niche in coexisting plant species: effect of simulated
climatic change. Polish J. Ecol., 56, 613–622.
R Development Core Team. (2005). R: a language and environment for statistical
computing. R Foundation for Statistical Computing, Vienna, Austria. Available
at: http://www.Rproject.org/bin/windows/base/old/2.2.1/. Last accessed
1 November 2005.
Reich, B.P. (2005). Global biogeography of plant chemistry: filling in the blanks.
New Phytol., 168, 263–266.
Reich, P.B. & Oleksyn, J. (2004). Global patterns of plant leaf N and P in relation to
temperature and latitude. Proc. Nat. Acad. Sci. USA, 101, 11001–11006.
Reich, P.B., Oleksyn, J., Modrzynski, J., Mrozinski, P., Hobbie, S.E., Eissenstat,
D.M. et al. (2005). Linking litter calcium, earthworms and soil properties: a
common garden test with 14 tree species. Ecol. Lett., 8, 811–818.
Reich, P.B., Wright, I.J. & Lusk, C.H. (2007). Predicting leaf physiology from simple
plant and climate attributes: a global GLOPNET analysis. Ecol. Appl., 17, 1982–
1988.
Sardans, J., Penuelas, J., Prieto, P. & Estiarte, M. (2009). Changes in Ca, Fe, Mg,
Mo, Na, and S content in a Mediterranean shrubland under warming and
drought. J. Geophys. Res., 113, G03039.
Sokal, R.R. & Rohlf, F.J. (1995). Biometry: The Principles and Practice of Statistics in
Biological Research, 3rd edn Freeman, New York, NY.
Sterner, R.W. & Elser, J.J. (2002). Ecological Stoichiometry: The Biology of Elements from
Molecules to the Biosphere. Princeton University Press, Princeton, NJ.
Townsend, A.R., Cleveland, C.C., Houlton, B.Z., Alden, C.B. & White, J.W.C.
(2011). Multi-element regulation of the tropical forest carbon cycle. Front. Ecol.
Environ., 9, 9–17.
Van Groenigen, K.J., Six, J., Hungate, B.A., DeGraaff, M.A., Van Breemen, N. &
Van Kessel, C. (2006). Element interactions limit soil carbon storage. Proc. Nat.
Acad. Sci. USA, 103, 6571–6574.
Vitousek, P.M. & Farrington, H. (1997). Nutrient limitation and soil development:
experimental test of a biogeochemical theory. Biogeochemistry, 37, 63–75.
Vitousek, P.M., Porder, S., Houlton, B.Z. & Chadwick, O.A. (2010). Terrestrial
phosphorus limitation: mechanisms, implications, and nitrogen-phosphorus
interactions. Ecol. Appl., 20, 5–15.
Watanabe, T., Broadley, M.R., Jansen, S., White, P.J., Takada, J., Satake, K. et al.
(2007). Evolutionary control of leaf element composition in plants. New Phytol.,
174, 516–523.
White, P.J. & Brown, P.H. (2010). Plant nutrition for sustainable development and
global health. Ann. Bot., 105, 1073–1080.
Woodward, F.I. (1987). Climate and Plant Distribution. Cambridge University Press,
Cambridge.
Wright, I.J., Reich, P.B., Westoby, M., Ackerly, D.D., Baruch, Z., Bongers, F. et al.
(2004). The worldwide leaf economics spectrum. Nature, 428, 821–827.
Zhang, X.S. (2007). Atlas of China!s Vegetation (1:100 M). Geological Publishing
House, Beijing.
SUPPORTING INFORMATION
Additional Supporting Information may be found in the onlineversion of this article:
Appendix S1 Full description of the Material and Methods.Data S1 Dataset on concentrations of 11 leaf minerals in terrestrialplants of China and associated information.Figure S1 Distribution of the samples for 11 leaf minerals in plants ofChina.Figure S2 Relationships between minerals in China!s soils and plantleaves.Figure S3 Geographic patterns of plant leaf minerals in China.Figure S4 Geographic patterns of temperature and precipitation in themainland and two large islands of China.Figure S5 Latitudinal trends in leaf minerals of deciduous vs.evergreen broadleaves.Figure S6 Variation partitioning of environmental factors in account-ing for the variations in leaf nitrogen and phosphorus concentrations.Figure S7 The schematic diagram showing the climatic controls on theleaf mineral patterns.Table S1 Leaf mineral concentrations in 1900 plant species in China.Table S2 Correlations of five climatic variables, using climate data inall sites in this study.Table S3 Linear regressions of leaf minerals on MAT and MAP.Table S4 Model summary for the stepwise multiple regression of leafminerals on five climatic variables.Table S5 Leaf minerals for different functional types of seed plants inChina.Table S6 Summary of the (partial) general linear models for the effectsof climate, plant functional type and soil nutrient contents on leafminerals.
As a service to our authors and readers, this journal providessupporting information supplied by the authors. Such materials arepeer-reviewed and may be re-organised for online delivery, but are notcopy edited or typeset. Technical support issues arising fromsupporting information (other than missing files) should be addressedto the authors.
Editor: Richard LindrothManuscript received 22 February 2011First decision made 1 April 2011Manuscript accepted 16 May 2011
796 W. X. Han et al. Letter
! 2011 Blackwell Publishing Ltd/CNRS