Embed Size (px)
Citation preview
Science for conServation 281
Biogeography, community structure and biological habitat types of subtidal reefs on the South Island West Coast, New Zealand

Biogeography, community structure and biological habitat types of subtidal reefs on the South Island West Coast, New Zealand
Nick T. Shears
Science for conServation 281
Published by
Science & Technical Publishing
Department of Conservation
PO Box 10420, The Terrace
Wellington 6143, New Zealand

Cover: Shallow mixed turfing algal assemblage near Moeraki River, South Westland (2 m depth).
Dominant species include Plocamium spp. (yellow-red), Echinothamnium sp. (dark brown), Lophurella
hookeriana (green), and Glossophora kunthii (top right).
Photo: N.T. Shears
Science for Conservation is a scientific monograph series presenting research funded by New Zealand
Department of Conservation (DOC). Manuscripts are internally and externally peer-reviewed; resulting
publications are considered part of the formal international scientific literature.
Individual copies are printed, and are also available from the departmental website in pdf form. Titles
are listed in our catalogue on the website, refer www.doc.govt.nz under Publications, then Science &
technical.
© Copyright December 2007, New Zealand Department of Conservation
ISSN 1173–2946 (hardcopy)
ISSN 1177–9241 (web PDF)
ISBN 978–0–478–14354–6 (hardcopy)
ISBN 978–0–478–14355–3 (web PDF)
This report was prepared for publication by Science & Technical Publishing; editing and layout
by Lynette Clelland. Publication was approved by the Chief Scientist (Research, Development &
Improvement Division), Department of Conservation, Wellington, New Zealand.
In the interest of forest conservation, we support paperless electronic publishing. When printing,
recycled paper is used wherever possible.

CONTeNTS
Abstract 5
1. Introduction 6
2. Methods 7
2.1 Sampling location 7
2.2 Sampling procedure 9
2.3 environmental variables 10
2.4 Habitat classification 10
2.5 Community analysis 11
2.6 Biogeographic classification 12
3. Results 13
3.1 Habitat classification 13
3.2 Habitat distributions and reef profiles 16
3.2.1 South Westland 16
3.2.2 Buller 18
3.3 Benthic community structure 18
3.4 Macroalgal assemblages 24
3.5 Mobile macroinvertebrate assemblages 30
3.6 Biogeographic analysis 31
4. Discussion 35
4.1 Habitat classification 35
4.2 Floral and faunal characteristics of SIWC subtidal reefs 37
4.3 Community structure and processes 39
4.4 Biogeography of the SIWC 41
5. Summary and conclusions 42
6. Acknowledgements 43
7. References 44
Appendix 1
Mean abundance and cover of key components of SIWC subtidal reef
habitat types 47
Appendix 2
Macroalgal taxa 51
5Science for Conservation 281
© Copyright December 2007, Department of Conservation. This paper may be cited as:
Shears, N.T. 2007: Biogeography, community structure and biological habitat types of subtidal reefs
on the South Island West Coast, New Zealand. Science for Conservation 281. Department
of Conservation, Wellington. 53 p.
Biogeography, community structure and biological habitat types of subtidal reefs on the South Island West Coast, New Zealand
Nick T. Shears1, 2
1 Leigh Marine Laboratory, University of Auckland, PO Box 349, Warkworth,
New Zealand2 Current address: Marine Science Institute, University of California Santa Barbara,
Santa Barbara, California 93106, USA. email: [email protected]
A B S T R A C T
There is currently little information on the biogeography and ecology of subtidal
reef habitats along New Zealand’s west coast. Without such information, it will
not be possible to develop a system of marine protected areas (MPAs) in these
areas. This report describes subtidal reef habitats at sites spanning more than
300 km of the highly wave-exposed South Island West Coast (SIWC), with a view
to investigating relationships between biological communities and environmental
variables. It tests existing biogeographic classification schemes for the SIWC.
Nine biological habitat types were identified on the reefs examined. The reef
communities within these habitats were biologically distinct, supporting their
use for future classification and mapping of SIWC reefs. Analysis of seaweeds,
mobile macroinvertebrates and fishes supported division of the SIWC into two
biogeographic regions: northern Buller and South Westland. Variation within and
between these regions was strongly related to water clarity. In general, Buller
sites had low water clarity, shallow reefs with a high degree of sand-scour, and
were dominated by encrusting invertebrates (especially mussels and sponges)
and bare rock. In contrast, the South Westland sites were dominated by small
seaweeds. The majority of sites sampled in this study were unusual for temperate
reef systems in that both kelp and large grazers (sea urchins) were rare. This
suggests that non-biological factors (e.g. water clarity and wave action) are largely
responsible for shaping subtidal reef communities on the SIWC. The information
gained in this study will assist planning for marine protected areas on the SIWC,
particularly with regard to those unique habitat types like Xenostrobus mats.
Keywords: biogeographic classification, coastal reef fish, habitat mapping, macro-
algae, marine reserves, marine protected areas, mobile macroinvertebrates, reef
biodiversity, seaweeds, New Zealand
6 Shears—West Coast subtidal reef communities
1. Introduction
As part of New Zealand’s commitment to the International Convention on
Biological Diversity (www.biodiv.org), the New Zealand Biodiversity Strategy
aims to protect 10% of New Zealand’s marine environment in a network of
representative marine protected areas (MPAs) using an agreed bioregional
classification system by 2010 (DOC & Mfe 2000). A Marine Protected Area
Policy and Implementation Plan (MPAPIP) has been developed by the New
Zealand Government (www.biodiversity.govt.nz/seas/biodiversity/protected/
mpa_policy.html) to guide this process. A key step outlined in the MPAPIP is to
develop a consistent approach to classification of marine habitats and ecosystems
based on best available scientific information to ensure representativeness of
future MPA networks. In order to represent the nested nature of biological
patterns across a range of spatial scales, a hierarchical approach to marine
classification is required (Lourie & Vincent 2004). For example, the Australian
inshore bioregionalisation provides a framework that considers ecological
patterns and processes which occur at the scale of provinces (macro-scale;
> 1000s of km), regions or bioregions (meso-scale; 100s–1000s of km), local units
(10s–100s of km), and individual sites (< 10 km) (Commonwealth-of-Australia
2006). Systematically collected biological data over broad geographic scales
combined with analytical techniques provide an opportunity to objectively
classify the marine environment at provincial and bioregional scales (e.g.
Bustamante & Branch 1996; edgar et al. 1997; edgar et al. 2004; Shears et al. in
press), while information on the distribution of biological habitat types is useful
for classification and mapping the marine environment at smaller spatial scales
(e.g. Connor 1997; Ward et al. 1999; Parsons et al. 2004).
In New Zealand, shallow subtidal reefs are highly important coastal habitats in
terms of their ecological, cultural, recreational and economic attributes. Many
important commercial, recreational and customary fisheries are focussed on these
habitats, e.g. rock lobster Jasus edwardsii, kina Evechinus chloroticus and paua
Haliotis iris. Biological information on the communities found in these habitats,
and our general understanding of their ecology, is generally based on studies in
a limited number of locations, e.g. northern New Zealand (Ayling 1981; Andrew
& Choat 1982; Choat & Schiel 1982; Schiel 1990; Shears & Babcock 2002), and
southern New Zealand (Schiel & Hickford 2001; Villouta et al. 2001; Wing et al.
2003). The majority of the areas studied so far have easy access and/or benign
sea conditions. Based on these studies, broad generalisations about the structure
of New Zealand’s subtidal reef communities have been made in the international
literature (e.g. Schiel 1990; Steneck et al. 2002). In general, New Zealand’s reefs
are considered to be typical of other temperate systems, being dominated by
Laminarian and Fucalean macroalgae, with sea urchins Evechinus chloroticus
being important structuring components, particularly in northern New Zealand
(Choat & Schiel 1982; Schiel 1990).
Because of the extremely exposed nature of the South Island West Coast (SIWC),
information on the biogeography, habitat types and ecology of shallow subtidal
reefs in this region is very limited. The draft national classification framework
for the MPAPIP proposes a biogeographic region covering the Department of
Conservation’s (DOC’s) West Coast/Tai Poutini Conservancy from Kahurangi

7Science for Conservation 281
Point in the north to Jackson Head in the south. However, the few biogeographic
studies carried out on the SIWC have divided this proposed region into two or
three distinct regions or ecological districts (Neale & Nelson 1998; Roberts et al.
2005; Shears et al. in press). Basing their studies predominantly on geomorphology
and collections of intertidal and beach-cast macroalgae, Neale & Nelson (1998)
proposed three marine ecological districts along the SIWC: Buller, Westland,
and South Westland (Fig. 1A), with the central (Westland) region lying between
Greymouth and Bruce Bay. A nationwide study of subtidal reef communities
by Shears et al. (in press) supported biogeographic divisions between northern
Buller, South Westland and Fiordland. However, in this study, no sampling was
carried out in Neale & Nelson’s (1998) Westland region. Roberts et al. (2005)
recognised three marine regions on the SIWC based on physical characteristics
and collections of coastal fishes (Fig. 1A). The area sampled in their study
included Fiordland, and the inner Fiords were defined as one of the three marine
regions. The other two regions were Fiordland open coast–South Westland
and Westland–Buller, and a broad transition zone was proposed between these
from Jackson Head in the north to Bruce Bay in the south. There are, therefore,
a number of inconsistencies between the biogeographic classifications so far
proposed for the SIWC (Neale & Nelson 1998; Roberts et al. 2005; Shears et al.
in press).
This report describes the biogeography, biological habitat types and community
structure of subtidal reefs at the 27 sites surveyed by Shears et al. (in press),
which span over 300 km of the SIWC (Fig. 1B, C). General descriptions of the
benthic communities at these sites are provided from a national perspective in
Shears & Babcock (2007). As the biological habitat types found on the SIWC reefs
do not conform to the habitat classification developed for northeastern New
Zealand reefs (reviewed in Shears et al. 2004) or other South Island locations
such as Kaikoura (Schiel & Hickford 2001), the data were also used to develop
and validate a biological habitat classification scheme for SIWC subtidal reefs.
In addition, the existing biogeographic schemes proposed for the SIWC (Neale
& Nelson 1998; Roberts et al. 2005) are tested using macroalgal data (this study)
and fish distribution data from Roberts et al. (2005). It is hoped that this regional
assessment of coastal reefs will assist the West Coast Marine Protection Forum
process (under the MPAPIP) by providing a robust quantitative assessment of
biogeographic patterns, identifying key reef habitat types on the West Coast, and
describing spatial patterns in reef communities among sites. This information
will allow assessment of the representativeness and distinctiveness of the sites
sampled within the SIWC region.
2. Methods
2 . 1 S A M P L I N G L O C A T I O N
The West Coast/Tai Poutini Conservancy’s coastal boundaries are located at
Kahurangi Point in the north and Awarua Point (northern point of Big Bay) in the
south (Fig. 1). A detailed description of the oceanography and geomorphology of
this region is given in Neale & Nelson (1998). This coastline is highly exposed to

8 Shears—West Coast subtidal reef communities
25
Kilometers
10
Kilometers
C
B Little Wanganui Head
Kongahu Pt
Falls Creek
South Seal RocksFishing Rod Reef
Granite spotNorth Granite
Cape Foulwind
Karamea
Barn Is
Cascades
Jackson Head/Bay Open Bay Is
Moeraki
Big Bay
Browne I
Moeraki RiverWhakapoaiArnott Pt
Gorge Is
Barn Is
Crayfish RockPenguin Rocks
Penguin Inner
Cement FaceCascade ICascade Pt
Moccasin GapSmoothwater PtFrog Rocks Jackson Head
Jackson Bluff
NW TaumakaNE TaumakaSW Popotai
A
Kilometres
Kilometres
Kahurangi Pt
Cape Farewell
Martins Bay
Figure 1. Map of South Island (A) from Roberts
et al. (2005), showing locations of the three marine
biogeographic regions they proposed for the SIWC: (1)
Fiord, (2) Fiordland open coast–South Westland,
and (3) Westland–Buller. Horizontal dashed lines
indicate boundaries of Neale & Nelson’s (1998) ecological
districts: Buller, Westland and South Westland. The
dashed boxes indicate the two study areas where sites
were sampled in the present study at Buller (B) and South
Westland (C). Note: most of South Westland
coast (marked XXXX) was proposed as a broad transition zone between
regions 2 and 3 by Roberts et al. (2005).

9Science for Conservation 281
the prevailing southwesterly swell and wind, sheltered reefs are rare, and there is
a high degree of sand-scour on reefs in most places. High annual rainfall and large
rivers lead to high sediment loading and turbidity in the nearshore zone. Reefs
extend into deep water around headlands (e.g. Jackson Head), offshore rock
stacks (e.g. Cascade Island and Barn Island) and islands (e.g. Open Bay Islands
(Taumaka and Popotai)), and the levels of sand scour and turbidity appear to be
reduced in these areas. Upwelling (of colder, deeper water) is considered to play
an important role in the ecology of intertidal communities (Menge et al. 1999;
Menge et al. 2003; but see Schiel 2004); however, the importance of upwelling
to subtidal systems, and the relative importance of terrestrially-derived nutrients
associated with the high river inflow, has not been investigated in this region.
2 . 2 S A M P L I N G P R O C e D U R e
Sampling was carried out at eight sites in South Westland and seven sites in Buller
in February 2001, and twelve additional sites were sampled in December 2003
at Big Bay, Barn Island, Jackson Head, Open Bay Islands and Moeraki (See Shears
& Babcock (2007) for site positions and sampling dates). All sites were sampled
using the same methodology, which is described in Shears & Babcock (2007).
The 27 sites were divided between nine sampling locations: Karamea (3), Cape
Foulwind (4), Moeraki (3), Open Bay Islands (3), Jackson Bay (2), Jackson Head
(3), Cascades (3), Barn Islands (3) and Big Bay (3) (Fig. 1). The numbers of sites
sampled, and locations sampled, were largely influenced by sea conditions at the
time of sampling. As far as possible, sampling was standardised to sites that had
contiguous sloping reef between 0 and 12 m deep. In most cases, sampling sites
were located on the northwestern side of intertidal reefs, rock-stacks or islands
to provide some protection from the prevailing southwesterly swell. Because of
adverse sea conditions and high turbidity, no sampling was carried out between
Moeraki and Cape Foulwind. Local information and assessment of maps and
photos indicate that there are few suitable sampling sites between Greymouth
and Bruce Bay.
The depth distribution of biological habitat types and counts of dominant species
were recorded at 5-m intervals along a line transect run perpendicular to the
shore at each site, and benthic communities were quantified by sampling five
1-m2 quadrats within each of four depth ranges (0–2, 4–6, 7–9 and 10–12 m).
At sites where the reef was truncated at shallow depths by sand, the deeper
strata were omitted. Within each quadrat, all large brown macroalgae were
counted and measured, while the percentage cover of smaller algal species was
estimated. Red algal species less than 5 cm in height or length were divided into
the following groups: crustose corallines, coralline turf, red encrusting algae, and
red turfing algae. Where possible, all larger macroalgal species were identified to
species level in the field. The percentage cover of sediment, bare rock and other
sessile forms (e.g. sponges, bryozoans, hydroids, ascidians and anemones) was
also estimated in each quadrat. Counts and measurements of conspicuous mobile
macroinvertebrates species were also made.

10 Shears—West Coast subtidal reef communities
2 . 3 e N V I R O N M e N T A L V A R I A B L e S
A number of environmental variables were estimated for each site. These were:
wave exposure, wind fetch, turbidity (secchi disc), sedimentation, reef slope and
maximum depth. Wave exposure estimates (m) for all sites were derived from
the New Zealand regional wave hindcast model 1979–98 (Gorman et al. 2003).
Wind fetch (km) was calculated for each site by summing the potential fetch
for each 10° sector of the compass rose—as in Thomas (1986)—to provide an
additional estimate of wave exposure at each site. For open sectors of water, the
radial distance was arbitrarily set to be 300 km. Turbidity was measured using a
standard 25-cm-diameter black and white secchi disc (Larson & Buktenica 1998).
The reading was taken as the average depth (m) of descending disappearance and
ascending reappearance. The percentage cover of sediment on the substratum at
each site from quadrat sampling was used as an estimator of sedimentation. Reef
slope at each site was expressed as a percentage, where the maximum depth
sampled was divided by the total length of a transect line which was run out
perpendicular to the shore from low water to 12 m depth or the edge of the reef
(whichever came first). The density of exposed Evechinus (averaged across all
depths at each site) was also used as an explanatory variable in multivariate analyses
because of its strong influence on macroalgal community structure (Ayling 1981;
Andrew & Choat 1982; Villouta et al. 2001; Shears & Babcock 2002).
2 . 4 H A B I T A T C L A S S I F I C A T I O N
Because of the lack of information on subtidal reef habitat types on the SIWC, the
line transect data were used to identify, describe and validate common habitat
types. The majority of quadrats sampled along the line transects were assigned to
nine subjective habitat types in the field (Table 1). In addition to assigning each
quadrat to a habitat type, the abundance of dominant species and percentage cover
of dominant macroalgal and sessile benthic groups were estimated. This allowed
an assessment of the biological distinctiveness of the habitats identified in the
field using the same technique used to validate habitat types in northeastern New
Zealand (Shears et al. 2004). In some cases, quadrats were not clearly assigned
to a specific habitat type (e.g. occurred at a transition), so were not included in
the analysis. Sand and Cobble habitats were also excluded.
Analysis of similarity (ANOSIM, Clarke & Warwick 1994) and canonical analysis
of principal coordinates (CAP, Anderson & Willis 2003) were used to test for
differences in assemblages between the nine habitats and to carry out a leave-
one-out classification of habitat types to determine the classification success
of each habitat type, as in Shears et al. (2004). Analyses were carried out on
untransformed count data for Ecklonia radiata, Durvillaea spp., other
large brown algal species (pooled) and Evechinus chloroticus, and log(x+1)
transformed percentage cover data for 18 macroalgal, sessile invertebrate and
physical groups (Appendix 1). The two physical groups (sediment and bare rock)
were included in the classification analysis as their occurrence was a key feature
of some of the biological habitats recorded.

11Science for Conservation 281
2 . 5 C O M M U N I T y A N A L y S I S
Community analyses were carried out separately for benthic community structure,
macroalgal species composition and mobile macroinvertebrate assemblages.
Analyses of benthic community structure were carried out on log(x+1)
transformed percentage cover data for 21 sessile benthic groups (these were
the same groups used above for the habitat classification, excluding Evechinus
(Appendix 1)). Analysis on macroalgal species composition was carried out on
presence-absence data of the 48 macroalgal species recorded and analysis of
mobile macroinvertebrates was carried out on log(x+1) transformed count data
of the 28 macroinvertebrate species recorded. All analyses were performed on
the depth-averaged data for each site. Depth-related patterns in the abundance,
biomass or cover of key species and groups are presented for each of the SIWC
sampling locations in Shears & Babcock (2007).
HABITAT DePTH DeSCRIPTION RANGe (m)
Durvillaea fringe (Dur) < 1 Shallow fringe of Durvillaea willana and/or D. antarctica. Substratum predominantly covered by crustose corallines and, to a lesser extent, red encrusting algae and red turfing algae.
Ecklonia forest (eck) < 5 Generally monospecific stands of Ecklonia radiata (> 4 adult plants per m2). Urchins at low numbers (< 1 exposed urchin per m2).
Mixed brown algae (MB)* < 7 Mixture of large brown algal species. No clear dominance of one particular species and urchins may occur in low numbers (< 2 exposed urchins per m2).
Mixed turfing algae (MT)* All Substratum predominantly covered by turfing (e.g. articulated corallines and other red turfing algae) and foliose algae (> 30% cover). Low numbers of large brown algae (< 4 adult plants per m2) and urchins may be common.
Scoured rock (Sco)* > 5 The reef is predominantly bare, often with high sediment cover. Crustose corallines are the dominant encrusting form. The mussel Xenostrobus and encrusting bryozoans may also be common.
Invertebrate turf (IT)* > 5 Substratum predominantly covered by community of encrusting ascidians, sponges, hydroids, and bryozoans, with a high cover of sediment. Large brown algae and Evechinus are generally absent.
Urchin barrens (UB)* 5–12 Very low numbers of large brown algae present (< 4 adult plants per m2), substratum typically dominated by crustose coralline algae and red turfing algae. Usually associated with grazing activity of Evechinus (> 2 exposed urchins per m2).
Perna beds (Per) < 3 Dominance of Perna canaliculus, which may be covered in a variety of encrusting flora and fauna.
Xenostrobus mats (Xen)* 2–10 Xenostrobus pulex, crustose corallines and the hydroid Amphisbetia bispinosa. encrusting bryozoans and anemones are also common.
TABLe 1. DeSCRIPTION OF BIOLOGICAL HABITAT TyPeS ReCORDeD ON SOUTH ISLAND WeST COAST ReeFS (HABITATS WeRe DeTeRMINeD IN THe FIeLD By SUBJeCTIVe ASSeSSMeNT OF DOMINANT SPeCIeS) . ABUNDANCeS GIVeN IN THe DeSCRIPTIONS ARe INDICATIVe ONLy, ACTUAL MeAN ABUNDANCeS AND COVeRS OF DOMINANT SPeCIeS WITHIN eACH HABITAT ARe PReSeNTeD IN APPeNDIX 1.
* Pictured in Fig. 2.

12 Shears—West Coast subtidal reef communities
Patterns in benthic community structure, macroalgal species composition and
mobile macroinvertebrate assemblages were investigated among sites using
principal coordinates analysis based on Bray-Curtis similarities (using the PCO
program, Anderson 2003). The original species variables were also correlated
with principal coordinates axes, and the correlation coefficients plotted as bi-
plots, to give an indication of the relationship between individual species and
the multivariate patterns. The relationship between the multivariate data sets
and environmental variables was investigated using non-parametric multivariate
multiple regression (McArdle & Anderson 2001) with the computer program
DISTLM (Anderson 2002). Individual variables were analysed for their relationship
with each community dataset, then subjected to a forward-selection procedure
whereby each variable was added to the model in the order of greatest contribution
to total variation. All analyses were based on Bray-Curtis similarities. Marginal
tests (examining a single variable or the entire set of variables) were carried
out with 4999 permutations of the raw data, while conditional tests (used for
the forward-selection procedure) were based on 4999 permutations of residuals
under the reduced model.
For each of the three community datasets, general patterns in the abundance
of cover of the dominant groups or species are presented. This provides an
indication of the variation among sites within locations and between Buller and
South Westland.
2 . 6 B I O G e O G R A P H I C C L A S S I F I C A T I O N
The existing biogeographic schemes proposed for the SIWC (Fig. 1A) were
tested using the macroalgal species composition dataset (presence-absence of
48 species) collected in the present study and fish species composition data from
the appendices of Roberts et al. (2005) (compiled by D. Neale, DOC; presence-
absence data for 90 fish species from 46 stations). Fish stations were located from
Milford Sound (Fiordland) in the south to Wekakura Point (north of Karamea) in
the north. However, no sampling was carried out on the Fiordland open coast, and
only two stations were sampled between Bruce Bay and Greymouth (Westland).
Analyses were restricted to the macroalgal species composition data collected in
the present study, as this group of taxa display greater biogeographic disjunction
than mobile macroinvertebrates (for reasons discussed in Shears et al. (in press)).
Differences in algal and reef fish species composition were investigated among
sites or stations within each of the regions using ANOSIM and CAP (as in the
habitat classification analysis). A leave-one-out classification of sites was also
carried out using CAP to determine the classification success of each region and
scheme. The following regions were tested for each scheme:
Neale & Nelson (1998): Buller, Westland, South Westland and Fiordland •
(note: Fiordland was included as this was considered as a distinct region by
these authors).
Roberts et al. (2005): Fiords, Fiordland open coast–South Westland, Transition •
and Westland–Buller (note: the Transition zone was treated as its own
region).

13Science for Conservation 281
3. Results
3 . 1 H A B I T A T C L A S S I F I C A T I O N
The present study identified nine biological habitat types on the SIWC reefs
sampled (Fig. 2); these are summarised in Table 1. The mean abundance or
percentage cover of dominant benthic species groups within each of these
habitats is given in Appendix 1. Three of the habitat types were characterised
by large brown algae—‘mixed brown algae’, ‘Ecklonia forest’ and ‘Durvillaea
fringe’—although these habitats were generally rare with low numbers of the
quadrats sampled being classified in these categories (Appendix 1). ‘Mixed brown
algae’ habitat (MB, Fig. 2A) comprised a mixed assemblage of large brown algal
species such as Landsburgia quercifolia, Ecklonia radiata and/or Sargassum
sinclairii, but also included relatively high numbers of small brown algal species,
red foliose and turfing species, coralline turf and crustose corallines. ‘Ecklonia
forest’ was clearly dominated by Ecklonia radiata, but other large brown algae
were present in low numbers, and the substratum was dominated by crustose
corallines and ascidians. ‘Durvillaea fringe’ habitat occupied the sublittoral
fringe at some sites, and was predominantly characterised by Durvillaea willana
and, in some cases, Durvillaea antarctica. The substratum in this habitat was
dominated by crustose corallines and, to a lesser extent, red turfing algal species
such as Ballia callitrichia.
The most common reef habitat was ‘mixed turfing algae’ (MT, Fig. 2B), which
was dominated by red turfing algal species but also a combination of small brown
algal species, red foliose species, coralline turf and crustose corallines. Evechinus
often occurred in low numbers in this habitat, encrusting invertebrates had a
low percentage cover (<10%), and there was a relatively high cover of sediment
(trapped in amongst the algal turfs) (Appendix 1, Tables A1.2, A1.3). Two other
commonly occurring reef habitats were ‘invertebrate turf’ and ‘scoured rock’.
‘Invertebrate turf’ (IT, Fig. 2C) was dominated by sessile invertebrate groups
such as ascidians, bryozoans, hydroids, sponges, tube worms and anemones, as
well as sediment (Appendix 1). Large brown algae were absent, but other algal
groups were common, with red turfing algae being the dominant algal group in
this habitat. All algal groups except crustose corallines were rare in the ‘scoured
rock’ habitat (Sco, Fig. 2D), which was dominated by bare rock. encrusting
invertebrates were also rare in the Sco habitat (Appendix 1, Table A1.2), with the
mussel Xenostrobus pulex being the most common. In some cases, Xenostrobus
was the dominant substratum cover on the reef and these areas were classified
as ‘Xenostrobus mats’ habitat (Xen, Fig. 2e). Hydroids (predominantly mussel
beard Amphisbetia bispinosa), anemones and bryozoans (encrusting forms)
were common in this habitat. The starfish Stichaster australis was particularly
abundant in this habitat (Fig. 2e). The greenshell mussel Perna canaliculus also
dominated the substratum on some reefs and these areas were classified as ‘Perna
beds’. A variety of groups were recorded growing on or in association with the
mussels, e.g. red foliose algae, barnacles, anemones, hydroids.

14 Shears—West Coast subtidal reef communities
‘Urchin barrens’ habitat (UB, Fig. 2F) was also recorded at some sites in association
with high densities of the sea urchin Evechinus chloroticus (Appendix 1, Table
A1.3). Large brown algae were absent in this habitat and the substratum was
dominated by red turfing algae, crustose corallines and sediment. encrusting
invertebrates were generally rare in this habitat.
Unconstrained ordination of the quadrat data from line transects revealed some
clear groupings of samples from different habitats (Fig. 3A). Sco and Xen samples
were grouped on the left of the ordination, while the large brown algal habitats,
Fig. 2. (a) Mixed brown algae (Big Bay)
(b) Mixed turfing algae (Jackson Head)
(c) Invertebrate turf (Moeraki)
(d) Scoured rock (Cape Foulwind)
(e) Xenostrobus mats (Cape Foulwind)
(f) Urchin barrens (Big Bay)
Figure 2. Biological habitat types recorded on West Coast reefs (excluding Ecklonia forest, Durvillaea fringe and Perna beds). See Table 1 for a description of each habitat type. Photos B, C, D, E—NTS; A, F—P. Ross.
Mixed brown algae (Big Bay) Scoured rock (Cape Foulwind)
Mixed turfing algae (Jackson Head) Xenostrobus mats (Cape Foulwind)
Invertebrate turf (Moeraki) Urchin barrens (Big Bay)
A D
B E
C F

15Science for Conservation 281
IT and MT, were grouped on the right. The covers of bare rock and Xenostrobus
were negatively correlated with PC1, while a number of algal groups were
positively correlated. Similarly, there was a clear gradient in habitats along PC2,
with IT samples at the bottom of the ordination, MT in the middle, and large
brown algal habitats at the top (Fig. 3A). Sediment and invertebrate groups
(e.g. tube worms and ascidians) were negatively correlated with PC2, while
Ecklonia, Durvillaea and other large brown algae were positively correlated.
Despite some overlap among samples from different habitats, ANOSIM revealed
significant differences in benthic communities between the nine habitats
(Global R = 0.729, P = 0.001). However, pair-wise tests revealed no significant
Correlation with PC2-1.0 -0.5 0.0 0.5 1.0
Cor
rela
tion
with
PC
1
-1.0
-0.5
0.0
0.5
1.0
Durv
Eck
O_Lb
Sm_br
R_fol
R_turf
C_turf
Eve
CCA
Sed
Bare
Hydr
AsciSpon
Tube
BryoAnem
Xeno
PernBarnGree
R_enc
A
PC1 (25.4%)-0.8 -0.6 -0.4 -0.2 0.0 0.2 0.4 0.6
PC
2 (1
7.1%
)
-0.6
-0.4
-0.2
0.0
0.2
0.4
0.6
B
CAP1
-0.2 -0.1 0.0 0.1 0.2 0.3
CA
P2
-0.15
-0.10
-0.05
0.00
0.05
0.10
0.15
0.20
0.25
Correlation with CAP1
-1.0 -0.5 0.0 0.5 1.0
Cor
rela
tion
with
CA
P2
-1.0
-0.5
0.0
0.5
1.0
DurvEck
O_Lb
Sm_br
R_folR_turf
C_turfEve
CCA
Sed
Bare
Hydr
Asci
SponTube
BryoAnem
Xeno
Pern
BarnGree
R_enc
Durvillaea fringeEcklonia forestMixed brown algaeMixed turfing algaePerna beds Scoured rockInvertebrate turfUrchin barrensXenostrobus mats
Durvillaea fringeEcklonia forestMixed brown algaeMixed turfing algaePerna beds Scoured rockInvertebrate turfUrchin barrensXenostrobus mats
Figure 3. Habitat classification for West Coast reefs. A—Unconstrained (principal coordinates analysis) of benthic assemblages from quadrat sampling. B—Constrained (CAP) ordination of benthic assemblages from quadrat sampling. each symbol represents one quadrat and indicates the habitat type it was assigned to in the field. Bi-plots show correlations between the benthic species group variables, and (A) the two principal coordinate axes, and (B) the two CAP axes. See Table 2 for variable codes.

16 Shears—West Coast subtidal reef communities
differences between Durvillaea fringe and Ecklonia forest, Durvillaea fringe
and Perna beds, and Ecklonia forest and Perna beds, most likely because of the
low numbers of samples from each of those habitats.
Constrained ordination revealed clearer groupings of samples from the different
habitats (Fig. 3B) and CAP analysis found a highly significant difference between
the nine habitats (P ≤ 0.001), with an overall classification success of 75.6%; i.e.
93 of the 123 quadrats analysed were correctly classified by CAP as the original
habitat assigned in the field. The classification success for each habitat ranged from
0% for ‘Ecklonia forest’ to 90% for ‘scoured rock’ (Appendix 1, Table A1.3). All
‘Ecklonia forest’ quadrats were misclassified as ‘mixed brown algae’, suggesting
there wasn’t a clear distinction between these habitat types; however, only three
quadrats were classified as ‘Ecklonia forest’. In general, the habitats with low
numbers of samples had a low classification success, e.g. Durvillaea fringe,
Ecklonia forest, Perna beds and Xenostrobus mats (Appendix 1, Table A1.3).
There was a general gradient in benthic communities among IT, MT and UB and
a high degree of overlap among samples based on CAP axis 1 and 2 (Fig. 3B).
Subsequently, five of the IT samples were misclassified as MT (one as UB), while
five of the MT samples were classified as IT and two as UB. Despite this gradient,
the distinction between these habitats was clearly supported by the classification
analysis, each scoring approximately 75%.
3 . 2 H A B I T A T D I S T R I B U T I O N S A N D R e e F P R O F I L e S
3.2.1 South Westland
Big Bay—There was a clear difference in the distribution of habitats between
Crayfish Rock on the northern side of the bay compared with Penguin Inner and
Penguin Rocks on the southern side (Fig. 4A). At Crayfish Rock, shallow depths
(< 6 m) were dominated by mixed brown algal habitat (MB), while mixed turfing
algal habitat (MT) dominated deeper areas, with some patches of urchin barrens
(Fig. 2F). In contrast, the southern sites were both dominated by MT at shallow
depths, and invertebrate turf habitat (IT) below 8 m depth.
Barn Islands—The three sites in this area all had a similar depth distribution of
habitats, with MT dominating across all depths, but with patches of MB (generally
in shallow water, < 7 m). MB was not recorded at the steeper Browne Island site,
but the large brown alga Landsburgia was present in low numbers.
Cascades—The reef profiles and habitat distributions were variable among the sites
sampled in this area. The reef at Cascade Point was a near vertical wall classified
as IT and MT to c. 9 m depth, below which it levelled out and was highly scoured
and interspersed with sand (Fig. 4A). In contrast, Cement Face sloped gradually
and MT dominated across all depths. The Cascade Island site was intermediate to
the other sites in this area and was covered in a mosaic of habitats including Sco,
MB, MT and patches of urchin barrens in the deeper areas.
Jackson Head and Jackson Bay—The sites in both these areas had similar reef
profiles and depth distribution of habitats with MT dominating at all depths
(Fig. 4B). One exception was Frog Rocks where the reef dropped steeply to 12 m
and then levelled out. At this site the reef below 10 m depth was classified as IT.

17Science for Conservation 281
Fig. 4. (a) Big Bay to Cascades
Cascades
Distance (m)
0 10 20 30 40 50 60
-14
-12
-10
-8
-6
-4
-2
0
SaScoScoScoMT
SaMT
IT
MT
UBUBScoScoMT
MTSaMTScoMBSco
MT
MT
MB
MTMT
MT
MTMTMTMTMTC
MTC
MTMT
MT
Barn Coast
Dep
th (m
)
-12
-10
-8
-6
-4
-2
0
SaMTIT
MTMTMT
MT
MT
MT
SaMTMT
MT
MT
ITMT
MT
MT
MT
MTMTMTMT
MTMTMTMB
MBMBMT
MB
MT
Gorge Is
Brown Is
Barn Is
Big Bay
-12
-10
-8
-6
-4
-2
0
MT
MT
MTUBMT
MTMTMT
MBMBMB
MB
MB
MB
ITIT
MTUB
MT
MTMTMT
MT
MT
ITITIT
MTMT
MT
MT
MT
Crayfish Rock
Penguin Inner Penquin Rocks
Cascade IsCascade Pt
Cement Face
Fig. 4(b) Jackson Head to Moeraki
Moeraki
Distance (m)
0 10 20 30 40 50 60
-14
-12
-10
-8
-6
-4
-2
0
SaIT
ITIT
ITMT
MTMT
MT
MT
SaMT
MTMT
MB
MB
MB
SaMT
ITMT
MT
MTMT
MT
Open Bay Is
-12
-10
-8
-6
-4
-2
0
ScoMT
MTMT
MTMTUB
MTEck
Eck
MTUB
MTMT
MTMTMBMB
MB
MBMB
SaMTUBMT
ITMB
MB
Eck
MB
Jackson Bay
Dep
th (m
) -12
-10
-8
-6
-4
-2
0
SaMT
MT
MTMT
MT
MT
MTMTMT
MT
MT
MT
SaMT
MT
MTMT
MT
MT
MTMT
MT
MT
Jackson Head
-12
-10
-8
-6
-4
-2
0
ITITIT
IT
ITITIT
MT
IT
MT
MT
MTMTMTMT
MTMTMT
MT
MTMTMT
MT
MT
MTMT
MTMTMT
MT
MTMTMT
MT
MTMT
MT
MT
SmoothwaterFrog Rocks
Moccasin Gap
Jackson Bluff
Jackson Head
NE TaumakaNW Taumaka
SW Popotai
Whakapoai
Arnott Pt
MoerakiRiver
Fig. 4(c) Buller locations
Karamea
Distance (m)0 10 20 30 40 50 60
-14
-12
-10
-8
-6
-4
-2
0
ScoScoScoScoScoScoPer
PerPer
ScoIT
IT
IT
MT
ScoScoScoSco
IT
MTDur
Cape Foulwind (Steeples)
-12
-10
-8
-6
-4
-2
0
IT
IT
IT
ITMT
MTMT
MT
MBMB
MT
XenXenUBUBScoUBSco
XenIT/ScoIT/ScoIT/ScoIT/Sco
Barn/MT
Barn/MT
Cape Foulwind (coastal)
Dep
th (m
)
-12
-10
-8
-6
-4
-2
0
Sco
ScoScoSco
ScoScoScoSco
ScoXenXenXen
Dur
SaSco
IT/Xen
MT
South Seal Rocks
North Granite
Granite spot
Fishing Rod Reef
Falls Creek
Kongahu Pt
Little Wanganui
Big Bay to Cascades Jackson Head to Moeraki
Buller
Figure 4. Depth profiles and habitat distributions at each site within each location: A. Big Bay to Cascades; B. Jackson Head to Moeraki; C. Buller. See Table 1 for habitat abbreviations. Sa = Sand, C = cobbles.
A B
C

18 Shears—West Coast subtidal reef communities
Open Bay Islands—The sites sampled at Open Bay Islands had considerably
different habitat distributions to the other SIWC sites, because of the dominance
of large brown algal habitat types (Ecklonia forest and MB) in shallow water
(< 8 m). Mixed turfing algae dominated the deeper water areas and patches of
urchin barrens were common.
Moeraki—The Moeraki River and Whakapohai sites had similar habitat distributions
with shallow quadrats (< 8 m) classified as MT while deeper quadrats were IT.
The Arnott Point site was considerably steeper and MB dominated shallower
depths (< 6 m).
3.2.2 Buller
Cape Foulwind—There was considerable variation among the Cape Foulwind
sites (Fig. 4C) and the habitat distributions are presented separately for the
coastal sites (North Granite and Granite Spot) and sites located offshore at an area
known as Three Steeples (South Seal Rocks and Fishing Rod Reef). Granite Spot
was a relatively gradually sloping boulder reef which was highly scoured below
4 m. Durvillaea fringe dominated shallow subtidal areas and ‘Xenostrobus mats’
covered the reef at 2–4 m depth. The reef at North Granite was near vertical, and
IT and Xen covered the rock wall at 2–8 m, below which the reef was scoured and
inundated by sand at 10 m. The shallow zone at Fishing Rod Reef was dominated
by barnacles and MB, while the reef at greater depths was classified as a mix of
IT, Sco, Xen and UB. The South Seal Rocks site was considerably different and
more typical of South Westland sites, with MT and MB in shallow water (< 8 m),
and deeper areas of the reef were classified as IT.
Karamea—The Falls Creek and Kongahu Point sites were both steep sloping reefs
that levelled out at c. 8 m depth and were highly scoured (Fig. 4C). Durvillaea
fringe and MT dominated the shallow zone (< 2 m), while IT covered the steep
reef areas. The shallow reef at Little Wanganui was quite distinct from the other
West Coast sites with Perna beds dominating the shallow zone (< 2 m), while
deeper areas were scoured.
3 . 3 B e N T H I C C O M M U N I T y S T R U C T U R e
There was a relatively clear division in benthic community structure between
Buller and South Westland sites along PC1 (Fig. 5A). ANOSIM revealed a highly
significant difference in benthic community structure between sites from both
regions (Global R = 0.885; P = 0.001); although, based on hierarchical cluster
analysis, South Seal Rocks (Cape Foulwind) was clustered with the South Westland
sites, which were separated from the other Buller sites at the 48% dissimilarity level.
A number of macroalgal groups (red turf, red foliose, small brown, large brown
and coralline turf) were positively correlated with PC1 (Fig. 5B) and these tended
to have higher covers at the South Westland sites (Fig. 6A). In contrast, a number
of sessile invertebrate groups (Bryozoans, Hydroids, Barnacles, Anemones and
Xenostrobus pulex; Fig. 6B) and bare rock (Fig. 6C) were negatively correlated
with PC1 and had higher covers at Buller sites.
Benthic community structure was strongly correlated with the environmental
variables, which explained 54.8% of the variation among sites (Table 2A). Reefs
sampled at the northern Buller sites tended to be shallower and more turbid than

19Science for Conservation 281
A
PC1 (50.1%)-60 -40 -20 0 20 40
PC
2 (1
6.2%
)
-40
-20
0
20
40
Big BayBarn CoastCascadesJackson HeadJackson Bay
Open Bay IsMoerakiCape FoulwindKaramea
B
Correlation with PC1-1.0 -0.5 0.0 0.5 1.0
Cor
rela
tion
with
PC
2
-1.0
-0.5
0.0
0.5
1.0
Anem
Asci
BareBarn
Bryo
C_turf
CCA
Durv
Eck
Gree
Hydr
O_Lb
Pern
R_enc
R_fol
R_turf
Sed
Sm_br
SponTube
Xeno
C
-1.0 -0.5 0.0 0.5 1.0
EvechinusFetch MaxDepth
Slope
Secchi
Sediment
WaveExp
Figure 5. A—Principal coordinates analysis of benthic community structure (log(x+1) transformed percent cover data) for West Coast sites. B—Bi-plot showing correlations between principal coordinate axes and benthic group variables. C—Biplot showing correlations between principal coordinate axes and environmental variables. See Table 2 for variable codes. Buller sites—open symbols; South Westland sites—black or grey symbols (grey indicates sites in Roberts et al.’s (2005) ‘Transition zone’).
the South Westland sites. This was reflected by a strongly negative correlation
among sites between latitude (Northing, New Zealand Map Grid) and both
MaxDepth (–0.60) and Secchi (–0.64). Of the seven environmental variables,
Secchi (27%) and MaxDepth (19.9%) explained the greatest variation (Table 2A).
However, these two variables were also strongly correlated with each other (0.56)
and when factors were fitted sequentially, Secchi (27.4%) and Sediment (15.6%)

20 Shears—West Coast subtidal reef communities
A
Big BayBarn CoastCascadesJackson HeadJackson BayOpen Bay IsMoerakiCape FoulwindKaramea
Large brown algae (incl. Ecklonia and Durvillaea)
Site
Pengu
in Roc
ks
Pengu
in Inn
er
Crayfi
sh R
ock
Gorge
Is
Browne
I
Barn I
s
Casca
de P
t
Casca
de I
Cemen
t Fac
e
Frog R
ocks
Mocca
sin G
ap
Smoothw
ater P
t
Jack
son B
luff
Jack
son H
ead
SW P
opota
i
NE Tau
maka
NW T
aumak
a
Arnott
Poin
t
Wha
kapo
hai
Moera
ki Rive
r
Granit
e spo
t
North
Granit
e
South
Seal R
ocks
Fishing
Rod
reef
Konga
hu P
t
Falls C
reek
Little
Wan
ganu
i Hea
d0
1
2
3
Coralline turf
0
10
20
30
Small brown algae
0
10
20
30
Red foliose
Cov
er (%
+ S
E)
0
10
20
30
Red turf
0
10
20
30
Crustosecorallines
0
10
20
30
40
Figure 6A. Percentage cover of dominant benthic groups
for macroalgae. Horizontal lines indicate global means across all sites and vertical
line indicates division between South Westland
(left) and Buller (right) sites.

21Science for Conservation 281
B
Big BayBarn CoastCascadesJackson HeadJackson BayOpen Bay IsMoerakiCape FoulwindKaramea
Tube worms
Site
Pengu
in Roc
ks
Pengu
in Inn
er
Crayfi
sh R
ock
Gorge
Is
Browne
I
Barn I
s
Casca
de P
t
Casca
de I
Cemen
t Fac
e
Frog R
ocks
Mocca
sin G
ap
Smoothw
ater P
t
Jack
son B
luff
Jack
son H
ead
SW P
opota
i
NE Tau
maka
NW Tau
maka
Arnott
Poin
t
Wha
kapo
hai
Moera
ki Rive
r
Granit
e spo
t
North
Granit
e
South
Seal R
ocks
Fishing
Rod
reef
Konga
hu P
t
Falls C
reek
Little
Wan
ganu
i Hea
d0
5
10
15
Sponges
0
5
10
15
Xenostrobus pulex
Cov
er (%
+ S
E)
0
5
10
15
Bryozoans
0
5
10
15
Perna canaliculus
0
5
10
3040
Ascidian
0
5
10
15
20
Figure 6B. Percentage cover of dominant benthic groups
for sessile invertebrates. Horizontal lines indicate
global means across all sites and vertical line indicates
division between South Westland (left) and Buller
(right) sites.

22 Shears—West Coast subtidal reef communities
C
Sediment
Site
Pengu
in Roc
ks
Pengu
in Inn
er
Crayfi
sh R
ock
Gorge
Is
Browne
I
Barn I
s
Casca
de P
t
Casca
de I
Cemen
t Fac
e
Frog R
ocks
Mocca
sin G
ap
Smoothw
ater P
t
Jack
son B
luff
Jack
son H
ead
SW P
opota
i
NE Tau
maka
NW T
aumak
a
Arnott
Poin
t
Wha
kapo
hai
Moera
ki Rive
r
Granit
e spo
t
North
Granit
e
South
Seal R
ocks
Fishing
Rod
reef
Konga
hu P
t
Falls C
reek
Little
Wan
ganu
i Hea
d0
10
20
30
Bare rock
Cov
er (%
+ S
E)
0
10
20
30
40
50
60Big BayBarn CoastCascadesJackson HeadJackson BayOpen Bay IsMoerakiCape FoulwindKaramea
Figure 6C. Percentage cover of dominant benthic groups for bare rock and sediment.
Horizontal lines indicate global means across all sites
and vertical line indicates division between South
Westland (left) and Buller (right) sites.
were found to be significantly related to community structure. The relationship
between benthic community structure and these two variables is reflected by
their correlations with PC1 and PC2, respectively (Fig. 5C).
Within the Buller and South Westland regions there was no clear location-level
grouping of sites; instead, variation in community structure (Fig. 5A) and key
benthic groups (Fig. 6) within regions appeared to be related to differences in
environmental conditions among sites. For example, the South Westland sites
were spread along PC2 and this reflected a gradient from turbid sites with high
sediment and ascidian cover (e.g. Penguin Inner, Penguin Rocks, Jackson Bluff,
Jackson Head and Moeraki River) to sites at offshore rock-stacks or islands
(e.g. Open Bay Islands sites, Barn Islands, Browne Island, Cascade Island and
Crayfish Rocks) with clearer water and higher covers of large brown algae and
coralline turf (Figs 5B and 6C).
The Buller sites were all highly wave exposed and the variation among sites
was less clearly related to the environmental factors measured. Bare rock was
a common feature at all Buller sites except for the two sites at offshore rock-
stacks with moderately sloping reefs (South Seal Rocks and Fishing Rod Reef)
(Fig. 6C). Benthic community structure at South Seal Rocks was more similar to
South Westland sites with some large brown algae (Sargassum sinclairii and
Landsburgia quercifolia) and a high cover of small brown algae, particularly
Halopteris spp. The Kongahu Point and Falls Creek sites were distinct from
the other Buller sites. These both had relatively steep sloping reefs to c. 8 m
depth, with a particularly low cover of algal groups and dominance by ascidians,
bryozoans, sponges and tube worms. Benthic community structure at the Little
Wanganui Head site was also highly distinctive because of the dominance of
Perna canaliculus (Fig. 6B) and bare rock (Fig. 6C).

23Science for Conservation 281
TABLe 2. ReSULTS OF NON-PARAMeTRIC MULTIVARIATe ReGReSSION OF
BIOLOGICAL DATASeTS AGAINST eNVIRONMeNTAL VARIABLeS.
A—BeNTHIC COMMUNITy STRUCTURe. B—ALGAL SPeCIeS COMPOSITION.
C—MOBILe MACROINVeRTeBRATe ASSeMBLAGeS.
Note: The test statistics and percentage variance explained for each variable (or set) are given where
variables are fitted individually (left) and for significant variables following forward selection (right)
(ns = not significant).
INDIVIDUAL SeqUeNTIAL
PSeUDO-F P % PSeUDO-F P %
Set of variables
environmental 3.29 0.0002 54.8 3.29 0.0002 54.8
Individual variable
evechinus 1.50 0.1734 5.67 – ns –
Fetch 1.74 0.1364 6.5 – ns –
MaxDepth 6.20 0.0036 19.88 – ns –
Slope 1.00 0.3786 3.83 – ns –
Secchi 9.41 0.0002 27.35 9.4113 0.0002 27.4
Sediment 4.51 0.0048 15.28 6.5544 0.0006 15.6
Waveexp 1.07 0.3372 4.09 – ns –
A
INDIVIDUAL SeqUeNTIAL
PSeUDO-F P % PSeUDO-F P %
Set of variables
environmental 2.40 0.0032 46.9 2.40 0.0032 46.9
Individual variable
evechinus 3.98 0.0088 13.73 – ns –
Fetch 1.87 0.1224 6.94 – ns –
MaxDepth 7.35 0.0014 22.71 2.31 0.056 6.4
Slope 0.19 0.962 0.75 – ns –
Secchi 9.46 0.0002 27.45 9.46 0.0002 27.5
Sediment 1.20 0.28 4.57 – ns –
Waveexp 0.55 0.703 2.17 – ns –
B
INDIVIDUAL SeqUeNTIAL
PSeUDO-F P % PSeUDO-F P %
Set of variables
environmental 1.53 0.0488 31.5 1.53 0.0488 31.5
Individual variable
Fetch 1.27 0.2564 4.83 – ns –
MaxDepth 2.69 0.0178 9.7 – ns –
Slope 1.39 0.2098 5.26 – ns –
Secchi 4.87 0.001 16.3 4.8674 0.001 16.3
Sediment 1.34 0.2196 5.08 – ns –
Waveexp 0.90 0.4868 3.49 – ns –
C

24 Shears—West Coast subtidal reef communities
3 . 4 M A C R O A L G A L A S S e M B L A G e S
A total of 48 macroalgal taxa were recorded during quadrat sampling across the
27 West Coast sites (Table 3A; Appendix 2). Crustose corallines were the most
commonly recorded group and on average were the dominant substratum cover
among the sites sampled, followed by the red turfing algal species complex and
articulated coralline turf. The majority of species recorded were typically short
turfing or foliose species, and large brown macroalgae were generally rare and at
low abundances (< 1/m2) (Table 2A). Landsburgia quercifolia and Sargassum
sinclairii were the most common large brown algal species and were recorded
in 13.9% and 10.4% of quadrats respectively.
There was a clear division in algal species composition between Buller and South
Westland sites (Fig. 7A). While the South Seal Rocks site at Cape Foulwind had
some similarities with South Westland sites, hierarchical cluster analysis separated
all sites from the two regions at the 50% dissimilarity level, and there was a highly
significant difference in algal species composition between sites from the two
regions (ANOSIM, Global R = 0.901; P = 0.001).
The abundance of large brown algal species (Fig. 8) and cover of most other
algal species (Fig. 9) was typically lower at the Buller sites compared with South
Westland sites and this was reflected by the correlations between PC1 and the
species variables (Fig. 7B). The majority of algal species were more common at
South Westland sites and positively correlated with PC1, e.g. most large brown
algal species (Ecklonia radiata, Landsburgia quercifolia, Carpophyllum
flexuosum and Cystophora scalaris; Fig. 8), the small brown algae Dictyota
spp. and Zonaria spp. (Fig. 9A), and a number of red algal species including
Plocamium spp., Anotrichium crinitum and Asparagopsis armata (Fig. 9B).
The green alga Caulerpa brownii was common at a few South Westland sites,
particularly Crayfish Rocks (Fig. 9C). A low number of species were more common
at the Buller sites, e.g. Endarachne binghamiae, Gigartina spp., Gymnogongrus
furcatus (Fig. 9A, B), while others were relatively common at sites in both regions,
e.g. Halopteris spp. (predominantly Halopteris congesta, which is a common
component of the ‘mixed turfing algal’ habitat in the immediate subtidal zone),
Glossophora kunthii, and a number of other species that commonly occur at
shallow depths—Microzonia velutina, Echinothamnion spp. and Lophurella
hookeriana. Durvillaea willana was recorded at one site from each region
(Fig. 8).
The environmental variables explained 46.9% of the variation in algal species
composition among sites (Table 2B). As for benthic community structure, Secchi
(27.5%) and MaxDepth (22.7%) were the variables most strongly related to algal
species composition and these were positively correlated with PC1 (Fig. 7C).
When variables were fitted sequentially, Secchi was the only significant variable,
although MaxDepth was marginally significant (P = 0.056). Unlike the benthic
community structure analysis, sediment was not significantly related to algal
species composition but evechinus was (Table 2B).
There was no clear location-level grouping of sites within each region (Fig. 7A). All Buller sites had similar species composition, except South Seal Rocks where Landsburgia and Sargassum were present (Fig. 8), and there was a high cover of Codium convolutum (Fig. 9C). South Westland sites were spread out along PC2, but this did not correlate strongly with any of the physical variables measured. Evechinus abundance was weakly correlated with PC2 (Fig. 7C). Sites at the top

25Science for Conservation 281
TABLe 3. MACROALGAL (A) AND MOBILe MACROINVeRTeBRATe (B) TAXA ReCORDeD DURING qUADRAT
SAMPLING.
Note: % occ. = percent occurrence, i.e. percentage of quadrats each species was recorded in (n = 517).
% count = percentage of the total number of mobile macroinvertebrates recorded. Text in parentheses indicates species codes used in
Figs 7 and 11.
TAXA % MeAN MeAN TAXA % MeAN % OCC. COVeR COUNT OCC. COUNT COUNT
Crustose corallines 87.81 15.576 – Patiriella spp. (Pati) 37.7 1.188 37.8
Red turf 72.73 13.277 – Evechinus chloroticus (eve) 21.9 0.841 26.8
Coralline turf (C_turf) 56.09 6.722 – Stichaster australis (Stichas) 15.3 0.317 10.1
Plocamium spp. (Ploc) 55.71 3.031 – Diplodontias spp. (Dipl) 10.6 0.120 3.8
Halopteris spp. (Halop) 44.68 4.930 – Haliotis australis (H_aus) 6.0 0.095 3.0
Microzonia velutina (Microz) 36.56 2.088 – Cookia sulcata (Cook) 3.1 0.041 1.3
Lophurella hookeriana (Loph) 26.89 1.764 – Pentagonaster pulchellus (Pent) 2.9 0.029 0.9
Anotrichium crinitum (Ano) 25.73 1.825 – Stichopus mollis (Sticho) 2.5 0.031 1.0
Asparagopsis armata (Asp) 25.15 0.854 – Cryptoconchus porosus (Cryp) 1.9 0.023 0.7
Echinothamnion spp. (echino) 20.70 1.015 – Astrostole scaber (Astro) 1.9 0.019 0.6
Red encrusting (R_enc) 19.92 0.760 – Cellana stellifera (Cell) 1.7 0.031 1.0
Glossophora kunthii (Gloss) 18.76 0.392 – Calliostoma punctulatum (Cpun) 1.7 0.019 0.6
Euptilota formosissima (eup) 17.99 0.616 – Micrelenchus spp. (Micr) 1.5 0.112 3.6
Landsburgia quercifolia (Lands) 13.93 0.155 0.739 Maoricolpus roseus (Maor) 1.4 0.037 1.2
Dictyota spp. (Dicty) 13.15 0.217 – Trochus viridis (Troc) 1.4 0.029 0.9
Sargassum sinclairii (Sarg) 10.44 0.068 0.470 Haliotis iris (H_iris) 1.2 0.122 3.9
Carpomitra costata (Carpom) 10.06 0.051 – Argobuccinulum pustulosum (Argo) 1.0 0.010 0.3
Rhodophyllis gunnii (Rgun) 7.93 0.164 – Plagusia chabrus (Plag) 0.8 0.010 0.3
Zonaria spp. (Zon) 7.16 0.202 – Modelia granosus (Mode) 0.8 0.008 0.2
Ecklonia radiata (eck) 6.96 0.073 0.588 Ophiopsammus maculata (Ophi) 0.6 0.006 0.2
Gymnogongrus furcatus (Gymno) 6.96 0.199 – Allostichaster sp. (Allo) 0.6 0.006 0.2
Carpophyllum flexuosum (Flex) 4.26 0.046 0.356 Pycnogonid sp. (Pycn) 0.6 0.006 0.2
Ballia callitrichia (Ballia) 3.87 0.263 – Turbo smaragdus (Turb) 0.4 0.023 0.7
Gigartina spp. (Gig) 3.68 0.158 – Eudoxochiton nobilis (eudo) 0.4 0.004 0.1
Spatoglossum chapmanii (Spat) 3.68 0.052 – Calliostoma tigris (Ctig) 0.4 0.004 0.1
Colpomenia sinuosa (Colp) 3.48 0.046 – Dicathais orbita (Dica) 0.4 0.004 0.1
Caulerpa brownii (Cbrow) 3.29 0.175 – Buccinulum lineum (Bucc) 0.2 0.004 0.1
Dictyota papenfussii 3.29 0.305 – Cominella adspersa (C_ads) 0.2 0.004 0.1
Codium convolutum (Cconv) 3.09 0.416 – Coscinasterias muricata (Cosc) 0.2 0.002 0.1
Hymenena durvillaei (Hdurv) 2.71 0.040 – Scutus breviculus (Scut) 0.2 0.002 0.1
Ptilonia willana (Ptil) 2.71 0.015 –
Endarachne binghamiae (endar) 2.13 0.040 –
Heterosiphonia concinna (Hetero) 2.13 0.165 –
Platythamnion sp. (Platy) 1.93 0.031 –
Pterocladiella capillacea (Pcap) 1.74 0.041 –
Cystophora scalaris (Cscal) 1.35 0.011 0.046
Ceramium spp. 1.16 0.020 –
Cladophoropsis herpestica 1.16 0.009 –
Plocamium cirrhosum 0.97 0.010 –
Pterocladia lucida (Ptero) 0.77 0.005 –
Durvillaea willana (Dwill) 0.58 0.019 0.044
Ulva spp. 0.58 0.042 –
Bryopsis pinnata (Bryop) 0.39 0.002 –
Desmarestia ligulata (Desm) 0.39 0.002 –
Scoparia hirsuta (Scop) 0.19 0.001 –
Lessonia variegata 0.19 0.002 0.058
Sporochnus sp. 0.19 0.008 –
Xiphophora gladiata 0.19 0.002 0.010
BA

26 Shears—West Coast subtidal reef communities
of the ordination (e.g. Open Bay Islands sites, Crayfish Rocks, Barn Islands and Arnott Point) tended to have higher abundances of large brown algal species such as Sargassum and Landsburgia (Fig. 8). Ecklonia radiata and Carpophyllum flexuosum were also common at Open Bay Islands only. Large brown algae were rare at the remaining sites and the algal assemblages were dominated by a variety of turfing and foliose algal species, e.g. Plocamium, Echinothamnion
and Lophurella.
A
PC1 (50.9%)-40 -20 0 20 40
PC
2 (1
6.6%
)
-40
-20
0
20
40
Big BayBarn CoastCascadesJackson HeadJackson Bay
Open Bay IsMoerakiCape FoulwindKaramea
B
Correlation with PC1-1.0 -0.5 0.0 0.5 1.0
Cor
rela
tion
with
PC
2
-1.0
-0.5
0.0
0.5
1.0
Halop
C_turf
Lands
PlocEck
Microz
Ano
Loph
Dwill
Asp
Echinoth
Flex
Eup
SargCconv
Gloss
Dicty
ZonGymno
Ballia
Cbrow RgunGig
Hetero
Less
R_enc
SpatColp
Pcap
Hdurv
Endar Cscal
Platy
Carpom
Ptil
Ptero
Bryop
Desm
Scop
C
-1.0 -0.5 0.0 0.5 1.0
Evechinus
Fetch
MaxDepth
Slope
Secchi
SedimentWaveExp
Figure 7. A—Principal coordinates analysis of macroalgal species composition (presence-absence data) for West Coast sites. B—Bi-plot showing correlations between principal coordinate axes and species variables. C— Bi-plot showing correlations between principal coordinate axes and environmental variables. See Table 2A for species codes (note: species that were weakly correlated (coefficient < 0.20) with both PC1 and PC2 are not presented in C to make species codes legible). Buller sites—open symbols; South Westland sites—black or grey symbols (grey indicates sites in the ‘Transition zone’ of Roberts et al. 2005).

27Science for Conservation 281
Durvillaea willana
Site
Pengu
in Roc
ks
Pengu
in Inn
er
Crayfi
sh R
ock
Gorge
Is
Browne
I
Barn I
s
Casca
de P
t
Casca
de I
Cemen
t Fac
e
Frog R
ocks
Mocca
sin G
ap
Smoothw
ater P
t
Jack
son B
luff
Jack
son H
ead
SW P
opota
i
NE Taumak
a
NW T
aumak
a
Arnott
Poin
t
Wha
kapo
hai
Moera
ki Rive
r
Granit
e spo
t
North
Granit
e
South
Seal R
ocks
Fishing
Rod
reef
Konga
hu P
t
Falls C
reek
Little
Wan
ganu
i Hea
d0
2
4
6
Cystophora scalaris
0
2
4
6
Carpophyllum flexuosum
0
2
4
6
Sargassum sinclairii
Den
sity
(m-2
+ S
E)
0
2
4
6
Landsburgia quercifolia
0
2
4
6
Ecklonia radiata
0
2
4
6
8
10
12
14Big BayBarn CoastCascadesJackson HeadJackson BayOpen Bay IsMoerakiCape FoulwindKaramea
Figure 8. Mean density of dominant large brown algal species at each site. Horizontal lines indicate
global means across all sites and vertical line indicates
division between South Westland (left) and Buller
(right) sites.

28 Shears—West Coast subtidal reef communities
A
Endarachne binghamiae
Site
Pengu
in Roc
ks
Pengu
in Inn
er
Crayfi
sh R
ock
Gorge
Is
Browne
I
Barn I
s
Casca
de P
t
Casca
de I
Cemen
t Fac
e
Frog R
ocks
Mocca
sin G
ap
Smoothw
ater P
t
Jack
son B
luff
Jack
son H
ead
SW P
opota
i
NE Tau
maka
NW T
aumak
a
Arnott
Poin
t
Wha
kapo
hai
Moera
ki Rive
r
Granit
e spo
t
North
Granit
e
South
Seal R
ocks
Fishing
Rod
reef
Konga
hu P
t
Falls C
reek
Little
Wan
ganu
i Hea
d0
2
4
6
8
Zonaria spp.
0
2
4
6
8
Dictyota spp.
Cov
er (%
+ S
E)
0
2
4
6
8
Glossophora kunthii
0
2
4
6
8
Microzonia velutina
0
5
10
15
20
Halopteris spp.
0
5
10
15
20
25
Big BayBarn CoastCascadesJackson HeadJackson BayOpen Bay IsM oerakiCape Foulw indKaram ea
Figure 9A. Mean cover of dominant small brown algal
species. Horizontal lines indicate global means across
all sites and vertical line indicates division between South Westland (left) and
Buller (right) sites.

29Science for Conservation 281
Figure 9B. Mean cover of dominant red algal species.
Horizontal lines indicate global means across all sites
and vertical line indicates division between South
Westland (left) and Buller (right) sites.
B
Gymnogongrus furcatus
Site
Pengu
in Roc
ks
Pengu
in Inn
er
Crayfi
sh R
ock
Gorge
Is
Browne
I
Barn I
s
Casca
de P
t
Casca
de I
Cemen
t Fac
e
Frog R
ocks
Mocca
sin G
ap
Smoothw
ater P
t
Jack
son B
luff
Jack
son H
ead
SW P
opota
i
NE Tau
maka
NW T
aumak
a
Arnott
Poin
t
Wha
kapo
hai
Moera
ki Rive
r
Granit
e spo
t
North
Granit
e
South
Seal R
ocks
Fishing
Rod
reef
Konga
hu P
t
Falls C
reek
Little
Wan
ganu
i Hea
d0
5
10
15
20
Gigartina spp.
0
5
10
15
20
Echinothamnion spp.
0
5
10
15
20
Lophurella hookeriana
Cov
er (%
+ S
E)
0
5
10
15
20
Anotrichium crinitum
0
5
10
15
20
Plocamium spp.
0
5
10
15
20
25
Big BayBarn CoastCascadesJackson HeadJackson BayOpen Bay IsMoerakiCape FoulwindKaramea

30 Shears—West Coast subtidal reef communities
C
Caulerpa brownii
Site
Pengu
in Roc
ks
Pengu
in Inn
er
Crayfi
sh R
ock
Gorge
Is
Browne
I
Barn I
s
Casca
de P
t
Casca
de I
Cemen
t Fac
e
Frog R
ocks
Mocca
sin G
ap
Smoothw
ater P
t
Jack
son B
luff
Jack
son H
ead
SW P
opota
i
NE Tau
maka
NW T
aumak
a
Arnott
Poin
t
Wha
kapo
hai
Moera
ki Rive
r
Granit
e spo
t
North
Granit
e
South
Seal R
ocks
Fishing
Rod
reef
Konga
hu P
t
Falls C
reek
Little
Wan
ganu
i Hea
d0
5
10
15
Codium convolutum
Cov
er (
% +
SE
)
0
5
10
15
20Big BayBarn CoastCascadesJackson HeadJackson BayOpen Bay IsMoerakiCape FoulwindKaramea
Figure 9C. Mean cover of dominant green algal species.
Horizontal lines indicate global means across all sites
and vertical line indicates division between South
Westland (left) and Buller (right) sites.
Algal species richness (total number of species recorded at each site) also varied
considerably between the two regions (Fig. 10). The mean number of species
recorded at South Westland sites (21.2 ± 0.8) was almost double the mean number
recorded at Buller sites (11.9 ± 0.6). Consequently, species richness was strongly
negatively correlated with latitude (NZ Map Grid, Northing = –0.77) and positively
correlated with Secchi (0.69). evechinus abundance (0.40) and MaxDepth (0.40)
were also weakly positively correlated with algal species richness. The highest
macroalgal species richness was recorded at Open Bay Islands sites, Arnott Point
and Crayfish Rocks.
3 . 5 M O B I L e M A C R O I N V e R T e B R A T e A S S e M B L A G e S
Mobile macroinvertebrate assemblages did not exhibit a clear division between
Buller and South Westland sites (Fig. 11A). While ANOSIM suggested a significant
difference between regions (Global R = 0.547; P = 0.001), this difference was
less distinct compared with that seen for benthic community structure and algal
species composition (as indicated by lower Global R). Furthermore, hierarchical
cluster analysis revealed no clear groupings of sites from the two regions.
environmental variables explained 31.5% of the variation in mobile invertebrate
assemblages; however, the relationship was only marginally significant (P = 0.049,
Table 2C). As for the other community analyses, Secchi explained the largest
amount of variation (16.3%) and was positively correlated with PC1 (Fig. 11C).
None of the other environmental variables were strongly correlated with PC2.
Mobile macroinvertebrate species generally occurred in low numbers on West
Coast reefs with the mean abundance being < 1/m2 for all species except Patiriella
spp. (Table 3B). In total, 24 of the 30 species recorded occurred in less than
3% of the quadrats sampled. Patiriella was the most common and numerically
abundant species (Table 3B), and was found at all sites except Smoothwater

31Science for Conservation 281
Figure 10. Macroalgal species richness. Total
number of macroalgal taxa recorded at each site.
19-21
22-25
26-30
10-1415-20
Total species
Cape Foulwind
Karamea
Moeraki
Open Bay Is
Jackson Head/Bay
Big Bay
Barn CoastCascades
Point (Fig. 12). Patiriella tended to occur in lower numbers around the Jackson
Head, Jackson Bay and Open Bay Islands areas and was positively correlated
with PC2 (Fig. 11B). Evechinus and Stichaster were also relatively common
(Table 3B) and were strongly correlated with PC1 (Fig. 11B). Evechinus was rare
at the Buller sites (only occurring at the two offshore sites: South Seal Rocks and
Fishing Rod Reef) and, in general, was more common at the South Westland sites,
particularly Open Bay Islands, Cascade Island and Arnott Point. Diplodontias
spp. and Haliotis australis were also more common at South Westland sites
and rare at Buller sites. In contrast, Stichaster was generally more abundant at
the Buller sites and rare at most South Westland sites (Fig. 12). Haliotis iris was
locally abundant at Cascade Point and Granite Spot.
3 . 6 B I O G e O G R A P H I C A N A L y S I S
According to the scheme proposed by Roberts et al. (2005), twelve of the sites
sampled in the present study were in the ‘Fiordland open coast–South Westland’
region, seven in Westland–Buller, and eight in the Transition zone (Table 4).
Overall, there was a significant difference in algal species composition among
these regions (ANOSIM: Global R = 0.567, P = 0.001) and there was a clear division
in algal assemblages between Westland–Buller and the other regions (Fig. 7).
However, there was no clear division between sites in Fiordland open coast–

32 Shears—West Coast subtidal reef communities
A
PC1 (35.9%)-60 -40 -20 0 20 40 60
PC
2 (1
8.6%
)
-40
-20
0
20
40
Big BayBarn CoastCascadesJackson HeadJackson Bay
Open Bay IsMoerakiCape FoulwindKaramea
B
Correlation with PC1-1.0 -0.5 0.0 0.5 1.0
Cor
rela
tion
with
PC
2
-1.0
-0.5
0.0
0.5
1.0
Pati
Eve
Stichas
H_iris Diplo
MicrH_aus
CookMaorCell
Sticho
Pent
Troc
Cryp TurbAstroCpun
Argo
Plag
Mode
Ophi
AlloPycnoBucc
C_adsEudo
Ctig
Dica
Cosc
Scut
C
-1.0 -0.5 0.0 0.5 1.0
Fetch
MaxDepthSlope
Secchi
Sediment
WaveExp
Figure 11. A—Principal coordinates analysis of mobile macroinvertebrate assemblages (log(x+1) transformed count data) for West Coast sites. B—Bi-plot showing correlations between principal coordinate axes and species variables. C— Bi-plot showing correlations between principal coordinate axes and environmental variables. See Table 2B for species codes. Buller sites—open symbols; South Westland sites—black or grey symbols (grey indicates sites in Roberts et al.’s (2005) ‘Transition zone’).
South Westland region and the Transition zone and there was only a marginally
significant difference between these two regions (Global R = 0.177, P = 0.036).
Classification success was low for the Roberts et al. (2005) scheme (63.0%) and
seven out of eight sites in their proposed Transition zone were misclassified as
being in the Fiordland open coast–South Westland region. Three of the Westland–
Buller sites were also misclassified as Fiordland open coast–South Westland. Based
on the scheme proposed by Neale & Nelson (1998), twenty of the sites sampled
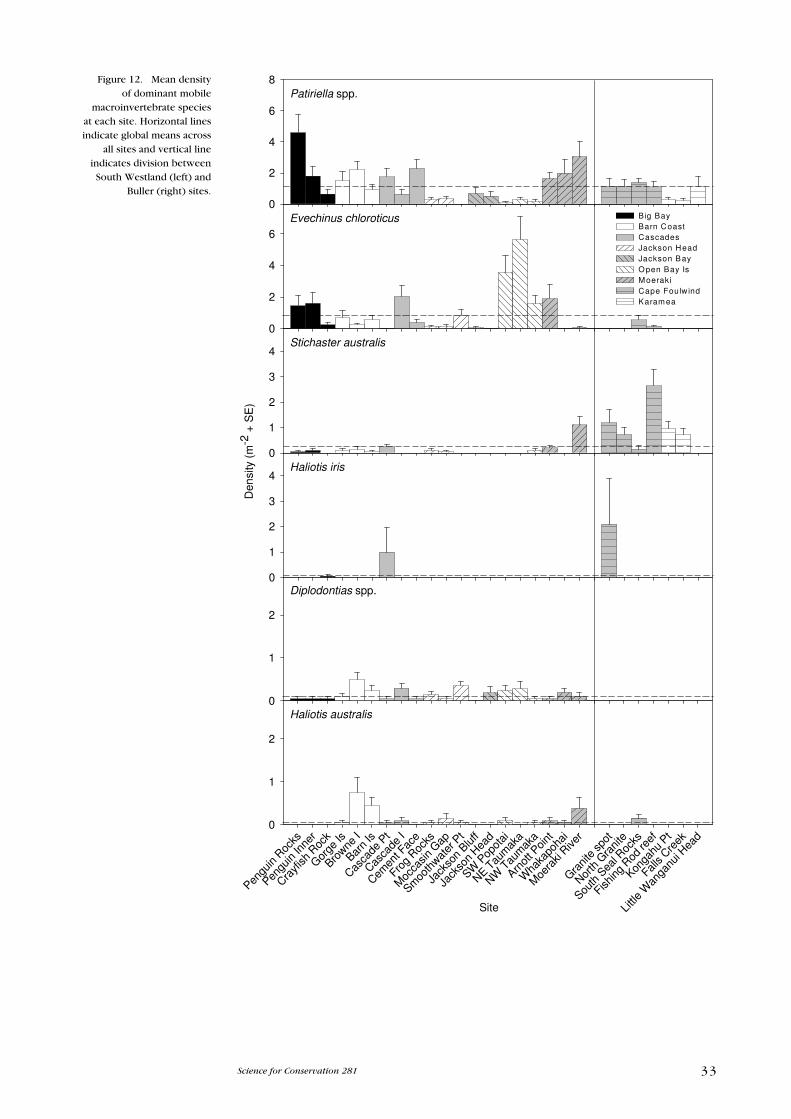
33Science for Conservation 281
Big BayBarn CoastCascadesJackson HeadJackson BayOpen Bay IsMoerakiCape Foulw indKaramea
Haliotis australis
Site
Pengu
in Roc
ks
Pengu
in Inn
er
Crayfi
sh R
ock
Gorge
Is
Browne
I
Barn I
s
Casca
de P
t
Casca
de I
Cemen
t Fac
e
Frog R
ocks
Mocca
sin G
ap
Smoothw
ater P
t
Jack
son B
luff
Jack
son H
ead
SW P
opota
i
NE Tau
maka
NW T
aumak
a
Arnott
Poin
t
Wha
kapo
hai
Moera
ki Rive
r
Granit
e spo
t
North
Granit
e
South
Seal R
ocks
Fishing
Rod
reef
Konga
hu P
t
Falls C
reek
Little
Wan
ganu
i Hea
d0
1
2
Diplodontias spp.
0
1
2
Haliotis iris
Den
sity
(m
-2 +
SE
)
0
1
2
3
4
Stichaster australis
0
1
2
3
4
Evechinus chloroticus
0
2
4
6
Patiriella spp.
0
2
4
6
8
Figure 12. Mean density of dominant mobile
macroinvertebrate species at each site. Horizontal lines indicate global means across
all sites and vertical line indicates division between South Westland (left) and
Buller (right) sites.

34 Shears—West Coast subtidal reef communities
MACROALGAe ReeF FISH
n CLASSIFICATION n CLASSIFICATION
SUCCeSS (%) SUCCeSS (%)
Roberts et al. (2005)
Westland–Buller 7 57.14 11 72.73
Transition 8 12.50 12 33.33
Fiordland open coast– 12 100.00 10 80.00
South Westland
Fiordland 0 – 13 69.23
Total 62.96 63.04
Neale & Nelson (1998)
Buller 7 71.43 10 60.00
Westland 0 – 2 0.00
South Westland 20 100.00 21 100.00
Fiordland 0 – 13 84.62
Total 92.59 82.61
TABLe 4. CLASSIFICATION SUCCeSS (PeRCeNTAGe OF SITeS ASSIGNeD TO
THeIR CORReCT ReGION BASeD ON CAP ANALySIS) OF PReVIOUS MARINe
BIOGeOGRAPHIC CLASSIFICATION SCHeMeS FOR THe WeST COAST USING
MACROALGAL PReSeNCe-ABSeNCe DATA (THIS STUDy) AND ReeF FISH PReSeNCe-
ABSeNCe DATA (ROBeRTS eT AL. 2005) . n INDICATeS THe NUMBeR OF SITeS
SAMPLeD WITHIN eACH OF THe PROPOSeD ReGIONS FOR eACH STUDy.
were in the South Westland region and seven in the Buller region. There was clear
separation in algal species composition between these regions (Fig. 7, Global
R = 0.901, P = 0.001) and CAP analysis revealed a 92.6% classification success
(Table 4) (two ‘Buller’ sites were misclassified as South Westland).
The reef fish data of Roberts et al. (2005) exhibited similar patterns in species
composition, with an overall significant difference in fish assemblages among
their proposed regions (Global R = 0.519, P = 0.001) but a high degree of overlap
(Fig. 13A), and no significant difference (Global R = –0.003, P = 0.444), between
sites located in the ‘Fiordland open coast–South Westland’ region and the
‘Transition zone’. The reef fish assemblages at sites sampled in both ‘Fiordland’
(Milford Sound: 13 sites) and ‘Westland–Buller’ were relatively distinct, although
one Fiordland site (St Anne Bay) was grouped with Buller sites. The St Anne Bay
station was, however, the only rockpool station sampled in Fiordland and had
a comparatively low diversity (7 species) compared with the other Fiordland
stations (13–22 species). The overall classification success was 63.0% for the
Roberts et al. (2005) regions, with 7 out of 12 sites in the proposed ‘transition
zone’ misclassified as ‘Fiordland open coast–South Westland’. The reef fish
assemblage data conformed more closely with the regions proposed by Neale
& Nelson (1998) (Fig. 13B), with highly significant differences among regions
(Global R = 0.667, P = 0.001), and an overall classification success of 82.6%. All 21
‘South Westland’ sites were classified correctly and 84.6% (11/13) of ‘Fiordland’
sites were classified correctly (two were misclassified as ‘South Westland’).
The two sites sampled in the ‘Westland’ region, however, were misclassified as
‘Buller’, and three ‘Buller’ sites were misclassified as ‘South Westland’. There was
no significant difference between the two Westland sites and Buller sites (Global
R = –0.110, P = 0.652).

35Science for Conservation 281
Westland-BullerTransitionFiordland open coast-South WestlandFiords
B
PC1 (41.3%)-60 -40 -20 0 20 40 60
PC
2 (1
8.8%
)
-60
-40
-20
0
20
40
60
A
PC1 (41.3%)-60 -40 -20 0 20 40 60
PC
2 (1
8.8%
)
-60
-40
-20
0
20
40
60
BullerWestlandSouth WestlandFiordland
Westland-BullerTransitionFiordland open coast-South WestlandFiords
B
PC1 (41.3%)-60 -40 -20 0 20 40 60
PC
2 (1
8.8%
)
-60
-40
-20
0
20
40
60
A
PC1 (41.3%)-60 -40 -20 0 20 40 60
PC
2 (1
8.8%
)
-60
-40
-20
0
20
40
60
BullerWestlandSouth WestlandFiordland
Figure 13. Principal coordinates analysis of reef fish species composition (presence-absence data for 90 species from Roberts et al. 2005) for West Coast and Fiordland sites. A—Symbols indicate regions proposed by Roberts et al. (2005); B—Symbols indicate regions proposed by Neale & Nelson (1998).
4. Discussion
4 . 1 H A B I T A T C L A S S I F I C A T I O N
The biological habitat types identified on South Island West Coast (SIWC) reefs
provide a stark contrast to those described from other parts of New Zealand, e.g.
northeastern (Shears et al. 2004) and Kaikoura (Schiel & Hickford 2001). While
some of the same habitats found in northern New Zealand were recorded during
the survey (e.g. ‘Ecklonia forest’, ‘mixed brown algae’ and ‘urchin barrens’),
these were generally rare. Furthermore, the Ecklonia forest described from
Open Bay Islands was restricted to shallow water and comprised short Ecklonia
plants with other large brown algae interspersed. This is in contrast to the deep
water (> 5 m depth) monospecific stands of tall Ecklonia plants found in northern
New Zealand. The most common SIWC habitats recorded were ‘mixed turfing
algae’, ‘invertebrate turf’ and ‘scoured rock’. The ‘mixed turfing algae’ habitat
represents a mix between the ‘turfing algae’ and ‘red foliose algae’ of Shears et
al. (2004) and was typically characterised by a variety of turfing and foliose algal
species (e.g. Lophurella, Anotrichium and Asparagopsis). The ‘invertebrate turf’
habitat is somewhat analogous to the ‘encrusting invertebrate’ habitat of Shears
et al. (2004), being dominated by encrusting ascidians, sponges, hydroids, and
bryozoans. However, in northeastern New Zealand, the ‘encrusting invertebrate’
habitat is typically found on vertical walls, whereas the ‘invertebrate turf’ habitat
at West Coast sites also occurred on flat and sloping areas of reef with high
sediment cover. Similar habitats dominated by filter feeders are typical of sites
with high turbidity in many areas throughout New Zealand (e.g. Banks Peninsula,
New Plymouth, Raglan) (Shears & Babcock 2007).

36 Shears—West Coast subtidal reef communities
The ‘scoured rock’ habitat represents a habitat that is symbolic of the SIWC’s
extreme physical conditions and was particularly common at sites in the Buller
region. Reefs in this habitat were predominantly bare, presumably because of
high levels of sand scour. Crustose coralline algae were the dominant encrusting
form in this habitat and most other encrusting groups were rare. This habitat
was typically found at the sand-reef interface, but at some sites, e.g. Granite Spot
(Cape Foulwind), the majority of the reef (5–10 m) was classified as ‘Scoured
rock’. At Granite Spot, the abalone Haliotis iris (paua) also appeared to be highly
abraded by sand, as the outside of their shells were highly eroded, with the blue-
green nacre being visible (pers. obs.). The ‘scoured rock’ habitat was rare at
sites with steeper sloping reefs, where the effect of sand-scour appeared to be
reduced, e.g. at headlands, offshore islands and rock stacks.
Two mussel-dominated habitat types were also identified (‘Xenostrobus mats’
and ‘Perna beds’) that are generally atypical of subtidal habitats in New Zealand.
‘Perna beds’ were only recorded at Little Wanganui Head at the entrance of
Little Wanganui Inlet, but similar Perna-dominated subtidal reefs also occur
on offshore reefs at Raglan, on the northwestern coast of the North Island
(pers. obs.) and some other parts of the SIWC (D. Neale, pers. comm. 2007).
‘Xenostrobus mats’ were recorded in shallow water (< 7 m) at a number of Buller
sites. While Xenostrobus pulex is typically an intertidal species (Morton 2004),
it also appears to be common on shallow subtidal reefs (< 5 m depth) in certain
parts of New Zealand’s west coast, e.g. Shears & Babcock (2007) also found
X. pulex to be common on subtidal reefs at Raglan.
The bull kelp Durvillaea antarctica, another typically intertidal species, was
an important component of the ‘Durvillaea fringe’ habitat. While this habitat
was often associated with D. willana, which occurs in shallow subtidal areas,
the influence of sweeping by D. antarctica blades also appears to extend into
these areas. Beneath the Durvillaea canopy, the substratum was predominantly
covered in crustose corallines and other groups that were resistant to the sweeping
action of Durvillaea, e.g. encrusting bryozoans. However, this habitat was rarely
encountered in these surveys, as it is generally restricted to very shallow water
(< 1 m depth and low intertidal) and is characteristic of very exposed points and
headlands. In most cases, sampling was carried out in the lee of such physical
features.
Classification analysis indicated distinct differences in communities among the
nine reef habitats identified, providing strong support for their use in classifying
and mapping shallow subtidal reefs along the SIWC. One exception, however,
was ‘Ecklonia forest’, which could not be statistically distinguished from ‘mixed
brown algae’ habitat. ‘Ecklonia forest’ was very rare at the sites sampled and
only three samples (at the Open Bay Islands) were classified as this habitat. In
general, the most common habitats had the highest classification success and
it appears that the low sample sizes for some habitats (n < 10) compromised
the overall classification success. While additional sampling in these habitats
is required to provide a more robust test of their classification success, the
communities found in these habitats all appear relatively distinct. Furthermore,
as discussed in Shears et al. (2004), the classification technique used (CAP) may
also underestimate an observer’s ability to categorise habitats, as it doesn’t take
into account differences in size or morphology of key species. Regardless, 76%
of the samples were classified correctly, based on counts of dominant habitat-

37Science for Conservation 281
forming species and covers of dominant benthic groups, indicating that these
reef habitat types can be reliably identified visually in the field. While this habitat
classification scheme will also be suitable for use with other habitat mapping
techniques (e.g. aerial photography, drop camera and towed video survey
methods), the average sea conditions and water clarity on the SIWC potentially
pose severe limitations to such studies.
4 . 2 F L O R A L A N D F A U N A L C H A R A C T e R I S T I C S O F S I W C S U B T I D A L R e e F S
The macroalgae recorded during quadrat sampling (48 taxa) represent a relatively
small subset of the flora of the West Coast region, primarily because crustose
corallines and red turfs (< 5 cm height), which are the dominant macroalgal forms
on many SIWC reefs, were not identified to species level. Furthermore, many
other larger common species such as Plocamium spp. and Halopteris spp. could
not be identified to species level in the field. Based on museum collections, Neale
& Nelson (1998) recorded more than 175 macroalgal taxa for the SIWC, but also
noted that this was most likely an underestimate of the region’s flora. One of the
characteristic features of the SIWC flora is an absence of many species found
throughout New Zealand. For example, New Zealand’s dominant kelp Ecklonia
radiata (Shears & Babcock 2007) was only recorded at Open Bay Islands. The
extreme physical conditions along the SIWC may be responsible for the absence
or low numbers of many species common to both the north and south.
Fucalean algal species are rare along much of the SIWC. Landsburgia quercifolia
and Sargassum sinclairii were locally abundant at some South Westland sites
and also South Seal Rocks, Cape Foulwind. These algae were found, typically,
at sites on offshore islands or rock-stacks with deeper, clearer water where the
effects of sand-scour were reduced. Cystophora species common to southern
New Zealand (Nelson et al. 2002) were rare at the sites examined, although
Cystophora scalaris was recorded in low numbers at six of the South Westland
sites. Carpophyllum flexuosum was the only Carpophyllum species recorded
and was common at Open Bay Islands (OBI). Carpophyllum maschalocarpum,
which has also been recorded at OBI (Neale & Nelson 1998), was not recorded in
this study. Similarly, Marginariella boryana and Xiphophora gladiata, which
have been recorded at OBI in the past, were not recorded at sites in this location
in the present study. Xiphophora gladiata was, however, recorded in the lee of
Gorge Is. The two kelp species Lessonia variegata and Ecklonia radiata were
both recorded at OBI, but were absent from all other sites. A variety of smaller
brown algal species were common across all locations on the reefs examined,
e.g. Halopteris spp., Glossophora kunthii and Microzonia velutina. Halopteris
congesta was particularly common and formed a short turf (< 5 cm height) in the
shallow subtidal zone at many sites. The small brown algal species Endarachne
binghamiae was only recorded at Buller sites.
Green algae (Chlorophyta) were generally rare on the subtidal reefs sampled on
the SIWC and are potentially limited by high wave action, turbidity and sand-
scour. Caulerpa brownii, which had not been recorded on the SIWC previously
(Neale & Nelson 1998), was common at Big Bay sites and was also recorded at
Barn Islands. The prostrate Codium convolutum, which appears more resistant to

38 Shears—West Coast subtidal reef communities
high wave action than other species, was commonly recorded in South Westland
but was rare at most Buller sites. One exception was South Seal Rocks, Cape
Foulwind, where C. convolutum was highly abundant in the shallow subtidal
zone. Ulva spp. were rare at all sites except Little Wanganui Head where they
were recorded growing on mussels (Perna canaliculus).
Red algae (Rhodophyta) were the most diverse algal group among SIWC sites,
and most of these were more common in South Westland than Buller. However,
a few species that appear more tolerant of sand and gravel abrasion were more
common in the northern Buller region e.g. Gymnogrongrus furcatus and
Gigartina spp. Species of Gigartinaceae were also found by Neale & Nelson
(1998) to be a conspicuous part of the flora in the intertidal zone from Karamea
in the north to about Okarito in the south, but the taxonomy of this group is
poorly understood. Some more northern species such as Pterocladia lucida were
also found to extend down to Karamea, but were sparse. At most South Westland
sites, the shallow subtidal fringe was dominated by a red turfing assemblage with
Echinothamnion spp., Plocamium spp., Lophurella hookeriana, Hymenena
durvillaei, crustose corallines and articulated coralline algae. More delicate
species such as Anotrichium crinitum, Asparagopsis armata, Euptilota
formosissima and Rhodophyllis gunnii were more common in deeper water.
Macroalgal species richness tended to increase with latitude, being higher in the
southern part of the SIWC. This pattern has been reported at a national scale for
New Zealand (Shears & Babcock 2007) and also regionally among northern and
southern Fiords (Nelson et al. 2002). Not surprisingly, there is a clear gradient
in mean SST temperature along the SIWC (strongly positively correlated with
northing among sites, 0.93), but the annual range in temperature is also strongly
correlated and declines with latitude (strongly positively correlated with northing
among sites, 0.99), i.e. reefs in the northern SIWC are subjected to a greater
annual range in SST (NZMeC).
The overall abundance and diversity (28 species) of mobile macro-invertebrates
was considerably lower than that observed for macroalgae. Patiriella spp. were
the most abundant mobile invertebrate species and were found at all sites, except
Smoothwater Point. The actual species of Patiriella were not recorded in the
field, but appear to have predominantly been P. regularis. As for macroalgae,
the majority of species were more common at the South Westland sites, e.g
Evechinus chloroticus, Haliotis iris, Pentagonaster pulchellus and Diplodontias
spp. Only the starfish Stichaster australis was more common at Buller sites. This
species is typically an intertidal species around most of the New Zealand coast
‘on wave-beaten shores, particularly west coasts with the green mussel Perna
canaliculus’ (Morton 2004); however, in this study it was recorded in subtidal
areas at high abundances associated with the mussel Xenostrobus pulex.
The diversity of sessile invertebrates and encrusting fauna was not investigated at
the SIWC sites examined in this study. Instead, species were grouped into general
benthic groups (e.g. ascidians, bryozoans, sponges, anemones, tube worms and
hydroids). In many cases, these groups were dominant components of the reef
communities, particularly at the Buller sites, and much of the diversity of the
SIWC reefs is encompassed in these broad groupings. In addition, numerous
species of bryozoans, ascidians and tube worms observed appeared to be unique
at the national level (pers. obs.). Further investigation of the encrusting fauna

39Science for Conservation 281
on these highly exposed and turbid invertebrate-dominated reefs is necessary to
better understand the nearshore biodiversity of this coast.
4 . 3 C O M M U N I T y S T R U C T U R e A N D P R O C e S S e S
The structures of shallow subtidal reef communities on the West Coast of the
South Island are atypical at a national scale (Shears & Babcock 2007). The reef
communities along the entire Buller coast are exposed to extreme wave action,
high sand scour and high turbidity. Large brown algae (Durvillaea spp.) were
found to be largely restricted to shallow depths (< 2 m), where the reef is covered
by a mixture of crustose coralline algae and algal turfs. At greater depths, the
reef is predominantly bare or covered in a suite of encrusting invertebrates
(e.g. mussels, sponges, ascidians and bryozoans). Reefs in South Westland tend
to have a higher cover of macroalgal groups, although large brown algae are
generally restricted to headlands and offshore islands, e.g. Open Bay Islands, and
sea urchins occur at low numbers. While the South Westland coast is also subject
to high wave action, it does not appear to be as impacted by sand scouring and
high turbidity as sites in the Buller region. The covers of bare rock and most
encrusting invertebrate groups in South Westland are much lower than at Buller
locations and the substratum is generally covered by crustose corallines and a
suite of short turfing algal species. At Open Bay Islands, Ecklonia, Landsburgia,
C. flexuosum and Sargassum sinclairii are common at shallow depths, while
red foliose algae and Evechinus are abundant at depths greater than 7 m.
In general, Open Bay Islands are regionally unique, with a number of species
being found there that are rare or absent at other SIWC sites.
The clear differences in benthic community structure between the two regions
appear to be related to major differences in their physical characteristics. The
two regions span a large latitudinal gradient and while factors such as sea surface
temperature and solar radiation vary among sites, many other environmental
parameters also vary, e.g. turbidity, sand-scour, sedimentation, depth of
coastal waters, extent of rocky reef and reef slope. These factors are all highly
interrelated and turbidity, as measured by Secchi depth, was found to be the single
environmental variable that explained the greatest variation among sites. In most
cases, sites with clearer water are located on offshore islands or rock-stacks and/
or have extensive reefs extending into deeper water. High turbidity potentially
restricts most macroalgal species (particularly large brown algae) to shallow
water and in this study large brown algae (with the exception of Durvillaea
spp.) were rare at highly turbid sites and most common offshore (e.g. at Open
Bay Islands) or in areas with relatively high water clarity (e.g. Crayfish Rocks, Big
Bay). High wave action, sedimentation and sand-scour are also likely to restrict
many species from coastal sites where the reefs were typically dominated by
short turfing algal species or encrusting invertebrates. Overall, the sites surveyed
in the Buller region were more turbid, had shallower reefs and appear to have
higher levels of sand-scour. Roberts et al. (2005) suggested similar mechanisms
were important in explaining variation in reef fish assemblages among regions,
and suggested the low diversity on the northern SIWC (Buller) was most likely
due to low habitat diversity and high exposure. In this study there was no clear
difference in wave exposure between the two regions, with all sites being highly
exposed (wave exposure between 1.4 and 2.3 m), except Jackson Bluff at the

40 Shears—West Coast subtidal reef communities
entrance of Jackson Bay (0.5 m). This is likely to explain why there was no
significant relationship between community structure and wind fetch or wave
exposure (Table 2) among the sites examined. However, both methods used
to estimate wave exposure were not sensitive to small-scale topography that
may affect wave force at sites. There were some differences among sites that
appeared to be related to wave exposure, e.g. Ecklonia was more abundant and
found at larger sizes at the most sheltered Open Bay Islands site (Ne Taumaka)
compared with the more exposed sites at Open Bay Islands.
Grazing by sea urchins is generally considered to be a key structuring process
on temperate reefs (Steneck et al. 2002); however, the sea urchin Evechinus
chloroticus was generally very rare at most of the sites examined. Large
aggregations of urchins occurred at a few sites, forming patches of ‘urchin
barrens’ habitat devoid of large brown algae (e.g. at Open Bay Islands sites and
Crayfish Rocks, Big Bay). However, the effect of urchin grazing at these sites
appeared relatively localised and the barrens habitat not extensive, unlike other
parts of New Zealand (Shears & Babcock 2007). At Open Bay Islands, Evechinus
appeared to play some role in restricting large brown algae from depths greater
than c.7 m. However, the relative roles of grazing, turbidity and sedimentation
in restricting large brown algae from these depths are unknown. In general,
sea urchins were most abundant at sites with the highest abundances of large
brown algae and high species richness. It therefore appears that urchins are
restricted from the turbid coastal sites by the same mechanisms that restrict
kelp, e.g. wave exposure (Siddon & Witman 2003) and sedimentation (Phillips &
Shima 2006; Walker in press). Paua Haliotis iris were also rare at most sites, but
found in dense patches on crustose coralline algae and also bare rock at some
sites around Westport and Cascades. This species was potentially more abundant
historically on the SIWC and may have played a greater role in structuring reef
assemblages.
Research on intertidal reef habitats on the SIWC suggests that intermittent
upwelling on the West Coast provides high levels of subsidies (nutrients,
particulates and propagules) to nearshore areas, ultimately determining the
intensity of species interactions and, subsequently, community structure (Menge
et al. 1999; Menge et al. 2003). These authors found higher levels of predation by
the starfish Stichaster australis, grazing by limpets, and recruitment of mussels
and barnacles on the SIWC, compared with the east coast of the South Island
where upwelling was thought to be less prevalent. In most cases the species
composition on SIWC subtidal reefs is considerably different to that in the
intertidal zone, so it is only possible to draw comparisons at the functional
level. However, one exception was S. australis, which was relatively common
at most Buller sites and Moeraki River in South Westland (Fig. 12). Interestingly,
the highest abundances of S. australis were found at sites where the mussel
Xenostrobus pulex occurred (Fig. 6B). This is broadly consistent with the patterns
described by Menge and his colleagues. Shears & Babcock (2007) also found S.
australis and X. pulex to be common in the subtidal zone at Raglan on the
west coast of the North Island, where upwelling may also be a common feature
of the coastal oceanography (Stanton 1973). However, as Schiel (2004) points
out, the oceanography along the SIWC, and around New Zealand in general, is
highly complex and the relative importance of pelagic-derived (upwelling) and
terrestrial-derived (freshwater) nutrients to nearshore benthic processes needs
further work.
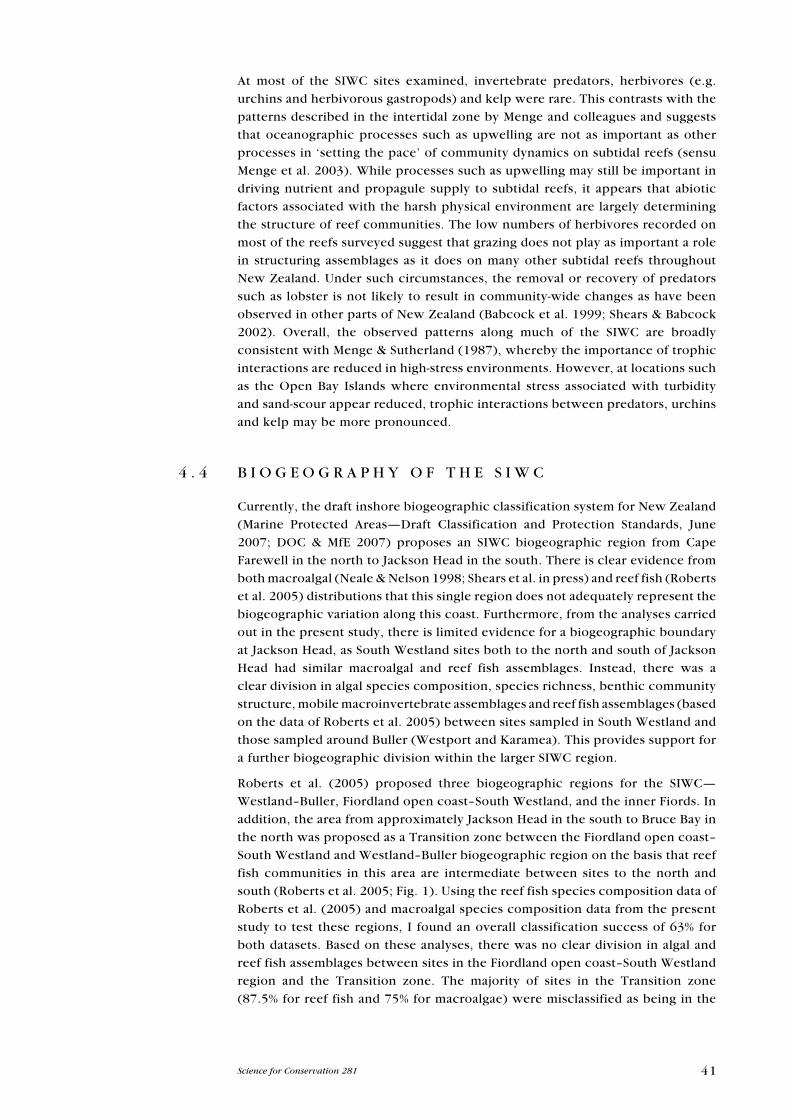
41Science for Conservation 281
At most of the SIWC sites examined, invertebrate predators, herbivores (e.g.
urchins and herbivorous gastropods) and kelp were rare. This contrasts with the
patterns described in the intertidal zone by Menge and colleagues and suggests
that oceanographic processes such as upwelling are not as important as other
processes in ‘setting the pace’ of community dynamics on subtidal reefs (sensu
Menge et al. 2003). While processes such as upwelling may still be important in
driving nutrient and propagule supply to subtidal reefs, it appears that abiotic
factors associated with the harsh physical environment are largely determining
the structure of reef communities. The low numbers of herbivores recorded on
most of the reefs surveyed suggest that grazing does not play as important a role
in structuring assemblages as it does on many other subtidal reefs throughout
New Zealand. Under such circumstances, the removal or recovery of predators
such as lobster is not likely to result in community-wide changes as have been
observed in other parts of New Zealand (Babcock et al. 1999; Shears & Babcock
2002). Overall, the observed patterns along much of the SIWC are broadly
consistent with Menge & Sutherland (1987), whereby the importance of trophic
interactions are reduced in high-stress environments. However, at locations such
as the Open Bay Islands where environmental stress associated with turbidity
and sand-scour appear reduced, trophic interactions between predators, urchins
and kelp may be more pronounced.
4 . 4 B I O G e O G R A P H y O F T H e S I W C
Currently, the draft inshore biogeographic classification system for New Zealand
(Marine Protected Areas—Draft Classification and Protection Standards, June
2007; DOC & Mfe 2007) proposes an SIWC biogeographic region from Cape
Farewell in the north to Jackson Head in the south. There is clear evidence from
both macroalgal (Neale & Nelson 1998; Shears et al. in press) and reef fish (Roberts
et al. 2005) distributions that this single region does not adequately represent the
biogeographic variation along this coast. Furthermore, from the analyses carried
out in the present study, there is limited evidence for a biogeographic boundary
at Jackson Head, as South Westland sites both to the north and south of Jackson
Head had similar macroalgal and reef fish assemblages. Instead, there was a
clear division in algal species composition, species richness, benthic community
structure, mobile macroinvertebrate assemblages and reef fish assemblages (based
on the data of Roberts et al. 2005) between sites sampled in South Westland and
those sampled around Buller (Westport and Karamea). This provides support for
a further biogeographic division within the larger SIWC region.
Roberts et al. (2005) proposed three biogeographic regions for the SIWC—
Westland–Buller, Fiordland open coast–South Westland, and the inner Fiords. In
addition, the area from approximately Jackson Head in the south to Bruce Bay in
the north was proposed as a Transition zone between the Fiordland open coast–
South Westland and Westland–Buller biogeographic region on the basis that reef
fish communities in this area are intermediate between sites to the north and
south (Roberts et al. 2005; Fig. 1). Using the reef fish species composition data of
Roberts et al. (2005) and macroalgal species composition data from the present
study to test these regions, I found an overall classification success of 63% for
both datasets. Based on these analyses, there was no clear division in algal and
reef fish assemblages between sites in the Fiordland open coast–South Westland
region and the Transition zone. The majority of sites in the Transition zone
(87.5% for reef fish and 75% for macroalgae) were misclassified as being in the

42 Shears—West Coast subtidal reef communities
Fiordland open coast–South Westland zone. Instead, the reef fish and macroalgal
data conformed more strongly (had higher classification success) to the regions
proposed by Neale & Nelson (1998), with an overall classification success of 83%
for reef fish and 93% for macroalgae. These results are consistent with Shears et
al. (in press) in that classification analyses based on groups of taxa with short
dispersal distances (e.g. macroalgae) exhibit clearer biogeographic disjunction
and greater classification success than wider dispersing taxa (e.g. fishes). For
both datasets, sites between Big Bay and Bruce Bay (the South Westland region)
formed a relatively clear grouping (100% classification success), distinct from
sites from Fiordland and sites to the north (Westland and Buller). Only two sites
were sampled in the Westland region (Greymouth to Bruce Bay) by Roberts et al.
(2005), and these were both misclassified as Buller. It therefore remains unclear
whether the Westland area proposed by Neale & Nelson (1998) forms a distinct
biogeographic region. The reefs in this area are generally limited in extent and
seldom extend into subtidal zones (Rilov & Schiel 2006), and it appears that the
physical setting, along with an absence of many species, are what characterises
this area as a distinct biogeographic region (Neale & Nelson 1998).
The analyses carried out in this study provide further support for the separation of
Fiordland and South Westland into two distinct regions. While the Fiordland flora
is considered to be most closely related to the flora of the West Coast of the South
Island (Nelson et al. 2002), the national analysis of Shears et al. (in press) clearly
demonstrates a division in algal species composition between South Westland
and Fiordland. The reefs on the outer coast of Fiordland are dominated by
X. gladiata, Ecklonia, and C. flexuosum, and other more ‘southern’ species
such as Marginariella and Cystophora spp. are also common (Shears & Babcock
2007). The southern boundary between South Westland and Fiordland was
proposed as being at Awarua Point (the northern point of Big Bay) by Neale &
Nelson (1998), but the present study suggests this boundary lies to the south of
Big Bay, based on the similarity in algal assemblages between Big Bay and sites
to the north. Both Moore (1949) and Knox (1975) proposed the area around
Milford Sound as the northern boundary of a Forsterian province, while King
et al. (1985) (shelf ecological regions) placed biogeographic boundaries in the
vicinity of Big Bay/Martins Bay. It is possible or even likely that the boundary
is best described not by a single point along the coast, but by an area several
kilometres or tens of kilometres in length. A relative lack of biological survey
sites south of Big Bay makes it difficult to precisely define the location and extent
of this boundary.
5. Summary and conclusions
Nine commonly occurring biological habitat types were identified on the •
SIWC subtidal reefs examined in this study. Some of these habitat types have
not previously been described from New Zealand’s subtidal reefs and some
appear unique to west coast locations (e.g. Xenostrobus mats and scoured
rock). The reef communities within these habitats were biologically distinct
and classification analysis revealed an overall classification success of 76%,
supporting the use of these habitat descriptions in future classification and
mapping studies of SIWC reefs.

43Science for Conservation 281
Large differences were found in reef community structure and diversity •
between Buller and South Westland sites and these differences were strongly
related to differences in turbidity and depth of the reefs. Buller sites were
generally shallow and highly turbid, and were dominated by encrusting
invertebrates, crustose corallines and bare rock. In contrast, other algal
groups were more common at the South Westland sites, which tended to
have higher water clarity and reefs that extended into deeper water. extreme
physical conditions appear to be the key factor controlling reef community
structure, and the influence of sea urchin grazing appears minimal. Only at
a few offshore locations (e.g. Open Bay Islands), and coastal sites with high
water clarity (e.g. Crayfish Rocks, Big Bay) were both sea urchins and subtidal
kelps common. Such locations are rare on the SIWC and should be given
priority for marine protection.
Macroalgal and reef fish species distribution data provided strong support •
for the SIWC biogeographic scheme proposed by Neale & Nelson (1998),
which included South Westland, Westland and Buller regions. There was,
however, limited support for their Westland region (between Greymouth and
Bruce Bay), which may need to be incorporated into the Buller region. There
was considerably less support for the scheme proposed by Roberts et al.
(2005), which proposed a broad biogeographic transition zone from Bruce
Bay to Jackson Head, between a Fiordland open coast–South Westland and a
Westland–Buller region.
For the purposes of assessing representativeness for the protection of marine •
habitats, it is recommended that the proposed SIWC region be divided into
two biogeographic regions: Buller (Cape Farewell to Bruce Bay), and South
Westland (Bruce Bay to Martin’s Bay). However, additional sampling is needed
to determine whether a third biogeographic region is warranted between
Bruce Bay and Greymouth (Westland), and further sampling is needed between
Milford Sound and Big Bay to determine the biogeographic boundary between
Fiordland and South Westland.
6. Acknowledgements
This study was funded by Science & Research Division (now Research,
Development & Improvement Division), DOC (Science Investigation No. 2481)
and West Coast/Tai Poutini Conservancy, DOC. Additional post-doctoral support
was provided by the University of Auckland. I am extremely grateful to the divers
who bravely took their quadrats where no ecologists have been before: Clinton
Duffy, Don Neale, Phil Ross, Mark Martini and Helen Kettles. Thanks also to
Kina Scollay for gallantly skippering the Taku Hoa with impeccable judgement
and confidence, and also to Don Neale for initiating this work, and providing
local knowledge, information and advice throughout. Thanks to Wendy Nelson
(NIWA) for assistance with seaweed identifications, eduardo Villouta (DOC) for
software for calculating wind fetch, and Richard Gorman (NIWA) for modelled
wave exposure estimates.

44 Shears—West Coast subtidal reef communities
7. References
Anderson, M.J. 2002: DISTLM v2: a FORTRAN computer program to calculate a distance based
multivariate analysis for a linear model. Department of Statistics, University of Auckland, 9 p.
Anderson, M.J. 2003: PCO: a FORTRAN computer program for principal coordinate analysis.
Department of Statistics, University of Auckland, New Zealand. Available from www.stat.
auckland.ac.nz/~mja (accessed September 2006). 7 p.
Anderson, M.J.; Willis, T.J. 2003: Canonical analysis of principal coordinates: an ecologically
meaningful approach for constrained ordination. Ecology 84: 511–525.
Andrew, N.L.; Choat, J.H. 1982: The influence of predation and conspecific adults on the abundance
of juvenile Evechinus chloroticus (echinoidea: echinometridae). Oecologia 54: 80–87.
Ayling, A.M. 1981: The role of biological disturbance in temperate subtidal encrusting communities.
Ecology 62: 830–847.
Bustamante, R.H.; Branch, G.M. 1996: Large-scale patterns and trophic structure of southern African
rocky shores—the roles of geographic variation and wave exposure. Journal of Biogeography
23: 339–351.
Choat, J.H.; Schiel, D.R. 1982: Patterns of distribution and abundance of large brown algae and
invertebrate herbivores in subtidal regions of northern New Zealand. Journal of Experimental
Marine Biology & Ecology 60: 129–162.
Clarke, K.R.; Warwick, R.M. 1994: Change in marine communities: an approach to statistical analysis
and interpretation. Natural environment Research Council, UK. 144 p.
Commonwealth-of-Australia 2006: A Guide to the Integrated Marine and Coastal Regionalisation of
Australia Version 4.0. Department of the environment and Heritage, Canberra, Australia.
www.environment.gov.au/coasts/mbp/publications/pubs/imcra4.pdf.
Connor, D.W. 1997: Marine Biotope Classification for Britain and Ireland. Joint Nature Conservation
Review, Peterborough, UK.
DOC (Department of Conservation); Mfe (Ministry for the environment) 2000: The New Zealand
Biodiversity Strategy: our chance to turn the tide. Department of Conservation and Ministry
for the environment, Wellington, New Zealand. 145 p. Available from www.biodiversity.
govt.nz (accessed September 2006).
DOC (Department of Conservation); Mfe (Ministry for the environment) 2007: Marine Protected
Areas—draft classification and protection standard. www.biodiversity.govt.nz/pdf/MPA-
Draft-protection-and-classification-system.pdf (accessed October 2007).
edgar, G.J.; Banks, S.; Farina, J.M.; Calvopina, M.; Martinez, C. 2004: Regional biogeography of
shallow reef fish and macro-invertebrate communities in the Galapagos archipelago. Journal
of Biogeography 31: 1107–1124.
edgar, G.J.; Moverley, J.; Barrett, N.S.; Peters, D.; Reed, C. 1997: The conservation-related benefits of
a systematic marine biological sampling programme—the Tasmanian reef bioregionalisation
as a case study. Biological Conservation 79: 227–240.
Gorman, R.M.; Bryan, K.R.; Laing, A.K. 2003: Wave hindcast for the New Zealand region: nearshore
validation and coastal wave climate. New Zealand Journal of Marine and Freshwater
Research 37: 567–588.
King, K.J.; Bailey, K.N.; Clark, M.R. 1985: Coastal and marine ecological areas of New Zealand:
a preliminary classification for conservation purposes. Department of Lands and Survey,
Wellington, New Zealand. Information Series No 15/1985. 47 p.
Knox, G.A. 1975: The marine benthic ecology and biogeography. Pp. 353–403 in Kuschel, G. (ed.):
Biogeography and ecology in New Zealand. Monographiae Biologicae, Dr W. Junk, The
Hague.

45Science for Conservation 281
Larson, G.L.; Buktenica, M.W. 1998: Variability of secchi disk readings in an exceptionally clear and
deep Caldera Lake. Archiv für Hydrobiologie 141: 377–388.
Lourie, S.A.; Vincent, A.C.J. 2004: Using biogeography to help set priorities in marine conservation.
Conservation Biology 18: 1004–1020.
McArdle, B.H.; Anderson, M.J. 2001: Fitting multivariate models to community data: a comment on
distance-based redundancy analysis. Ecology 82: 290–297.
Menge, B.A.; Daley, B.A.; Lubchenco, J.; Sanford, e.; Dahlhoff, e.; Halpin, P.M.; Hudson, G.; Burnaford,
J.L. 1999: Top-down and bottom-up regulation of New Zealand rocky intertidal communities.
Ecological Monographs 69: 297–330.
Menge, B.A.; Lubchenco, J.; Bracken, M.e.S.; Chan, F.; Foley, M.M.; Freidenburg, T.L.; Gaines, S.D.;
Hudson, G.; Krenz, C.; Leslie, H.; Menge, D.N.L.; Russell, R.; Webster, M.S. 2003: Coastal
oceanography sets the pace of rocky intertidal community dynamics. Proceedings of the
National Academy of Sciences of the United States of America 100: 12229–12234.
Menge, B.A.; Sutherland, J.P. 1987: Community regulation: variation in disturbance, competition,
and predation in relation to environmental stress and recruitment. American Naturalist
130: 730–757.
Moore, L.B. 1949: The marine algal provinces of New Zealand. Transactions of the Royal Society of
New Zealand 77: 187–189.
Morton, J. 2004: Seashore ecology of New Zealand and the Pacific. David Bateman. Auckland.
Neale, D.; Nelson, W. 1998: Marine algae of the West Coast, South Island, New Zealand. Tuhinga
10: 87–118.
Nelson, W.A.; Villouta, e.; Neill, K.F.; Williams, G.C.; Adams, N.M.; Slivsgaard, R. 2002: Marine
macroalgae of Fiordland, New Zealand. Tuhinga 13: 117–152.
Parsons, D.M.; Shears, N.T.; Babcock, R.C.; Haggitt, T.R. 2004: Fine-scale habitat change in a marine
reserve, mapped using radio-acoustically positioned video transects. Marine & Freshwater
Research 55: 257–265.
Phillips, N.e.; Shima, J.S. 2006: Differential effects of suspended sediments on larval survival and
settlement of New Zealand urchins Evechinus chloroticus and abalone Haliotis iris. Marine
Ecology Progress Series 314: 149–158.
Rilov, G.; Schiel, D.R. 2006: Seascape-dependent subtidal-intertidal trophic linkages. Ecology 87:
731–744.
Roberts, C.D.; Stewart, A.L.; Paulin, C.D.; Neale, D. 2005: Regional diversity and biogeography of
coastal fishes on the West Coast South Island of New Zealand. Science for Conservation 250.
Department of Conservation, Wellington, New Zealand. 70 p.
Schiel, D.R. 1990: Macroalgal assemblages in New Zealand: structure, interactions and demography.
Hydrobiologia 192: 59–76.
Schiel, D.R. 2004: The structure and replenishment of rocky shore intertidal communities and
biogeographic comparisons. Journal of Experimental Marine Biology & Ecology 300:
309–342.
Schiel, D.R.; Hickford, M.J.H. 2001: Biological structure of nearshore rocky subtidal habitats in
southern New Zealand. Science for Conservation 182. Department of Conservation,
Wellington, New Zealand. 54 p.
Shears, N.T.; Babcock, R.C. 2002: Marine reserves demonstrate top-down control of community
structure on temperate reefs. Oecologia 132: 131–142.
Shears, N.T.; Babcock, R.C. 2007: quantitative description of mainland New Zealand’s shallow
subtidal reef communities. Science for Conservation 280. Department of Conservation,
Wellington, New Zealand. 126 p.
Shears, N.T.; Babcock, R.C.; Duffy, C.A.J.; Walker, J.W. 2004: Validation of qualitative habitat
descriptors commonly used to classify subtidal reef assemblages in northeastern
New Zealand. New Zealand Journal of Marine & Freshwater Research 38: 743–752.

46 Shears—West Coast subtidal reef communities
Shears, N.T.; Smith, F.; Babcock, R.C.; Duffy, C.A.J.; Villouta, e. in press: evaluation of biogeographic
classification schemes for conservation planning: application to New Zealand’s coastal
marine environment. Conservation Biology.
Siddon, C.e.; Witman, J.D. 2003: Influence of chronic, low-level hydrodynamic forces on subtidal
community structure. Marine Ecology-Progress Series 261: 99–110.
Stanton, B.R. 1973: Hydrological investigations around northern New Zealand. New Zealand Journal
of Marine & Freshwater Research 7: 85–110.
Steneck, R.S.; Graham, M.H.; Bourque, B.J.; Corbett, D.; erlandson, J.M.; estes, J.A.; Tegner, M.J.
2002: Kelp forest ecosystems: biodiversity, stability, resilience and future. Environmental
Conservation 29: 436–459.
Villouta, e.; Chadderton, W.L.; Pugsley, C.W.; Hay, C.H. 2001: effects of sea urchin (Evechinus
chloroticus) grazing in Dusky Sound, Fiordland, New Zealand. New Zealand Journal of
Marine & Freshwater Research 35: 1007–1024.
Walker, J.W. in press: effects of sediment on settlement and survival of juvenile sea urchins
(Evechinus chloroticus). Marine Ecology Progress Series.
Ward, T.J.; Vanderklift, M.A.; Nicholls, A.O.; Kenchington, R.A. 1999: Selecting marine reserves
using habitats and species assemblages as surrogates for biological diversity. Ecological
Applications 9: 691–698.
Wing, S.R.; Gibbs, M.T.; Lamare, M.D. 2003: Reproductive sources and sinks within a sea urchin,
Evechinus chloroticus, population of a New Zealand fjord. Marine Ecology Progress Series
248: 109–123.

47Science for Conservation 281
Appendix 1
M e A N A B U N D A N C e A N D C O V e R O F K e y C O M P O N e N T S O F S I W C S U B T I D A L R e e F H A B I T A T T y P e S
Three tables: A1.1. A1.2 and A1.3.

48 Shears—West Coast subtidal reef communities
HA
BIT
AT
n
D
urv
illa
ea
Eck
lon
ia
OT
He
R L
AR
Ge
SM
AL
L
Re
D F
OL
IOSe
R
eD
TU
RF
C
OR
AL
LIN
e
Re
D
CR
UST
OSe
G
Re
eN
BR
OW
NS
BR
OW
NS
TU
RF
e
NC
RU
STIN
G
CO
RA
LL
INe
S
(Du
rv)
(ec
k)
(O_
Lb
) (S
m_
br)
(R
_fo
l)
(R_
turf
) (C
_tu
rf)
(R_
en
c)
(CC
A)
(GR
ee
)
Du
rvil
laea
fri
nge
2
11.5
± 3
.5
0.0
± 0
.0
0.0
± 0
.0
0.0
± 0
.0
4.0
± 1
.0
9.0
± 2
.0
2.5
± 2
.5
8.0
± 2
.0
70.0
± 5
.0
0.0
± 0
.0
(Dur
)
(8,1
5)
(0,0
) (0
,0)
(0,0
) (3
,5)
(7,1
1)
(0,5
) (6
,10)
(6
5,75
) (0
,0)
Eck
lon
ia f
ores
t 3
0.0
± 0
.0
21.7
± 5
.2
5.0
± 2
.5
6.7
± 3
.5
2.0
± 1
.0
5.0
± 5
.0
10.7
± 4
.7
0.0
± 0
.0
41.0
± 7
.2
0.7
± 0
.7
(eck
)
(0,0
) (1
2,30
) (2
,10)
(0
,12)
(0
,3)
(0,1
5)
(5,2
0)
(0,0
) (2
9,54
) (0
,2)
Mix
ed b
row
n a
lgae
15
0.
0 ±
0.0
2.
6 ±
1.3
11
.9 ±
2.7
19
.0 ±
6.4
14
.7 ±
6.7
18
.6 ±
5.7
17
.4 ±
4.4
0.
9 ±
0.5
20
.4 ±
5.2
0.
3 ±
0.3
(MB
)
(0,0
) (0
,18)
(5
,39)
(0
,85)
(0
,88)
(0
,54)
(0
,50)
(0
,5)
(0,7
5)
(0,4
)
Mix
ed t
urfi
ng
alga
e 29
0.
0 ±
0.0
0.
0 ±
0.0
0.
2 ±
0.2
7.
3 ±
2.2
7.
9 ±
1.8
44
.7 ±
5.3
10
.9 ±
2.4
0.
7 ±
0.4
11
.2 ±
2.7
0.
1 ±
0.0
(MT
)
(0,0
) (0
,0)
(0,5
) (0
,50)
(0
,30.
5)
(0,8
6)
(0,5
0)
(0,1
0)
(0,5
0)
(0,0
.5)
Scou
red
rock
29
0.
0 ±
0.0
0.
0 ±
0.0
0.
0 ±
0.0
1.
1 ±
0.4
0.
3 ±
0.2
1.
6 ±
0.8
0.
7 ±
0.4
2.
8 ±
1.2
21
.3 ±
4.3
0.
6 ±
0.2
(Sco
)
(0,0
) (0
,0)
(0,0
) (0
,10)
(0
,5)
(0,2
0)
(0,1
0)
(0,3
0)
(0,7
4)
(0,5
)
Inve
rteb
rate
tur
f 27
0.
0 ±
0.0
0.
0 ±
0.0
0.
0 ±
0.0
1.
8 ±
0.9
4.
4 ±
1.6
9.
7 ±
3.1
4.
3 ±
1.7
0.
5 ±
0.3
6.
2 ±
2.0
0.
0 ±
0.0
(IT
)
(0,0
) (0
,0)
(0,0
) (0
,22)
(0
,31)
(0
,50)
(0
,35)
(0
,5)
(0,4
0)
(0,1
)
Urc
hin
bar
ren
s 8
0.0
± 0
.0
0.0
± 0
.0
0.0
± 0
.0
0.8
± 0
.6
2.2
± 2
.1
18.9
± 7
.2
3.3
± 2
.5
4.5
± 3
.1
29.9
± 3
.1
0.3
± 0
.3
(UB
)
(0,0
) (0
,0)
(0,0
) (0
,5)
(0,1
7)
(0,4
5)
(0,2
0)
(0,2
5)
(25,
50)
(0,2
)
Per
na
bed
s 3
0.0
± 0
.0
0.0
± 0
.0
0.0
± 0
.0
1.3
± 0
.9
20.0
± 0
.0
1.0
± 0
.6
1.7
± 1
.7
0.0
± 0
.0
2.7
± 1
.2
0.7
± 0
.7
(Per
)
(0,0
) (0
,0)
(0,0
) (0
,3)
(20,
20)
(0,2
) (0
,5)
(0,0
) (1
,5)
(0,2
)
Xen
ostr
obu
s m
ats
7 0.
0 ±
0.0
0.
0 ±
0.0
0.
0 ±
0.0
0.
0 ±
0.0
0.
1 ±
0.1
2.
2 ±
2.1
0.
3 ±
0.3
4.
6 ±
1.9
28
.7 ±
5.5
0.
0 ±
0.0
(Xen
)
(0,0
) (0
,0)
(0,0
) (0
,0)
(0,1
) (0
,15)
(0
,2)
(0,1
5)
(15,
53)
(0,0
)
Ta
ble
A1
.1.
M
eA
N A
BU
ND
AN
Ce
OF
Du
rvil
lae
a s
pp
., E
ck
lon
ia r
ad
iata
(p
er
m2),
AN
D O
TH
eR
LA
RG
e B
RO
WN
AL
GA
e,
AN
D T
He
Pe
RC
eN
TA
Ge
CO
Ve
R O
F O
TH
eR
MA
eC
RO
AL
GA
L G
RO
UP
S.
No
te: N
um
ber
s in
par
enth
eses
ind
icat
e m
inim
um
an
d m
axim
um
val
ues
rec
ord
ed in
eac
h h
abit
at. T
ext
in p
aren
thes
es in
dic
ate
cod
es u
sed
in F
ig. 3
. Fo
r m
ixed
tu
rfin
g al
gae,
29
sam
ple
s w
ere
ran
do
mly
sele
cted
fro
m a
to
tal o
f 11
2.

49Science for Conservation 281
TA
BL
e A
1.2
. M
eA
N P
eR
Ce
NT
AG
e C
OV
eR
OF
Se
SS
ILe
IN
Ve
RT
eB
RA
Te
GR
OU
PS
.
No
te: N
um
ber
s in
par
enth
eses
ind
icat
e m
inim
um
an
d m
axim
um
val
ues
rec
ord
ed in
eac
h h
abit
at. T
ext
in p
aren
thes
es in
dic
ate
cod
es u
sed
in F
ig. 3
. Fo
r m
ixed
tu
rfin
g al
gae,
29
sam
ple
s w
ere
ran
do
mly
sel
ecte
d f
rom
a t
ota
l of
112.
HA
BIT
AT
n
H
yD
RO
IDS
ASC
IDIA
NS
SPO
NG
eS
TU
Be
WO
RM
S B
AR
NA
CL
eS
BR
yO
ZO
AN
S A
Ne
MO
Ne
S X
eN
OST
RO
BU
S P
eR
NA
(Hyd
r)
(Asc
i)
(Sp
on
) (T
ub
e)
(Bar
n)
(Bry
o)
(An
em
) (X
en
o)
(Pe
rna)
Du
rvil
laea
fri
nge
2
0.3
± 0
.3
0.0
± 0
.0
0.0
± 0
.0
0.0
± 0
.0
0.0
± 0
.0
0.3
± 0
.3
0.0
± 0
.0
0.5
± 0
.5
0.0
± 0
.0
(Du
r)
(0
,0.5
) (0
,0)
(0,0
) (0
,0)
(0,0
) (0
,0)
(0,0
.5)
(0,1
) (0
,0)
Eck
lon
ia f
ore
st
3 0.
0 ±
0.0
14
.7 ±
10.
1 0.
0 ±
0.0
0.
0 ±
0.0
0.
0 ±
0.0
0.
0 ±
0.0
3.
5 ±
2.1
0.
0 ±
0.0
0.
0 ±
0.0
(eck
)
(0,0
) (0
,34)
(0
,0)
(0,0
) (0
,0)
(0,0
) (0
,7)
(0,0
) (0
,0)
Mix
ed b
row
n a
lgae
15
0.
0 ±
a 0.
0 1.
5 ±
0.9
0.
4 ±
0.3
0.
0 ±
0.0
0.
0 ±
0.0
0.
0 ±
0.0
0.
3 ±
0.2
0.
0 ±
0.0
0.
0 ±
0.0
(MB
)
(0,0
) (0
,13)
(0
,5)
(0,0
) (0
,0)
(0,0
) (0
,2.5
) (0
,0)
(0,0
)
Mix
ed t
urf
ing
alga
e 29
0.
1 ±
0.1
2.
0 ±
0.6
0.
3 ±
0.2
0.
2 ±
0.2
0.
0 ±
0.0
0.
0 ±
0.0
0.
6 ±
0.4
0.
0 ±
0.0
0.
0 ±
0.0
(MT
)
(0,2
) (0
,10)
(0
,4)
(0,5
) (0
,0)
(0,0
) (0
,10)
(0
,0)
(0,0
)
Sco
ure
d r
ock
29
0.
3 ±
0.2
0.
9 ±
0.9
0.
0 ±
0.0
0.
1 ±
0.1
0.
3 ±
0.2
2.
2 ±
0.9
0.
6 ±
0.2
2.
7 ±
0.8
0.
1 ±
0.1
(Sco
)
(0,4
) (0
,25)
(0
,0)
(0,2
) (0
,5)
(0,1
5)
(0,5
) (0
,15)
(0
,1)
Inve
rteb
rate
tu
rf
27
1.3
± 1
.1
24.7
± 4
.7
2.0
± 1
.2
12.2
± 3
.3
1.1
± 0
.8
3.9
± 2
.0
2.5
± 1
.2
0.0
± 0
.0
0.3
± 0
.2
(IT
)
(0,3
0)
(0,7
4)
(0,3
0)
(0,4
5)
(0,2
0)
(0,4
0)
(0,2
2)
(0,0
) (0
,5)
Urc
hin
bar
ren
s 8
1.3
± 1
.3
0.9
± 0
.6
0.3
± 0
.2
0.0
± 0
.0
0.0
± 0
.0
3.1
± 1
.6
1.5
± 0
.9
0.0
± 0
.0
0.0
± 0
.0
(UB
)
(0,1
0)
(0,5
) (0
,2)
(0,0
) (0
,0)
(0,1
0)
(0,7
) (0
,0)
(0,0
)
Per
na
bed
s 3
0.0
± 0
.0
0.0
± 0
.0
0.0
± 0
.0
0.0
± 0
.0
0.0
± 0
.0
0.0
± 0
.0
0.3
± 0
.3
0.0
± 0
.0
92.0
± 6
.0
(Per
)
(0,0
) (0
,0)
(0,0
) (0
,0)
(0,0
) (0
,0)
(0,1
) (0
,0)
(80,
98)
Xen
ost
robu
s m
ats
7 6.
4 ±
3.0
0.
0 ±
0.0
0.
8 ±
0.7
0.
3 ±
0.3
1.
4 ±
0.9
5.
6 ±
2.7
3.
5 ±
1.0
48
.4 ±
9.1
0.
0 ±
0.0
(Xen
)
(0,2
0)
(0,0
) (0
,5)
(0,2
) (0
,5)
(0,2
0)
(0.1
,7)
(20,
80)
(0,0
)

50 Shears—West Coast subtidal reef communities
TABLe A1.3. MeAN PeRCeNTAGe COVeR OF SeDIMeNT AND BARe ROCK, AND MeAN
ABUNDANCe OF Evechinus .
Numbers in parentheses indicate minimum and maximum values recorded in each habitat. Text in
parentheses indicate codes used in Fig. 3. The overall classification success for each habitat from CAP
analysis is also given. For mixed turfing algae, 29 samples were randomly selected from a total of 112.
HABITAT n SeDIMeNT BARe ROCK Evechinus CLASSIFICATION
(Sed) (Bare) (eve) SUCCeSS
Durvillaea fringe 2 0.0 ± 0.0 0.0 ± 0.0 0.0 ± 0.0 50.0%
(Dur) (0,0) (0,0) (0,0)
Ecklonia forest 3 0.0 ± 0.0 0.0 ± 0.0 1.0 ± 0.6 0.0%
(eck) (0,0) (0,0) (0,2)
Mixed brown algae 15 2.7 ± 2.3 0.1 ± 0.1 0.8 ± 0.4 80.0%
(MB) (0,35) (0,2) (0,6)
Mixed turfing algae 29 17.8 ± 3.7 0.2 ± 0.2 2.0 ± 0.7 75.9%
(MT) (0,70) (0,6) (0,13)
Scoured rock 29 12.2 ± 3.2 49.3 ± 5.7 0.0 ± 0.0 89.7%
(Sco) (0,50) (0,98) (0,1)
Invertebrate turf 27 23.5 ± 4.1 0.5 ± 0.4 0.1 ± 0.1 74.1%
(IT) (0,69) (0,10) (0,2)
Urchin barrens 8 15.8 ± 7.4 0.0 ± 0.0 6.0 ± 2.6 75.0%
(UB) (0,52) (0,0) (0,22)
Perna beds 3 0.0 ± 0.0 0.0 ± 0.0 0.0 ± 0.0 66.7%
(Per) (0,0) (0,0) (0,0)
Xenostrobus mats 7 0.0 ± 0.0 2.4 ± 2.1 0.1 ± 0.1 57.1%
(0,0) (0,15) (0,1)

51Science for Conservation 281
Appendix 2
M A C R O A L G A L T A X A

52 Shears—West Coast subtidal reef communities
Cru
sto
se c
ora
llin
es
x
x
x
x
x
x
x
x
x
x
x
x
x
x
x
x
x
x
x
x
x
x
x
x
x
x
x
Red
tu
rf
x
x
x
x
x
x
x
x
x
x
x
x
x
x
x
x
x
x
x
x
x
x
x
x
x
x
x
Co
ralli
ne
turf
x
x
x
x
x
x
x
x
x
x
x
x
x
x
x
x
x
x
x
x
x
x
–
x
x
x
x
Plo
cam
ium
sp
p.
x
x
x
x
x
x
x
x
x
x
x
x
x
x
x
x
x
x
x
x
x
x
x
– x
x
–
Ha
lopte
ris
spp
. x
x
x
x
x
x
x
x
x
x
x
x
x
x
x
x
x
x
x
x
x
x
x
–
x
x
x
Mic
rozo
nia
vel
uti
na
x
x
x
x
x
x
x
x
x
x
x
x
x
x
x
x
x
x
x
x
–
x
x
– x
–
x
Loph
ure
lla
hooker
ian
a
x
x
x
x
x
– x
x
x
x
x
x
x
x
x
–
x
x
x
x
x
x
– x
x
x
–
An
otr
ich
ium
cri
nit
um
x
x
x
x
x
x
x
x
x
x
x
x
x
x
x
x
x
x
x
x
–
– –
– –
– –
Asp
ara
gopsi
s a
rma
ta
x
x
x
x
– x
–
x
x
– x
x
x
x
x
x
x
x
x
x
–
– –
– –
– –
Ech
inoth
am
nio
n s
pp
. –
x
x
x
x
– x
x
x
x
x
x
x
x
–
– x
–
x
x
– x
–
– x
x
x
Red
en
cru
stin
g x
–
x
x
x
x
x
x
x
x
x
x
– –
x
x
x
x
– x
x
x
x
x
x
x
x
Glo
ssoph
ora
ku
nth
ii
x
x
x
x
x
x
x
x
x
x
x
x
x
x
x
x
x
x
x
x
– x
x
x
x
x
–
Eu
pti
lota
form
osi
ssim
a
x
– x
x
–
x
x
x
x
x
x
x
x
x
x
x
x
x
x
x
– –
– –
– –
–
Lan
dsb
urg
ia q
uer
cifo
lia
–
x
x
x
x
x
x
x
x
– x
x
–
– x
x
x
x
–
-- –
– x
–
– –
–
Dic
tyota
sp
p.
x
x
x
x
x
x
x
–
– x
x
x
x
x
x
–
x
x
x
x
– –
– –
– –
–
Sarg
ass
um
sin
cla
irii
–
x
x
x
– –
– x
x
–
– –
– –
x
x
x
x
– –
– –
x
– –
– –
Ca
rpom
itra
cost
ata
–
– –
x
x
x
x
x
x
x
x
x
– –
x
x
x
x
x
– –
– –
– –
– –
Rh
odoph
ylli
s gu
nn
ii
– –
x
x
– x
–
– –
– x
x
–
x
x
x
x
x
x
– –
– –
– –
– –
Zon
ari
a s
pp
.
x
x
x
x
x
– –
– –
– –
x
x
x
x
– x
x
–
– –
– –
– –
– –
Eck
lon
ia r
adia
ta
– –
– –
– –
– –
– –
– –
x
– x
x
x
–
– –
– –
– –
– –
–
Gym
nogo
ngr
us
furc
atu
s x
x
x
–
– –
x
x
– –
– –
– –
– –
– –
– x
x
x
–
x
x
– x
Ca
rpoph
yllu
m f
lexu
osu
m
– –
– –
– –
– –
– –
– –
– –
x
x
x
– –
– –
– –
– –
– –
Ba
llia
ca
llit
rich
ia
x
x
x
x
x
– x
–
– x
–
x
x
– –
– –
– –
– x
–
– –
– –
x
Gig
art
ina
sp
p .
– –
– –
– –
– –
– –
– –
– –
– –
– –
– –
x
– –
x
x
x
x
Spa
togl
oss
um
ch
apm
an
ii
– –
x
x
– x
–
– –
– x
–
– –
– –
x
– x
–
– –
– –
– –
–
Colp
om
enia
sin
uosa
–
– –
– –
x
– x
x
x
x
x
x
–
x
x
– x
x
–
– –
– –
– –
–
Dic
tyota
pa
pen
fuss
ii
– –
x
– –
– –
– –
– –
– –
– –
– –
x
– –
– –
– –
– –
–
Ca
ule
rpa
bro
wn
ii
– x
x
–
– x
–
– –
– –
– –
– –
– –
– –
– –
– –
– –
– –
Codiu
m c
on
volu
tum
–
– –
– x
x
–
x
x
– –
x
– –
– x
x
x
–
– –
– x
–
– –
–
Hym
enen
a d
urv
illa
ei
– –
– –
x
– x
x
–
– x
–
– –
– –
– –
x
x
– –
– –
– x
–
Pti
lon
ia w
illa
na
–
– –
– –
x
– –
– –
– –
– –
x
– x
–
x
x
– –
– –
– –
–
Het
erosi
ph
on
ia c
on
cin
na
–
– –
– –
x
– x
–
x
– –
– x
–
– –
x
x
x
– –
– –
– –
–
Penguin Rocks
Penguin Inner
Crayfish Rock
Gorge Islands
Browne Island
Barn Islands
Cascade Point
Cascade Island
Cement Face
Frog Rocks
Moccasin Gap
Smoothwater Point
Jackson Bluff
Jackson Head
SW Popotai
Ne Taumaka
NW Taumaka
Arnott Point
Moeraki River
Whakapohai
Granite spot
North Granite
South Seal Rocks
Fishing Rod reef
Kongahu Pt
Falls Creek
Little Wanganui Head
Tax
a
Sou
th W
estl
and
Bu
ller
TA
BL
e A
2.1
.
A L
IST
OF
MA
CR
OA
LG
AL
TA
XA
Re
CO
RD
eD
AT
eA
CH
SIT
e W
ITH
IN e
AC
H R
eG
ION
OF
IS
WC
. ‘X
’ IN
DIC
AT
eS
SP
eC
IeS
PR
eS
eN
T A
T A
SIT
e.
Ta
ble
A2
.1 c
on
tin
ued
on
nex
t pa
ge

53Science for Conservation 281
Ta
ble
A2
.1 c
on
tin
ued
.
En
da
rach
ne
bin
gha
mia
e –
– –
– –
– –
– –
– –
– –
– –
– –
– –
– –
– x
x
x
x
x
Pla
tyth
am
nio
n s
p.
– x
x
x
–
– –
– –
– –
– –
– –
– x
x
x
x
–
– –
– –
– –
Pte
rocl
adie
lla
ca
pil
lace
a
– –
– –
– –
– –
x
– –
– x
–
x
x
– –
– –
– –
– –
– –
–
Cys
toph
ora
sca
lari
s –
x
x
– –
– –
– x
–
– –
– –
– x
x
x
–
– –
– –
– –
– –
Cer
am
ium
sp
p.
– –
– –
– –
– x
–
– x
–
– –
– –
– –
– –
– –
– –
– –
–
Cla
doph
oro
psi
s h
erpes
tica
–
– –
x
– –
– –
– –
– –
– –
– –
x
– x
–
– –
– x
–
– –
Plo
cam
ium
cir
rhosu
m
– –
– –
– –
– –
– –
– –
– –
– –
x
– –
– –
– –
– –
– –
Pte
rocl
adia
lu
cida
–
– –
– –
– –
– –
– –
– –
– –
– –
– –
– –
– –
– x
x
–
Du
rvil
laea
wil
lan
a
– –
– –
– –
– x
–
– –
– –
– –
– –
– –
– x
–
– –
– –
–
Ulv
a s
pp
.
– –
– –
– –
– –
x
– –
– x
–
– –
– –
– –
– –
– –
– –
x
Bry
opsi
s pin
na
ta
x
– –
– –
– –
– –
– –
– –
– –
– –
– –
x
– –
– –
– –
–
Des
ma
rest
ia lig
ula
ta
– –
– –
– –
– –
– –
– –
– –
– –
x
x
– –
– –
– –
– –
–
Less
on
ia v
ari
ega
ta
– –
– –
– –
– –
– –
– –
– –
– –
x
– –
– –
– –
– –
– –
Xip
hoph
ora
gla
dia
ta
– –
– x
–
– –
– –
– –
– –
– –
– –
– –
-- –
– –
– –
– –
Sporo
chn
us
sp.
– –
x
– –
– –
– –
– –
– –
– –
– –
– –
– –
– –
– –
– –
Scopa
ria
hir
suta
–
– –
– –
– –
– –
– –
– –
– –
– –
– –
– –
– –
– –
– x
Penguin Rocks
Penguin Inner
Crayfish Rock
Gorge Islands
Browne Island
Barn Islands
Cascade Point
Cascade Island
Cement Face
Frog Rocks
Moccasin Gap
Smoothwater Point
Jackson Bluff
Jackson Head
SW Popotai
Ne Taumaka
NW Taumaka
Arnott Point
Moeraki River
Whakapohai
Granite spot
North Granite
South Seal Rocks
Fishing Rod reef
Kongahu Pt
Falls Creek
Little Wanganui Head
Tax
a
Sou
th W
estl
and
Bu
ller

Ecology of subtidal reefs on the South Island West Coast
This report describes the biogeography, biological habitat types and community structure of subtidal reefs on the South Island West Coast (SIWC). A biological habitat classification scheme for SIWC subtidal reefs is developed, and nine biological habitat types identified. Analyses support division of the SIWC into two biogeographic regions—northern Buller and South Westland. Abiotic factors (particularly poor water clarity and sand scour) appear to play a dominant role in shaping subtidal reef communities on the SIWC.
Shears, N.T. 2007: Biogeography, community structure and biological habitat types of subtidal reefs on the South Island West Coast, New Zealand. Science for Conservation 281. 53 p.