Embed Size (px)
Citation preview
Biohythane production from the organic fraction
of municipal solid waste: improving existing
anaerobic digestion plants
C. Cavinato*, D. Bolzonella°, F. Fatone°, P. Pavan*, F. Cecchi°
EU FP7 VALORGAS
(ENERGY.2009.3.2.2)
Second generation
biofuels
The Twenty-Sixth International Conference on Solid Waste
Technology and Management
Philadelphia, PA, USA27-30 March 2011
University Ca’ Foscari of Venice * and University of Verona°
1
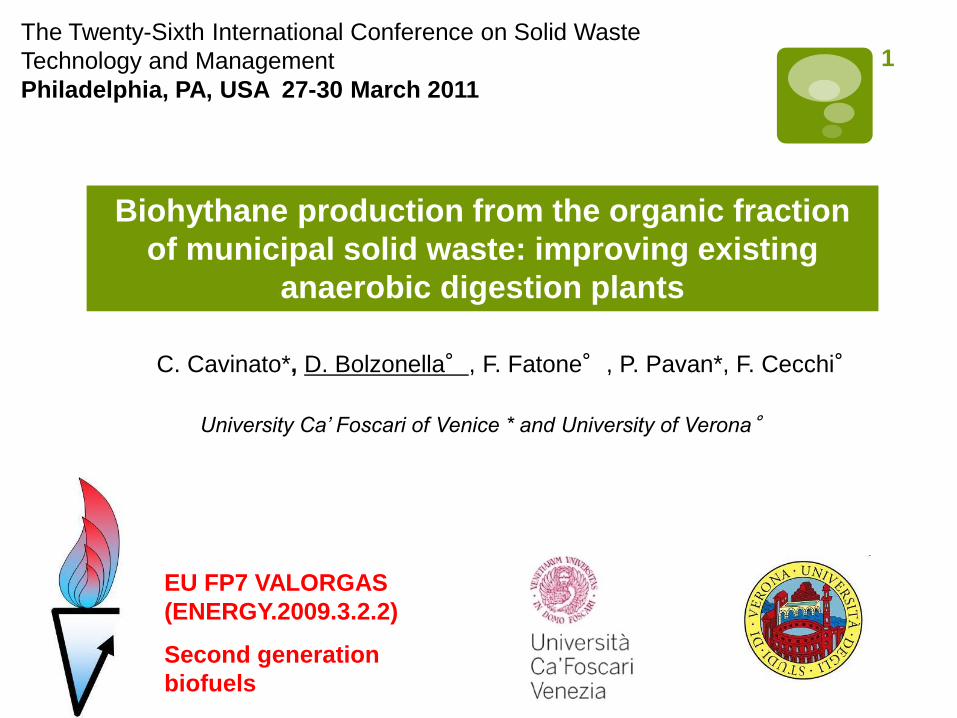
Anaerobic digestion of the organic fraction of MSW is a well established and reliable
technology in Europe
Source: De Baere et al 2010
2
Introduction Experimental Conclusions

Anaerobic digestion of the organic fraction of MSW is a well established and reliable
technology in Europe
Source: De Baere et al 2010
3
Introduction Experimental Conclusions

4
So far, main drivers for this success have been:
the implementation of separate collection of biowaste: this allows for
the treatment of material characterized by a high biogas potential (up to
160-170 m3 biogas per tonne of raw material) and the production of a
digestate of good quality
the subsidies for renewable energy (EU 202020)
Introduction Experimental Conclusions
Introduction Experimental Conclusions
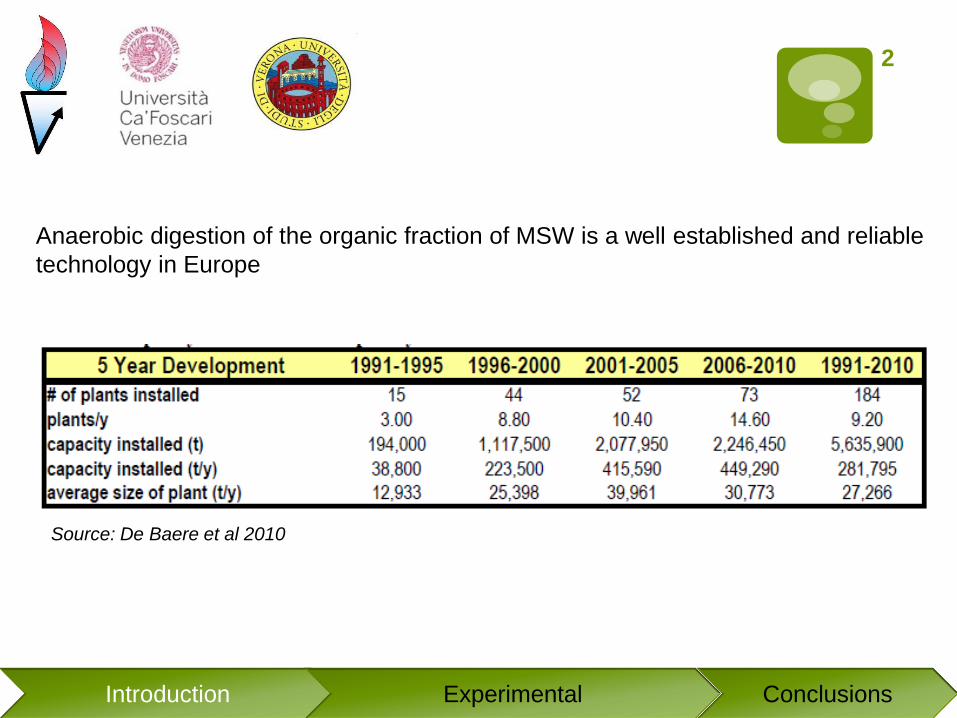
5 A step forward for the improvement of the common anaerobic
digestion process is the two-phase process in thermophilic
conditions: in such a way we optimize the bioreactor operation
and both hydrogen and methane can be produced
1st phase
reactor
2nd phase
reactor
Hydrogen and methane can be collected and used separately or mixed to
produce (bio-)hythane
The overall energy content of the mixture is lower than biogas itself but:
6
The addition of even small amounts (10% or lower) of hydrogen to
biogas extends the lean flammability range significantly while the flame
speed is faster
The CO2 emissions are decreased as less CH4 is produced and
replaced by H2
Introduction Experimental Conclusions
7
Introduction Experimental Conclusions
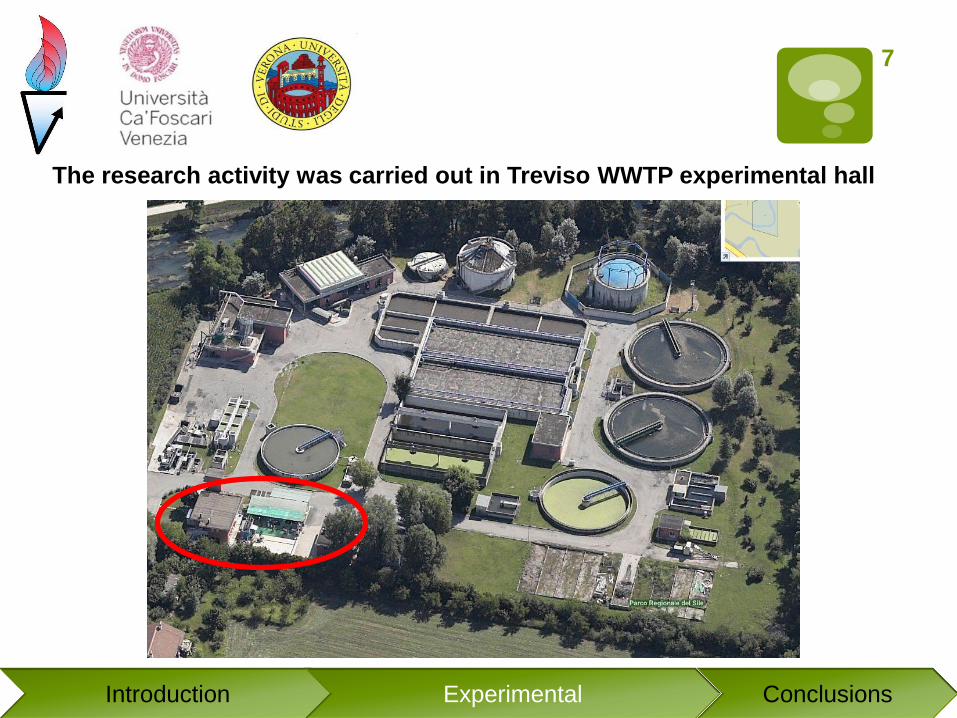
The research activity was carried out in Treviso WWTP experimental hall

CSTR
T = 55°C
V= 0.2 m3
V= 0.8 m3
Run I Run II Run III
HRT 1phase (d) 3.3 3.3 3.3
HRT 2 phase (d) 12.6 12.6 12.6
OLR 1 phase (kgVS/m3d) 16 21 14
OLR 2 phase (kgVS/m3d) 4.2 5.6 3.7
8
Introduction Experimental Conclusions

units average min max S.d.
TS g/kg 242,9 145,3 304,7 71,3
TVS g/kg 179,5 150,0 220,9 40,13
TVS %TS 73,8 61,5 88,4 10,6
COD g/kg 217,2 151,9 273,6 41,02
TKN mgN/kg 5738 2178 8436 2280
TP mgP/kg 198,7 140,7 250,0 39,6
SUBSTRATE: BIOWASTE FROM SEPARATE COLLECTION
units average min max S.d.
pH 7,51 7,31 7,69 0,16
TS g/kg 22,87 22,31 23,38 0,46
TVS g/kg 13,38 13,03 13,70 0,35
TVS %TS 58,48 57,72 59,21 0,61
TKN mgN/kg 0,50 0,48 22,40 0,02
TP mgP/kg 0,06 0,06 0,07 0,01
INOCULUM FROM THE
WWTP FULL SCALE
ANAEROBIC DIGESTOR
9
Introduction Experimental Conclusions
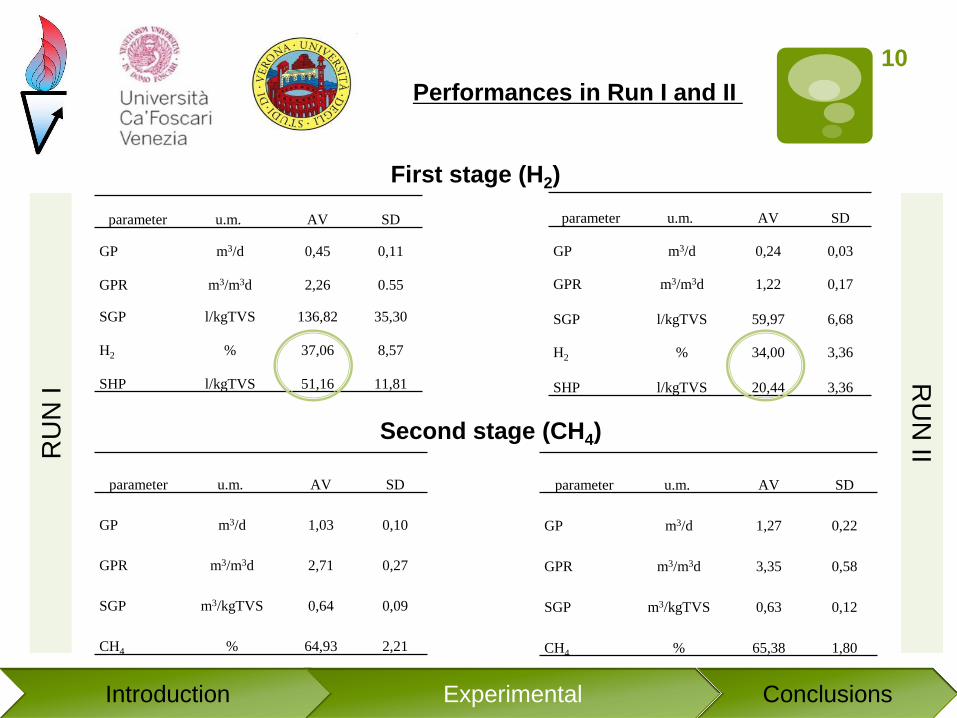
Performances in Run I and II
parameter u.m. AV SD
GP m3/d 0,45 0,11
GPR m3/m3d 2,26 0.55
SGP l/kgTVS 136,82 35,30
H2 % 37,06 8,57
SHP l/kgTVS 51,16 11,81
parameter u.m. AV SD
GP m3/d 1,03 0,10
GPR m3/m3d 2,71 0,27
SGP m3/kgTVS 0,64 0,09
CH4 % 64,93 2,21
Second stage (CH4)
parameter u.m. AV SD
GP m3/d 0,24 0,03
GPR m3/m3d 1,22 0,17
SGP l/kgTVS 59,97 6,68
H2 % 34,00 3,36
SHP l/kgTVS 20,44 3,36
parameter u.m. AV SD
GP m3/d 1,27 0,22
GPR m3/m3d 3,35 0,58
SGP m3/kgTVS 0,63 0,12
CH4 % 65,38 1,80
RU
N I R
UN
II
First stage (H2)
10
Introduction Experimental Conclusions

0,0
10,0
20,0
30,0
40,0
50,0
60,0
70,0
80,0
90,0
12,0 14,0 16,0 18,0 20,0 22,0 24,0
OLR kgTVS/m3d
SH
P l
H2/k
gT
VS
Results of Run I and II suggested to decrease the applied OLR to the first
reactor and improve pH through the partially recycling of the second reactor
11
Introduction Experimental Conclusions

0,0
10,0
20,0
30,0
40,0
50,0
60,0
70,0
80,0
90,0
12,0 14,0 16,0 18,0 20,0 22,0 24,0
OLR kgTVS/m3d
SH
P l
H2/k
gT
VS
Results of Run I and II suggested to decrease the applied OLR to the first
reactor and improve pH through the partially recycling of the second reactor
12
Introduction Experimental Conclusions

DF
CSTR
temp. 55°C
AD
CSTR
temp. 55°C
Partial recycling of the liquid fraction
H2 e CO2
CH4 e CO2
OFMSW
AD effluent
13
Introduction Experimental Conclusions
pH control at 5.5 without the addition of external chemicals
14
Experimental Introduction Experimental Conclusions
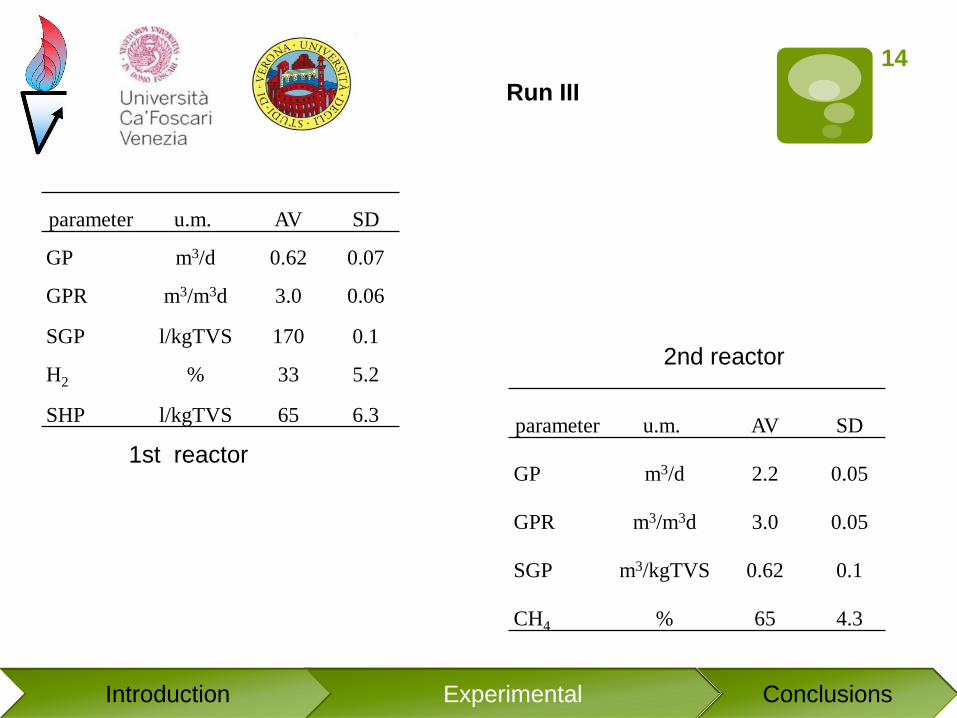
parameter u.m. AV SD
GP m3/d 0.62 0.07
GPR m3/m3d 3.0 0.06
SGP l/kgTVS 170 0.1
H2 % 33 5.2
SHP l/kgTVS 65 6.3 parameter u.m. AV SD
GP m3/d 2.2 0.05
GPR m3/m3d 3.0 0.05
SGP m3/kgTVS 0.62 0.1
CH4 % 65 4.3
Run III
1st reactor
2nd reactor

15
Experimental Introduction Experimental Conclusions
parameter u.m. AV SD
GP m3/d 0.62 0.07
GPR m3/m3d 3.0 0.06
SGP l/kgTVS 170 0.1
H2 % 33 5.2
SHP l/kgTVS 65 6.3 parameter u.m. AV SD
GP m3/d 2.2 0.05
GPR m3/m3d 3.0 0.05
SGP m3/kgTVS 0.62 0.1
CH4 % 65 4.3
Run III
1st reactor
2nd reactor

m
3H2/d
DF m
3CO2/d DF
m3CH4/d DA
m3CO2/d DA
m3gas/d %H2 %CH4 %CO2
GPR [m
3gas/m
3d]
SGP [lgas/kgVS]
RUN I
Average 0,168 0,285 1,337 0,722 2,512 6,7 53,2 40,1 2,6 779
S.d. 0,041 0,070 0,134 0,072 0,317 - - - 0,3 98
Min 0,097 0,165 1,053 0,569 1,884 5,2 55,9 38,9 2,0 584
Max 0,225 0,381 1,471 0,795 2,872 7,8 51,2 40,9 3.0 890
RUN II
Average 0,083 0,161 1,665 0,882 2,791 3,0 59,7 37,4 2,9 661
S.d. 0,012 0,023 0,286 0,151 0,472 - - - 0,5 111
Min 0,075 0,145 1,257 0,665 2,142 3,5 58,7 37,8 2,2 507
Max 0,107 0,207 2,053 1,087 3,454 3,1 59,4 37,5 3,598 818
RUN III
Average 0,220 0,408 1,411 0,740 2,779 7,9 50,8 41,3 2,9 980
S.d. 0,055 0,103 0,185 0,097 0,439 - - - 0,5 154
Min 0,179 0,333 1,280 0,672 2,464 7,3 51,9 40,8 2,6 869
Max 0,283 0,525 1,541 0,809 3,158 9,0 48,8 42,2 3,3 1113
bio hythane mixture obtained
16
Introduction Experimental Conclusions

17
Introduction Experimental Conclusions
H2 energy
content
(kcal/kgVS)
CH4 energy
content
(kcal/kgVS)
Total energy
content
(kcal/kgVS)
Run I 135 3,760 3,900
Run II 51 3,575 3,600
Run III 203 4,750 4,900
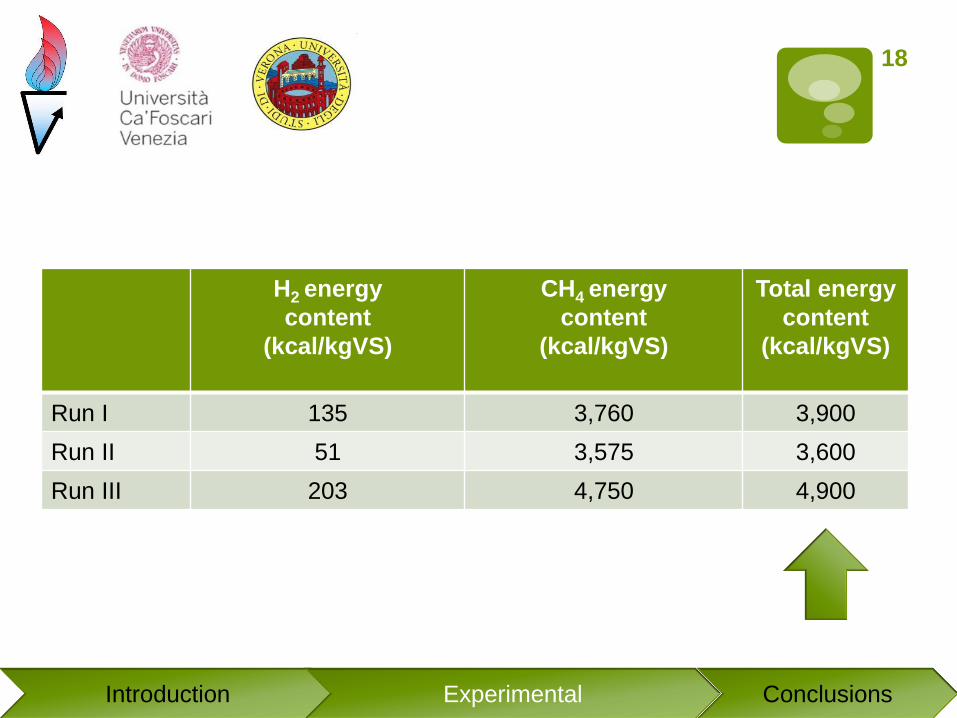
18
Introduction Experimental Conclusions
H2 energy
content
(kcal/kgVS)
CH4 energy
content
(kcal/kgVS)
Total energy
content
(kcal/kgVS)
Run I 135 3,760 3,900
Run II 51 3,575 3,600
Run III 203 4,750 4,900

19
Full scale implementation of the bio-hythane approach in a WWTP:
economical considerations
Introduction Experimental Conclusions

20
Full scale implementation of the bio-hythane approach in a WWTP:
Economical considerations
Introduction Experimental Conclusions
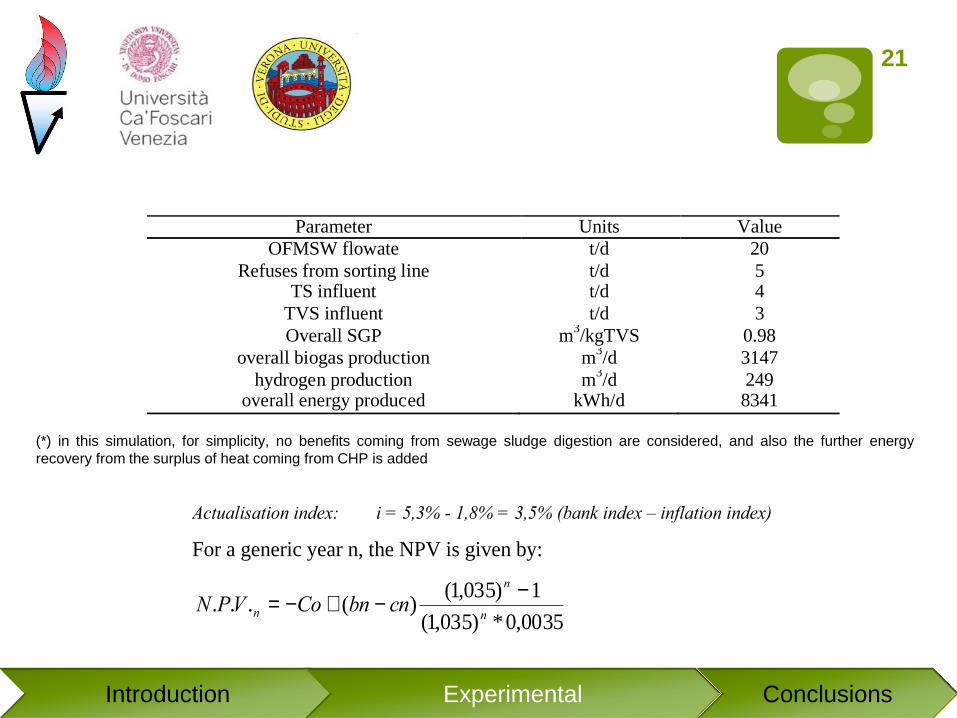
Parameter Units Value
OFMSW flowate t/d 20
Refuses from sorting line t/d 5 TS influent t/d 4
TVS influent t/d 3
Overall SGP m3/kgTVS 0.98
overall biogas production m3/d 3147
hydrogen production m3/d 249
overall energy produced kWh/d 8341
(*) in this simulation, for simplicity, no benefits coming from sewage sludge digestion are considered, and also the further energy
recovery from the surplus of heat coming from CHP is added
Actualisation index: i = 5,3% - 1,8% = 3,5% (bank index – inflation index)
For a generic year n, the NPV is given by:
0035,0*)035,1(
1)035,1()(...
n
n
n cnbnCoVPN-
-+-=
21
Introduction Experimental Conclusions

NPV of the approach proposed
(in the Italian scenario for renewable energy)
-400000
-200000
0
200000
400000
600000
800000
1000000
1200000
1400000
1600000
0 1 2 3 4 5 6 7 8 9 10 11 12
years
NP
V,
euro
s
22
Introduction Experimental Conclusions
The choice of both a two-phase and thermophilic system clearly boosts the economics
Dark fermentation in the first reactor was optimised without any reagent
addiction for pH control and without any previous treatment of inoculum
Recirculation of rejected wastewater after anaerobic digestion from the
second was sufficient to keep the process at ideal condition for hydrogen
production (pH around 5.5)
The highest yield in terms of H2 production was obtained at the lower loading
condition, with a maximum specific hydrogen production of 73.8 lH2/kgTVSfed
for an applied OLR of 14 kgTVS/m3 per day
The second reactor maintained its typical yield of some 0.65 m3/ kgTVS fed
The economical feasibility for this process implementation at full scale was
also analysed
23
Introduction Experimental Conclusions
Take home messages