Embed Size (px)
Citation preview

Bioinformatics, YYYY, 0–0 doi: 10.1093/bioinformatics/xxxxx
Advance Access Publication Date: DD Month YYYY Original Paper
Bioimage informatics Identification of Topological Features in Renal Tumor Microenvironment Associated with Pa-tient Survival Jun Cheng1, Xiaokui Mo2, Xusheng Wang3, Anil Parwani4, Qianjin Feng1,*, and Kun Huang6,5,3,* 1Guangdong Province Key Laboratory of Medical Image Processing, School of Biomedical Engineer-ing, Southern Medical University, Guangzhou 510515, China; 2Center for Biostatistics, The Ohio State University Wexner Medical Center, Columbus, Ohio 43210, USA; 3Department of Electrical and Computer Engineering, The Ohio State University, Columbus, Ohio 43210, USA; 4Department of Pa-thology, The Ohio State University, Columbus, Ohio 43210, USA; 5Department of Biomedical Infor-matics, The Ohio State University, Columbus, Ohio 43210, USA; 6Department of Medicine, Indiana University School of Medicine, Indianapolis, Indiana 46202, USA
*To whom correspondence should be addressed.
Associate Editor: XXXXXXX
Received on XXXXX; revised on XXXXX; accepted on XXXXX
Abstract Motivation: As a highly heterogeneous disease, the progression of tumor is not only achieved by unlimited growth of the tumor cells, but also supported, stimulated, and nurtured by the microenvi-ronment around it. However traditional qualitative and/or semi-quantitative parameters obtained by pathologist’s visual examination have very limited capability to capture this interaction between tumor and its microenvironment. With the advent of digital pathology, computerized image analysis may provide a better tumor characterization and give new insights into this problem. Results: We propose a novel bioimage informatics pipeline for automatically characterizing the topo-logical organization of different cell patterns in the tumor microenvironment. We apply this pipeline to the only publicly available large histopathology image dataset for a cohort of 190 patients with papil-lary renal cell carcinoma obtained from The Cancer Genome Atlas project. Experimental results show that the proposed topological features can successfully stratify early- and middle-stage patients with distinct survival, and show superior performance to traditional clinical features and cellular morpho-logical and intensity features. The proposed features not only provide new insights into the topologi-cal organizations of cancers, but also can be integrated with genomic data in future studies to devel-op new integrative biomarkers. Availability: https://github.com/chengjun583/KIRP-topological-features Contact: [email protected], [email protected] (Qianjin Feng) Supplementary information: Supplementary data are available at Bioinformatics online.
1 Introduction Cancers are highly heterogeneous diseases. Even for a specific type of cancer, there are often different subtypes conferring different clinical outcomes including different prognoses (i.e., survival times) and responses to treatments. For instance, according to the International Union Against Cancer and the American Joint Committee on Cancer, renal cell carcinoma (RCC, also called kidney cancer) histologic subtypes are categorized as clear cell, papil-lary, chromophobe, collecting duct, and unclassified RCC types based on the Heidelberg classification system (Kovacs et al., 1997), and some types of RCC also have its own subtypes. Previous studies on many cancers have suggested that stratification by histologic subtype could provide prognostic value (Patard et al., 2005). Stratifying cancer patients into different subtypes with more accurate prediction of the clinical outcome will greatly enhance
___________________________________________________________________
This is the author's manuscript of the article published in final edited form as:
Cheng, J., Mo, X., Wang, X., Parwani, A., Feng, Q., & Huang, K. (2018). Identification of topological features in renal tumor microenvironment associated with patient survival. Bioinformatics, 34(6), 1024–1030. https://doi.org/10.1093/bioinformatics/btx723
J.Cheng et al.
precision medicine practices. For example, patients with worse prognosis may benefit from closer follow-up, more aggressive treatment, and advance care planning.
Currently, despite fast advances in genome medicine, patient stratification is still often carried out by pathologists by reviewing histopathology slides under a light microscopy. However, such review is often subjective, and both intra- and inter-operator variations are large, frequently leading to dis-crepancies in diagnosis and subtyping results and sometimes even misdiagnosis. Thus there is an urgent need for developing effective computer vision based algorithms and workflows to extract quantitative features that can effectively stratify patients with distinct prognosis.
1.1 Scope of study In this study we focus on the second most common subtype of kidney cancer called papillary renal cell carcinoma (pRCC), accounting for 11% to 15% of all cases (Hansel, 2010). pRCC is a less well understood cancer, and currently there are no effective morphological markers for pRCC that pathologists can use to effectively predict prognosis. We aim to improve the prognostic prediction of pRCC through objective features derived from histopathology images. Despite the specific application, our workflow is a general one focusing on an important aspect of the development of all solid tumors -- the interaction between tumor and its surrounding stroma.
With the development of cancer biology, scientists and clinicians have gained deep insights into the importance of the tumor microenvironment. As a highly heterogeneous organ-like structure, the development of tumor is not only achieved by unlimited growth of the tumor cells, but also supported, stimulated, and nurtured by the microenvironment around it (Pietras and Östman, 2010; Trimboli et al., 2009). The tumor microenvironment includes fibroblasts with large amount of extracellular matrices, blood vessels with endothelial cells, and various immune cells such as macrophages, T-cells, and B-cells, which form the stroma. In fact, the amount of stroma, its organization, gene expression profiles, and interaction with the tumor cells are sometimes more effective predictors for clinical outcomes than the tumor cells alone. For instance, Yuan et al. (Yuan et al., 2012) found that spatial distribution of stromal cells is critical for predicting patient survival in ER- breast cancers while Beck et al. (Beck et al., 2011) found that most of the quantitative histopathological features predicting general breast cancer survival are stromal features.
1.2 Related work Commonly used clinical and pathological factors include patient age, gender, tumor multifocality, stage, grade, cancer specific subtyping, and so on. Patard et al. (Patard et al., 2005) conducted a retrospective study in a large cohort which contains 4063 patients from eight international centers. They concluded that the stratification in three main renal cell carcinoma histologic subtypes (clear cell, papillary, and chromophobe carcinoma) should not be considered as a major prognostic variable comparable to TNM stage, Furman grade, and eastern cooperative oncology group performance status. pRCC is usually classified into 2 subtypes based on specific histologic features, consisting of type 1 (or basophilic) and type 2 (or eosinophilic) (Sukov et al., 2012). Although some pRCCs can be easily split into 2 subtypes, pRCC is usually heterogeneous and can show both type 1 and type 2 features. For this reason, the prognostic value of pRCC type varies between studies. For example, several studies show type 2 pRCC has a significantly worse prognosis than type 1(Moch et al., 2000; Pignot et al., 2007). However, the prognostic utility of subtyping pRCC remains controversial. Ku et al. (Ku et al., 2009) compared pRCC type 1 and type 2 in a small group of 70 patients, and did not observe a statistically significant difference in survival times. Gontero et al. (Gontero et al., 2008) confirmed that finding.
With the recent availability of digital whole-slide images, we can perform systematic analysis of the diverse structures present in histopathology im-ages and may find previously unrecognized image features that correlate with patient prognosis, while reducing the inconsistence arising from subjec-tive interpretation. Quantitative analysis of biomedical images has been an area gaining increasing interest. Plenty of methods have been proposed for tasks like object detection and segmentation (nuclei, mitosis, and glands) (Albarqouni et al., 2016; Xu et al., 2014), benign/malignant image classifica-tion (Zhang, Liu, et al., 2015), and discovery of prognostic factors (Beck et al., 2011; Chen et al., 2015; Veta et al., 2012; Yuan et al., 2012). For prog-nostic factor discovery, most studies focus on tumor morphology; however, we provide an effective workflow taking into account not only cell mor-phology but also the spatial arrangement of different cell patterns, with demonstrated advantages over existing subtyping or cell-based features in pRCC.
1.3 Technical challenges and overview of our contribution One big challenge for computerized histopathological image analysis is that each type of cancer, given the specific anatomical origin, will often have specific structures, calling for specific features. This is also reflected in the fact that pathologists are highly diversified in their expertise usually with focus on one or a couple of types of cancers instead of all cancers. From the computing point of view, it means that researchers need to strike a balance between general workflows and specific quantitative features tailored for specific cancers.
In this paper, we aim at developing a bioimage informatics workflow to quantitatively characterize the interaction between different types of cells in the cancer tissue and examine if such interactions are associated with the outcomes of patients. The tumor microenvironment is a complex milieu, which includes not only the tumor cells but also the stromal cells, immune cells, and even normal, healthy cells. Biopsy tissue staining by such as hema-toxylin and eosin (H&E), can provide a spatial layout of heterogeneous tumor cellularity. Our contributions include: 1) an integrative pipeline to auto-matically learn different cell types and 2) novel topological features characterizing the topological organization of different cell types including both tumor and stroma. This pipeline is universal for other solid tumors, and our application on pRCC will have a high impact on clinical practice.
2 Materials and methods
2.1 Dataset
BOEH features
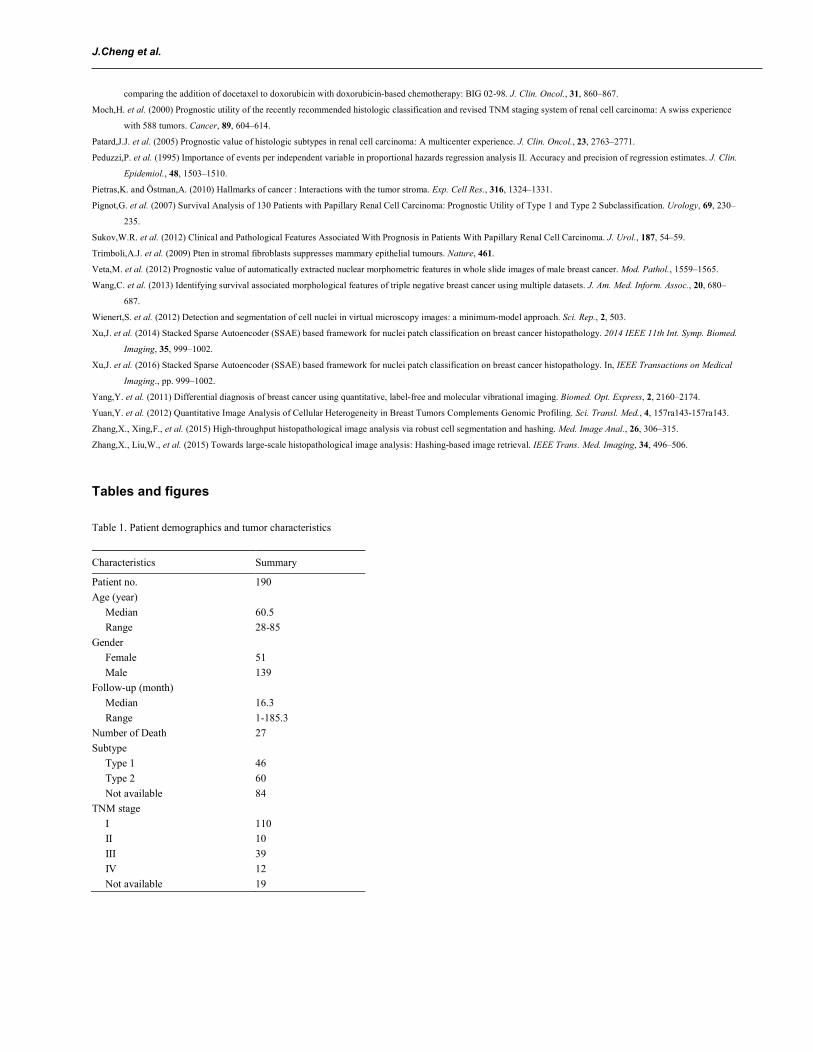
The dataset used in the experiments was downloaded (at May 4, 2016) from The Cancer Genome Atlas (TCGA) portal (project TCGA-KIRP). It con-sists of 190 patients with H&E stained whole slide images (WSI) as well as corresponding clinical information (patients with survival times less than 1 month have been excluded from the study). The typical resolution of a WSI is about 100K by 90K pixels. Due to the limited computational resource and the artifacts present in the image, in each WSI, 2 to 8 regions of interest (ROI) of size 3K by 3K are extracted, resulting in 856 ROIs in total. Regions having too much blood or artifacts are avoided. The patient demographics and tumor characteristics of our dataset are summarized in Table 1. Note that the stage and subtype information of some patients is not available. In addition, since the prognosis prediction is more important for relatively early-stage patients, we focus our study on the patients with stages I, II, and III and exclude the patients with stage IV (the latest stage).
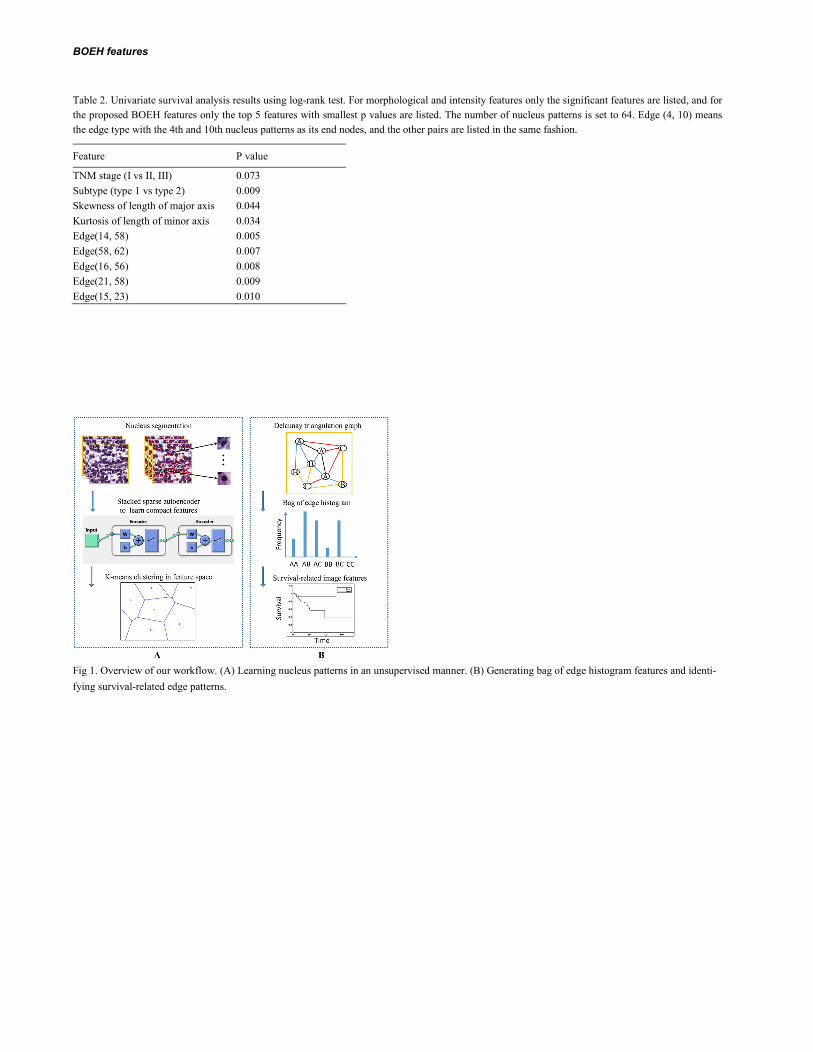
2.2 Overview of the workflow Fig. 1 shows the overview of our workflow to extract topological features, which consists of two modules. The first module (Fig. 1A) shows the process for learning nucleus patterns from the imaging dataset. The second one (Fig. 1B) demonstrates how to generate topological features (bag of edge histo-gram features) for an image using the learned nucleus patterns and Delaunay triangulation. In the following subsections we provide details of our work-flow.
2.3 Nucleus segmentation and patch extraction For nucleus segmentation, we employ a recently proposed approach by Phoulady et al. (Ahmady Phoulady et al., 2016), which is an unsupervised seg-mentation method for cell nuclei in histopathology images. More specifically, following an initial preprocessing step involving color deconvolution and image reconstruction, the segmentation step consists of multilevel thresholding and a series of morphological operations. Unlike the methods in (Al-Kofahi et al., 2010; Wienert et al., 2012), which require many parameters, this method requires no parameter learning or training data because the pa-rameters are set adaptively, making the approach insensitive to variations in staining intensity and appealing to our applications.
After nucleus segmentation, we need to extract nucleus patches centered at the centroids of nuclei to train an autoencoder. In order to choose an ap-propriate patch size that can frame most nuclei and is not too large, for each nucleus we compute the size of the smallest square bounding box that ex-actly covers it. The patch size in our experiments is set to the 90th percentile of all the sizes, which is 41 by 41 pixels.
2.4 Nucleus subtyping using stacked sparse autoencoder Since there are a large number of cell types in the tumor microenvironment each calling for a different set of features for its recognition, it is difficult to design a repertoire of algorithms for this classification. Instead we take an unsupervised approach to categorize the cells based on their morphology without explicitly labeling their histological types using a stacked sparse autoencoder (SSAE) (Fig. 1A). A SSAE is a neural network that consists of multiple layers of sparse autoencoder (SAE) in which the outputs of each layer are wired to the inputs of each successive layer. In a recent work on cell nucleus detection (Xu et al., 2016), SSAE is utilized to learn high-level features from just pixel intensities of small patches. A slide window is applied to each image in order to represent image patches via high-level features obtained from SSAE. The features are subsequently fed into a classifier to determine whether an image patch contains nucleus. However in this paper, instead of putting the learned features into a classifier, we put them into the K-means clustering algorithm to learn K distinct nucleus patterns.
Similar to Xu’s work (Xu et al., 2014), we also employ two SAE layers to form the SSAE whose architecture is shown in Fig. 1A. The SSAE is trained by a greedy layer-wise approach, i.e., training each layer in turn. First, we train a SAE on the training nucleus patches kx . Next, we feed all the training nucleus patches into the first trained SAE, obtaining the primary features 1
kh for each kx . We then use 1kh as input to another SAE to learn
secondary features 2kh . After that, we perform K-means algorithm on 2
kh to generate K nucleus patterns. We randomly choose 50,000 nucleus patches to train the SSAE. The input to the first SAE layer is the vector of pixel intensities corresponding to the
nucleus patch, which is 41 × 41 × 3 dimensional. The number of units of the first and second SAE is set to 400 and 200, respectively.
2.5 Topological features based on Delaunay triangulation For each image, we obtain the label of every nucleus therein by the following steps: nucleus segmentation, nucleus patch extraction, feeding them into the learned SSAE to generate high-level features, and quantizing these features to one of the K clusters. Given an image I consisting of its nuclei
( ) { }iO I o= , we construct a graph { , }G V E= on the nuclei's centroids using Delaunay triangulation, where vertex set V includes every nucleus ( )io O I∈ , and edge set E contains triangle edges ( , )m nedge o o . Edges are labeled with regard to their end nodes, regardless of their order.
Then, we characterize the image by the histogram of edge types, which we call bag of edge histogram (BOEH for short) (Fig. 1B). If there are K nu-cleus patterns, the dimensionality of BOEH would be ( 1) / 2K K K× − + . The first term is the number of combinations when two nuclei come from different types, and the second term is the number of combinations when two nuclei are of the same type. Note that each patient has multiple images and the BOEH representations of these images for each patient are summed and then L1-nomalized.
The BOEH representations encode the neighborhood information between adjacent nuclei. Fig. 1B shows a schematic diagram of constructing a De-launay graph on 8 nuclei. For the sake of simplicity, there are only three types of nuclei and therefore six edge types. Triangle edge types are indicated with different colors.
2.6 Morphological and intensity features In addition to the proposed BOEH representations, we also implement some morphological and intensity features (Yang et al., 2011) for comparison. Ten cell-level features are computed for each segmented nucleus: nuclear area, lengths of major and minor axes of cell nucleus and their ratio, mean pixel values of nucleus in RGB three channels respectively, as well as mean, maximum, and minimum neighbor distances of cell nuclei in Delaunay triangulation graph. Afterwards, for each type of cell-level features extracted from a patient, five statistical distribution parameters, including mean
J.Cheng et al.
value, standard deviation, skewness, kurtosis, and entropy, are calculated to characterize the distribution of cell-level features. Consequently, a total of fifty patient-level features are extracted to describe each patient. Skewness is a measure of the asymmetry of the data around the sample mean. Kurtosis is a measure of how outlier-prone a distribution is. And entropy is a statistical measure of randomness.
2.7 Machine-learning methods for prognosis prediction A lasso-regularized Cox regression model (lasso-Cox model) is built on image features to predict the risk indices of patients and divide them into a low-risk or high-risk group (R package “glmnet”). To validate our method, Leave-one-out cross validation (CV) strategy is used due to relatively small sample size and low death rate (Table 1). More specifically, in each round of the leave-one-out CV process, a single patient is left out as test set with the rest as training set. In the training set, to reduce high dimensionality of BOEH features, we first perform univariate Cox regression to select features strongly related to survival by dichotomizing patients using median feature value and calculating the hazard ratio between the two groups. Features with hazard ratios greater than 4 or less than 0.25 are selected. Next, principle component analysis (PCA) is used to reduce noise and decorrelate these fea-tures, and Cox regression model is trained using the top two principle components. To predict the risk index of the held-out patient, we select survival-related features based on the feature selection results in the training set, apply the PCA projection matrix learned from training set to the test data, and put the reduced features to the learned Cox regression model. Note that only the training set is used for feature selection and PCA while the test sample is excluded from training. After n rounds, each patient is assigned a predicted risk index. Finally, patients are divided into two groups (low-risk vs. high risk) using the median risk index as cut-off point, and log-rank test is used to test if there are distinct survival outcomes between the two groups.
In addition, we conduct receiver-operator characteristics (ROC) curve analysis for binary outcome of 5-year survival to determine the prognosis pre-diction capability for tumor stage, tumor subtype, and the predicted risk index of Cox regression model by using nearest neighbor estimation method (Heagerty et al., 2000; Heagerty and Zheng, 2005).
3 Results
3.1 Nucleus segmentation, subtyping, and BOEH representations For evaluating nucleus segmentation algorithm, we manually count the true number of nuclei, the number of nuclei identified by the segmentation algo-rithm, and the number of false positives in eight image patches of size 1500 × 1500 pixels; the three numbers are 4082, 4159, and 168 respectively. The recall is (4159-168)/4082 = 97.77%, and precision is (4159-168)/4159 = 95.96%. Thus this nucleus segmentation algorithm performs well enough for the subsequent steps in our pipeline. Examples of segmentation results are shown in Fig. S1.
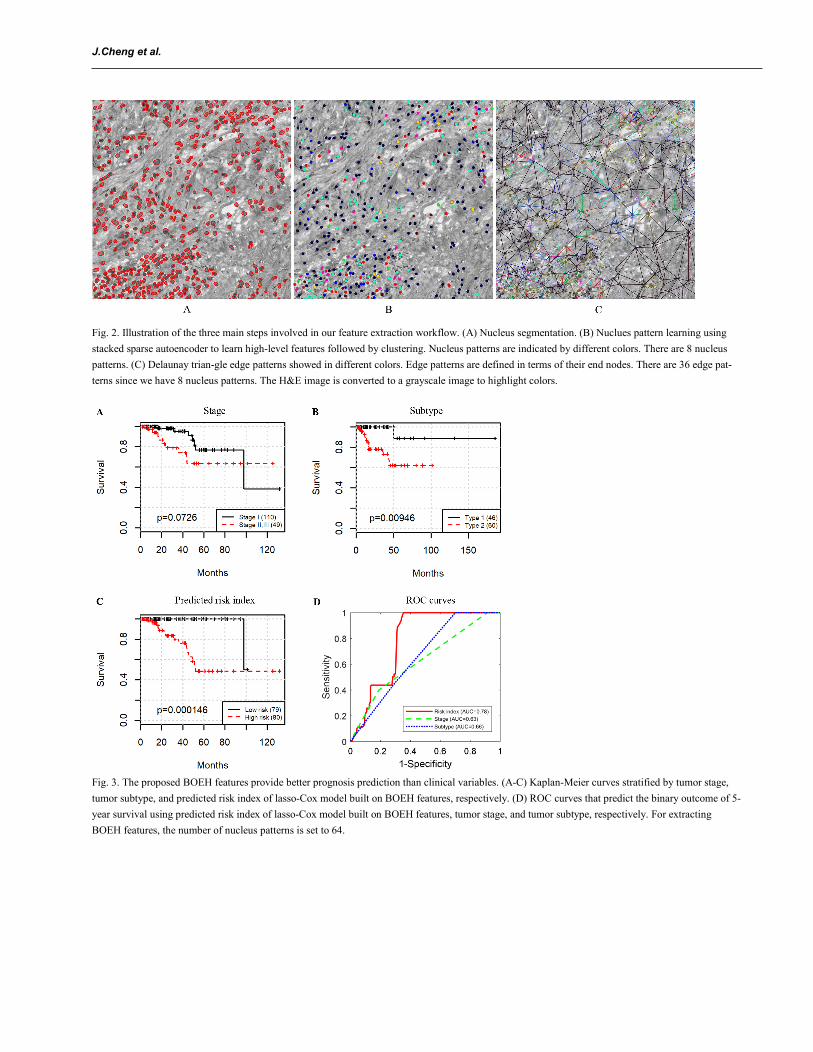
Using a ROI as an example, Fig. 2 shows the results of several steps involved in our computer-aided image analysis pipeline, including nucleus seg-mentation, nucleus subtyping by K-means clustering algorithm on the high-level features learned by SSAE, Delaunay triangulation on nucleus cen-troids, and construction of bag of edge histogram features. In this figure, we set the number of clusters to 8 in K-means algorithm, so we will have 8 distinct nucleus patterns and therefore 8 × (8-1)/2+8 = 36 edge types. We can see clearly that the proposed feature representations can capture the inter-action between nuclei and their neighbors, which may provide useful information about patient prognosis.
3.2 Prognostic values of BOEH representations Since prognosis prediction for patients with terminal cancer is not crucial, instead we focus on survival analysis for relatively early to middle-stage (I, II, and III) patients, and patients with stage IV are excluded. By setting a large number of nucleus patterns, we can characterize nuclei more distinctive-ly and discover the potential topological arrangements of nuclei that are related to patient prognosis. Several values of the number of nucleus patterns are tried, 8, 16, 32, and 64, which corresponds to 36, 136, 528, and 2,080 dimensional BOEH representations (see Section 2.5). To conduct univariate survival analysis, patients are divided into 2 groups using the median of each feature. Results from log-rank test on each feature reveal that 1 out of 36, 1 out of 136, 16 out of 528, and 51 out of 2,080 are significantly associated with patient survival. Besides, we also conduct univariate survival analysis on the 50 morphological features and 2 pathological variables, i.e., TNM stage and pRCC subtypes. We merge stage II and III into one group and com-pare it with stage I. Among the 50 morphological features, 2 features are identified to be related to survival. Table 2 shows the p values of log-rank test for the pathological and image features. Due to limited space, only the 2 significant morphological features are listed, and only the top 5 significant BOEH features with the smallest p values are listed. For extracting the BOEH features in Table 2, the number of nucleus patterns is set to 64.
Fig. 3A-C show the Kaplan-Meier survival curves stratified by stage, subtype, and lasso-Cox on BOEH features, respectively. Early stage trends with better survival (log-rank test p = 0.0726, Fig. 3A). Patients with pRCC type 2 have worse prognosis than those with pRCC type 1 (log-rank test p = 0.00946, Fig. 3B), which is consistent with the conclusion by Pignot (Pignot et al., 2007). Patient stratification by the predicted risk inedx provides the best prognosis prediction (log-rank test p = 1.46e-4, Fig. 3C. See Section 2.7 for details of model training and classification). In addition, area under the curve (AUC) of ROC that predicts the binary outcome of 5-year survival for the stage and subtype is 0.63 and 0.66, respectively. The predicted risk index achieves an AUC of 0.78 (Fig. 3D. See Section 2.7 for the methods used to plot ROC curves). Therefore, the proposed BOEH features have a better predictive capability than stage or subtype.
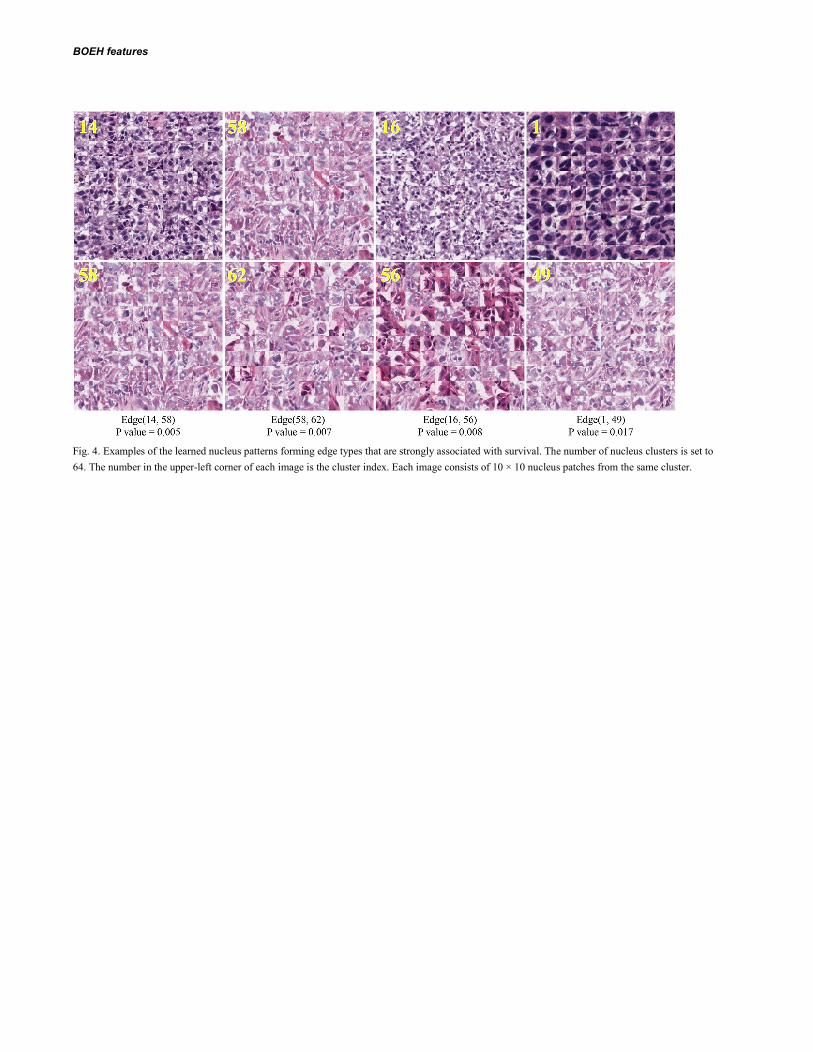
Fig. 4 shows some nucleus patch patterns that form the edge types that are strongly associated with survival, identified by univariate survival analysis (Table 2). Although these nucleus clusters contain mostly tumor cells with diverse texture, there exist different levels of stromal deposition around the nucleus clusters (e.g., 1, 58, and 56). The clusters 16 and 14 also show strong interactions between tumor cells and lymphocytes (as shown in Fig. S2). Therefore these four pairs of clusters with most significant difference between patient survival times are involved in tumor heterogeneity, implying the importance of stroma-tumor-lymphocyte interaction which is consistent with previous findings (Yuan et al., 2012; Beck et al., 2011; Loi et al., 2013) that stromal tissue and tumor-infiltrating lymphocytes also play an important role in predicting survival times.
BOEH features
4 Discussion Nuclei in histopathology images play a very important role in cancer diagnosis and prognosis prediction. Many studies have been focusing on nuclear morphological features. However, in this study we present a workflow to automatically extract image features which considers both nucleus morpholo-gy and topology of the distribution of different types of nuclei. Based on these features, we find that the co-occurrences of some nucleus patterns are potential biomarkers for pRCC with stronger prognostic power than clinical staging or existing subtyping in the TCGA-KIRP dataset. The interaction among different tumor cells, stromal cells, and lymphocytes is known to play a major role in cancer growth and progression. Our method provides a way of quantitatively characterizing this interaction, and our results suggest that some connecting edges between tumor cells and stromal cells are relat-ed to patient survival.
Many previous studies for discovering prognostic image features require laborious labeling by skilled pathologist, such as labeling various cell types (Yuan et al., 2012) and classifying tissues into epithelium or stoma (Beck et al., 2011; Wang et al., 2013). In contrast, our approach is fully-automated, which can learn potential nucleus patterns via an unsupervised feature learning algorithm (i.e., stacked sparse autoencoder) followed by clustering. Although the learnt nucleus patterns may not explicitly correspond to known cell types such as cancer cells, stromal cells or lymphocytes, due to this flexibility it enables us to thoroughly investigate nucleus morphology and their spatial arrangement which are proved by our experiments to be related to clinical outcomes.
Our study has several limitations. First, although cross validation is used to validate our method, the proposed topological features need to be tested on other validation cohorts to fully validate its generalizability. This is an ongoing effort as we are collecting pRCC samples from multiple sites. Sec-ondly, a common practice in survival analysis is to first conduct univariate survival analysis to identify significant variables and then to carry out multi-variate survival analysis on these variables using Cox regression to determine independently significant variables. However, in order for results of the multivariate Cox regression to be reliable, there must be at least ten events (deaths) for each investigated variable (Peduzzi et al., 1995). Due to the relatively few events in our dataset (16 in 159), we don’t do testing for independence of features. Lastly, since the nucleus patterns are learnt directly from the images by the SSAE, they need to be further interpreted by pathologists.
Future work of research includes automated detection of artifacts in histopathological images and application of our method to other cancers and tasks. Currently regions of interest are manually selected in our study, which is infeasible for very large dataset. Automated detection of artifacts can make our pipeline fully-automated and therefore applicable to large clinical trials. The proposed features are the histogram of co-occurrence of nucleus patterns, so in order for the features to be robust it is important that the features are summarized over a much larger area of the tumor. Although our study focuses on predicting prognosis in patients with pRCC, our flexible workflow is not specific to this application and can be applied to other cancer types or even diseases other than cancers. In addition, we plan to investigate how the proposed bag of edge histogram representations perform in other applications in digital pathology and bioimage informatics such as the problem of histopathology image classification and retrieval (Zhang, Xing, et al., 2015; Zhang, Liu, et al., 2015). Furthermore, these features not only provide new insights into the topological organization of cancers, but also can be integrated with genomic data in future studies to develop new integrative biomarkers and to generate new insights regarding the genomic basis for tis-sue morphology and organization.
Acknowledgements The Ohio Supercomputer Center provided support for computing for this project.
Funding This work has been supported by the NCI ITCR grant U01CA188547, Leidos grant 15x040, Shenzhen Peacock Plan (No. KQTD2016053112051497), and the Science and Technology Project of Guangdong Province, China (No. 2015B010131011) Conflict of Interest: none declared.
References Ahmady Phoulady,H. et al. (2016) Nucleus segmentation in histology images with hierarchical multilevel thresholding. Proc. SPIE 9791, Med. Imaging 2016 Digit. Pathol.,
9791, 979111.
Al-Kofahi,Y. et al. (2010) Improved automatic detection and segmentation of cell nuclei in histopathology images. IEEE Trans. Biomed. Eng., 57, 841–852.
Albarqouni,S. et al. (2016) AggNet: Deep Learning from Crowds for Mitosis Detection in Breast Cancer Histology Images. IEEE Trans. Med. Imaging, 35, 1–1.
Beck,A.H. et al. (2011) Systematic Analysis of Breast Cancer Morphology Uncovers Stromal Features Associated with Survival. Sci. Transl. Med., 3, 108ra113-108ra113.
Chen,J.-M. et al. (2015) New breast cancer prognostic factors identified by computer-aided image analysis of HE stained histopathology images. Sci. Rep., 5, 10690.
Gontero,P. et al. (2008) Prognostic factors in a prospective series of papillary renal cell carcinoma. BJU Int., 102, 697–702.
Hansel,D.E. (2010) Diagnostic Pathology: Genitourinary LWW.
Heagerty,P.J. et al. (2000) Time-Dependent ROC Curves for Censored Survival Data and a Diagnostic Marker. Biometrics, 56, 337–344.
Heagerty,P.J. and Zheng,Y. (2005) Survival model predictive accuracy and ROC curves. Biometrics, 61, 92–105.
Kovacs,G. et al. (1997) The Heidelberg classification of renal cell tumours. J. Pathol., 183, 131–133.
Ku,J.H. et al. (2009) Is there a role of the histologic subtypes of papillary renal cell carcinoma as a prognostic factor? Jpn. J. Clin. Oncol., 39, 664–670.
Loi,S. et al. (2013) Prognostic and predictive value of tumor-infiltrating lymphocytes in a phase III randomized adjuvant breast cancer trial in node-positive breast cancer
J.Cheng et al.
comparing the addition of docetaxel to doxorubicin with doxorubicin-based chemotherapy: BIG 02-98. J. Clin. Oncol., 31, 860–867.
Moch,H. et al. (2000) Prognostic utility of the recently recommended histologic classification and revised TNM staging system of renal cell carcinoma: A swiss experience
with 588 tumors. Cancer, 89, 604–614.
Patard,J.J. et al. (2005) Prognostic value of histologic subtypes in renal cell carcinoma: A multicenter experience. J. Clin. Oncol., 23, 2763–2771.
Peduzzi,P. et al. (1995) Importance of events per independent variable in proportional hazards regression analysis II. Accuracy and precision of regression estimates. J. Clin.
Epidemiol., 48, 1503–1510.
Pietras,K. and Östman,A. (2010) Hallmarks of cancer : Interactions with the tumor stroma. Exp. Cell Res., 316, 1324–1331.
Pignot,G. et al. (2007) Survival Analysis of 130 Patients with Papillary Renal Cell Carcinoma: Prognostic Utility of Type 1 and Type 2 Subclassification. Urology, 69, 230–
235.
Sukov,W.R. et al. (2012) Clinical and Pathological Features Associated With Prognosis in Patients With Papillary Renal Cell Carcinoma. J. Urol., 187, 54–59.
Trimboli,A.J. et al. (2009) Pten in stromal fibroblasts suppresses mammary epithelial tumours. Nature, 461.
Veta,M. et al. (2012) Prognostic value of automatically extracted nuclear morphometric features in whole slide images of male breast cancer. Mod. Pathol., 1559–1565.
Wang,C. et al. (2013) Identifying survival associated morphological features of triple negative breast cancer using multiple datasets. J. Am. Med. Inform. Assoc., 20, 680–
687.
Wienert,S. et al. (2012) Detection and segmentation of cell nuclei in virtual microscopy images: a minimum-model approach. Sci. Rep., 2, 503.
Xu,J. et al. (2014) Stacked Sparse Autoencoder (SSAE) based framework for nuclei patch classification on breast cancer histopathology. 2014 IEEE 11th Int. Symp. Biomed.
Imaging, 35, 999–1002.
Xu,J. et al. (2016) Stacked Sparse Autoencoder (SSAE) based framework for nuclei patch classification on breast cancer histopathology. In, IEEE Transactions on Medical
Imaging., pp. 999–1002.
Yang,Y. et al. (2011) Differential diagnosis of breast cancer using quantitative, label-free and molecular vibrational imaging. Biomed. Opt. Express, 2, 2160–2174.
Yuan,Y. et al. (2012) Quantitative Image Analysis of Cellular Heterogeneity in Breast Tumors Complements Genomic Profiling. Sci. Transl. Med., 4, 157ra143-157ra143.
Zhang,X., Xing,F., et al. (2015) High-throughput histopathological image analysis via robust cell segmentation and hashing. Med. Image Anal., 26, 306–315.
Zhang,X., Liu,W., et al. (2015) Towards large-scale histopathological image analysis: Hashing-based image retrieval. IEEE Trans. Med. Imaging, 34, 496–506.
Tables and figures Table 1. Patient demographics and tumor characteristics
Characteristics Summary
Patient no. 190 Age (year) Median 60.5 Range 28-85 Gender Female 51 Male 139 Follow-up (month) Median 16.3 Range 1-185.3 Number of Death 27 Subtype Type 1 46 Type 2 60 Not available 84 TNM stage I 110 II 10 III 39 IV 12 Not available 19
BOEH features
Table 2. Univariate survival analysis results using log-rank test. For morphological and intensity features only the significant features are listed, and for the proposed BOEH features only the top 5 features with smallest p values are listed. The number of nucleus patterns is set to 64. Edge (4, 10) means the edge type with the 4th and 10th nucleus patterns as its end nodes, and the other pairs are listed in the same fashion.
Feature P value
TNM stage (I vs II, III) 0.073 Subtype (type 1 vs type 2) 0.009 Skewness of length of major axis 0.044 Kurtosis of length of minor axis 0.034 Edge(14, 58) 0.005 Edge(58, 62) 0.007 Edge(16, 56) 0.008 Edge(21, 58) 0.009 Edge(15, 23) 0.010
Fig 1. Overview of our workflow. (A) Learning nucleus patterns in an unsupervised manner. (B) Generating bag of edge histogram features and identi-fying survival-related edge patterns.
J.Cheng et al.
Fig. 2. Illustration of the three main steps involved in our feature extraction workflow. (A) Nucleus segmentation. (B) Nuclues pattern learning using stacked sparse autoencoder to learn high-level features followed by clustering. Nucleus patterns are indicated by different colors. There are 8 nucleus patterns. (C) Delaunay trian-gle edge patterns showed in different colors. Edge patterns are defined in terms of their end nodes. There are 36 edge pat-terns since we have 8 nucleus patterns. The H&E image is converted to a grayscale image to highlight colors.
Fig. 3. The proposed BOEH features provide better prognosis prediction than clinical variables. (A-C) Kaplan-Meier curves stratified by tumor stage, tumor subtype, and predicted risk index of lasso-Cox model built on BOEH features, respectively. (D) ROC curves that predict the binary outcome of 5-year survival using predicted risk index of lasso-Cox model built on BOEH features, tumor stage, and tumor subtype, respectively. For extracting BOEH features, the number of nucleus patterns is set to 64.
BOEH features
Fig. 4. Examples of the learned nucleus patterns forming edge types that are strongly associated with survival. The number of nucleus clusters is set to 64. The number in the upper-left corner of each image is the cluster index. Each image consists of 10 × 10 nucleus patches from the same cluster.

Fig. S1. Qualitative examples of nucleus segmentation results in two images.
Fig. S2. An example image with high percentage of the 16th nucleus pattern when the number of nucleus patterns is set to 64. The 16th nucleus pattern is related to lymphocytes. Lymphocytes typically have small, dark, round nuclei and not much cytoplasm, as indicated by red circles.