Embed Size (px)
Citation preview
FELIX VÜLLERS
SCHRIFTEN DES INSTITUTS FÜR MIKROSTRUKTURTECHNIK
AM KARLSRUHER INSTITUT FÜR TECHNOLOGIE (KIT)
Band 38
Bioinspired Superhydrophobic Nano- and
and Optoelectronics


Felix Vüllers
Bioinspired Superhydrophobic Nano- and Microstructured Surfaces for Drag Reduction and Optoelectronics

Eine Übersicht aller bisher in dieser Schriftenreihe erschienenen Bände finden Sie am Ende des Buchs.
Schriften des Instituts für Mikrostrukturtechnik am Karlsruher Institut für Technologie (KIT) Band 38
Hrsg. Institut für Mikrostrukturtechnik
Bioinspired Superhydrophobic Nano- and Microstructured Surfaces for Drag Reduction and Optoelectronics
byFelix Vüllers
Print on Demand 2018 – Gedruckt auf FSC-zertifiziertem Papier
ISSN 1869-5183ISBN 978-3-7315-0816-8 DOI 10.5445/KSP/1000084178
This document – excluding the cover, pictures and graphs – is licensed under a Creative Commons Attribution-Share Alike 4.0 International License (CC BY-SA 4.0): https://creativecommons.org/licenses/by-sa/4.0/deed.en
The cover page is licensed under a Creative CommonsAttribution-No Derivatives 4.0 International License (CC BY-ND 4.0):https://creativecommons.org/licenses/by-nd/4.0/deed.en
Impressum
Karlsruher Institut für Technologie (KIT) KIT Scientific Publishing Straße am Forum 2 D-76131 Karlsruhe
KIT Scientific Publishing is a registered trademark of Karlsruhe Institute of Technology. Reprint using the book cover is not allowed.
www.ksp.kit.edu
Dissertation, Karlsruher Institut für Technologie KIT-Fakultät für Maschinenbau
Tag der mündlichen Prüfung: 17. Mai 2018Referenten: Priv.-Doz. Dr. Hendrik Hölscher
Prof. Dr.-Ing. Bettina Frohnapfel Prof. Dr. Chiara Neto


Bioinspired SuperhydrophobicNano- and Microstructured Surfaces
for Drag Reduction and Optoelectronics
Zur Erlangung des akademischen Grades eines
DOKTORS DER INGENIEURWISSENSCHAFTEN
von der Fakultät für Maschinenbau des
Karlsruher Instituts für Technologie (KIT)
genehmigte
DISSERTATION
von
Felix Vüllers
Tag der mündlichen Prüfung:
Referent:
Korreferentin:
Korreferentin:
17.05.2018
Priv.-Doz. Dr. Hendrik Hölscher
Prof. Dr.-Ing. Bettina Frohnapfel
Prof. Dr. Chiara Neto

Abstract
Mimicking natural organisms and their unique properties, like superhydropho-bicity, enables researchers to equip artificial surfaces with functionalities suchas underwater air retention or self-cleaning properties. These functionalitiescan help to address challenges in a multitude of applications including re-duction of fluidic drag in microfluidics and shipping or minimizing soilingof optoelectronic devices.Inspired by the superhydrophobic leaves of Salvinia cucullata and Pistia stratiotes,which are covered in a dense layer of transparent hairs, this thesis introduces ahighly flexible, superhydrophobic transparent thin nanofur film. Polymeric thinnanofur is fabricated using a combination of highly scalable hot embossing andhot pulling techniques. The resulting superhydrophobic film has extreme wet-ting properties with droplets rolling off the surface at minimal tilt angles and isself-cleaning against a broad range of contaminant species and sizes. Theunderwater retained air layer of thin nanofur, also called plastron, shows a goodstability against hydrostatic pressure. In order to precisely control the retainedair pressure and support the underwater retained air layer, thin nanofur is perfo-rated and attached to a pressure support system, thus, significantly increasing theretained air layer stability against hydrostatic pressure and pressure fluctuations.By introducing a contact line motion measurement technique to analyze thedynamic plastron stability and contamination resistance of thin nanofur, severaldynamic plastron stability enhancing topographical features are identified.In addition to retaining an air film when submerged underwater, thin nanofuralso exhibits self-cleaning and anti-reflective properties, making it applicable as atransparent coating and as a translucent self-standing film ideal for light managing
i
Abstract
applications. Hence, superhydrophobic self-cleaning thin nanofur was successfullyapplied as an efficiency enhancing coating on organic light emitting diodes andsolar cells. Moreover, based on the optically enhancing nanofur topography, ahighly flexible superhydrophobic microcavity array is fabricated from mechani-cally, chemically and UV-stable fluorinated ethylene propylene typically used inthe photovoltaic industry. Besides its anti-reflective and self-cleaning properties,the superhydrophobic microcavity array exhibits a high stability against impact-ing rain droplets, making it an ideal candidate for outdoor applications. Theseproperties can be exploited by attaching the microcavity array to photovoltaicmodules, and, thus, significantly increasing the modules electrical gain, whilesimultaneously equipping them with self-cleaning properties.The scalable, highly flexible, superhydrophobic, self-cleaning, anti-reflective,air-retaining films introduced in this work present promising solutions for currentchallenges in optoelectronic and drag-reducing applications.
ii
Zusammenfassung
Durch Nachahmen natürlicher Organismen und ihrer einzigarten Eigenschaften,wie z.B. Superhydrophobizität, gelingt es Wissenschaftlern künstliche Ober-flächen mit Funktionalitäten wie Selbstreinigung oder dem Aufrechthalten einerLuftschicht unter Wasser auszustatten. Mit Hilfe dieser Funktionalitäten könneneine Vielzahl von Herausforderungen in den verschiedensten Anwendungsfeldern,wie z.B. der Reibungsreduktion in der Mikrofluidik und Schifffahrt, sowie dieVerminderung von Verschmutzung optoelektronischer Geräte, bewältigt werden.Inspiriert von den superhydrophoben Blättern der Wasserpflanzen Salvinia
cucullata und Pistia stratiotes, welche von einer dichten Schicht aus transpar-enten Haaren bedeckt sind, wird in dieser Dissertation ein hochgradig flexibler,superhydrophober und transparenter dünner Nanopelz vorgestellt. Der aus Poly-mer gefertigte dünne Nanpelz wird mittels eines zweistufigen skalierbarenVerfahrens, bestehend aus Heißprägen und Heißziehen, hergestellt. Der sohergestellte superhydrophobe Film weißt extreme Benetzungseigenschaftenauf, sodass darauf abgesetzte Wassertropfen bereits bei minimaler Neigung desFilms abrollen. Des Weiteren weißt der Film eine selbstreinigende Wirkunggegenüber einem breiten Spektrum an Verschmutzungen auf. Die vom Nanopelzunter Wasser aufrechterhaltene Luftschicht, auch bekannt als Plastron, zeigt einegute Stabilität gegenüber hydrostatischem Druck. Um eine genaue Kontrolleüber den Luftdruck innerhalb der Luftschicht zu erhalten und sie gegenüberhydrostatischem Druck zu stabilisieren, wird der dünne Nanopelz perforiertund an ein Drucksystem angeschlossen. Hierdurch kann die Plastronstabilitätgegenüber erhöhtem Wasserdruck und Wasserdruckfluktuationen signifikanterhöht werden. Durch die Verwendung einer neu eingeführten Methodik zur
iii
Zusammenfassung
Vermessung der Kontaktlinie, wird die dynamischen Plastronstabilität sowie dieWiderstandsfähigkeit des dünnen Nanopelz gegen Verschmutzung analysiert. Diesermöglicht die Identifikation mehrerer topographischer Merkmale, die zu einererhöhten dynamischen Plastronstabilität beitragen.Neben der Fähigkeit unter Wasser eine Luftschicht aufrechtzuerhalten, ist derdünne Nanopelz selbstreinigend und unterdrückt die Reflektion von einfall-endem Licht, was seine Verwendung als transparente Beschichtung sowie alstransluzenten frei stehenden Film ermöglicht und ihn zu einem idealenMaterial für Anwendungen im Lichtmanagement macht. Durch Ausnutzen dieseroptischen Eigenschaften konnte der superhydrophobe, selbstreinigende Nanopelzerfolgreich als effizienzsteigernde Beschichtung auf Solarzellen und organischenLeuchtdioden angebracht werden. Außerdem konnte, basierend auf der optischvorteilhaften Nanopelztopographie, ein hochgradig flexibles, superhydrophobesMikrokavitätenarray aus mechanisch, chemisch und UV stabilem Fluorethylen-propylen hergestellt werden. Auf Grund seiner hohen Stabiltät gegenüberauftreffenden Regentropfen, sowie seiner antireflektiven und wasserabweisendenEigenschaften, ist das hergestellte Mikrokavitätenarray ideal für den Einsatzim Freien geeignet. Durch Anbringen auf Photovoltaikmodulen konnte dieEffizienz der Module signifikant gesteigert werden, während sie gleichzeitigmit selbstreinigenden Eigenschaften ausgestattet wurden.Der in dieser Arbeit vorgestellte, hochgradig flexible, stark wasserabweisende,selbstreinigende, antireflektive und unter Wasser Luft haltende dünne Nanopelzstellt eine vielversprechende Lösung für eine Vielzahl von aktuellen Heraus-forderungen in Bereichen der Reibungsreduktion und der Optimierung optoelek-tronischer Geräte dar.
iv
Contents
Abstract . . . . . . . . . . . . . . . . . . . . . . . . . . . . . . . . . . i
Zusammenfassung . . . . . . . . . . . . . . . . . . . . . . . . . . . iii
1 Introduction . . . . . . . . . . . . . . . . . . . . . . . . . . . . . . 1
2 Theoretical and Methodological Background . . . . . . . . . 52.1 Wetting Theory . . . . . . . . . . . . . . . . . . . . . . . . . . 5
2.1.1 Wetting States . . . . . . . . . . . . . . . . . . . . . . 7
2.1.2 Contact Angle Hysteresis . . . . . . . . . . . . . . . . . 9
2.1.3 Critical Pressure . . . . . . . . . . . . . . . . . . . . . 10
2.2 Materials . . . . . . . . . . . . . . . . . . . . . . . . . . . . . 13
2.3 Fabrication Tools and Techniques . . . . . . . . . . . . . . . . 15
2.3.1 Hot Embossing and Hot Pulling . . . . . . . . . . . . . 16
2.3.2 Plasma Etching . . . . . . . . . . . . . . . . . . . . . . 21
2.4 Microscopic and Surface Analytic Tools . . . . . . . . . . . . . 21
2.4.1 Scanning Electron Microscope . . . . . . . . . . . . . . 21
2.4.2 Contact Angle Goniometer . . . . . . . . . . . . . . . . 22
2.4.3 Wilhelmy Plate Tensiometer/Contact Line Motion . . . 25
2.4.4 Underwater Retained Air Layer Measurement . . . . . . 28
2.4.5 Confocal Laser Scanning Microscopy . . . . . . . . . . 29
2.4.6 Spectrophotometer . . . . . . . . . . . . . . . . . . . . 30
2.4.7 External Quantum Efficiency Measurement . . . . . . . 31
v
Contents
3 Fabrication and Wetting Properties of Nanofur . . . . . . . . 333.1 Nanofur Fabrication . . . . . . . . . . . . . . . . . . . . . . . . 33
3.1.1 Thick Nanofur Fabrication . . . . . . . . . . . . . . . . 33
3.1.2 Thin Nanofur Fabrication . . . . . . . . . . . . . . . . 35
3.1.3 Perforated Nanofur Fabrication . . . . . . . . . . . . . 38
3.2 Fabrication of FEP Microcavity Arrays . . . . . . . . . . . . . . 42
3.3 Fabrication of Surface Wrinkles and PTFE Pillars . . . . . . . . 46
3.4 Wetting Properties . . . . . . . . . . . . . . . . . . . . . . . . . 47
3.4.1 Wetting Properties of Thin Nanofur . . . . . . . . . . . 47
3.4.2 Reversing the Wetting Behavior . . . . . . . . . . . . . 49
3.4.3 Wetting Properties of FEP MCA . . . . . . . . . . . . . 51
4 Stability of Retained Air Layer on Nanofur . . . . . . . . . . . 534.1 Retained Air Layer Stability Against Hydrostatic Pressure . . . 55
4.1.1 Air-Water Interface Evolution During
Wetting Transition . . . . . . . . . . . . . . . . . . . . 55
4.1.2 Retained Air Layer Stability of Thin Nanofur . . . . . . 59
4.1.3 Highly Pressure-Stable Air Layer of
Perforated Nanofur . . . . . . . . . . . . . . . . . . . . 62
4.1.4 Retained Air Layer Stability Against
Water Pressure Fluctuations . . . . . . . . . . . . . . . 68
4.2 Dynamic Plastron Stability of Superhydrophobic Surfaces . . . 70
4.2.1 Retained Air Layer Stability of Moving
Superhydrophobic Surfaces . . . . . . . . . . . . . . . 70
4.2.2 Contact Line Motion and Dynamic
Wetting Behavior . . . . . . . . . . . . . . . . . . . . . 74
4.2.3 Contamination Resistance of
Superhydrophobic Surfaces . . . . . . . . . . . . . . . 76
4.2.4 Directionality of Dynamic Wetting Transitions . . . . . 79
4.3 Conclusion . . . . . . . . . . . . . . . . . . . . . . . . . . . . 81
vi
Contents
5 Superhydrophobic Surfaces forOptoelectronic Applications . . . . . . . . . . . . . . . . . . . . 855.1 Nanofur Application on Optoelectronic Devices . . . . . . . . . 86
5.1.1 Self-Cleaning Properties of Nanofur . . . . . . . . . . . 86
5.1.2 Optical Properties of Nanofur . . . . . . . . . . . . . . 88
5.1.3 Application of Nanofur on Optoelectronic Devices . . . 91
5.2 Self-Cleaning Microcavity Array for Photovoltaic Modules . . . 96
5.2.1 Optical Properties of MCA . . . . . . . . . . . . . . . . 96
5.2.2 Self-Cleaning properties of FEP MCA . . . . . . . . . . 100
5.2.3 Application of FEP MCA on PV Modules . . . . . . . . 104
5.3 Conclusion . . . . . . . . . . . . . . . . . . . . . . . . . . . . 107
6 Summary and Outlook . . . . . . . . . . . . . . . . . . . . . . . 111
Appendix . . . . . . . . . . . . . . . . . . . . . . . . . . . . . . . . . 117
Bibliography . . . . . . . . . . . . . . . . . . . . . . . . . . . . . . . 127
Glossary . . . . . . . . . . . . . . . . . . . . . . . . . . . . . . . . . . 149
Acronyms . . . . . . . . . . . . . . . . . . . . . . . . . . . . . . . . . 151
Acknowledgement . . . . . . . . . . . . . . . . . . . . . . . . . . . . 153
vii

1 Introduction
The abundance of fascinating micro- and nanostructured surfaces in nature hasalways been a well of inspiration for researchers and engineers. Survival of thefittest and the need to find nourishment resulted in natural organisms and theirsurfaces being perfectly adapted to fulfill a variety of different purposes essentialto survive in the species chosen environment. Among these functional surfaces areLotus leaves [1], leaves of the water fern species Salvinia [2] and the water lettucePistia Stratiotes [3], which are equipped with special wetting properties. Theirsuperhydrophobicity results in self-cleaning behavior necessary for unobstructedphotosynthesis and enables them to retain an air layer when submerged underwater[4, 5]. The self-cleaning and air retaining properties observed on these naturalsurfaces are especially beneficial for technical applications including anti-fouling[6], self-cleaning windshields [7], solar panels [8], energy conservation [9] anddrag reduction [10–13].Developing efficient drag-reducing surfaces is of great interest to applications inmedicine, shipping and fluid transport [14–16]. The integration of drag-reducingsurfaces can reduce pressure loss and operational costs of microfluidic devices,which are essential for medical diagnostics, pharmaceutical, clinical and biologicalresearch [17–20]. Additionally, stable and scalable drag-reducing surfaces canhelp to reduce the enormous fuel consumption of international shipping, whichhas increased from 64.5 million metric tons (Mt) in 1950 up to more than 330Mtin 2007 [21, 22]. Several techniques including microbubble injection, microstruc-turing surfaces with shark skin inspired riblets or adding polymer additives tothe fluid have been employed to reduce frictional drag [14, 23–26]. However,limited efficiency, high production costs or the constant energy input required
1
1 Introduction
to generate bubbles, limit these methods [14, 27]. In contrast, the passivelyretained air layer on natural superhydrophobic surfaces found on the skin ofsuch insects as the water bug Notonecta glauca and the water strider Gerris
remigis has a lubricating effect and enables them to efficiently move in and onwater [10, 28]. Artificial air retaining superhydrophobic surfaces, such as polymerswith functionalized zinc-oxide nanoparticles [29], etched and anodized aluminumsurfaces coated with fluorinated chemicals [30–32] and fluorinated hydrophobizedsilicon microstructures [33], have adapted this lubricating effect and were shownto reduce frictional drag by up to 70% [26]. However, many of the fabricationtechniques are cost-intensive and time-consuming, thus, making them difficultto scale up. Additionally, organic materials and micro- and nanosized particulateused for chemical surface treatment can be toxic to the environment, severelylimiting the applicability of the functionalized surfaces. Another limitation is theinstability of the retained air layer against external stimuli such as pressure andflow, which can replace the lubricating air layer with water and result in a loss ofdrag-reducing properties.Superhydrophobic surfaces are also of great interest because of their self-cleaningproperties. In particular, for optoelectronic applications, such as photovoltaic (PV)modules they present a way to reduce contamination. All around the year, naturalaerosols such as sand, clay, volcanic ashes or pollen as well as anthropogenicpollution from power plants, vehicles and industry accumulate on PV modules[34–36]. These contaminants increase unwanted reflection and absorption ofsolar radiation at the protective encapsulation of PV modules, and, thus, reducetransmission of light into the active medium, leading to an up to 50% reducedenergy output [34–40]. Geographical regions most prone to soiling and obstructionare arid regions, where rainfall is low and the possible electrical gain of PVmodules especially high [34–40]. A variety of active cleaning mechanisms, suchas manual cleaning, overnight storage or electrodynamic screens, can mitigatethese effects, but also greatly increase the operational costs of the PV devices, thus,reducing their economic value [34–38, 41]. Therefore, the passive self-cleaningeffect of superhydrophobic coatings is the most promising approach to solve the
2
1 Introduction
contamination problem, as it drastically reduces maintenance costs compared toactive mechanisms, and satisfies most commercial requirements [34]. A varietyof superhydrophobic transparent surfaces have been developed, and the mostcommon of them are inspired by the anti-reflective coating of the moth eye andthe transparent wings of the glasswing butterfly and the cicada [7, 8, 42, 43].These coatings typically consist of subwavelength structures such as randomnanopillars (glasswing) or nanonipples (moth eye) [8, 43], and are transferredonto optoelectronic devices through techniques such as etching, laser writing,two-photon lithography and soft lithography [42, 44, 45]. The fabrication ofsuch transparent superhydrophobic surfaces often requires expensive and time-consuming fabrication techniques or subsequent chemical treatment, which makesupscaling difficult and limits their applicability [46–48]. Thus, the developmentof a safe, stable, biocompatible, easily scalable, self-cleaning, transparent drag-reducing material is of utmost importance.The biomimetic group at the Institute of Microstructure Technology (IMT) haspreviously developed a bioinspired, superhydrophobic nanofur film [49–51]. Thisnanofur was shown to retain an air layer when submerged underwater, reducefluidic drag and can be used as a liquid trap or an oil-water separating mem-brane [50, 51]. Based on these results, this work aims to improve nanofur andits properties, in order to make it applicable in drag-reducing and optoelectronicapplications. Therefore, the objectives of this thesis are:
1. Development of a scalable and cost efficient fabrication technique for trans-parent superhydrophobic thin nanofur.
2. Equipment of thin nanofur with a highly stable underwater retained air layer.
3. Application of self-cleaning thin nanofur and nanofur-based films as effi-ciency enhancing coatings on optoelectronic devices.
To achieve these objectives, the following Chapter 2 presents the theoretical back-ground regarding wettability, as well as fundamentals on the utilized fabricationtechniques and analytical methods. Chapter 3 introduces the developed advanced
3
1 Introduction
fabrication and modification techniques used to fabricate thin nanofur and thinnanofur-based microcavity arrays and presents their respective wetting behavior.Next a characterization and subsequent improvement of the static and dynamicstability of the underwater retained air layer of thin nanofur against external stimuliis undertaken in Chapter 4. In Chapter 5 the optical properties of thin nanofur andthin nanofur-based microcavity array are analyzed and their efficiency enhanc-ing effect on optoelectronic devices is demonstrated. Finally, Chapter 6 gives asummary and an outlook on possible future developments.
4
2 Theoretical and MethodologicalBackground
2.1 Wetting Theory
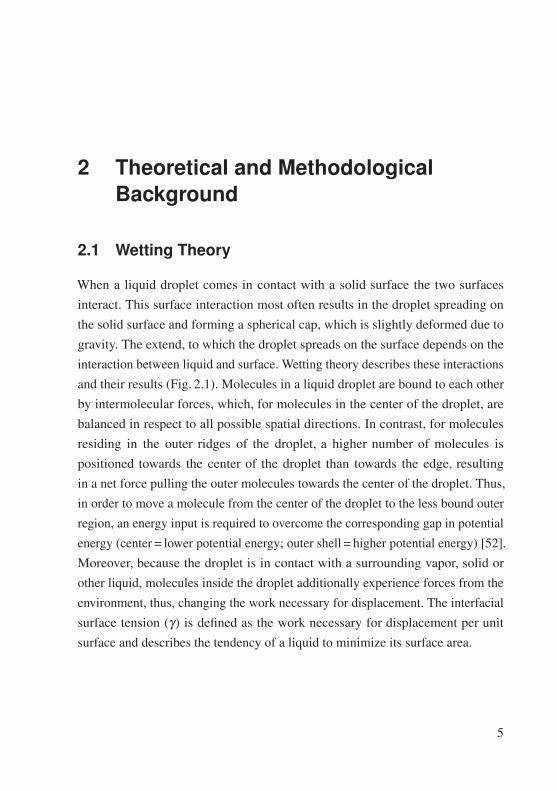
When a liquid droplet comes in contact with a solid surface the two surfacesinteract. This surface interaction most often results in the droplet spreading onthe solid surface and forming a spherical cap, which is slightly deformed due togravity. The extend, to which the droplet spreads on the surface depends on theinteraction between liquid and surface. Wetting theory describes these interactionsand their results (Fig. 2.1). Molecules in a liquid droplet are bound to each otherby intermolecular forces, which, for molecules in the center of the droplet, arebalanced in respect to all possible spatial directions. In contrast, for moleculesresiding in the outer ridges of the droplet, a higher number of molecules ispositioned towards the center of the droplet than towards the edge, resultingin a net force pulling the outer molecules towards the center of the droplet. Thus,in order to move a molecule from the center of the droplet to the less bound outerregion, an energy input is required to overcome the corresponding gap in potentialenergy (center = lower potential energy; outer shell = higher potential energy) [52].Moreover, because the droplet is in contact with a surrounding vapor, solid orother liquid, molecules inside the droplet additionally experience forces from theenvironment, thus, changing the work necessary for displacement. The interfacialsurface tension (γ) is defined as the work necessary for displacement per unitsurface and describes the tendency of a liquid to minimize its surface area.
5
2 Theoretical and Methodological Background
VL
SL SV
0°< <90° =90° 90°< <180°
solidliquid
vapour
a) b) c)
Figure 2.1: Schematic of different wetting behaviors. The contact angle at the solid-liquid-vapor triple line is defined by Young’s equation (Eq. (2.1)) through the respec-tive interfacial tensions and characterizes the wetting behavior of a surface. Surfaceswith contact angle 0◦ < θ < 90◦ are hydrophilic (a), while surfaces with contact angle90◦ ≤ θ ≤ 180◦ are hydrophobic (b ,c).
In 1805, Young [53] derived a relation between the contact angle (θ ) of a droplet ona smooth surface and the surface tensions γIJ , of the liquid-vapor (LV), liquid-solid(LS) and solid-vapor (SV) interfaces, using a three-phase model and assuming adroplet small enough for gravity to be negligible.
cosθ =γSV − γSL
γLV(2.1)
Equation (2.1) can be geometrically derived from Fig. 2.1 a) by regarding θas a local property independent of drop volume and fixed at the triple line ofthe three phases. Because the contact angle (CA) is fixed and each surfacetension tries to minimize the corresponding surface area, a balance of forcesbetween the surface tensions immediately results in Eq. (2.1). An alternativederivation is based on minimizing the total surface energy (E) of a dropletE = ΣLV γLV +ΣSLγSL +(ΣS +ΣSL)γSV , where ΣIJ are the respective surface areas,and assuming a constant drop volume (dV = 0).Based on the contact angle, wetting properties of solid surfaces are separated intodifferent cases as illustrated in Fig. 2.1. Surfaces with a contact angle smaller than90◦ are classified as hydrophilic and dispensed droplets wet the surface. Super-
hydrophilicity describes an extreme case of hydrophilicity, in which the liquidexhibits a water contact angle θW < 10◦ and completely spreads over the surface
6
2.1 Wetting Theory
[54]. Glass and most non-fluorinated polymers are hydrophilic with contact anglesbelow 90◦. In contrast, surfaces with θW > 90◦ are classified as hydrophobic,which in the extreme case of droplets exhibiting θW > 150◦ combined with lowdroplet adhesion is classified as superhydrophobic. To achieve contact anglesabove 90◦ surfaces are typically fluorinated or otherwise chemically modified,reducing their surface energy and increasing hydrophobicity. However, smoothsurfaces cannot exceed a contact angle of 120◦, even when chemically modified[55, 56]. To surpass this limitation and achieve higher contact angles, surfacesneed to exhibit topographical features such as roughness or other regular or randomsurface structures [54, 57–59].However, Eq. (2.1) only applies to chemically homogeneous, unstructuredsurfaces. Therefore, structured surfaces need to be investigated individuallyand two separate wetting states can be distinguished: Wenzel andCassie-Baxter (Fig. 2.2) [4, 60–62].
2.1.1 Wetting States
Wenzel State
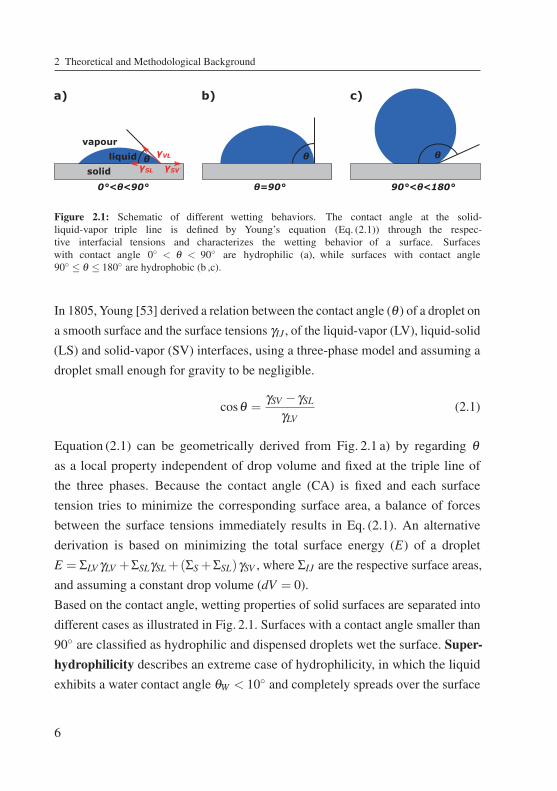
The introduction of surface roughness or surface features does generally alter thewetting behavior in one of two possible ways schematically shown in Fig. 2.2. Thefirst case is known as "Wenzel wetting". A droplet resting on a structured surfacepenetrates into the topography and completely wets the surface. By introducinga roughness parameter r, which is defined as the ratio of actual surface area tothe projected area of the surface, Wenzel was able to correlate the apparent CA(θWenzel) of the droplet on the structured surface to the Young CA (θO) the dropletwould have on an unstructured solid of the same material [60].
cosθWenzel = r cosθO ; r ≥ 1 (2.2)
7
2 Theoretical and Methodological Background
Wenzel state Cassie-Baxter state
a) b)
Figure 2.2: Schematic illustration of different wetting states. a) A droplet penetrat-ing into the surface topography and completely wetting the structured substrate (Wenzelstate). b) A droplet resting on top of the surface topography and trapping air pocketsunderneath (Cassie-Baxter state).
surface will exhibit lower contact angles than an unstructured substrate of thesame hydrophilic material, while a hydrophobic material (θW ≥ 90◦) will becomemore hydrophobic by introducing roughness [54, 57, 62, 63].
Cassie-Baxter State
The second possible interaction between a droplet and a structured surface isknown as "Cassie-Baxter wetting". This state describes a droplet sitting on theapex of the surface topography without penetrating it, and, thus, partially resting onair pockets trapped in the structure underneath the liquid (Fig. 2.2 b) [55, 58, 64].The air pockets reduce the liquid-solid contact area and significantly increase thecontact angle of the surface. In 1944 Cassie and Baxter [61] developed a model tocalculate the apparent CA (θCB) of these so-called "fakir droplets":
cosθCB = φSrS cos(θOS)+φairrair cos(θOair) (2.3)
where φS and φair are area fractions of wetted solid and air respectively and rS
and rair are the respective roughness factors of the wetted solid and air. Hence,the apparent CA in a Cassie-Baxter wetting state is an average of the CA of thetwo supporting materials weighted with the respective liquid-material surface area
8
Because r ≥ 1 surface roughness and topographical features always enhance theprevalent wettability of the bulk material. Therefore, a structured hydrophilic
2.1 Wetting Theory
fractions. In the specific case of a fakir droplet partially resting on air, Eq. (2.3)can be simplified using θOair = 180◦, rair = 1 and φair = 1−φS:
cosθCB =−1+φS(rS cos(θOS)+1) (2.4)
Thus, the CA in a Cassie-Baxter wetting state depends on the solid-liquid contactarea and decreasing φS increases the CA. Furthermore, surfaces in a Cassie-Baxterwetting state often exhibit higher CA and at the same time significantly lowerdroplet adhesion than surfaces in a Wenzel state.
2.1.2 Contact Angle Hysteresis
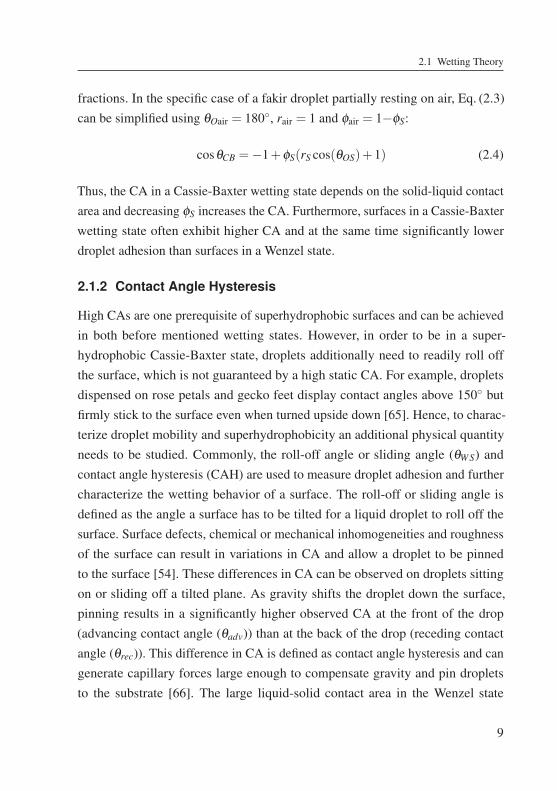
High CAs are one prerequisite of superhydrophobic surfaces and can be achievedin both before mentioned wetting states. However, in order to be in a super-hydrophobic Cassie-Baxter state, droplets additionally need to readily roll offthe surface, which is not guaranteed by a high static CA. For example, dropletsdispensed on rose petals and gecko feet display contact angles above 150◦ butfirmly stick to the surface even when turned upside down [65]. Hence, to charac-terize droplet mobility and superhydrophobicity an additional physical quantityneeds to be studied. Commonly, the roll-off angle or sliding angle (θWS) andcontact angle hysteresis (CAH) are used to measure droplet adhesion and furthercharacterize the wetting behavior of a surface. The roll-off or sliding angle isdefined as the angle a surface has to be tilted for a liquid droplet to roll off thesurface. Surface defects, chemical or mechanical inhomogeneities and roughnessof the surface can result in variations in CA and allow a droplet to be pinnedto the surface [54]. These differences in CA can be observed on droplets sittingon or sliding off a tilted plane. As gravity shifts the droplet down the surface,pinning results in a significantly higher observed CA at the front of the drop(advancing contact angle (θadv)) than at the back of the drop (receding contactangle (θrec)). This difference in CA is defined as contact angle hysteresis and cangenerate capillary forces large enough to compensate gravity and pin dropletsto the substrate [66]. The large liquid-solid contact area in the Wenzel state
9
2 Theoretical and Methodological Background
usually results in droplets firmly sticking to the surface, and, thus, exhibiting highCAH and θWS. In contrast, a droplet in the Cassie-Baxter state is characterizedby minimal CAH and roll off angles below 10◦. This decreased droplet adhesionis a result of the reduced liquid-solid contact area combined with a "smoothing"effect of the air film covering defects and reducing roughness, thus, preventingWenzel penetration [54, 63].
2.1.3 Critical Pressure
When a superhydrophobic surface is submerged underwater it can retain an airlayer, as long as it is in the Cassie-Baxter wetting state. This is a result of the airpockets trapped underneath the liquid layer in between the surface topography(Fig. 2.2 b). Otten and Herminghaus [67] have identified roughness and elasticityof topographical features as key properties for surfaces to be able to retain anair layer and Solga et al. [68] expanded this list to include micro- to millimeterlong hairs, hierarchical structures and cavities. Many such air retaining surfacescan be found in nature, including the water strider Gerris remigis [28, 69], thewater bug Notonecta glauca [10] and water plants like Salvinia [11, 27, 70, 71]and Pistia stratiotes [72]. On biological surfaces the retained air film is used fora variety of applications such as drag reduction, respiration and insulation [2].However, the retained air layer, which is essential for applications, can easilybe damaged or completely broken by external stimuli such as immersion timeor elevated hydrostatic pressure. The hydrostatic pressure necessary to inducea wetting transition from a Cassie-Baxter to a Wenzel wetting state is calledcritical pressure (pcr) and can be calculated based on a balance of forces betweenhydrostatic pressure (pwater), ambient air pressure (pamb), capillary pressure (pcap)and retained air pressure (pair) [73].
pair + pcap− pwater− pamb = 0 (2.5)
Several numerical and theoretical studies have shown wetting transitions tooccur through two possible routes: sagging and sliding (Fig. 2.3 a) [73–76].
10
2.1 Wetting Theory
Pamb
Pwater
Pcap
Pair
b)
R
D/2z=0
ko
G
c)a)water
z xy
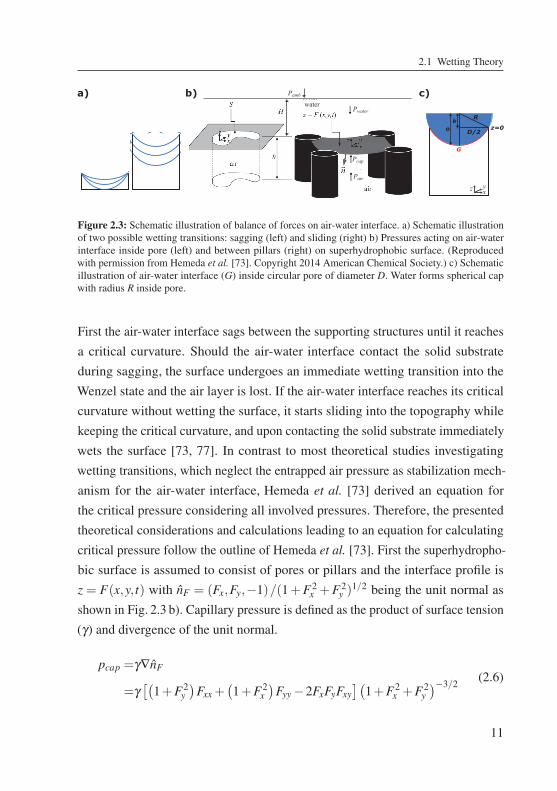
Figure 2.3: Schematic illustration of balance of forces on air-water interface. a) Schematic illustrationof two possible wetting transitions: sagging (left) and sliding (right) b) Pressures acting on air-waterinterface inside pore (left) and between pillars (right) on superhydrophobic surface. (Reproducedwith permission from Hemeda et al. [73]. Copyright 2014 American Chemical Society.) c) Schematicillustration of air-water interface (G) inside circular pore of diameter D. Water forms spherical capwith radius R inside pore.
First the air-water interface sags between the supporting structures until it reachesa critical curvature. Should the air-water interface contact the solid substrateduring sagging, the surface undergoes an immediate wetting transition into theWenzel state and the air layer is lost. If the air-water interface reaches its criticalcurvature without wetting the surface, it starts sliding into the topography whilekeeping the critical curvature, and upon contacting the solid substrate immediatelywets the surface [73, 77]. In contrast to most theoretical studies investigatingwetting transitions, which neglect the entrapped air pressure as stabilization mech-anism for the air-water interface, Hemeda et al. [73] derived an equation forthe critical pressure considering all involved pressures. Therefore, the presentedtheoretical considerations and calculations leading to an equation for calculatingcritical pressure follow the outline of Hemeda et al. [73]. First the superhydropho-bic surface is assumed to consist of pores or pillars and the interface profile isz = F(x,y, t) with nF = (Fx,Fy,−1)/(1+F2
x +F2y )
1/2 being the unit normal asshown in Fig. 2.3 b). Capillary pressure is defined as the product of surface tension(γ) and divergence of the unit normal.
pcap =γ∇nF
=γ[(1+F2
y)
Fxx +(1+F2
x)
Fyy−2FxFyFxy](1+F2
x +F2y)−3/2 (2.6)
11
2 Theoretical and Methodological Background
Next the pressure in the retained air layer during compression is calculated. Forthis an isothermal compression of the retained air layer with a constant pressure-volume-product pairVair =pambV0 is assumed, where Vair = V0+
∫ ∫FdS is the
retained air volume, S is the entrapped air surface area and V0 = S ·h is the orig-inal retained air volume as shown in Fig. 2.3 b). Let G(x,y) = F(x,y,0) be thecritical air-water interface at pcr. The entrapped air pressure can then be expressedas pair = pambV0/Vair = pairV0/(V0+
∫ ∫GdS), and Eq. (2.5) can be rearranged to
pcr = γ∇nG− pamb
[1−V0/
(V0+
∫ ∫GdS
)](2.7)
Assuming that the superhydrophobic surface is made up of pores, the air-waterinterface drooping into a pore takes the shape of a spherical cap as shown inFig. 2.3 c), and the critical air-water interface can be written as:
G = k−o
G =√
Rcr−D2/4−√
R2cr− x2− y2(2.8)
with k being the distance between the origin of the spherical cap and the xy-planeand o(x,y) being the critical air-water interface in respect to the origin ofthe spherical cap (Fig. 2.3 c). The capillary pressure of a circular pore is defined as
pcap =−2γ cosθW/R (2.9)
with R being the radius of the pore. Substituting F in Eq. (2.6) by Eq. (2.8) andequalizing the result with Eq. (2.9) gives Rcr =−D/(2cosθW ) as critical radiusof the air-water interface, with D being the pore diameter. Finally, inserting thecritical radius and Eq. (2.8) into Eq. (2.7) results in an expression for the criticalpressure for a surface consisting of pores [73].
12
2.2 Materials
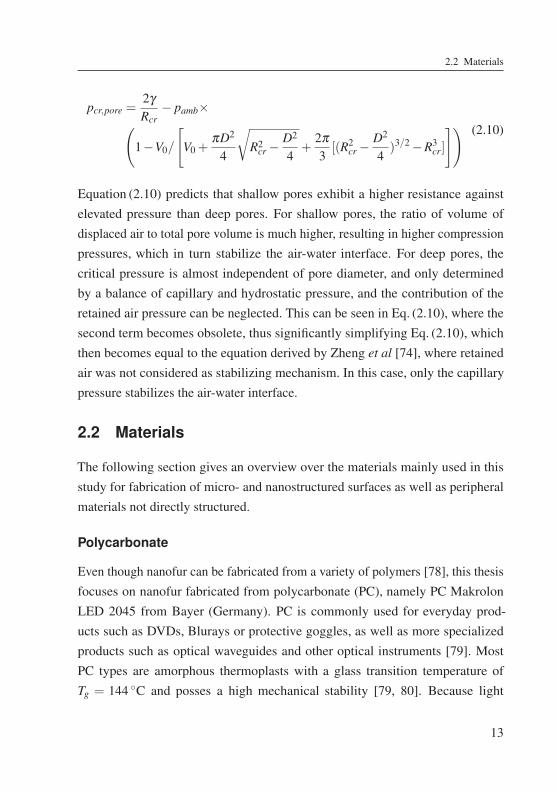
pcr,pore =2γRcr− pamb×(
1−V0/
[V0+
πD2
4
√R2cr−
D2
4+2π3[(R2cr−
D2
4)3/2−R3cr]
]) (2.10)
Equation (2.10) predicts that shallow pores exhibit a higher resistance againstelevated pressure than deep pores. For shallow pores, the ratio of volume ofdisplaced air to total pore volume is much higher, resulting in higher compressionpressures, which in turn stabilize the air-water interface. For deep pores, thecritical pressure is almost independent of pore diameter, and only determinedby a balance of capillary and hydrostatic pressure, and the contribution of theretained air pressure can be neglected. This can be seen in Eq. (2.10), where thesecond term becomes obsolete, thus significantly simplifying Eq. (2.10), whichthen becomes equal to the equation derived by Zheng et al [74], where retainedair was not considered as stabilizing mechanism. In this case, only the capillarypressure stabilizes the air-water interface.
2.2 Materials
The following section gives an overview over the materials mainly used in thisstudy for fabrication of micro- and nanostructured surfaces as well as peripheralmaterials not directly structured.
Polycarbonate
Even though nanofur can be fabricated from a variety of polymers [78], this thesisfocuses on nanofur fabricated from polycarbonate (PC), namely PC MakrolonLED 2045 from Bayer (Germany). PC is commonly used for everyday prod-ucts such as DVDs, Blurays or protective goggles, as well as more specializedproducts such as optical waveguides and other optical instruments [79]. MostPC types are amorphous thermoplasts with a glass transition temperature ofTg = 144 ◦C and posses a high mechanical stability [79, 80]. Because light
13
2 Theoretical and Methodological Background
neither gets absorbed nor scattered at its molecules, PC is highly transparent,with transmission values of approximately 89%, negligible absorption and noscattering in the visible and infrared (IR) wavelengths [80]. The excellent opticalproperties are essential for the intended use as a light managing material andthe biocompability of PC further broadens its range of applications. Regard-ing wetting properties, PC exhibits slightly hydrophilic properties with a staticwater contact angle of θW = 72◦ [72, 81].
Cyclo-Olefin-Copolymer
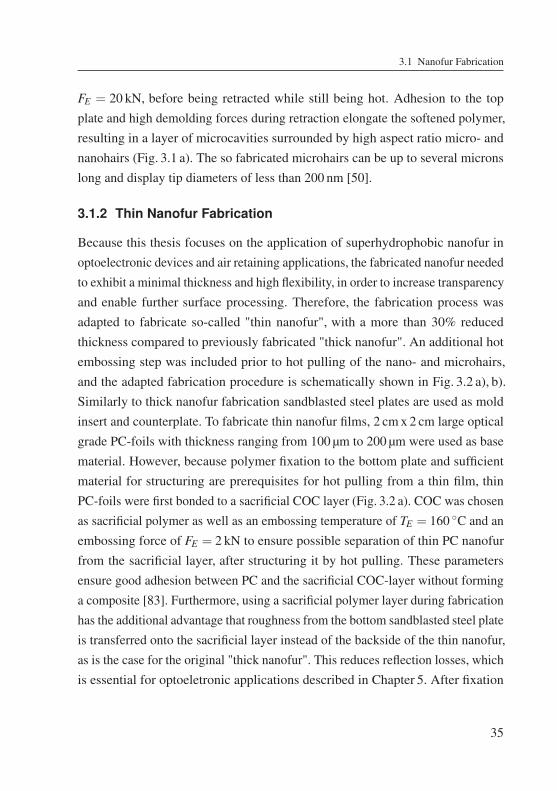
During the fabrication of thin nanofur (see Section 3.1.2) PC is bonded to acyclo-olefin-copolymer (COC) layer, specifically, COC 6013 F-04 from Topas(Germany). The COC layer serves as a sacrificial protective layer to the thinPC-foils during hot pulling. Similar to PC, COC is a transparent thermoplasticpolymer with a glass transition temperature of Tg = 138 ◦C [82]. The main criteriafor choosing COCwas the possibility to bond PC to it without forming a composite,and, thus, being able to separate them from each other after structuring PC [83].An additional requirement was a Tg in the same range as that of PC, so thepolymers could be softened and bonded in one embossing step. Due to the slightlylower glass transition temperature of COC compared to PC, COC softens earlierin the embossing step and encapsulates the edges of the PC-foil, thus, furtherstrengthening the adhesion necessary for a subsequent structuring step of PC.
Fluorinated Ethylene Propylene
Another polymer used for fabrication of microstructured surfaces is fluorinatedethylene propylene (FEP) (grade: FEP500c) from DuPont Corp (USA). Unlike PCand COC, FEP is a semi-crystalline thermoplast with a glass transition temperatureof Tg = 80 ◦C and a melting temperature (Tm) of Tm = 260 ◦C - 280 ◦C [84, 85].Depending on its treatment FEP exhibits a degree of crystallisation between 40%and 57% [79]. High transparency, low refractive index (n = 1.34) and low surfaceenergy of fluorinated polymers and specifically FEP are the reason why they are
14
2.3 Fabrication Tools and Techniques
often used as top covers for photovoltaic (PV) modules instead of the commonglass encapsulation [85, 86]. Especially in the case of flexible and light-weightPV modules, the low weight and flexibility of FEP is superior to the heavy andrigid glass encapsulation. The low surface energy of FEP results in low adhesionof particulate matter on FEP and a water contact angle (θW ≈ 110◦) close to thelimitation of unstructured surfaces, which is especially beneficial for self-cleaningproperties. Additionally, FEP exhibits high mechanical and chemical resistance,and is not affected by prolonged exposure to ultraviolet (UV) light, which isparticularly important for applications where the material is subjected to directsunlight, such as coatings of PV modules [79, 85].
Polydimethylsiloxane
Polydimethylsiloxane PDMS is used as a protective cover during oxygen plasmaetching of thin nanofur and as a soft underground during needle perforation.Needles can puncture samples lying on top of PDMS and penetrate into it withoutbeing damaged, as would be the case for hard undergrounds. PDMS is chemicallyinert, and is not affected by oxygen, which makes it an ideal protective coverduring oxygen plasma etching [79]. In this thesis PDMS type Sylgard 184 fromDow Corning (Germany) was used, consisting of a viscous pre-polymer and ahardener. To harden PDMS, the pre-polymer and hardener were mixed in a 10:1ratio and baked in an oven at 65 ◦C for 1 hour or left at ambient atmosphere for24 hours. Because of the viscous nature of the pre-polymer, no limitations existregarding topography or curvature of surfaces that are to be coated.
2.3 Fabrication Tools and Techniques
Polymer replication techniques such as 3D printing, thermoforming, injectionmolding or hot embossing allow manufacturing and repeated reshaping of poly-mers into structured films with structure sizes down to several hundreds of nanome-ters. Depending on requirements such as complexity, throughput, mechanicalproperties, material demands and feature size, a suitable fabrication technique
15
2 Theoretical and Methodological Background
has to be found. 3D printing for instances is ideally suited for fast prototypingand fabrication of single units, because it is highly flexible and does not require acostly mold insert. However, even though it becomes ever more versatile in regardto processable materials [87], due to high cycling time and low cost effectiveness,it cannot produce high throughput. In contrast, hot embossing sacrifices the moldfree fabrication procedure for higher throughput, and, thus, lower per unit costs.The following section provides an overview over the fabrication and replicationtechniques utilized in this thesis.
2.3.1 Hot Embossing and Hot Pulling
Hot embossing is a manufacturing process for polymers capable of fabricatingstructures with feature sizes as small as tens of nanometer [88, 89], and spansa huge variety of materials, geometries and sizes required for different applica-tions [90]. Thermoplastic polymers are the most commonly used material in hotembossing, but the process can be applied to other materials such as bulk metallicglasses [91], ceramics [90], or liquid wood, which is a combination of cellulosefiber and lignin [92]. Hot embossing has already been used as early as 1888for the replication of vinyl records [90, 93]. While other replication techniques(injection molding, LiGA, thermoforming) have emerged and been refined, thehigh versatility, low cycling time and, therefore, high throughput, ensure that hotembossing stays a relevant replication technique for small to medium size produc-tion batches. Moreover, the possibility of fabricating structures down to a scale oftens of nanometers combined with large fabrication areas of up to 6 inches [94]and the prospect of even greater areas by transferring the process to a roll-to-rollembossing technique ensures its importance in several application fields includingmicrofluidics, lab-on-chip and optical applications [95–98].In general, hot embossing is comprised of three basic steps as illustrated in Fig. 2.4.First a polymer is placed between the metallic mold insert, which contains thenegative of the desired structure, and a suitable counter plate. Even though themold insert and counterplate do not have to be metallic, choosing a metallic mold
16
2.3 Fabrication Tools and Techniques
FE
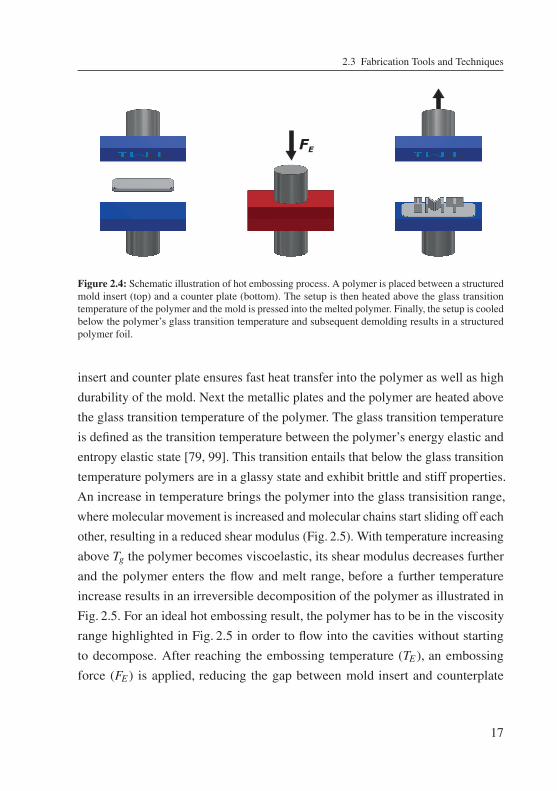
Figure 2.4: Schematic illustration of hot embossing process. A polymer is placed between a structuredmold insert (top) and a counter plate (bottom). The setup is then heated above the glass transitiontemperature of the polymer and the mold is pressed into the melted polymer. Finally, the setup is cooledbelow the polymer’s glass transition temperature and subsequent demolding results in a structuredpolymer foil.
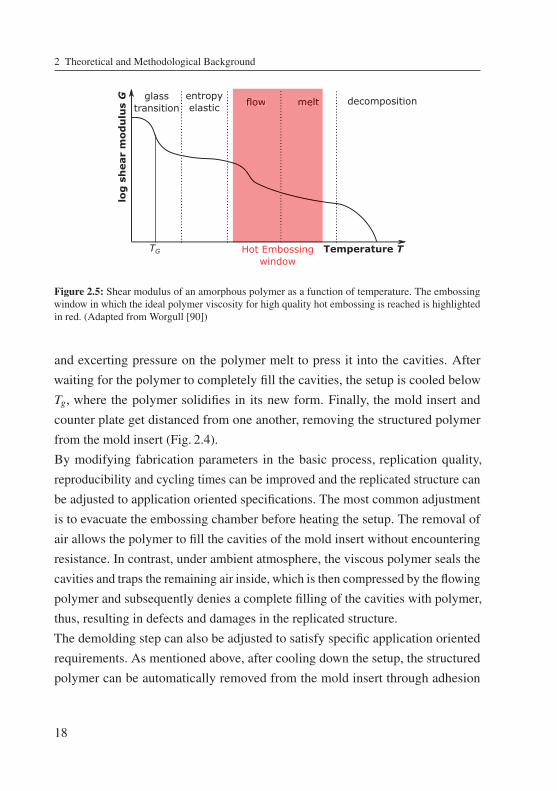
insert and counter plate ensures fast heat transfer into the polymer as well as highdurability of the mold. Next the metallic plates and the polymer are heated abovethe glass transition temperature of the polymer. The glass transition temperatureis defined as the transition temperature between the polymer’s energy elastic andentropy elastic state [79, 99]. This transition entails that below the glass transitiontemperature polymers are in a glassy state and exhibit brittle and stiff properties.An increase in temperature brings the polymer into the glass transisition range,where molecular movement is increased and molecular chains start sliding off eachother, resulting in a reduced shear modulus (Fig. 2.5). With temperature increasingabove Tg the polymer becomes viscoelastic, its shear modulus decreases furtherand the polymer enters the flow and melt range, before a further temperatureincrease results in an irreversible decomposition of the polymer as illustrated inFig. 2.5. For an ideal hot embossing result, the polymer has to be in the viscosityrange highlighted in Fig. 2.5 in order to flow into the cavities without startingto decompose. After reaching the embossing temperature (TE ), an embossingforce (FE ) is applied, reducing the gap between mold insert and counterplate
17
2 Theoretical and Methodological Background
glasstransition meltflow decompositionentropy
elastic meltflow
Hot Embossingwindow
log
sh
ear
mod
ulu
s G
TG Temperature T
Figure 2.5: Shear modulus of an amorphous polymer as a function of temperature. The embossingwindow in which the ideal polymer viscosity for high quality hot embossing is reached is highlightedin red. (Adapted from Worgull [90])
and excerting pressure on the polymer melt to press it into the cavities. Afterwaiting for the polymer to completely fill the cavities, the setup is cooled belowTg, where the polymer solidifies in its new form. Finally, the mold insert andcounter plate get distanced from one another, removing the structured polymerfrom the mold insert (Fig. 2.4).By modifying fabrication parameters in the basic process, replication quality,reproducibility and cycling times can be improved and the replicated structure canbe adjusted to application oriented specifications. The most common adjustmentis to evacuate the embossing chamber before heating the setup. The removal ofair allows the polymer to fill the cavities of the mold insert without encounteringresistance. In contrast, under ambient atmosphere, the viscous polymer seals thecavities and traps the remaining air inside, which is then compressed by the flowingpolymer and subsequently denies a complete filling of the cavities with polymer,thus, resulting in defects and damages in the replicated structure.The demolding step can also be adjusted to satisfy specific application orientedrequirements. As mentioned above, after cooling down the setup, the structuredpolymer can be automatically removed from the mold insert through adhesion
18
2.3 Fabrication Tools and Techniques
to the counter plate. To achieve this automated removal, the adhesion betweenpolymer and counterplate needs to exceed the adhesion between mold insertand structured polymer. Hence, the counterplate-polymer adhesion needs to beincreased, which is typically achieved by sandblasting the counterplate, and, thus,increasing the counterplate-polymer contact area. The roughness from sandblast-ing is then transferred onto the polymer backside during embossing, resultingin a highly scattering opaque sample. However, this can often be remedied in apost-processing step if required. Alternatively, manual demolding can circumventthis issue by using a smooth counterplate and removing the polymer from themold insert by hand after embossing. Because manual demolding does not removethe polymer vertically from the cavities, additional stress is exerted on the polymertopography, which can lead to rupture or breakage of structures. Especially frag-ile high aspect ratio topographies are prone to get damaged during this process.Another possibility used in this study, is automated demolding with the inclu-sion of a sacrificial polymer sublayer. In this case, the roughness is transferredto the sublayer and the polymer stack is still vertically demolded, resulting infully intact transparent samples. However, using a sacrificial polymer requiresgood adhesion between the sacrificial and structured polymer without forming acomposite, to ensure possible separation after demolding. Furthermore, a similarTg of the polymers is required to ensure adequate adhesion without irreversiblydecomposing one of the polymers.Demolding is also the biggest drawback of hot embossing in regard to reproduciblesurface geometry, as the removal of the polymer along one axis allows no under-cuts relative to this axis. As a result, only topographies with vertical sidewallsor structures rejuvenating towards the top can be replicated, thus, limiting thecomplexity of the fabricated geometry. Because of this limitation, hot embossingis considered as a 2.5D fabrication technique, able to replicate arbitrary planargeometries, but only able to vary the height of the replicated structures.Another limiting factor of hot embossing is the achievable aspect ratio (AR)of replicated structures. During demolding, high forces between polymer andmold insert limit the possible AR, making microstructures with AR as high as
19
2 Theoretical and Methodological Background
0 500 1000 1500 2000Time / s
0
2
4
6
8
10
12
14
16Fo
rce
/ kN
0
50
100
150
200
250
Tem
pera
ture
/ °C
Top PlateBottom PlateForce
2000 2050 2100Time / s
0
5
10
15
Forc
e / k
N
0
50
100
150
200
250
Tem
pera
ture
/ °C
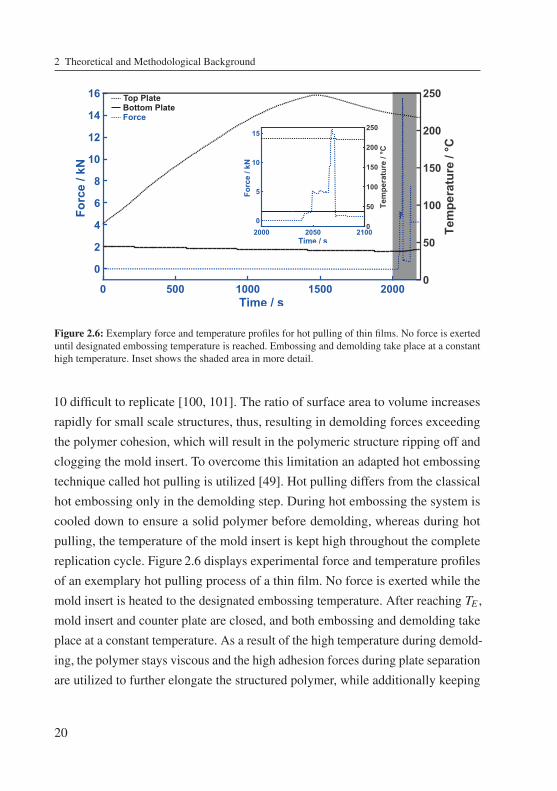
Figure 2.6: Exemplary force and temperature profiles for hot pulling of thin films. No force is exerteduntil designated embossing temperature is reached. Embossing and demolding take place at a constanthigh temperature. Inset shows the shaded area in more detail.
10 difficult to replicate [100, 101]. The ratio of surface area to volume increasesrapidly for small scale structures, thus, resulting in demolding forces exceedingthe polymer cohesion, which will result in the polymeric structure ripping off andclogging the mold insert. To overcome this limitation an adapted hot embossingtechnique called hot pulling is utilized [49]. Hot pulling differs from the classicalhot embossing only in the demolding step. During hot embossing the system iscooled down to ensure a solid polymer before demolding, whereas during hotpulling, the temperature of the mold insert is kept high throughout the completereplication cycle. Figure 2.6 displays experimental force and temperature profilesof an exemplary hot pulling process of a thin film. No force is exerted while themold insert is heated to the designated embossing temperature. After reaching TE ,mold insert and counter plate are closed, and both embossing and demolding takeplace at a constant temperature. As a result of the high temperature during demold-ing, the polymer stays viscous and the high adhesion forces during plate separationare utilized to further elongate the structured polymer, while additionally keeping
20
2.4 Microscopic and Surface Analytic Tools
the polymer from ripping off and blocking the mold insert. This results in anincreased height of the fabricated structures and enables replication of high ARtopographies not possible with classical hot embossing.
2.3.2 Plasma Etching
Etching describes the process of removing material by applying chemically agres-sive substances to a substrate and is divided into dry and wet etching dependingon the etchants aggregate state [102, 103]. During this process, an etching maskcan be used to protect parts of the substrate surface that are not supposed tobe affected by the etchant. In this study polymeric samples are modified usingplasma etching, specifically oxygen plasma etching. Oxygen plasma etching isan isotropic dry chemical etching process, resulting in unidirectional removal ofexposed material. Etching processes are characterized through the etching rateretch = detch
tetch, where detch is the amount of removed material during the applied
etching time (tetch). The etching rate is influenced by temperature, sample posi-tion, gas pressure and substrate geometry [104]. All etching experiments in thisthesis were carried out with a R3T STP2020 oxygen plasma etching machinefrom MUEGGE GmbH (Germany).
2.4 Microscopic and Surface Analytic Tools
2.4.1 Scanning Electron Microscope
A scanning electron microscope (SEM) is a useful tool to obtain a topographicalimage of nano- and microstructured surfaces. It works by the same basic princi-ple as a standard light microscope but utilizes electrons instead of light wavesfor imaging. A beam of electrons is emitted and focused on the sample surface,before being moved over the surface line by line. The highly focused electronbeam excites electrons from the surface, which can be collected by a variety ofdetectors. Depending on the used detector, different information about the surfaceis gathered. In most cases secondary electrons, which are emitted by surface atoms,
21
2 Theoretical and Methodological Background
are gathered, and, thus, information about the topography of the surface is gained.By using electrons instead of photons, as is the case for a light microscope, amuch higher resolution can be achieved and feature sizes ranging from severalmillimeters down to single nanometers can be resolved. However, electrons cancharge non-conductive surfaces, leading to imaging artifacts and a reduced res-olution. Therefore, to minimize charging effects and achieve optimal resolution,non-conductive samples are typically coated with conductive metals such as goldor silver prior to imaging, possibly preventing further processing or applicationof the substrate afterwards. As a result, SEM imaging of coated samples can beclassified as a destructive measurement technique for non-conductive substrates.Additionally, similar to a light microscope, images are taken from a top viewand can lack crucial information about structure height or hierarchy. However,tilting the substrate or imaging cross-sections, fabricated with sharp razor blades, amicrotome or focused-ion beam, enables a complete characterization of a samplestopographical features. SEM images throughout this thesis were obtained with aSupra 55P SEM from Zeiss (Germany).
2.4.2 Contact Angle Goniometer
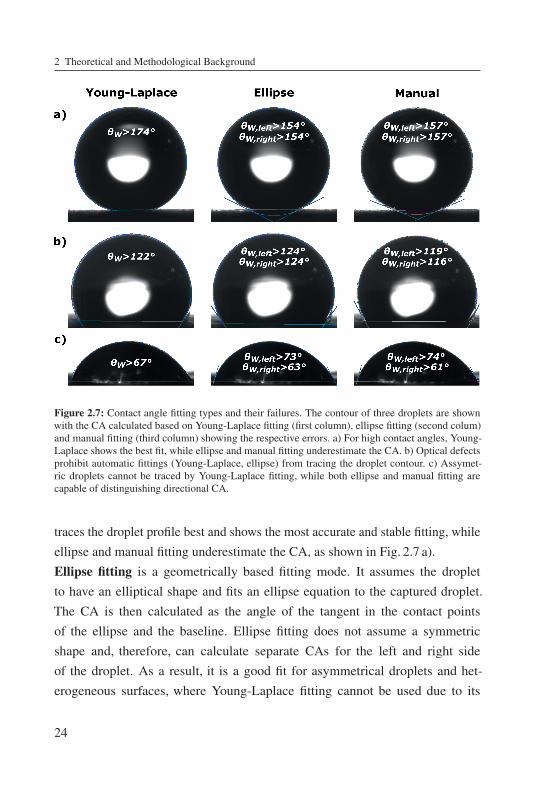
A contact angle goniometer quantifies the wetting behavior of surfaces in regardto a specific liquid. As described in Section 2.1, dispensing a liquid droplet ona surface can result in the droplet spreading completely, staying spherical ordisplaying any behavior in between. To acquire the CA, the goniometer is equippedwith an actuator driven syringe, which is able to dispense drops of various, butwell defined, volumes. The dispensed droplet is then illuminated from the back-side and the contour is recorded with a camera as either a single image or amovie. A software then analyzes the contour and based on different fitting mod-els calculates the CA (Fig. 2.7). The three different fitting models used in thisthesis are ellipse fitting, Young-Laplace fitting and manual fitting and are laterdescribed in more detail.
22
2.4 Microscopic and Surface Analytic Tools
The goniometer can further be used to measure the advancing and receding con-tact angle on surfaces. For this, a droplet is dispensed onto the surface while stillattached to the needle. Then, the volume of the droplet is increased and subse-quently decreased and a movie of the evolving droplet shape is recorded. Theadvancing contact angle is measured as the highest CA during volume increaseand the receding contact angle is measured as the lowest CA during deflationof the droplet. Combining the sample holder with a tilting unit further allowsmeasurement of the sliding angle and contact angle hysteresis. After dispensinga droplet on the surface and retracting the needle, the substrate is tilted until thedroplet starts to slide off the surface. The maximum tilt angle at which the dropletis still attached to the surface describes the sliding angle, while the angle at thefront/rear side of the droplet before sliding off is θadv/θrec.Static contact angles in this thesis were measured with the OCA 15Pro contactangle measurement system from DataPhysics Instruments. To record slidingangles the measurement system was rotated using an electronic tilting base unit(TBU90E, Dataphysics, Germany).
Fitting Types and Errors
As mentioned above, the CA is calculated from a recorded drop shape profile bycurve-fitting software using different fitting methods. Depending on the contactangle, shape and homogeneity of the substrate, various fitting errors can occur anda suitable calculation method has to be chosen to achieve the best result (Fig. 2.7).Young-Laplace fitting considers the whole droplet shape and assumes gravityis the only force acting on the droplet. Furthermore, for this fitting type to beapplicable, the droplet needs to exhibit a high degree of symmetry, which is thereason why it is also called axisymmetric drop shape analysis (ADSA) [105].Using the surface tension of the liquid, the ADSA method iteratively solves theLaplace equation, and, thus, calculates the CA. In contrast to all other fittingmethods, it takes physical properties of the droplet into account and is not onlybased on geometrical curve fitting. Especially for high CA the ADSA method
23
2 Theoretical and Methodological Background
Figure 2.7: Contact angle fitting types and their failures. The contour of three droplets are shownwith the CA calculated based on Young-Laplace fitting (first column), ellipse fitting (second colum)and manual fitting (third column) showing the respective errors. a) For high contact angles, Young-Laplace shows the best fit, while ellipse and manual fitting underestimate the CA. b) Optical defectsprohibit automatic fittings (Young-Laplace, ellipse) from tracing the droplet contour. c) Assymet-ric droplets cannot be traced by Young-Laplace fitting, while both ellipse and manual fitting arecapable of distinguishing directional CA.
traces the droplet profile best and shows the most accurate and stable fitting, whileellipse and manual fitting underestimate the CA, as shown in Fig. 2.7 a).Ellipse fitting is a geometrically based fitting mode. It assumes the dropletto have an elliptical shape and fits an ellipse equation to the captured droplet.The CA is then calculated as the angle of the tangent in the contact pointsof the ellipse and the baseline. Ellipse fitting does not assume a symmetricshape and, therefore, can calculate separate CAs for the left and right sideof the droplet. As a result, it is a good fit for asymmetrical droplets and het-erogeneous surfaces, where Young-Laplace fitting cannot be used due to its
24
2.4 Microscopic and Surface Analytic Tools
assumption of symmetry (Fig. 2.7 c). However, for high CA the assumed ellipticalshape cannot accurately trace the droplet profile and, therefore, ellipse fittingtypically underestimates the CA.Manual fitting is a subroutine of ellipse fitting and, therefore, also a geometricallybased fitting mode. For manual fitting at least five spots of the droplet profile needto be manually defined. Then an elliptical equation is fitted to the manually definedpoints and interactively adjusted to each newly defined profile point. Similar toellipse fitting, the CA is then calculated as the tangent of the elliptical equationin the contact points of the ellipse and the baseline. Manual fitting is especiallybeneficial when distortions due to light make an automatic fitting of the captureddroplet impossible, as shown in the lower right part of Fig. 2.7 b).Circle and tangent fitting are other commonly used fitting routines. Circle fit-ting uses the same algorithm as ellipse fitting, with the exception of fitting acircle to the detected droplet. Tangent fitting extracts a set amount of pointsof the droplet contour above the baseline and numerically calculates a tangentbased on the extracted data. Both routines have shown less accurate resultsthan Young-Laplace, ellipse and manual fitting, and are therefore not furtherconsidered in this work.Because most investigated surfaces in this thesis were superhydrophobic withθW > 150◦, Young-Laplace fitting was used for all static contact angle measure-ments unless otherwise specified.
2.4.3 Wilhelmy Plate Tensiometer/Contact Line Motion
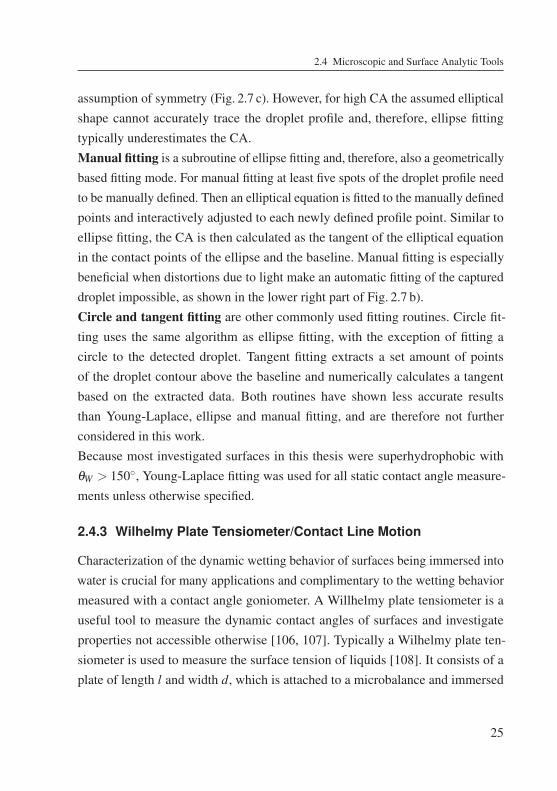
Characterization of the dynamic wetting behavior of surfaces being immersed intowater is crucial for many applications and complimentary to the wetting behaviormeasured with a contact angle goniometer. A Willhelmy plate tensiometer is auseful tool to measure the dynamic contact angles of surfaces and investigateproperties not accessible otherwise [106, 107]. Typically a Wilhelmy plate ten-siometer is used to measure the surface tension of liquids [108]. It consists of aplate of length l and width d, which is attached to a microbalance and immersed
25
2 Theoretical and Methodological Background
High Speed Camera
Tested Surface
ImmersionContainer
Light Source
a)
c) d)b)
1mm 1mm
water
air
Tes
ted
su
rface
Figure 2.8: Contact line motion measurement. Schematic (a) and photograph (b) of contact line motionsetup. A substrate is illuminated from the side, while being immersed in a test liquid. A high speedcamera records the evolution and movement of the contact line. c) Exemplary image of the recordedcontact line on a superhydrophobic thin nanofur. d) Air-water interface and tangent are extracted andhighlighted for CA calculation.
in a testing liquid. The microbalance measures the triple-line anchoring force(F) and by using γ = F/(ucosθW ), where u = (2w+2d) is the wetted perimeter,makes the calculation of the surface tension (γ) possible [108].Dynamic CAs are measured by observing the contact line motion on an adaptedWilhelmy plate tensiometer as shown in Fig. 2.8. Superhydrophobic surfaces areattached to a glass slide and by using a dip coater immersed in a testing liquid at acontrolled immersion velocity. During immersion, a light source illuminates thesample from the side, while a high speed camera records the evolution and move-ment of the contact line (air-water interface). The contact line is then extractedthrough a custom Matlab code (Appendix) and highlighted. Using the extractedcontact line, the Matlab code then semi-automatically fits a tangent to the air-water interface by linear regression of the liquid contour before the solid-liquid-airtriple point, and calculates the dynamic contact angle as the angle between the
26
2.4 Microscopic and Surface Analytic Tools
Advancing CAReceding CACAH
0 5 10 15 20Immersion / mm
CA
, CA
H /
°
0
10
20
Advancing CAReceding CACAH
140
150
160
170
180
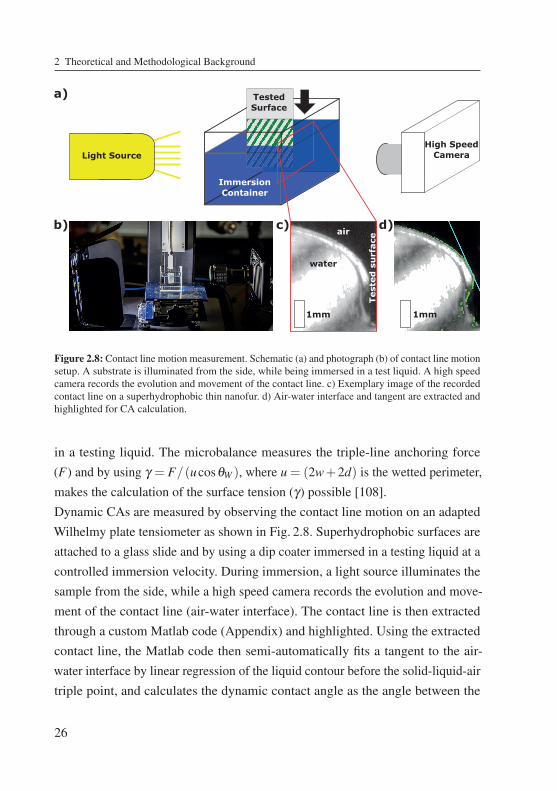
Figure 2.9: Position resolved dynamic wetting behavior. Locally resolved advancing and receding CAand CAH as a function of immersion depth for a thin nanofur film immersed in deionized (DI) waterat 20mmmin−1.
tangent and the vertical substrate. In contrast to sessile drop measurements withthe goniometer, which only measure the wetting properties on individual localizedspots, the semi-automatic CA calculation allows a fast characterization of thedynamic wetting properties of the complete surface (Fig. 2.9).Furthermore, the measurement technique allows a characterization of surfaceswhile being immersed and moved through a liquid and allows an allocation ofwetting behavior (CA and CAH) to a specific location on the substrate as shownin Fig. 2.9, thus, mapping the sample. A constant, in-situ CA measurement iscapable of showing Cassie-Baxter to Wenzel wetting transitions as soon as theyoccur as a plummeting dynamic contact angle, and, thus, is able to measure thestability of the superhydrophobic state, while the surface is in motion. Furthermore,mapping of the sample through precise localized contact angle measurementsallows correlation of dynamic wetting behavior and wetting transitions to suchproperties as roughness, surface topography and slip length accessible throughother locally resolved measurement techniques, such as atomic force microscopy,SEM or vertical scanning interferometry.
27
2 Theoretical and Methodological Background
air
water
Salvinia Nanofur
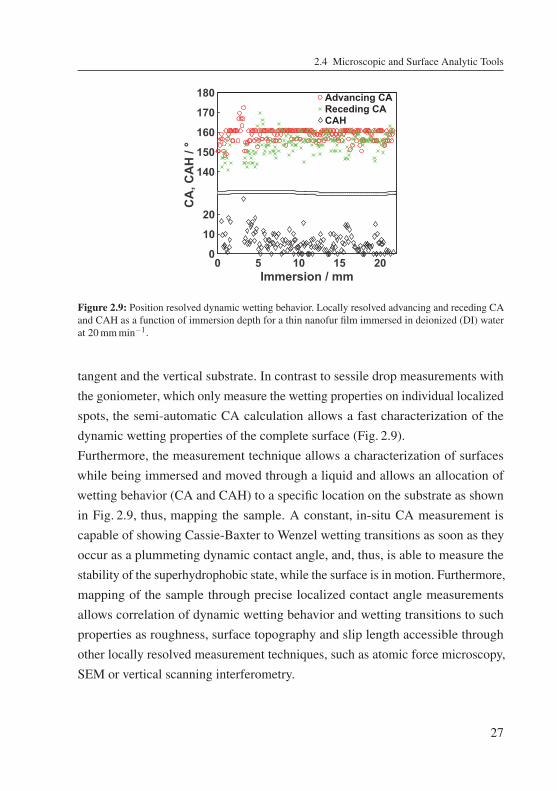
Figure 2.10: Retained air layer on superhydrophobic surfaces. Photograph of nanofur and Salviniamolesta leaf submerged underwater. Silver shimmer is caused by total internal reflection at air-waterinterface and indicates the retained air layer. (Adapted with permission from [81]. Copyright 2015American Chemical Society.)
Moreover, by varying immersion liquid, immersion velocity, liquid temperature,and, thus, capillary number (Ca1) and Reynolds number2, as well as immer-sion angle, substrate temperature, ambient temperature, ambient pressure andsurrounding gas/liquid, the measurement setup can easily be tailored to representspecific application oriented environments.
2.4.4 Underwater Retained Air Layer Measurement
When superhydrophobic surfaces are submerged under water they retain an airlayer which can be seen as a silvery shimmer due to total internal reflection (TIR)at the air-water interface (Fig. 2.10). When a wetting transition occurs, the samplelooses its superhydrophobicity and water infiltrates the topography and replacesthe retained air layer. The breakdown of the retained air layer results in a visibleloss of reflectivity, best observed from a tilt angle (α) close to the critical tiltangle αTIR = arcsin(n2/n1), with n1/n2 being the refractive index of air/water(n1 = 1.0 / n2 = 1.33). The high reflectivity and change thereof during wettingtransitions can be utilized to measure the stability and evolution of the retainedair layer. To do this, superhydrophobic surfaces are submerged in a containerfilled with deionized (DI) water and optical images of the air-water interface arerecorded with a camera tilted at αTIR, while the sample is exposed to external1 Ca= μv/γ , describes the relation between viscous forces and surface tension, with μ being dynamicviscosity and v characteristic velocity.
2 Reynolds number is a dimensionless number predicting flow patterns. A low/high Reynolds numbertypically describes a laminar/turbulent flow.
28
2.4 Microscopic and Surface Analytic Tools
originalimage
tilt corrected thresholded
a) b) c)dry
wet
dry
wet
dry
wet
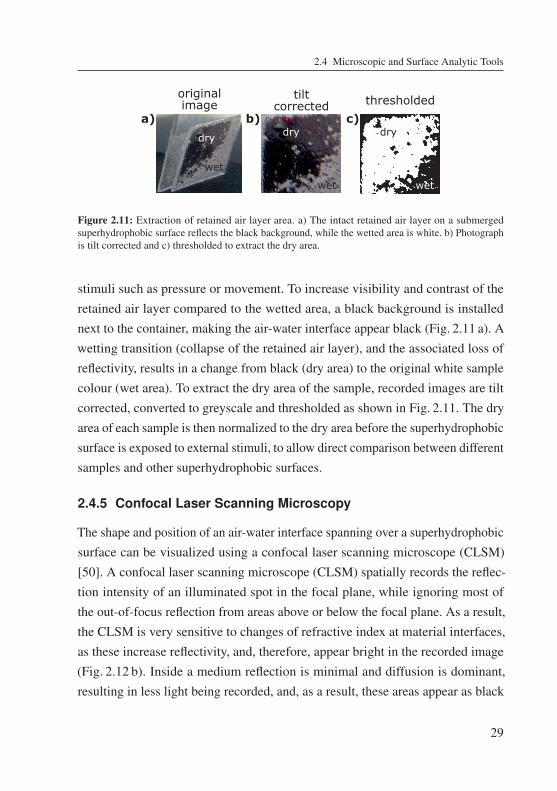
Figure 2.11: Extraction of retained air layer area. a) The intact retained air layer on a submergedsuperhydrophobic surface reflects the black background, while the wetted area is white. b) Photographis tilt corrected and c) thresholded to extract the dry area.
stimuli such as pressure or movement. To increase visibility and contrast of theretained air layer compared to the wetted area, a black background is installednext to the container, making the air-water interface appear black (Fig. 2.11 a). Awetting transition (collapse of the retained air layer), and the associated loss ofreflectivity, results in a change from black (dry area) to the original white samplecolour (wet area). To extract the dry area of the sample, recorded images are tiltcorrected, converted to greyscale and thresholded as shown in Fig. 2.11. The dryarea of each sample is then normalized to the dry area before the superhydrophobicsurface is exposed to external stimuli, to allow direct comparison between differentsamples and other superhydrophobic surfaces.
2.4.5 Confocal Laser Scanning Microscopy
The shape and position of an air-water interface spanning over a superhydrophobicsurface can be visualized using a confocal laser scanning microscope (CLSM)[50]. A confocal laser scanning microscope (CLSM) spatially records the reflec-tion intensity of an illuminated spot in the focal plane, while ignoring most ofthe out-of-focus reflection from areas above or below the focal plane. As a result,the CLSM is very sensitive to changes of refractive index at material interfaces,as these increase reflectivity, and, therefore, appear bright in the recorded image(Fig. 2.12 b). Inside a medium reflection is minimal and diffusion is dominant,resulting in less light being recorded, and, as a result, these areas appear as black
29

2 Theoretical and Methodological Background
confocalmicroscope
Nanofur
wateraw-interfaceretained air
a) b)
Figure 2.12: Visualization of the air-water interface. a) Schematic illustration of theCLSM measurement setup. b) Cross-sectional CLSM image of air-water interface (aw-interface) spanning submerged superhydrophobic thin nanofur. Bright areas indicateair-water interface separating water (dark area above interface) from retained air layer(dark area below interface).
regions in the image. An automated shift of the focal plane enables the record-ing of vertical image series of a sample, and, thus, cross-sectional visualizationof the sample and its interfaces (Fig. 2.12 b). To visualize the air-water inter-face of a superhydrophobic surface, the sample is immersed in a container filledwith DI water and the CLSM records a vertical series of the sample and the re-tained air layer (Fig. 2.12 a). An exemplary air-water interface spanning a thinnanofur film is shown in Fig. 2.12 b), where the bright areas indicate the jump inrefractive index at the air-water interface, separating the water layer (dark areaabove the interface) from the retained air layer (dark area below the interface).Combining the CLSM with a pressure cell enables visualization of the effecthydrostatic pressure has on the shape of the air-water interface suspended over asuperhydrophobic surface (Section 4.1.1).Cross-sectional images of air-water interfaces in this thesis were recorded using aLeica TCS SP2 CLSM from Leica Mikrosysteme GmbH (Germany).
2.4.6 Spectrophotometer
The macroscopic interaction of light with matter in this thesis is measured usinga LAMBDA 1050 UV/VIS/NIR spectrophotometer from PerkinElmer (USA).Calibrated UV, VIS (visible) and NIR (near infrared) light sources are capableof emitting light in the range of 175 nm to 3300 nm. A highly reflective, white
30
2.4 Microscopic and Surface Analytic Tools
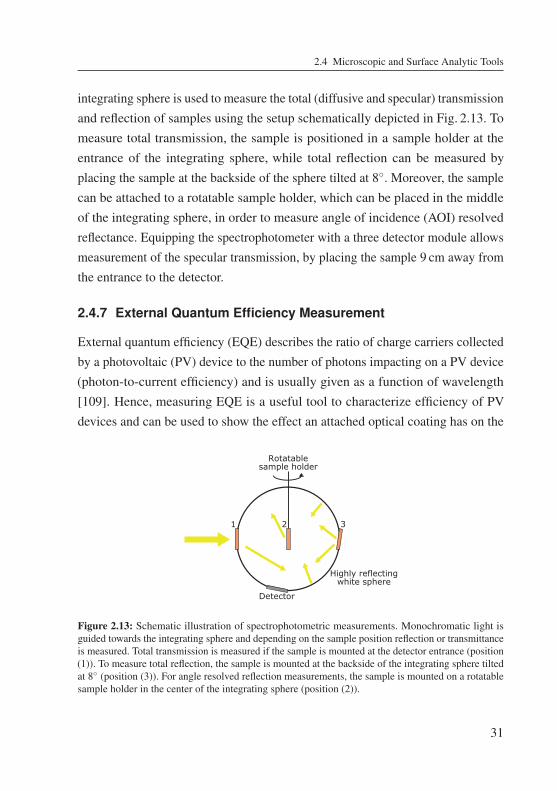
integrating sphere is used to measure the total (diffusive and specular) transmissionand reflection of samples using the setup schematically depicted in Fig. 2.13. Tomeasure total transmission, the sample is positioned in a sample holder at theentrance of the integrating sphere, while total reflection can be measured byplacing the sample at the backside of the sphere tilted at 8◦. Moreover, the samplecan be attached to a rotatable sample holder, which can be placed in the middleof the integrating sphere, in order to measure angle of incidence (AOI) resolvedreflectance. Equipping the spectrophotometer with a three detector module allowsmeasurement of the specular transmission, by placing the sample 9 cm away fromthe entrance to the detector.
2.4.7 External Quantum Efficiency Measurement
External quantum efficiency (EQE) describes the ratio of charge carriers collectedby a photovoltaic (PV) device to the number of photons impacting on a PV device(photon-to-current efficiency) and is usually given as a function of wavelength[109]. Hence, measuring EQE is a useful tool to characterize efficiency of PVdevices and can be used to show the effect an attached optical coating has on the
1 2 3
Detector
Rotatable sample holder
Highly reflectingwhite sphere
Figure 2.13: Schematic illustration of spectrophotometric measurements. Monochromatic light isguided towards the integrating sphere and depending on the sample position reflection or transmittanceis measured. Total transmission is measured if the sample is mounted at the detector entrance (position(1)). To measure total reflection, the sample is mounted at the backside of the integrating sphere tiltedat 8◦ (position (3)). For angle resolved reflection measurements, the sample is mounted on a rotatablesample holder in the center of the integrating sphere (position (2)).
31
2 Theoretical and Methodological Background
electrical output of PV modules. During the EQE measurement the tested solarcell is typically in the short-circuit condition and illuminated with monochromaticlight, while a white light "bias", simulating sunlight (air-mass 1.5 global spec-trum [110]) is added. In this thesis, the EQE of multicrystalline silicon (mc-Si)solar cells from E-Ton Solar (Taiwan) was measured using a xenon lamp and amonochromator-based spectral response system from Oerlikon Solar (Switzer-land). One-sun bias light was provided by a halogen lamp. Efficiency enhancingfilms were optically coupled to the solar celly by dispensing several droplets ofrefractive matching liquid on the films backside, before pressing the film onto thesolar cell with enough physical force to prohibit formation of air bubbles betweenthe sample and the solar cell. For multicrystalline solar cells several spots need tobe measured and averaged, to account for the efficiency discrepancies due to themulticrystalline nature of the cell.Another characteristic parameter for solar cells is the short-circuit current density(JSC), which can be calculated from the EQE and the incident spectrum (air-mass1.5 global spectrum [110]) using the following equation.
JSC = q∫ λ2
λ1EQE(λ )Φ(λ )dλ (2.11)
Here q is the elementary charge, Φ(λ ) is the incident spectrum’s photon fluxand λ1 = 300 nm and λ2 = 1100 nm define the relevant spectrum. The short-circuitcurrent density describes the theoretical maximum current that can be drawn froma solar cell divided by the area of the solar cell. Therefore, the higher the JSC, thehigher the electrical output of a PV module.
32
3 Fabrication and WettingProperties of Nanofur
Inspired by natural surfaces scientists have been exploring new ways and methodsto fabricate superhydrophobic surfaces for a long time [11, 42, 71, 111–113].However, developing a scalable and cost-effective technique to fabricate superhy-drophobic surfaces remains challenging to this date.In this chapter I will introduce upscalable fabrication procedures for bioinspiredsuperhydrophobic surfaces based on hot embossing and hot pulling. First, inSection 3.1.1, the state of the art fabrication procedure of nanofur, developed byRöhrig et al. [49–51], will be presented. Then, an adapted fabrication techniquereducing thickness and increasing flexibility of the nanofur is introduced in Sec-tion 3.1.2, resulting in "thin nanofur". Section 3.2 introduces the fabrication of afluorinated superhydrophobic microcavity array (MCA) based on nanofur topog-raphy and used to enhance the electrical output of PV modules, while Section 3.3describes the fabrication of two other superhydrophobic surfaces (double scaleteflon surface wrinkles (DS wrinkles) and polytetrafluorethylene (PTFE) pillars)to which the retained air layer stability of thin nanofur is compared to later in thethesis. Finally, in Section 3.4 the wetting properties of thin nanofur and fluorinatedethylene propylene (FEP) MCA are investigated.
3.1 Nanofur Fabrication
3.1.1 Thick Nanofur Fabrication
Superhydrophobicity of water fern Salvinia and water lettuce Pistia stratiotes
originate from a dense layer of microhairs covering their surface [11, 70, 114].
33
3 Fabrication and Wetting Properties of Nanofur
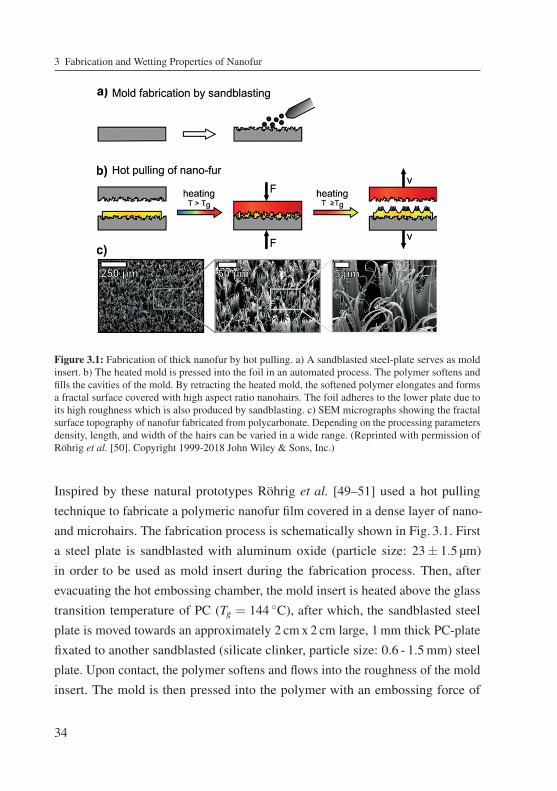
Figure 3.1: Fabrication of thick nanofur by hot pulling. a) A sandblasted steel-plate serves as moldinsert. b) The heated mold is pressed into the foil in an automated process. The polymer softens andfills the cavities of the mold. By retracting the heated mold, the softened polymer elongates and formsa fractal surface covered with high aspect ratio nanohairs. The foil adheres to the lower plate due toits high roughness which is also produced by sandblasting. c) SEM micrographs showing the fractalsurface topography of nanofur fabricated from polycarbonate. Depending on the processing parametersdensity, length, and width of the hairs can be varied in a wide range. (Reprinted with permission ofRöhrig et al. [50]. Copyright 1999-2018 John Wiley & Sons, Inc.)
Inspired by these natural prototypes Röhrig et al. [49–51] used a hot pullingtechnique to fabricate a polymeric nanofur film covered in a dense layer of nano-and microhairs. The fabrication process is schematically shown in Fig. 3.1. Firsta steel plate is sandblasted with aluminum oxide (particle size: 23± 1.5 μm)in order to be used as mold insert during the fabrication process. Then, afterevacuating the hot embossing chamber, the mold insert is heated above the glasstransition temperature of PC (Tg = 144 ◦C), after which, the sandblasted steelplate is moved towards an approximately 2 cmx 2 cm large, 1mm thick PC-platefixated to another sandblasted (silicate clinker, particle size: 0.6 - 1.5mm) steelplate. Upon contact, the polymer softens and flows into the roughness of the moldinsert. The mold is then pressed into the polymer with an embossing force of
34
3.1 Nanofur Fabrication
FE = 20 kN, before being retracted while still being hot. Adhesion to the topplate and high demolding forces during retraction elongate the softened polymer,resulting in a layer of microcavities surrounded by high aspect ratio micro- andnanohairs (Fig. 3.1 a). The so fabricated microhairs can be up to several micronslong and display tip diameters of less than 200 nm [50].
3.1.2 Thin Nanofur Fabrication
Because this thesis focuses on the application of superhydrophobic nanofur inoptoelectronic devices and air retaining applications, the fabricated nanofur neededto exhibit a minimal thickness and high flexibility, in order to increase transparencyand enable further surface processing. Therefore, the fabrication process wasadapted to fabricate so-called "thin nanofur", with a more than 30% reducedthickness compared to previously fabricated "thick nanofur". An additional hotembossing step was included prior to hot pulling of the nano- and microhairs,and the adapted fabrication procedure is schematically shown in Fig. 3.2 a), b).Similarly to thick nanofur fabrication sandblasted steel plates are used as moldinsert and counterplate. To fabricate thin nanofur films, 2 cmx 2 cm large opticalgrade PC-foils with thickness ranging from 100 μm to 200 μm were used as basematerial. However, because polymer fixation to the bottom plate and sufficientmaterial for structuring are prerequisites for hot pulling from a thin film, thinPC-foils were first bonded to a sacrificial COC layer (Fig. 3.2 a). COC was chosenas sacrificial polymer as well as an embossing temperature of TE = 160 ◦C and anembossing force of FE = 2 kN to ensure possible separation of thin PC nanofurfrom the sacrificial layer, after structuring it by hot pulling. These parametersensure good adhesion between PC and the sacrificial COC-layer without forminga composite [83]. Furthermore, using a sacrificial polymer layer during fabricationhas the additional advantage that roughness from the bottom sandblasted steel plateis transferred onto the sacrificial layer instead of the backside of the thin nanofur,as is the case for the original "thick nanofur". This reduces reflection losses, whichis essential for optoeletronic applications described in Chapter 5. After fixation
35
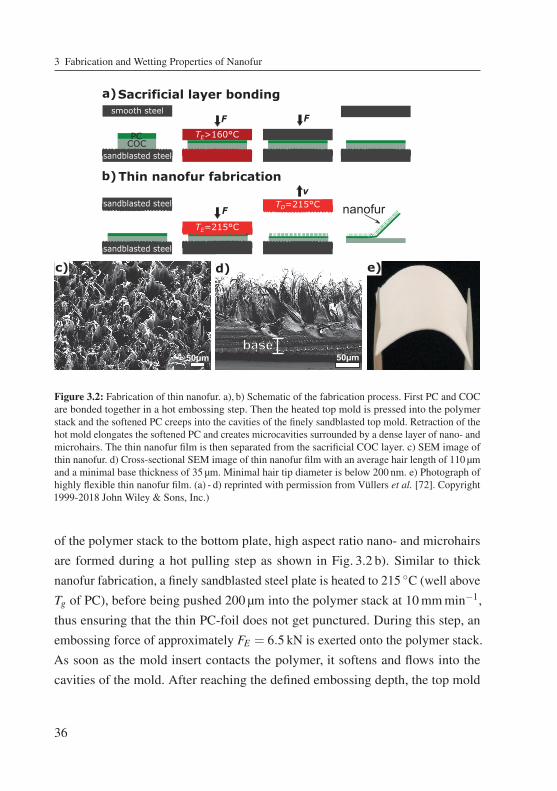
3 Fabrication and Wetting Properties of Nanofur
F
a)
FTE>160°C
Sacrificial layer bondingsmooth steel
sandblasted steel
PCCOC
F
TE=215°C
b)Thin nanofur fabrication
nanofurv
TD=215°Csandblasted steel
sandblasted steel
50μm
c)
50μmbase
d) e)
Figure 3.2: Fabrication of thin nanofur. a), b) Schematic of the fabrication process. First PC and COCare bonded together in a hot embossing step. Then the heated top mold is pressed into the polymerstack and the softened PC creeps into the cavities of the finely sandblasted top mold. Retraction of thehot mold elongates the softened PC and creates microcavities surrounded by a dense layer of nano- andmicrohairs. The thin nanofur film is then separated from the sacrificial COC layer. c) SEM image ofthin nanofur. d) Cross-sectional SEM image of thin nanofur film with an average hair length of 110 μmand a minimal base thickness of 35 μm. Minimal hair tip diameter is below 200 nm. e) Photograph ofhighly flexible thin nanofur film. (a) - d) reprinted with permission from Vüllers et al. [72]. Copyright1999-2018 John Wiley & Sons, Inc.)
of the polymer stack to the bottom plate, high aspect ratio nano- and microhairsare formed during a hot pulling step as shown in Fig. 3.2 b). Similar to thicknanofur fabrication, a finely sandblasted steel plate is heated to 215 ◦C (well aboveTg of PC), before being pushed 200 μm into the polymer stack at 10mmmin−1,thus ensuring that the thin PC-foil does not get punctured. During this step, anembossing force of approximately FE = 6.5 kN is exerted onto the polymer stack.As soon as the mold insert contacts the polymer, it softens and flows into thecavities of the mold. After reaching the defined embossing depth, the top mold
36
3.1 Nanofur Fabrication
200μm
a)
300μm
b)
Figure 3.3: Surface topography of Salvinia cucullata and Pistia stratiotes. Cross-sectionalmicroscopy images of a) Salvinia cucullata and b) Pistia stratiotes leaves coveredwith transparent microhairs. Insets show photographs of the superhydrophobic leaves ofa) Salvinia cucullata (Image: W. Barthlott, University of Bonn) and c) Pistia stra-tiotes. (Figure adapted with permission from Vüllers et al. [72]. Copyright 1999-2018John Wiley & Sons, Inc.)
is retracted at 100mmmin−1 and with a demolding temperature TD = 215 ◦C,thus, resulting in a cratered surface covered with high aspect ratio micro- andnanohairs (Fig. 3.2 c). The dense layer of hairs is up to 150 μm high with hairtip diameters down to 200 nm and is supported by a thin residual PC-layer withthickness ranging from 30 μm to 150 μm as shown in Fig. 3.2 d). Overall thicknessof thin nanofur films can be varied in a range of 70 μm to 300 μm by modificationof original PC foil thickness and fabrication parameters. Low film thickness makesthe thin nanofur film highly flexible as shown in Fig. 3.2 e). Comparing the surfacetopography of both thick and thin nanofur to their biological inspiration Salvinia
cucullata and Pistia stratiotes (Fig. 3.3) reveals many important similarities, asall of the surfaces are covered in dense layer of microhairs. These topographicalsimilarities also manifest themselves in the excellent wetting and optical propertiesof thin nanofur, as discussed later in this thesis (Section 3.4.1, Section 5.1).
Variation of hair density on thin nanofur
Röhrig et al. [50] have shown that by varying fabrication parameters, both hairdensity and diameter of microcavities of thick nanofur can be influenced, thus, evenchanging the wetting behavior of nanofur. To investigate the effect hair densityhas on the dynamic stability of retained air layer in Section 4.2, superhydrophobic
37
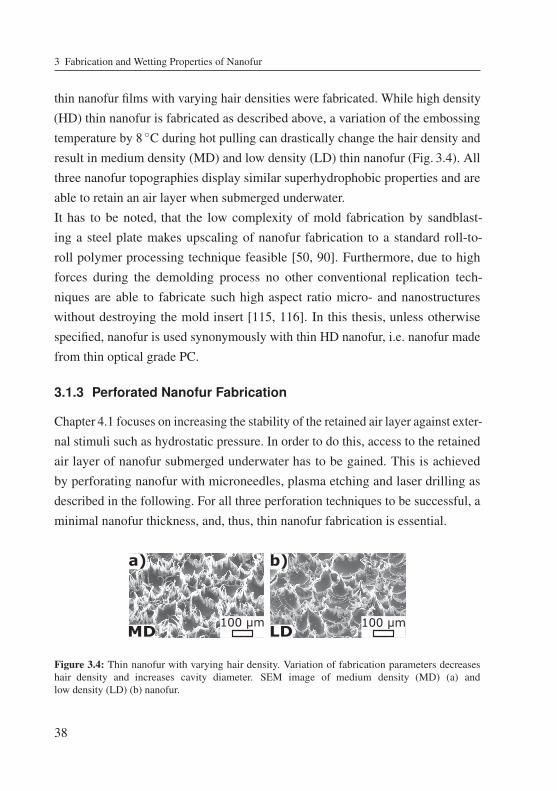
3 Fabrication and Wetting Properties of Nanofur
thin nanofur films with varying hair densities were fabricated. While high density(HD) thin nanofur is fabricated as described above, a variation of the embossingtemperature by 8 ◦C during hot pulling can drastically change the hair density andresult in medium density (MD) and low density (LD) thin nanofur (Fig. 3.4). Allthree nanofur topographies display similar superhydrophobic properties and areable to retain an air layer when submerged underwater.It has to be noted, that the low complexity of mold fabrication by sandblast-ing a steel plate makes upscaling of nanofur fabrication to a standard roll-to-roll polymer processing technique feasible [50, 90]. Furthermore, due to highforces during the demolding process no other conventional replication tech-niques are able to fabricate such high aspect ratio micro- and nanostructureswithout destroying the mold insert [115, 116]. In this thesis, unless otherwisespecified, nanofur is used synonymously with thin HD nanofur, i.e. nanofur madefrom thin optical grade PC.
3.1.3 Perforated Nanofur Fabrication
Chapter 4.1 focuses on increasing the stability of the retained air layer against exter-nal stimuli such as hydrostatic pressure. In order to do this, access to the retainedair layer of nanofur submerged underwater has to be gained. This is achievedby perforating nanofur with microneedles, plasma etching and laser drilling asdescribed in the following. For all three perforation techniques to be successful, aminimal nanofur thickness, and, thus, thin nanofur fabrication is essential.
100 μmMD 100 μmLD
a) b)
Figure 3.4: Thin nanofur with varying hair density. Variation of fabrication parameters decreaseshair density and increases cavity diameter. SEM image of medium density (MD) (a) andlow density (LD) (b) nanofur.
38
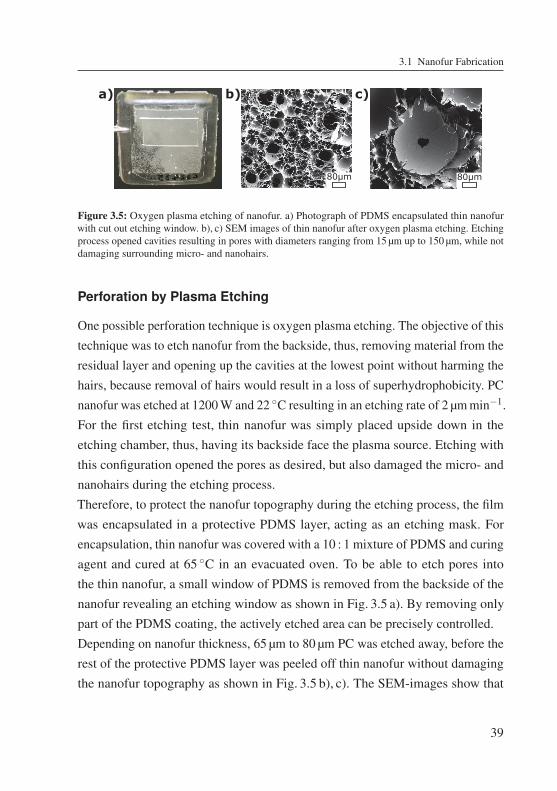
3.1 Nanofur Fabrication
80μm 80μm
a) b) c)
Figure 3.5: Oxygen plasma etching of nanofur. a) Photograph of PDMS encapsulated thin nanofurwith cut out etching window. b), c) SEM images of thin nanofur after oxygen plasma etching. Etchingprocess opened cavities resulting in pores with diameters ranging from 15 μm up to 150 μm, while notdamaging surrounding micro- and nanohairs.
Perforation by Plasma Etching
One possible perforation technique is oxygen plasma etching. The objective of thistechnique was to etch nanofur from the backside, thus, removing material from theresidual layer and opening up the cavities at the lowest point without harming thehairs, because removal of hairs would result in a loss of superhydrophobicity. PCnanofur was etched at 1200W and 22 ◦C resulting in an etching rate of 2 μmmin−1.For the first etching test, thin nanofur was simply placed upside down in theetching chamber, thus, having its backside face the plasma source. Etching withthis configuration opened the pores as desired, but also damaged the micro- andnanohairs during the etching process.Therefore, to protect the nanofur topography during the etching process, the filmwas encapsulated in a protective PDMS layer, acting as an etching mask. Forencapsulation, thin nanofur was covered with a 10 : 1 mixture of PDMS and curingagent and cured at 65 ◦C in an evacuated oven. To be able to etch pores intothe thin nanofur, a small window of PDMS is removed from the backside of thenanofur revealing an etching window as shown in Fig. 3.5 a). By removing onlypart of the PDMS coating, the actively etched area can be precisely controlled.Depending on nanofur thickness, 65 μm to 80 μm PC was etched away, before therest of the protective PDMS layer was peeled off thin nanofur without damagingthe nanofur topography as shown in Fig. 3.5 b), c). The SEM-images show that
39
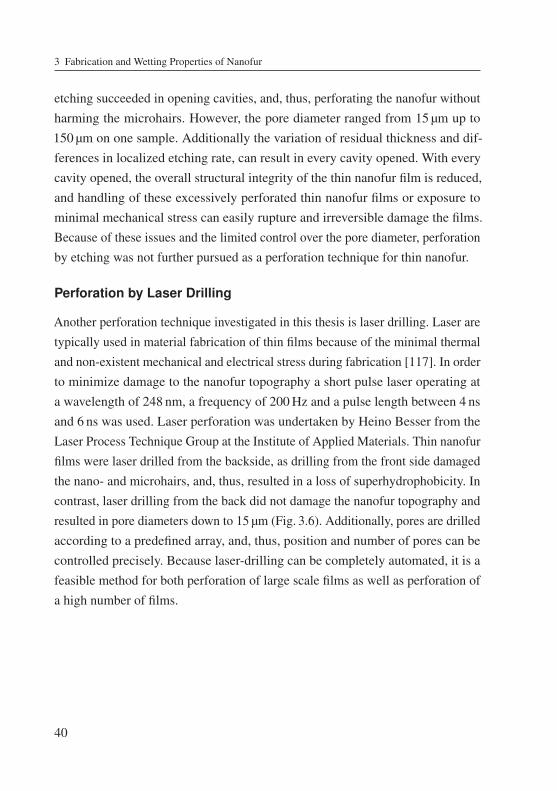
3 Fabrication and Wetting Properties of Nanofur
etching succeeded in opening cavities, and, thus, perforating the nanofur withoutharming the microhairs. However, the pore diameter ranged from 15 μm up to150 μm on one sample. Additionally the variation of residual thickness and dif-ferences in localized etching rate, can result in every cavity opened. With everycavity opened, the overall structural integrity of the thin nanofur film is reduced,and handling of these excessively perforated thin nanofur films or exposure tominimal mechanical stress can easily rupture and irreversible damage the films.Because of these issues and the limited control over the pore diameter, perforationby etching was not further pursued as a perforation technique for thin nanofur.
Perforation by Laser Drilling
Another perforation technique investigated in this thesis is laser drilling. Laser aretypically used in material fabrication of thin films because of the minimal thermaland non-existent mechanical and electrical stress during fabrication [117]. In orderto minimize damage to the nanofur topography a short pulse laser operating ata wavelength of 248 nm, a frequency of 200Hz and a pulse length between 4 nsand 6 ns was used. Laser perforation was undertaken by Heino Besser from theLaser Process Technique Group at the Institute of Applied Materials. Thin nanofurfilms were laser drilled from the backside, as drilling from the front side damagedthe nano- and microhairs, and, thus, resulted in a loss of superhydrophobicity. Incontrast, laser drilling from the back did not damage the nanofur topography andresulted in pore diameters down to 15 μm (Fig. 3.6). Additionally, pores are drilledaccording to a predefined array, and, thus, position and number of pores can becontrolled precisely. Because laser-drilling can be completely automated, it is afeasible method for both perforation of large scale films as well as perforation ofa high number of films.
40
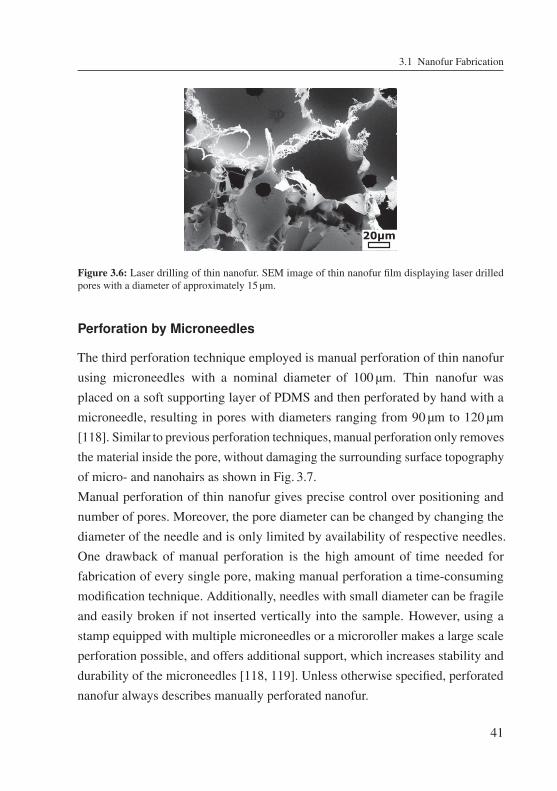
3.1 Nanofur Fabrication
20μm
Figure 3.6: Laser drilling of thin nanofur. SEM image of thin nanofur film displaying laser drilledpores with a diameter of approximately 15 μm.
Perforation by Microneedles
The third perforation technique employed is manual perforation of thin nanofurusing microneedles with a nominal diameter of 100 μm. Thin nanofur wasplaced on a soft supporting layer of PDMS and then perforated by hand with amicroneedle, resulting in pores with diameters ranging from 90 μm to 120 μm[118]. Similar to previous perforation techniques,manual perforation only removesthe material inside the pore, without damaging the surrounding surface topographyof micro- and nanohairs as shown in Fig. 3.7.Manual perforation of thin nanofur gives precise control over positioning andnumber of pores. Moreover, the pore diameter can be changed by changing thediameter of the needle and is only limited by availability of respective needles.One drawback of manual perforation is the high amount of time needed forfabrication of every single pore, making manual perforation a time-consumingmodification technique. Additionally, needles with small diameter can be fragileand easily broken if not inserted vertically into the sample. However, using astamp equipped with multiple microneedles or a microroller makes a large scaleperforation possible, and offers additional support, which increases stability and
41
durability of the microneedles [118, 119]. Unless otherwise specified, perforatednanofur always describes manually perforated nanofur.
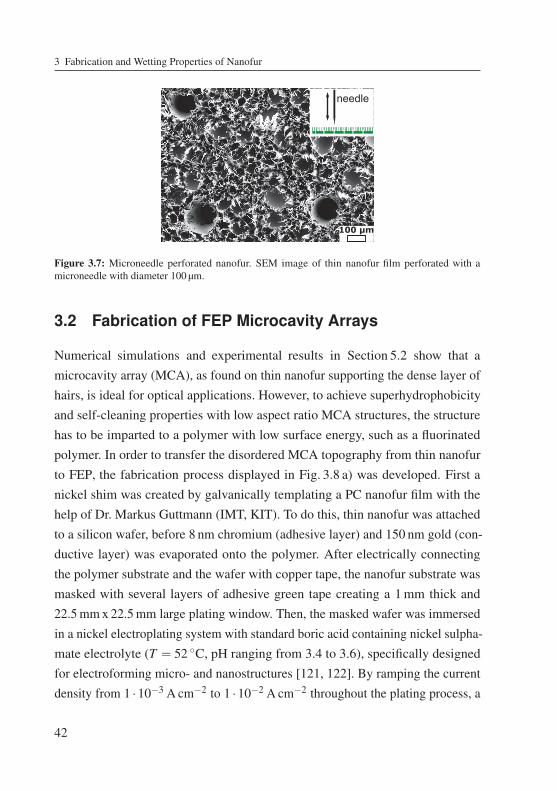
3 Fabrication and Wetting Properties of Nanofur
100 μm
needle
Figure 3.7: Microneedle perforated nanofur. SEM image of thin nanofur film perforated with amicroneedle with diameter 100 μm.
3.2 Fabrication of FEP Microcavity Arrays
Numerical simulations and experimental results in Section 5.2 show that amicrocavity array (MCA), as found on thin nanofur supporting the dense layer ofhairs, is ideal for optical applications. However, to achieve superhydrophobicityand self-cleaning properties with low aspect ratio MCA structures, the structurehas to be imparted to a polymer with low surface energy, such as a fluorinatedpolymer. In order to transfer the disordered MCA topography from thin nanofurto FEP, the fabrication process displayed in Fig. 3.8 a) was developed. First anickel shim was created by galvanically templating a PC nanofur film with thehelp of Dr. Markus Guttmann (IMT, KIT). To do this, thin nanofur was attachedto a silicon wafer, before 8 nm chromium (adhesive layer) and 150 nm gold (con-ductive layer) was evaporated onto the polymer. After electrically connectingthe polymer substrate and the wafer with copper tape, the nanofur substrate wasmasked with several layers of adhesive green tape creating a 1mm thick and22.5mmx 22.5mm large plating window. Then, the masked wafer was immersed
42
in a nickel electroplating system with standard boric acid containing nickel sulpha-mate electrolyte (T = 52 ◦C, pH ranging from 3.4 to 3.6), specifically designedfor electroforming micro- and nanostructures [121, 122]. By ramping the currentdensity from 1 ·10−3 A cm−2 to 1 ·10−2 A cm−2 throughout the plating process, a
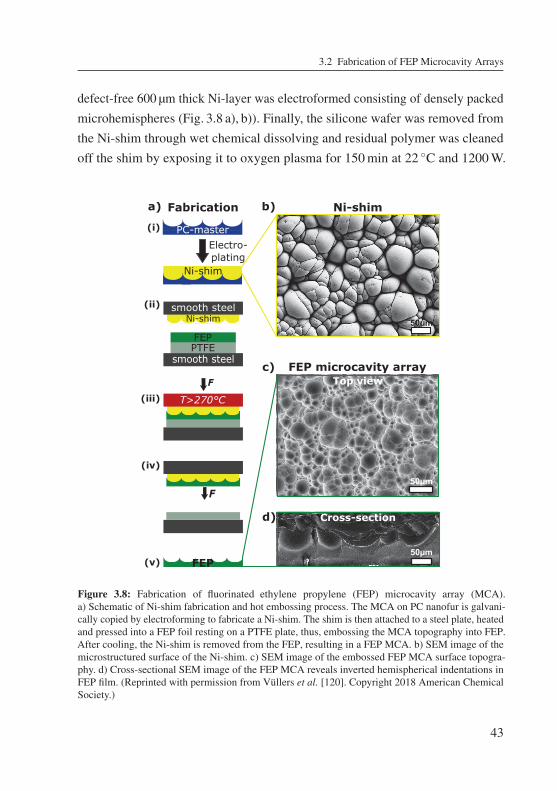
3.2 Fabrication of FEP Microcavity Arrays
a) b)
c)
50μm
Ni-shim
50μm
FEP microcavity array
50μm
d)
(ii)
(iii)
(iv)
(i)
(v)
Fabrication
smooth steel
smooth steel
FEPPTFE
Ni-shim
F
T>270°C
F
Electro-plating
Ni-shim
PC-master
FEP
Top view
Cross-section
Figure 3.8: Fabrication of fluorinated ethylene propylene (FEP) microcavity array (MCA).a) Schematic of Ni-shim fabrication and hot embossing process. The MCA on PC nanofur is galvani-cally copied by electroforming to fabricate a Ni-shim. The shim is then attached to a steel plate, heatedand pressed into a FEP foil resting on a PTFE plate, thus, embossing the MCA topography into FEP.After cooling, the Ni-shim is removed from the FEP, resulting in a FEP MCA. b) SEM image of themicrostructured surface of the Ni-shim. c) SEM image of the embossed FEP MCA surface topogra-phy. d) Cross-sectional SEM image of the FEP MCA reveals inverted hemispherical indentations inFEP film. (Reprinted with permission from Vüllers et al. [120]. Copyright 2018 American ChemicalSociety.)
43
defect-free 600 μm thick Ni-layer was electroformed consisting of densely packedmicrohemispheres (Fig. 3.8 a), b)). Finally, the silicone wafer was removed fromthe Ni-shim through wet chemical dissolving and residual polymer was cleanedoff the shim by exposing it to oxygen plasma for 150min at 22 ◦C and 1200W.
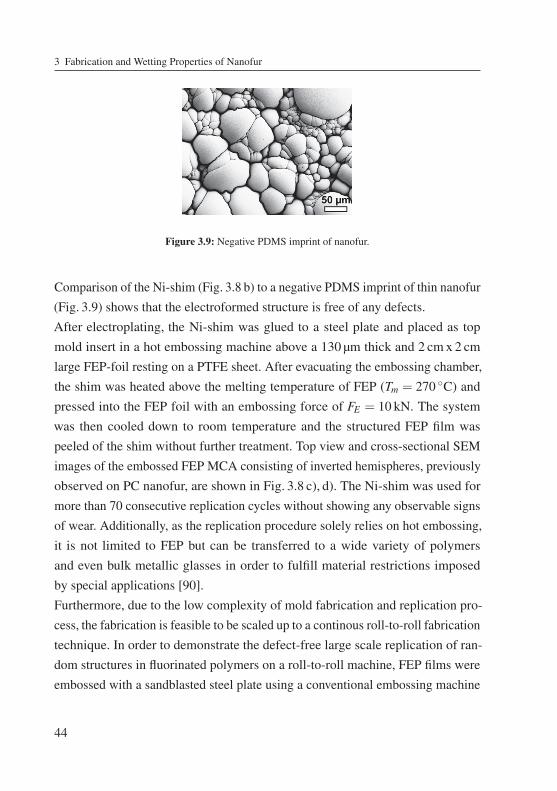
3 Fabrication and Wetting Properties of Nanofur
Figure 3.9: Negative PDMS imprint of nanofur.
Comparison of the Ni-shim (Fig. 3.8 b) to a negative PDMS imprint of thin nanofur(Fig. 3.9) shows that the electroformed structure is free of any defects.After electroplating, the Ni-shim was glued to a steel plate and placed as topmold insert in a hot embossing machine above a 130 μm thick and 2 cmx 2 cmlarge FEP-foil resting on a PTFE sheet. After evacuating the embossing chamber,the shim was heated above the melting temperature of FEP (Tm = 270 ◦C) andpressed into the FEP foil with an embossing force of FE = 10 kN. The systemwas then cooled down to room temperature and the structured FEP film waspeeled of the shim without further treatment. Top view and cross-sectional SEMimages of the embossed FEP MCA consisting of inverted hemispheres, previouslyobserved on PC nanofur, are shown in Fig. 3.8 c), d). The Ni-shim was used formore than 70 consecutive replication cycles without showing any observable signsof wear. Additionally, as the replication procedure solely relies on hot embossing,it is not limited to FEP but can be transferred to a wide variety of polymersand even bulk metallic glasses in order to fulfill material restrictions imposedby special applications [90].
44
Furthermore, due to the low complexity of mold fabrication and replication pro-cess, the fabrication is feasible to be scaled up to a continous roll-to-roll fabricationtechnique. In order to demonstrate the defect-free large scale replication of ran-dom structures in fluorinated polymers on a roll-to-roll machine, FEP films wereembossed with a sandblasted steel plate using a conventional embossing machine
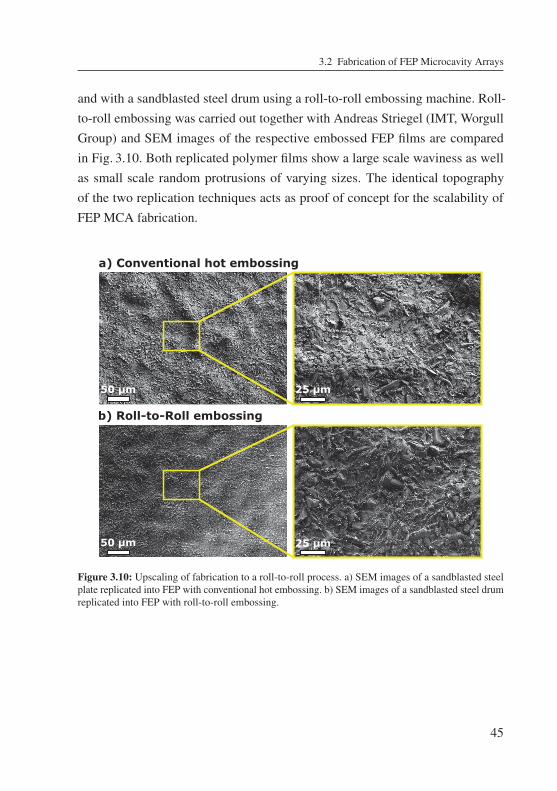
3.2 Fabrication of FEP Microcavity Arrays
25 μm
50 μm 25 μm
a) Conventional hot embossing
b) Roll-to-Roll embossing
50 μm
Figure 3.10: Upscaling of fabrication to a roll-to-roll process. a) SEM images of a sandblasted steelplate replicated into FEP with conventional hot embossing. b) SEM images of a sandblasted steel drumreplicated into FEP with roll-to-roll embossing.
45
and with a sandblasted steel drum using a roll-to-roll embossing machine. Roll-to-roll embossing was carried out together with Andreas Striegel (IMT, WorgullGroup) and SEM images of the respective embossed FEP films are comparedin Fig. 3.10. Both replicated polymer films show a large scale waviness as wellas small scale random protrusions of varying sizes. The identical topographyof the two replication techniques acts as proof of concept for the scalability ofFEP MCA fabrication.
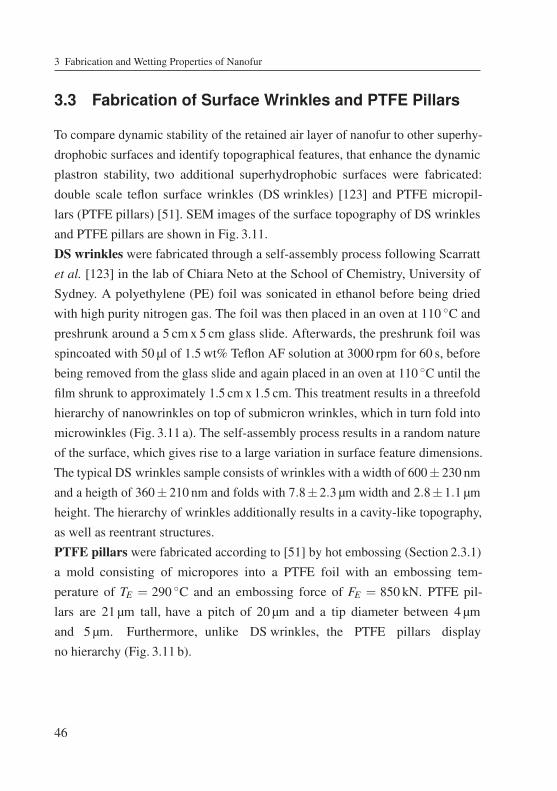
3 Fabrication and Wetting Properties of Nanofur
3.3 Fabrication of Surface Wrinkles and PTFE Pillars
To compare dynamic stability of the retained air layer of nanofur to other superhy-drophobic surfaces and identify topographical features, that enhance the dynamicplastron stability, two additional superhydrophobic surfaces were fabricated:double scale teflon surface wrinkles (DS wrinkles) [123] and PTFE micropil-lars (PTFE pillars) [51]. SEM images of the surface topography of DS wrinklesand PTFE pillars are shown in Fig. 3.11.DS wrinkles were fabricated through a self-assembly process following Scarrattet al. [123] in the lab of Chiara Neto at the School of Chemistry, University ofSydney. A polyethylene (PE) foil was sonicated in ethanol before being driedwith high purity nitrogen gas. The foil was then placed in an oven at 110 ◦C andpreshrunk around a 5 cmx 5 cm glass slide. Afterwards, the preshrunk foil wasspincoated with 50 μl of 1.5wt% Teflon AF solution at 3000 rpm for 60 s, beforebeing removed from the glass slide and again placed in an oven at 110 ◦C until thefilm shrunk to approximately 1.5 cm x 1.5 cm. This treatment results in a threefoldhierarchy of nanowrinkles on top of submicron wrinkles, which in turn fold intomicrowinkles (Fig. 3.11 a). The self-assembly process results in a random natureof the surface, which gives rise to a large variation in surface feature dimensions.The typical DS wrinkles sample consists of wrinkles with a width of 600± 230 nmand a heigth of 360± 210 nm and folds with 7.8±2.3 μm width and 2.8±1.1 μmheight. The hierarchy of wrinkles additionally results in a cavity-like topography,as well as reentrant structures.PTFE pillars were fabricated according to [51] by hot embossing (Section 2.3.1)a mold consisting of micropores into a PTFE foil with an embossing tem-perature of TE = 290 ◦C and an embossing force of FE = 850 kN. PTFE pil-lars are 21 μm tall, have a pitch of 20 μm and a tip diameter between 4 μm
46
and 5 μm. Furthermore, unlike DS wrinkles, the PTFE pillars displayno hierarchy (Fig. 3.11 b).
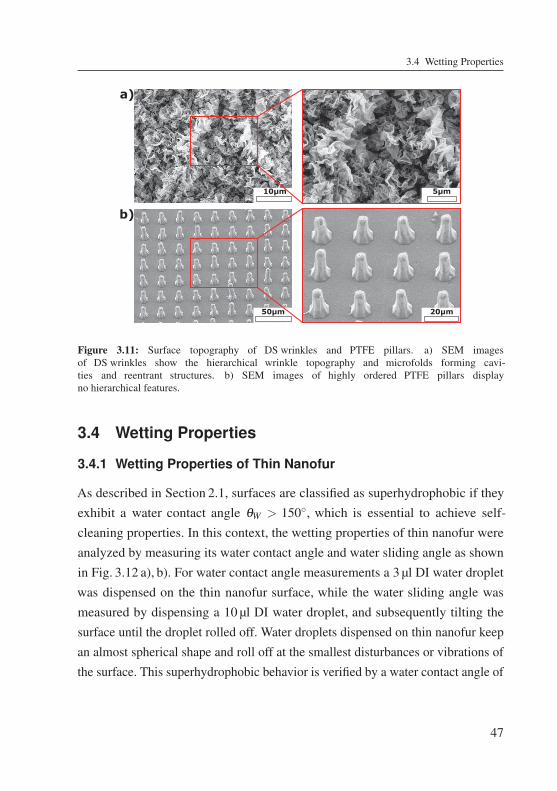
3.4 Wetting Properties
10μm
50μm
5μm
20μm
a)
b)
Figure 3.11: Surface topography of DS wrinkles and PTFE pillars. a) SEM imagesof DS wrinkles show the hierarchical wrinkle topography and microfolds forming cavi-ties and reentrant structures. b) SEM images of highly ordered PTFE pillars displayno hierarchical features.
3.4 Wetting Properties
3.4.1 Wetting Properties of Thin Nanofur
As described in Section 2.1, surfaces are classified as superhydrophobic if theyexhibit a water contact angle θW > 150◦, which is essential to achieve self-cleaning properties. In this context, the wetting properties of thin nanofur wereanalyzed by measuring its water contact angle and water sliding angle as shownin Fig. 3.12 a), b). For water contact angle measurements a 3 μl DI water dropletwas dispensed on the thin nanofur surface, while the water sliding angle wasmeasured by dispensing a 10 μl DI water droplet, and subsequently tilting thesurface until the droplet rolled off. Water droplets dispensed on thin nanofur keep
47
an almost spherical shape and roll off at the smallest disturbances or vibrations ofthe surface. This superhydrophobic behavior is verified by a water contact angle of
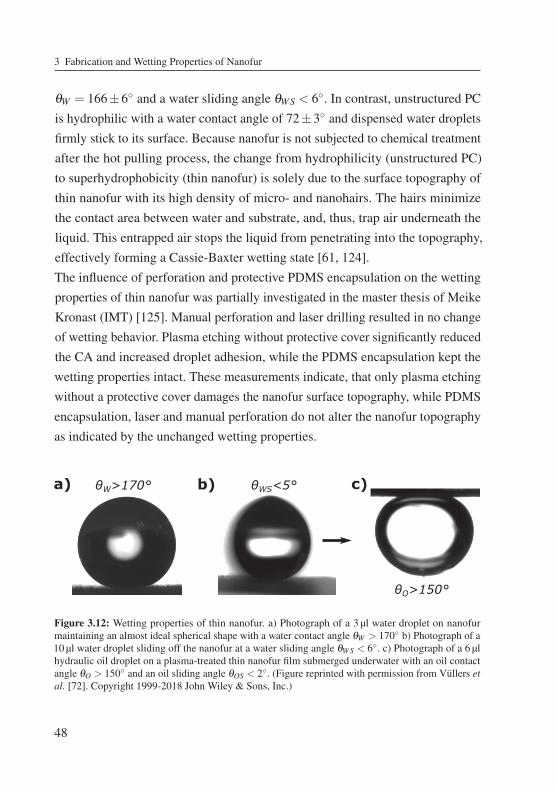
3 Fabrication and Wetting Properties of Nanofur
a) c)b)W>170° WS<5°
O>150°
Figure 3.12: Wetting properties of thin nanofur. a) Photograph of a 3 μl water droplet on nanofurmaintaining an almost ideal spherical shape with a water contact angle θW > 170◦ b) Photograph of a10 μl water droplet sliding off the nanofur at a water sliding angle θWS < 6◦. c) Photograph of a 6 μlhydraulic oil droplet on a plasma-treated thin nanofur film submerged underwater with an oil contactangle θO > 150◦ and an oil sliding angle θOS < 2◦. (Figure reprinted with permission from Vüllers etal. [72]. Copyright 1999-2018 John Wiley & Sons, Inc.)
48
θW = 166±6◦ and a water sliding angle θWS < 6◦. In contrast, unstructured PCis hydrophilic with a water contact angle of 72±3◦ and dispensed water dropletsfirmly stick to its surface. Because nanofur is not subjected to chemical treatmentafter the hot pulling process, the change from hydrophilicity (unstructured PC)to superhydrophobicity (thin nanofur) is solely due to the surface topography ofthin nanofur with its high density of micro- and nanohairs. The hairs minimizethe contact area between water and substrate, and, thus, trap air underneath theliquid. This entrapped air stops the liquid from penetrating into the topography,effectively forming a Cassie-Baxter wetting state [61, 124].The influence of perforation and protective PDMS encapsulation on the wettingproperties of thin nanofur was partially investigated in the master thesis of MeikeKronast (IMT) [125]. Manual perforation and laser drilling resulted in no changeof wetting behavior. Plasma etching without protective cover significantly reducedthe CA and increased droplet adhesion, while the PDMS encapsulation kept thewetting properties intact. These measurements indicate, that only plasma etchingwithout a protective cover damages the nanofur surface topography, while PDMSencapsulation, laser and manual perforation do not alter the nanofur topographyas indicated by the unchanged wetting properties.
3.4 Wetting Properties
3.4.2 Reversing the Wetting Behavior
Even though superhydrophobicity is a highly desirable property for many appli-cations, it can be necessary to modify the wetting behavior of extreme wettingfilms. Underwater superoleophobicity, which is beneficial for lossless oil droplettransport, lab-on-chip devices or oil-water separation [126, 127], requires highaspect ratio surface features with hydrophilic properties. Because high aspectratio features are prevalent on most superhydrophobic surfaces, the combinationof topography and wetting behavior required for underwater superoleophobicitycan be achieved by reversing the wetting behavior of superhydrophobic surfaces.Plasma treatment is often used to precisely tailor the wetting behavior of poly-mers and metals [112, 128]. To reverse the wetting behavior of nanofur fromsuperhydrophobic to hydrophilic, while keeping the surface topography intact,thin nanofur was exposed to argon plasma for 30 s at 30W and 0.2mbar. Thistreatment results in the formation of hydrophilic chemical groups on the surface[129], making the plasma treated nanofur (p-nanofur) underwater superoleophobicwith an oil in water CA of θO > 150◦ (Fig. 3.12 c) and an oil sliding angle below2◦. Because of the hydrophilicity of p-nanofur, water fills the space in betweenthe micro- and nanohairs, thus, forming a separating water layer between the thinnanofur surface and the oil droplet. As a result, the oil droplet rests on a water-solidcomposite surface resembling an underwater Cassie-Baxter state, which results inexcellent oil repellency [130]. Hence, the effect a water layer has on oil repellencyis analogous to the effect the retained air layer of a superhydrophobic surface hason water adhesion.However, the change in wetting behavior through plasma treatment is not per-manent and the treated surface reverts back to its high CA through the so-calledhydrophobic recovery [129, 131, 132]. Reorientation and mass diffusion of polargroups inside the material are responsible for hydrophobic recovery [129, 131].
49
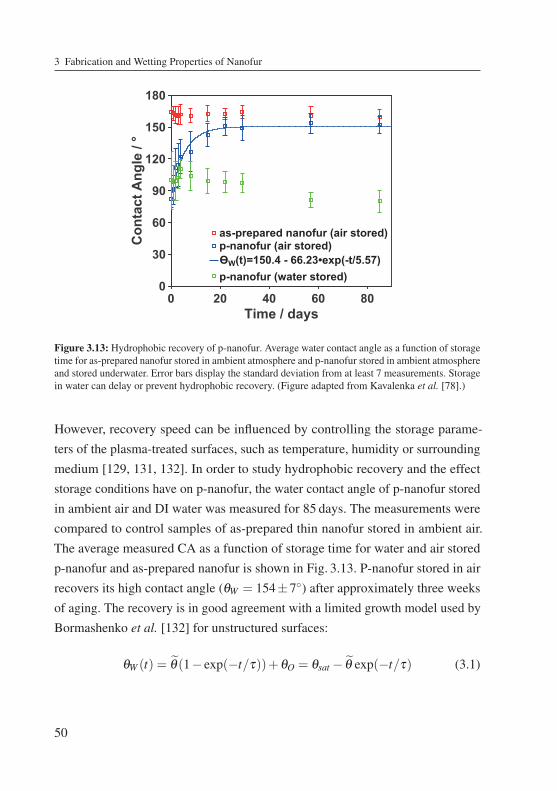
3 Fabrication and Wetting Properties of Nanofur
0 20 40 60 80Time / days
0
30
60
90
120
150
180
Con
tact
Ang
le /
°
as-prepared nanofur (air stored)p-nanofur (air stored)
p-nanofur (water stored)W(t)=150.4 - 66.23•exp(-t/5.57)
Figure 3.13: Hydrophobic recovery of p-nanofur. Average water contact angle as a function of storagetime for as-prepared nanofur stored in ambient atmosphere and p-nanofur stored in ambient atmosphereand stored underwater. Error bars display the standard deviation from at least 7 measurements. Storagein water can delay or prevent hydrophobic recovery. (Figure adapted from Kavalenka et al. [78].)
However, recovery speed can be influenced by controlling the storage parame-ters of the plasma-treated surfaces, such as temperature, humidity or surroundingmedium [129, 131, 132]. In order to study hydrophobic recovery and the effectstorage conditions have on p-nanofur, the water contact angle of p-nanofur storedin ambient air and DI water was measured for 85 days. The measurements werecompared to control samples of as-prepared thin nanofur stored in ambient air.The average measured CA as a function of storage time for water and air storedp-nanofur and as-prepared nanofur is shown in Fig. 3.13. P-nanofur stored in airrecovers its high contact angle (θW = 154±7◦) after approximately three weeksof aging. The recovery is in good agreement with a limited growth model used byBormashenko et al. [132] for unstructured surfaces:
θW (t) = θ(1− exp(−t/τ))+θO = θsat − θ exp(−t/τ) (3.1)
50
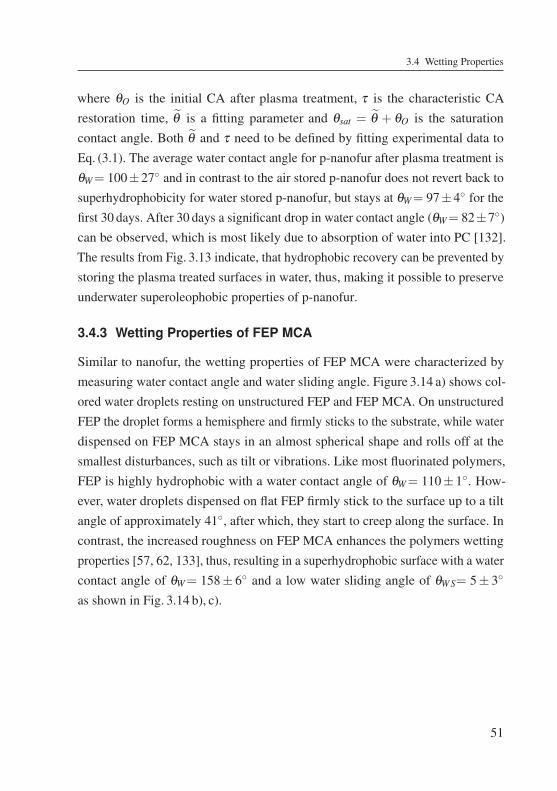
3.4 Wetting Properties
where θO is the initial CA after plasma treatment, τ is the characteristic CArestoration time, θ is a fitting parameter and θsat = θ + θO is the saturationcontact angle. Both θ and τ need to be defined by fitting experimental data toEq. (3.1). The average water contact angle for p-nanofur after plasma treatment isθW= 100±27◦ and in contrast to the air stored p-nanofur does not revert back tosuperhydrophobicity for water stored p-nanofur, but stays at θW= 97±4◦ for thefirst 30 days. After 30 days a significant drop in water contact angle (θW= 82±7◦)can be observed, which is most likely due to absorption of water into PC [132].The results from Fig. 3.13 indicate, that hydrophobic recovery can be prevented bystoring the plasma treated surfaces in water, thus, making it possible to preserveunderwater superoleophobic properties of p-nanofur.
3.4.3 Wetting Properties of FEP MCA
Similar to nanofur, the wetting properties of FEP MCA were characterized bymeasuring water contact angle and water sliding angle. Figure 3.14 a) shows col-ored water droplets resting on unstructured FEP and FEP MCA. On unstructuredFEP the droplet forms a hemisphere and firmly sticks to the substrate, while waterdispensed on FEP MCA stays in an almost spherical shape and rolls off at thesmallest disturbances, such as tilt or vibrations. Like most fluorinated polymers,FEP is highly hydrophobic with a water contact angle of θW= 110± 1◦. How-ever, water droplets dispensed on flat FEP firmly stick to the surface up to a tiltangle of approximately 41◦, after which, they start to creep along the surface. Incontrast, the increased roughness on FEP MCA enhances the polymers wettingproperties [57, 62, 133], thus, resulting in a superhydrophobic surface with a watercontact angle of θW= 158± 6◦ and a low water sliding angle of θWS= 5± 3◦as shown in Fig. 3.14 b), c).
51
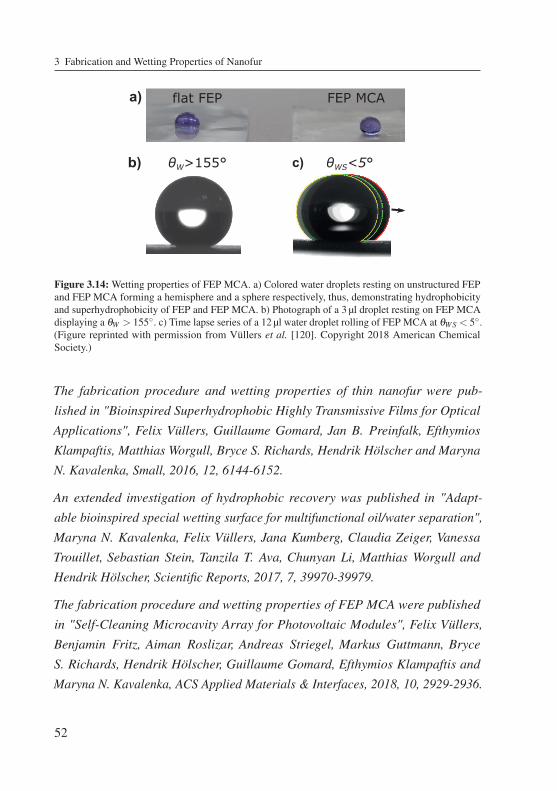
3 Fabrication and Wetting Properties of Nanofur
WS<5°c)b) W>155°
a) flat FEP FEP MCA
Figure 3.14: Wetting properties of FEP MCA. a) Colored water droplets resting on unstructured FEPand FEP MCA forming a hemisphere and a sphere respectively, thus, demonstrating hydrophobicityand superhydrophobicity of FEP and FEP MCA. b) Photograph of a 3 μl droplet resting on FEP MCAdisplaying a θW > 155◦. c) Time lapse series of a 12 μl water droplet rolling of FEP MCA at θWS < 5◦.(Figure reprinted with permission from Vüllers et al. [120]. Copyright 2018 American ChemicalSociety.)
The fabrication procedure and wetting properties of thin nanofur were pub-
lished in "Bioinspired Superhydrophobic Highly Transmissive Films for Optical
Applications", Felix Vüllers, Guillaume Gomard, Jan B. Preinfalk, Efthymios
Klampaftis, Matthias Worgull, Bryce S. Richards, Hendrik Hölscher and Maryna
N. Kavalenka, Small, 2016, 12, 6144-6152.
An extended investigation of hydrophobic recovery was published in "Adapt-
able bioinspired special wetting surface for multifunctional oil/water separation",
Maryna N. Kavalenka, Felix Vüllers, Jana Kumberg, Claudia Zeiger, Vanessa
Trouillet, Sebastian Stein, Tanzila T. Ava, Chunyan Li, Matthias Worgull and
Hendrik Hölscher, Scientific Reports, 2017, 7, 39970-39979.
The fabrication procedure and wetting properties of FEP MCA were published
in "Self-Cleaning Microcavity Array for Photovoltaic Modules", Felix Vüllers,
Benjamin Fritz, Aiman Roslizar, Andreas Striegel, Markus Guttmann, Bryce
S. Richards, Hendrik Hölscher, Guillaume Gomard, Efthymios Klampaftis and
Maryna N. Kavalenka, ACS Applied Materials & Interfaces, 2018, 10, 2929-2936.
52
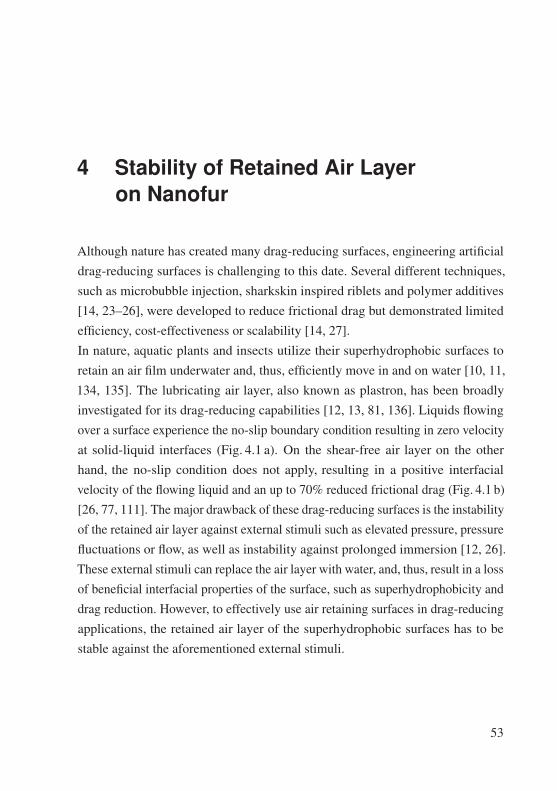
4 Stability of Retained Air Layeron Nanofur
Although nature has created many drag-reducing surfaces, engineering artificialdrag-reducing surfaces is challenging to this date. Several different techniques,such as microbubble injection, sharkskin inspired riblets and polymer additives[14, 23–26], were developed to reduce frictional drag but demonstrated limitedefficiency, cost-effectiveness or scalability [14, 27].In nature, aquatic plants and insects utilize their superhydrophobic surfaces toretain an air film underwater and, thus, efficiently move in and on water [10, 11,134, 135]. The lubricating air layer, also known as plastron, has been broadlyinvestigated for its drag-reducing capabilities [12, 13, 81, 136]. Liquids flowingover a surface experience the no-slip boundary condition resulting in zero velocityat solid-liquid interfaces (Fig. 4.1 a). On the shear-free air layer on the otherhand, the no-slip condition does not apply, resulting in a positive interfacialvelocity of the flowing liquid and an up to 70% reduced frictional drag (Fig. 4.1 b)[26, 77, 111]. The major drawback of these drag-reducing surfaces is the instabilityof the retained air layer against external stimuli such as elevated pressure, pressurefluctuations or flow, as well as instability against prolonged immersion [12, 26].These external stimuli can replace the air layer with water, and, thus, result in a lossof beneficial interfacial properties of the surface, such as superhydrophobicity anddrag reduction. However, to effectively use air retaining surfaces in drag-reducingapplications, the retained air layer of the superhydrophobic surfaces has to bestable against the aforementioned external stimuli.
53
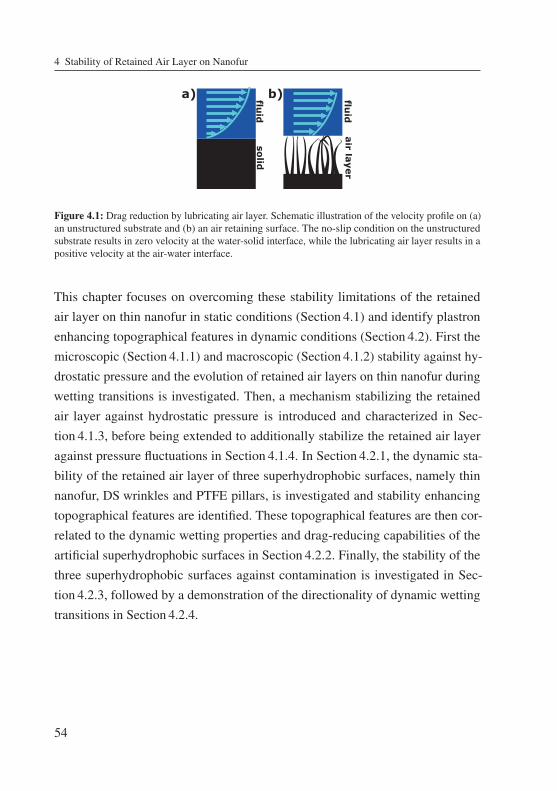
4 Stability of Retained Air Layer on Nanofur
a) b)fluid
solid
fluid
air layerFigure 4.1: Drag reduction by lubricating air layer. Schematic illustration of the velocity profile on (a)an unstructured substrate and (b) an air retaining surface. The no-slip condition on the unstructuredsubstrate results in zero velocity at the water-solid interface, while the lubricating air layer results in apositive velocity at the air-water interface.
This chapter focuses on overcoming these stability limitations of the retainedair layer on thin nanofur in static conditions (Section 4.1) and identify plastronenhancing topographical features in dynamic conditions (Section 4.2). First themicroscopic (Section 4.1.1) and macroscopic (Section 4.1.2) stability against hy-drostatic pressure and the evolution of retained air layers on thin nanofur duringwetting transitions is investigated. Then, a mechanism stabilizing the retainedair layer against hydrostatic pressure is introduced and characterized in Sec-tion 4.1.3, before being extended to additionally stabilize the retained air layeragainst pressure fluctuations in Section 4.1.4. In Section 4.2.1, the dynamic sta-bility of the retained air layer of three superhydrophobic surfaces, namely thinnanofur, DS wrinkles and PTFE pillars, is investigated and stability enhancingtopographical features are identified. These topographical features are then cor-related to the dynamic wetting properties and drag-reducing capabilities of theartificial superhydrophobic surfaces in Section 4.2.2. Finally, the stability of thethree superhydrophobic surfaces against contamination is investigated in Sec-tion 4.2.3, followed by a demonstration of the directionality of dynamic wettingtransitions in Section 4.2.4.
54
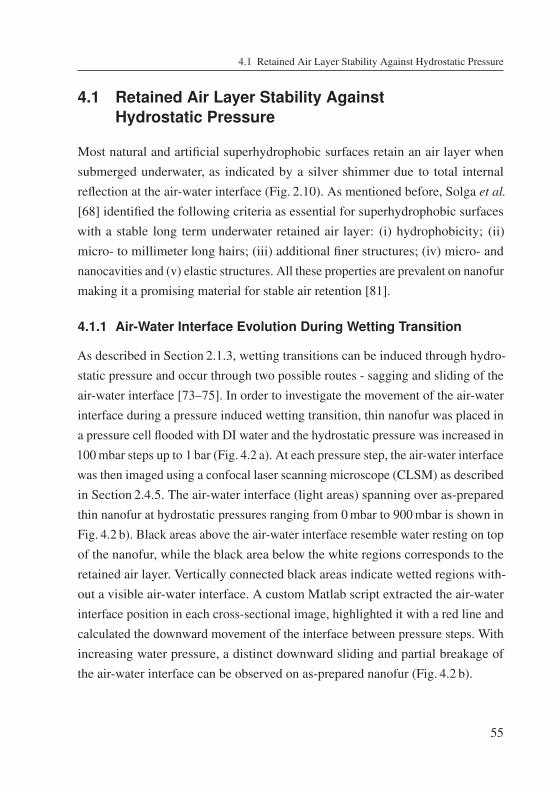
4.1 Retained Air Layer Stability Against Hydrostatic Pressure
4.1 Retained Air Layer Stability AgainstHydrostatic Pressure
Most natural and artificial superhydrophobic surfaces retain an air layer whensubmerged underwater, as indicated by a silver shimmer due to total internalreflection at the air-water interface (Fig. 2.10). As mentioned before, Solga et al.
[68] identified the following criteria as essential for superhydrophobic surfaceswith a stable long term underwater retained air layer: (i) hydrophobicity; (ii)micro- to millimeter long hairs; (iii) additional finer structures; (iv) micro- andnanocavities and (v) elastic structures. All these properties are prevalent on nanofurmaking it a promising material for stable air retention [81].
4.1.1 Air-Water Interface Evolution During Wetting Transition
As described in Section 2.1.3, wetting transitions can be induced through hydro-static pressure and occur through two possible routes - sagging and sliding of theair-water interface [73–75]. In order to investigate the movement of the air-waterinterface during a pressure induced wetting transition, thin nanofur was placed ina pressure cell flooded with DI water and the hydrostatic pressure was increased in100mbar steps up to 1 bar (Fig. 4.2 a). At each pressure step, the air-water interfacewas then imaged using a confocal laser scanning microscope (CLSM) as describedin Section 2.4.5. The air-water interface (light areas) spanning over as-preparedthin nanofur at hydrostatic pressures ranging from 0mbar to 900mbar is shown inFig. 4.2 b). Black areas above the air-water interface resemble water resting on topof the nanofur, while the black area below the white regions corresponds to theretained air layer. Vertically connected black areas indicate wetted regions with-out a visible air-water interface. A custom Matlab script extracted the air-waterinterface position in each cross-sectional image, highlighted it with a red line andcalculated the downward movement of the interface between pressure steps. Withincreasing water pressure, a distinct downward sliding and partial breakage ofthe air-water interface can be observed on as-prepared nanofur (Fig. 4.2 b).
55
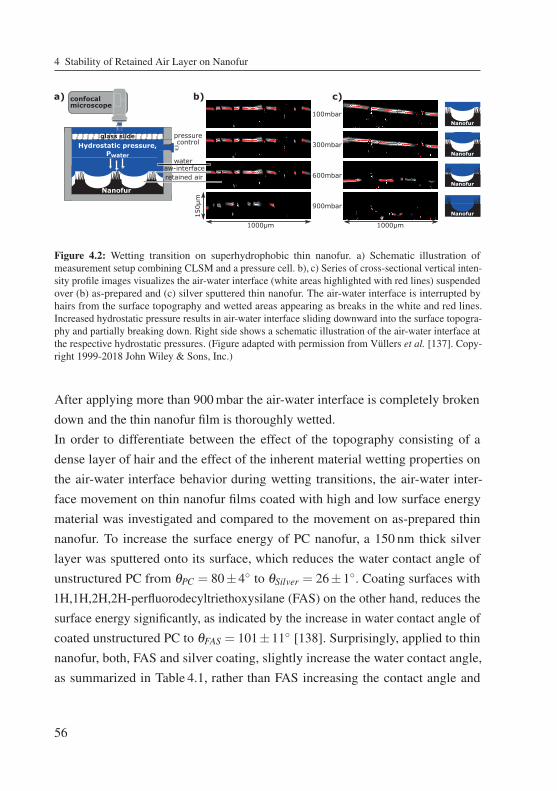
4 Stability of Retained Air Layer on Nanofur
Nanofur
Nanofur
Nanofur
Nanofur
100mbar
300mbar
600mbar
900mbar
b)
150μ
m
1000μm
c)
1000μm
confocalmicroscope
glass slide pressurecontrol
a)
wateraw-interfaceretained air
Hydrostatic pressure,Pwater
Nanofur
Figure 4.2: Wetting transition on superhydrophobic thin nanofur. a) Schematic illustration ofmeasurement setup combining CLSM and a pressure cell. b), c) Series of cross-sectional vertical inten-sity profile images visualizes the air-water interface (white areas highlighted with red lines) suspendedover (b) as-prepared and (c) silver sputtered thin nanofur. The air-water interface is interrupted byhairs from the surface topography and wetted areas appearing as breaks in the white and red lines.Increased hydrostatic pressure results in air-water interface sliding downward into the surface topogra-phy and partially breaking down. Right side shows a schematic illustration of the air-water interface atthe respective hydrostatic pressures. (Figure adapted with permission from Vüllers et al. [137]. Copy-right 1999-2018 John Wiley & Sons, Inc.)
applying more than 900mbar the air-water interface is completely brokendown and the thin nanofur film is thoroughly wetted.In order to differentiate between the effect of the topography consisting of adense layer of hair and the effect of the inherent material wetting properties onthe air-water interface behavior during wetting transitions, the air-water inter-face movement on thin nanofur films coated with high and low surface energymaterial was investigated and compared to the movement on as-prepared thinnanofur. To increase the surface energy of PC nanofur, a 150 nm thick silverlayer was sputtered onto its surface, which reduces the water contact angle ofunstructured PC from θPC = 80±4◦ to θSilver = 26±1◦. Coating surfaces with1H,1H,2H,2H-perfluorodecyltriethoxysilane (FAS) on the other hand, reduces thesurface energy significantly, as indicated by the increase in water contact angle ofcoated unstructured PC to θFAS = 101±11◦ [138]. Surprisingly, applied to thinnanofur, both, FAS and silver coating, slightly increase the water contact angle,as summarized in Table 4.1, rather than FAS increasing the contact angle and
56
After
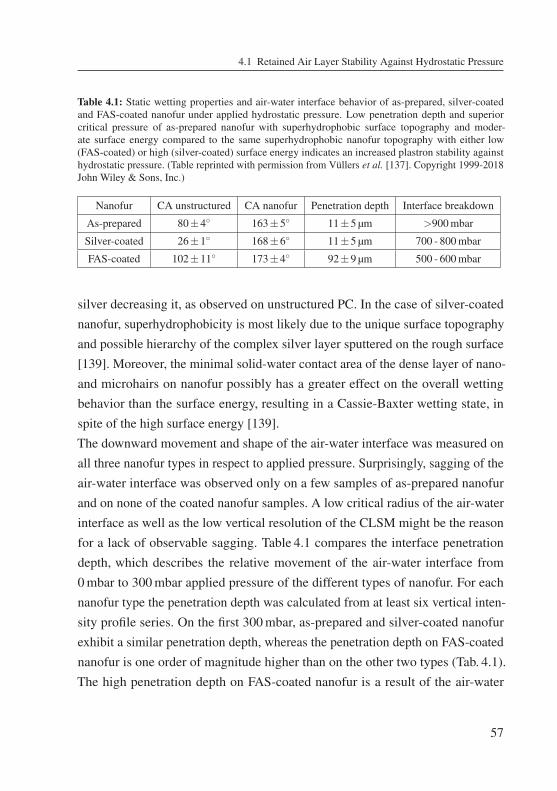
4.1 Retained Air Layer Stability Against Hydrostatic Pressure
Table 4.1: Static wetting properties and air-water interface behavior of as-prepared, silver-coatedand FAS-coated nanofur under applied hydrostatic pressure. Low penetration depth and superiorcritical pressure of as-prepared nanofur with superhydrophobic surface topography and moder-ate surface energy compared to the same superhydrophobic nanofur topography with either low(FAS-coated) or high (silver-coated) surface energy indicates an increased plastron stability againsthydrostatic pressure. (Table reprinted with permission from Vüllers et al. [137]. Copyright 1999-2018John Wiley & Sons, Inc.)
Nanofur CA unstructured CA nanofur Penetration depth Interface breakdown
As-prepared 80±4◦ 163±5◦ 11±5 μm >900mbar
Silver-coated 26±1◦ 168±6◦ 11±5 μm 700 - 800mbar
FAS-coated 102±11◦ 173±4◦ 92±9 μm 500 - 600mbar
silver decreasing it, as observed on unstructured PC. In the case of silver-coatednanofur, superhydrophobicity is most likely due to the unique surface topographyand possible hierarchy of the complex silver layer sputtered on the rough surface[139]. Moreover, the minimal solid-water contact area of the dense layer of nano-and microhairs on nanofur possibly has a greater effect on the overall wettingbehavior than the surface energy, resulting in a Cassie-Baxter wetting state, inspite of the high surface energy [139].The downward movement and shape of the air-water interface was measured onall three nanofur types in respect to applied pressure. Surprisingly, sagging of theair-water interface was observed only on a few samples of as-prepared nanofurand on none of the coated nanofur samples. A low critical radius of the air-waterinterface as well as the low vertical resolution of the CLSM might be the reasonfor a lack of observable sagging. Table 4.1 compares the interface penetrationdepth, which describes the relative movement of the air-water interface from0mbar to 300mbar applied pressure of the different types of nanofur. For eachnanofur type the penetration depth was calculated from at least six vertical inten-sity profile series. On the first 300mbar, as-prepared and silver-coated nanofurexhibit a similar penetration depth, whereas the penetration depth on FAS-coatednanofur is one order of magnitude higher than on the other two types (Tab. 4.1).The high penetration depth on FAS-coated nanofur is a result of the air-water
57
4 Stability of Retained Air Layer on Nanofur
interface resting on the apex of the highest microhairs in a metastable state. Anincrease in hydrostatic pressure results in an immediate downward movement ofthe air-water interface closer to the substrate and to the next layer of supportinghairs. Additionally, the increased movement is a result of easier air-water interfacesliding due to the low surface energy of the material. In contrast, the hydrophilichair tips on as-prepared and silver-coated nanofur can pin the air-water inter-face, thus, hindering its downward movement. For pressures exceeding 300mbarhowever, the air-water interface on silver-coated nanofur slides downward fasterthan on as-prepared thin nanofur (Fig. 4.2 b), c)). The same trend prevalent inpenetration depth can also be observed in the hydrostatic pressure required forcompletely breaking down the air-water interface. While the critical pressurerequired for a wetting transition on silver-coated nanofur is only slightly lowerthan on as-prepared nanofur, it is only half as much on FAS-coated nanofur as itis on as-prepared nanofur, indicating a reduced plastron stability.These results indicate that a combination of superhydrophobic surface topogra-phy and presence of moderate surface energy material increases stability of theair-water interface against hydrostatic pressure compared to the same superhy-drophobic topography with either high (silver-coated) or low (FAS-coated) surfaceenergy. A possible explanation for this superiority is the moderate surface energyof as-prepared nanofur compared to the other two extreme surface energy casesof FAS-coated and silver-coated nanofur. On silver coated nanofur (high surfaceenergy) the air-water interface is pinned at the apexes of the hairs, thus, stabi-lizing it. However, the high surface energy also results in an easier wettabilityof the nano- and mirohairs themselves, and, thus, a lower critical pressure thanon as-prepared nanofur. On the other hand, on FAS-coated nanofur (low surfaceenergy) a higher energy input is required to wet the nano- and microhairs them-selves, but the missing pinning effect of the air-water interface at the tips of thehairs results in a lower stability. Therefore, the slightly hydrophilic properties ofas-prepared nanofur result in a pinning of the air-water interface at the tips ofthe hairs, while simultaneously having a low enough surface energy to require asignificant energy input for water to penetrate into the topography, resulting in
58
4.1 Retained Air Layer Stability Against Hydrostatic Pressure
a maximum critical pressure. This outcome is in agreement with observationson the leaves of water fern Salvinia, where a superhydrophobic hairy topographycoupled with hydrophilic hair tips results in a retained air layer stable againsthigh hydrostatic pressures [2].
4.1.2 Retained Air Layer Stability of Thin Nanofur
Section 4.1.1 investigated the microscopic behavior and small scale stabilityof the retained air layer on thin nanofur. However, nanofur is a highly hetero-geneous surface and for many applications the macroscopic stability of theretained air layer is of importance. The next section investigates this macroscopicstability in more detail.
Hydrostatic Stability of Retained Air Layer on Nanofur
In order to investigate the robustness of the retained air layer on nanofur, n = 10nanofur samples were placed in a pressure cell filled with DI water and the air-water interface was studied using total internal reflection as described in Sec-tion 2.4.4. After sealing the cell, the hydrostatic pressure was increased and con-secutive in-situ images of the underwater retained air layer were taken at differentapplied pressures. The percentage of dry area was extracted from these imagesand normalized to the dry area without applied pressure. The normalized dry areaas a function of applied pressure is shown in Fig. 4.3 a), with the inset displayingprocessed images of two typical measurements at different applied pressures.The retained air layer decreases exponentially with increasing hydrostatic pressurewith approximately 50% still intact at 0.5 bar, and approximately 10% at 1.4 bar.In comparison, water starts penetrating in between the eggbeater-shaped hairs ofSalvinia molesta at≈ 0.12 bar and completely wets the surface at 5.8 bar [4], whilethe lotus leaf can only sustain an air layer up to 0.135 bar [140]. Furthermore, toinvestigate directionality of pressure induced wetting transitions, the retained airlayers on the upper and lower half of several thin nanofur films were processedand analyzed separately (Fig. 4.3 b). No difference in retained air layer stability
59
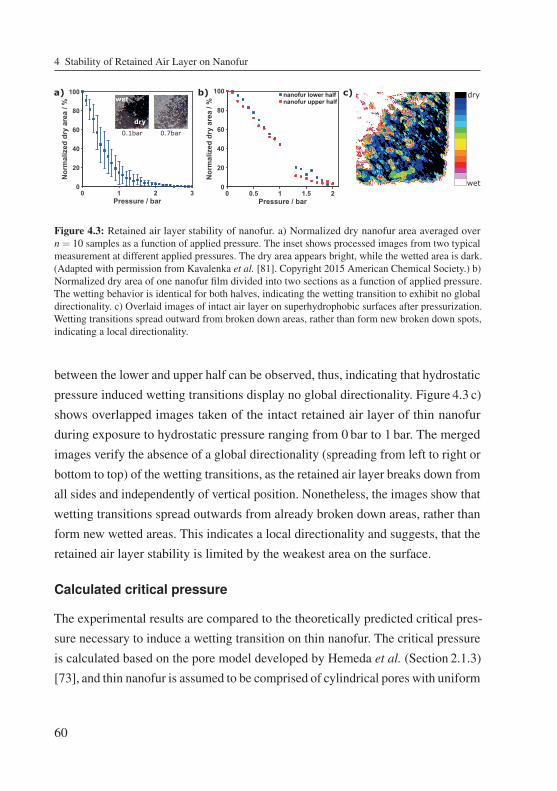
4 Stability of Retained Air Layer on Nanofur
0 1 2 3Pressure / bar
0
20
40
60
80
100
Nor
mal
ized
dry
are
a / %
0 0.5 1 1.5 2Pressure / bar
0
20
40
60
80
100
Nor
mal
ized
dry
are
a / %
nanofur lower halfnanofur upper halfwet
dry
0.1bar 0.7bar
a) b) c) dry
wet
Figure 4.3: Retained air layer stability of nanofur. a) Normalized dry nanofur area averaged overn = 10 samples as a function of applied pressure. The inset shows processed images from two typicalmeasurement at different applied pressures. The dry area appears bright, while the wetted area is dark.(Adapted with permission from Kavalenka et al. [81]. Copyright 2015 American Chemical Society.) b)Normalized dry area of one nanofur film divided into two sections as a function of applied pressure.The wetting behavior is identical for both halves, indicating the wetting transition to exhibit no globaldirectionality. c) Overlaid images of intact air layer on superhydrophobic surfaces after pressurization.Wetting transitions spread outward from broken down areas, rather than form new broken down spots,indicating a local directionality.
between the lower and upper half can be observed, thus, indicating that hydrostaticpressure induced wetting transitions display no global directionality. Figure 4.3 c)shows overlapped images taken of the intact retained air layer of thin nanofurduring exposure to hydrostatic pressure ranging from 0 bar to 1 bar. The mergedimages verify the absence of a global directionality (spreading from left to right orbottom to top) of the wetting transitions, as the retained air layer breaks down fromall sides and independently of vertical position. Nonetheless, the images show thatwetting transitions spread outwards from already broken down areas, rather thanform new wetted areas. This indicates a local directionality and suggests, that theretained air layer stability is limited by the weakest area on the surface.
Calculated critical pressure
The experimental results are compared to the theoretically predicted critical pres-sure necessary to induce a wetting transition on thin nanofur. The critical pressureis calculated based on the pore model developed by Hemeda et al. (Section 2.1.3)[73], and thin nanofur is assumed to be comprised of cylindrical pores with uniform
60
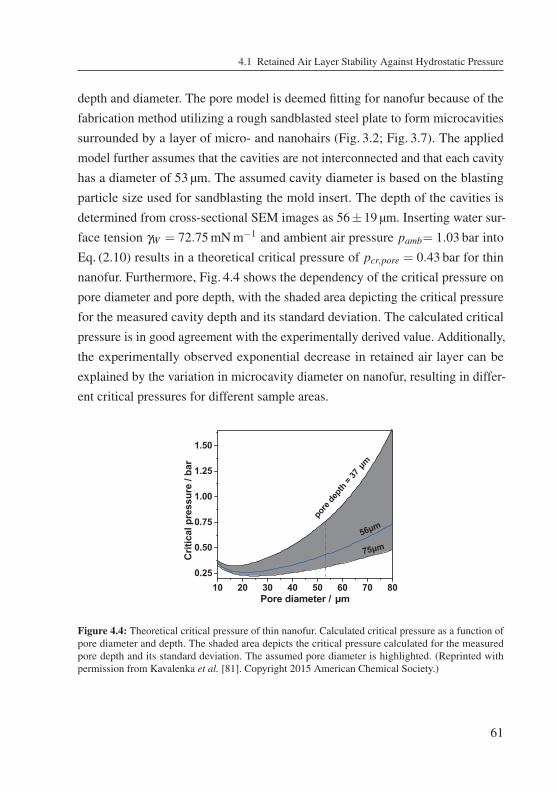
4.1 Retained Air Layer Stability Against Hydrostatic Pressure
depth and diameter. The pore model is deemed fitting for nanofur because of thefabrication method utilizing a rough sandblasted steel plate to form microcavitiessurrounded by a layer of micro- and nanohairs (Fig. 3.2; Fig. 3.7). The appliedmodel further assumes that the cavities are not interconnected and that each cavityhas a diameter of 53 μm. The assumed cavity diameter is based on the blastingparticle size used for sandblasting the mold insert. The depth of the cavities isdetermined from cross-sectional SEM images as 56±19 μm. Inserting water sur-face tension γW = 72.75mNm−1 and ambient air pressure pamb= 1.03 bar intoEq. (2.10) results in a theoretical critical pressure of pcr,pore = 0.43 bar for thinnanofur. Furthermore, Fig. 4.4 shows the dependency of the critical pressure onpore diameter and pore depth, with the shaded area depicting the critical pressurefor the measured cavity depth and its standard deviation. The calculated criticalpressure is in good agreement with the experimentally derived value. Additionally,the experimentally observed exponential decrease in retained air layer can beexplained by the variation in microcavity diameter on nanofur, resulting in differ-ent critical pressures for different sample areas.
10 20 30 40 50 60 70 800.25
0.50
0.75
1.00
1.25
1.50
75μm
Crit
ical
pre
ssur
e / b
ar
Pore diameter / μm
pore
depth
= 37
μm
56μm
Figure 4.4: Theoretical critical pressure of thin nanofur. Calculated critical pressure as a function ofpore diameter and depth. The shaded area depicts the critical pressure calculated for the measuredpore depth and its standard deviation. The assumed pore diameter is highlighted. (Reprinted withpermission from Kavalenka et al. [81]. Copyright 2015 American Chemical Society.)
61
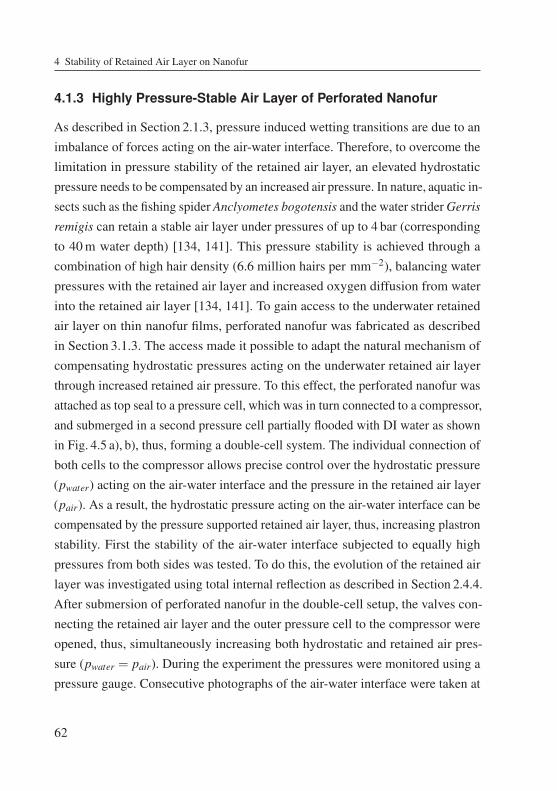
4 Stability of Retained Air Layer on Nanofur
4.1.3 Highly Pressure-Stable Air Layer of Perforated Nanofur
As described in Section 2.1.3, pressure induced wetting transitions are due to animbalance of forces acting on the air-water interface. Therefore, to overcome thelimitation in pressure stability of the retained air layer, an elevated hydrostaticpressure needs to be compensated by an increased air pressure. In nature, aquatic in-sects such as the fishing spider Anclyometes bogotensis and the water striderGerris
remigis can retain a stable air layer under pressures of up to 4 bar (correspondingto 40m water depth) [134, 141]. This pressure stability is achieved through acombination of high hair density (6.6 million hairs per mm−2), balancing waterpressures with the retained air layer and increased oxygen diffusion from waterinto the retained air layer [134, 141]. To gain access to the underwater retainedair layer on thin nanofur films, perforated nanofur was fabricated as describedin Section 3.1.3. The access made it possible to adapt the natural mechanism ofcompensating hydrostatic pressures acting on the underwater retained air layerthrough increased retained air pressure. To this effect, the perforated nanofur wasattached as top seal to a pressure cell, which was in turn connected to a compressor,and submerged in a second pressure cell partially flooded with DI water as shownin Fig. 4.5 a), b), thus, forming a double-cell system. The individual connection ofboth cells to the compressor allows precise control over the hydrostatic pressure(pwater) acting on the air-water interface and the pressure in the retained air layer(pair). As a result, the hydrostatic pressure acting on the air-water interface can becompensated by the pressure supported retained air layer, thus, increasing plastronstability. First the stability of the air-water interface subjected to equally highpressures from both sides was tested. To do this, the evolution of the retained airlayer was investigated using total internal reflection as described in Section 2.4.4.After submersion of perforated nanofur in the double-cell setup, the valves con-necting the retained air layer and the outer pressure cell to the compressor wereopened, thus, simultaneously increasing both hydrostatic and retained air pres-sure (pwater = pair). During the experiment the pressures were monitored using apressure gauge. Consecutive photographs of the air-water interface were taken at
62
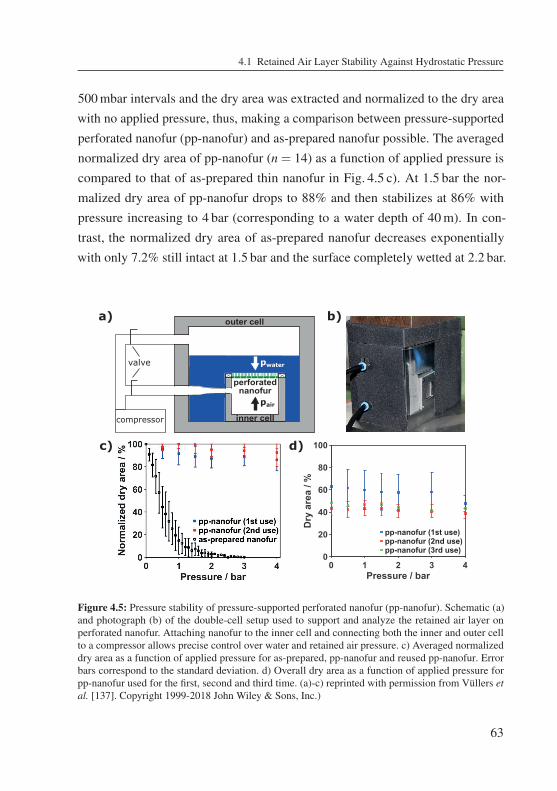
4.1 Retained Air Layer Stability Against Hydrostatic Pressure
0 1 2 3 4Pressure / bar
0
20
40
60
80
100
Dry
are
a / %
pp-nanofur (1st use)pp-nanofur (2nd use)pp-nanofur (3rd use)
a) b)
c) d)
perforatednanofur
compressor
outer cell
inner cell
valve pwater
pair
Figure 4.5: Pressure stability of pressure-supported perforated nanofur (pp-nanofur). Schematic (a)and photograph (b) of the double-cell setup used to support and analyze the retained air layer onperforated nanofur. Attaching nanofur to the inner cell and connecting both the inner and outer cellto a compressor allows precise control over water and retained air pressure. c) Averaged normalizeddry area as a function of applied pressure for as-prepared, pp-nanofur and reused pp-nanofur. Errorbars correspond to the standard deviation. d) Overall dry area as a function of applied pressure forpp-nanofur used for the first, second and third time. (a)-c) reprinted with permission from Vüllers etal. [137]. Copyright 1999-2018 John Wiley & Sons, Inc.)
63
500mbar intervals and the dry area was extracted and normalized to the dry areawith no applied pressure, thus, making a comparison between pressure-supportedperforated nanofur (pp-nanofur) and as-prepared nanofur possible. The averagednormalized dry area of pp-nanofur (n = 14) as a function of applied pressure iscompared to that of as-prepared thin nanofur in Fig. 4.5 c). At 1.5 bar the nor-malized dry area of pp-nanofur drops to 88% and then stabilizes at 86% withpressure increasing to 4 bar (corresponding to a water depth of 40m). In con-trast, the normalized dry area of as-prepared nanofur decreases exponentiallywith only 7.2% still intact at 1.5 bar and the surface completely wetted at 2.2 bar.
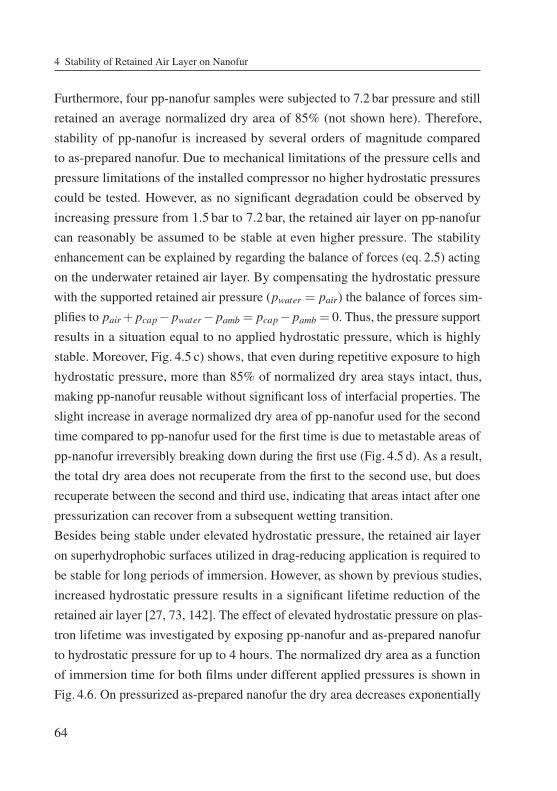
4 Stability of Retained Air Layer on Nanofur
Furthermore, four pp-nanofur samples were subjected to 7.2 bar pressure and stillretained an average normalized dry area of 85% (not shown here). Therefore,stability of pp-nanofur is increased by several orders of magnitude comparedto as-prepared nanofur. Due to mechanical limitations of the pressure cells andpressure limitations of the installed compressor no higher hydrostatic pressurescould be tested. However, as no significant degradation could be observed byincreasing pressure from 1.5 bar to 7.2 bar, the retained air layer on pp-nanofurcan reasonably be assumed to be stable at even higher pressure. The stabilityenhancement can be explained by regarding the balance of forces (eq. 2.5) actingon the underwater retained air layer. By compensating the hydrostatic pressurewith the supported retained air pressure (pwater = pair) the balance of forces sim-plifies to pair+ pcap− pwater− pamb = pcap− pamb = 0. Thus, the pressure supportresults in a situation equal to no applied hydrostatic pressure, which is highlystable. Moreover, Fig. 4.5 c) shows, that even during repetitive exposure to highhydrostatic pressure, more than 85% of normalized dry area stays intact, thus,making pp-nanofur reusable without significant loss of interfacial properties. Theslight increase in average normalized dry area of pp-nanofur used for the secondtime compared to pp-nanofur used for the first time is due to metastable areas ofpp-nanofur irreversibly breaking down during the first use (Fig. 4.5 d). As a result,the total dry area does not recuperate from the first to the second use, but doesrecuperate between the second and third use, indicating that areas intact after onepressurization can recover from a subsequent wetting transition.Besides being stable under elevated hydrostatic pressure, the retained air layeron superhydrophobic surfaces utilized in drag-reducing application is required tobe stable for long periods of immersion. However, as shown by previous studies,increased hydrostatic pressure results in a significant lifetime reduction of theretained air layer [27, 73, 142]. The effect of elevated hydrostatic pressure on plas-tron lifetime was investigated by exposing pp-nanofur and as-prepared nanofurto hydrostatic pressure for up to 4 hours. The normalized dry area as a functionof immersion time for both films under different applied pressures is shown inFig. 4.6. On pressurized as-prepared nanofur the dry area decreases exponentially
64
4.1 Retained Air Layer Stability Against Hydrostatic Pressure
with time. After two hours at 0.1 bar and 0.3 bar the dry area decreases to 55%and 35% respectively, demonstrating an increased decay of dry area through in-creased pressure. In contrast, the retained air layer on pp-nanofur pressurizedup to 3.5 bar is stable for more than four hours, after which the experiment wasstopped. Increasing the pressure to 4 bar, surprisingly results in a complete wet-ting transition of the nanofur surface after two hours. The plastron lifetime ofpp-nanofur is in the same order of magnitude as that of surfaces fabricated bySamaha et al. [143], who have recorded an air layer stable under 7.5 bar for upto 3.5 h on a fibrous polystyrene coating electrospun onto an aluminum plate. Incomparison, most other artificial superhydrophobic surfaces can sustain a stableretained air layer at up to 130mbar for no more than 4 hours, with longevitydecreasing exponentially with increasing pressure [144–146]. Natural surfacessuch as the lotus leaf break down after just 1 hour at 55mbar [147].
0 50 100 150 200 250Time / min
0
20
40
60
80
100
Nor
mal
ized
dry
are
a / %
nanofur: 0.1barnanofur: 0.3barpp-nanofur: 3.5barpp-nanofur: 4bar
Figure 4.6: Plastron lifetime on pp-nanofur. Normalized dry area as a function of immersion timefor as-prepared nanofur and pp-nanofur. Lines represent fits to the respective data. Lifetime of theretained air layer is significantly increased by pressure support. (Figure reprinted with permission fromVüllers et al. [137]. Copyright 1999-2018 John Wiley & Sons, Inc.)
65
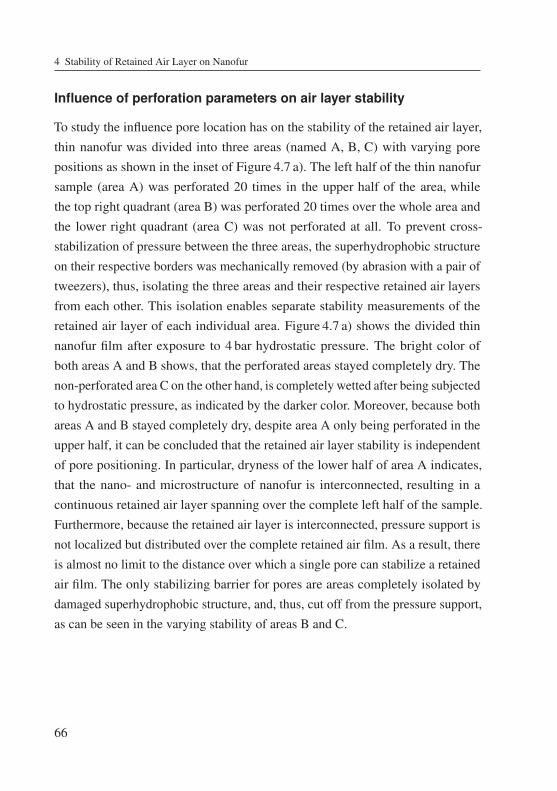
4 Stability of Retained Air Layer on Nanofur
Influence of perforation parameters on air layer stability
To study the influence pore location has on the stability of the retained air layer,thin nanofur was divided into three areas (named A, B, C) with varying porepositions as shown in the inset of Figure 4.7 a). The left half of the thin nanofursample (area A) was perforated 20 times in the upper half of the area, whilethe top right quadrant (area B) was perforated 20 times over the whole area andthe lower right quadrant (area C) was not perforated at all. To prevent cross-stabilization of pressure between the three areas, the superhydrophobic structureon their respective borders was mechanically removed (by abrasion with a pair oftweezers), thus, isolating the three areas and their respective retained air layersfrom each other. This isolation enables separate stability measurements of theretained air layer of each individual area. Figure 4.7 a) shows the divided thinnanofur film after exposure to 4 bar hydrostatic pressure. The bright color ofboth areas A and B shows, that the perforated areas stayed completely dry. Thenon-perforated area C on the other hand, is completely wetted after being subjectedto hydrostatic pressure, as indicated by the darker color. Moreover, because bothareas A and B stayed completely dry, despite area A only being perforated in theupper half, it can be concluded that the retained air layer stability is independentof pore positioning. In particular, dryness of the lower half of area A indicates,that the nano- and microstructure of nanofur is interconnected, resulting in acontinuous retained air layer spanning over the complete left half of the sample.Furthermore, because the retained air layer is interconnected, pressure support isnot localized but distributed over the complete retained air film. As a result, thereis almost no limit to the distance over which a single pore can stabilize a retainedair film. The only stabilizing barrier for pores are areas completely isolated bydamaged superhydrophobic structure, and, thus, cut off from the pressure support,as can be seen in the varying stability of areas B and C.
66
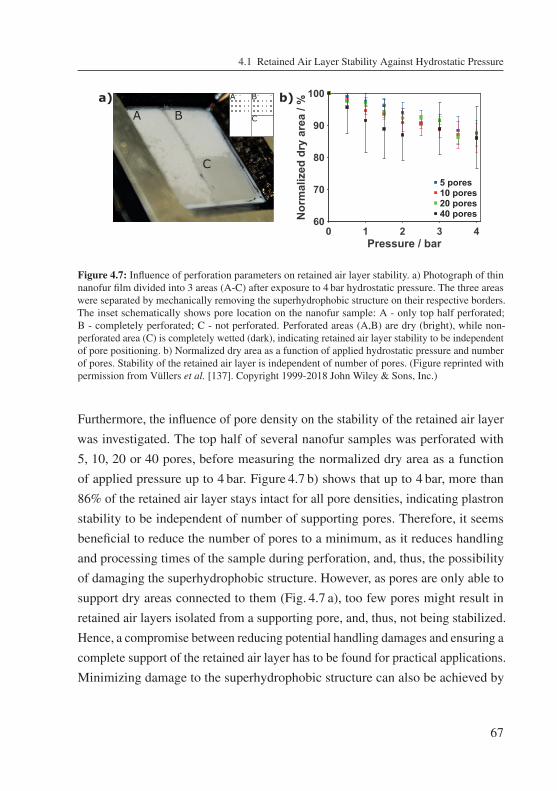
4.1 Retained Air Layer Stability Against Hydrostatic Pressure
0 1 2 3 4Pressure / bar
60
70
80
90
100
Nor
mal
ized
dry
are
a / %
5 pores10 pores20 pores40 pores
a) b)A B
C
A B
C
Figure 4.7: Influence of perforation parameters on retained air layer stability. a) Photograph of thinnanofur film divided into 3 areas (A-C) after exposure to 4 bar hydrostatic pressure. The three areaswere separated by mechanically removing the superhydrophobic structure on their respective borders.The inset schematically shows pore location on the nanofur sample: A - only top half perforated;B - completely perforated; C - not perforated. Perforated areas (A,B) are dry (bright), while non-perforated area (C) is completely wetted (dark), indicating retained air layer stability to be independentof pore positioning. b) Normalized dry area as a function of applied hydrostatic pressure and numberof pores. Stability of the retained air layer is independent of number of pores. (Figure reprinted withpermission from Vüllers et al. [137]. Copyright 1999-2018 John Wiley & Sons, Inc.)
Furthermore, the influence of pore density on the stability of the retained air layerwas investigated. The top half of several nanofur samples was perforated with5, 10, 20 or 40 pores, before measuring the normalized dry area as a functionof applied pressure up to 4 bar. Figure 4.7 b) shows that up to 4 bar, more than86% of the retained air layer stays intact for all pore densities, indicating plastronstability to be independent of number of supporting pores. Therefore, it seemsbeneficial to reduce the number of pores to a minimum, as it reduces handlingand processing times of the sample during perforation, and, thus, the possibilityof damaging the superhydrophobic structure. However, as pores are only able tosupport dry areas connected to them (Fig. 4.7 a), too few pores might result inretained air layers isolated from a supporting pore, and, thus, not being stabilized.Hence, a compromise between reducing potential handling damages and ensuring acomplete support of the retained air layer has to be found for practical applications.Minimizing damage to the superhydrophobic structure can also be achieved by
67
4 Stability of Retained Air Layer on Nanofur
reducing pore diameter and direct contact to the superhydrophobic surface duringperforation, as is the case for laser drilling pores. To investigate the suitability oflaser drilling for pressure support, the plastron stability of laser perforated andmanually perforated thin nanofur was compared, and no difference in plastronstability was observed between the two perforation techniques.
4.1.4 Retained Air Layer Stability AgainstWater Pressure Fluctuations
Materials used in drag-reducing applications do not only experience static pressurebut are often subjected to fluctuations of water pressure, which can result inwater penetrating into the surface topography and a subsequent breakdown ofthe air-water interface. The previous section has shown that as long as the waterpressure is balanced by an equivalent retained air pressure, the air-water interfaceis highly stable. By increasing the supporting air pressure above the hydrostaticpressure, sudden surges/fluctuations in hydrostatic pressure can be compensated,and the total hydrostatic pressure remains always below or at the same level asthe retained air pressure. The effect such a supporting air pressure exceeding thehydrostatic pressure has on the stability of the air-water interface was studiedon pp-nanofur. To this end, pp-nanofur was submerged in the double-cell setupand the hydrostatic (pwater) and retained air pressure (pair) were simultaneouslyincreased to a base pressure (pbase) ranging from 0 bar to 4 bar. After reachingpbase, the valve connecting the hydrostatic pressure to the compressor was closed,fixing pwater = pbase. Next, only pair was further increased in 0.2 bar steps (Δp)up to an additional 3 bar. At each pressure step pbase +Δp the normalized dryarea of the retained air layer was extracted. To do this, first the retained air layerwas depressurized back to pbase, before taking a photograph of the air-waterinterface. Depressurization of the retained air layer is necessary, as otherwisebubble formation would prevent an accurate depiction of the retained air layer.The average normalized dry area of three pp-nanofur films as a function of pres-sure difference Δp = pair− pbase is shown in Fig. 4.8 a). For low base pressure
68
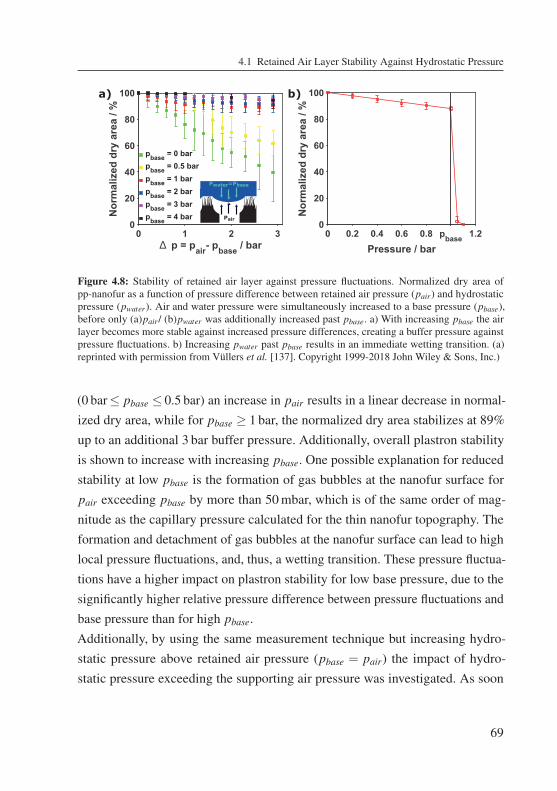
4.1 Retained Air Layer Stability Against Hydrostatic Pressure
0 1 2 3p = pair- pbase / bar
0
20
40
60
80
100
Nor
mal
ized
dry
are
a / %
pbase = 0 barpbase = 0.5 barpbase = 1 barpbase = 2 barpbase = 3 barpbase = 4 bar
0 0.2 0.4 0.6 0.8 pbase 1.2Pressure / bar
0
20
40
60
80
100
Nor
mal
ized
dry
are
a / %
a) b)
Pair
Pwater=Pbase
Figure 4.8: Stability of retained air layer against pressure fluctuations. Normalized dry area ofpp-nanofur as a function of pressure difference between retained air pressure (pair) and hydrostaticpressure (pwater). Air and water pressure were simultaneously increased to a base pressure (pbase),before only (a)pair/ (b)pwater was additionally increased past pbase. a) With increasing pbase the airlayer becomes more stable against increased pressure differences, creating a buffer pressure againstpressure fluctuations. b) Increasing pwater past pbase results in an immediate wetting transition. (a)reprinted with permission from Vüllers et al. [137]. Copyright 1999-2018 John Wiley & Sons, Inc.)
(0 bar≤ pbase ≤ 0.5 bar) an increase in pair results in a linear decrease in normal-ized dry area, while for pbase ≥ 1 bar, the normalized dry area stabilizes at 89%up to an additional 3 bar buffer pressure. Additionally, overall plastron stabilityis shown to increase with increasing pbase. One possible explanation for reducedstability at low pbase is the formation of gas bubbles at the nanofur surface forpair exceeding pbase by more than 50mbar, which is of the same order of mag-nitude as the capillary pressure calculated for the thin nanofur topography. Theformation and detachment of gas bubbles at the nanofur surface can lead to highlocal pressure fluctuations, and, thus, a wetting transition. These pressure fluctua-tions have a higher impact on plastron stability for low base pressure, due to thesignificantly higher relative pressure difference between pressure fluctuations andbase pressure than for high pbase.Additionally, by using the same measurement technique but increasing hydro-static pressure above retained air pressure (pbase = pair) the impact of hydro-static pressure exceeding the supporting air pressure was investigated. As soon
69
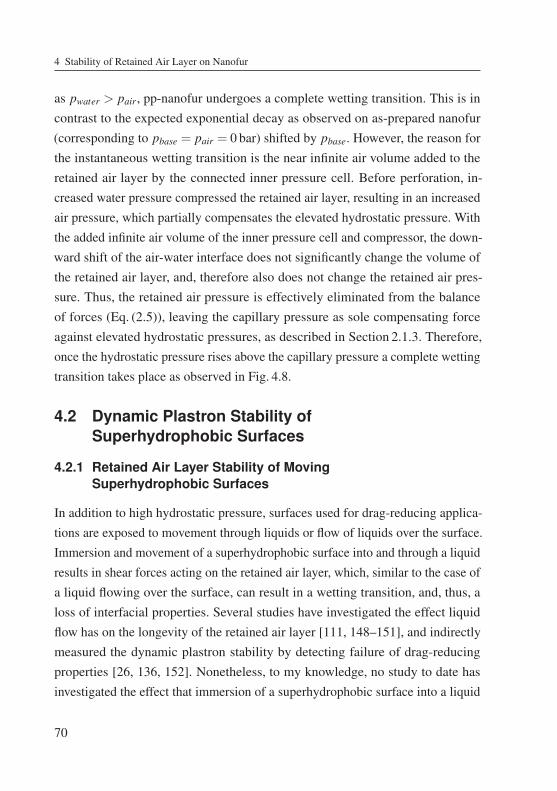
4 Stability of Retained Air Layer on Nanofur
as pwater > pair, pp-nanofur undergoes a complete wetting transition. This is incontrast to the expected exponential decay as observed on as-prepared nanofur(corresponding to pbase = pair = 0 bar) shifted by pbase. However, the reason forthe instantaneous wetting transition is the near infinite air volume added to theretained air layer by the connected inner pressure cell. Before perforation, in-creased water pressure compressed the retained air layer, resulting in an increasedair pressure, which partially compensates the elevated hydrostatic pressure. Withthe added infinite air volume of the inner pressure cell and compressor, the down-ward shift of the air-water interface does not significantly change the volume ofthe retained air layer, and, therefore also does not change the retained air pres-sure. Thus, the retained air pressure is effectively eliminated from the balanceof forces (Eq. (2.5)), leaving the capillary pressure as sole compensating forceagainst elevated hydrostatic pressures, as described in Section 2.1.3. Therefore,once the hydrostatic pressure rises above the capillary pressure a complete wettingtransition takes place as observed in Fig. 4.8.
4.2 Dynamic Plastron Stability ofSuperhydrophobic Surfaces
4.2.1 Retained Air Layer Stability of MovingSuperhydrophobic Surfaces
In addition to high hydrostatic pressure, surfaces used for drag-reducing applica-tions are exposed to movement through liquids or flow of liquids over the surface.Immersion and movement of a superhydrophobic surface into and through a liquidresults in shear forces acting on the retained air layer, which, similar to the case ofa liquid flowing over the surface, can result in a wetting transition, and, thus, aloss of interfacial properties. Several studies have investigated the effect liquidflow has on the longevity of the retained air layer [111, 148–151], and indirectlymeasured the dynamic plastron stability by detecting failure of drag-reducingproperties [26, 136, 152]. Nonetheless, to my knowledge, no study to date hasinvestigated the effect that immersion of a superhydrophobic surface into a liquid
70
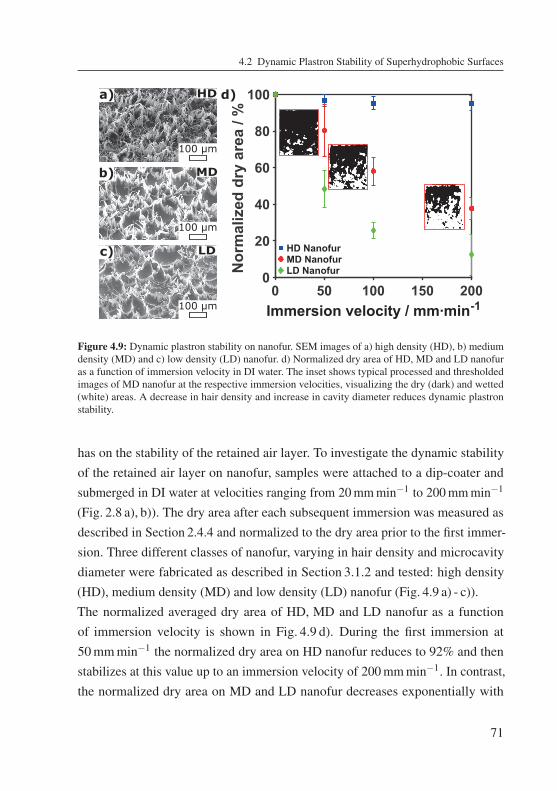
4.2 Dynamic Plastron Stability of Superhydrophobic Surfaces
0 50 100 150 2000
20
40
60
80
100
Nor
mal
ized
dry
are
a / %
MD NanofurLD Nanofur
HD Nanofur
Immersion velocity / mm min-1
100 μm
MD
100 μm
LD
100 μm
HD d)
b)
c)
a)
Figure 4.9: Dynamic plastron stability on nanofur. SEM images of a) high density (HD), b) mediumdensity (MD) and c) low density (LD) nanofur. d) Normalized dry area of HD, MD and LD nanofuras a function of immersion velocity in DI water. The inset shows typical processed and thresholdedimages of MD nanofur at the respective immersion velocities, visualizing the dry (dark) and wetted(white) areas. A decrease in hair density and increase in cavity diameter reduces dynamic plastronstability.
has on the stability of the retained air layer. To investigate the dynamic stabilityof the retained air layer on nanofur, samples were attached to a dip-coater andsubmerged in DI water at velocities ranging from 20mmmin−1 to 200mmmin−1
(Fig. 2.8 a), b)). The dry area after each subsequent immersion was measured asdescribed in Section 2.4.4 and normalized to the dry area prior to the first immer-sion. Three different classes of nanofur, varying in hair density and microcavitydiameter were fabricated as described in Section 3.1.2 and tested: high density(HD), medium density (MD) and low density (LD) nanofur (Fig. 4.9 a) - c)).The normalized averaged dry area of HD, MD and LD nanofur as a functionof immersion velocity is shown in Fig. 4.9 d). During the first immersion at50mmmin−1 the normalized dry area on HD nanofur reduces to 92% and thenstabilizes at this value up to an immersion velocity of 200mmmin−1. In contrast,the normalized dry area on MD and LD nanofur decreases exponentially with
71
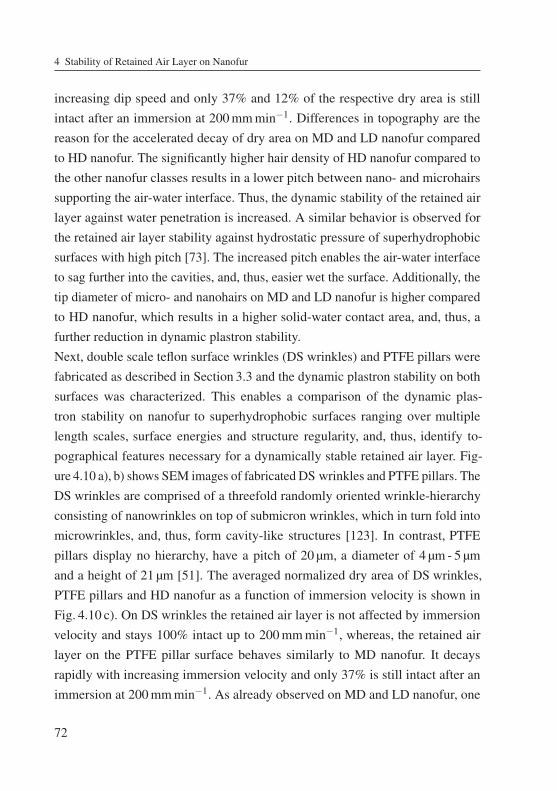
4 Stability of Retained Air Layer on Nanofur
increasing dip speed and only 37% and 12% of the respective dry area is stillintact after an immersion at 200mmmin−1. Differences in topography are thereason for the accelerated decay of dry area on MD and LD nanofur comparedto HD nanofur. The significantly higher hair density of HD nanofur compared tothe other nanofur classes results in a lower pitch between nano- and microhairssupporting the air-water interface. Thus, the dynamic stability of the retained airlayer against water penetration is increased. A similar behavior is observed forthe retained air layer stability against hydrostatic pressure of superhydrophobicsurfaces with high pitch [73]. The increased pitch enables the air-water interfaceto sag further into the cavities, and, thus, easier wet the surface. Additionally, thetip diameter of micro- and nanohairs on MD and LD nanofur is higher comparedto HD nanofur, which results in a higher solid-water contact area, and, thus, afurther reduction in dynamic plastron stability.Next, double scale teflon surface wrinkles (DS wrinkles) and PTFE pillars werefabricated as described in Section 3.3 and the dynamic plastron stability on bothsurfaces was characterized. This enables a comparison of the dynamic plas-tron stability on nanofur to superhydrophobic surfaces ranging over multiplelength scales, surface energies and structure regularity, and, thus, identify to-pographical features necessary for a dynamically stable retained air layer. Fig-ure 4.10 a), b) shows SEM images of fabricated DS wrinkles and PTFE pillars. TheDS wrinkles are comprised of a threefold randomly oriented wrinkle-hierarchyconsisting of nanowrinkles on top of submicron wrinkles, which in turn fold intomicrowrinkles, and, thus, form cavity-like structures [123]. In contrast, PTFEpillars display no hierarchy, have a pitch of 20 μm, a diameter of 4 μm - 5 μmand a height of 21 μm [51]. The averaged normalized dry area of DS wrinkles,PTFE pillars and HD nanofur as a function of immersion velocity is shown inFig. 4.10 c). On DS wrinkles the retained air layer is not affected by immersionvelocity and stays 100% intact up to 200mmmin−1, whereas, the retained airlayer on the PTFE pillar surface behaves similarly to MD nanofur. It decaysrapidly with increasing immersion velocity and only 37% is still intact after animmersion at 200mmmin−1. As already observed on MD and LD nanofur, one
72
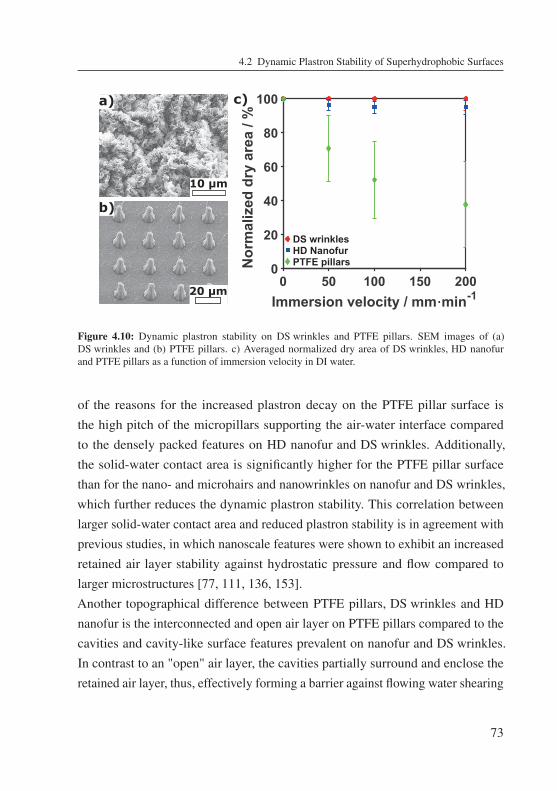
4.2 Dynamic Plastron Stability of Superhydrophobic Surfaces
0 50 100 150 200Immersion velocity / mm·min-1
0
20
40
60
80
100
Nor
mal
ized
dry
are
a / %
DS wrinklesHD NanofurPTFE pillars
c)
20 μm
10 μm
a)
b)
Figure 4.10: Dynamic plastron stability on DS wrinkles and PTFE pillars. SEM images of (a)DS wrinkles and (b) PTFE pillars. c) Averaged normalized dry area of DS wrinkles, HD nanofurand PTFE pillars as a function of immersion velocity in DI water.
of the reasons for the increased plastron decay on the PTFE pillar surface isthe high pitch of the micropillars supporting the air-water interface comparedto the densely packed features on HD nanofur and DS wrinkles. Additionally,the solid-water contact area is significantly higher for the PTFE pillar surfacethan for the nano- and microhairs and nanowrinkles on nanofur and DS wrinkles,which further reduces the dynamic plastron stability. This correlation betweenlarger solid-water contact area and reduced plastron stability is in agreement withprevious studies, in which nanoscale features were shown to exhibit an increasedretained air layer stability against hydrostatic pressure and flow compared tolarger microstructures [77, 111, 136, 153].Another topographical difference between PTFE pillars, DS wrinkles and HDnanofur is the interconnected and open air layer on PTFE pillars compared to thecavities and cavity-like surface features prevalent on nanofur and DS wrinkles.In contrast to an "open" air layer, the cavities partially surround and enclose theretained air layer, thus, effectively forming a barrier against flowing water shearing
73
4 Stability of Retained Air Layer on Nanofur
of the air layer, and, as a result making the retained air layer less susceptible tomovement. Moreover, the higher surface energy of PC nanofur in comparison toPTFE, possibly results in pinning of the air-water interface at the tips of the nano-and microhairs, further increasing stability of the retained air layer compared tothe hydrophobic PTFE pillars. On the highly hydrophobic DS wrinkles the lackof pinning apexes is compensated by the nanometer scale feature size, threefoldhierarchy and prevalent reentrant structures. The stability enhancing propertiesof hydrophilic apexes are in agreement with the results from Section 4.1.1 andobservations on the water fern Salvinia molesta, on which a combination of waxcoated superhydrophobic hairs and hydrophilic hair tips was shown to significantlyincrease the stability of the retained air layer [2]. Finally, DS wrinkles and HDnanofur are comprised of a hierarchical topography, which was shown to enhancesuperhydrophobicity and stability of the retained air layer against hydrostaticpressure, and, therefore, most likely further enhances the dynamic stability of theretained air layer on these surfaces, while the lack of hierarchy on PTFE pillarsdiminishes its dynamic plastron stability.In summary, the dynamic stability measurements identify the following set oftopographical features as necessary to achieve a high dynamic plastron stabil-ity: (i) hierarchical topography; (ii) high density surface features; (iii) mini-mal water-solid-contact area; (iv) nanoscale feature size; and (v) cavities orcavity-like structures.
4.2.2 Contact Line Motion and Dynamic Wetting Behavior
As mentioned before, application of superhydrophobic surfaces, especially inthe case of drag reduction, usually exposes them to flow or movement throughliquids, rather than static conditions. Even though dynamic behavior is essentialfor applications and studies have shown great variations between static (sessiledrop technique) and dynamic (contact line motion) wetting behavior [108, 154–157], only static measurements are typically employed to characterize the wettingbehavior of superhydrophobic surfaces. Therefore, application oriented charac-
74
4.2 Dynamic Plastron Stability of Superhydrophobic Surfaces
terization of wetting properties needs to include dynamic wetting behavior. Thedynamic wetting behavior of HD nanofur, DS wrinkles and PTFE pillars wasmeasured using a newly developed contact line motion technique described inSection 2.4.3 with an immersion velocity of 50mmmin−1. Table 4.2 compares thestatic (sessile drop technique) and dynamic (contact line motion) wetting behaviorof air retaining areas on all three used superhydrophobic surfaces. For the dy-namic CA only surface areas with an intact air layer were included. Measurementswith the sessile drop technique show almost no difference between DS wrinklesand PTFE pillars, with advancing and receding CAs of 172± 2◦ and 170± 2◦for DS wrinkles [123] and 174±5◦ and 170±7◦ for PTFE pillars. HD nanofurhas a slightly lower advancing and receding CA of 164±3◦ and 159±5◦. How-ever, from the sessile drop technique no conclusions about the dynamic plastronstability can be drawn. Contact line motion on the other hand, shows DS wrinklesand HD nanofur to have an intact air layer with homogenous superhydrophobicwetting behavior for the complete structured area, whereas the PTFE pillar surfacedisplays wetting transitions on part of the structured area, indicating a reduceddynamic plastron stability. Therefore, in contrast to the sessile drop technique, thein-situ contact line motion measurement can reveal differences in the dynamicplastron stability of the various surfaces.HD nanofur displays the smallest difference (≈ 5◦) between static and dynamicwetting behavior for both advancing and receding CA. Moreover, in contrast tothe other surfaces, the dynamic advancing and receding CA of HD nanofur isabove 150◦, resulting in a minimal CAH. In contrast, the difference betweenstatic and dynamic wetting behavior for DS wrinkles and PTFE pillars is 20◦
for the advancing CA and 30◦ for the receding CA. This not only results in adrop in CA below 150◦ but also a tripling in CAH compared to the static wettingproperties. This large difference in dynamic CAH between nanofur, DS wrinklesand PTFE pillars is surprising, as the static measurements show minimal CAHfor all three surfaces. However, previous studies have shown that such a de-crease in dynamic CA and increase in CAH indicates a reduced slip length [156,158, 159]. Because slip length increases with (i) increasing plastron volume and
75
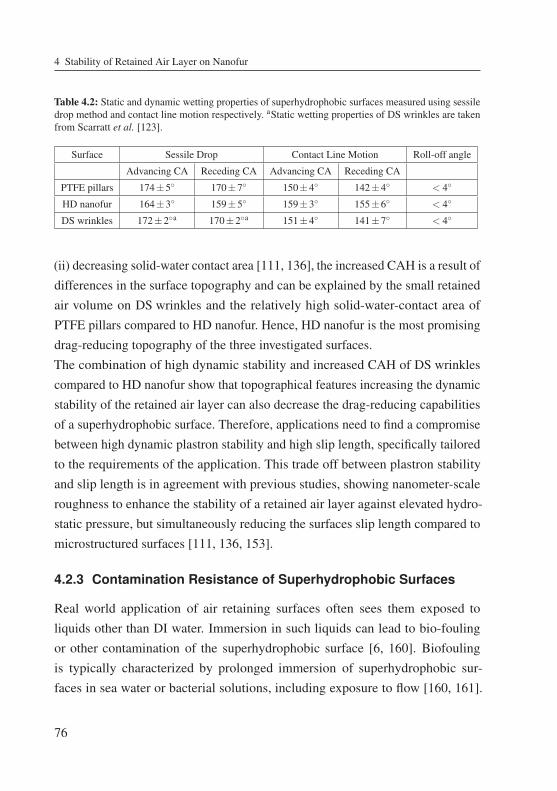
4 Stability of Retained Air Layer on Nanofur
Table 4.2: Static and dynamic wetting properties of superhydrophobic surfaces measured using sessiledrop method and contact line motion respectively. aStatic wetting properties of DS wrinkles are takenfrom Scarratt et al. [123].
Surface Sessile Drop Contact Line Motion Roll-off angle
Advancing CA Receding CA Advancing CA Receding CA
PTFE pillars 174±5◦ 170±7◦ 150±4◦ 142±4◦ < 4◦
HD nanofur 164±3◦ 159±5◦ 159±3◦ 155±6◦ < 4◦
DS wrinkles 172±2◦a 170±2◦a 151±4◦ 141±7◦ < 4◦
(ii) decreasing solid-water contact area [111, 136], the increased CAH is a result ofdifferences in the surface topography and can be explained by the small retainedair volume on DS wrinkles and the relatively high solid-water-contact area ofPTFE pillars compared to HD nanofur. Hence, HD nanofur is the most promisingdrag-reducing topography of the three investigated surfaces.The combination of high dynamic stability and increased CAH of DS wrinklescompared to HD nanofur show that topographical features increasing the dynamicstability of the retained air layer can also decrease the drag-reducing capabilitiesof a superhydrophobic surface. Therefore, applications need to find a compromisebetween high dynamic plastron stability and high slip length, specifically tailoredto the requirements of the application. This trade off between plastron stabilityand slip length is in agreement with previous studies, showing nanometer-scaleroughness to enhance the stability of a retained air layer against elevated hydro-static pressure, but simultaneously reducing the surfaces slip length compared tomicrostructured surfaces [111, 136, 153].
4.2.3 Contamination Resistance of Superhydrophobic Surfaces
Real world application of air retaining surfaces often sees them exposed toliquids other than DI water. Immersion in such liquids can lead to bio-foulingor other contamination of the superhydrophobic surface [6, 160]. Biofoulingis typically characterized by prolonged immersion of superhydrophobic sur-faces in sea water or bacterial solutions, including exposure to flow [160, 161].
76
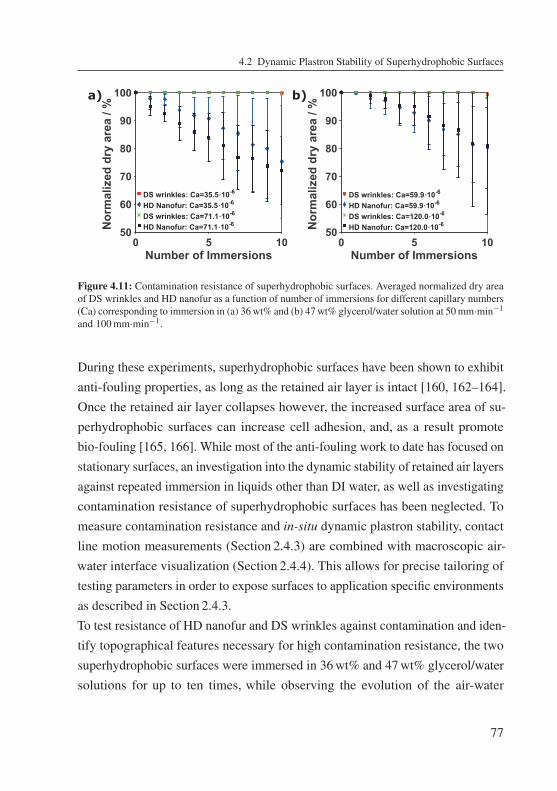
4.2 Dynamic Plastron Stability of Superhydrophobic Surfaces
0 5 10Number of Immersions
50
60
70
80
90
100N
orm
aliz
ed d
ry a
rea
/ %
DS wrinkles: Ca=35.5·10-6
HD Nanofur: Ca=35.5·10-6
DS wrinkles: Ca=71.1·10-6
HD Nanofur: Ca=71.1·10-6
0 5 10Number of Immersions
50
60
70
80
90
100
Nor
mal
ized
dry
are
a / %
DS wrinkles: Ca=59.9·10-6
HD Nanofur: Ca=59.9·10-6
DS wrinkles: Ca=120.0·10-6
HD Nanofur: Ca=120.0·10-6
a) b)
Figure 4.11: Contamination resistance of superhydrophobic surfaces. Averaged normalized dry areaof DS wrinkles and HD nanofur as a function of number of immersions for different capillary numbers(Ca) corresponding to immersion in (a) 36wt% and (b) 47wt% glycerol/water solution at 50mm·min−1and 100mm·min−1.
During these experiments, superhydrophobic surfaces have been shown to exhibitanti-fouling properties, as long as the retained air layer is intact [160, 162–164].Once the retained air layer collapses however, the increased surface area of su-perhydrophobic surfaces can increase cell adhesion, and, as a result promotebio-fouling [165, 166]. While most of the anti-fouling work to date has focused onstationary surfaces, an investigation into the dynamic stability of retained air layersagainst repeated immersion in liquids other than DI water, as well as investigatingcontamination resistance of superhydrophobic surfaces has been neglected. Tomeasure contamination resistance and in-situ dynamic plastron stability, contactline motion measurements (Section 2.4.3) are combined with macroscopic air-water interface visualization (Section 2.4.4). This allows for precise tailoring oftesting parameters in order to expose surfaces to application specific environmentsas described in Section 2.4.3.To test resistance of HD nanofur and DS wrinkles against contamination and iden-tify topographical features necessary for high contamination resistance, the twosuperhydrophobic surfaces were immersed in 36wt% and 47wt% glycerol/watersolutions for up to ten times, while observing the evolution of the air-water
77
4 Stability of Retained Air Layer on Nanofur
interface. Figure 4.11 shows the average normalized dry area of DS wrinklesand HD nanofur as a function of number of immersions and capillary number(Ca). For all Ca the repeated immersion of HD nanofur results in a decay of theretained air layer, whereas the retained air layer on DS wrinkles stays 100% intact.Moreover, the decrease in dry area on HD nanofur, and thus contamination ofthe surface, increases with increasing immersion velocity. The dependency ofplastron decay on immersion velocity is in agreement with observations on sur-faces immersed in water (Fig. 4.9, Fig. 4.10), where increased immersion velocityalso resulted in increased plastron decay. However, in contrast to immersion inglycerol, repeated immersion in DI water with a constant immersion velocity didnot result in a further decrease of dry area. Surprisingly, an increase in glycerolconcentration did not affect the decay rate of the retained air layer on HD nanofuras shown in Fig. 4.11 b).To investigate if surface contamination is time dependent, HD nanofur wasimmersed in both prepared glycerol solutions for 24 hours. Comparison of the dryarea before and after immersion revealed no significant differences, showing thatcontamination is not time dependent. Hence, contamination is a dynamic effectand occurs during immersion or movement of the sample. During immersion, thehigh repellency of the surface results in a continuously increasing curvature ofthe air-liquid interface, until the dynamic advancing CA is reached. The increasein curvature results in a constantly increasing Laplace pressure, which couldbe responsible for the observed wetting transition. An increase in immersionvelocity additionally results in a faster increase in Laplace pressure, which, in turndestabilizes the retained air layer. Combined with the higher shear forces acting onthe retained air layer with increasing immersion velocity, this results in a velocitydependent plastron decay rate. The contamination of nanofur was permanent andthe films could not be cleaned by prolonged immersion in DI water or ethanol,or sonication in ethanol.As mentioned before, the retained air layer on DS wrinkles is 100% intact for allCa, thus, indicating a superior contamination resistance compared to HD nanofur(Fig. 4.11). This superior resistance is the result of several topographical features
78
4.2 Dynamic Plastron Stability of Superhydrophobic Surfaces
prevalent on DS wrinkles and missing on HD nanofur: (i) smaller length scaleof topographical features (nm); (ii) threefold hierarchy ranging from nanometersto micrometers instead of double hierarchy of microcavities and nanohairs onnanofur; (iii) low surface energy resulting in minimal adhesion; (iv) microwrinklesforming reentrant structures. Comparing these resistance boosting features withthe dynamic stability enhancing features from Section 4.2.1, reveals that the sametopographical features responsible for high dynamic plastron stability are alsoresponsible for a high contamination resistance.
4.2.4 Directionality of Dynamic Wetting Transitions
To investigate how wetting transitions spread on superhydrophobic surfaces, thedynamic CA of MD nanofur was measured as a function of immersion depth forrepeated immersion in a 30wt% sucrose/water solution at 20mmmin−1 as shownin Fig. 4.12 a), b). During the first immersion, the receding CA shows almost nochange across the complete sample surface. However, after repeated immersions,the receding CA decreases linearly towards the lower end of the nanofur substrate.This linear decay becomes more pronounced with increasing immersion repetitionand finally leads to a completely wetted and contaminated lower surface areaafter ten immersions, as shown in Fig. 4.12 a). The gradual decrease of recedingCA with increasing number of immersions, indicates that a superhydrophobicsurface passes through several intermediate states between intact air layer andcompletely contaminated hydrophilic surface, which is in contrast with the ex-pected two distinct wetting states. Moreover, the change in wetting behavior isnot as pronounced in the dynamic advancing CA as it is in the dynamic recedingCA, as shown in Fig. 4.12 b). Repeated immersion of MD nanofur results in alower mean value and higher scattering of the advancing CA, but does not dis-play the same linear trend as can be observed for the receding CA. The reasonfor this is most likely the lower susceptibility of the advancing CA in regard topinning of the liquid on the surface.
79
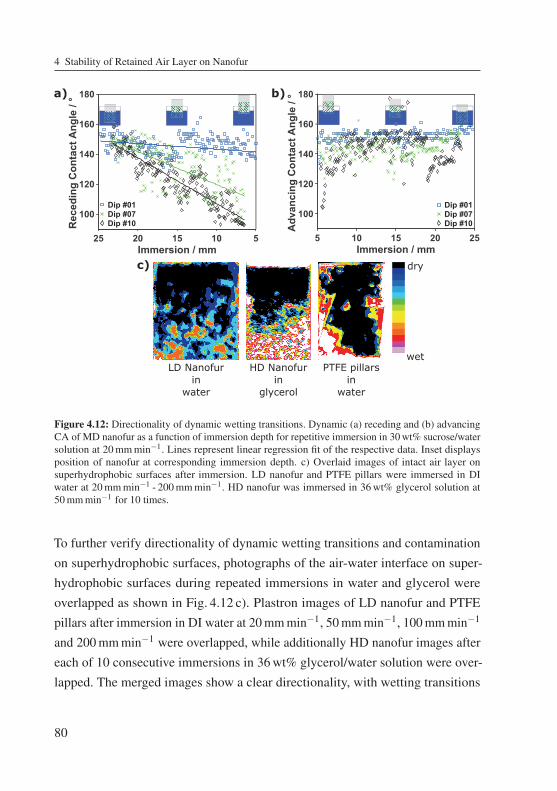
4 Stability of Retained Air Layer on Nanofur
a)
510152025Immersion / mm
100
120
140
160
180
Rec
edin
g C
onta
ct A
ngle
/ °
Dip #01Dip #07Dip #10
5 10 15 20 25Immersion / mm
100
120
140
160
180
Adv
anci
ng C
onta
ct A
ngle
/ °
Dip #07Dip #10
Dip #01
b)
LD Nanofurin
water
HD Nanofurin
glycerol
PTFE pillarsin
water
dry
wet
c)
Figure 4.12: Directionality of dynamic wetting transitions. Dynamic (a) receding and (b) advancingCA of MD nanofur as a function of immersion depth for repetitive immersion in 30wt% sucrose/watersolution at 20mmmin−1. Lines represent linear regression fit of the respective data. Inset displaysposition of nanofur at corresponding immersion depth. c) Overlaid images of intact air layer onsuperhydrophobic surfaces after immersion. LD nanofur and PTFE pillars were immersed in DIwater at 20mmmin−1 - 200mmmin−1. HD nanofur was immersed in 36wt% glycerol solution at50mmmin−1 for 10 times.
To further verify directionality of dynamic wetting transitions and contaminationon superhydrophobic surfaces, photographs of the air-water interface on super-hydrophobic surfaces during repeated immersions in water and glycerol wereoverlapped as shown in Fig. 4.12 c). Plastron images of LD nanofur and PTFEpillars after immersion in DI water at 20mmmin−1, 50mmmin−1, 100mmmin−1
and 200mmmin−1 were overlapped, while additionally HD nanofur images aftereach of 10 consecutive immersions in 36wt% glycerol/water solution were over-lapped. The merged images show a clear directionality, with wetting transitions
80
4.3 Conclusion
starting at the lower end of the superhydrophobic surface and then spreadingupwards. This is in agreement with the receding CA measurements shown inFig. 4.12 a). The directionality is possibly due to the build up of the contact lineduring immersion in the liquid. During immersion, the superhydrophobic surface’shigh repellency results in a liquid curvature that is constantly increasing until theadvanced dynamic CA is reached. This increase in curvature is equivalent toan increase in Laplace pressure, and combined with shear forces acting on themoving air-liquid-interface can push the liquid into the topography, resulting in awetting transition. Because the liquid curvature changes the fastest at the edge ofthe superhydrophobic surface, this area also experiences the largest increase inLaplace pressure. Thus, the edge of the superhydrophobic film is the likeliest spotfor a wetting transition to occur. Once a wetting transition/contamination occursat the edge of the film, it moves the superhydrophobic/hydrophilic border upwardsonto the structured area, where the same phenomenon is repeated, resulting in agradual progression of the wetting transition upwards along the surface. Lastly,Fig. 4.12 c) shows that wetting transitions do not start in random spots, but ratherspread outwards from already wetted areas. Once a wetting transition occured, thewetted area gradually spreads outward into all directions. As a result, the overalldynamic plastron stability is limited by the area with the weakest resistance againsta wetting transition.
4.3 Conclusion
In conclusion, static and dynamic wetting transitions of bioinspired superhydropho-bic nanofur and other selected superhydrophobic surfaces were characterized andthe effect of surface energy and varying topographical features on the retainedair layer stability was investigated. In case of elevated hydrostatic pressure, acombination of slightly hydrophilic material and superhydrophobic surface topog-raphy was shown to exhibit a higher plastron stability than the same topographywith highly hydrophobic/hydrophilic bulk wetting properties. Utilizing the highreflectivitiy of the air-water interface, the macroscopic stability of the retained air
81
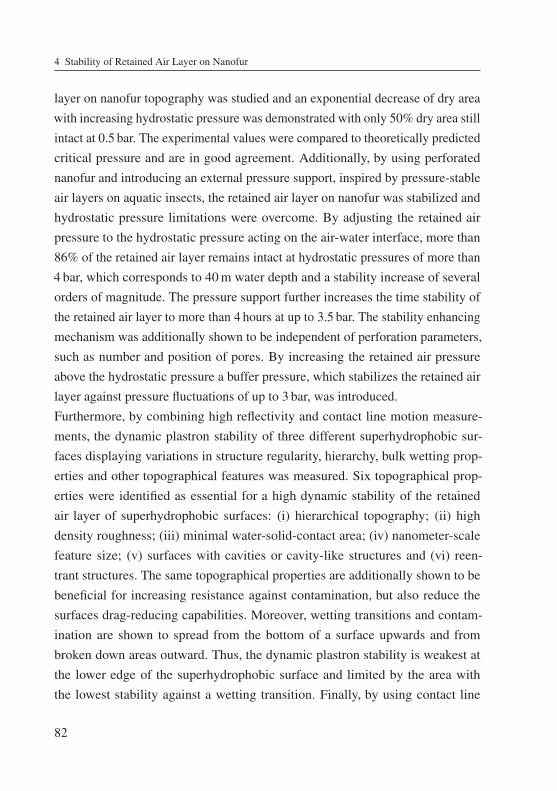
4 Stability of Retained Air Layer on Nanofur
layer on nanofur topography was studied and an exponential decrease of dry areawith increasing hydrostatic pressure was demonstrated with only 50% dry area stillintact at 0.5 bar. The experimental values were compared to theoretically predictedcritical pressure and are in good agreement. Additionally, by using perforatednanofur and introducing an external pressure support, inspired by pressure-stableair layers on aquatic insects, the retained air layer on nanofur was stabilized andhydrostatic pressure limitations were overcome. By adjusting the retained airpressure to the hydrostatic pressure acting on the air-water interface, more than86% of the retained air layer remains intact at hydrostatic pressures of more than4 bar, which corresponds to 40m water depth and a stability increase of severalorders of magnitude. The pressure support further increases the time stability ofthe retained air layer to more than 4 hours at up to 3.5 bar. The stability enhancingmechanism was additionally shown to be independent of perforation parameters,such as number and position of pores. By increasing the retained air pressureabove the hydrostatic pressure a buffer pressure, which stabilizes the retained airlayer against pressure fluctuations of up to 3 bar, was introduced.Furthermore, by combining high reflectivity and contact line motion measure-ments, the dynamic plastron stability of three different superhydrophobic sur-faces displaying variations in structure regularity, hierarchy, bulk wetting prop-erties and other topographical features was measured. Six topographical prop-erties were identified as essential for a high dynamic stability of the retainedair layer of superhydrophobic surfaces: (i) hierarchical topography; (ii) highdensity roughness; (iii) minimal water-solid-contact area; (iv) nanometer-scalefeature size; (v) surfaces with cavities or cavity-like structures and (vi) reen-trant structures. The same topographical properties are additionally shown to bebeneficial for increasing resistance against contamination, but also reduce thesurfaces drag-reducing capabilities. Moreover, wetting transitions and contam-ination are shown to spread from the bottom of a surface upwards and frombroken down areas outward. Thus, the dynamic plastron stability is weakest atthe lower edge of the superhydrophobic surface and limited by the area withthe lowest stability against a wetting transition. Finally, by using contact line
82
4.3 Conclusion
motion measurements, surface contamination and the decay of wetting propertieswas shown to be a gradual process.Because dynamic environments have mainly been ignored in respect to retainedair layer stability but are essential for drag-reducing applications, further inves-tigation into stability enhancing parameters can provide a basis for fabricatinghighly stable air retaining surfaces. Especially the ease and low complexity of theused measurements addresses the lack of appropriate characterization techniques.Additionally, the versatile possibilities to implement the presented stability enhanc-ing mechanisms into other superhydrophobic surfaces widen the applicability ofair-retaining surfaces for drag reduction. Lastly, characterisation of drag-reducingcapabilities of pressure-supported perforated nanofur and adaptation of the sta-bilization mechanism to other drag-reducing mechanisms are promising futurestudies.
A shortened version of the retained air layer stability measurements on as prepared
thin nanofur (Section 4.1.2) was published as part of the article "Bioinspired Air-
Retaining Nanofur for Drag Reduction", Maryna N. Kavalenka, Felix Vüllers,
Simone Lischker, Claudia Zeiger, Andreas Hopf, Michael Röhrig, Bastian E. Rapp,
Matthias Worgull, and Hendrik Hölscher, ACS Applied Materials and Interfaces,
2015, 7, 10651-10655.
A shortened version of the laser confocal microscope study and the study of
pressure supported perforated nanofur (Sections 4.1.1,4.1.3-4.1.4) was published
in "Pressure-Stable Air-Retaining Nanostructured Surfaces Inspired by Natural
Air Plastrons", Felix Vüllers, Yann Germain, Luce-Marie Petit, Hendrik Hölscher
and Maryna N. Kavalenka, Advanced Materials Interfaces, 2018, 5, 1800125-
1800132
The investigation into dynamic plastron stability (Section 4.2) will be published as
"Dynamic Wetting Behavior and Plastron Stability on Superhydrophobic Surfaces",
Felix Vüllers, Sam Peppou-Chapman, Maryna N. Kavalenka, Hendrik Hölscher
and Chiara Neto
83

5 Superhydrophobic Surfaces forOptoelectronic Applications
Accumulation of natural and anthropogenic contamination on photovoltaic (PV)modules poses an immense problem, as it drastically decreases in-coupling oflight into the active medium of the PV module, and, thus, decreases efficiency byup to 50% [34, 37, 39, 40]. Active cleaning mechanisms would mitigate thoseeffects, but also result in a significant increase in operational costs [34–38, 41]. Incontrast, minimal adhesion of particulate matter on superhydrophobic surfaces andthe resulting self-cleaning properties present a long term passive solution, whichdrastically decreases maintenance costs. If additionally coupled with high trans-mission or anti-reflective behavior, the coatings can even increase the efficiency ofoptoelectronic devices, thus, making transparent superhydrophobic surfaces oneof the most promising solutions for soiling [34]. Superhydrophobic thin nanofuris inspired by the dense layer of transparent microhairs present on the leaves ofSalvinia cucullata and Pistia stratiotes (Fig. 3.3, Section 3.1.2), which renders theleaves superhydrophobic without impairing the absorption of light necessary forphotosynthesis and the plants survival [167].The first part of this chapter (Section 5.1) investigates the application of thinnanofur on optoelectronic devices. First the self-cleaning properties of thin nanofurare tested in Section 5.1.1, before its optical properties are characterized in Sec-tion 5.1.2, and its effect on the efficiency of optoelectronic devices is studied inSection 5.1.3. In the second part of the chapter (Section 5.2) a microcavity arraybased on nanofur topography and transferred to a PV relevant polymer (FEP)in order to fulfill application specific material constraints, is investigated as anefficiency enhancing, self-cleaning coating for PV modules.
85
5 Superhydrophobic Surfaces for Optoelectronic Applications
5.1 Nanofur Application on Optoelectronic Devices
To reduce soiling and consequently efficiency losses of optoelectronic devices,surface coatings combining superhydrophobicity, self-cleaning properties and highoptical transmission are necessary. To achieve this, thin nanofur was fabricated asdescribed in Section 3.1.2 and classified as superhydrohobic through its extremewetting properties (Section 3.4.1). Furthermore, thin nanofur is highly flexible,and, thus, can be applied to any surface geometry, making it widely applicable inlight managing applications.
5.1.1 Self-Cleaning Properties of Nanofur
Most superhydrophobic nano- and microstructured surfaces exhibit self-cleaningproperties known as "Lotus-Effect" [1, 11, 41, 168]. Because of the superhy-drophobicity, water droplets roll down these structured surfaces at small tilt angles,pick up any contaminants they come in contact with, and, thus, clean the surfacein the process. This self-cleaning behavior stems from the high roughness of thenano- and microstructured surface, which minimizes the contact area betweencontaminant and solid substrate (Fig. 5.1 b). The minimal contact area results inan adhesion between contaminant and substrate that is lower than the adhesionbetween water and contaminant, allowing the droplet to pick up the particle andcarry it off [1, 168, 169]. On an unstructured surface, the greater contact area, and,thus, higher adhesion between contaminant and substrate results in water dropletscreeping down the surface and simply rearranging the contaminants as shown inFig. 5.1 a) or sticking to the surface until they evaporate [170].Self-cleaning properties of thin nanofur were tested by contaminating unstruc-tured PC as well as thin nanofur with graphite powder (particle size: 30 μm to900 μm) and positioning the surfaces on a glass slide tilted at 30◦, before dispens-ing single consecutive water droplets on both surfaces. On unstructured PC thewater droplets stick to the surface without exhibiting any self-cleaning properties,whereas they roll down the thin nanofur film, picking up the graphite particles andcleaning the surface in the process (Fig. 5.1 c). To test a wide range of contaminant
86
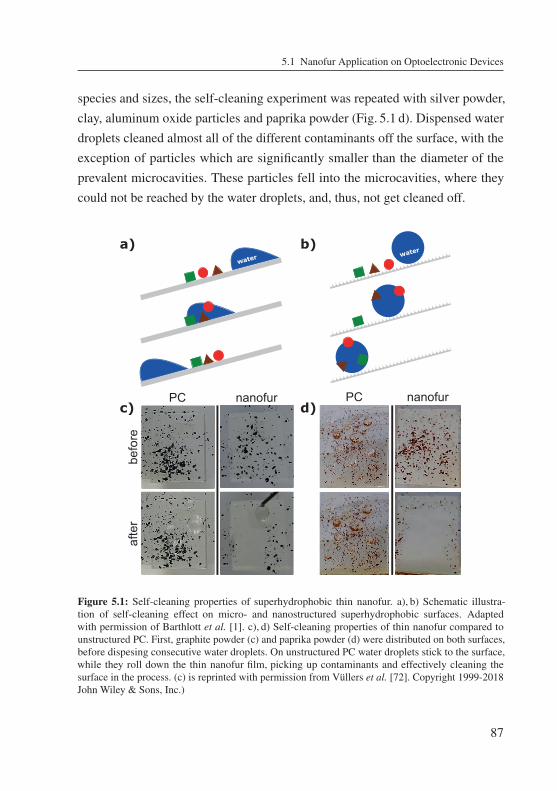
5.1 Nanofur Application on Optoelectronic Devices
species and sizes, the self-cleaning experiment was repeated with silver powder,clay, aluminum oxide particles and paprika powder (Fig. 5.1 d). Dispensed waterdroplets cleaned almost all of the different contaminants off the surface, with theexception of particles which are significantly smaller than the diameter of theprevalent microcavities. These particles fell into the microcavities, where theycould not be reached by the water droplets, and, thus, not get cleaned off.
before
PC nanofur
after
PC nanofurc) d)
water
water
a) b)
Figure 5.1: Self-cleaning properties of superhydrophobic thin nanofur. a), b) Schematic illustra-tion of self-cleaning effect on micro- and nanostructured superhydrophobic surfaces. Adaptedwith permission of Barthlott et al. [1]. c), d) Self-cleaning properties of thin nanofur compared tounstructured PC. First, graphite powder (c) and paprika powder (d) were distributed on both surfaces,before dispesing consecutive water droplets. On unstructured PC water droplets stick to the surface,while they roll down the thin nanofur film, picking up contaminants and effectively cleaning thesurface in the process. (c) is reprinted with permission from Vüllers et al. [72]. Copyright 1999-2018John Wiley & Sons, Inc.)
87
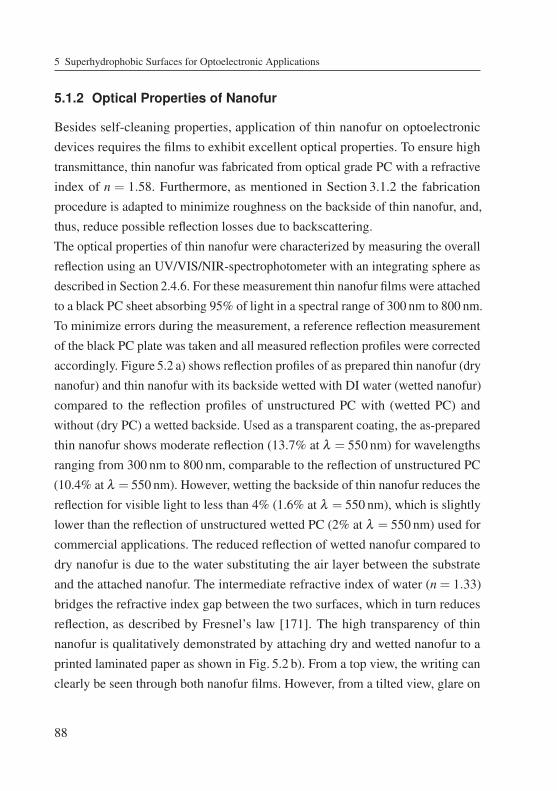
5 Superhydrophobic Surfaces for Optoelectronic Applications
5.1.2 Optical Properties of Nanofur
Besides self-cleaning properties, application of thin nanofur on optoelectronicdevices requires the films to exhibit excellent optical properties. To ensure hightransmittance, thin nanofur was fabricated from optical grade PC with a refractiveindex of n = 1.58. Furthermore, as mentioned in Section 3.1.2 the fabricationprocedure is adapted to minimize roughness on the backside of thin nanofur, and,thus, reduce possible reflection losses due to backscattering.The optical properties of thin nanofur were characterized by measuring the overallreflection using an UV/VIS/NIR-spectrophotometer with an integrating sphere asdescribed in Section 2.4.6. For these measurement thin nanofur films were attachedto a black PC sheet absorbing 95% of light in a spectral range of 300 nm to 800 nm.To minimize errors during the measurement, a reference reflection measurementof the black PC plate was taken and all measured reflection profiles were correctedaccordingly. Figure 5.2 a) shows reflection profiles of as prepared thin nanofur (drynanofur) and thin nanofur with its backside wetted with DI water (wetted nanofur)compared to the reflection profiles of unstructured PC with (wetted PC) andwithout (dry PC) a wetted backside. Used as a transparent coating, the as-preparedthin nanofur shows moderate reflection (13.7% at λ = 550 nm) for wavelengthsranging from 300 nm to 800 nm, comparable to the reflection of unstructured PC(10.4% at λ = 550 nm). However, wetting the backside of thin nanofur reduces thereflection for visible light to less than 4% (1.6% at λ = 550 nm), which is slightlylower than the reflection of unstructured wetted PC (2% at λ = 550 nm) used forcommercial applications. The reduced reflection of wetted nanofur compared todry nanofur is due to the water substituting the air layer between the substrateand the attached nanofur. The intermediate refractive index of water (n = 1.33)bridges the refractive index gap between the two surfaces, which in turn reducesreflection, as described by Fresnel’s law [171]. The high transparency of thinnanofur is qualitatively demonstrated by attaching dry and wetted nanofur to aprinted laminated paper as shown in Fig. 5.2 b). From a top view, the writing canclearly be seen through both nanofur films. However, from a tilted view, glare on
88
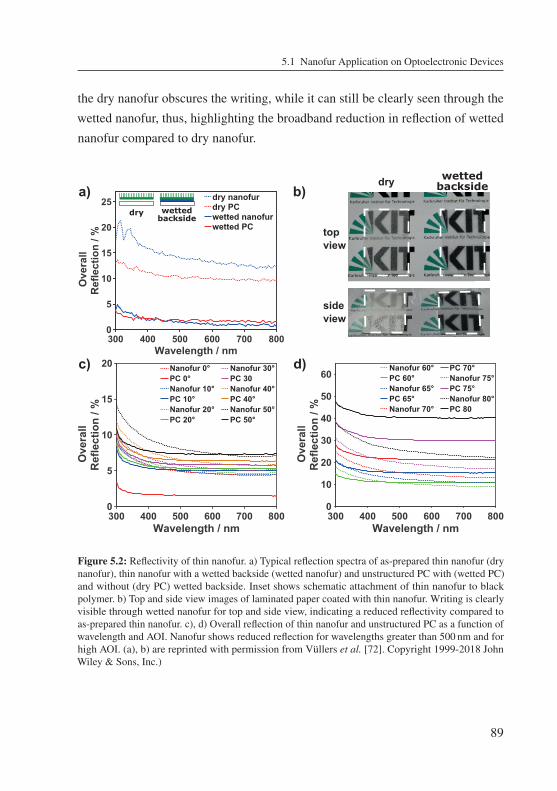
5.1 Nanofur Application on Optoelectronic Devices
the dry nanofur obscures the writing, while it can still be clearly seen through thewetted nanofur, thus, highlighting the broadband reduction in reflection of wettednanofur compared to dry nanofur.
300 400 500 600 700 800Wavelength / nm
0
5
10
15
20
Ove
rall
Ref
lect
ion
/ %
Nanofur 0°PC 0°Nanofur 10°PC 10°Nanofur 20°PC 20°
Nanofur 30°PC 30Nanofur 40°PC 40°Nanofur 50°PC 50°
300 400 500 600 700 800Wavelength / nm
0
10
20
30
40
50
60
Ove
rall
Ref
lect
ion
/ %
Nanofur 60°PC 60°Nanofur 65°PC 65°Nanofur 70°
PC 70°Nanofur 75°PC 75°Nanofur 80°PC 80
300 400 500 600 700 800Wavelength / nm
0
5
10
15
20
25
Ove
rall
Ref
lect
ion
/ %
dry nanofurdry PCwetted nanofurwetted PC
a) b)
d)c)
wettedbackside
dry
dry
topview
sideview
wettedbackside
Figure 5.2: Reflectivity of thin nanofur. a) Typical reflection spectra of as-prepared thin nanofur (drynanofur), thin nanofur with a wetted backside (wetted nanofur) and unstructured PC with (wetted PC)and without (dry PC) wetted backside. Inset shows schematic attachment of thin nanofur to blackpolymer. b) Top and side view images of laminated paper coated with thin nanofur. Writing is clearlyvisible through wetted nanofur for top and side view, indicating a reduced reflectivity compared toas-prepared thin nanofur. c), d) Overall reflection of thin nanofur and unstructured PC as a function ofwavelength and AOI. Nanofur shows reduced reflection for wavelengths greater than 500 nm and forhigh AOI. (a), b) are reprinted with permission from Vüllers et al. [72]. Copyright 1999-2018 JohnWiley & Sons, Inc.)
89
5 Superhydrophobic Surfaces for Optoelectronic Applications
300 400 500 600 700 800Wavelength / nm
0
20
40
60
80
100
Ove
rall
Tran
smis
sion
/ %
400 600 800Wavelength / nm
0
1
2
3
4Sp
ecul
arTr
ansm
issi
on /
%
dry nanofurwetted nanofur
d=1cm
d=5cm d=10cm
dLaser
Nanofur
Screenb)a)
dry nanofurwetted nanofur
Figure 5.3: Transmission of thin nanofur. a) Overall transmission spectra of as-prepared self stand-ing thin nanofur film (dry nanofur) and thin nanofur film attached to glass slide by water (wettednanofur). The inset shows the respective specular transmissions. b) Light of a laser pointer trans-mitted through thin nanofur and observed in varying nanofur-screen distances (d). Widening of thebeam and the low specular transmission demonstrate the high forward scattering properties of thinnanofur topography. (a) is reprinted with permission from Vüllers et al. [72]. Copyright 1999-2018John Wiley & Sons, Inc.)
Additionally, the angle resolved overall reflectivity of thin nanofur from a normalangle of incidence (AOI) of 0◦ to a glancing AOI of 80◦ is compared to that ofunstructured PC in Fig. 5.2 c), d). For low AOI, nanofur and unstructured PC showsimilar reflectivity, with PC having lower reflection values for shorter wavelengths(< 500 nm) (Fig. 5.2 c). Surprisingly, with increasing AOI, the nanofur reflectivityfirst increases faster than that of unstructured PC up to 50◦ tilt, where the contrastbetween thin nanofur and PC is minimal for high wavelengths and maximum forlow wavelengths. For AOI> 50◦ nanofur then significantly reduces the reflectionto almost half the value of unstructured PC (for high wavelengths), making it mostvaluable for optoelectronic devices installed at increased tilt angles. The reducedreflectivity of thin nanofur for wavelengths ranging from 550 nm to 750 nm foralmost all AOI is especially beneficial for PV modules, as the photon flux of thesun is highest in this spectral range, and, thus, a reduced reflectivity results in asignificant boost in efficiency.Besides attachment of thin nanofur as a transparent and self-cleaning coating, itcan also be used as a translucent self-standing superhydrophobic film with high
90
5.1 Nanofur Application on Optoelectronic Devices
transmission in the visible spectrum (300 nm to 800 nm). Figure 5.3 a) shows thetypical transmission spectra of a self-standing thin nanofur film and a thin nanofurfilm with wetted backside attached to a glass slide. More than 88% of light incidingon the dry nanofur is transmitted through the film, while wetting the backside of thenanofur and attaching it to a glass slide (wetted nanfour) still shows transmissionvalues above 85% for the visible spectrum. The reduced transmission of wettednanofur is due to light absorption of both water and glass [172]. Furthermore, thelow specular transmission of thin nanofur (inset of Fig. 5.3 a) indicates transmittedlight to be highly diffusive. For wavelengths ranging from 300 nm to 800 nmless than 2.8% of inciding light transmits thin nanofur without being scattered(2.6% for dry and 2.5% for wetted nanofur at 550 nm). Thus, the haze factor ofthin nanofur, defined as ratio of diffusive transmitted light to overall transmittedlight, is greater than 97% proving the high amount of forward scattering. The highforward scattering is further qualitatively demonstrated in Fig. 5.3 b) where thelight of a laser pointer transmitted through thin nanofur is observed on a whitescreen positioned at varying distances. For small nanofur-screen distances (d)the light hardly spreads on the screen. However, with increasing distance, theilluminated area widens further and further, thus, demonstrating the change ofdirection of transmitted light. High forward scattering of light stems from thenanofur surface topography consisting of microcavities surrounded by a denselayer of micro- and nanohairs. This unique surface topography randomizes thepropagation angle of transmitted light due to the random orientation of the micro-and nanohairs. In combination with the microcavities acting as microlenses, therandomized propagation results in the high amount of forward scattering, and,thus, the translucent properties of thin nanofur.
5.1.3 Application of Nanofur on Optoelectronic Devices
The exceptional optical properties of thin nanofur demonstrated in the previoussection can be exploited for light managing applications in optoelectronic devices,such as light extraction in organic light emitting diodes (OLED) or light incoupling
91
5 Superhydrophobic Surfaces for Optoelectronic Applications
in PV modules. The organic light emitting diode (OLED) and EQE measurementspresented in the following subsection were jointly carried out with Jan B. Preinfalk(Light Technology Institute (LTI), KIT) and Efthymios Klampaftis (Institute ofMicrostructure Technology (IMT), KIT).Before applying thin nanofur to an OLED as a coating, the emission profile of lighttransmitting through the thin nanofur film was measured as described by Hüniget al. [173]. Thin nanofur was attached to a glass hemisphere using refractiveindex matching liquid and illuminated with a white LED and a beam collimator.The device was then mounted on a rotational stage and the angle resolved emis-sion profile was acquired using an optical fiber mounted on a monochroma-tor. Fig. 5.4 a) shows, that the emission profile is similar to the ideal lambertianprofile. Therefore, a thin nanofur coated optical device has the same apparentbrightness independent of viewing angle, which is an essential property formost lighting applications [174].In order to investigate the effect of thin nanofur on OLED performance, thinnanofur films and unstructured PC were attached to monochromatic yellow-emitting OLEDs by dispensing the UV-curing adhesive Norland Optical Adhesive86 on the OLED and pressing the respective films backside into it. Next the adhe-sive was crosslinked with a mercury lamp (λ = 365 nm) for 30 s. A schematic ofthe tested OLED as well as a photograph of an OLED half covered with nanofuris shown in Fig. 5.4 b). Compared to the uncoated half of the OLED, attachmentof highly scattering thin nanofur widens the pixels of the OLED and seeminglyincreases the active area, and, as a result the OLED efficiency. The positive effecta thin nanofur coating has on OLED efficiency is verified by measuring the currentand power efficiency of a bare monochromatic OLED and comparing it to theefficiency of OLEDs coated with thin nanofur and coated with unstructured PC,as shown in Fig. 5.4 c), d). Attachment of thin nanofur results in a more than10% relative intensity enhancement of the coated OLED compared to a baredevice, while attachment of unstructured PC has no effect on the average intensity.Without attached nanofur, photons generated by the OLED can be trapped insidethe glass substrate due to the high contrast in refractive index resulting in total
92
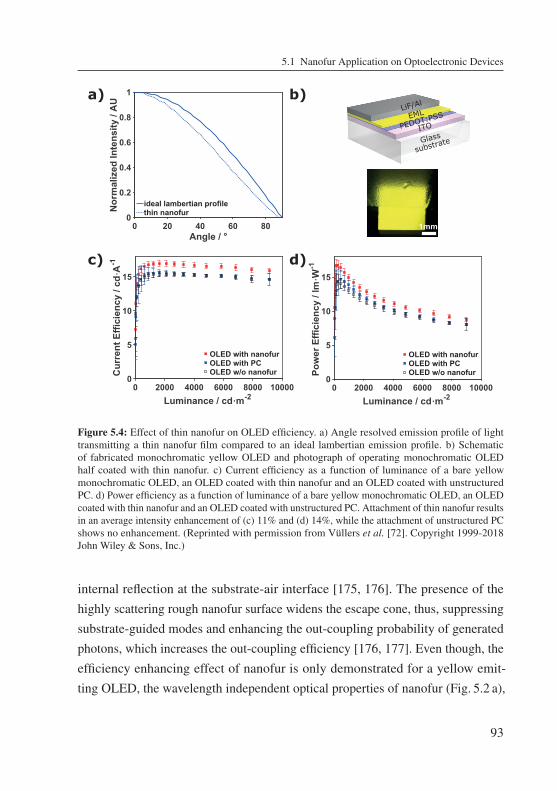
5.1 Nanofur Application on Optoelectronic Devices
0 2000 4000 6000 8000 10000Luminance / cd·m-2
0
5
10
15
Pow
er E
ffici
ency
/ lm
·W-1
OLED with nanofurOLED with PCOLED w/o nanofur
1mm
LiF/Al
EML
PEDOT:PSSITO
Glass
substrate
0 20 40 60 80Angle / °
0
0.2
0.4
0.6
0.8
1
Nor
mal
ized
Inte
nsity
/ A
U
ideal lambertian profilethin nanofur
0 2000 4000 6000 8000 10000Luminance / cd·m-2
0
5
10
15
Cur
rent
Effi
cien
cy /
cd·A
-1
OLED with nanofurOLED with PCOLED w/o nanofur
b)a)
c) d)
Figure 5.4: Effect of thin nanofur on OLED efficiency. a) Angle resolved emission profile of lighttransmitting a thin nanofur film compared to an ideal lambertian emission profile. b) Schematicof fabricated monochromatic yellow OLED and photograph of operating monochromatic OLEDhalf coated with thin nanofur. c) Current efficiency as a function of luminance of a bare yellowmonochromatic OLED, an OLED coated with thin nanofur and an OLED coated with unstructuredPC. d) Power efficiency as a function of luminance of a bare yellow monochromatic OLED, an OLEDcoated with thin nanofur and an OLED coated with unstructured PC. Attachment of thin nanofur resultsin an average intensity enhancement of (c) 11% and (d) 14%, while the attachment of unstructured PCshows no enhancement. (Reprinted with permission from Vüllers et al. [72]. Copyright 1999-2018John Wiley & Sons, Inc.)
internal reflection at the substrate-air interface [175, 176]. The presence of thehighly scattering rough nanofur surface widens the escape cone, thus, suppressingsubstrate-guided modes and enhancing the out-coupling probability of generatedphotons, which increases the out-coupling efficiency [176, 177]. Even though, theefficiency enhancing effect of nanofur is only demonstrated for a yellow emit-ting OLED, the wavelength independent optical properties of nanofur (Fig. 5.2 a),
93
5 Superhydrophobic Surfaces for Optoelectronic Applications
Fig. 5.3 a)) make the extension of these results to other emitters operating over thevisible range possible.Finally, the effect of thin nanofur on the light in-coupling properties of mc-Si solarcells was tested. To this end, the external quantum efficiency (EQE) of a bare,nanofur coated and unstructured PC coated solar cell were measured as describedin Section 2.4.7 and are displayed in Fig. 5.5 a). To account for the multicrystallinenature of the solar cell and the random and highly heterogenous topography of thethin nanofur, five different spots were measured and averaged for each displayedconfiguration. The steep drop in EQE for the solar cell with attached PC and thinnanofur in the UV spectral region is due to high absorption of the refractive indexmatching liquid used for attaching PC and nanofur to the solar cell. The respectiveshort-circuit current densitys are shown in Fig. 5.5 b) and were calculated basedon the EQE measurements and by using Eq. (2.11). Attaching thin nanofur to themc-Si solar cell resulted in a relative enhancement of 5.8% in JSC compared to thebare device. Including measurements with unstructured PC allows to distinguishbetween the improvement caused by the introduction of PC and the improvementcaused by the topographical structure of thin nanofur. Introducing unstructured PCincreases the EQE throughout the whole spectral region relevant for generatingpower as shown in Fig. 5.5 a). However, for wavelengths ranging from 550 nmto 750 nm, where the photon flux of the sun is highest, the enhancement is lesspronounced, because the prevalent anti-reflective coating of the utilized solarcell has been optimized for this region. The enhancement in EQE results in anincrease of 1.1mAcm−2, which corresponds to a relative enhancement of 3.4%and is a result of PC (refractive index n = 1.58) reducing the gap in refractiveindex between air (n = 1) and the anti-reflective coating (a-SiNX:H, n ≈ 2 forλ =300 nm - 800 nm) of the solar cell. A similar effect occurs during glass encapsu-lation of PV modules for commercial use. Nonetheless, attachment of thin nanofurfurther increases the EQE for wavelengths ranging from 300 nm to 1100 nm,thus, increasing the short-circuit current density by an additional 0.8mAcm−2
(2.4%) compared to unstructured PC. As the introduction of PC is already factored
94
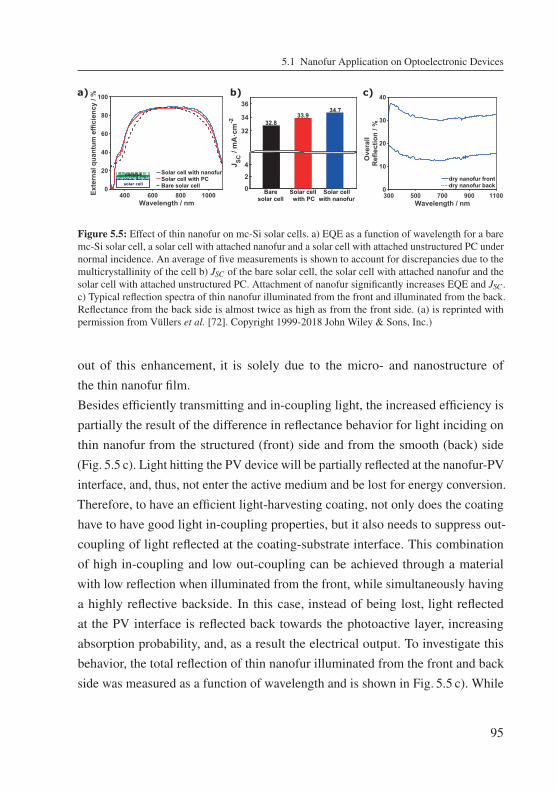
5.1 Nanofur Application on Optoelectronic Devices
400 600 800 1000Wavelength / nm
0
20
40
60
80
100Ex
tern
al q
uant
um e
ffici
ency
/ %
Solar cell with nanofurSolar cell with PCBare solar cellsolar cell
matching liquidnanofur
300 500 700 900 1100Wavelength / nm
0
10
20
30
40
Ove
rall
Ref
lect
ion
/ %
dry nanofur frontdry nanofur back
J SC/ m
A·c
m-2
0
2
4
32
34
36
32.833.9
34.7
Baresolar cell
Solar cellwith PC
Solar cellwith nanofur
a) b) c)
Figure 5.5: Effect of thin nanofur on mc-Si solar cells. a) EQE as a function of wavelength for a baremc-Si solar cell, a solar cell with attached nanofur and a solar cell with attached unstructured PC undernormal incidence. An average of five measurements is shown to account for discrepancies due to themulticrystallinity of the cell b) JSC of the bare solar cell, the solar cell with attached nanofur and thesolar cell with attached unstructured PC. Attachment of nanofur significantly increases EQE and JSC .c) Typical reflection spectra of thin nanofur illuminated from the front and illuminated from the back.Reflectance from the back side is almost twice as high as from the front side. (a) is reprinted withpermission from Vüllers et al. [72]. Copyright 1999-2018 John Wiley & Sons, Inc.)
out of this enhancement, it is solely due to the micro- and nanostructure ofthe thin nanofur film.Besides efficiently transmitting and in-coupling light, the increased efficiency ispartially the result of the difference in reflectance behavior for light inciding onthin nanofur from the structured (front) side and from the smooth (back) side(Fig. 5.5 c). Light hitting the PV device will be partially reflected at the nanofur-PVinterface, and, thus, not enter the active medium and be lost for energy conversion.Therefore, to have an efficient light-harvesting coating, not only does the coatinghave to have good light in-coupling properties, but it also needs to suppress out-coupling of light reflected at the coating-substrate interface. This combinationof high in-coupling and low out-coupling can be achieved through a materialwith low reflection when illuminated from the front, while simultaneously havinga highly reflective backside. In this case, instead of being lost, light reflectedat the PV interface is reflected back towards the photoactive layer, increasingabsorption probability, and, as a result the electrical output. To investigate thisbehavior, the total reflection of thin nanofur illuminated from the front and backside was measured as a function of wavelength and is shown in Fig. 5.5 c). While
95
5 Superhydrophobic Surfaces for Optoelectronic Applications
the reflectance from the front side is low to moderate as mentioned before, thereflectivity of the backside is twice as high over the complete PV relevant spectrum.Thus, nanofur suppresses back scattering, while simultaneously reducing frontside reflection essential for PV modules.
5.2 Self-Cleaning Microcavity Array forPhotovoltaic Modules
The previous section demonstrated the excellent optical and self-cleaning prop-erties of superhydrophobic thin nanofur. However, due to the fragile nature ofthe high aspect ratio micro- and nanohairs, thin nanofur has limited mechanicalresistance and can easily be damaged by scratching (Section 4.1.3, Fig. 4.7)[50, 51]. Moreover, even though thin nanofur is fabricated from optical gradePC, which is commonly used for optical applications [79], elongated exposure toUV-irradiation changes the polymers chemical structure, resulting in a changein color from transparent to yellow, thus, limiting its outdoor applications [178].Even though this change in chemical structure does not influence wetting andself-cleaning properties, it mitigates the long term passive applicability of PCcoatings for enhancing PV modules. In order to overcome these shortcom-ings, the thin nanofur topography is deconstructed and its parts are separatelyoptically characterized (Section 5.2.1). The optically relevant microcavity array(MCA) was then transferred into a fluorinated polymer, as described in Sec-tion 3.2 and in turn characterized in regard to its self-cleaning (Section 5.2.2)and PV enhancing properties (Section 5.2.3). Simulations and EQE measure-ments presented in the following section were jointly carried out with BenjaminFritz (Light Technology Insitute (LTI), KIT) and Aiman Roslizar (Institute ofMicrostructure Technology (IMT), KIT).
5.2.1 Optical Properties of MCA
Thin nanofur topography consists of a dense layer of high aspect ratio micro- andnanohairs supported by an underlying disordered MCA as shown in Fig. 5.6 a).
96
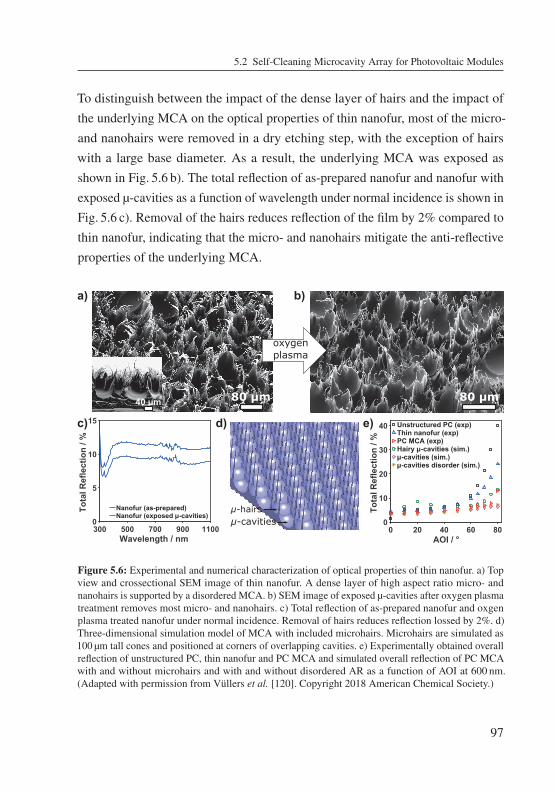
5.2 Self-Cleaning Microcavity Array for Photovoltaic Modules
To distinguish between the impact of the dense layer of hairs and the impact ofthe underlying MCA on the optical properties of thin nanofur, most of the micro-and nanohairs were removed in a dry etching step, with the exception of hairswith a large base diameter. As a result, the underlying MCA was exposed asshown in Fig. 5.6 b). The total reflection of as-prepared nanofur and nanofur withexposed μ-cavities as a function of wavelength under normal incidence is shown inFig. 5.6 c). Removal of the hairs reduces reflection of the film by 2% compared tothin nanofur, indicating that the micro- and nanohairs mitigate the anti-reflectiveproperties of the underlying MCA.
0 20 40 60 800
10
20
30
40
Tota
l Ref
lect
ion
/ %
Unstructured PC (exp)Thin nanofur (exp)
Hairy μ-cavities (sim.)μ-cavities (sim.)μ-cavities disorder (sim.)
PC MCA (exp)
AOI / °
a)
80 μm 40 μm
b)
μ-cavitiesμ-hairs
e)
80 μm
oxygenplasma
300 500 700 900 1100Wavelength / nm
0
5
10
15
Tota
l Ref
lect
ion
/ %
Nanofur (as-prepared)Nanofur (exposed μ-cavities)
c) d)
Figure 5.6: Experimental and numerical characterization of optical properties of thin nanofur. a) Topview and crossectional SEM image of thin nanofur. A dense layer of high aspect ratio micro- andnanohairs is supported by a disordered MCA. b) SEM image of exposed μ-cavities after oxygen plasmatreatment removes most micro- and nanohairs. c) Total reflection of as-prepared nanofur and oxgenplasma treated nanofur under normal incidence. Removal of hairs reduces reflection lossed by 2%. d)Three-dimensional simulation model of MCA with included microhairs. Microhairs are simulated as100 μm tall cones and positioned at corners of overlapping cavities. e) Experimentally obtained overallreflection of unstructured PC, thin nanofur and PC MCA and simulated overall reflection of PC MCAwith and without microhairs and with and without disordered AR as a function of AOI at 600 nm.(Adapted with permission from Vüllers et al. [120]. Copyright 2018 American Chemical Society.)
97
5 Superhydrophobic Surfaces for Optoelectronic Applications
To study the antireflective properties of the disordered μ-cavity topography andfurther investigate the effect of microhairs on the reflectivity of MCA films undervarying AOI, a simplified MCA model with the possibility to include microhairsinto the topography was developed (Fig. 5.6 d). Based on this model, all followingsimulations were undertaken. Because the μ-cavities on thin nanofur are more thanone order of magnitude larger than the spectral range relevant for PV applications(300 nm - 1100 nm), optical properties of MCA are solely governed by ray opticsand consequently all corresponding simulations are carried out using ray tracingsimulations. A negative PDMS imprint (Fig. 3.9) shows that thin nanofur is cov-ered in overlapping μ-cavities, which leave no planar surface area left. Therefore,the modelled cavities with radius r, were aligned in a hexagonal array with a latticeconstant a =
√3r, to achieve a complete tiling of the base. Moreover, all modeled
μ-cavities were assigned an aspect ratio of AR= 0.45, which was experimentallyderived from cross-sectional SEM images of thin nanofur (Fig. 5.7). Numericalreflectivity simulations of MCA as a function of AR have shown minimal reflec-tivity for AR = 0.5 (not shown here), indicating that the AR of thin nanofur isclose to optimal, and, thus, making nanofur topography a promising template foranti-reflective coatings.Experimental reflection values of thin nanofur, unstructured PC and PC MCA arecompared to simulated reflection values of PC MCA with and without disorderand microhairs as a function of AOI in Fig. 5.6 e). The displayed reflection valuesare taken at λ = 600 nm, in order to be close to the solar irradiance peak. Forunstructured PC and as-prepared thin nanofur reflection increases exponentiallywith increasing AOI up to 40% and 25% respectively. A similar exponentialincrease can be observed for the simulated MCA with incorporated microhairs.The increase in reflectivity is directly correlated to the height of the microhairs,as a reduction of cone height from 100 μm to 50 μm reduces reflectivity from13.5% to 7.5%. The exponential increase in reflectivity for thin nanofur andMCA with microhairs is a result of the change in effective cross-sectional areaof microhairs with increasing AOI. At normal incidence the area relevant forreflection is the horizontal cross-sectional area of the hairs, which for hairs with
98
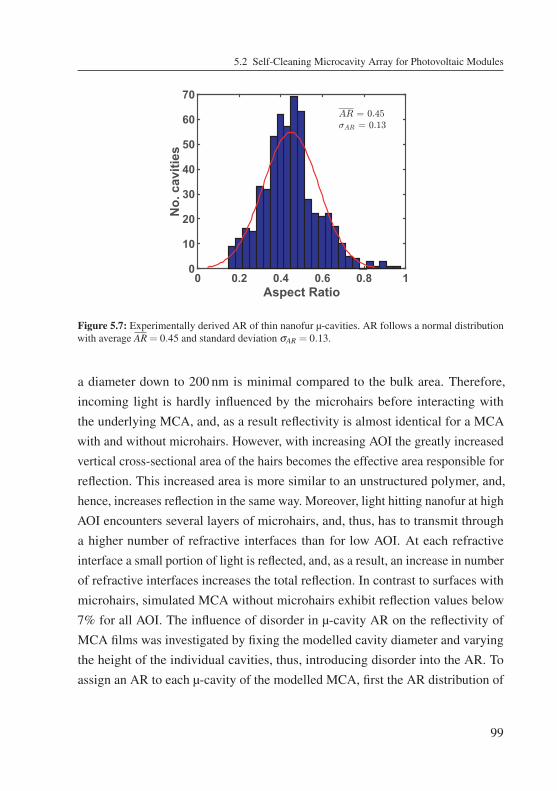
5.2 Self-Cleaning Microcavity Array for Photovoltaic Modules
0 0.2 0.4 0.6 0.8 1Aspect Ratio
0
10
20
30
40
50
60
70
No.
cav
ities
Figure 5.7: Experimentally derived AR of thin nanofur μ-cavities. AR follows a normal distributionwith average AR = 0.45 and standard deviation σAR = 0.13.
a diameter down to 200 nm is minimal compared to the bulk area. Therefore,incoming light is hardly influenced by the microhairs before interacting withthe underlying MCA, and, as a result reflectivity is almost identical for a MCAwith and without microhairs. However, with increasing AOI the greatly increasedvertical cross-sectional area of the hairs becomes the effective area responsible forreflection. This increased area is more similar to an unstructured polymer, and,hence, increases reflection in the same way. Moreover, light hitting nanofur at highAOI encounters several layers of microhairs, and, thus, has to transmit througha higher number of refractive interfaces than for low AOI. At each refractiveinterface a small portion of light is reflected, and, as a result, an increase in numberof refractive interfaces increases the total reflection. In contrast to surfaces withmicrohairs, simulated MCA without microhairs exhibit reflection values below7% for all AOI. The influence of disorder in μ-cavity AR on the reflectivity ofMCA films was investigated by fixing the modelled cavity diameter and varyingthe height of the individual cavities, thus, introducing disorder into the AR. Toassign an AR to each μ-cavity of the modelled MCA, first the AR distribution of
99
5 Superhydrophobic Surfaces for Optoelectronic Applications
thin nanofur was measured using cross-sectional SEM images. Figure 5.7 showsthat the AR of nanofur μ-cavities follows a normal distribution with mean valueAR = 0.45 and standard deviation σAR = 0.13.Based on this distribution, modeled μ-cavities were assigned an AR. The intro-duced disorder changes the reflectivity of MCA films by less than 0.2% as shownin Fig. 5.6 e). This minimal reduction is in agreement with results shown by Fritzet al. [179] for microstructured surfaces composed of microcones. Hence, theeffect of prevalent structural disorder on the surfaces optical properties can beneglected and, therefore, was not adjusted in the replication of MCAs (Section 3.2).Therefore, it can be concluded, that the increase in reflection of thin nanofur withincreasing AOI compared to MCA without microhairs is solely a result of themicrohairs. Thus, the bare MCA is more advantageous for applications requiringhigh transmittance, such as PV modules.However, to achieve superhydrophobicity and self-cleaning properties with highsurface energy materials such as PC, the dense layer of microhairs is essential,because it reduces the contact area between water and substrate necessary toachieve a Cassie-Baxter wetting state [54, 61]. Therefore, in order for low ARstructures such as MCA to achieve superhydrophobicity and self-cleaning proper-ties, while keeping good optical properties, a polymer with low surface energy,such as a fluorinated polymer has to be used. To combine optimal optical andwetting properties, the MCA topography was transferred into fluorinated ethy-lene propylene (FEP) using hot embossing as described in Section 3.2. A fur-ther benefit of using FEP is its high chemical and mechanical resistance againstimpact and tearing.
5.2.2 Self-Cleaning properties of FEP MCA
As mentioned in Section 5.1.1, many micro- and nanostructured superhydrophobicsurfaces exhibit self-cleaning properties known as "Lotus-Effect" [1, 11, 41, 168].This effect is especially of interest for photovoltaic (PV) devices as a way toreduce soiling, and, thus, maintenance and operational costs [35, 38, 40]. To
100
5.2 Self-Cleaning Microcavity Array for Photovoltaic Modules
maximize efficiency of PV modules, they are installed at different tilt anglesdepending on several constraints including geographical location, fraction ofdiffuse vs. direct sunlight and local shading from surrounding hills, trees andbuildings [180, 181]. Therefore, in order to include optimal PV installation anglesfor most of the world [180], self-cleaning properties of FEP MCA were testedfor tilt angles ranging from 10◦ to 45◦. Furthermore, to encompass a varietyof contaminants, sea sand (particle size: 100 μm - 315 μm) and graphite powder(particle size: 30 μm - 900 μm) were used as contamination. The large size distribu-tion of graphite powder additionally tests the self-cleaning properties for a broadrange of contaminant sizes.After contaminating FEP MCA and unstructured FEP with graphite powder,consecutive water droplets were dispensed on both surfaces. The self-cleaningproperties of FEP MCA and unstructured FEP at 10◦ and 45◦ are compared inFig. 5.8 a), b). For all tilt angles, water droplets stuck to unstructured FEP resultingin no self-cleaning effect. Water droplets dispensed on FEP MCA on the otherhand, rolled down the surface, picking up contaminants and effectively cleaningthe surface in the process. Furthermore, optical microscope pictures of unstruc-tured FEP and FEP MCA after conducting the self-cleaning test show graphiteparticles still contaminating unstructured FEP, while FEP MCA is completelycleaned from all contaminants (Fig. 5.8 a), b), c)).Because sand and dust are the most common contaminants in arid regions, whereinstallation of PV modules, and, therefore soiling of PV modules is of greatinterest, self-cleaning tests were repeated with sea sand. FEP MCA exhibited self-cleaning behavior for all tested angles, whereas sea sand and water droplets stuckto unstructured FEP, resulting in no self-cleaning behavior and a contaminatedsurface as shown in Fig. 5.8 d).One main natural source providing water for self-cleaning properties of PV mod-ules is rain. However, rain impacting on a superhydrophobic surface can result ina Cassie-Baxter to Wenzel wetting transition [182–185]. Such a transition wouldresult in droplets sticking to the surface and a loss of superhydrophobicity and self-cleaning properties. Additionally, if droplets from dust rain stick to the surface of
101
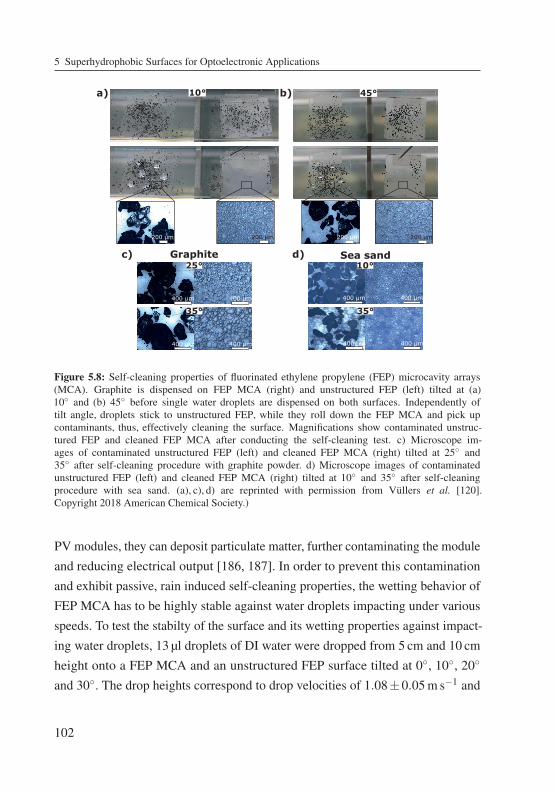
5 Superhydrophobic Surfaces for Optoelectronic Applications
a) 10° b)
200 μm200 μm200 μm200 μm
c) d)
45°
400 μm 400 μm
400 μm 400 μm
35°
10°
400 μm 400 μm
25°
400 μm400 μm
35°
Graphite Sea sand
Figure 5.8: Self-cleaning properties of fluorinated ethylene propylene (FEP) microcavity arrays(MCA). Graphite is dispensed on FEP MCA (right) and unstructured FEP (left) tilted at (a)10◦ and (b) 45◦ before single water droplets are dispensed on both surfaces. Independently oftilt angle, droplets stick to unstructured FEP, while they roll down the FEP MCA and pick upcontaminants, thus, effectively cleaning the surface. Magnifications show contaminated unstruc-tured FEP and cleaned FEP MCA after conducting the self-cleaning test. c) Microscope im-ages of contaminated unstructured FEP (left) and cleaned FEP MCA (right) tilted at 25◦ and35◦ after self-cleaning procedure with graphite powder. d) Microscope images of contaminatedunstructured FEP (left) and cleaned FEP MCA (right) tilted at 10◦ and 35◦ after self-cleaningprocedure with sea sand. (a), c), d) are reprinted with permission from Vüllers et al. [120].Copyright 2018 American Chemical Society.)
PV modules, they can deposit particulate matter, further contaminating the moduleand reducing electrical output [186, 187]. In order to prevent this contaminationand exhibit passive, rain induced self-cleaning properties, the wetting behavior ofFEP MCA has to be highly stable against water droplets impacting under variousspeeds. To test the stabilty of the surface and its wetting properties against impact-ing water droplets, 13 μl droplets of DI water were dropped from 5 cm and 10 cmheight onto a FEP MCA and an unstructured FEP surface tilted at 0◦, 10◦, 20◦
and 30◦. The drop heights correspond to drop velocities of 1.08±0.05m s−1 and
102
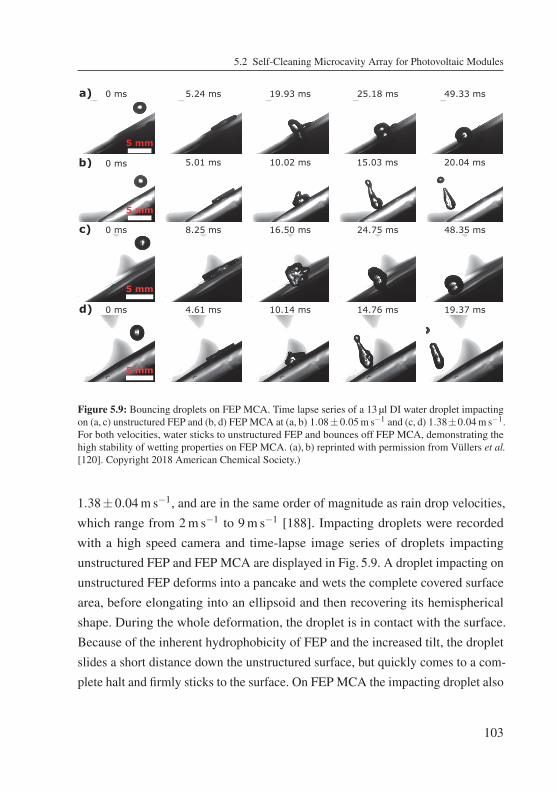
5.2 Self-Cleaning Microcavity Array for Photovoltaic Modules
5.01 ms 10.02 ms 15.03 ms 20.04 msb) 0 ms
5.24 ms 19.93 ms 25.18 ms 49.33 ms0 msa)
5 mm
5 mm
5 mm
4.61 ms 10.14 ms 14.76 ms 19.37 ms0 msd)
8.25 ms 16.50 ms 24.75 ms 48.35 ms0 msc)
5 mm
Figure 5.9: Bouncing droplets on FEP MCA. Time lapse series of a 13 μl DI water droplet impactingon (a, c) unstructured FEP and (b, d) FEP MCA at (a, b) 1.08±0.05m s−1 and (c, d) 1.38±0.04m s−1.For both velocities, water sticks to unstructured FEP and bounces off FEP MCA, demonstrating thehigh stability of wetting properties on FEP MCA. (a), b) reprinted with permission from Vüllers et al.[120]. Copyright 2018 American Chemical Society.)
1.38±0.04m s−1, and are in the same order of magnitude as rain drop velocities,which range from 2m s−1 to 9m s−1 [188]. Impacting droplets were recordedwith a high speed camera and time-lapse image series of droplets impactingunstructured FEP and FEP MCA are displayed in Fig. 5.9. A droplet impacting onunstructured FEP deforms into a pancake and wets the complete covered surfacearea, before elongating into an ellipsoid and then recovering its hemisphericalshape. During the whole deformation, the droplet is in contact with the surface.Because of the inherent hydrophobicity of FEP and the increased tilt, the dropletslides a short distance down the unstructured surface, but quickly comes to a com-plete halt and firmly sticks to the surface. On FEP MCA the impacting droplet also
103
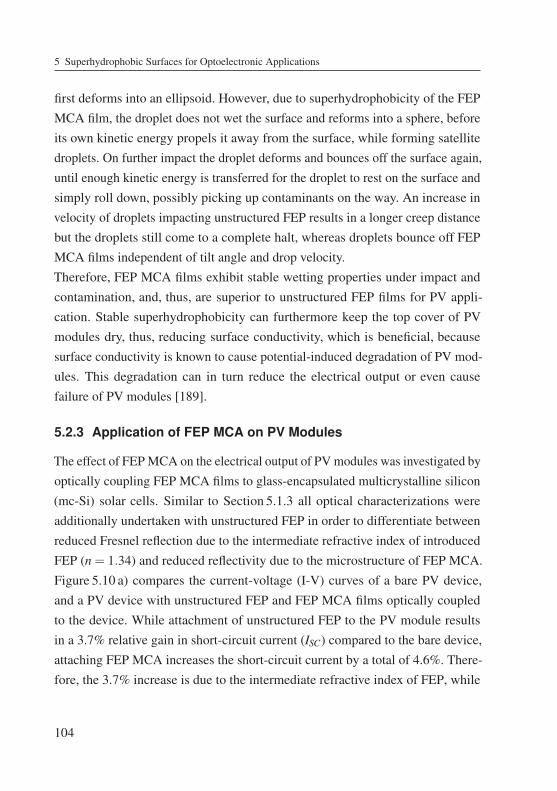
5 Superhydrophobic Surfaces for Optoelectronic Applications
first deforms into an ellipsoid. However, due to superhydrophobicity of the FEPMCA film, the droplet does not wet the surface and reforms into a sphere, beforeits own kinetic energy propels it away from the surface, while forming satellitedroplets. On further impact the droplet deforms and bounces off the surface again,until enough kinetic energy is transferred for the droplet to rest on the surface andsimply roll down, possibly picking up contaminants on the way. An increase invelocity of droplets impacting unstructured FEP results in a longer creep distancebut the droplets still come to a complete halt, whereas droplets bounce off FEPMCA films independent of tilt angle and drop velocity.Therefore, FEP MCA films exhibit stable wetting properties under impact andcontamination, and, thus, are superior to unstructured FEP films for PV appli-cation. Stable superhydrophobicity can furthermore keep the top cover of PVmodules dry, thus, reducing surface conductivity, which is beneficial, becausesurface conductivity is known to cause potential-induced degradation of PV mod-ules. This degradation can in turn reduce the electrical output or even causefailure of PV modules [189].
5.2.3 Application of FEP MCA on PV Modules
The effect of FEPMCA on the electrical output of PV modules was investigated byoptically coupling FEP MCA films to glass-encapsulated multicrystalline silicon(mc-Si) solar cells. Similar to Section 5.1.3 all optical characterizations wereadditionally undertaken with unstructured FEP in order to differentiate betweenreduced Fresnel reflection due to the intermediate refractive index of introducedFEP (n = 1.34) and reduced reflectivity due to the microstructure of FEP MCA.Figure 5.10 a) compares the current-voltage (I-V) curves of a bare PV device,and a PV device with unstructured FEP and FEP MCA films optically coupledto the device. While attachment of unstructured FEP to the PV module resultsin a 3.7% relative gain in short-circuit current (ISC) compared to the bare device,attaching FEP MCA increases the short-circuit current by a total of 4.6%. There-fore, the 3.7% increase is due to the intermediate refractive index of FEP, while
104
5.2 Self-Cleaning Microcavity Array for Photovoltaic Modules
300 500 700 900 1100Wavelength / nm
0
20
40
60
80
100
Exte
rnal
qua
ntum
effi
cien
cy /
%
PV device with FEP MCAPV device with flat FEPBare PV device
0 0.1 0.2 0.3 0.4 0.5Voltage / V
0
0.02
0.04
0.06
0.08
0.1C
urre
nt /
A
PV device with FEP MCA (ISC=81.8 mA)PV device with flat FEP (ISC=81.1 mA)Bare PV device (ISC=78.2 mA)
a) b)
300 500 700 900 1100Wavelength / nm
0
1
2
3
4
5
EQE
/ %
Flat FEP vs. bare PVFEP MCA vs. bare PV
Figure 5.10: Effect of FEP MCA on PV devices. a) I-V curves of bare, unstructured FEP coated andFEP MCA coated glass-encapsulated mc-Si solar cell. b) EQE as a function of wavelength for bare,unstructured FEP coated and FEP MCA coated glass-encapsulated mc-Si solar cell under simulatedsunlight (air-mass 1.5 global spectrum) and normal incidence. Compared to the bare device, unstruc-tured FEP and FEP MCA increase the electrical gain by 3.7% and 4.6% respectively. Inset showshighest improvement of electrical output in the visible spectrum (λ = 400 nm - 700 nm). (Reprintedwith permission from Vüllers et al. [120]. Copyright 2018 American Chemical Society.)
the additional 0.9% increase of FEP MCA is solely due to the microstructure ofthe embossed film. The optical improvement of FEP and FEP MCA is verifiedby EQE measurements shown in Fig. 5.10 b). Optically coupling FEP and FEPMCA to the PV device increases the EQE over the complete PV relevant spec-trum (300 nm to 1100 nm). The inset in Fig. 5.10 shows that the improvement inEQE, due to attached FEP and FEP MCA, decreases with increasing wavelengthand is most pronounced in the visible spectrum between 400 nm and 700 nm.Because the solar photon flux is highest in this spectral region, the improvementresults in a significant increase in electrical gain. For normal incidence, both theEQE and I-V curves indicate that the introduction of FEP has a bigger impacton the electrical gain of PV modules than the microstructure of FEP MCA. Apossible reason for the less pronounced impact of the MCA microstructure areunstructured ridges between the microcavities (Fig. 3.8 c), d)), which possiblyincrease reflection and decrease the electrical gain. By fine tuning the fabrication
105
5 Superhydrophobic Surfaces for Optoelectronic Applications
parameters, these ridges can be eliminated, minimizing reflectivity, and, thus,maximizing the electrical gain.As mentioned before, PV modules are installed at various different tilt angles,depending on the installation site and the surrounding landscape. Therefore,sunlight usually does not hit modules under normal incidence but rather at variousdifferent AOI. To investigate the effect of varying tilt angles on the reflectivityof PV modules, the total reflection of a bare solar cell, a solar cell coated withunstructured FEP and a cell coated with FEP MCA illuminated at 8◦ and 80◦ wasmeasured as shown in Fig. 5.11. The reflection spectra at 8◦ verify the result ofthe EQE and I-V curve measurements under normal incidence. Introduction ofunstructured FEP and FEP MCA results in a broadband reduction in reflectivitycompared to the uncoated device with the smallest difference at a wavelengthof λ =650 nm, for which the anti-reflective coating of the solar cell has beenoptimized. For decreasing and increasing wavelengths however, FEP and FEPMCA significantly reduce the reflectivity with the highest difference betweencoated and uncoated device being observed in the lower wavelength range. At8◦ tilt, almost no difference in reflectivity can be observed between unstructuredFEP and FEP MCA (Fig. 5.11 a). However, with increasing AOI the reflectivityof the bare solar cell and the cell coated with unstructured FEP greatly increases(≈ 20% and ≈ 35% at 650 nm respectively), while the reflectivity of the FEPMCA coated cell hardly changes (≈ 13% at 650 nm). Thus, reflectivity of the PVdevice coated with unstructured FEP at 80◦ is three times as high as reflectivityof the FEP MCA coated device and even higher than on the uncoated device.On the other hand, FEP MCA shows anti-reflective behavior over the completespectrum relevant for electrical conversion. Because unstructured FEP drasticallyincreases the reflectivity, the anti-reflective behavior can solely be attributed tothe embossed microstructure. Hence, for real-world applications, where sunlightoften incides on PV modules at an AOI greater than 8◦, FEP MCA shows superioroptical properties compared to both alternatives, while additionally displayingself-cleaning properties.
106
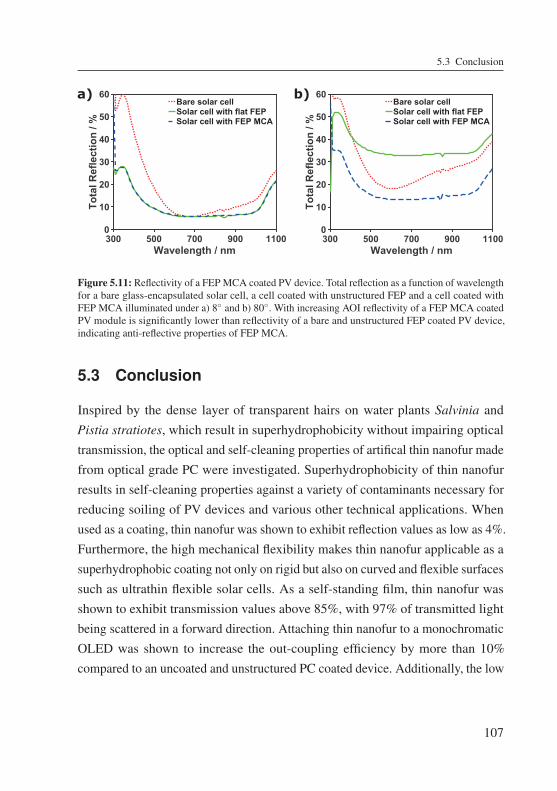
5.3 Conclusion
300 500 700 900 1100Wavelength / nm
0
10
20
30
40
50
60To
tal R
efle
ctio
n / %
Bare solar cellSolar cell with flat FEPSolar cell with FEP MCA
300 500 700 900 1100Wavelength / nm
0
10
20
30
40
50
60
Tota
l Ref
lect
ion
/ %
Bare solar cellSolar cell with flat FEPSolar cell with FEP MCA
a) b)
Figure 5.11: Reflectivity of a FEPMCA coated PV device. Total reflection as a function of wavelengthfor a bare glass-encapsulated solar cell, a cell coated with unstructured FEP and a cell coated withFEP MCA illuminated under a) 8◦ and b) 80◦. With increasing AOI reflectivity of a FEP MCA coatedPV module is significantly lower than reflectivity of a bare and unstructured FEP coated PV device,indicating anti-reflective properties of FEP MCA.
5.3 Conclusion
Inspired by the dense layer of transparent hairs on water plants Salvinia andPistia stratiotes, which result in superhydrophobicity without impairing opticaltransmission, the optical and self-cleaning properties of artifical thin nanofur madefrom optical grade PC were investigated. Superhydrophobicity of thin nanofurresults in self-cleaning properties against a variety of contaminants necessary forreducing soiling of PV devices and various other technical applications. Whenused as a coating, thin nanofur was shown to exhibit reflection values as low as 4%.Furthermore, the high mechanical flexibility makes thin nanofur applicable as asuperhydrophobic coating not only on rigid but also on curved and flexible surfacessuch as ultrathin flexible solar cells. As a self-standing film, thin nanofur wasshown to exhibit transmission values above 85%, with 97% of transmitted lightbeing scattered in a forward direction. Attaching thin nanofur to a monochromaticOLED was shown to increase the out-coupling efficiency by more than 10%compared to an uncoated and unstructured PC coated device. Additionally, the low
107
5 Superhydrophobic Surfaces for Optoelectronic Applications
front reflectance and high back reflection of thin nanofur increases the short-circuitcurrent density of mc-Si solar cells by 5.8% compared to a bare device.To overcome limitations in applicabilty of thin nanofur due to low mechani-cal, chemical and UV stability, while keeping its excellent optical properties, itsoptically relevant surface topography was transferred to a fluorinated polymer. Tothis effect, the optical properties of thin nanofur were studied using ray tracingsimulations and a MCA topography was shown to significantly reduce reflectivityfor all AOI compared to a combination of μ-cavities and nano- and microhairs.Hence, the MCA topography was transferred into FEP and characterized for itsapplicability on optoelectronic devices. Self-cleaning properties of FEP MCAare demonstrated for several contaminant species and a wide range of contami-nant sizes (30 μm - 900 μm) and tilt angles (10◦ - 45◦), thus, including parametersencountered in real-world applications. Furthermore, rain droplets impacting FEPMCA are shown to easily bounce off the surface independent of tilt angle anddrop velocity, demonstrating high impact stability of the surface and its wettingproperties. Moreover, a 4.6% relative gain in short-circuit current of glass encap-sulated mc-Si solar cells was achieved by optically coupling FEP MCA to the PVdevice. Anti-reflective properties of the embossed MCA at high AOI promises thisefficiency enhancement to become even more prominent for PV modules installedat angles differing from normal incidence, as is the case for practical applications.Based on these results, further angle resolved EQE measurements of FEP MCAare of great interest for optoelectronic applications and will give a more detailedinsight into the effect of FEP MCA on PV modules. Such investigations will showsuperiority of the embossed films compared to the conventional glass encapsu-lation. Furthermore, an investigation into foregoing glass encapsulation of PVmodules in favor of FEP MCA is a promising approach to increase efficiency,while simultaneously reducing manufacturing costs. Direct FEP MCA encapsu-lation would not only reduce manufacturing costs by reducing a two-step (glassencapsulation + coating the PV device) to a one-step fabrication process, butwould additionally eliminate one solid-solid interface, which could reduce reflec-tion losses and increase electrical gain. Moreover, self-cleaning properties of the
108
5.3 Conclusion
films combined with their high UV, mechanical and chemical resistance wouldmake an exchange of the FEP MCA coating unnecessary, resulting in long lifecycles of PV modules with minimal maintenance.
A shortened version of the optical characterization and application of thin nanofur
(Section 5.1) was published in "Bioinspired Superhydrophobic Highly Transmis-
sive Films for Optical Applications", Felix Vüllers, Guillaume Gomard, Jan B.
Preinfalk, Efthymios Klampaftis, Matthias Worgull, Bryce S. Richards, Hendrik
Hölscher and Maryna N. Kavalenka, Small, 2016, 12, 6144-6152.
A shortened version of the optical characterization and application of FEP MCA
(Section 5.2) was published in "Self-Cleaning Microcavity Array for Photovoltaic
Modules", Felix Vüllers, Benjamin Fritz, Aiman Roslizar, Andreas Striegel, Markus
Guttmann, Bryce S. Richards, Hendrik Hölscher, Guillaume Gomard, Efthymios
Klampaftis and Maryna N. Kavalenka, ACS Applied Materials & Interfaces, 2018,
10, 2929-2936.
109

6 Summary and Outlook
Superhydrophobic surfaces, both natural and artificial, exhibit a great varietyof functionalities, which can be exploited for a multitude of energy harvestingand energy conserving applications. In order to harness the enormous potentialof superhydrophobic surfaces classical micro- and nanostructuring techniqueswere used to fabricate superhydrophobic surfaces, which were then examinedin the context of fluidic drag reduction and optoelectronic applications. Thescientific objectives of this work could thereby be fulfilled and the main findingsare summarized in the following.
Development of a scalable and cost efficient fabrication techniquefor transparent superhydrophobic thin nanofur.
Based on "thick nanofur" [50, 51], a two-step fabrication procedure combininghot embossing and hot pulling was developed to fabricate a thin nanofur filmwith a minimal base layer thickness of 30 μm, suppporting a dense layer of highaspect ratio micro- and nanohairs. Bonding biocompatible optical grade PC to asacrificial polymer layer before structuring thin nanofur, minimizes its backsideroughness, and, thus, reduces reflection and absorption losses, essential for hightransmission and its use as a functional coating on optoelectronic devices. Theresulting superhydrophobic thin nanofur exhibits static water contact angles above150◦, roll-off angles below 6◦ and retains an air layer when submerged underwater.Furthermore, by varying the fabrication parameters or perforating thin nanofurby laser drilling or manual perforation, thin nanofur can be functionalized andits air retaining capabilities improved, without changing its wetting properties.Exposition to argon plasma is shown to temporarily reverse the wetting properties
111
6 Summary and Outlook
of thin nanofur to underwater superoleophobic. By adjusting the storing conditionsof the treated films, the hydrophobic recovery back to superhydrophobicity can bedelayed or even halted, in case the treated films are stored in water.To increase mechanical, UV and chemical resistance, and decrease reflectionlosses, which is essential for application on optoelectronic devices, a fabricationroute was developed to imprint the underlying microcavity array (MCA) of thinnanofur into the PV-relevant polymer fluorinated ethylene propylene (FEP). Byelectroplating thin nanofur and then hot embossing the fabricated Ni-shim intoFEP, a superhydrophobic thin FEP MCA film with water contact angles above150◦ and water sliding angles below 5◦ was fabricated.In conclusion, developed thin nanofur and nanofur-based MCA are applicablefor drag reduction and optoelectronics. However, to be suitable for industrialapplication, some open issues have to be tackled first. Optimizing the FEP MCAfabrication parameters can increase the AR of the μ-cavities, eliminate unstruc-tured ridges between the cavities, and, thus, reduce reflection losses. Furthermore,a reliable high throughput fabrication procedure of both FEP MCA and thinnanofur has to be established. A transfer to a roll-to-roll replication procedurehas great potential, as the fabrication procedure of both films is based on hotembossing and hot pulling techniques, and fabrication of the respective shims isinexpensive and low in complexity. The greatest challenge for large scale fabri-cation of thin nanofur is cleaning of the sandblasted steel drum used as a moldinsert during hot pulling. A possible solution for removing polymer from the drumcould be in-situ chemical or plasma cleaning of the utilized steel drum. Moreover,current projects at the Institute of Microstructure Technology target develope-ment of seamless sleeves for roll-to-roll fabrication. Such shims will overcomelimitations in shim size which limit FEP MCA fabrication to conventional hotembossing, rather than roll-to-roll fabrication. An upscaling of the fabricationprocedures of thin nanofur and FEP MCA would greatly increase throughput andenable coating of large areas, such as entire ships or PV arrays with functionalizedsuperhydrophobic surfaces, thus, pushing towards solutions for such problems as
112
6 Summary and Outlook
increasing fuel consumption in international shipping and the increasing needfor renewable energy.
Equipment of thin nanofur with a highly stable underwaterretained air layer.
Analogous to its natural prototypes, the dense layer of high aspect ratio micro-and nanohairs enables thin nanofur to retain an air layer when submerged underwater. By characterizing the wetting transition on superhydrophobic nanofur, itwas shown that its superhydrophobic topography with moderate surface energyretains an air layer which is more stable against hydrostatic pressure than the sametopography with either low or high surface energy. Additionally, an easy to usemeasurement technique based on total internal reflection at the air-water interfacewas introduced to show that the air covered area on thin nanofur decreases expo-nentially with increasing hydrostatic pressure. To overcome the pressure limitationof the retained air layer, nanofur was perforated and its underwater retained airlayer was pressurized. Air layer pressurization counteracts the hydrostatic pressureacting on the air-water interface, and results in retained air layer stable up to 7 barhydrostatic pressure and pressure fluctuations of 3 bar.Moreover, by combining the total internal reflection measurement technique withcontact line motion observations, it was possible to identify six topographicalfeatures necessary for high dynamic plastron stability and high contaminationresistance of superhydrophobic surfaces. These features are: (i) hierarchicaltopography; (ii) high density of surface structures; (iii) minimal water-solid con-tact area; (iv) nanometer-scale features; (v) cavities or cavity-like structures and(vi) re-entrant structures. Moreover, these topographical features were correlatedto the dynamic wetting behavior of superhydrophobic surfaces and a discrepancybetween stability enhancing and drag reducing features was shown.Both developed measurement techniques are easy to use and easily adjustable toa variety of different measurement environments, thus, providing a good foun-dation for characterization of the retained air layer stability, both in static and
113
6 Summary and Outlook
dynamic conditions, often neglected in other existing research. A further inves-tigation of stability enhancing topographical features (dynamic and static) andan in-depth investigation into the drag reducing capabilities of perforated thinnanofur is of great interest. The high static stability of the retained air layeron pressure supported perforated thin nanofur has the potential to reduce fric-tional drag under extreme conditions often encountered in harsh environments.Measurements of the drag-reducing capabilities of thin nanofur and perforatedthin nanofur after integration into model ship surfaces or microfluidic devicescould be the next step.
Application of self-cleaning thin nanofur and nanofur-based filmsas efficiency enhancing coatings on optoelectronic devices.
The superhydrophobicity of thin nanofur results in a self-cleaning behavior againsta variety of contaminants with a broad range of particle sizes. Self-cleaningbehavior is beneficial for reducing soiling of optoelectronic devices. An in-depthoptical characterization of bioinspired thin nanofur shows that it exhibits reflectionvalues of less than 4% when used as a coating, while more than 86% of incidinglight is scattered in a forward direction, when used as a self-standing film. Suchexcellent optical properties are beneficial for light managing applications, and areshown to increase the out-coupling efficiency of OLEDs by up to 14%, and alsoenhance the efficiency of a bare mc-Si solar cells by almost 6%.Optical coupling of nanofur-based FEP MCA to a glass encapsulated mc-Si solarcell leads to a 4.6% increase in electrical gain under normal incidence, comparedto a bare glass encapsulated cell. Furthermore, numerical simulations show thatthe bare MCA topography exhibits lower reflection values than thin nanofur for allAOI. This anti-reflective behavior of FEP MCA enhances drastically with increas-ing AOI, leading to an up to 50% reduced reflectivity compared to unstructuredFEP at an AOI of 80◦. Together with the self-cleaning properties shown for abroad range of contaminant species, sizes and tilt angles, as well as the surface
114
6 Summary and Outlook
stability against impacting water droplets, the anti-reflective behavior makes FEPMCA an effective coating for light management.A further investigation into the benefits of FEP MCA for PV efficiency at differenttilt angles, as well as a field testing of self-cleaning properties and UV- andmechanical stability would be of great interest. Moreover, foregoing the glassencapsulation of PV modules in favor of a direct coating with FEP MCA mightfurther reduce reflection losses and increase the cost efficiency of coated PVmodules. Finally, the high mechanical flexibility and translucent properties of boththin nanofur and FEP MCA have great potential for implementation into ultrathinflexible solar cells, where forward scattering increases the optical path in the activemedium, thus, further boosting the absorption probability and electrical gain.
115

Appendix
Semi-Automatic Calculation of Dynamic Contact Angle
% Filename: ContactLineMotion.m
% Author: Felix Vuellers
% Date: 01.03.2018
% Karlsruhe Institute of Technology (KIT)
% Matlab Version: MatlabR2015b
function [angle_deg, cleansed_angle] ...
= ContactLineMotion()
% Path of Contact Line Motion Images
direct=’D:\Users\hb3224\Documents\Dip01_50mmmin...
\sliced\crop\up\images\’;
fpathdata=direct;
% Getting all contact line motion files with
% specified extension;
getAllTiff=getAllFiles(fpathdata,’*.tiff’,true);
if isempty(getAllTiff)
getAllTiff=getAllFiles(fpathdata,’*.tif’,true);
end
getAllTiff=char(getAllTiff);
% Define number of points not taken into
117

Appendix
% consideration at beginning due to artifacts
point_omit=2;
% Definition of Threshold intensity, defining interface
intensity_threshold=70;
% Definition of number of points used to calculate
% linear regression for tangent
tangent_points=8;
% Define deviation that is allowed from mean value in
% contact angle without being labeled as program not
%working and moved for manual reevaluation
allowed_deviation=10;
% Define after how many frames the coordinates of the
% substrate should be reset by clicking
click_reset=5;
% Create folders to save pictures fabricated in measurement,
% if not existent
if(~exist(direct,’dir’));
mkdir(direct);
end
help=strcat(direct,’Overlap’);
if (~exist(help,’dir’))
mkdir(help);
mkdir(help,’Tangent’);
end
118

Appendix
for i=1:size(getAllTiff,1)
% Resave name of currently used picture in order
% to make handling easier
fname=getAllTiff(i,:);
% Break up name into filename and rest of name
% --> only filename necessary
[~,filename,~] = fileparts(fname);
% Create strings to later save data and pictures
% in appropriate folders
AWI_tangent = ...
strcat(direct,’Overlap\Tangent\’,filename,’.tif’);
ContactAngleFile=strcat(direct,’_ContactAngle.mat’);
% loads the picture to extract data from it
load_crosssection = imread(fname);
% To find the location of the pixel reaching
% threshold intensity;
[rows,cols] = ...
find(load_crosssection<intensity_threshold);
% location of pixel using binary image
Y = [rows,cols];
% information about the loaded image
% width = size x-direction (number of pictures in
% original stack) and
% heigth = size y-direction (length of edge
% of one picture in original stack)
119

Appendix
info = imfinfo (fname);
w = info(1).Width;
h = info(1).Height;
%Creates an empty 3-D array
intensity_profile = zeros(h,w,3,’uint8’);
intensity_profile(:,:,:)=255;
Trace = zeros(h,w,3,’uint8’);
S=zeros(h,1);
N=zeros(h,1);
% Visualization of the intensity profile in RGB
% Sets every pixel in Y (every pixel exceeding the
% threshold to some arbitrary color in RGB values.
% Only first value of intensity profile will be used
% in later script to determine further computations)
for j=1:size(Y,1)
intensity_profile(Y(j,1),Y(j,2),1)=200;
intensity_profile(Y(j,1),Y(j,2),2)=75;
intensity_profile(Y(j,1),Y(j,2),3)=50;
end
for k=1:h
for l=1:w
if intensity_profile(k,l,1)==255 && S(k)==0
% Goes through the rows of the image from
% left to right; for every pixel that
% doesn’t exceed the threshold with no
% pixel in that row before it exceeding
% the threshold it increases the
% respective N by 1 (not above 255); i.e.
120
Appendix
% the first row contains 5 pixels with third
% and fifth exceeding the threshold
% -->N(1)=2 (increased at first and second
% iteration, doesn’t increase for 4th pixel,
% since the third increases S-->S(1)
% unequal 0); i.e. the first row contains
% 5 pixels with first and fifth exceeding
% the threshold -->N(1)=0 (first pixel
% increases S --> S(1) unequal 0 for the
% rest of the pixels --> N doesn’t increase;
N(k)=N(k)+1;
elseif intensity_profile(k,l,1)==200 && S(k)==0
% Similar to N(k) determination.
% It will become one for the first pixel
% that reaches the threshold. Afterwards
% no more changes are made to S(k) or N(k)
%in that specific row
S(k)=S(k)+1;
end
end
if S(k)~=0
% colors the first pixel reaching the threshold
% N(k) is number of pixels starting from left,
% that are not higher than threshold and S(k)/2
% is the first pixel reaching threshold due to
% upper definition i.e. first row has 20 pixels
% with first 7 below threshold then 6 higher
% and then 4 below --> N(1)=7 S(1)=6 -->
% N(k)+S(k)/2=13 = middle of bright area.
% This calculation however only works,
% if the area higher than threshold is
121
Appendix
% continuous, otherwise S(k) does not
% represent the thickness of the interface
% --> will not work for more than one interface
Trace(k,N(k)+round(S(k)/2),1)=0;
Trace(k,N(k)+round(S(k)/2),2)=250;
Trace(k,N(k)+round(S(k)/2),3)=0;
end
end
% Trace is the rgb matrix for tracing the outline of
% the interface and I is the two dimensional matrix
% in greyscale
I=rgb2gray(Trace);
[rows,cols] = find(I);
Z = [rows,cols];
D = sortrows(Z);
% Highlighting the extracted air-water interface in
% the image
overlap = repmat(load_crosssection,[1,1,3]);
for r=(find(cols>1,1):(length(rows)-1))
overlap(rows(r),cols(r)-1,1)=0;
overlap(rows(r),cols(r)-1,3)=0;
overlap(rows(r),cols(r)-1,2)=250;
overlap(rows(r),cols(r),1)=0;
overlap(rows(r),cols(r),3)=0;
overlap(rows(r),cols(r),2)=250;
overlap(rows(r),cols(r)+1,1)=0;
overlap(rows(r),cols(r)+1,3)=0;
overlap(rows(r),cols(r)+1,2)=250;
end
122

Appendix
% Define solid-liquid-vapor-triple point manually;
% Find closest point to contact line by clicking
% next to it plotting overlap with fitted polynomial
% and tangent
h1=figure(’Name’,sprintf(’Click number %s %s’, ...
num2str(i), filename(1,:)),’NumberTitle’,’Off’,...
’Position’, [162 55 867 612],’Visible’,’on’);
imshow(overlap);
set(h1,’Position’,[162 55 867 612]);
hold on
if (i==1 || mod(i,click_reset)==1 || click_reset==1)
[x,y]=ginput(1);
end
closest_point_x=D(find(abs(D(:,1)-y)<4),:);
closest_point=closest_point_x(...
find(abs(closest_point_x(:,2)-x)<4),:);
% In case contact line moves too far away
% from first click, new position will be defined
while isempty(closest_point)
[x,y]=ginput(1);
closest_point_x=D(find(abs(D(:,1)-y)<4),:);
closest_point=...
closest_point_x(find(...
abs(closest_point_x(:,2)-x)<4),:);
end
% Find first index of the substrate line
first_index_substrate=find(...
closest_point(:,2)==closest_point(end,2),1);
123

Appendix
D_substrate_index=...
closest_point(first_index_substrate,1);
help_x=[D_substrate_index:(-1):...
D_substrate_index()-tangent_points];
help_y=transpose(D(help_x,2));
p=polyfit(help_x,help_y,1);
slope_red=p(1);
x_tangent=[0:0.1:200];
tangent_red=slope_red*(x_tangent-(D_substrate_index))...
+polyval(p,D_substrate_index);
% calculating ContactAngle
v_tangent=[1 slope_red];
% Polynomial is calculated for a normal orientation of
% the axis. Therefore the angle is in respect to a
% horizontal line instead of a vertical line as seen
% in the picture from overlap (overlap has a 90°
% tilted view)
v_vert=[1 0];
angle(i)=atan2(abs(det([transpose(v_vert),...
transpose(v_tangent)])),dot(transpose(v_vert),...
transpose(v_tangent)));
angle_deg(i)=rad2deg(angle(i));
angle_deg(i)=180-angle_deg(i);
% As the tangent is also calculated in the rotated
% system, the change of variables has to be done
% here as well
plot(tangent_red,x_tangent,’cyan’);
124
Appendix
% increase tangent width for better visibility
help=get(gca,’children’);
set(help(1),’LineWidth’,2.5);
saveas(h1,AWI_tangent);
close(h1);
end
angle_deg=transpose(angle_deg);
% Move files that differ too much from mean value
% to different folder to be reevaluated
mean_angle_deg=mean(angle_deg);index_trouble=...
find(abs(angle_deg-mean_angle_deg)>allowed_deviation);
moved_files=getAllTiff(index_trouble,:);
if ~isempty(moved_files)
% create new folder and move deviating
% files into that folder
folder_help=strcat(direct,’reevaluate’);
mkdir(folder_help);
for ll=1:size(moved_files,1)
copyfile(moved_files(ll,:),folder_help);
end
% Save names of files to reevaluate and
% their indexes to later see which contact angle
% has been replaced
name_length=size(moved_files,2)
fileID = fopen(strcat(direct,’_reevaluate.txt’),’w’);
125

Appendix
fprintf(fileID,’%20s \r\n’,’Files reevaluated’);
for r=1:size(moved_files,1)
fprintf(fileID,sprintf(...
’%s%i%s %s %s%i%s \r\n’,’%’,name_length,...
’s’, ’ ’, ’%’,3,’i’),...
moved_files(r,:),index_trouble(r));
end
fclose(fileID);
cleansed_angle_deg=angle_deg(find(abs(...
angle_deg-mean_angle_deg)<=allowed_deviation));
% save contact angles
save(ContactAngleFile,’angle_deg’,...
’cleansed_angle_deg’,’index_trouble’);
else
% save contact angles
save(ContactAngleFile,’angle_deg’);
end
end
126
Bibliography
[1] Barthlott, W., and Neinhuis, C. Purity of the sacred lotus, or escape fromcontamination in biological surfaces, Planta, 1997, 202, 1–8.
[2] Barthlott, W., Schimmel, T., Wiersch, S., Koch, K., Brede, M.,Barczewski, M., Walheim, S., Weis, A., Kaltenmaier, A., Leder, A., andBohn, H. F. The Salvinia Paradox: Superhydrophobic Surfaces withHydrophilic Pins for Air Retention Under Water, Adv. Mater., 2010, 22,2325–2328.
[3] Neinhuis, C., and Barthlott, W. Characterization and Distribution of Water-repellent, Self-cleaning Plant Surfaces, Ann. Bot., 1997, 79, 667–677.
[4] Mayser, M. J., and Barthlott, W. Layers of Air in the Water beneath theFloating Fern Salvinia are Exposed to Fluctuations in Pressure, Integr.
Comp. Biol., 2014, 54, 1001–1007.
[5] Cerman, Z., Striffler, B. F., and Barthlott, W. Functional Surfaces in Biology;Springer Science + Business Media, 2009; pp 97–111.
[6] Genzer, J., and Efimenko, K. Recent developments in superhydrophobicsurfaces and their relevance to marine fouling: a review, Biofouling, 2006,22, 339–360.
[7] Kim, J.-G., Choi, H. J., Park, K.-C., Cohen, R. E., McKinley, G. H.,and Barbastathis, G. Multifunctional Inverted Nanocone Arrays forNon-Wetting, Self-Cleaning Transparent Surface with High MechanicalRobustness, Small, 2014, 10, 2487–2494.
127
Bibliography
[8] Min, W.-L., Jiang, B., and Jiang, P. Bioinspired Self-Cleaning AntireflectionCoatings, Adv. Mater., 2008, 20, 3914–3918.
[9] Koch, K., Bhushan, B., Jung, Y. C., and Barthlott, W. Fabricationof artificial Lotus leaves and significance of hierarchical structure forsuperhydrophobicity and low adhesion, Soft Matter, 2009, 5, 1386–1393.
[10] Ditsche-Kuru, P., Schneider, E. S., Melskotte, J.-E., Brede, M., Leder, A.,and Barthlott, W. Superhydrophobic surfaces of the water bug Notonectaglauca: a model for friction reduction and air retention, Beilstein J.
Nanotechnol., 2011, 2, 137–144.
[11] Barthlott, W., Mail, M., and Neinhuis, C. Superhydrophobic hierarchicallystructured surfaces in biology: evolution, structural principles andbiomimetic applications, Philos. Trans. R. Soc., A, 2016, 374, 0191–0231.
[12] Papageorgiou, D. P., Tsougeni, K., Tserepi, A., and Gogolides, E.Superhydrophobic, hierarchical, plasma-nanotextured polymericmicrochannels sustaining high-pressure flows, Microfluid. Nanofluid.,2013, 14, 247–255.
[13] Choi, C.-H., and Kim, C.-J. Large Slip of Aqueous Liquid Flow over aNanoengineered Superhydrophobic Surface, Phys. Rev. Lett., 2006, 96,066001–066004.
[14] Bixler, G. D., and Bhushan, B. Fluid Drag Reduction with Shark-SkinRiblet Inspired Microstructured Surfaces, Adv. Funct. Mater., 2013, 23,4507–4528.
[15] Srinivasan, S., Kleingartner, J. A., Gilbert, J. B., Cohen, R. E., Milne, A.J. B., and McKinley, G. H. Sustainable Drag Reduction in Turbulent Taylor-Couette Flows by Depositing Sprayable Superhydrophobic Surfaces, Phys.
Rev. Lett., 2015, 114, 014501–014505.
128
Bibliography
[16] Bhushan, B., and Jung, Y. C. Natural and biomimetic artificial surfaces forsuperhydrophobicity, self-cleaning, low adhesion, and drag reduction, Prog.
Mater Sci., 2011, 56, 1–108.
[17] Zhang, P., and Lv, F. A review of the recent advances in superhydrophobicsurfaces and the emerging energy-related applications, Energy, 2015, 82,1068–1087.
[18] Yao, X., Song, Y., and Jiang, L. Applications of Bio-Inspired SpecialWettable Surfaces, Adv. Mater., 2011, 23, 719–734.
[19] Gogolides, E., Ellinas, K., and Tserepi, A. Hierarchical micro and nanostructured, hydrophilic, superhydrophobic and superoleophobic surfacesincorporated in microfluidics, microarrays and lab on chip microsystems,Microelectron. Eng., 2015, 132, 135–155.
[20] Sackmann, E. K., Fulton, A. L., and Beebe, D. J. The present and futurerole of microfluidics in biomedical research, Nature, 2014, 507, 181–189.
[21] Eyring, V., Köhler, H. W., van Aardenne, J., and Lauer, A. Emissions frominternational shipping: 1. The last 50 years, J. Geophys. Res., 2005, 110,305–316.
[22] Buhaug, Ø., Corbett, J., Endresen, O., Eyring, V., Faber, J., Hanayama, S.,Lee, D., Lee, D., Lindstad, H., Mjelde, A., Palsson, C., Wanquing, W.,Winebrake, J., and Yoshida, K. Second IMO greenhouse gas study,International Maritime Organization, London, 2009,
[23] Ceccio, S. L. Friction Drag Reduction of External Flows with Bubble andGas Injection, Annu. Rev. Fluid Mech., 2010, 42, 183–203.
[24] Gokcay, S., Insel, M., and Odabasi, A. Revisiting artificial air cavity conceptfor high speed craft, Ocean Eng., 2004, 31, 253–267.
129
Bibliography
[25] Kawaguchi, Y., Segawa, T., Feng, Z., and Li, P. Experimental study ondrag-reducing channel flow with surfactant additives-spatial structure ofturbulence investigated by PIV system, Int. J. Heat Fluid Flow, 2002, 23,700–709.
[26] Golovin, K. B., Gose, J. W., Perlin, M., Ceccio, S. L., and Tuteja, A.Bioinspired surfaces for turbulent drag reduction, Philos. Trans. R. Soc., A,2016, 374, 189–208.
[27] Wang, G., Guo, Z., and Liu, W. Interfacial Effects of SuperhydrophobicPlant Surfaces: A Review, J. Bionic Eng., 2014, 11, 325–345.
[28] Suhr, S. H., Song, Y. S., Lee, S. J., and Sitti, M. Biologically InspiredMiniature Water Strider Robot., Robotics: Science and Systems, 2005; pp.319–326.
[29] Brassard, J.-D., Sarkar, D., and Perron, J. Studies of drag on thenanocomposite superhydrophobic surfaces, Appl. Surf. Sci., 2015, 324,525–531.
[30] Jung, Y. C., and Bhushan, B. Biomimetic structures for fluid drag reductionin laminar and turbulent flows, J. Phys. Condens. Matter, 2010, 22,035104–035112.
[31] Lyu, S., Nguyen, D. C., Kim, D., Hwang, W., and Yoon, B. Experimentaldrag reduction study of super-hydrophobic surface with dual-scalestructures, Appl. Surf. Sci., 2013, 286, 206–211.
[32] Zhang, H., Yin, L., Li, L., Shi, S., Wang, Y., and Liu, X. Wettability anddrag reduction of a superhydrophobic aluminum surface, RSC Adv., 2016,6, 14034–14041.
[33] Ou, J., Perot, B., and Rothstein, J. P. Laminar drag reduction inmicrochannels using ultrahydrophobic surfaces, Phys. Fluids, 2004, 16,4635–4643.
130
Bibliography
[34] Sarver, T., Al-Qaraghuli, A., and Kazmerski, L. L. A comprehensive reviewof the impact of dust on the use of solar energy: History, investigations,results, literature, and mitigation approaches, Renew. Sustain. Energy Rev.,2013, 22, 698–733.
[35] Mani, M., and Pillai, R. Impact of dust on solar photovoltaic (PV)performance: Research status, challenges and recommendations, Renew.
Sustain. Energy Rev., 2010, 14, 3124–3131.
[36] Darwish, Z. A., Kazem, H. A., Sopian, K., Al-Goul, M., and Alawadhi, H.Effect of dust pollutant type on photovoltaic performance, Renew. Sustain.
Energy Rev., 2015, 41, 735–744.
[37] Costa, S. C., Diniz, A. S. A., and Kazmerski, L. L. Dust and soiling issuesand impacts relating to solar energy systems: Literature review update for2012-2015, Renew. Sustain. Energy Rev., 2016, 63, 33–61.
[38] Jamil, W. J., Rahman, H. A., Shaari, S., and Salam, Z. Performancedegradation of photovoltaic power system: Review on mitigation methods,Renew. Sustain. Energy Rev., 2017, 67, 876–891.
[39] Micheli, L., and Muller, M. An investigation of the key parameters forpredicting PV soiling losses, Prog. Photovoltaics Res. Appl., 2017, 25,291–307.
[40] Sayyah, A., Horenstein, M. N., and Mazumder, M. K. Energy yield losscaused by dust deposition on photovoltaic panels, Sol. Energy, 2014, 107,576–604.
[41] Ragesh, P., Anand Ganesh, V., Nair, S. V., and Nair, A. S. A review on’self-cleaning and multifunctional materials’, J. Mater. Chem. A, 2014, 2,14773–14797.
131
Bibliography
[42] Sun, C.-H., Gonzalez, A., Linn, N. C., Jiang, P., and Jiang, B.Templated biomimetic multifunctional coatings, Appl. Phys. Lett., 2008, 92,051107–051109.
[43] Siddique, R. H., Gomard, G., and Hölscher, H. The role of randomnanostructures for the omnidirectional anti-reflection properties of theglasswing butterfly, Nat. Commun., 2015, 6, 6909–6916.
[44] Leem, J. W., Kim, S., Lee, S. H., Rogers, J. A., Kim, E., and Yu, J. S.Efficiency Enhancement of Organic Solar Cells Using HydrophobicAntireflective Inverted Moth-Eye Nanopatterned PDMS Films, Adv. Energy
Mater., 2014, 4, 1301315–1301322.
[45] Palumbo, F., Di Mundo, R., Cappelluti, D., and d’Agostino, R.SuperHydrophobic and SuperHydrophilic Polycarbonate by TailoringChemistry and Nano-texture with Plasma Processing, Plasma Processes
Polym., 2011, 8, 118–126.
[46] Gao, C.-Y., Meng, G.-X., Li, X., Wu, M., Liu, Y., Li, X.-Y., Zhao, X., Lee, I.,and Feng, X. Wettability of dragonfly wings: the structure detection andtheoretical modeling, Surf. Interface Anal., 2013, 45, 650–655.
[47] Meng, L.-Y., and Park, S.-J. Effect of fluorination of carbon nanotubes onsuperhydrophobic properties of fluoro-based films, J. Colloid Interface Sci.,2010, 342, 559–563.
[48] Yu, S., Guo, Z., and Liu, W. Biomimetic transparent and superhydrophobiccoatings: from nature and beyond nature, Chem. Commun., 2015, 51,1775–1794.
[49] Röhrig, M., Schneider, M., Etienne, G., Oulhadj, F., Pfannes, F.,Kolew, A., Worgull, M., and Hölscher, H. Hot pulling and embossing ofhierarchical nano- and micro-structures, J. Micromech. Microeng., 2013, 23,105014–105020.
132
Bibliography
[50] Röhrig, M., Mail, M., Schneider, M., Louvin, H., Hopf, A., Schimmel, T.,Worgull, M., and Hölscher, H. Nanofur for Biomimetic Applications, Adv.
Mater. Interfaces, 2014, 1, 1300083–1300092.
[51] Röhrig, M. Fabrication and analysis of bio-inspired smart surfaces. Ph.D.thesis, Karlsruhe Institute of Technology (KIT), Karlsruhe, 2014; Zugl.:Karlsruhe, KIT, Diss., 2013.
[52] Reiss, H. Warum gibt es Benetzung?, Phys. Unserer Zeit, 1992, 23,204–212.
[53] Young, T. An Essay on the Cohesion of Fluids, Philos. Trans. Roy. Soc.
London, 1805, 95, 65–87.
[54] Quéré, D. Rough ideas on wetting, Physica A, 2002, 313, 32–46.
[55] Roach, P., Shirtcliffe, N. J., and Newton, M. I. Progess in superhydrophobicsurface development, Soft Matter, 2008, 4, 224–240.
[56] Nishino, T., Meguro, M., Nakamae, K., Matsushita, M., and Ueda, Y. TheLowest Surface Free Energy Based on -CF3 Alignment, Langmuir, 1999,15, 4321–4323.
[57] Quéré, D. Wetting and Roughness, Annu. Rev. Mater. Res., 2008, 38, 71–99.
[58] Moulinet, S., and Bartolo, D. Life and death of a fakir droplet: Impalementtransitions on superhydrophobic surfaces, Eur. Phys. J. E: Soft Matter Biol.
Phys., 2007, 24, 251–260.
[59] Gorb, S. N. Functional Surfaces in Biology: Little structures with big
effects; Springer Science & Business Media, 2009; Vol. 1.
[60] Wenzel, R. N. Resistance of solid surfaces to wetting by water, Ind. Eng.
Chem., 1936, 28, 988–994.
[61] Cassie, A. B. D., and Baxter, S. Wettability of porous surfaces, Trans.
Faraday Soc., 1944, 40, 546–551.
133
Bibliography
[62] Marmur, A. Wetting on Hydrophobic Rough Surfaces: To BeHeterogeneous or Not To Be?, Langmuir, 2003, 19, 8343–8348.
[63] Quéré, D. Surface chemistry: Fakir droplets, Nat. Mater., 2002, 1, 14–15.
[64] Callies, M., and Quere, D. On water repellency, Soft Matter, 2005, 1, 55–61.
[65] Webb, H. K., Crawford, R. J., and Ivanova, E. P. Wettability of naturalsuperhydrophobic surfaces, Adv. Colloid Interface Sci., 2014, 210, 58–64.
[66] Quéré, D., Azzopardi, M.-J., and Delattre, L. Drops at Rest on a TiltedPlane, Langmuir, 1998, 14, 2213–2216.
[67] Otten, A., and Herminghaus, S. How Plants Keep Dry: A Physicist’s Pointof View, Langmuir, 2004, 20, 2405–2408.
[68] Solga, A., Cerman, Z., Striffler, B. F., Spaeth, M., and Barthlott, W. Thedream of staying clean: Lotus and biomimetic surfaces, Bioinspiration &
Biomimetics, 2007, 2, S126–S134.
[69] Gao, X., and Jiang, L. Biophysics: water-repellent legs of water striders,Nature, 2004, 432, 36–36.
[70] Barthlott, W.,Wiersch, S., Colic, Z., and Koch, K. Classification of trichometypes within species of the water fern Salvinia , and ontogeny of the egg-beater trichomes, Botany, 2009, 87, 830–836.
[71] Koch, K., and Barthlott, W. Superhydrophobic and superhydrophilic plantsurfaces: an inspiration for biomimetic materials, Philos. Trans. R. Soc., A,2009, 367, 1487–1509.
[72] Vüllers, F., Gomard, G., Preinfalk, J. B., Klampaftis, E., Worgull, M.,Richards, B., Hölscher, H., and Kavalenka, M. N. BioinspiredSuperhydrophobic Highly Transmissive Films for Optical Applications,Small, 2016, 12, 6144–6152.
134
Bibliography
[73] Hemeda, A. A., and Tafreshi, H. V. General Formulations for PredictingLongevity of Submerged Superhydrophobic Surfaces Composed of Poresor Posts, Langmuir, 2014, 30, 10317–10327.
[74] Zheng, Q.-S., Yu, Y., and Zhao, Z.-H. Effects of Hydraulic Pressure on theStability and Transition of Wetting Modes of Superhydrophobic Surfaces,Langmuir, 2005, 21, 12207–12212.
[75] Xue, Y., Chu, S., Lv, P., and Duan, H. Importance of Hierarchical Structuresin Wetting Stability on Submersed Superhydrophobic Surfaces, Langmuir,2012, 28, 9440–9450.
[76] Bormashenko, E. Progress in understanding wetting transitions on roughsurfaces, Adv. Colloid Interface Sci., 2015, 222, 92–103, Reinhard Miller,Honorary Issue.
[77] Amabili, M., Giacomello, A., Meloni, S., and Casciola, C. M. Collapse ofsuperhydrophobicity on nanopillared surfaces, Phys. Rev. Fluids, 2017, 2,034202–034217.
[78] Kavalenka, M. N., Vüllers, F., Kumberg, J., Zeiger, C., Trouillet, V.,Stein, S., Ava, T. T., Li, C., Worgull, M., and Hölscher, H. Adaptablebioinspired special wetting surface for multifunctional oil/water separation,Sci. Rep., 2017, 7, 39970–39979.
[79] Domininghaus, H. Kunststoffe: Eigenschaften und Anwendungen; Springer-Verlag, 2007.
[80] Covestro, Datasheet: Makrolon LED2045, www.plastics.covestro.com,(2017), accessed: 20. February 2018.
[81] Kavalenka, M. N., Vüllers, F., Lischker, S., Zeiger, C., Hopf, A., Röhrig, M.,Rapp, B. E., Worgull, M., and Hölscher, H. Bioinspired Air-RetainingNanofur for Drag Reduction, ACS Appl. Mater. Interfaces, 2015, 7,10651–10655.
135
Bibliography
[82] Material Data Center, Polymerstoffdatenbank,www.materialdatacenter.com, (2018), accessed: 01. January 2018.
[83] Kolew, A.Heißprägen von Verbundfolien für mikrofluidische Anwendungen;Schriften des Instituts für Mikrostrukturtechnik am Karlsruher Institut fürTechnologie (KIT).: Institut für Mikrostrukturtechnik; KIT Scientific Publ.,2012.
[84] Greer, A. I. M., Vasiev, I., Della-Rosa, B., and Gadegaard, N. Fluorinatedethylene-propylene: a complementary alternative to PDMS for nanoimprintstamps, Nanotechnology, 2016, 27, 155301–155308.
[85] The Chemours Company, Teflon FEP Fluoroplastic Film,www.chemours.com, accessed: 09. January 2018.
[86] Flisom Flexible Solar Modules, www.flisom.com/wp-content/uploads/2017/08/Datasheet_eFlex_3.1m.pdf, accessed: 09. January 2018.
[87] Kotz, F., Arnold, K., Bauer, W., Schild, D., Keller, N., Sachsenheimer, K.,Nargang, T. M., Richter, C., Helmer, D., and Rapp, B. E. Three-dimensionalprinting of transparent fused silica glass, Nature, 2017, 544, 337–342.
[88] Kim, S. H., Lee, K.-D., Kim, J.-Y., Kwon, M.-K., and Park, S.-J. Fabricationof photonic crystal structures on light emitting diodes by nanoimprintlithography, Nanotechnology, 2007, 18, 055306–055310.
[89] Kouba, J., Kubenz, M., Mai, A., Ropers, G., Eberhardt, W., and Loechel, B.Fabrication of Nanoimprint stamps for photonic crystals, J. Phys. Conf.
Ser., 2006, 34, 897–903.
[90] Worgull, M. Hot embossing: theory and technology of microreplication;William Andrew, 2009.
[91] Schroers, J., Pham, Q., and Desai, A. Thermoplastic Forming of BulkMetallic Glass mdash; A Technology for MEMS and MicrostructureFabrication, J. Microelectromech. Syst., 2007, 16, 240–247.
136
Bibliography
[92] Kavalenka, M. N., Hopf, A., Schneider, M., Worgull, M., andHolscher, H. Wood-based microhaired superhydrophobic and underwatersuperoleophobic surfaces for oil/water separation, RSC Adv., 2014, 4,31079–31083.
[93] Berliner, E. Process of producing records of sound. 1888.
[94] Heidari, B., Maximov, I., and Montelius, L. Nanoimprint lithographyat the 6 in. wafer scale, Journal of Vacuum Science & Technology B:
Microelectronics and Nanometer Structures Processing, Measurement, and
Phenomena, 2000, 18, 3557–3560.
[95] Koesdjojo, M. T., Tennico, Y. H., and Remcho, V. T. Fabrication of aMicrofluidic System for Capillary Electrophoresis Using a Two-StageEmbossing Technique and Solvent Welding on Poly(methyl methacrylate)with Water as a Sacrificial Layer, Anal. Chem., 2008, 80, 2311–2318.
[96] Ulrich, R., Weber, H. P., Chandross, E. A., Tomlinson, W. J., andFranke, E. A. Embossed Optical Waveguides, Appl. Phys. Lett., 1972, 20,213–215.
[97] Seekamp, J., Zankovych, S., Helfer, A. H., Maury, P., Torres, C. M. S.,Böttger, G., Liguda, C., Eich, M., Heidari, B.,Montelius, L., and Ahopelto, J.Nanoimprinted passive optical devices, Nanotechnology, 2002, 13,581–586.
[98] Kricka, L. J., Fortina, P., Panaro, N. J., Wilding, P., Alonso-Amigo, G., andBecker, H. Fabrication of plastic microchips by hot embossing, Lab Chip,2002, 2, 1–4.
[99] Ehrenstein, G. W. Polymer-Werkstoffe: Struktur, Eigenschaften, Anwendung,3rd ed.; Carl Hanser: München, 2011.
[100] Heckele, M., and Schomburg, W. K. Review on micro molding ofthermoplastic polymers, J. Micromech. Microeng., 2004, 14, R1–R14.
137
Bibliography
[101] Mappes, T., Worgull, M., Heckele, M., and Mohr, J. Submicron polymerstructures with X-ray lithography and hot embossing, Microsyst. Technol.,2008, 14, 1721–1725.
[102] Köhler, M. Nanotechnologie; Wiley-VCH Verlag GmbH & Co. KGaA,2005; pp. 37–99.
[103] Gatzen, H. H., Saile, V., and Leuthold, J. Micro and nano fabrication: tools
and processes; Springer, 2015.
[104] Franz, G. Niederdruckplasmen und Mikrostrukturtechnik; Springer-Verlag,2013.
[105] Law, K.-Y. In Surface Wetting : Characterization, Contact Angle, and
Fundamentals, 1st ed.; Zhao, H., Ed.; SpringerLink : Bücher; Springer:Cham, 2016.
[106] Lander, L. M., Siewierski, L. M., Brittain, W. J., and Vogler, E. A. Asystematic comparison of contact angle methods, Langmuir, 1993, 9,2237–2239.
[107] Krishnan, A., Liu, Y.-H., Cha, P.,Woodward, R., Allara, D., and Vogler, E. A.An evaluation of methods for contact angle measurement, Colloids Surf., B,2005, 43, 95–98.
[108] Hisler, V., Jendoubi, H., Hairaye, C., Vonna, L., Le Houérou, V.,Mermet, F., Nardin, M., and Haidara, H. Tensiometric Characterizationof Superhydrophobic Surfaces As Compared to the Sessile and BouncingDrop Methods, Langmuir, 2016, 32, 7765–7773.
[109] Smestad, G. P. Optoelectronics of solar cells; Spie Press, 2002; Vol. 115.
[110] http://dx.doi.org/10.1520/G0173-03R12, ASTM Standard G173-03 "Tables for Reference Solar Spectral Irradiances: Direct Normal andHemispherical on 37◦ Tilted Surface." DOI: 10.1520/g0173-03r12.
138
Bibliography
[111] Xue, Y., Lv, P., Lin, H., and Duan, H. Underwater superhydrophobicity:stability, design and regulation, and applications, Appl. Mech. Rev., 2016,68, 030803–030841.
[112] Song, W., Veiga, D. D., Custódio, C. A., and Mano, J. a. F. BioinspiredDegradable Substrates with Extreme Wettability Properties, Adv. Mater.,2009, 21, 1830–1834.
[113] Kim, T.-H., Ha, S.-H., Jang, N.-S., Kim, J., Kim, J. H., Park, J.-K.,Lee, D.-W., Lee, J., Kim, S.-H., and Kim, J.-M. Simple and Cost-EffectiveFabrication of Highly Flexible, Transparent Superhydrophobic Filmswith Hierarchical Surface Design, ACS Appl. Mater. Interfaces, 2015, 7,5289–5295.
[114] Ditsche, P., Gorb, E., Mayser, M., Gorb, S., Schimmel, T., and Barthlott, W.Elasticity of the hair cover in air-retaining Salvinia surfaces, Appl. Phys. A,2015, 121, 505–511.
[115] Lee, J., Majidi, C., Schubert, B., and Fearing, R. S. Sliding-inducedadhesion of stiff polymer microfibre arrays. I. Macroscale behaviour,Journal of The Royal Society Interface, 2008, 5, 835–844.
[116] Kustandi, T. S., Samper, V. D., Ng, W. S., Chong, A. S., and Gao, H.Fabrication of a gecko-like hierarchical fibril array using a bonded porousalumina template, J. Micromech. Microeng., 2007, 17, N75–N81.
[117] Bliedtner, J., Müller, H., and Barz, A. Lasermaterialbearbeitung:
Grundlagen - Verfahren - Anwendungen - Beispiele; Carl Hanser VerlagGmbH & Company KG, 2013.
[118] Kumberg, J. Trennung von Öl/Wasser-Gemischen mit porösem,biomimetischem Nanopelz. M.Sc. thesis, Karlsruhe Institute of Technology(KIT), 2015.
139
Bibliography
[119] Zeiger, C., Kumberg, J., Vüllers, F., Worgull, M., Hölscher, H., andKavalenka, M. N. Selective filtration of oil/water mixtures with bioinspiredporous membranes, RSC Adv., 2017, 7, 32806–32811.
[120] Vüllers, F., Fritz, B., Roslizar, A., Striegel, A., Guttmann, M.,Richards, B. S., Hölscher, H., Gomard, G., Klampaftis, E., andKavalenka, M. N. Self-Cleaning Microcavity Array for PhotovoltaicModules, ACS Appl. Mater. Interfaces, 2018, 10, 2929–2936.
[121] Leach, R., Giusca, C., Guttmann, M., Jakobs, P.-J., and Rubert, P.Development of low-cost material measures for calibration of themetrological characteristics of areal surface texture instruments, CIRP Ann.,2015, 64, 545–548.
[122] Schanz, G., and Bade, K. Microelectroforming of metals,Microengineering
of Metals and Ceramics Part II: Special Replication Techniques,
Automation and Properties, 2005, 395–420.
[123] Scarratt, L. R. J., Hoatson, B. S., Wood, E. S., Hawkett, B. S., and Neto, C.Durable Superhydrophobic Surfaces via Spontaneous Wrinkling of TeflonAF, ACS Appl. Mater. Interfaces, 2016, 8, 6743–6750.
[124] Ishino, C., Reyssat, M., Reyssat, E., Okumura, K., and Quéré, D. Wickingwithin forests of micropillars, EPL (Europhysics Letters), 2007, 79,56005–56009.
[125] Kronast, M. Nanofur Funtionalization for Increased Air Retention Stabilityunder Hydrostatic Pressure Fluctuations. M.Sc. thesis, Karlsruhe Instituteof Technology (KIT), 2017.
[126] Yong, J., Yang, Q., Chen, F., Bian, H., Du, G., Farooq, U., and Hou, X.Reversible Underwater Lossless Oil Droplet Transportation, Adv. Mater.
Interfaces, 2015, 2, 1400388–1400393.
140
Bibliography
[127] Wu, D., Wu, S.-z., Chen, Q.-D., Zhao, S., Zhang, H., Jiao, J., Piersol, J. A.,Wang, J.-N., Sun, H.-B., and Jiang, L. Facile creation of hierarchical PDMSmicrostructures with extreme underwater superoleophobicity for anti-oilapplication in microfluidic channels, Lab Chip, 2011, 11, 3873–3879.
[128] Oliveira, N. M., Reis, R. L., and Mano, J. F. Superhydrophobic SurfacesEngineered Using Diatomaceous Earth, ACS Appl. Mater. Interfaces, 2013,5, 4202–4208.
[129] Chen, F., Liu, J., Cui, Y., Huang, S., Song, J., Sun, J., Xu, W., and Liu, X.Stability of plasma treated superhydrophobic surfaces under differentambient conditions, J. Colloid Interface Sci., 2016, 470, 221–228.
[130] Yong, J., Chen, F., Yang, Q., Du, G., Shan, C., Bian, H., Farooq, U., andHou, X. Bioinspired transparent underwater superoleophobic and anti-oilsurfaces, J. Mater. Chem. A, 2015, 3, 9379–9384.
[131] Mortazavi, M., and Nosonovsky, M. A model for diffusion-drivenhydrophobic recovery in plasma treated polymers, Appl. Surf. Sci., 2012,258, 6876–6883.
[132] Bormashenko, E., Chaniel, G., and Grynyov, R. Towards understandinghydrophobic recovery of plasma treated polymers: Storing in high polarityliquids suppresses hydrophobic recovery, Appl. Surf. Sci., 2013, 273,549–553.
[133] Vogler, E. A. Structure and reactivity of water at biomaterial surfaces, Adv.
Colloid Interface Sci., 1998, 74, 69–117.
[134] Balmert, A., Bohn, H. F., Ditsche-Kuru, P., and Barthlott, W. Dry underwater: Comparative morphology and functional aspects of air-retaininginsect surfaces, J. Morphol., 2011, 272, 442–451.
141
Bibliography
[135] McHale, G., Newton, M. I., and Shirtcliffe, N. J. Immersedsuperhydrophobic surfaces: Gas exchange, slip and drag reductionproperties, Soft Matter, 2010, 6, 714–719.
[136] Carlborg, C. F., and van der Wijngaart, W. Sustained SuperhydrophobicFriction Reduction at High Liquid Pressures and Large Flows, Langmuir,2011, 27, 487–493.
[137] Vüllers, F., Germain, Y., Petit, L.-M., Hölscher, H., and Kavalenka, M. N.Pressure-Stable Air-Retaining Nanostructured Surfaces Inspired by NaturalAir Plastrons, Adv. Mater. Interfaces, 2018, 5, 1800125–1800132.
[138] Kong, L., Chen, X., Yang, G., Yu, L., and Zhang, P. Preparation andcharacterization of slice-like Cu2(OH)3NO3 superhydrophobic structureon copper foil, Appl. Surf. Sci., 2008, 254, 7255–7258.
[139] Liu, T. L., and Kim, C.-J. Turning a surface superrepellent even tocompletely wetting liquids, Science, 2014, 346, 1096–1100.
[140] Sheng, X., and Zhang, J. Air layer on superhydrophobic surface underwater,Colloids Surf., A, 2011, 377, 374–378.
[141] Pedersen, O., and Colmer, T. D. Physical gills prevent drowning of manywetland insects, spiders and plants, J. Exp. Biol., 2012, 215, 705–709.
[142] Samaha, M. A., Ochanda, F. O., Tafreshi, H. V., Tepper, G. C., andel Hak, M. G. In situ, noninvasive characterization of superhydrophobiccoatings, Rev. Sci. Instrum., 2011, 82, 045109–045115.
[143] Samaha, M. A., Tafreshi, H. V., and el Hak, M. G. Sustainabilityof superhydrophobicity under pressure, Phys. Fluids, 2012, 24,112103–112111.
[144] Bobji, M. S., Kumar, S. V., Asthana, A., and Govardhan, R. N. UnderwaterSustainability of the "Cassie" State of Wetting, Langmuir, 2009, 25,12120–12126.
142
Bibliography
[145] Poetes, R., Holtzmann, K., Franze, K., and Steiner, U. MetastableUnderwater Superhydrophobicity, Phys. Rev. Lett., 2010, 105,166104–166107.
[146] Lv, P., Xue, Y., Shi, Y., Lin, H., and Duan, H. Metastable States and WettingTransition of Submerged Superhydrophobic Structures, Phys. Rev. Lett.,2014, 112, 196101–196105.
[147] Søgaard, E., Andersen, N. K., Smistrup, K., Larsen, S. T., Sun, L., andTaboryski, R. Study of Transitions between Wetting States on MicrocavityArrays by Optical Transmission Microscopy, Langmuir, 2014, 30,12960–12968.
[148] Dilip, D., Jha, N. K., Govardhan, R. N., and Bobji, M. Controlling airsolubility to maintain "Cassie" state for sustained drag reduction, Colloids
Surf., A, 2014, 459, 217–224.
[149] Kim, J.-H., and Rothstein, J. P. Delayed lubricant depletion on liquid-infused randomly rough surfaces, Exp. Fluids, 2016, 57, 81–89.
[150] Wang, J., Wang, B., and Chen, D. Underwater drag reduction by gas,Friction, 2014, 2, 295–309.
[151] Emami, B., Hemeda, A. A., Amrei, M. M., Luzar, A., el Hak, M. G.,and Tafreshi, H. V. Predicting longevity of submerged superhydrophobicsurfaces with parallel grooves, Phys. Fluids, 2013, 25, 062108–062124.
[152] Lee, C., Choi, C.-H., and Kim, C.-J. Superhydrophobic drag reduction inlaminar flows: a critical review, Exp. Fluids, 2016, 57, 176–195.
[153] Checco, A., Ocko, B. M., Rahman, A., Black, C. T., Tasinkevych, M.,Giacomello, A., and Dietrich, S. Collapse and Reversibility of theSuperhydrophobic State on Nanotextured Surfaces, Phys. Rev. Lett., 2014,112, 216101–216105.
143
Bibliography
[154] Voinov, O. V. Hydrodynamics of wetting, Fluid Dyn., 1976, 11, 714–721.
[155] Cox, R. G. The dynamics of the spreading of liquids on a solid surface. Part1. Viscous flow, J. Fluid Mech., 1986, 168, 169–194.
[156] Kim, J.-H., Kavehpour, H. P., and Rothstein, J. P. Dynamic contact anglemeasurements on superhydrophobic surfaces, Phys. Fluids, 2015, 27,032107.
[157] Lhermerout, R., Perrin, H., Rolley, E., Andreotti, B., and Davitt, K. Amoving contact line as a rheometer for nanometric interfacial layers, Nat.
Commun., 2016, 7, 12545–12550.
[158] Lee, T., Charrault, E., and Neto, C. Interfacial slip on rough, patternedand soft surfaces: A review of experiments and simulations, Adv. Colloid
Interface Sci., 2014, 210, 21–38.
[159] Bocquet, L., and Charlaix, E. Nanofluidics, from bulk to interfaces, Chem.
Soc. Rev., 2010, 39, 1073–1095.
[160] Bixler, G. D., and Bhushan, B. Biofouling: lessons from nature, Philos.
Trans. R. Soc., A, 2012, 370, 2381–2417.
[161] Callow, M. E., Jennings, A. R., Brennan, A. B., Seegert, C. E., Gibson, A.,Wilson, L., Feinberg, A., Baney, R., and Callow, J. A. MicrotopographicCues for Settlement of Zoospores of the Green Fouling Alga Enteromorpha,Biofouling, 2002, 18, 229–236.
[162] Zhang, X., Wang, L., and Levanen, E. Superhydrophobic surfaces for thereduction of bacterial adhesion, RSC Adv., 2013, 3, 12003–12020.
[163] Privett, B. J., Youn, J., Hong, S. A., Lee, J., Han, J., Shin, J. H.,and Schoenfisch, M. H. Antibacterial Fluorinated Silica ColloidSuperhydrophobic Surfaces, Langmuir, 2011, 27, 9597–9601.
144
Bibliography
[164] Simpson, J. T., Hunter, S. R., and Aytug, T. Superhydrophobic materialsand coatings: a review, Rep. Prog. Phys., 2015, 78, 086501–086514.
[165] Anselme, K., Davidson, P., Popa, A., Giazzon, M., Liley, M., and Ploux, L.The interaction of cells and bacteria with surfaces structured at thenanometre scale, Acta Biomater., 2010, 6, 3824–3846.
[166] Epstein, A. K., Hong, D., Kim, P., and Aizenberg, J. Biofilm attachmentreduction on bioinspired, dynamic, micro-wrinkling surfaces, New J. Phys.,2013, 15, 095018–095030.
[167] Koch, K., Bhushan, B., and Barthlott, W. Multifunctional surface structuresof plants: An inspiration for biomimetics, Prog. Mater Sci., 2009, 54,137–178.
[168] Fürstner, R., , Barthlott, W., Neinhuis, C., and Walzel, P. Wetting and Self-Cleaning Properties of Artificial Superhydrophobic Surfaces, Langmuir,2005, 21, 956–961.
[169] Bhushan, B. Biomimetics - Bioinspired Hierarchical-Structured Surfaces
for Green Science and Technology, 2nd ed.; Springer InternationalPublishing, 2016.
[170] Lai, Y., Huang, J., Cui, Z., Ge, M., Zhang, K.-Q., Chen, Z., and Chi, L.Recent Advances in TiO2-Based Nanostructured Surfaces with ControllableWettability and Adhesion, Small, 2016, 12, 2203–2224.
[171] Hecht, E. Optik, 5th ed.; Oldenbourg: München, 2009.
[172] Smith, R. C., and Baker, K. S. Optical properties of the clearest naturalwaters (200–800 nm), Appl. Opt., 1981, 20, 177–184.
[173] Hünig, R., Mertens, A., Stephan, M., Schulz, A., Richter, B., Hetterich, M.,Powalla, M., Lemmer, U., Colsmann, A., and Gomard, G. Flower Power:Exploiting Plants’ Epidermal Structures for Enhanced Light Harvesting inThin-Film Solar Cells, Adv. Opt. Mater., 2016, 1487–1493.
145
Bibliography
[174] Giannini, A. In Sustainable Indoor Lighting; Sansoni, P., Mercatelli, L.,and Farini, A., Eds.; Springer London: London, 2015; Chapter Radiometricand Photometric Quantities and Laws, pp 1–22.
[175] Möller, S., and Forrest, S. R. Improved light out-coupling in organic lightemitting diodes employing ordered microlens arrays, J. Appl. Phys., 2002,91, 3324–3327.
[176] Saxena, K., Jain, V., and Mehta, D. S. A review on the light extractiontechniques in organic electroluminescent devices, Opt. Mater., 2009, 32,221–233.
[177] Wrzesniewski, E., Eom, S.-H., Cao, W., Hammond, W. T., Lee, S.,Douglas, E. P., and Xue, J. Enhancing Light Extraction in Top-EmittingOrganic Light-Emitting Devices Using Molded Transparent PolymerMicrolens Arrays, Small, 2012, 8, 2647–2651.
[178] Migahed, M., and Zidan, H. Influence of UV-irradiation on the structureand optical properties of polycarbonate films, Curr. Appl Phys., 2006, 6,91–96.
[179] Fritz, B., Hünig, R., Schmager, R., Hetterich, M., Lemmer, U., andGomard, G. Assessing the influence of structural disorder on the plantepidermal cells optical properties: a numerical analysis, Bioinspir. Biomim.,2017, 12, 036011–036020.
[180] Huld, T., Šúri, M., and Dunlop, E. D. Comparison of potential solarelectricity output from fixed-inclined and two-axis tracking photovoltaicmodules in Europe, Prog. Photovoltaics Res. Appl., 2008, 16, 47–59.
[181] Šúri, M., Huld, T. A., Dunlop, E. D., and Ossenbrink, H. A. Potentialof solar electricity generation in the European Union member states andcandidate countries, Sol. Energy, 2007, 81, 1295–1305.
146
Bibliography
[182] Jung, Y. C., and Bhushan, B. Dynamic Effects of Bouncing Water Dropletson Superhydrophobic Surfaces, Langmuir, 2008, 24, 6262–6269.
[183] Tsai, P., Pacheco, S., Pirat, C., Lefferts, L., and Lohse, D. Drop Impactupon Micro- and Nanostructured Superhydrophobic Surfaces, Langmuir,2009, 25, 12293–12298.
[184] Bartolo, D., Bouamrirene, F., Verneuil, E., Buguin, A., Silberzan, P., andMoulinet, S. Bouncing or sticky droplets: Impalement transitions onsuperhydrophobic micropatterned surfaces, EPL (Europhysics Letters),2006, 74, 299–305.
[185] Reyssat, M., Pépin, A., Marty, F., Chen, Y., and Quéré, D. Bouncingtransitions on microtextured materials, EPL (Europhysics Letters), 2006,74, 306–312.
[186] Pye, K. Aeolian dust and dust deposits; Elsevier, 2015.
[187] Itani, G. N., and Smith, C. A. Dust rains deliver diverse assemblagesof microorganisms to the Eastern Mediterranean, Sci. Rep., 2016, 6,22657–22667.
[188] Byers, H. R. General meteorology; McGraw-Hill, 1959.
[189] Luo, W., Khoo, Y. S., Hacke, P., Naumann, V., Lausch, D., Harvey, S. P.,Singh, J. P., Chai, J.,Wang, Y., Aberle, A. G., and Ramakrishna, S. Potential-induced degradation in photovoltaic modules: a critical review, Energy
Environ. Sci., 2017, 10, 43–68.
147

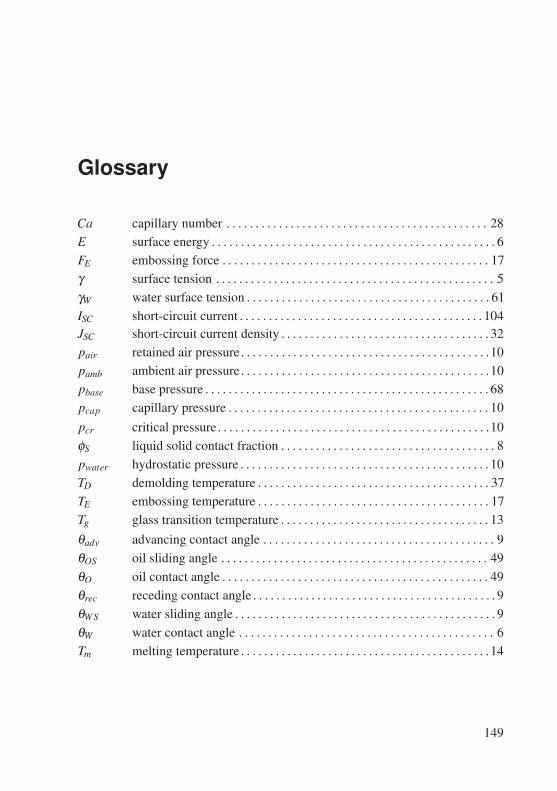
Glossary
Ca capillary number . . . . . . . . . . . . . . . . . . . . . . . . . . . . . . . . . . . . . . . . . . . . . 28E surface energy . . . . . . . . . . . . . . . . . . . . . . . . . . . . . . . . . . . . . . . . . . . . . . . . . 6FE embossing force . . . . . . . . . . . . . . . . . . . . . . . . . . . . . . . . . . . . . . . . . . . . . . 17γ surface tension . . . . . . . . . . . . . . . . . . . . . . . . . . . . . . . . . . . . . . . . . . . . . . . . 5γW water surface tension . . . . . . . . . . . . . . . . . . . . . . . . . . . . . . . . . . . . . . . . . . 61ISC short-circuit current . . . . . . . . . . . . . . . . . . . . . . . . . . . . . . . . . . . . . . . . . . 104JSC short-circuit current density . . . . . . . . . . . . . . . . . . . . . . . . . . . . . . . . . . . . 32pair retained air pressure . . . . . . . . . . . . . . . . . . . . . . . . . . . . . . . . . . . . . . . . . . .10pamb ambient air pressure. . . . . . . . . . . . . . . . . . . . . . . . . . . . . . . . . . . . . . . . . . .10pbase base pressure . . . . . . . . . . . . . . . . . . . . . . . . . . . . . . . . . . . . . . . . . . . . . . . . . 68pcap capillary pressure . . . . . . . . . . . . . . . . . . . . . . . . . . . . . . . . . . . . . . . . . . . . . 10pcr critical pressure. . . . . . . . . . . . . . . . . . . . . . . . . . . . . . . . . . . . . . . . . . . . . . .10φS liquid solid contact fraction . . . . . . . . . . . . . . . . . . . . . . . . . . . . . . . . . . . . . 8pwater hydrostatic pressure . . . . . . . . . . . . . . . . . . . . . . . . . . . . . . . . . . . . . . . . . . . 10TD demolding temperature . . . . . . . . . . . . . . . . . . . . . . . . . . . . . . . . . . . . . . . . 37TE embossing temperature . . . . . . . . . . . . . . . . . . . . . . . . . . . . . . . . . . . . . . . . 17Tg glass transition temperature . . . . . . . . . . . . . . . . . . . . . . . . . . . . . . . . . . . . 13θadv advancing contact angle . . . . . . . . . . . . . . . . . . . . . . . . . . . . . . . . . . . . . . . . 9θOS oil sliding angle . . . . . . . . . . . . . . . . . . . . . . . . . . . . . . . . . . . . . . . . . . . . . . 49θO oil contact angle . . . . . . . . . . . . . . . . . . . . . . . . . . . . . . . . . . . . . . . . . . . . . . 49θrec receding contact angle . . . . . . . . . . . . . . . . . . . . . . . . . . . . . . . . . . . . . . . . . . 9θWS water sliding angle . . . . . . . . . . . . . . . . . . . . . . . . . . . . . . . . . . . . . . . . . . . . . 9θW water contact angle . . . . . . . . . . . . . . . . . . . . . . . . . . . . . . . . . . . . . . . . . . . . 6Tm melting temperature . . . . . . . . . . . . . . . . . . . . . . . . . . . . . . . . . . . . . . . . . . . 14
149

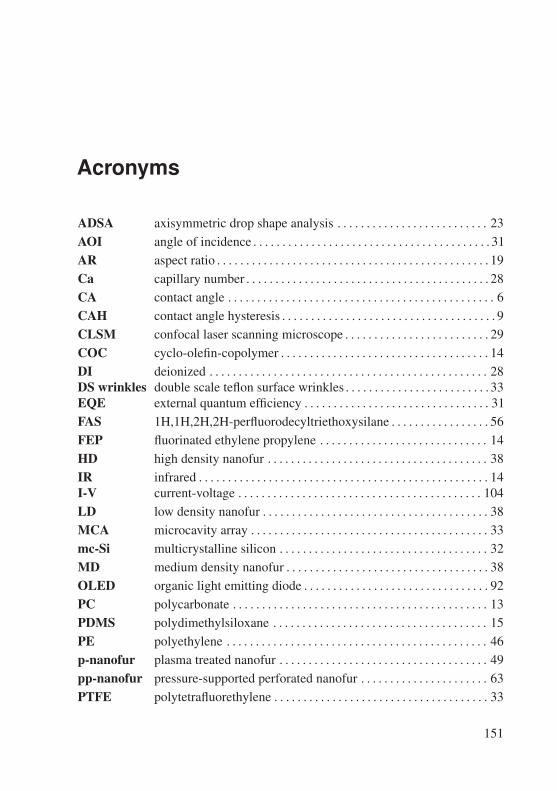
Acronyms
ADSA axisymmetric drop shape analysis . . . . . . . . . . . . . . . . . . . . . . . . . . 23AOI angle of incidence . . . . . . . . . . . . . . . . . . . . . . . . . . . . . . . . . . . . . . . . . 31AR aspect ratio . . . . . . . . . . . . . . . . . . . . . . . . . . . . . . . . . . . . . . . . . . . . . . . 19Ca capillary number . . . . . . . . . . . . . . . . . . . . . . . . . . . . . . . . . . . . . . . . . . 28CA contact angle . . . . . . . . . . . . . . . . . . . . . . . . . . . . . . . . . . . . . . . . . . . . . . 6CAH contact angle hysteresis . . . . . . . . . . . . . . . . . . . . . . . . . . . . . . . . . . . . . 9CLSM confocal laser scanning microscope . . . . . . . . . . . . . . . . . . . . . . . . . 29COC cyclo-olefin-copolymer . . . . . . . . . . . . . . . . . . . . . . . . . . . . . . . . . . . . 14DI deionized . . . . . . . . . . . . . . . . . . . . . . . . . . . . . . . . . . . . . . . . . . . . . . . . 28DS wrinkles double scale teflon surface wrinkles . . . . . . . . . . . . . . . . . . . . . . . . . 33EQE external quantum efficiency . . . . . . . . . . . . . . . . . . . . . . . . . . . . . . . . 31FAS 1H,1H,2H,2H-perfluorodecyltriethoxysilane . . . . . . . . . . . . . . . . . 56FEP fluorinated ethylene propylene . . . . . . . . . . . . . . . . . . . . . . . . . . . . . 14HD high density nanofur . . . . . . . . . . . . . . . . . . . . . . . . . . . . . . . . . . . . . . 38IR infrared . . . . . . . . . . . . . . . . . . . . . . . . . . . . . . . . . . . . . . . . . . . . . . . . . . 14I-V current-voltage . . . . . . . . . . . . . . . . . . . . . . . . . . . . . . . . . . . . . . . . . . 104LD low density nanofur . . . . . . . . . . . . . . . . . . . . . . . . . . . . . . . . . . . . . . . 38MCA microcavity array . . . . . . . . . . . . . . . . . . . . . . . . . . . . . . . . . . . . . . . . . 33mc-Si multicrystalline silicon . . . . . . . . . . . . . . . . . . . . . . . . . . . . . . . . . . . . 32MD medium density nanofur . . . . . . . . . . . . . . . . . . . . . . . . . . . . . . . . . . . 38OLED organic light emitting diode . . . . . . . . . . . . . . . . . . . . . . . . . . . . . . . . 92PC polycarbonate . . . . . . . . . . . . . . . . . . . . . . . . . . . . . . . . . . . . . . . . . . . . 13PDMS polydimethylsiloxane . . . . . . . . . . . . . . . . . . . . . . . . . . . . . . . . . . . . . 15PE polyethylene . . . . . . . . . . . . . . . . . . . . . . . . . . . . . . . . . . . . . . . . . . . . . 46p-nanofur plasma treated nanofur . . . . . . . . . . . . . . . . . . . . . . . . . . . . . . . . . . . . 49pp-nanofur pressure-supported perforated nanofur . . . . . . . . . . . . . . . . . . . . . . 63PTFE polytetrafluorethylene . . . . . . . . . . . . . . . . . . . . . . . . . . . . . . . . . . . . . 33
151

Acronyms
PV photovoltaic . . . . . . . . . . . . . . . . . . . . . . . . . . . . . . . . . . . . . . . . . . . . . . . 2SEM scanning electron microscope . . . . . . . . . . . . . . . . . . . . . . . . . . . . . . 21UV ultraviolet . . . . . . . . . . . . . . . . . . . . . . . . . . . . . . . . . . . . . . . . . . . . . . . . 15
152
Acknowledgement
This work would not have been possible without the assistance and support fromnumerous people. All the effort, workforce, experience and support extendedtowards accomplishing this thesis is highly appreciated. I therefore hope that allthe aid and support is completely and justly recognized in the following withoutleaving anyone unmentioned.First of all, I would like to thank my supervisor Dr. Hendrik Hölscher for providingme with the opportunity to pursue my Ph.D. thesis. Thank you for guiding methroughout the work and always providing advice, while also giving me thepossibility to follow my own ideas and grow in the process.Next, I would like to thank Prof. Bettina Frohnapfel and Prof. Chiara Neto for,without hesitation, taking upon them the tasks and responsibilities that come alongwith being co-referees to my thesis.Tremendous thanks goes to Maryna Kavalenka, for her excellent supervision,endless support and assistance during the work. Thank you for listening to all theproblems and issues and providing a bountiful of advice on how to overcome allthe obstacles I encountered during my Ph.D.A special thanks goes to the Landesgraduiertenförderung and the German AcademicExchange Service (DAAD) for funding the research project as well as a researchstay in Sydney. From the University of Sydney I want to thank the Neto researchgroup for heartily welcoming me, despite my sore lack of proper chemistryknowledge. Special thanks goes to Sam Peppou-Chapman and Liam Scarratt, who,besides discussing scientific ideas and always lending a helping hand in the lab,also assisted with all the small things necessary for making my stay in Sydney anunforgettable time.
153
Acknowledgement
Thanks is also owed to the students I had the pleasure to supervise and work with,namely Yann Germain, Meike Kronast, Luce-Marie Petit and Pooja Thakkar. Aspecial thanks also goes to Benjamin Fritz and Guillaume Gomard from the LightTechnology Institute (LTI) for the productive and easy cooperation. Moreover, Iwould like to thank the whole staff at IMT for on-going support, advice, tips andtricks, without which, many things would have been impossible. To just name afew: Alexandra Moritz and her workshop team; Dr. Uwe Köhler and the cleanroom team; Dr. Matthias Worgull, Marc Schneider and Andreas Striegel for thenever ending and fast support with everything related to hot embossing; HolgerMoritz, Siegfrid Roth, Mr. and Mrs. Klein and Nina Giraud for tackling all thenon-scientific related problems and issues that accompany a Ph.D. project.Also thank you to my office mates Randy Fechner, Christian Lutz, Tobias Förtschand Florian Brüderlin. Thank you for the fun talks (scientific or not), discussionsabout proper labeling of axis, rage induced outbursts about things that didn’t workand all the other things, which made the office a good natured environment.I am thankful for all the friends, that made my Ph.D. an unforgettable, exciting andenjoyable adventure. Frederik Kotz for our weekly rounds of jogging around thecampus, which not only kept us moving but also provided much needed time tovent frustration and go on rants about diverse topics. Andreas Striegel for ensuringthat not everything is taken too seriously and that there is always some humor leftin sticky situations. Senta Schauer for providing comic relief and being both anally and the occasional spy. Richard Thelen for being the good natured, optimisticperson he is, who always sees and points out the silver lining. Moreover, I wantto thank all the other Ph.D. students, Post-Docs and alumni for always providingsupport, insightful discussions and the occasional after work drink. A heartfeltthank you goes to Markus and Andrea Gudernatsch and of course their children,who made these last years more enjoyable through shared dinners, weekend tripsand the occasional drink.A special thanks goes to my wife Jutta Vüllers. Dear Jutta, I cannot begin todescribe how thankful I am for all the things you have done for me. I am especiallythankful for your unwavering support, motivation and encouragement during these
154

Acknowledgement
last few months and through every decision I made. You endured every mood orindecision on my part without ever faltering and still found the strength and rightwords to cheer me back up.Finally, I want to thank my family. First and foremost I thank my parents Hansand Margarete Vüllers for their unconditional love and support. You respected allmy decisions, had my back in every situation and helped in innumerable ways.I am grateful for everything you made possible for me. I also want to thank mybrothers Hannes Vüllers and Franz Vüllers and their families. A fair share oflaughs, giggles, smirks, snarles and "battle scars" are due to being your brother.Still I always enjoyed spending time with you guys and am ever grateful to seemy nieces and nephews grow up.
155

Herausgeber: Institut für Mikrostrukturtechnik
Band 1 Georg Obermaier Research-to-Business Beziehungen: Technologietransfer
durch Kommunikation von Werten (Barrieren, Erfolgs- faktoren und Strategien). 2009
ISBN 978-3-86644-448-5
Band 2 Thomas Grund Entwicklung von Kunststoff-Mikroventilen im
Batch-Verfahren. 2010 ISBN 978-3-86644-496-6
Band 3 Sven Schüle Modular adaptive mikrooptische Systeme in Kombination
mit Mikroaktoren. 2010 ISBN 978-3-86644-529-1
Band 4 Markus Simon Röntgenlinsen mit großer Apertur. 2010 ISBN 978-3-86644-530-7
Band 5 K. Phillip Schierjott Miniaturisierte Kapillarelektrophorese zur kontinuierlichen
Überwachung von Kationen und Anionen in Prozess- strömen. 2010
ISBN 978-3-86644-523-9
Band 6 Stephanie Kißling Chemische und elektrochemische Methoden zur
Oberflächenbearbeitung von galvanogeformten Nickel-Mikrostrukturen. 2010
ISBN 978-3-86644-548-2
Die Bände sind unter www.ksp.kit.edu als PDF frei verfügbar oder als Druckausgabe zu bestellen.
Schriften des Instituts für Mikrostrukturtechnikam Karlsruher Institut für Technologie (KIT)
ISSN 1869-5183
Band 7 Friederike J. Gruhl Oberflächenmodifikation von Surface Acoustic Wave (SAW)
Biosensoren für biomedizinische Anwendungen. 2010 ISBN 978-3-86644-543-7
Band 8 Laura Zimmermann Dreidimensional nanostrukturierte und superhydrophobe
mikrofluidische Systeme zur Tröpfchengenerierung und -handhabung. 2011 ISBN 978-3-86644-634-2
Band 9 Martina Reinhardt Funktionalisierte, polymere Mikrostrukturen für die
drei dimensionale Zellkultur. 2011 ISBN 978-3-86644-616-8
Band 10 Mauno Schelb Integrierte Sensoren mit photonischen Kristallen auf
Polymer basis. 2012 ISBN 978-3-86644-813-1
Band 11 Daniel Auernhammer Integrierte Lagesensorik für ein adaptives mikrooptisches
Ablenk system. 2012 ISBN 978-3-86644-829-2
Band 12 Nils Z. Danckwardt Pumpfreier Magnetpartikeltransport in einem
Mikroreaktions system: Konzeption, Simulation und Machbarkeitsnachweis. 2012
ISBN 978-3-86644-846-9
Band 13 Alexander Kolew Heißprägen von Verbundfolien für mikrofluidische
Anwendungen. 2012 ISBN 978-3-86644-888-9
Die Bände sind unter www.ksp.kit.edu als PDF frei verfügbar oder als Druckausgabe zu bestellen.

Band 14 Marko Brammer Modulare Optoelektronische Mikrofluidische
Backplane. 2012 ISBN 978-3-86644-920-6
Band 15 Christiane Neumann Entwicklung einer Plattform zur individuellen Ansteuerung
von Mikroventilen und Aktoren auf der Grundlage eines Phasenüberganges zum Einsatz in der Mikrofluidik. 2013
ISBN 978-3-86644-975-6
Band 16 Julian Hartbaum Magnetisches Nanoaktorsystem. 2013 ISBN 978-3-86644-981-7
Band 17 Johannes Kenntner Herstellung von Gitterstrukturen mit Aspektverhältnis 100 für die
Phasenkontrastbildgebung in einem Talbot-Interferometer. 2013 ISBN 978-3-7315-0016-2
Band 18 Kristina Kreppenhofer Modular Biomicrofluidics - Mikrofluidikchips im Baukasten-
system für Anwendungen aus der Zellbiologie. 2013 ISBN 978-3-7315-0036-0
Band 19 Ansgar Waldbaur Entwicklung eines maskenlosen Fotolithographiesystems
zum Einsatz im Rapid Prototyping in der Mikrofluidik und zur gezielten Oberflächenfunktionalisierung. 2013
ISBN 978-3-7315-0119-0
Band 20 Christof Megnin Formgedächtnis-Mikroventile für eine fluidische Plattform. 2013 ISBN 978-3-7315-0121-3
Band 21 Srinivasa Reddy Yeduru Development of Microactuators Based on
the Magnetic Shape Memory Effect. 2013 ISBN 978-3-7315-0125-1
Die Bände sind unter www.ksp.kit.edu als PDF frei verfügbar oder als Druckausgabe zu bestellen.
Band 22 Michael Röhrig Fabrication and Analysis of Bio-Inspired Smart Surfaces. 2014 ISBN 978-3-7315-0163-3
Band 23 Taleieh Rajabi Entwicklung eines mikrofluidischen Zweikammer-
Chipsystems mit integrierter Sensorik für die Anwendung in der Tumorforschung. 2014
ISBN 978-3-7315-0220-3
Band 24 Frieder Märkle Laserbasierte Verfahren zur Herstellung hochdichter
Peptidarrays. 2014 ISBN 978-3-7315-0222-7
Band 25 Tobias Meier Magnetoresistive and Thermoresistive Scanning
Probe Microscopy with Applications in Micro- and Nanotechnology. 2014
ISBN 978-3-7315-0253-1
Band 26 Felix Marschall Entwicklung eines Röntgenmikroskops für
Photonenenergien von 15 keV bis 30 keV. 2014 ISBN 978-3-7315-0263-0
Band 27 Leonardo Pires Carneiro Development of an Electrochemical Biosensor Platform and a
Suitable Low-Impedance Surface Modification Strategy. 2014 ISBN 978-3-7315-0272-2
Band 28 Sebastian Mathias Schillo Prozessentwicklung für die Automatisierung der Herstellung
und Anwendung von hochdichten Peptidmicroarrays. 2014 ISBN 978-3-7315-0274-6
Die Bände sind unter www.ksp.kit.edu als PDF frei verfügbar oder als Druckausgabe zu bestellen.
Band 29 Nicole E. Steidle Micro- and Nanostructured Microfluidic Devices
for Localized Protein Immobilization and Other Biomedical Applications. 2014
ISBN 978-3-7315-0297-5
Band 30 Jochen Heneka Prozessentwicklung eines industrietauglichen Verfahrens
zur Fertigung von vereinzelten LIGA-Mikrobauteilen. 2015 ISBN 978-3-7315-0326-2
Band 31 Seoung-Eun Kim Konzeption und prototypische Fertigung einer
nicht-invasiven mikrofluidischen Plattform für die Elektrophysiologie (NIMEP) zur Zellenanlyse. 2015
ISBN 978-3-7315-0378-1
Band 32 Elisabeth Wilhelm Entwicklung eines mikrofluidischen Brailledisplays. 2015 ISBN 978-3-7315-0385-9
Band 33 Viktor Pinneker Entwicklung miniaturisierter Aktorsysteme basierend
auf magnetischen Formgedächtnislegierungen. 2018 ISBN 978-3-7315-0500-6
Band 34 Ali Caglar Özen Novel MRI Technologies for Structural and Functional
Imaging of Tissues with Ultra-short T2 Values. 2017 ISBN 978-3-7315-0657-7
Band 35 Anne Bäcker Veränderliche 3D Zellgerüstträger auf Cryogelbasis
zur Kultivierung von Prostatakarzinomzellen. 2017 ISBN 978-3-7315-0676-8
Band 36 Frieder Johannes Koch X-ray optics made by X-ray lithography:
Process optimization and quality control. 2017 ISBN 978-3-7315-0679-9
Die Bände sind unter www.ksp.kit.edu als PDF frei verfügbar oder als Druckausgabe zu bestellen.

Band 37 Tobias Jörg Schröter Vergrößerung des Sehfeldes der Röntgen-Phasenkontrast-
Bildgebung für die klinische Anwendung. 2017 ISBN 978-3-7315-0731-4
Band 38 Felix Vüllers Bioinspired Superhydrophobic Nano- and Microstructured
Surfaces for Drag Reduction and Optoelectronics. 2018 ISBN 978-3-7315-0816-8
Die Bände sind unter www.ksp.kit.edu als PDF frei verfügbar oder als Druckausgabe zu bestellen.

FELIX VÜLLERS
9 783731 508168
ISBN 978-3-7315-0816-8