Embed Size (px)
Citation preview

111111 101 1403411696
Cranfield UNIVERSITY
c<` tr
LIBRARY
Biological Aerated Filters
BAF Cranfield University
12th June 1996
Organised by: The School of Water Sciences, Cranfield University
In conjunction with The IChemE Water Subject Group
Editors — Professor Tom Stephenson and Dr Bruce Jefferson
Published by: The School of Water Sciences Cranfield University Cranfield Bedfordshire MK43 OAL, UK
ISBN— 1 86194 014 9
© 1996. The contents are world copyrighted by the School of Water Sciences, Cranfield University, in the first instance. Permission must be sought from the School of Water Sciences before the whole or any part of this document is transcribed.

2nd Symposium on Biological Aerated Filters (BAF2)
12 June 1996
Following the success of the first BAF symposium held here in 1993, Cranfield University's School of Water Sciences is holding a second one day symposium on Biological Aerated Filters.
Over the last three years there has been a great deal of work on the development and optimisation of what has become one of the leading processes in wastewater treatment. The aim of this second symposium is to introduce recent work carried out in this field, bringing together many of the world's leading exponents of BAF technology and its application.
BAF2 represents an ideal opportunity to update your knowledge of these developments.
BAF2 Programme
9:30 Registration and coffee
10:25 Chairman's morning introduction
10:30 Trouble shooting and optimisation of BAF systems. A Smith, Thames Water
11:00 Pilot scale comparisons of floating/sunken media and up/downflow BAFs. A Mann, School of Water Sciences, Cranfield University.
11:20 Combined treatment of dairy and municipal wastewater in BAFs. Howard Rundle, Tetra (Europe) Ltd.
11:40 North European experience of BAFs. P Sagberg, Veas, Norway. (to be confirmed)
12:00 The Poole Harbour wastewater treatment works. P Brewer, Wessex Water Engineering.
12:30 Lunch
2:00 Chairman's afternoon introduction
2:10 The moving bed biological aerated filter T Stephenson, School of Water Sciences, Cranfield University
2:30 Operational trials of different proprietary Lamella and BAF systems. F Budge, Halcrow Consulting Engineers and D Gorrie, Grampian Regional Council.
3:00 Aeration optimisation in biological aerated filters. P Pearce, Thames Water.
3:30 Operating performance and future development of the Biobed system. A Cantwell, Brightwater Engineering.
4:00 Close of Meeting and Tea
The School of Water Sciences
The School of Water Sciences is the UK's only academic centre to specialise in process technologies for water and wastewater treatment. The school has considerable experience in research and development, working with many of the world's leading water companies and organisations concerned with water and effluent treatment. This experience ensures that the school if well positioned to offer consultancy and research and development related to these process technologies. The School has particular expertise associated with biotechnological applications including BAFs.
In addition to research and development and consultancy, the School of Water Sciences is recognised as a leading centre for the training of process technologies with funding from the EPSRC and approval of its programmes from the IChemE and CIWEM.
BAF and the biotechnology short courses have been developed to advance the understanding and implementation of these technologies.
4„441Pe School of Water Scilences

1
OPTIMISING AND TROUBLE SHOOTING BIOLOGICAL AERATED FILTERS
A J Smith and W B Brignal
Thames Water Research and Development
1 Introduction
Legislation requiring the first time treatment of coastal wastewater discharges and the uprating of existing treatment plant to meet tighter quality standards has led to the introduction of the Biological Aerated Filter (BAF) as an alternative to conventional treatment options. Correct process design will ensure the required effluent quality standards are met, however, with the rationalisation of operating practises currently under way in most UK water service companies it is equally important to understand the operating limits of the process and agree an appropriate hardware specification that suits the needs and competencies of the operator. The generic Biological Aerated Filter comprise an aerated reactor containing submerged inert media supporting the growth of an attached biomass, through which the wastewater flows. No secondary clarification is required and excess biomass is removed by washing the media bed. Similar submerged, attached growth reactors which are not washed and do require secondary solids removal are known as Submerged Aerated Filters (SAF).
2 Types of BAF
A number of different BAF types exist. These can be classified according to the biomass carrier type and the direction of wastewater flows :
- Sunken media/ Downflow countercurrent air - Sunken media/ Upflow co-current air - Floating media/ Upflow co-current air - Structured media/ Downflow countercurrent air
The SAFe Process, a downflow sunken media BAF, comprises a 2-3 m deep bed of granular media with a grain size of 2-6mm and a specific gravity of 1.5 - 1.8, depending on the application. Settled sewage flows down through the bed with the process air introduced through the lateral floor. The high specific surface area of the media and the rough porous surface structure allows the growth of a high concentration of attached biomass, typically 4 times that found in conventional suspended growth systems. Treated effluent flows from the base of the filter bed and no final settlement is required. When the headloss across the bed increases to a pre-set level or after a set period of time, the excess biomass and filtered
School of Water Sdences

SAFe PROCESS SCHEMATIC
Settled Sewage
Backwash Liquor
To Mud Well I I y Final Effluent
To Clear Well
Aerated Packed Bed
Wash Water Process A:I
Lateral Filter Floor
Air Scour
2
solids are removed by a countercurrent air and water backwash to be settled in the primary settlement tanks.
A schematic of the SAFe Process is shown in Figure 1.
Figure 1
The advantages of BAF's are reported as:
Small land area required, can be built underground or inside a building • Range of effluent qualities depending on applied load • Modular design gives treatment flexibility
Not affected by sludge settleability • Automatic operation
Since 1991 a number of SAFe Process plants have been installed covering a range of effluent qualities. A reference list is shown in Table 2.
3 Key Design Criteria
The critical factors in BAF design and operation are:
Media size, shape, surface characteristics, hardness, density
Influent volumetric and hydraulic loading rates , variation and toxicity
School,' o Water Sdences

3
Process air flow rate, distribution and control.
Backwash rates, frequency, and backwash liquor return.
Table 2. SAFe Process Installations
Plant Operator Pop.Equiv. Year Type
Silchester Thames Water
20,000 1991 CN
Saffron Walden
Anglian Water
6,000 1993 CN
Par: St.Austell
South West Water
40,000 1993 C
Bursleden Southern Water
6,000 1994 CN
Heathcoat Industrial 2,000 1993 C
Seville, Spain
Domestic 500 - 2,000 1996 C
Milford Haven Welsh Water
20,000 1996 C(N)
C - Carbonaceous CN - Combined Carbonaceous/Nitrification
BAF Media
The media size in a BAF governs the specific surface area available for attached growth and hence the concentration of micro-organisms present. This will define the treatment capacity according to the media volumetric loading rate. Media size is varied according to the treatment requirements. Particle size and size distribution also governs the voidage of the packed bed and therefore the headloss across it. A rough porous surface structure is required to promote biomass attachment and increase the micro-surface area. Specific gravity is typically 1.5
1.8. For BOD removal only, a size of between 3 and 6 mm is used. A smaller particle size would lead to an increased wash frequency because of the higher load and the increased growth rate. Where nitrification is required a smaller 2.5 - 5 mm size range is used.
Schooll of Water Sdences

4
Volumetric and Hydraulic Loading Rates
The performance of a BAF for a given media size distribution is governed by the media volumetric loading rate, the hydraulic loading rate and the extent of any variations therein. BOD removal is illustrated in Figure 2. Typical BOD VLR's range from 1 to 4 kg/m3/d depending on the quality required. The limiting factor is often the hydraulic loading rate. Up to a VLR of 2 KgBOD/m3/d the removal rate is approximately 90%. At higher VLR's the spread of results is greater. The results shown in Table 2 indicate that the increase in total BOD is as a result of an increase in suspended solids related BOD in the filter effluent. This could be expected because of the increased filtration velocity at higher loading rates.
Figure 2
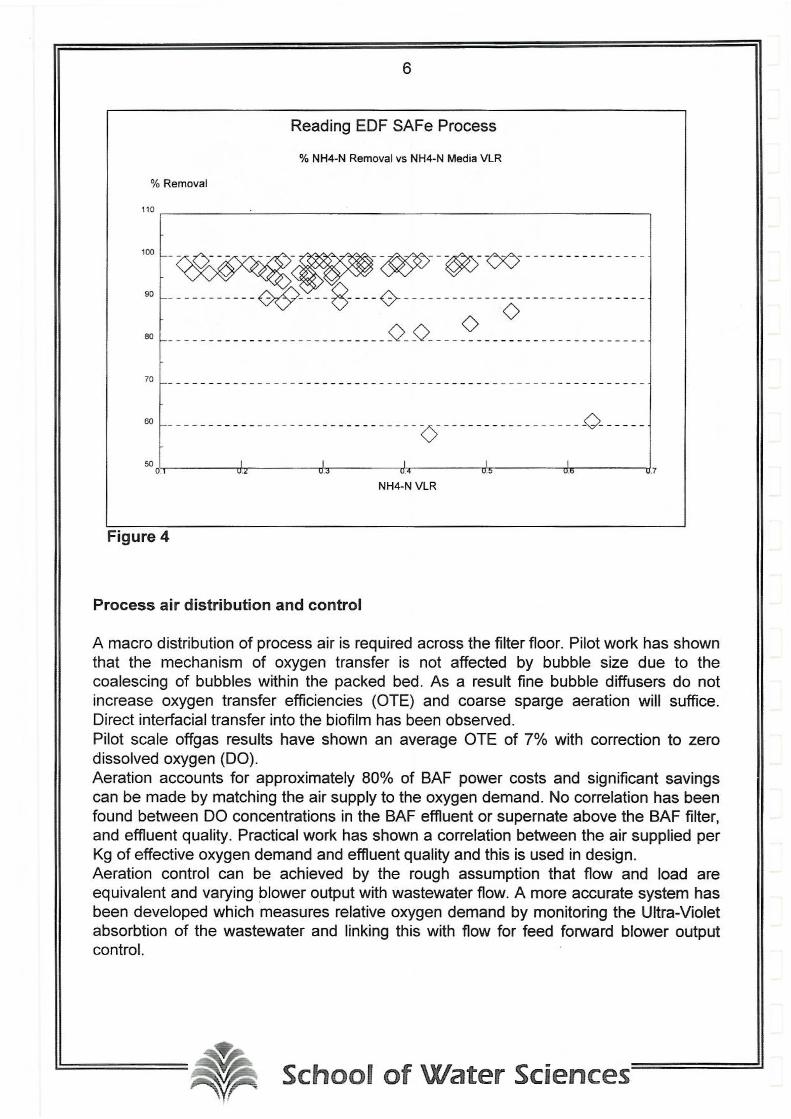
Nitrification in a complete treatment BAF is limited by both the BOD and NH4-N VLR's. The maximum BOD VLR for full nitrification is approximately 2.5 Kg/m3/d. The variation of Ammonia removal with applied load for a tertiary nitrifying BAF is shown in Figure 3. Greater than 90% removal is seen up to loading rates of 0.5 kg NH4-N/m3 media/d. At loading rates higher than 0.6 an ammount of scatter is introduced as other factors come into play. At these loads the inhibitory effects of the BOD load can affect nitrification. The variation in nitrification with applied load for a complete treatment BAF is shown in Figure 4.
40'& o SchocC of Water Scfiences

0-3
0.7 -
0.1 -
0 0.2 0.4 0.6 08
Ammonia Httrospn Volunnot.ric 1000 Appltai (K9S003/0)
Lb D° 0
C63 CI 21
Li& 0 n OS O
0. 0 al 0 13 -16,--0 a _9, d? cb B DO
0
7 7
E
2 O
E
0.7 0
TERTIARY NITRIF ICA1 ION
AMMONIA NfriN)GEN VOLUMETRIC LOAD APPLIED v AMMONIA NITROGEN VOLIJULTMC LOAD REMOVFO 0.8 _ _ -
0
0 0
0.6
0.5
0.4
5
Figure 3
Table 2 shows the effluent qualities and removal rates over a range of steady state values for VLR and HLR. Nitrification is reduced at the higher loading rates. At the highest BOD VLR of 3.9 only a 2% reduction in ammonia was seen although there is a 22% reduction in Total Kjeldahl Nitrogen (TKN) through cell growth assimilation.
Table 2: Effects of loading rate variation on BAF Performance
HLR (m\h) 1 1.5 2 3
HRT (min) 60 40 30 20
BOD VLR 1.2 1.7 2.6 3.9
NH4-N VLR 0.2 0.3 0.4 0.6
TKN VLR 0.4 0.6 0.9 1.35
BODoutmg/I 7 12 13 17
NH4-Nowt 1.1 1.7 7.9 13.1
SSout 5 7 17 32
TKNout 3.7 3.8 18 25
BOD %Red 93 88 91 75
NH4-N %Red 93 89 52 2
TKN %Red 89 88 45 22
SS %Red 95 93 83 69
School o Water Sdences
100
90
80
70
60
00
00
()it -03 05
NH4-N VLR
60 0
Reading EDF SAFe Process
% NH4-N Removal vs NH4-N Media VLR
% Removal
110
6
Figure 4
Process air distribution and control
A macro distribution of process air is required across the filter floor. Pilot work has shown that the mechanism of oxygen transfer is not affected by bubble size due to the coalescing of bubbles within the packed bed. As a result fine bubble diffusers do not increase oxygen transfer efficiencies (OTE) and coarse sparge aeration will suffice. Direct interfacial transfer into the biofilm has been observed. Pilot scale offgas results have shown an average OTE of 7% with correction to zero dissolved oxygen (DO). Aeration accounts for approximately 80% of BAF power costs and significant savings can be made by matching the air supply to the oxygen demand. No correlation has been found between DO concentrations in the BAF effluent or supernate above the BAF filter, and effluent quality. Practical work has shown a correlation between the air supplied per Kg of effective oxygen demand and effluent quality and this is used in design. Aeration control can be achieved by the rough assumption that flow and load are equivalent and varying blower output with wastewater flow. A more accurate system has been developed which measures relative oxygen demand by monitoring the Ultra-Violet absorbtion of the wastewater and linking this with flow for feed forward blower output control.
0%#'164 School off VVanter Sdences "1y,"1

SAFe Process Headloss Development Profile Height above plenum (mm)
3,800
3,600
3,400
3,200
3,000
2,800
2,600
2,400
Mani
Mang
Man3
Man4
0 4 8 12 16 20 24 28 32 36 40
2 6 10 14 18 22 26 30 34 38 42
Time after backwash (hours)
7
Backwash Rates and frequency
The purpose of backwashing a BAF is to remove particulate solids captured on the filter bed, optimise biofilm thickness and remove surplus biomass, and return the packed bed to its original clean bed headloss. This is achieved by simultaneous air and sub-fluidisation water flows, the rates of each being determined by the characteristics of the media particles (size, density, shape) and the characteristics of the packed bed (permeability, voidage, fluidisation velocity). The wash rates are set in the design however wash duration can be altered according to changes in the rate of headloss development bought about by increased load or wastewater temperature. The headloss is affected by the characteristics of the media particles and packed bed, wastewater flow rate, biomass concentration and profile, and possible bed or filter floor blockages. A typical headloss development profile is shown in Figure 5 for a SAFe Process plant running at an HLR of 1m/h and VLR's of 1.1 Kg BOD and 0.2 kg NH4-N /m3media/d.
This shows a flat profile for the majority of the expected 24 hour filter run with an increase in headloss in the top of the packed bed as the run is extended. This is to be expected with the highest filtration load and biomass growth in this section.
Figure 5
Backwashing and the management of the dirty backwash liquors is critical to the operation of the process. Typical backwash solids concentrations average 1500-200 mg/I over the period of the wash.
0%Pk SchocA of Water Sc-_:ences P11,rti‘

8
6 Optimisation and Troubleshooting
Potential problems related to non compliance on any wastewater treatment process . relate to not achieving either quality or quantity. From the experience gained in operation the theoretical design criteria can be captured in the two real issues in BAF operation. These are the hydrodynamics of the packed bed and the characteristics of the attached biomass. The hydrodynamics of the bed govern the headloss across the bed which in turn affects the possible flow to treatment and the wash frequency. The Biomass factors relate to the type of Micro-organisms present, the overall biomass concentration and the concentration profile through the bed. These are dependent on loading rate, treatability or toxicity of the waste, and temperature.
The diagnosis of a potential problem in a BAF can be made through monitoring and understanding the implications in changes to the following:
Total Headloss, headloss build up and the headloss profile across the bed and filter floor.
The biomass type, concentration and profile.
The treatment profile through the bed and the treatability or toxicity of the wastewater.
Headloss and wash frequency
Wash frequency is a function of the rate of headloss development across the bed which for a given design under 'normal' conditions, can be related to influent load and temperature. This can be translated into an operations process control procedure, an example of which is shown in Figure 6. The process is operating correctly when the predicted maximum number of washes is not exceeded.
ScGlooG of Water Sdences

Action
Normal
SAFe BIOLOGICAL AERATED FILTER
Wash frequency 17 April 1995 - 6 March 1996
** ,,, * *
r * *
*
4 4, 4 , * *
i(
',......„,. .-----------
* *ft ..
- *
* >ow . * 4K__, -4
* i *
kt"..kk.?::;- * 4
* *,, ik
4 4 ** 4 * ,k
: k
›K
5,000 10,000 15,000
20,000
25,000
Total flow to treatment m3/day
35
30
io
5
o ) n5
0 0
9
Figure 6
In optimising a BAF installation to minimise the effects of problems related to excessive hydraulic loads and/or high volumetric loads due to potential malfunctions in upstream processes Thames/PWT have introduced an innovative control system that automatically changes the filter wash regime to suit the process needs at any time. For example, during periods of excessive flows the requirement to wash will be related more to the flow rather than biomass growth. At these times the wash duration is reduced to minimise the volume of washwater returned to treatment.
Sch of of Waiter Sdences

Predicted wash frequency
Cumulative error 17 April 1995 - 6 March 1996
250
200
1150
00 0 ro
Ili V
50
C
0 0
-50 17 April
a 16 June 15 August 14 October
17 May 16 July 14 Sept 13 Nov
13 Dec 11 Feb
12 Jan
10
Biomass effects
It can be seen from Figure 6 that the maximum number of permitted washes was exceeded at certain times. Further analysis of the data highlighted the occurrence of the problem as shown in Figure 7. Here the deviation from the expected normal wash frequency can be clearly seen. Investigation of the biomass present at that time revealed masses of unicellular gram negative bacteria with filamentous organisms, Types 0411, 0041, 1701, Thiothrix, Spharotilus Natans and Beggiotoa. Some protozoa were present however there was a predominance of exocellular muco-polysacharide coating the media particles.
Figure 7
This slime like covering was not removed in the conventional wash cycle and had the effect of providing a surface blockage increasing the apparent headloss and the wash frequency. Examination of the backwash liquors showed a comparatively low suspended solids concentration indicating that the process was being over washed.
Muco-polysacharides are produced as an exocellular food store in nutrient deficient conditions or as a protection against harmful predators or toxic chemicals. Sphaerotilus natans, found in significant quantities in the biomass produces an exocellular slime coating under nutrient limitation. Muco-polysacharides are present in suspended growth systems and contribute biomass settlement through assisting in flocculation, however research into biomass adhesion in fixed film processes has shown them to enhance adhesion and thereby decrease wash efficiencies. As a potential food store polysacharides are susceptible to both aerobic and anaerobic degradation. In order to control the problem an operating regime incorporating periodic
Schoo titer Sdences

11
aerobic digestion under substrate limited conditions was initiated. Further work to remove the slime under extreme conditions has shown that low concentrations of oxidising chemicals can remove the slime coating on the media.
7 Conclusions
Biological aerated filters can be designed to produce a range of effluent qualities. The advantages of their compact size, modular construction and automatic control have made BAF's a popular alternative to conventional treatment options. Operation of the SAFe Process since the first installation in 1991 has shown the process to reliably achieve its design quality standard. Correct backwashing and management of the backwash liquor return is critical to BAF operation. Management of BAF operation requires monitoring and understanding the implications of changes to the rate of headloss build up and the characteristics of the attached biomass. This can be installed as part of the automatic control system.
Acknowledgement
The authors would like to thank the SAFe Process operators who have contributed to this paper. Any views expressed in this paper are those of the authors and not necessarily those of Thames Water and associated companies.
,se -%P- SchcoE of Water Sdences -fia1yr'