Embed Size (px)
Citation preview
Biological Assessment and Fine Sediment Study
Eaton BranchSt. Francois County, Missouri
2003-2004
Prepared for:
Missouri Department of Natural ResourcesWater Protection and Soil Conservation Division
Water Protection ProgramWater Pollution Control Branch
Prepared by:
Missouri Department of Natural ResourcesAir and Land Protection DivisionEnvironmental Services ProgramWater Quality Monitoring Section

Table of Contents Page
1.0 Introduction..................................................................................................11.1 Justification......................................................................................11.2 Purpose.............................................................................................21.3 Objectives ........................................................................................21.4 Tasks ................................................................................................21.5 Null Hypotheses...............................................................................3
2.0 Methods .......................................................................................................32.1 Study Timing ...................................................................................32.2 Station Locations and Descriptions .................................................3
2.2.1 Ecological Drainage Unit.....................................................42.2.2 Land Use ..............................................................................4
2.3 Stream Habitat Assessment..............................................................72.4 Biological Assessment .....................................................................7
2.4.1 Macroinvertebrate Sampling and Analyses .........................72.4.2 Physicochemical Water Sampling and Analyses.................82.4.3 Discharge .............................................................................9
2.5 Fine Sediment ..................................................................................92.5.1 Fine Sediment Estimations ..................................................92.5.2 Fine Sediment Character....................................................112.5.3 Fine Sediment Data Analyses ............................................11
2.6 Quality Control ..............................................................................113.0 Results and Analyses .................................................................................11
3.1 Stream Habitat Assessment............................................................113.2 Biological Assessment ...................................................................12
3.2.1 Macroinvertebrate Community Analyses ..........................123.2.2 Physicochemical Water Variables .....................................14
3.2.2.1 Discharge ...............................................................163.3 Fine Sediment ................................................................................16
3.3.1 Fine Sediment Estimations ................................................163.3.2 Fine Sediment Character....................................................16
4.0 Discussion..................................................................................................194.1 Stream Habitat Assessment............................................................194.2 Biological Criteria Metrics ............................................................194.3 Physicochemical Water Quality.....................................................194.4 Fine Sediment Estimation ..............................................................204.5 Fine Sediment Characterization.....................................................214.6 Macroinvertebrate Response..........................................................21
5.0 Conclusion .................................................................................................226.0 Recommendations......................................................................................227.0 Literature Cited ..........................................................................................22

TABLES Page
Table 1 Location and Descriptive Information for Eaton Branch andCub Creek Stations, 2003-2004 ......................................................4
Table 2 Percent Land Cover in the Eaton Branch, Cub Creek, andOzark/Meramec EDU ......................................................................4
Table 3 Stream Habitat Assessment Scores for Cub Creek and EatonBranch, Spring 2004 (March 23 and 24, 2004) .............................12
Table 4 Fall 2003 Biological Criteria (n=7) Metric Scores andStream Condition Index (SCI) Scores for Eaton Branch andCub Creek Stations. (SCI Scoring Table in light gray) ................12
Table 5 Spring 2004 Biological Criteria (n=6) Metric Scores andStream Condition Index (SCI) Scores for Eaton Branch andCub Creek Stations. (SCI Scoring Table in light gray) ................13
Table 6 Dominant Macroinvertebrate Families (DMF) as aPercentage of the Total Number of Individuals per Station,Fall 2003 ........................................................................................14
Table 7 Dominant Macroinvertebrate Families (DMF) as aPercentage of the Total Number of Individuals per Station,Spring 2004....................................................................................14
Table 8 Physicochemical Water Variables for Eaton Branch andCub Creek by Season: Spring 2003, Fall 2003, andSpring 2004....................................................................................15
Table 9 Fine Sediment Estimates (Percent) for Stations/Grid andQuadrat; Mean and Standard Deviation (s.d.) per Station .............17
Table 10 Cadmium Levels (ug/kg) in Sediment per Grid; Means andStandard Deviations (s.d.) per Station. Sediment CadmiumProbable Effects Level (PEL)=3,200 ug/kg(Ingersoll et al. 1996).....................................................................18
Table 11 Lead Levels (ug/kg) in Sediment per Grid; Means and StandardDeviations (s.d.) per Station. Sediment Lead Probable EffectsLevel (PEL)=82,000 ug/kg (Ingersoll et al. 1996).........................18
Table 12 Zinc Levels (ug/kg) in Sediment per Grid; Means and StandardDeviations (s.d.) per Station. Sediment Zinc Probable EffectsLevel (PEL)=540,000 ug/kg (Ingersoll et al. 1996).......................19

FIGURES Page
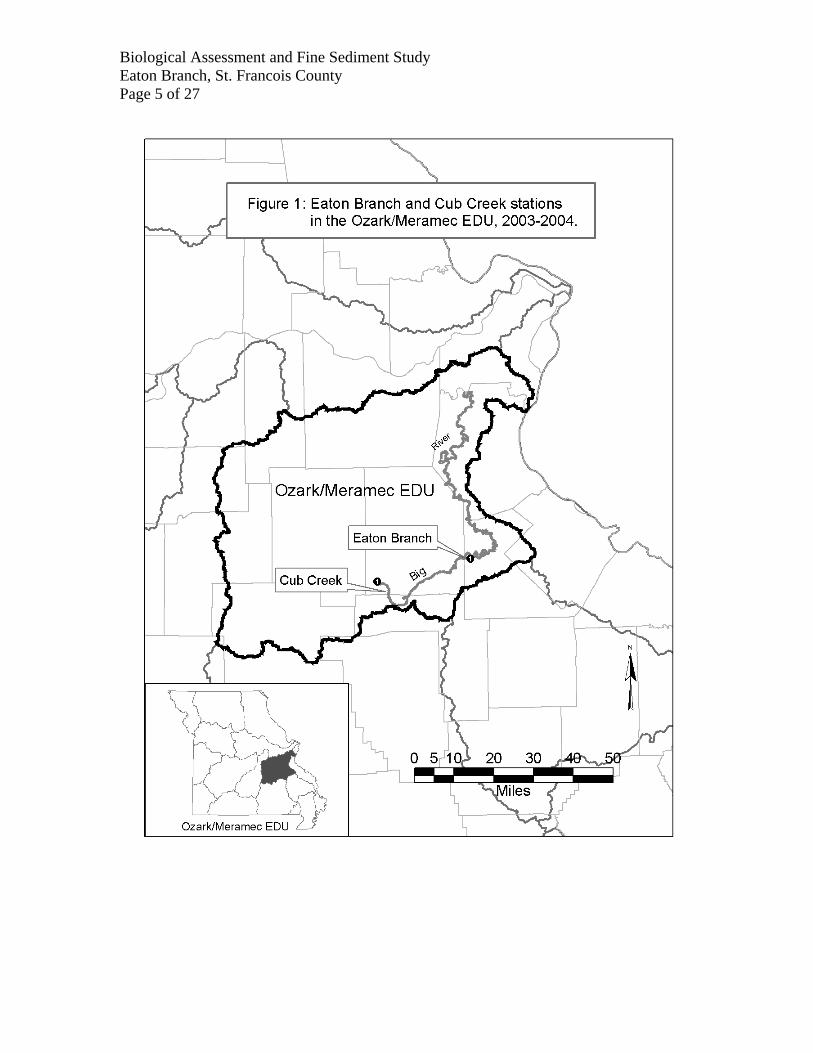
Figure 1 Eaton Branch and Cub Creek Stations in the Ozark/MeramecEDU, 2003-2004 ..............................................................................5
Figure 2 Eaton Branch, St. Francois County Station in theOzark/Meramec EDU, 2003-2004 ...................................................6
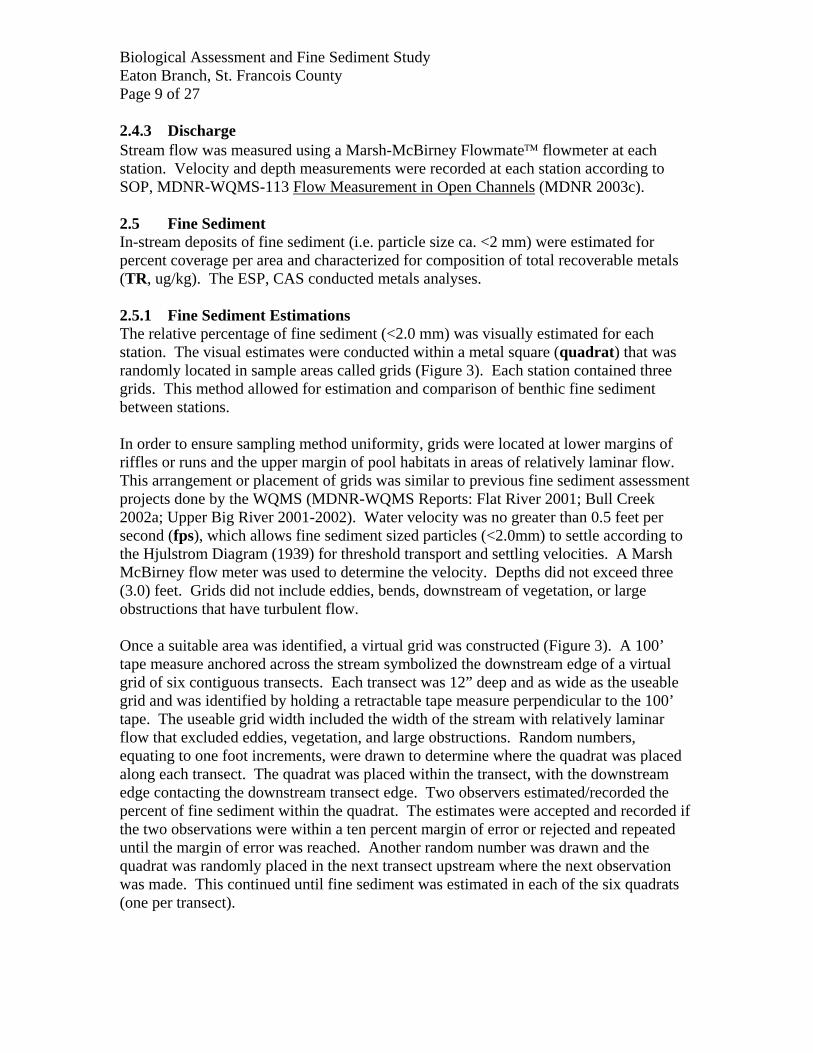
Figure 3 Virtual grid of transects (T) and quadrats (in gray, numbered) forestimating percent fine sediment ...................................................10
ATTACHMENTS
Appendix A Missouri Department of Natural Resources Bioassessment and SedimentStudy Plan, Eaton Branch, St. Francois County, August 26, 2003
Appendix B Macroinvertebrate Bench Sheets for Eaton Branch and Cub CreekStations, Fall 2003 and Spring 2004
Appendix C Fine Sediment Percentage and Sediment Character (metals) Tests:Mann-Whitney Rank and Student t-tests for Eaton Branch and Cub Creek,October 1 and 2, 2003
Biological Assessment and Fine Sediment StudyEaton Branch, St. Francois CountyPage 1 of 27
1.0 IntroductionEaton Branch, St. Francois County, is a small stream that is approximately three mileslong in the Ozark/Meramec Ecological Drainage Unit (EDU, Figure 1). The streamoriginates near Wortham, Missouri and flows to its confluence with Big Riverapproximately one-quarter of a mile north of Leadwood, Missouri. Most of the originalEaton Branch, south of Missouri State Highway 8 (MO 8) is covered with what appearsto be mine tailings and flow is intermittent or subsurface. Flow from north of MO 8 tothe confluence with Big River appears to be permanent or semi-permanent. This studywas conducted downstream of MO 8.
Because of the small size of Eaton Branch, the stream is considered a “class C” stream,which means it may cease flow but maintain permanent pools in dry weather (MDNR2000). Cub Creek acted as a similar size control and is considered a “class P” streamwith permanent flow. The “Use Designations” (MDNR 2000) for Eaton Branch and CubCreek are for “Livestock and Wildlife Watering (LWW) and the Protection of WarmWater Aquatic Life, Human Health-Fish Consumption (AQL)”. Both streams areconsidered “General Warm Water Fisheries” (GWWF, MDNR 2000).
1.1 JustificationEaton Branch is a tributary of Big River that drains the historic Leadwood tailings pondsin what is known as the Old Lead Belt. The Leadwood mines and mill began operation in1894 and continued with little interruption until 1965. The tailings ponds consist ofapproximately 528 acres of inactive lead mine tailings (Fluor Daniel EnvironmentalServices 1995). Two tailings retaining structures capture drainage in the area. Whetherthey are effective is not known. Runoff from these tailings ponds may influence theaquatic communities on Eaton Branch and subsequently Big River. While Eaton Branchhas not been placed on the 303(d) list, approximately 40 miles of Big River is listed forlead and non-volatile suspended solids (NVSS) and 53 miles are listed for lead,presumably from mine tailings runoff.
Abandoned mines may discreetly impair aquatic communities. Water runoff during rainevents erodes mine wastes, which increase sedimentation in some lower portions of BigRiver. Tailings are generally fine sediments (ca. <2.0 mm) and have been founddownstream in some portions of Big River. Fine sediments and silt clog the interstitialvoids between the larger particles in the substrate and can have destructive effects oninvertebrates and fish communities (Chutter 1969; Murphy et al. 1981; Berkman andRabeni 1987; Smale et al. 1995).
Metals such as copper, iron, lead, and zinc have been detected in aquatic fauna in areas ofBig River (Meneau 1997). Lead concentrations in fish tissues have resulted in fishconsumption advisories. The metals composition (i.e. character) of the sediment mayinfluence macroinvertebrate communities as well. Lead is toxic to all phyla of aquaticbiota, but its’ toxic action differs by species and physiological state and by physical andchemical variables (Eisler 1988). Metals can affect aquatic organisms as toxic substancesin water and sediment or as a toxicant in the food chain (Sorensen 1991; Rainbow 1996).
Biological Assessment and Fine Sediment StudyEaton Branch, St. Francois CountyPage 2 of 27
Clements (1991) found a lowered percent composition or elimination of Ephemeropteraand increased abundance of Chironomidae, especially Orthocladiinae, as well asHydropsychidae (net-spinning caddisflies), downstream from metals impacts in theabsence of organic pollution. Besser et al. (1987) stated that aquatic organisms intributaries of Big River located downstream from tailings piles contained concentrationsof lead, cadmium, and other heavy metals. Kramer (1976) and Jenett et al. (1981)reported elevated levels of lead and zinc in Flat River Creek, St. Francois County, atributary to Big River. Concentrations of lead and zinc were elevated within algae,crayfish, and minnows from lower Flat River Creek. They believed the sources werebrought to Flat River Creek via tributaries that drained Elvins and Federal tailings piles.
In 2001, the MDNR, ESP, Water Quality Monitoring Section (WQMS) identified ElvinsTailings Pile as a potential source of lead and zinc laden sediment found in Flat RiverCreek (MDNR 2001). Areas downstream from tailings piles on the lower portion of BigRiver were shown to be greatly impaired, potentially by fine sediment or heavy metalsconcentrations on the substrate (Zachritz 1978; Czarnezki 1987; Meneau 1997; MDNR2003a). It is our intention to determine if Eaton Branch is impaired by past mininginfluences.
A biological assessment, stream habitat assessment, and fine sediment study plan(Appendix A) were developed for the Water Protection Program (WPP), WaterProtection and Soil Conservation Division (WPSCD), Missouri Department of NaturalResources (MDNR). The study was coordinated and conducted by the AquaticBioassessment Unit of the WQMS, Environmental Services Program (ESP), MDNR.Kenneth B. Lister, David Michaelson, and the staff of the Water Quality MonitoringSection conducted the study. A biological assessment, stream habitat assessment, andfine sediment study were conducted on Eaton Branch and Cub Creek (control).
1.2 PurposeTo determine if Eaton Branch, St. Francois County is impaired by past mining influences.
1.3 Objectives1) Assess the macroinvertebrate community integrity and water quality in
Eaton Branch, St. Francois County.
2) Assess the stream habitat quality of Eaton Branch, St. Francois County.
3) Assess the relative quantity or actual character (metals content) of fine sedimentsized particles at Eaton Branch, St. Francois County.
1.4 Tasks1) Conduct a biological assessment for Eaton Branch, St. Francois County and Cub
Creek, Washington County.
2) Conduct a stream habitat assessment on Eaton Branch and Cub Creek.
Biological Assessment and Fine Sediment StudyEaton Branch, St. Francois CountyPage 3 of 27
3) Conduct a fine sediment percentage estimation and characterization study onEaton Branch and Cub Creek.
1.5 Null HypothesesEaton Branch macroinvertebrate communities and biological criteria metrics will besimilar to Cub Creek.
Water quality at Eaton Branch will be similar to Cub Creek and within acceptable WaterQuality Standards (MDNR 2000).
Stream habitat assessment at Eaton Branch will be comparable to the stream habitatcontrol station.
There will be no significant difference (p > 0.05) in the fine sediment percentageestimates or character between Eaton Branch and Cub Creek. The metals content will bebelow Probable Effects Levels (PELs; Ingersoll et al. 1996).
2.0 MethodsThe study area, station descriptions, EDUs, and land use are identified. Study timing isoutlined. Methods for stream habitat assessment are discussed. Biological assessmentcollection and analyses are introduced. Physicochemical water collection and analysesmethods are defined.
2.1 Study TimingSampling was conducted for up to three seasons; spring 2003, fall 2003, and spring 2004.One reconnaissance (water only), two biological assessments, one stream habitatassessment, and one fine sediment study were conducted on Eaton Branch and CubCreek.
A reconnaissance and physicochemical water sampling were conducted April 4, 2003.Biological assessments and the fine sediment study took place October 1 and 2, 2003 andMarch 23, 2004. Stream habitat assessments were conducted on Eaton Branch and CubCreek in March 2004.
2.2 Station Locations and DescriptionsTwo stations were used in this project (Figure 1, Table 1). The test station on EatonBranch, St. Francois County was located downstream of Missouri State Highway 8,approximately 0.5 miles north of Leadwood, Missouri. Cub Creek, Washington Countyis a class P stream with permanent flow (MDNR 2000) and was used as the similar-sizecontrol stream. The station on Cub Creek was located approximately 1.5 miles north ofCourtois, Missouri and 0.25 miles north of Washington County Road C.
Biological Assessment and Fine Sediment StudyEaton Branch, St. Francois CountyPage 4 of 27
Table 1Location and Descriptive Information for Eaton Branch and Cub Creek Stations,
2003-2004Stream-StationNumber
Location-Section,Township, Range
Description County
Eaton Branch #1 SE ¼ of sec. 33,T. 37 N., R. 04 W.
Test station-upstream from BigRiver confluence
St. Francois
Cub Creek #1 SE ¼ of sec 32,T. 36 N., R. 01 W.
Similar-size control-upstream 1.0mile Courtois Creek confluence
Washington
2.2.1 Ecological Drainage UnitEaton Branch and Cub Creek are in the Ozark/Meramec Ecological Drainage Unit(EDU, Figure 1). Ecological Drainage Units are delineated drainage units that areexpected to contain similar aquatic communities and stream habitat conditions.Comparisons between similar-size streams in the same EDU should then be appropriate.
2.2.2 Land UseLand cover throughout the entire Ozark/Meramec EDU was compared to the land coverof each station by it’s 14-digit Hydrological Unit (HU, Table 2). Percent land cover datawere derived from Thematic Mapper (out TM) satellite data collected between 1991 and1993 and interpreted by the Missouri Resource Assessment Partnership (MoRAP). Theimplication of this comparison is that land use within the study area does not interferewith interpretation of the findings, such as comparing streams near cropland and othersnear forestland.
Table 2Percent Land Cover in the Eaton Branch, Cub Creek, and Ozark/Meramec EDU
Stations HUC-14 Urban Crops Grassland ForestEaton Branch #1 07140104010006 1.2 1.5 47.9 44.9Cub Creek #1 07140102040002 0 0 7 92.6Ozark/Meramec EDU -- 1.3 1.7 28.5 67.1
Land use (cover) in the Eaton Branch was comparable to the EDU and to Cub Creek on asmaller scale. Eaton Branch and the EDU were relatively similar in all categories(Table 2). Eaton Branch and Cub Creek on the scale of the HU were not similar in land-cover. Eaton Branch had far less forest (44.9%) than Cub Creek (92.6%). Land use nearEaton Branch was affected by its proximity to Leadwood, Missouri and pasture.However, the riparian corridor was well forested surrounding Eaton Branch. On asmaller scale, the comparisons between Eaton Branch and Cub Creek should not beinfluenced by land use in the surrounding areas.
Biological Assessment and Fine Sediment StudyEaton Branch, St. Francois CountyPage 5 of 27

Biological Assessment and Fine Sediment StudyEaton Branch, St. Francois CountyPage 6 of 27

Biological Assessment and Fine Sediment StudyEaton Branch, St. Francois CountyPage 7 of 27
2.3 Stream Habitat AssessmentThe standardized Stream Habitat Assessment Project Procedure, MNDR-FSS-032(SHAPP) was conducted on Eaton Branch and Cub Creek, as described for “Riffle/PoolHabitat” (MDNR 2003f). Components of the stream habitat were evaluated and totalSHAPP scores were derived for each station. Scores were compared at Eaton Branch andCub Creek (stream habitat control). If the SHAPP score at the test station was >75% ofthe stream habitat control, the test station was considered comparable to the quality of thestream habitat control and supporting the aquatic community.
2.4 Biological AssessmentBiological assessments were conducted for one station on Eaton Branch and one stationon Cub Creek. Biological assessments consisted of macroinvertebrate community andphysicochemical water sampling and analyses.
2.4.1 Macroinvertebrate Sampling and AnalysesMacroinvertebrates were sampled as described in the MDNR’s Semi-quantitativeMacroinvertebrate Stream Bioassessment Project Procedure (SMSBPP, MDNR 2003e).Eaton Branch and Cub Creek are considered riffle/pool dominant streams and multiplehabitats were sampled accordingly (MDNR 2003e). These included flowing water withcoarse substrate (CS), non-flowing water with depositional substrates (NF), and rootmat(RM) habitats.
Macroinvertebrate community data are analyzed using three strategies. Stream ConditionIndex (SCI) scores, individual biological criteria metrics, and dominantmacroinvertebrate families (DMF) were examined and compared between stations. Allresults were grouped by season and station.
The first comparison was of SCI scores by station and season. An SCI score wasidentified as a qualitative rank measurement of a stream’s aquatic biological integrity(Rabeni et al. 1997). The SCI was further refined for reference streams within each EDUaccording to Biological Criteria for Perennial/Wadeable Streams (BIOREF, MDNR2002b). Four primary biological criteria metrics were used to calculate the SCIs perstation: 1) Taxa Richness (TR); 2) Ephemeroptera/Plecoptera/Trichoptera Taxa (EPTT);3) Biotic Index (BI); and 4) Shannon Diversity Index (SDI). Metric(TR, EPTT, BI, SDI) scores were compared to the BIOREF scoring range(SCI Scoring Table, Tables 4 and 5) and rank scores (5, 3, 1) were assigned to eachmetric. Rank scores were compiled for each station and SCIs were completed. Forexample, an SCI of 20-16 = fully supporting of the biological community;14-10 = partially supporting of the biological community; and 8-4 = non-supporting ofthe biological community.
Secondly, individual biological criteria metrics (TR, EPTT, BI, SDI) values wereexamined compared to the BIOREF scoring range (Scoring Table, Tables 4 and 5) toidentify unusual responses or interesting trends at each station. Variations in certainmetrics may help illustrate impairment, if it exists, and potentially identify a source.

Biological Assessment and Fine Sediment StudyEaton Branch, St. Francois CountyPage 8 of 27
Thirdly, the dominant macroinvertebrate families (DMFs) as a percentage of the totalnumber of individuals were evaluated. Eight DMFs were listed for each station byseason. Dominance by certain families may illustrate impairment, if it exists, andpotentially identify a source of impairment.
A complete taxa list (Appendix B) was also included for each station and grouped byseason. Presence or absence of individual taxa may be discussed based on their toleranceto impairment.
2.4.2 Physicochemical Water Sampling and AnalysesPhysicochemical water samples were handled according to appropriate MDNR, ESPStandard Operating Procedures (SOPs) and Project Procedures (PPs) for sampling andanalyzing physicochemical water samples. Results are reported for physicochemicalwater variables by season and station.
Spring 2003, fall 2003, and spring 2004 physicochemical water parameters measured inthe field were temperature (C0), pH, conductivity (uS/cm), dissolved oxygen (mg/L), anddischarge (cfs).
Water was sampled according to the SOP MDNR-FSS-001 Required/RecommendedContainers, Volumes, Preservatives, Holding Times, and Special SamplingConsiderations (MDNR 2003d). Samples were collected and kept on ice for transport tothe ESP. Water samples were collected and returned to the ESP laboratory for turbidity,hardness (CaCO3), ammonia-nitrogen, nitrate+nitrite-nitrogen, Total Kjeldahl Nitrogen(TKN), sulfate (spring 2003 only), chloride, total phosphorus, dissolved barium (spring2003 and fall 2003 only), dissolved cadmium, calcium, dissolved copper, dissolved iron,dissolved lead, dissolved magnesium, dissolved nickel, and dissolved zinc. The WQMSBiology Laboratory analyzed turbidity. All remaining samples were delivered to the ESPChemical Analysis Section (CAS) in Jefferson City, Missouri for analyses.
Physicochemical data were compared between Eaton Branch and Cub Creek. Resultswere also compared with acceptable limits according to Missouri’s Water QualityStandards (WQSs, MDNR 2000).
Interpretation of acceptable limits within the WQSs may be dependent on a stream’sclassification and its beneficial use designations (MDNR 2000). Eaton Branch is a classC stream downstream from MO 8 and Cub Creek is a class P stream. Both havedesignated uses for LWW and AQL. They are also considered General Warm WaterFisheries (GWWF). Furthermore, acceptable limits for some variables may be dependenton the rate of exposure. These exposure or toxicity limits are based on the lethality of atoxicant given long (chronic toxicity, c) or short-term exposure (acute toxicity, a).Water hardness (mg/L CaCO3) concentrations were necessary to further determineacceptable limits, based on the solubility of heavy metals.
Biological Assessment and Fine Sediment StudyEaton Branch, St. Francois CountyPage 9 of 27
2.4.3 DischargeStream flow was measured using a Marsh-McBirney Flowmate™ flowmeter at eachstation. Velocity and depth measurements were recorded at each station according toSOP, MDNR-WQMS-113 Flow Measurement in Open Channels (MDNR 2003c).
2.5 Fine SedimentIn-stream deposits of fine sediment (i.e. particle size ca. <2 mm) were estimated forpercent coverage per area and characterized for composition of total recoverable metals(TR, ug/kg). The ESP, CAS conducted metals analyses.
2.5.1 Fine Sediment EstimationsThe relative percentage of fine sediment (<2.0 mm) was visually estimated for eachstation. The visual estimates were conducted within a metal square (quadrat) that wasrandomly located in sample areas called grids (Figure 3). Each station contained threegrids. This method allowed for estimation and comparison of benthic fine sedimentbetween stations.
In order to ensure sampling method uniformity, grids were located at lower margins ofriffles or runs and the upper margin of pool habitats in areas of relatively laminar flow.This arrangement or placement of grids was similar to previous fine sediment assessmentprojects done by the WQMS (MDNR-WQMS Reports: Flat River 2001; Bull Creek2002a; Upper Big River 2001-2002). Water velocity was no greater than 0.5 feet persecond (fps), which allows fine sediment sized particles (<2.0mm) to settle according tothe Hjulstrom Diagram (1939) for threshold transport and settling velocities. A MarshMcBirney flow meter was used to determine the velocity. Depths did not exceed three(3.0) feet. Grids did not include eddies, bends, downstream of vegetation, or largeobstructions that have turbulent flow.
Once a suitable area was identified, a virtual grid was constructed (Figure 3). A 100’tape measure anchored across the stream symbolized the downstream edge of a virtualgrid of six contiguous transects. Each transect was 12” deep and as wide as the useablegrid and was identified by holding a retractable tape measure perpendicular to the 100’tape. The useable grid width included the width of the stream with relatively laminarflow that excluded eddies, vegetation, and large obstructions. Random numbers,equating to one foot increments, were drawn to determine where the quadrat was placedalong each transect. The quadrat was placed within the transect, with the downstreamedge contacting the downstream transect edge. Two observers estimated/recorded thepercent of fine sediment within the quadrat. The estimates were accepted and recorded ifthe two observations were within a ten percent margin of error or rejected and repeateduntil the margin of error was reached. Another random number was drawn and thequadrat was randomly placed in the next transect upstream where the next observationwas made. This continued until fine sediment was estimated in each of the six quadrats(one per transect).

Biological Assessment and Fine Sediment StudyEaton Branch, St. Francois CountyPage 10 of 27
Figure 3: Virtual grid of transects (T) and quadrats (in gray, numbered) for estimating percent fine sediment.Example: stream 20’ wide; quadrat placement based on random numbers (e.g. 18, 9, 4, 17, 8, 2).
RIFFLE
(Upstream)
T6 2
T5 8
T4 17
T3 4
T2 9
T1 18
1 2 3 4 5 6 7 8 9 10 11 12 13 14 15 16 17 18 19 20
Tape Measure Reading(feet)
POOL
Biological Assessment and Fine Sediment StudyEaton Branch, St. Francois CountyPage 11 of 27
2.5.2 Fine Sediment CharacterFine sediment was characterized by identifying its content of total recoverable cadmium,lead, and zinc (ug/kg). One composite sample of the fine sediment was collected at eachgrid (downstream from riffle). Each composite consisted of three (3) two-ounce grabsamples of fine sediment sized particles that were dredged from the substrate and placedinto an eight-ounce glass jar. Dredging depth did not exceed two inches. The flat surfaceof the two-ounce jar lid was used to retain the fine sediment while the jar was retrievedthrough the water column. If fine sediment was not found in sufficient quantities withinthe grid, a representative composite collection was collected near the study grid. A totalof three composite samples were collected and analyzed for each station. Samples werekept on ice and delivered to the ESP, CAS in Jefferson City, Missouri to be analyzed.
2.5.3 Fine Sediment Data AnalysesThe fine sediment estimates and characterizations were compared between controlstations and test stations and acceptable levels.
The mean of the two fine sediment estimations per quadrat was entered for testing finesediment. Statistical analyses were conducted on the differences between stations usingSigmaStat, Version 2.0 (1997). The Mann-Whitney Rank Sum test was conducted on thefine sediment estimations per station. This illustrated significant differences (p<0.05)between sample stations. Data for all quadrats in each station (n=18 quadrats) wereincluded in the comparison between stations. Thirty-six observations of fine sedimentwere used in the fine sediment estimation comparison for Eaton Branch and Cub Creek.
The character of the fine sediment was compared using two methods. The first was acomparison of the amounts of heavy metals in the sediment between Eaton Branch andCub Creek. The Student t-test was used to identify differences (p<0.05) in the meanconcentrations of sediment metals per station (n=3). Second, the levels of heavy metalsfound at all stations were compared to Probable Effects Levels (PELs, Ingersoll et al.1996). Data from three composite samples were used in the analyses for each station.
2.6 Quality ControlQuality control was conducted according to MDNR Standard Operating Procedures(SOPs) and Project Procedures (PPs). Duplicate biological assessments andmacroinvertebrate and physicochemical water sampling and analyses were conducted onCub Creek for quality control during the spring 2004 season.
3.0 Results and AnalysesResults include stream habitat assessments, biological assessments, discharge, and finesediment estimation and characterizations for Eaton Branch and Cub Creek.
3.1 Stream Habitat AssessmentThe stream habitat was assessed at Eaton Branch and Cub Creek (Table 3). Eaton Branchhad a score of 120, while Cub Creek scored 142. Eaton Branch stream habitat was 84.5percent the quality of the Cub Creek stream habitat control.

Biological Assessment and Fine Sediment StudyEaton Branch, St. Francois CountyPage 12 of 27
Table 3Stream Habitat Assessment Scores for Cub Creek and Eaton Branch, Spring 2004
(March 23 and 24, 2004)Stations Eaton Branch #1 Cub Creek #1Stream Habitat Score 120 142Percent of Control (Cub Creek) 84.5 100
3.2 Biological AssessmentBiological assessments consisted of macroinvertebrate community analyses andphysicochemical water quality to determine the ecological integrity of each station.
3.2.1 Macroinvertebrate Community AnalysesMacroinvertebrate community data were analyzed using three strategies. StreamCondition Index (SCI) scores, individual biological criteria metrics, and dominantmacroinvertebrate families (DMF) were examined and compared. All results weregrouped by season and station.
The SCI score at Eaton Branch (12) was not similar to the SCI at Cub Creek (20) in thefall (Table 4). This score indicated that Eaton Branch is partially supporting of thebiological community, while Cub Creek is fully supporting of the biological community.
Individual metrics were not similar between Eaton Branch and Cub Creek in the fall, withone exception (Table 4). Taxa richness at Eaton Branch (39) was less than half of CubCreek (98). The EPT taxa at Eaton Branch (7) were nearly four times less than CubCreek (27). The BI was similar between Eaton Branch (5.33) and Cub Creek (4.43). TheSDI at Eaton Branch (2.08) was much less than Cub Creek (3.41) in the fall.
Table 4Fall 2003 Biological Criteria (n=7) Metric Scores and Stream Condition Index (SCI)Scores for Eaton Branch and Cub Creek Stations. (SCI Scoring Table in light gray)
Station Eaton Branch #1 Cub Creek #1 Score 5 Score 3 Score 1Sample # 0318730 Sample # 0318731
Taxa Richness 39 (Score =3) 98 (Score = 5) >78 78-39 <39EPT Taxa 7 (Score = 1) 27 (Score = 5) >21 21-10 <10Biotic Index 5.33 (Score = 5) 4.43 (Score = 5) <5.78 5.78-7.89 >7.89Shannon DI 2.08 (Score = 3) 3.41 (Score = 5) >3.08 3.08-1.54 <1.54SCI 12 20 20-16 14 - 10 8-4BiologicalSupportCategory
Partial Full Full Partial Non
Biological Assessment and Fine Sediment StudyEaton Branch, St. Francois CountyPage 13 of 27
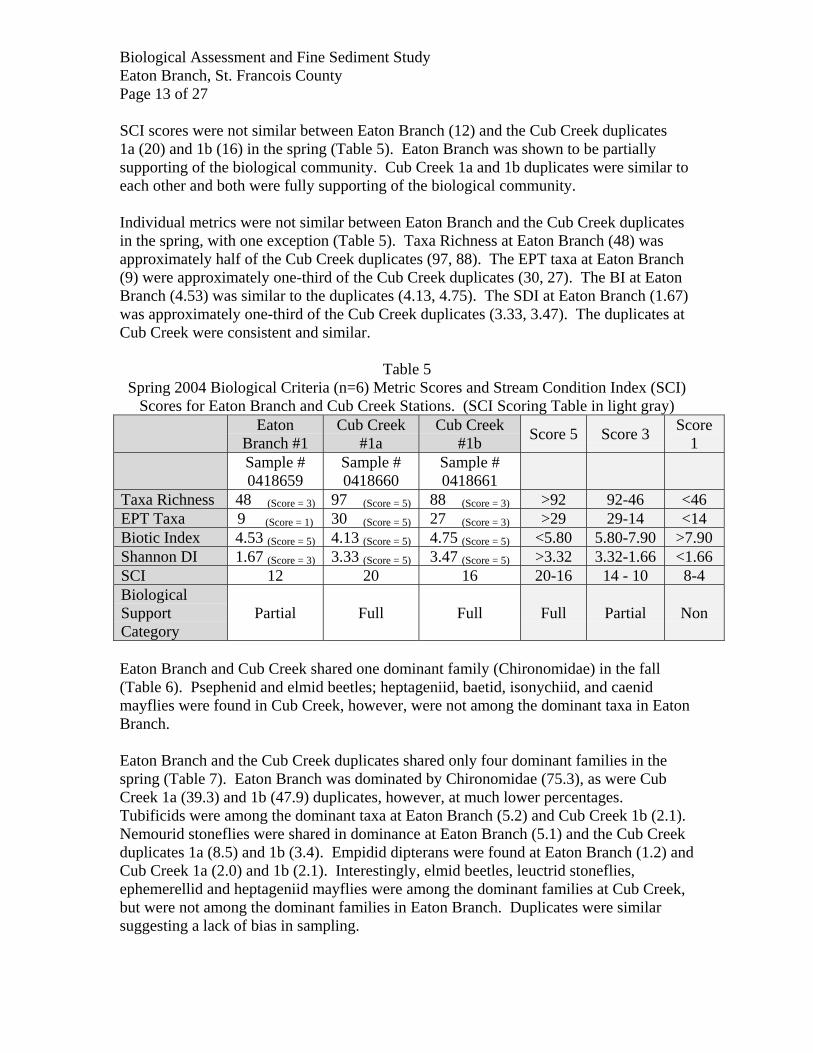
SCI scores were not similar between Eaton Branch (12) and the Cub Creek duplicates1a (20) and 1b (16) in the spring (Table 5). Eaton Branch was shown to be partiallysupporting of the biological community. Cub Creek 1a and 1b duplicates were similar toeach other and both were fully supporting of the biological community.
Individual metrics were not similar between Eaton Branch and the Cub Creek duplicatesin the spring, with one exception (Table 5). Taxa Richness at Eaton Branch (48) wasapproximately half of the Cub Creek duplicates (97, 88). The EPT taxa at Eaton Branch(9) were approximately one-third of the Cub Creek duplicates (30, 27). The BI at EatonBranch (4.53) was similar to the duplicates (4.13, 4.75). The SDI at Eaton Branch (1.67)was approximately one-third of the Cub Creek duplicates (3.33, 3.47). The duplicates atCub Creek were consistent and similar.
Table 5Spring 2004 Biological Criteria (n=6) Metric Scores and Stream Condition Index (SCI)
Scores for Eaton Branch and Cub Creek Stations. (SCI Scoring Table in light gray)Eaton
Branch #1Cub Creek
#1aCub Creek
#1b Score 5 Score 3 Score1
Sample #0418659
Sample #0418660
Sample #0418661
Taxa Richness 48 (Score = 3) 97 (Score = 5) 88 (Score = 3) >92 92-46 <46EPT Taxa 9 (Score = 1) 30 (Score = 5) 27 (Score = 3) >29 29-14 <14Biotic Index 4.53 (Score = 5) 4.13 (Score = 5) 4.75 (Score = 5) <5.80 5.80-7.90 >7.90Shannon DI 1.67 (Score = 3) 3.33 (Score = 5) 3.47 (Score = 5) >3.32 3.32-1.66 <1.66SCI 12 20 16 20-16 14 - 10 8-4BiologicalSupportCategory
Partial Full Full Full Partial Non
Eaton Branch and Cub Creek shared one dominant family (Chironomidae) in the fall(Table 6). Psephenid and elmid beetles; heptageniid, baetid, isonychiid, and caenidmayflies were found in Cub Creek, however, were not among the dominant taxa in EatonBranch.
Eaton Branch and the Cub Creek duplicates shared only four dominant families in thespring (Table 7). Eaton Branch was dominated by Chironomidae (75.3), as were CubCreek 1a (39.3) and 1b (47.9) duplicates, however, at much lower percentages.Tubificids were among the dominant taxa at Eaton Branch (5.2) and Cub Creek 1b (2.1).Nemourid stoneflies were shared in dominance at Eaton Branch (5.1) and the Cub Creekduplicates 1a (8.5) and 1b (3.4). Empidid dipterans were found at Eaton Branch (1.2) andCub Creek 1a (2.0) and 1b (2.1). Interestingly, elmid beetles, leuctrid stoneflies,ephemerellid and heptageniid mayflies were among the dominant families at Cub Creek,but were not among the dominant families in Eaton Branch. Duplicates were similarsuggesting a lack of bias in sampling.

Biological Assessment and Fine Sediment StudyEaton Branch, St. Francois CountyPage 14 of 27
Table 6Dominant Macroinvertebrate Families (DMF) as a Percentage of the Total Number of
Individuals per Station, Fall 2003Station Eaton Branch #1 Cub Creek #1Sample Number 0318730 0318731Chironomidae 53.6 13.4Leptoceridae 14.9 --Tubificidae 9.3 --Coenagrionidae 8.6 --Asellidae 2.8 --Tipulidae 2.6 --Hydroptilidae 1.5 --Calopterygidae 1.0 --Psephenidae -- 24.5Elmidae -- 20.7Heptageniidae -- 8.0Baetidae -- 3.8Isonychiidae -- 3.8Hyalellidae -- 2.4Caenidae -- 2.1
Table 7Dominant Macroinvertebrate Families (DMF) as a Percentage of the Total Number of
Individuals per Station, Spring 2004Station Eaton Branch #1 Cub Creek #1a Cub Creek #1bSample Number 0418659 0418660 0418661Chironomidae 75.3 39.3 47.9Tubificidae 5.2 -- 2.1Nemouridae 5.1 8.5 3.4Simuliidae 2.7 -- --Coenagrionidae 1.8 -- --Ceratopogonidae 1.2 -- --Caenidae 1.2 -- --Empididae 1.2 2.0 2.1Elmidae -- 14.5 13.5Leuctridae -- 13.8 7.0Ephemerellidae -- 2.6 2.0Arachnoidea -- 1.9 --Heptageniidae -- 1.9 3.0
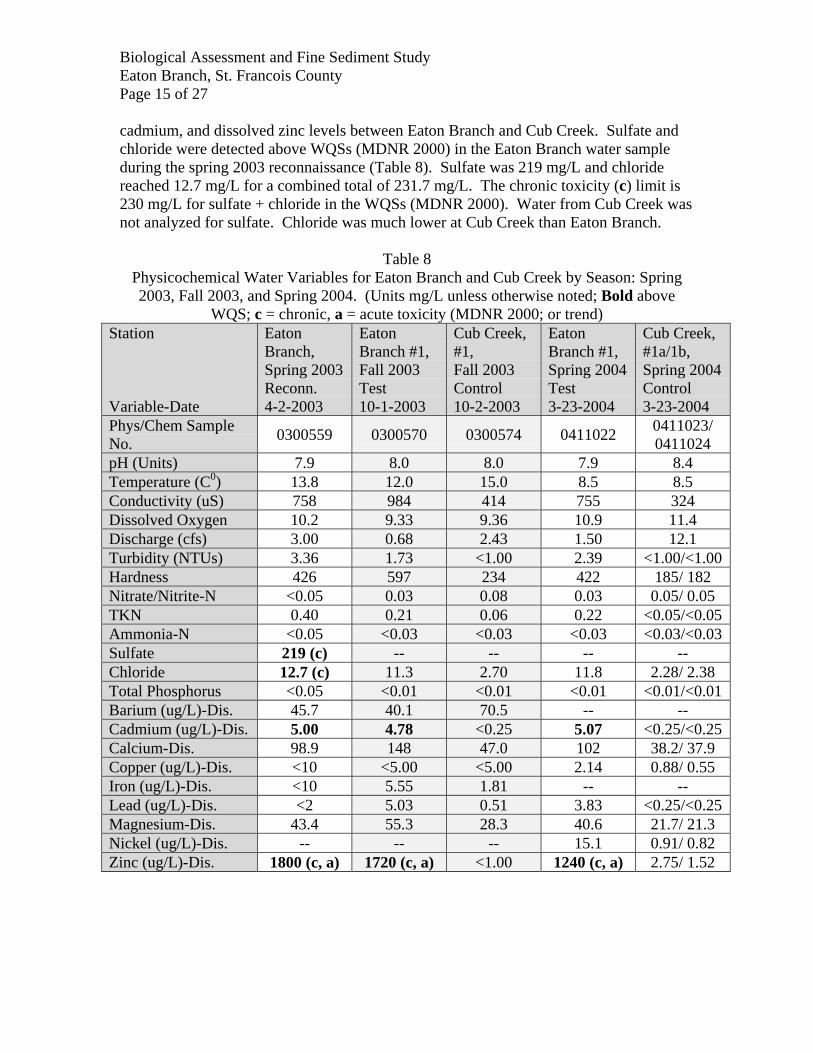
3.2.2 Physicochemical Water VariablesPhysicochemical water variables for Eaton Branch and Cub Creek were compared to eachother and to WQSs (Table 8). There were notable results in sulfate + chloride, dissolved
Biological Assessment and Fine Sediment StudyEaton Branch, St. Francois CountyPage 15 of 27
cadmium, and dissolved zinc levels between Eaton Branch and Cub Creek. Sulfate andchloride were detected above WQSs (MDNR 2000) in the Eaton Branch water sampleduring the spring 2003 reconnaissance (Table 8). Sulfate was 219 mg/L and chloridereached 12.7 mg/L for a combined total of 231.7 mg/L. The chronic toxicity (c) limit is230 mg/L for sulfate + chloride in the WQSs (MDNR 2000). Water from Cub Creek wasnot analyzed for sulfate. Chloride was much lower at Cub Creek than Eaton Branch.
Table 8Physicochemical Water Variables for Eaton Branch and Cub Creek by Season: Spring2003, Fall 2003, and Spring 2004. (Units mg/L unless otherwise noted; Bold above
WQS; c = chronic, a = acute toxicity (MDNR 2000; or trend)Station
Variable-Date
EatonBranch,Spring 2003Reconn.4-2-2003
EatonBranch #1,Fall 2003Test10-1-2003
Cub Creek,#1,Fall 2003Control10-2-2003
EatonBranch #1,Spring 2004Test3-23-2004
Cub Creek,#1a/1b,Spring 2004Control3-23-2004
Phys/Chem SampleNo. 0300559 0300570 0300574 0411022 0411023/
0411024pH (Units) 7.9 8.0 8.0 7.9 8.4Temperature (C0) 13.8 12.0 15.0 8.5 8.5Conductivity (uS) 758 984 414 755 324Dissolved Oxygen 10.2 9.33 9.36 10.9 11.4Discharge (cfs) 3.00 0.68 2.43 1.50 12.1Turbidity (NTUs) 3.36 1.73 <1.00 2.39 <1.00/<1.00Hardness 426 597 234 422 185/ 182Nitrate/Nitrite-N <0.05 0.03 0.08 0.03 0.05/ 0.05TKN 0.40 0.21 0.06 0.22 <0.05/<0.05Ammonia-N <0.05 <0.03 <0.03 <0.03 <0.03/<0.03Sulfate 219 (c) -- -- -- --Chloride 12.7 (c) 11.3 2.70 11.8 2.28/ 2.38Total Phosphorus <0.05 <0.01 <0.01 <0.01 <0.01/<0.01Barium (ug/L)-Dis. 45.7 40.1 70.5 -- --Cadmium (ug/L)-Dis. 5.00 4.78 <0.25 5.07 <0.25/<0.25Calcium-Dis. 98.9 148 47.0 102 38.2/ 37.9Copper (ug/L)-Dis. <10 <5.00 <5.00 2.14 0.88/ 0.55Iron (ug/L)-Dis. <10 5.55 1.81 -- --Lead (ug/L)-Dis. <2 5.03 0.51 3.83 <0.25/<0.25Magnesium-Dis. 43.4 55.3 28.3 40.6 21.7/ 21.3Nickel (ug/L)-Dis. -- -- -- 15.1 0.91/ 0.82Zinc (ug/L)-Dis. 1800 (c, a) 1720 (c, a) <1.00 1240 (c, a) 2.75/ 1.52

Biological Assessment and Fine Sediment StudyEaton Branch, St. Francois CountyPage 16 of 27
Dissolved cadmium was present at Eaton Branch, but not at Cub Creek (Table 8). In thespring of 2003, dissolved cadmium reached 5.0 ug/L. The fall sample contained 4.78ug/L and the spring 2004 sample contained 5.07 ug/L. The chronic toxicity level ofdissolved cadmium is 15.5 ug/L for General Warm-Water Fisheries (GWWF) with ahardness >200 mg/L Ca CO3. The WQS (MDNR 2000) was not exceeded at EatonBranch. Dissolved cadmium was not detected (<0.25 ug/L) in Cub Creek.
Dissolved zinc in the water was clearly different between Eaton Branch and Cub Creek(Table 8). Eaton Branch exceeded WQSs (MDNR 2000) on all three visits. Dissolvedzinc was 1800 ug/L in spring 2003, 1720 ug/L in fall 2003, and 1240 ug/L in spring 2004.Chronic (433 ug/L) and acute (479 ug/L) Water Quality Standards (MDNR 2000) for aGWWF at a hardness >200 mg/L CaCO3 were greatly exceeded at Eaton Branch. CubCreek had a dissolved zinc concentration of <1.0 ug/L during the fall and 2.75 ug/L and1.52 ug/L in the spring duplicates.
3.2.2.1 DischargeDischarge was relatively similar between Eaton Branch and Cub Creek (Table 8). Thespring 2003 discharge was 3 cfs at Eaton Branch. Eaton Branch discharge in fall 2003was 0.68 cfs, while Cub Creek discharge was 2.43 cfs. Discharge at Eaton Branch in thespring was 1.50 cfs, while Cub Creek discharge was 12.1 cfs.
3.3 Fine SedimentThe fine sediment study consisted of comparisons between Eaton Branch and Cub Creekin the amount of fine sediment and sediment character (metals concentration). Statisticaltests were conducted on either means or medians, however, tables contain mean values.
3.3.1 Fine Sediment EstimationsFine sediment estimations were much higher at Eaton Branch than at Cub Creek (Table9). The mean of fine sediment estimated was 78 (s.d.+21) percent at Eaton Branch andfour (4; s.d.+3) percent at Cub Creek. The difference between the means is 74 percent.A SigmaStat report sheet for fine sediment statistical test is included as Appendix C. Thenormality test failed (p<0.001) using the student t-test, so a Mann-Whitney rank sum testwas conducted between the medians at the two streams. Eaton Branch had significantlymore (p<0.001; T = 495.000) fine sediment on the substrate than did Cub Creek.
3.3.2 Fine Sediment CharacterThe character (heavy metals concentrations) of the sediment was much different at EatonBranch than at Cub Creek. High concentrations of cadmium, lead, and zinc were foundin the fine sediment substrate at Eaton Branch. Cub Creek fine sediment metalsconcentrations were low. Concentrations of heavy metals in the sediment were comparedto Probable Effects Levels (PELs, Ingersoll et al. 1996).

Biological Assessment and Fine Sediment StudyEaton Branch, St. Francois CountyPage 17 of 27
Table 9Fine Sediment Estimates (Percent) for Stations/Grid and Quadrat;
Mean and Standard Deviation (s.d.) per Station.(Six quadrats per grid or 18 per station)
Grid-Quadrat
Eaton Branch #1Test StationOctober 1, 2003 (%)
Cub Creek #1Control StationOctober 2, 2003 (%)
1-1 66 51-2 90 61-3 96 11-4 96 21-5 90 21-6 82 22-1 38 42-2 96 62-3 96 12-4 44 102-5 80 22-6 96 83-1 28 13-2 88 103-3 83 103-4 91 23-5 68 63-6 86 1Mean Percentage 78 4s.d. 21 3
The mean concentration of cadmium in the sediment was much higher at Eaton Branchthan at Cub Creek (Table 10). The mean amount of cadmium in the sediment at EatonBranch was 67,100 (+10,802) ug/kg while Cub Creek samples contained 60 (+5.3) ug/kg.The difference between means was 67,040 ug/kg. A t-test was conducted on thecadmium concentrations in the sediment (Appendix C). There was a significantdifference (p=0.001; t = 10.750, d.f. = 4) in the concentrations of cadmium in the finesediment sized particles at Eaton Branch and Cub Creek. The PEL for sedimentcadmium (3,200 ug/kg) was greatly exceeded at Eaton Branch.

Biological Assessment and Fine Sediment StudyEaton Branch, St. Francois CountyPage 18 of 27
Table 10Cadmium Levels (ug/kg) in Sediment per Grid; Means and Standard Deviations (s.d.) per
Station. Sediment Cadmium Probable Effects Level (PEL)=3,200 ug/kg(Ingersoll et al. 1996). Bold=above PELEaton Branch #1 Cub Creek #1
Grid 1 78,900 55Grid 2 57,700 61Grid 3 64,700 66Mean 67,100 60s.d. 10,802 5
The mean concentration of lead in the sediment was much higher at Eaton Branch than atCub Creek (Table 11). The mean amount of lead in the sediment at Eaton Branch was2,243,333 (993,244) ug/kg, while Cub Creek samples contained 12, 843 (+9,844) ug/kg.The difference between means was 2,230,490 ug/kg. A t-test was conducted on the leadconcentrations in the sediment (Appendix C). There was a significant difference(p=0.018; t = 3.889 with 4 d.f.) in the concentration of lead in the fine sediment sizedparticles at Eaton Branch and Cub Creek. The PEL for sediment lead (82,000 ug/kg) wasgreatly exceeded at Eaton Branch.
Table 11Lead Levels (ug/kg) in Sediment per Grid; Means and Standard Deviations (s.d.) per
Station. Sediment Lead Probable Effects Level (PEL)=82,000 ug/kg(Ingersoll et al. 1996). Bold=above PELEaton Branch #1 Cub Creek #1
Grid 1 2,490,000 24,200Grid 2 1,150,000 7,560Grid 3 3,090,000 6,770Mean 2,243,333 12,843s.d. 993,244 9,844
The mean concentration of zinc in the sediment was higher at Eaton Branch than CubCreek (Table 12). The mean amount of zinc in the sediment at Eaton Branch was2,013,333 (+579, 511) ug/kg, while Cub Creek samples contained 16, 833 (+929) ug/kg.The difference between means was 1,996,500 ug/kg. A t-test was conducted on the zincconcentrations in the sediment (Appendix C). There was a significant difference(p=0.004; t = 5.967 with 4 d.f.) in the concentration of zinc in the fine sediment sizedparticles at Eaton Branch and Cub Creek. The PEL for sediment zinc (540,000 ug/kg)was greatly exceeded at Eaton Branch.

Biological Assessment and Fine Sediment StudyEaton Branch, St. Francois CountyPage 19 of 27
Table 12Zinc Levels (ug/kg) in Sediment per Grid; Means and Standard Deviations (s.d.) per
Station. Sediment Zinc Probable Effects Level (PEL)=540,000 ug/kg(Ingersoll et al. 1996). Bold=above PELEaton Branch #1 Cub Creek #1
Grid 1 2,680,000 17,900Grid 2 1,730,000 16,200Grid 3 1,630,000 16,400Mean 2,013,333 16,833s.d. 579,511 929
4.0 DiscussionThe discussion includes the stream habitat assessment, biological criteria metrics,physicochemical water variables, and fine sediment quantity and character study. Themacroinvertebrate response may illustrate an association with several variables.
4.1 Stream Habitat AssessmentStream habitat at Eaton Branch was considered to be comparable to the stream habitatcontrol. It appears that the stream habitat in general did not obviously impair thebiological community.
4.2 Biological Criteria MetricsEaton Branch individual rank scores were much lower than Cub Creek scores during bothseasons. This indicated that a substantial and constant influence was affecting thecommunity. Total SCI scores at Eaton Branch and individual metric SCI scores wereidentical (Table 4 and Table 5) during both seasons. This suggested that the influence onEaton Branch was consistent between seasons. Results indicated that Eaton Branch waspartially supporting of the biological community during both seasons. Themacroinvertebrate community at Eaton Branch was not similar to Cub Creek.
By interpreting the biological criteria metrics, it appeared that the macroinvertebratecommunity at Eaton Branch had fewer EPT taxa, was less diverse, and less evenlydistributed than Cub Creek and the BIOREF streams. However, the BI at Eaton Branchwas similar and consistent with the control BI and scored well with the BIOREFs in bothseasons. This suggested that organic pollution was probably not contributing to theimpairment, short or long-term.
4.3 Physicochemical Water QualitySulfate and chloride levels combined were high at Eaton Branch and exceeded WQSs(MDNR 2000) during one season. Chronic toxicity levels (230 mg/L) were exceeded inthe spring 2003 reconnaissance sample (231.7 mg/L). Since sulfate was sampled onlyduring one season (spring 2003) it is not known if it is consistently high. However,chloride levels were consistent during all three seasons, which suggested that the inputwas continuous. High sulfate and chloride in the water are possible in intensively mined
Biological Assessment and Fine Sediment StudyEaton Branch, St. Francois CountyPage 20 of 27
areas. At such high levels, they may be affecting the ecological integrity. Dissolvedcadmium was present during all three seasons at Eaton Branch, however, did not exceedWQSs (MDNR 2000). Dissolved cadmium is an expected component in an area such asthe Big River watershed, where lead mining was prevalent for many years. Eaton Branchdrains the Leadwood Tailings Piles (Ponds) which may explain the cadmium in the watercolumn.
Dissolved zinc occurred at very high levels at Eaton Branch and greatly exceeded WQSs(MDNR 2000) during all three seasons. Dissolved zinc ranged from 1800 ug/kg in thespring of 2003 down to 1240 ug/kg in the spring of 2004. The chronic toxicity level(433 ug/L) and acute toxicity level (479 ug/L) were greatly exceeded for GWWF with ahardness >200 mg/L. Schmitt and Finger (1982) suggested that zinc was probablytransported as a liquid, especially during high flow. It is possible that the dissolved zincwas eluting from the fine sediment on the substrate of the stream or from surface orsubsurface flow through the tailings ponds upstream.
Sulfate (and chloride) and dissolved zinc in the water were above WQSs (MDNR 2000),suggesting that the water quality may have contributed to the impaired community. Itappears that the water quality at Eaton Branch was not similar to Cub Creek and was apotential cause for impairment.
4.4 Fine Sediment EstimationFine sediment deposition may explain the differences in the metrics between EatonBranch and Cub Creek. Fine sediments and silt clog the interstitial voids between thelarger particles in the substrate and can have destructive effects on invertebrates and fishcommunities (Chutter 1969; Murphy et al. 1981; Berkman and Rabeni 1987; Smale et al.1995). According to Zweig and Rabeni (2001), density of observed taxa decreasesdramatically with as little as 30 percent fine sediment coverage of the substrate. Finesediment was observed covering a mean of 78 (+21) percent of the substrate at EatonBranch, which probably influenced the density. Zweig and Rabeni (2001) also found thattaxa richness and EPT taxa were significantly negatively correlated with increased finesediment on the substrate. Eaton Branch had approximately one-half of the TR, one-thirdof the EPTT, and one-third of the diversity and evenness of Cub Creek during bothseasons. Cub Creek had little fine sediment on the substrate. The high quantity of finesediment on the substrate at Eaton Branch may have contributed to the impairedmacroinvertebrate community.
Interestingly, the BI at Eaton Branch was equal to Cub Creek during both seasons andscored well, which suggested that organic pollution was not responsible for the lowermetrics at Eaton Branch. Zweig and Rabeni (2001) found that the BI was not related tofine sediment deposition, which is consistent with this study.

Biological Assessment and Fine Sediment StudyEaton Branch, St. Francois CountyPage 21 of 27
4.5 Fine Sediment CharacterizationThe fine sediment substrate was characterized for its concentration of heavy metals.Cadmium, lead, and zinc were found in high concentrations in the sediment at EatonBranch, while sediment metals in Cub Creek were found in low concentrations. Meanconcentrations for all three metals exceeded PELs (Ingersoll et al. 1996) at Eaton Branch.Relative concentrations were consistent with sediment sampling and analyses (Cd76,000; Pb 2,490,000; Zn 3,910,000) conducted by ESP in November 2003 at EatonBranch (Nodine pers. comm. 2004).
Metals can affect aquatic organisms as toxic substances in water and sediment, or as atoxicant in the food chain (Sorensen 1991; Rainbow 1996). Metals concentrations can bethe same or greater in benthic macroinvertebrates as is found in the water (Kiffney andClements 1993). Kiffney and Clements (1993) suggested that metals sensitivity ofmacroinvertebrates was related to feeding habits. Herbivorous EPT had the highestmetals concentrations, while predators contained lower quantities (Burrows and Whitton1983; Kiffney and Clements 1993). Besser et al. (1987) stated that aquatic organisms intributaries of Big River located downstream from tailings piles contained highconcentrations of lead, cadmium, and other heavy metals. It appears that the character(metals content) of the fine sediment at Eaton Branch may have been related to thenegative metric response.
4.6 Macroinvertebrate ResponseElmid and psephenid beetles were not among the dominant taxa at Eaton Branch, whilethey were relatively abundant at Cub Creek. Heptageniidae, Isonychidae, and Baetidaemayflies were not prevalent at Eaton Branch, yet were among the dominant taxa at CubCreek. Zweig and Rabeni (2001) consider these taxa intolerant to excessive finesediment. The amount of fine sediment on the substrate may have deterred taxa fromoccupying Eaton Branch.
High levels of dissolved or sediment heavy metals may also have contributed to theimpaired community at Eaton Branch. The number of taxa and the abundance of mostdominant taxa are reduced and mayflies are significantly reduced (Clements et al. 1988)with exposure to cadmium or zinc. Maret et al. (2003) found that several metals sensitiveEphemeroptera had a significant negative correlation with metals concentrations in waterand sediment (r=-0.54 to -0.70) and were significantly lower in number at metalscontaminated streams versus reference streams. The most commonly observed changesin benthic communities exposed to metals included reduced Ephemeroptera andconcomitant increases in abundance of Chironomindae and/or Hydropyschidae (Clements1991). When exposed to increasing amounts of heavy metals, the dominant taxon shiftsfrom mayflies to caddisflies to chironomids (Winner et al. 1980). An examination ofDMFs in Eaton Branch illustrates very similar results, in that Ephemeroptera were notamong the dominant taxa and Chironomidae were found as the highest percentage amongthe DMFs. Cub Creek contained a variety of mayflies and fewer midges.
Biological Assessment and Fine Sediment StudyEaton Branch, St. Francois CountyPage 22 of 27
The metal sensitivity of mayflies in field and laboratory studies is well established(Winner et al. 1980). Low abundance of Heptagneniidae mayflies is one of the mostuseful indicators of metals pollution (Clements et al. 2000). Heptageniid mayflies wereabsent from Eaton Branch and abundant in Cub Creek (Appendix B). Baetis spp. alsoappear to be an extremely sensitive indicator of metal toxicity (Kiffney and Clements1993). Appendix B shows that Baetis spp. were not found in Eaton Branch, however,they were abundant in Cub Creek. Clements et al. (1988) also consider Isonychia spp. tobe sensitive to heavy metals. Isonychia spp. were absent from test stations. Resultssuggest that either dissolved and/or sediment metals may be impairing themacroinvertebrate community in Eaton Branch.
5.0 ConclusionIn general, the stream habitat at Eaton Branch was not impaired. The Eaton Branchmacroinvertebrate community was impaired during both seasons. The water quality mayhave been impaired by sulfate and chloride and dissolved zinc, which were found aboveWQSs (MDNR 2000). Fine sediment was observed in large quantities on the substrateand contained high concentrations of heavy metals (cadmium, lead, and zinc) above PELs(Ingersoll et al. 1996). The BI was similar and consistent with the BI at Cub Creek,which suggested that organic pollution was not the contributor to impairment. It appearsthat Eaton Branch is impaired by constituents from past mining practices and maycontribute fine sediment and heavy metals to Big River.
The objectives were met by assessing the macroinvertebrate community integrity,physicochemical water quality, stream habitat, and fine sediment quantity and character.The null hypotheses were addressed. The stream habitat at Eaton Branch was similar toCub Creek. The macroinvertebrate community integrity at Eaton Branch was not similarto Cub Creek. The physicochemical water quality was not similar. The quantity andcharacter of the fine sediment on the substrate at Eaton Branch was not similar to CubCreek.
6.0 Recommendations• Detain fine sediment and water containing heavy metals from entering Eaton Branch.
• Periodically monitor water for heavy metals.
• Conduct biological assessments on other tributaries to Big River that drain minetailings.
7.0 Literature CitedBerkman, H.E., and C.F. Rabeni. 1987. Effects of siltation on stream fish communities.
Environmental Biology of Fishes 18:285-294.
Besser, J.M. and C.F. Rabeni. 1987. Bioavailability and toxicity of metals leached fromlead mine tailings to aquatic invertebrates. Environmental Toxicology andChemistry, 6:879-890. (120.2R.64)

Biological Assessment and Fine Sediment StudyEaton Branch, St. Francois CountyPage 23 of 27
Burrows, I.G. and B.A. Whitton. 1983. Heavy metals in water, sediments, andinvertebrates from a metal-contaminated river free of organic pollution.Hydrobiologia 106. pp. 263-273.
Carlisle, D.M., and W.H. Clements. 1999. Sensitivity and variability of metrics used inbiological assessments of running waters. Environmental Toxicology andChemistry. 18:285-291.
Chutter, R.M. 1969. The effects of silt and sand on the invertebrate fauna of streams andrivers. Hydrobiologia 34:57-76.
Clements, W. H. 1991. Community responses of stream organisms to heavy metals:A review of descriptive and experimental approaches. In M. C. Newman and A.W. McIntosh, eds., Ecotoxicology of Metals: Current Concepts and Applications.Lewis, Chelsea, MI, pp. 363-391.
Clements, W.H., D.M. Carlisle, J.M. Lazorchak, and P.C. Johnson. 2000. Heavy metalsstructure benthic communities in Colorado mountain streams. EcologicalApplications, 10(2):626-638.
Clements, W.H., D.S. Cherry, and J. Cairns, Jr. 1988. Impact of heavy metals on insectcommunities in streams: A comparison of observational and experimental results.Can. J. Fish. Aquat. Sci. 45:2017-2025.
Czarnezki, J.M. 1985. Use of the pocket mussel, Lampsilis ventricosa, for monitoringheavy metal pollution in an Ozark stream. Bull. Environ. Contam. Toxicol.38:641-646.
Eisler, R. 1988. Lead hazards to fish, wildlife, and invertebrates: A synoptic review.U.S. Fish and Wildlife, U.S. Department of the Interior. BiologicalReport 85 (1.14). 135 pp.
Fluor Daniel Environmental Services. 1995. Initial remedial investigation. Big Rivermine tailings sites, Old Lead Belt, St. Francois, Missouri. Prepared by FluorDaniel Environmental Services, 3333 Michelson Dr., Irvine, California 92730.Contract No. 04438907. Prepared for The Doe Run Company.
Hjulstrom, F. 1939. Transportation of detritus by moving water. In Recent MarineSediments, a Symposium (Ed. P.D.Trask). American Assn. of PetroleumGeologists, Tulsa, Oklahoma. pp. 5-31.

Biological Assessment and Fine Sediment StudyEaton Branch, St. Francois CountyPage 24 of 27
Ingersoll, C. G., P.S. Haverland, E.L. Brunson, T.J. Canfield, F.J. Dwyer, C.E. Henke,N.E. Kemble, D.R. Mount, and R.G. Fox. 1996. Calculation and evaluation ofsediment effect concentrations for the amphipod Hyalella azteca and the midgeChironomus riparius. J. Great Lakes Res. 22(3): 602-623.
Jenett, J. C., B. G. Wixson, and R. L. Kramer. 1981. Some effects of century oldabandoned lead mining operations on streams in Missouri, USA. Minerals andthe Environment 3: 17-20.
Kiffney, P.M. and W.H. Clements. 1993. Bioaccumulation of heavy metals by benthicinvertebrates at the Arkansas River, Colorado. Environmental Toxicology andChemistry, Vol. 12. pp. 1507-1517
Kramer, R. L. 1976. Effects of a century old Missouri lead mining operation upon thewater quality, sediments, and biota of Flat River Creek. MS Thesis, University ofMissouri, Rolla, MO.
Maret, T.R., D.J. Cain, D.E. MacCoy, and T.M. Short. 2003. Response of benthicinvertebrate assemblages to metal exposure and bioaccumulation associated withhard-rock mining in northwestern streams, USA. J.N Am. Benthol. Soc. 22(4):598-620.
Meneau, K.J. 1997. Big River basin inventory and management plan. MissouriDepartment of Conservation. 106 pp.
Missouri Department of Natural Resources. 2000. Title 10. Rules of Department ofNatural Resources Division 20-Clean Water Commission, Chapter 7-WaterQuality. 10 CSR 20-7.031 Water Quality Standards. pp. 10-136.
Missouri Department of Natural Resources. 2001. Biological assessment and sedimentstudy: Flat River (Flat River Creek), St. Francois County. Air and LandProtection Division, Environmental Services Program, Water Quality MonitoringSection. A Final Report to MDNR, Water Pollution Control Program.40 pp. + app.
Missouri Department of Natural Resources. 2002a. Biological assessment and finesediment study: Effects of a floodplain gravel mine, Bull Creek, Christian andTaney Counties. Air and Land Protection Division, Environmental ServicesProgram, Water Quality Monitoring Section. A Final Report to MDNR, WaterPollution Control Program. 23 pp. + app.

Biological Assessment and Fine Sediment StudyEaton Branch, St. Francois CountyPage 25 of 27
Missouri Department of Natural Resources. 2002b. Biological criteria forwadeable/perennial streams of Missouri. Missouri Department of NaturalResources, Environmental Services Program, P.O. Box 176, Jefferson City,Missouri 65102. 32 pp.
Missouri Department of Natural Resources. 2003a. Biological assessment and finesediment study: Big River (lower): Irondale to Washington State Park,St. Francois, Washington, and Jefferson Counties, Missouri. Air and LandProtection Division, Environmental Services Program, Water Quality MonitoringSection. A Final Report to MDNR, Water Pollution Control Program.40 pp. + app.
Missouri Department of Natural Resources. 2003b. Biological assessment and finesediment study: Upper Big River, Washington County. Air and Land ProtectionDivision, Environmental Services Program, Water Quality Monitoring Section. AFinal Report to MDNR, Water Pollution Control Program. 24 pp. + app.
Missouri Department of Natural Resources. 2003c. Flow measurements in openchannels. Water Quality Monitoring Section-113. Environmental ServicesProgram, P.O. Box 176, Jefferson City, Missouri. 9 pp.
Missouri Department of Natural Resources. 2003d. Required/recommended containers,volumes, preservatives, holding times, and special sampling considerations. FieldServices Section-001. Environmental Services Program, P.O. Box 176, JeffersonCity, Missouri. 25 pp.
Missouri Department of Natural Resources. 2003e. Semi-quantitative macroinvertebratestream bioassessment project procedure. Field Services Section-030.Environmental Services Program, P.O. Box 176, Jefferson City, Missouri. 24 pp.
Missouri Department of Natural Resources. 2003f. Stream habitat assessment projectprocedure. Field Services Section-032. Environmental Services Program, P.O.Box 176, Jefferson City, Missouri. 40 pp.
Murphy, M.L., C.P. Hawkins, and N.H. Anderson. 1981. Effects of canopy modificationand accumulated sediment on stream communities. Transactions of the AmericanFisheries Society 110:469-478.
Rabeni, C.F., R.J. Sarver, N. Wang, G.S. Wallace, M. Weiland, and J.T. Peterson. 1997.Biological criteria for streams of Missouri. Missouri Cooperative Fish andWildlife Research Unit, University of Missouri-Columbia, Columbia, Missouri.261 pp.

Biological Assessment and Fine Sediment StudyEaton Branch, St. Francois CountyPage 26 of 27
Rainbow, P.S. 1996. Heavy metals in aquatic invertebrates. In W.N. Beyer, G.H. Heinz,and A.W. Redmon-Norwood (eds.). Environmental contaminants in wildlife.CRC Press, Boca Raton, Florida. pp. 405-426
Schmitt, C.J. and S.E. Finger. 1982. The dynamics of metals from past and presentmining activities in the Big and Black River watersheds, southeastern Missouri.Final Report for USCOE, St. Louis District, Project DACW43-80-A-0109.
Smale, M.A., C.F. Rabeni, and E.B. Nelson. 1995. Fish and invertebrate communities ofthe upper Niangua River in relation to water quality and riparian conditions.Missouri Cooperative Fish and Wildlife Research Unit. University of Missouri-Columbia, Columbia, Missouri 65211. 213 pp.
Sorenson, E.M. 1991. Metal poisoning in fish. CRC Press, Boca Raton, Florida.
Winner, R.W., M.W. Boessel, and M.P. Farrell. 1980. Insect community structure as anindex of heavy-metal pollution in lotic ecosystems. Can. J. Fish. Aquat. Sci.37:647-655.
Zachritz, W.H. 1978. The effects of the “Old Lead Belt” mining district of southeasternMissouri on the water quality and sediments of the Big River Basin. M.S. Thesis,University of Missouri-Rolla. Rolla, Missouri.
Zweig, L. D. and C. F. Rabeni. 2001. Biomonitoring for deposited sediment usingbenthic invertebrates: A test on four Missouri streams. Journal of the NorthAmerican Benthological Society 20 (4): 643-657.

Biological Assessment and Fine Sediment StudyEaton Branch, St. Francois CountyPage 27 of 27
Submitted by: _________________________________Kenneth B. ListerEnvironmental Specialist Environmental Services ProgramWater Quality Monitoring Section
Date: _________________________________
Approved by: _________________________________Earl W. PabstDirectorEnvironmental Services Program
EP:klt
c: John Ford, WPPGary Gaines, SERO Director
Appendix A
Missouri Department of Natural Resources Bioassessment and Sediment Study PlanEaton Branch
St. Francois CountyAugust 26, 2003

Missouri Department of Natural ResourcesBioassessment and Sediment Study Plan
Eaton Branch, St. Francois County
August 26, 2003
Background
Eaton Branch, St. Francois County, is a small stream that is approximately three mileslong in the Ozark/Meramec Ecological Drainage Unit (EDU). The stream originates nearWortham, Missouri, and confluences with Big River approximately one mile east ofLeadwood, Missouri (Figure 1). Most of the original Eaton Branch, south of MissouriState Highway 8 is now covered with what appears to be mine tailings. It also appearsthat flow is intermittent or subsurface south of Highway 8. Flow from north of MissouriHighway 8 to the confluence with Big River appears to be permanent or semi-permanent.The stream is a class “C” stream, which may cease flow, but maintain pools in dryweather (MDNR 2000).
Eaton Branch is one tributary of Big River that drains the historic Leadwood tailingsponds in what is known as the Old Lead Belt. The Leadwood mines and mill beganoperation in 1894 and continued with little interruption until 1965. The tailings pondsconsist of approximately 528 acres of inactive lead mine tailings (Fluor DanielEnvironmental Services 1995). Two tailings retaining structures capture drainage in thearea. Whether or not they are effective is not known. Runoff from these tailing pondsmay influence the aquatic communities on Eaton Branch, and subsequently Big River.
While Eaton Branch is not 303 (d) listed, approximately 80 miles of Big River,Washington County is 303 (d) listed for excessive sediment deposition, high lead andzinc values, presumably due to mine tailings runoff. Water runoff during rain eventserodes mine wastes, which has increased sedimentation in some lower portions of BigRiver. Portions of the stream are covered by fine-sediments that virtually eliminatesaquatic habitats used by some invertebrates. Fines and silt clog the interstitial voidsbetween the larger particles and can have destructive effects on invertebrates and fishcommunities (Chutter 1969; Murphy et al. 1981; Berkman and Rabeni 1987; Smale et al.1995). Metals such as copper, iron, lead, and zinc have been detected in aquatic fauna inareas of Big River. It is not known if the Leadwood tailings ponds upstream on EatonBranch contribute mine wastes to the stream or to Big River.
It is the Water Quality Monitoring Sections’ intention to determine if mine tailings areimpairing aquatic communities in Eaton Branch. Because of the streams small size, abiological comparison will be made to both wadeable/perennial biological criteria andcriteria calculated from similar sized control streams. During this study a biologicalassessment, habitat assessment and fine sediment study will be conducted on EatonBranch and Cub Creek, a same-size control stream.

Objectives
1) Determine if mine tailings are affecting the macroinvertebrate community and water quality of Eaton Branch.
2) Define the habitat quality of Eaton Branch, St. Francois County.
3) Determine if Eaton Branch is impaired by the quantity or character (metals content) of fine sediment sized particles.
Tasks
1) Conduct a bioassessment, including macroinvertebrates and water physicochemical analyses on Eaton Branch, St. Francois County, and Cub Creek, Washington, County.
2) Conduct a habitat assessment of Eaton Branch and Cub Creek.
3) Conduct a fine sediment percentage estimation and characterization study on Eaton Branch and Cub Creek.
Null Hypotheses
Eaton Branch macroinvertebrate metrics will be similar to biological criteria referencescores, and to the metrics on Cub Creek, a similar size control stream
Water quality at Eaton Branch will be similar to the similar size control stream, CubCreek #1 and within Water Quality Standards (MDNR 2000).
Habitat assessments at Eaton Branch and Cub Creek will be similar and fully sustainable.
There will be no significant difference (p > 0.05) in the fine sediment percentageestimates or character between Eaton Branch and Cub Creek. The metals content will bewithin acceptable concentrations.
Study Methods
General: The boundary on Eaton Branch, St. Francois County, is between the mouthand 0.5 miles upstream to Missouri State Highway 8 (Figure 1). Two stations will beused in this project for comparisons. The test station on Eaton Branch is located in theSE1/4 of Section 33; T.37N.,R.04E. Cub Creek #1 is the same-size control stream, and islocated at the SE1/4 of Section 32; T.36N.,R.01W. Biological assessments, habitatassessments, and a fine sediment study will be conducted on both stations by the WaterQuality Monitoring Section (WQMS), Environmental Services Program (ESP), Air andLand Protection Division (ALPD), Missouri Department of Natural Resources (MDNR).

Biological Assessment: Macroinvertebrates will be sampled according to the Semi-quantitative Macroinvertebrate Stream Bioassessment Project Procedure (SMSBPP;MDNR 2003b). Eaton Branch, St. Francois County is considered a “Riffle/Pool”predominant stream and habitats will be sampled accordingly. Habitats included in thesestreams are coarse-substrate, non-flow, and rootmat. Each station consists of a length oftwenty-times the stream’s average width, which includes at least two riffle sequences.Biological samples will be processed and identified according to MDNR-WQMS-209,Taxonomic Levels for Macroinvertebrate Identifications (MDNR 2001).
Macroinvertebrate data will be compared using two methods. Firstly, Eaton Branchmetrics will be a compared with MDNR’s wadeable/perennial stream biological criteriafor reference streams in the EDU, and for small control streams. Macroinvertebrate datawill be entered in a Microsoft Access database according to the MDNR StandardOperating Procedure WQMS-214, Quality Control Procedures for Data Processing(MDNR 2003a). Data analysis is automated within the Access database, so four standardmetrics are calculated: Total Taxa (TT); Ephemeroptera, Plecoptera, Trichoptera Taxa(EPTT); Biotic Index (BI); and the Shannon Diversity Index (SDI). Macroinvertebratedata from reference and small control streams within the Ozark/Meramec EDU will allowfor the calculation of a 25th percentile for the four metrics in the SMSBPP which are thencompared to the Eaton Branch station. Secondly, Stream Condition Indices (SCI) forEaton Branch will be calculated. Each of the four metrics receives a score whencompared to the biological criteria. The SCI is derived from the composite score from allfour metrics. Eaton Branch will be scored against these calculations and a compositescore (SCI) of 16 or greater will determine non-impairment. The SCI at Eaton Branchwill be compared to the SCI at Cub Creek, and small control streams in the biologicalcriteria database.
Other comparisons may be conducted to identify impairment. Additional metrics, such asPercent Taxon Similarity, or dominant macroinvertebrate families may be employed todiscern differences in taxa between control and test stations.
Biological assessments will be conducted on Eaton Branch and Cub Creek during the fall2003 and spring 2004 seasons.
Habitat Assessments: A standardized Stream Habitat Assessment Project Procedure(SHAPP) will be conducted (MDNR 2003c). Total scores will be compared betweenstreams, and the streams ability to sustain aquatic communities will be identified. Habitatassessments will be conducted at Eaton Branch and Cub Creek once during the study, inthe spring of 2003.
Water Quality Sampling: Water will be sampled in Eaton Branch, and Cub Creek.Physicochemical variables determined in the field will include: pH, temperature (C0),conductivity, dissolved oxygen, and discharge. Water samples collected for analysisinclude: turbidity, hardness (CaCO3), ammonia-nitrogen, nitrate+nitrite-nitrogen, TotalKjeldahl Nitrogen (TKN), chloride, total phosphorus; dissolved barium, calcium,

cadmium, copper, iron, magnesium, lead, and zinc. Samples will be handled according tothe Required/Recommended Containers, Volumes, Preservatives, Holding Times, andSpecial Sampling Considerations (MDNR 2002).
Water samples analyses will be conducted by the Environmental Services Program,Environmental Laboratory in Jefferson City, Missouri. The Water Quality MonitoringSection, will conduct analysis of turbidity. The Chemical and Analytical Section (CAS)will conduct the remaining analyses.
Water quality (physicochemical water variables) data will be analyzed using twomethods. Water quality data for Eaton Branch will be compared with data from CubCreek. Results will be compared to Missouri Water Quality Standards (MDNR 2000)and variables not within acceptable limits will be identified.
Water samples will be collected during the fall 2003 and spring 2004 seasons.
Sediment Percentage and Characterization: To ensure sampling method uniformity,depositional areas sampled will be in-stream at the lower margins of riffle/run habitat andupper margins of pools. Depths of the sample areas will not exceed two (2.0) feet andwater velocity will be less than 0.5 feet per second (fps). A Marsh-McBirney flow meterwill be used to ensure that water velocity of the sample area is within this range. In-stream deposits of fine sediment (i.e. less than particle size ca. 2mm= coarse sand) will be1) estimated for percent coverage in the substrate and 2) characterized for metals content.
A visual method will be used to estimate the relative percentage of fine sediment perstation. Each sampling station will be composed of three sample areas (i.e. grids), eachconsisting of six contiguous transects across the stream. A tape measure will be stretchedfrom bank to bank at the downstream edge of the grid. One sample quadrat (ca. 10 x 10inches) will be placed directly on the substrate within each of the six transects using arandom number that equates to one foot increments on the tape measure. The trailingedge of the quadrat will be placed on the random foot increment. Two investigators willthen estimate the percentage of the stream bottom covered by fine sediment within eachquadrat. If the estimated percentages are within ten percent between investigators it willbe accepted. If estimates diverge more than ten percent, the investigators will repeat theprocess until the estimates are within the acceptable margin of error. An average of thesetwo estimates will be recorded and used for analysis.
Sediment will be characterized by determining the total recoverable metals content(TRM- ug/kg) at each of the grids. Specifically, sediments will be analyzed forcadmium, lead and zinc content. Composite collections of sediments will be taken withineach grid that are used for fine sediment percentage estimation. If there is not sufficientquantity of fine sediment within the grid (ca. 6 oz.), a representative sample will becollected from an area near the study grid. Each composite will consist of three (3) two-ounce grab samples of sediment. One (1) two-ounce glass jar will be used as a collectiondevice to dredge the bottom to a depth within the sediment of no more than two inches.The sediment sample will be retained for transport through the water column by covering

the opening with the back of the cap. Each sample will be deposited into an eight-ounceglass jar comprising a composite for each transect-grid. There will be three transect-gridsper station in order to more accurately characterize and lessen potential bias. Eachcomposite jar will be placed on ice for transport to the ESP Lab according to MDNR-FSS-001 (MDNR 2002).
The percentage of sediment deposition and metals character may be compared betweenstations, sites, or grids. This will be done by ANOVA on Ranks, non-parametricstatistical methods, all pairwise comparison procedures, and possibly correlations, at asignificant probability level of p<0.05.
The fine sediment percent estimation, and characterization will be conducted one timeduring the study.
Additional Data Analyses: Ordination of communities with multiple linear regressionand correlations may be used in conjunction with habitat assessment, water qualityvalues, sediment percentages, as well as character of sediments in order to correlate withenvironmental variables.
Data Reporting: A report will be written by the Water Quality Monitoring Section, ESPfor the Water Pollution Control Program (WPCP).
Quality Controls: All analyses will be done according to recommended StandardOperating Procedures (SOPs), Project Procedures (PPs), and Quality Assurance ProjectProcedures (QAPPs).
Literature Cited:Berkman, H.E., and C.F. Rabini. 1987. Effects of siltation on stream fish communities.
Environmental Biology of Fishes 18:285-294.
Chutter, R.M. 1969. The effects of silt and sand on the invertebrate fauna of streams andrivers. Hydrobiologia 34:57-76.
Fluor Daniel Environmental Services. 1995. Initial remedial investigation. Big Rivermine tailings sites, Old Lead Belt, St. Francois, Missouri. Prepared by FluorDaniel Enivronmental Services, 3333 Michelson Dr., Irvine, California 92730.Contract No. 04438907. Prepared for The Doe Run Company.
Missouri Department of Natural Resources. 2000. Title 10. Rules of Department ofNatural Resources Division 20- Clean Water Commission, Chapter 7-WaterQuality. 10 CSR 20-7.031 Water Quality Standards. pp. 10-136.
Missouri Department of Natural Resources. 2001. Taxonomic levels formacroinvertebrate identification. MDNR-WQMS-209, Environmental ServicesProgram, P.O. Box 176, Jefferson City, Missouri 65102. 32 pp.

Missouri Department of Natural Resources. 2002. Required /recommended containers,volumes, preservatives, holding times, and special sampling considerations.MDNR-FSS-001, Environmental Services Program, P.O. Box 176, Jefferson City,Missouri 65102. 25 pp.
Missouri Department of Natural Resources. 2003a. Quality control procedures for dataprocessing. MDNR-WQMS-214, Environmental Services Program, P.O. Box176, Jefferson City, Missouri 65102. 6 pp.
Missouri Department of Natural Resources. 2003b. Semi-quantitative macroinvertebratestream bioassessment project procedure. MDNR-FSS-030. Missouri Departmentof Natural Resources, Environmental Services Program, P.O. Box 176, JeffersonCity, Missouri 65102. 24 pp.
Missouri Department of Natural Resources. 2003c. Stream habitat assessment projectprocedure. MDNR-FSS-032. Missouri Department of Natural Resources,Environmental Services Program, P.O. Box 176, Jefferson City, Missouri 65102.40 pp.
Murphy, M.L., C.P. Hawkins, and N.H. Anderson. 1981. Effects of canopy modificationand accumulated sediment on stream communities. Transactions of the AmericanFisheries Society 110:469-478.
Smale, M.A., C.F. Rabini, and E.B. Nelson. 1995. Fish and invertebrate communities ofthe upper Niangua River in relation to water quality and riparian conditions.Missouri Cooperative Fish and Wildlife Research Unit. University of Missouri-Columbia, Columbia, Missouri 65211. 213 pp.
Attachments: Figure 1: Eaton Branch, St. Francois County, 2003.

Appendix B
Macroinvertebrate Bench Sheets for Eaton Branch and Cub Creek StationsFall 2003 and Spring 2004

Aquid Invertebrate Database Bench Sheet ReportEaton Branch [0318730], Station #1, Sample Date: 10/1/2003 2:10:00 PMORDER: TAXA CS NF SG RMAMPHIPODA Stygobromus 1COLEOPTERA Berosus 4 Hydroporus 1 6 1DIPTERA Ceratopogoninae 1 Chaetocladius 1 Clinotanypus 1 Cricotopus/Orthocladius 1 Dicrotendipes 1 Empididae 1 Erioptera 7 Hydrobaenus 5 8 Larsia 1 2 Parametriocnemus 11 1 1 Phaenopsectra 2 2 1 Polypedilum convictum grp 1 Psectrocladius 282 51 17 Simulium 2 Thienemannimyia grp. 1 Tipula 12 Zavrelimyia 1ISOPODA Caecidotea 1 20MEGALOPTERA Sialis 1ODONATA Argia 16 3 40 Boyeria 1 Enallagma 1 3 Gomphus 2 1 Hetaerina 5 3 Libellula 1 Macromia 3TRICHOPTERA Ceratopsyche 4 Cheumatopsyche 3 Oecetis 13 1 21 Oxyethira 8 3 Phryganeidae 5 Polycentropus 1

ORDER: TAXA CS NF SG RM Triaenodes 1 73TUBIFICIDA Branchiura sowerbyi 1 Limnodrilus hoffmeisteri 2 Tubificidae 2 4 59
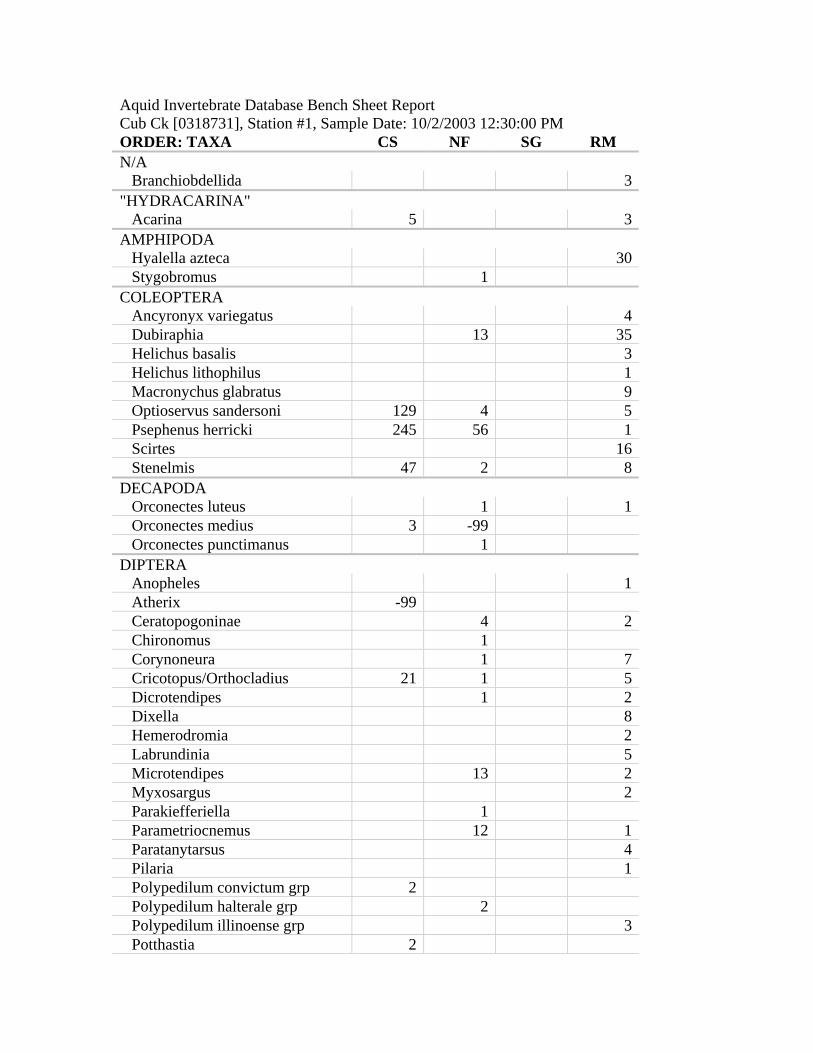
Aquid Invertebrate Database Bench Sheet ReportCub Ck [0318731], Station #1, Sample Date: 10/2/2003 12:30:00 PMORDER: TAXA CS NF SG RMN/A Branchiobdellida 3"HYDRACARINA" Acarina 5 3AMPHIPODA Hyalella azteca 30 Stygobromus 1COLEOPTERA Ancyronyx variegatus 4 Dubiraphia 13 35 Helichus basalis 3 Helichus lithophilus 1 Macronychus glabratus 9 Optioservus sandersoni 129 4 5 Psephenus herricki 245 56 1 Scirtes 16 Stenelmis 47 2 8DECAPODA Orconectes luteus 1 1 Orconectes medius 3 -99 Orconectes punctimanus 1DIPTERA Anopheles 1 Atherix -99 Ceratopogoninae 4 2 Chironomus 1 Corynoneura 1 7 Cricotopus/Orthocladius 21 1 5 Dicrotendipes 1 2 Dixella 8 Hemerodromia 2 Labrundinia 5 Microtendipes 13 2 Myxosargus 2 Parakiefferiella 1 Parametriocnemus 12 1 Paratanytarsus 4 Pilaria 1 Polypedilum convictum grp 2 Polypedilum halterale grp 2 Polypedilum illinoense grp 3 Potthastia 2
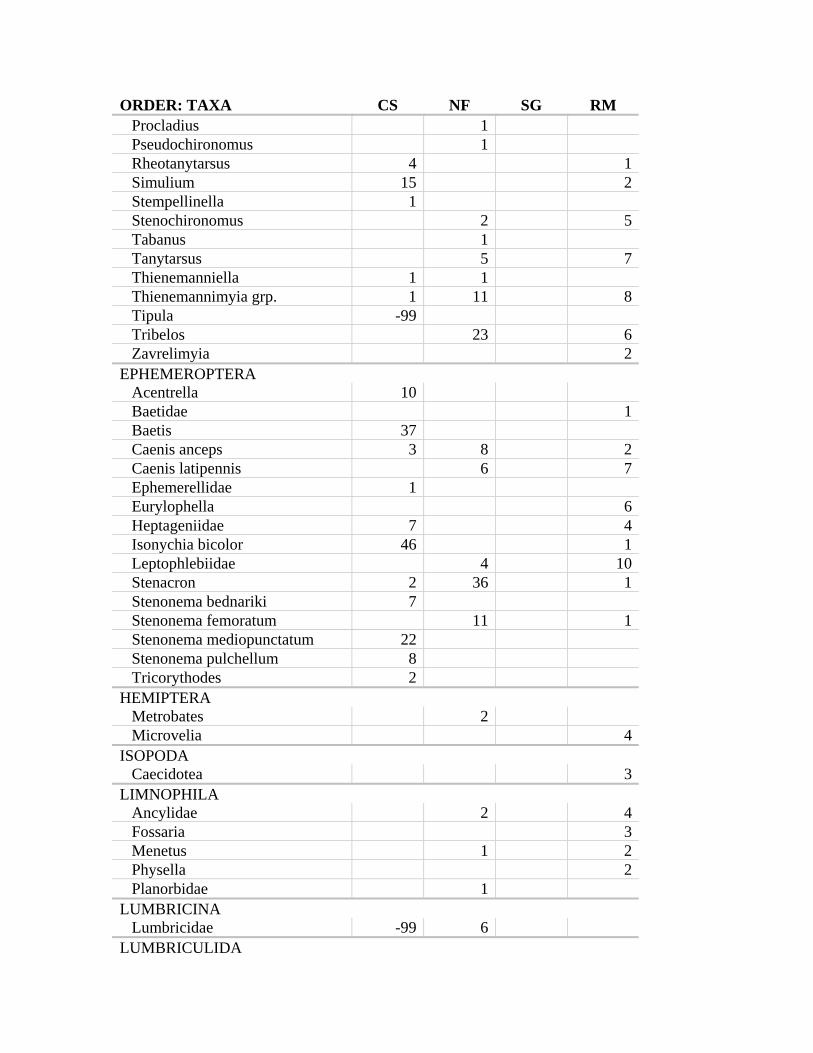
ORDER: TAXA CS NF SG RM Procladius 1 Pseudochironomus 1 Rheotanytarsus 4 1 Simulium 15 2 Stempellinella 1 Stenochironomus 2 5 Tabanus 1 Tanytarsus 5 7 Thienemanniella 1 1 Thienemannimyia grp. 1 11 8 Tipula -99 Tribelos 23 6 Zavrelimyia 2EPHEMEROPTERA Acentrella 10 Baetidae 1 Baetis 37 Caenis anceps 3 8 2 Caenis latipennis 6 7 Ephemerellidae 1 Eurylophella 6 Heptageniidae 7 4 Isonychia bicolor 46 1 Leptophlebiidae 4 10 Stenacron 2 36 1 Stenonema bednariki 7 Stenonema femoratum 11 1 Stenonema mediopunctatum 22 Stenonema pulchellum 8 Tricorythodes 2HEMIPTERA Metrobates 2 Microvelia 4ISOPODA Caecidotea 3LIMNOPHILA Ancylidae 2 4 Fossaria 3 Menetus 1 2 Physella 2 Planorbidae 1LUMBRICINA Lumbricidae -99 6LUMBRICULIDA

ORDER: TAXA CS NF SG RM Lumbriculidae 1MEGALOPTERA Corydalus 1MESOGASTROPODA Elimia 9 -99ODONATA Argia 9 Boyeria 2 Gomphidae 2 Hagenius brevistylus 3 Hetaerina 2 7 Macromia 1PLECOPTERA Pteronarcys pictetii -99TRICHOPTERA Cheumatopsyche 8 Chimarra 1 5 Helicopsyche 8 6 Limnephilidae 10 Lype diversa 2 Nectopsyche 1 Oecetis 3 Polycentropus 2 4 2 Psychomyia 1 Triaenodes 9TRICLADIDA Planariidae 10 1TUBIFICIDA Tubificidae 1 7VENEROIDEA Pisidium 5 Sphaerium 5

Aquid Invertebrate Database Bench Sheet ReportEaton Branch [0418659], Station #1, Sample Date: 3/23/2004 11:45:00 AMORDER: TAXA CS NF SG RMAMPHIPODA Crangonyx 13COLEOPTERA Dytiscus 1 Haliplus 1 Hydroporus 2 3DIPTERA Ablabesmyia 2 Ceratopogoninae 6 7 3 Chaetocladius 4 3 1 Clinocera 13 1 Corynoneura 1 Cricotopus bicinctus 1 Cricotopus/Orthocladius 42 1 5 Cryptotendipes 1 Diamesa 7 Dicrotendipes 2 Diptera 1 Hemerodromia 1 Parakiefferiella 1 Parametriocnemus 34 1 Paraphaenocladius 1 2 Polypedilum illinoense grp 1 Prosimulium 4 Psectrocladius 348 253 226 Simulium 30 Smittia 1 Thienemanniella 1 Thienemannimyia grp. 1 Tipula 1 -99 -99EPHEMEROPTERA Caenis latipennis 1 2 12 Callibaetis 1 Leptophlebia 1HEMIPTERA Microvelia 1ISOPODA Caecidotea 5LIMNOPHILA Physella 1ODONATA Argia 16

ORDER: TAXA CS NF SG RM Enallagma 7 Gomphus 1 Libellula 1PLECOPTERA Amphinemura 64 Perlesta 13TRICHOPTERA Hydropsyche 1 Oecetis 1 5 Oxyethira 4 10 Triaenodes 6TRICLADIDA Planariidae 1TUBIFICIDA Branchiura sowerbyi 1 3 Enchytraeidae 1 1 Limnodrilus hoffmeisteri 10 11 Tubificidae 19 20 1
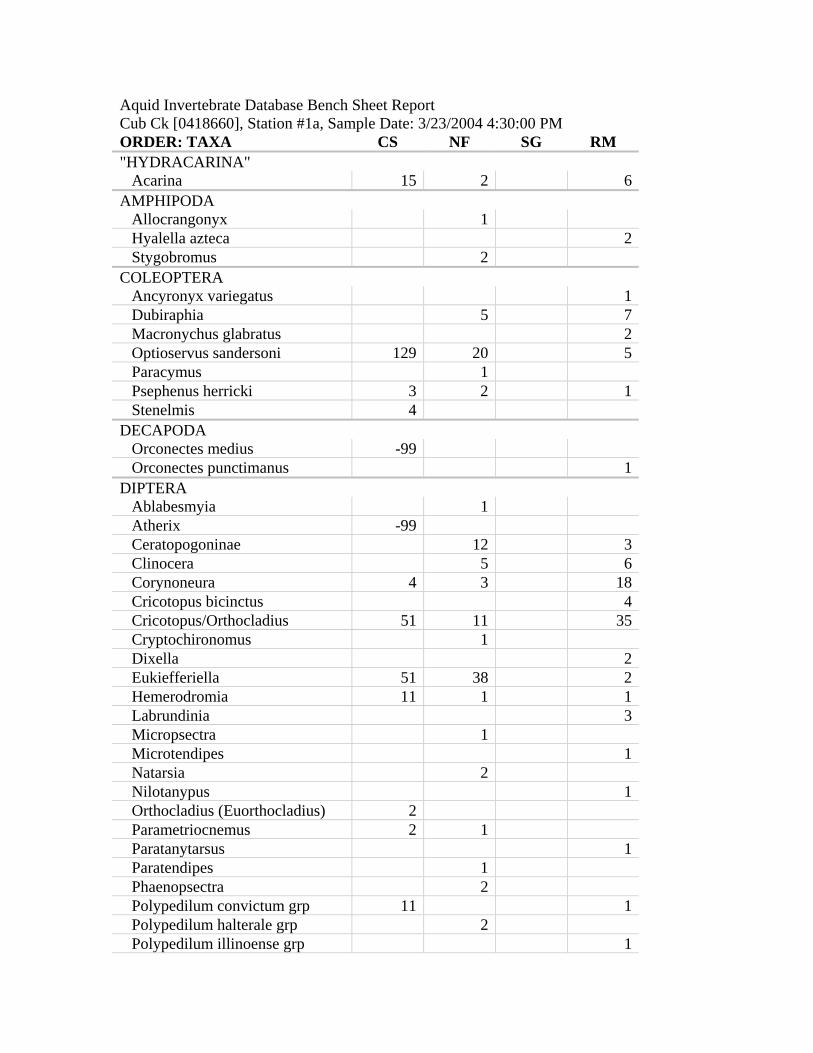
Aquid Invertebrate Database Bench Sheet ReportCub Ck [0418660], Station #1a, Sample Date: 3/23/2004 4:30:00 PMORDER: TAXA CS NF SG RM"HYDRACARINA" Acarina 15 2 6AMPHIPODA Allocrangonyx 1 Hyalella azteca 2 Stygobromus 2COLEOPTERA Ancyronyx variegatus 1 Dubiraphia 5 7 Macronychus glabratus 2 Optioservus sandersoni 129 20 5 Paracymus 1 Psephenus herricki 3 2 1 Stenelmis 4DECAPODA Orconectes medius -99 Orconectes punctimanus 1DIPTERA Ablabesmyia 1 Atherix -99 Ceratopogoninae 12 3 Clinocera 5 6 Corynoneura 4 3 18 Cricotopus bicinctus 4 Cricotopus/Orthocladius 51 11 35 Cryptochironomus 1 Dixella 2 Eukiefferiella 51 38 2 Hemerodromia 11 1 1 Labrundinia 3 Micropsectra 1 Microtendipes 1 Natarsia 2 Nilotanypus 1 Orthocladius (Euorthocladius) 2 Parametriocnemus 2 1 Paratanytarsus 1 Paratendipes 1 Phaenopsectra 2 Polypedilum convictum grp 11 1 Polypedilum halterale grp 2 Polypedilum illinoense grp 1

ORDER: TAXA CS NF SG RM Polypedilum scalaenum grp 1 Potthastia 19 49 19 Prosimulium 2 Rheocricotopus 14 5 Rheotanytarsus 2 9 Simulium 2 1 Stempellinella 2 8 1 Sympotthastia 11 5 8 Tabanus -99 Tanytarsus 9 Thienemanniella 3 12 Thienemannimyia grp. 5 23 11 Tvetenia 1 Zavrelimyia 1EPHEMEROPTERA Acentrella 14 1 Caenis latipennis 3 2 Centroptilum 1 1 Ephemerella invaria 12 1 Eurylophella bicolor 4 3 11 Heptageniidae 4 Isonychia bicolor 4 1 Leptophlebia 1 1 Stenacron 1 Stenonema bednariki 2 Stenonema femoratum 2 Stenonema mediopunctatum 3 1 Stenonema pulchellum 4 6ISOPODA Caecidotea 1LIMNOPHILA Ancylidae 1 Fossaria 1 Physella -99LUMBRICINA Lumbricidae 1 5LUMBRICULIDA Lumbriculidae 5MEGALOPTERA Corydalus -99MESOGASTROPODA Elimia 2 1 9ODONATA
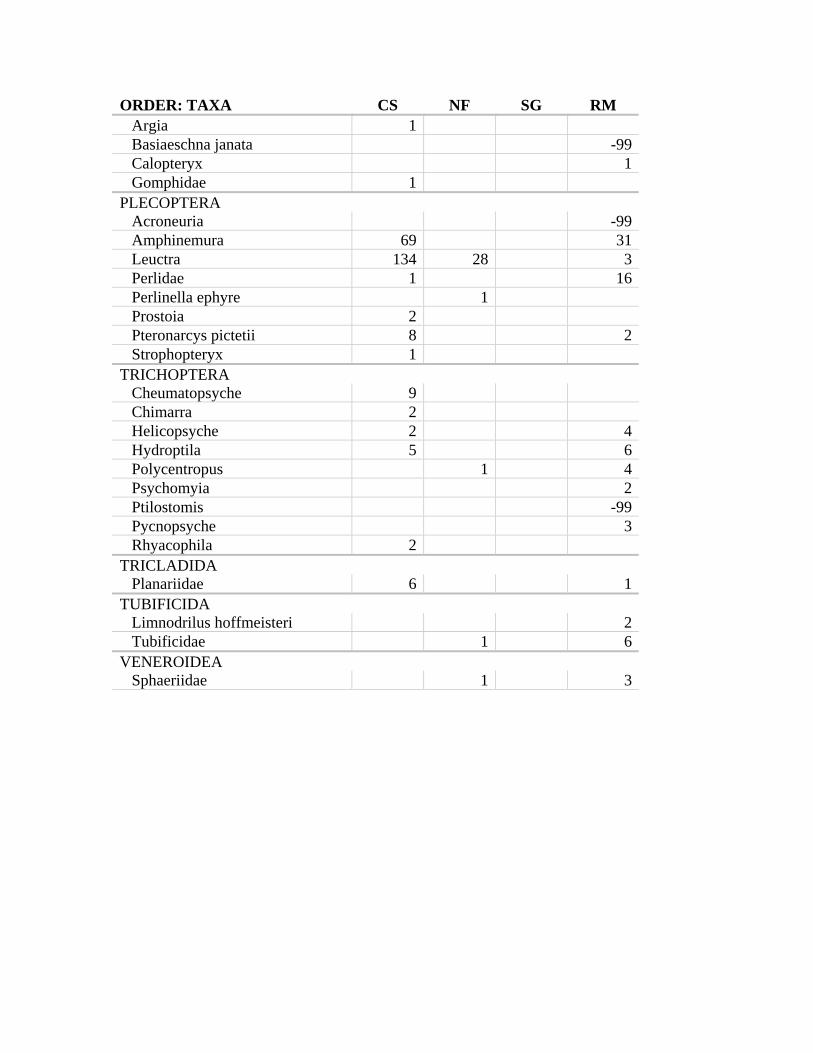
ORDER: TAXA CS NF SG RM Argia 1 Basiaeschna janata -99 Calopteryx 1 Gomphidae 1PLECOPTERA Acroneuria -99 Amphinemura 69 31 Leuctra 134 28 3 Perlidae 1 16 Perlinella ephyre 1 Prostoia 2 Pteronarcys pictetii 8 2 Strophopteryx 1TRICHOPTERA Cheumatopsyche 9 Chimarra 2 Helicopsyche 2 4 Hydroptila 5 6 Polycentropus 1 4 Psychomyia 2 Ptilostomis -99 Pycnopsyche 3 Rhyacophila 2TRICLADIDA Planariidae 6 1TUBIFICIDA Limnodrilus hoffmeisteri 2 Tubificidae 1 6VENEROIDEA Sphaeriidae 1 3

Aquid Invertebrate Database Bench Sheet ReportCub Ck [0418661], Station #1b, Sample Date: 3/23/2004 4:30:00 PMORDER: TAXA CS NF SG RM"HYDRACARINA" Acarina 6 2 5AMPHIPODA Hyalella azteca 1COLEOPTERA Dubiraphia 3 3 Hydroporus 1 Macronychus glabratus 1 Optioservus sandersoni 91 17 5 Psephenus herricki 3 1 2 Stenelmis 1DECAPODA Orconectes luteus -99 -99 Orconectes medius -99DIPTERA Ablabesmyia 3 2 Atherix -99 Ceratopogoninae 9 1 Chelifera 1 Clinocera 5 7 5 Corynoneura 1 7 25 Cricotopus/Orthocladius 43 21 31 Cryptochironomus 3 Dixella 1 Eukiefferiella 18 Hemerodromia 1 Labrundinia 6 Natarsia 1 Nilotanypus 1 Ormosia 1 Orthocladius (Euorthocladius) 1 1 Parametriocnemus 2 Paratanytarsus 1 1 Paratendipes 1 Polypedilum convictum grp 6 1 Polypedilum halterale grp 1 Potthastia 3 83 19 Prosimulium 1 Psectrocladius 1 Rheocricotopus 9 1 Rheotanytarsus 3 7 Simulium 4
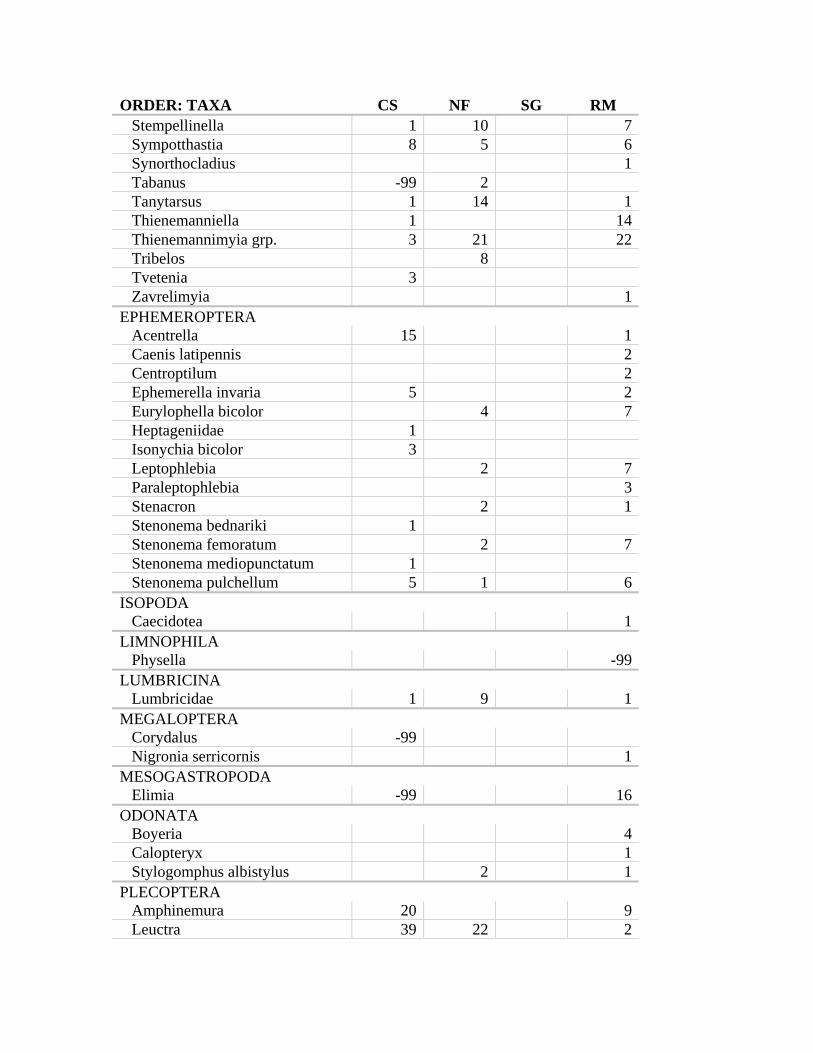
ORDER: TAXA CS NF SG RM Stempellinella 1 10 7 Sympotthastia 8 5 6 Synorthocladius 1 Tabanus -99 2 Tanytarsus 1 14 1 Thienemanniella 1 14 Thienemannimyia grp. 3 21 22 Tribelos 8 Tvetenia 3 Zavrelimyia 1EPHEMEROPTERA Acentrella 15 1 Caenis latipennis 2 Centroptilum 2 Ephemerella invaria 5 2 Eurylophella bicolor 4 7 Heptageniidae 1 Isonychia bicolor 3 Leptophlebia 2 7 Paraleptophlebia 3 Stenacron 2 1 Stenonema bednariki 1 Stenonema femoratum 2 7 Stenonema mediopunctatum 1 Stenonema pulchellum 5 1 6ISOPODA Caecidotea 1LIMNOPHILA Physella -99LUMBRICINA Lumbricidae 1 9 1MEGALOPTERA Corydalus -99 Nigronia serricornis 1MESOGASTROPODA Elimia -99 16ODONATA Boyeria 4 Calopteryx 1 Stylogomphus albistylus 2 1PLECOPTERA Amphinemura 20 9 Leuctra 39 22 2

ORDER: TAXA CS NF SG RM Perlidae 5 Prostoia 1 1 Pteronarcys pictetii 1 1TRICHOPTERA Cheumatopsyche 9 1 1 Chimarra 5 Helicopsyche 6 4 Hydroptila 6 Lype diversa 1 Oecetis 1 Polycentropus 1 2 Pycnopsyche 1 6TRICLADIDA Planariidae 1 1TUBIFICIDA Enchytraeidae 1 Limnodrilus hoffmeisteri 2 Tubificidae 16 1VENEROIDEA Pisidium 1 1

Appendix C
Fine Sediment Percentage and Sediment Character (metals) Tests:Mann-Whitney Rank and Student t-tests for Eaton Branch and Cub Creek
October 1 and 2, 2003
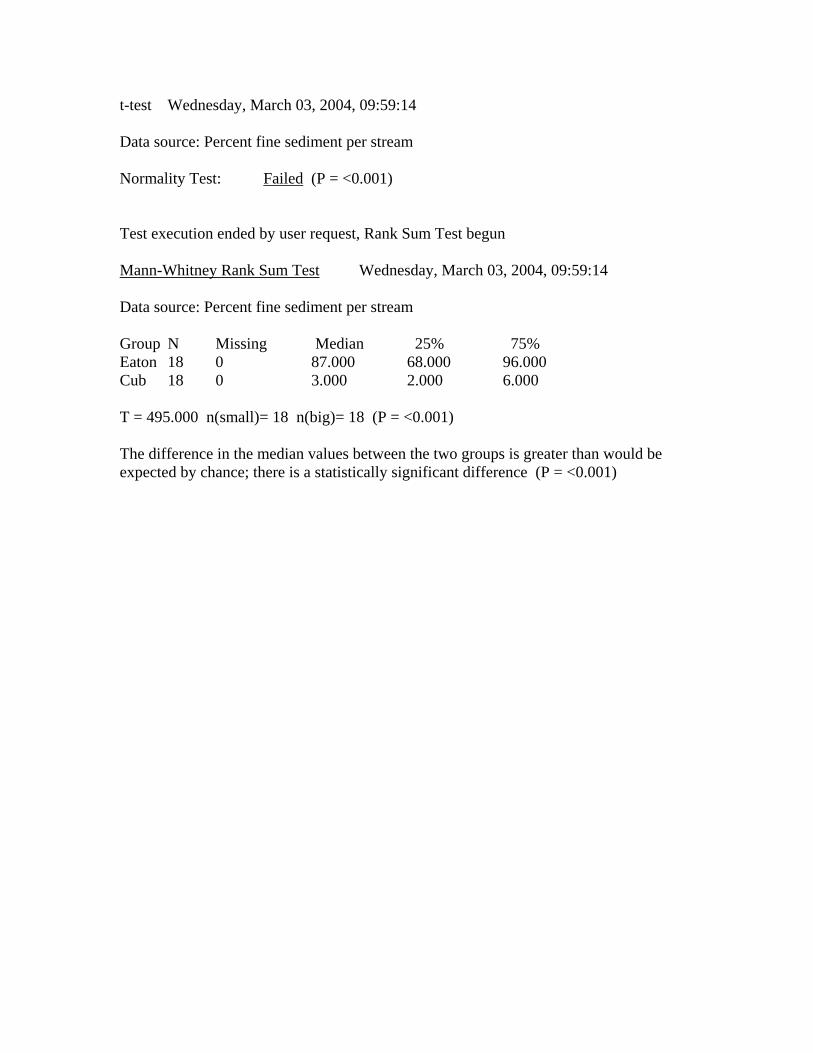
t-test Wednesday, March 03, 2004, 09:59:14
Data source: Percent fine sediment per stream
Normality Test: Failed (P = <0.001)
Test execution ended by user request, Rank Sum Test begun
Mann-Whitney Rank Sum Test Wednesday, March 03, 2004, 09:59:14
Data source: Percent fine sediment per stream
Group N Missing Median 25% 75% Eaton 18 0 87.000 68.000 96.000Cub 18 0 3.000 2.000 6.000
T = 495.000 n(small)= 18 n(big)= 18 (P = <0.001)
The difference in the median values between the two groups is greater than would beexpected by chance; there is a statistically significant difference (P = <0.001)
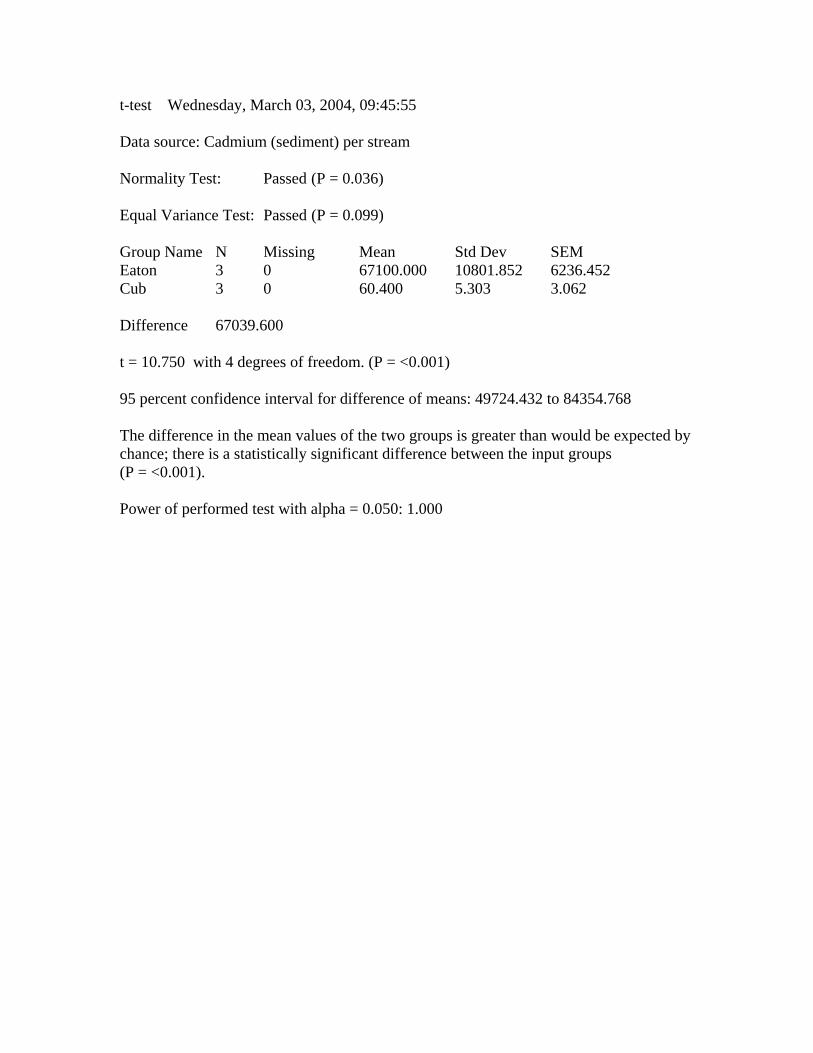
t-test Wednesday, March 03, 2004, 09:45:55
Data source: Cadmium (sediment) per stream
Normality Test: Passed (P = 0.036)
Equal Variance Test: Passed (P = 0.099)
Group Name N Missing Mean Std Dev SEMEaton 3 0 67100.000 10801.852 6236.452Cub 3 0 60.400 5.303 3.062
Difference 67039.600
t = 10.750 with 4 degrees of freedom. (P = <0.001)
95 percent confidence interval for difference of means: 49724.432 to 84354.768
The difference in the mean values of the two groups is greater than would be expected bychance; there is a statistically significant difference between the input groups(P = <0.001).
Power of performed test with alpha = 0.050: 1.000
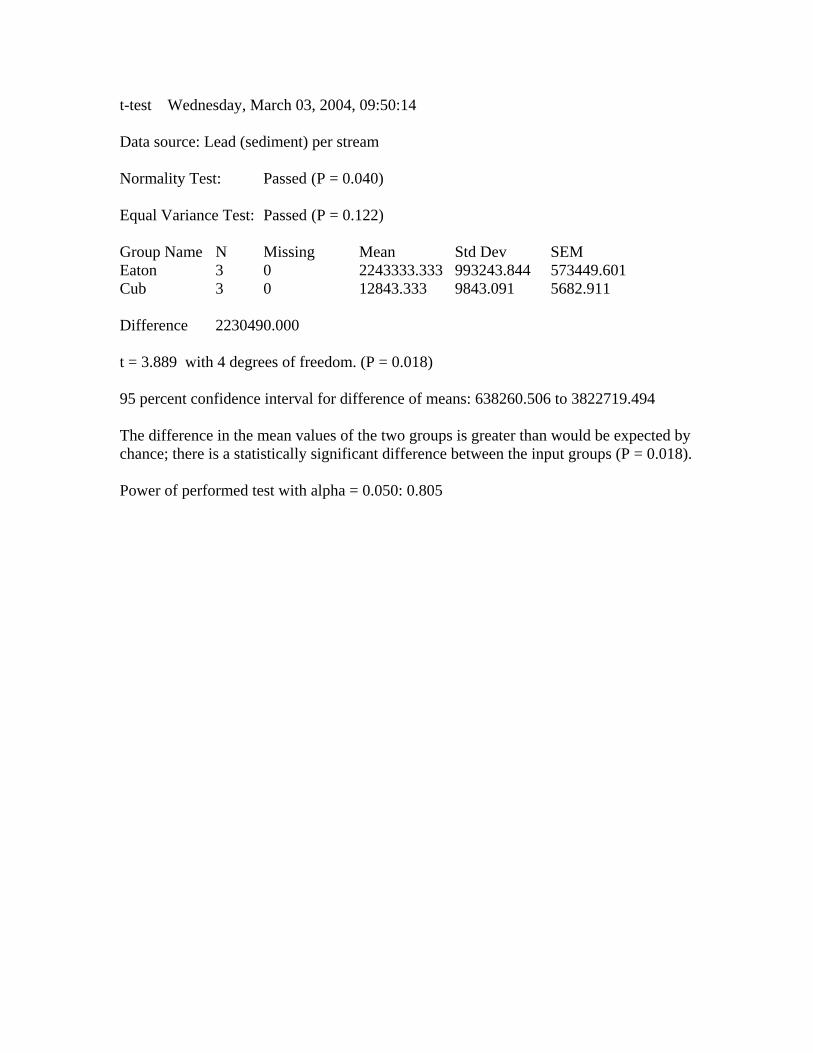
t-test Wednesday, March 03, 2004, 09:50:14
Data source: Lead (sediment) per stream
Normality Test: Passed (P = 0.040)
Equal Variance Test: Passed (P = 0.122)
Group Name N Missing Mean Std Dev SEMEaton 3 0 2243333.333 993243.844 573449.601Cub 3 0 12843.333 9843.091 5682.911
Difference 2230490.000
t = 3.889 with 4 degrees of freedom. (P = 0.018)
95 percent confidence interval for difference of means: 638260.506 to 3822719.494
The difference in the mean values of the two groups is greater than would be expected bychance; there is a statistically significant difference between the input groups (P = 0.018).
Power of performed test with alpha = 0.050: 0.805

t-test Wednesday, March 03, 2004, 09:52:23
Data source: Zinc (sediment) per stream
Normality Test: Passed (P = 0.037)
Equal Variance Test: Passed (P = 0.343)
Group Name N Missing Mean Std Dev SEMEaton 3 0 2013333.333 579511.288 334580.998Cub 3 0 16833.333 929.157 536.449
Difference 1996500.000
t = 5.967 with 4 degrees of freedom. (P = 0.004)
95 percent confidence interval for difference of means: 1067553.044 to 2925446.956
The difference in the mean values of the two groups is greater than would be expected bychance; there is a statistically significant difference between the input groups (P = 0.004).
Power of performed test with alpha = 0.050: 0.990