Embed Size (px)
Citation preview

Bionic Tracking: Using Eye Tracking to TrackBiological Cells in Virtual Reality
Ulrik Gunther1,2,3[0000−0002−1179−8228], Kyle I.S. Harrington4,5[0000−0002−7237−1973],Raimund Dachselt6,7[0000−0002−2176−876X ], and
Ivo F. Sbalzarini6,2,3,7[0000−0003−4414−4340]
1 Center for Advanced Systems Understanding, Gorlitz, Germany2 Center for Systems Biology, Dresden, Germany
3 Max Planck Institute of Molecular Cell Biology and Genetics, Dresden, Germany4 Virtual Technology and Design, University of Idaho, Moscow, ID, USA
5 HHMI Janelia Farm Research Campus, Ashburn, VA, USA6 Faculty of Computer Science, Technische Universitat Dresden, Germany
7 Excellence Cluster Physics of Life, Technische Universitat Dresden, Germany
Abstract. We present Bionic Tracking, a novel method for solving biological celltracking problems with eye tracking in virtual reality using commodity hardware.Using gaze data, and especially smooth pursuit eye movements, we are able totrack cells in time series of 3D volumetric datasets. The problem of trackingcells is ubiquitous in developmental biology, where large volumetric microscopydatasets are acquired on a daily basis, often comprising hundreds or thousands oftime points that span hours or days. The image data, however, is only a means toan end, and scientists are often interested in the reconstruction of cell trajectoriesand cell lineage trees. Reliably tracking cells in crowded three-dimensional spaceover many timepoints remains an open problem, and many current approaches relyon tedious manual annotation and curation. In our Bionic Tracking approach, wesubstitute the usual 2D point-and-click annotation to track cells with eye trackingin a virtual reality headset, where users simply have to follow a cell with theireyes in 3D space in order to track it. We detail the interaction design of ourapproach and explain the graph-based algorithm used to connect different timepoints, also taking occlusion and user distraction into account. We demonstrateour cell tracking method using the example of two different biological datasets.Finally, we report on a user study with seven cell tracking experts, demonstratingthe benefits of our approach over manual point-and-click tracking.
1 Introduction
In cell and developmental biology, the image data generated via fluorescence microscopyis often only a means to an end: Many tasks require exact information about the positionsof cells during development, or even their entire history, the so-called cell lineage tree.Both the creation of such a tree using cell tracking, and tracking of single cells, aredifficult and cannot always be done in a fully automatic manner. Therefore, such lineagetrees are created in a tedious manual process using a point-and-click 2D interface. Evenif cells can be tracked (semi)automatically, faulty tracks have to be repaired manually.
arX
iv:2
005.
0038
7v2
[cs
.HC
] 1
Aug
202
0

2 Gunther, et al.
Again, this is a very tedious task, as the users have to go through each timepoint and2D section in order to connect cells in 3D+time, with a 2D point-and-click interface.Manually tracking one single cell through 101 timepoints with this manual processtakes 5 to 30 minutes, depending on complexity of the dataset. Tracking an entiredevelopmental dataset with many 3D images can take months of manual curation effort.
The 3D images the lineage trees are usually created based on fluorescence microscopyimages. Such fluorescence images do not have well-defined intensity scales, and intensi-ties might vary strongly even within single cells. Cells also move around, divide, changetheir shape—sometimes drastically—or might die. Cells might also not appear alone,and may move through densely-populated tissue, making it difficult to tell one cell apartfrom another. These three issues are the main reasons that make the task of trackingcells so difficult. Further complicating the situation, recent advances in fluorescencemicroscopy, such as the advent and widespread use of lightsheet microscopy [9], haveled to a large increase in size of the images, with datasets growing from about a gigabyteto several terabytes for long-term timelapse images [25].
In this work, we reduce the effort needed to track cells through time series of3D images by introducing Bionic Tracking, a method that uses smooth pursuit eyemovements as detected by eye trackers inside a virtual reality head-mounted display(HMD) to render cell tracking and track curation tasks easier, faster, and more ergonomic.Instead of following a cell by point-and-click, users have to simply look at a cell inVirtual Reality (VR) in order to track it. The main contributions we present here are:
– A setup for interactively tracking cells by simply following the cell in a 3D volumerendering with the eyes, using a virtual reality headset equipped with eye trackers,
– an iterative, graph-based algorithm to connect gaze samples over time with cells involumetric datasets, addressing both the problems of occlusion and user distraction,and
– a user study evaluating the setup and the algorithm with seven cell tracking experts
2 Related Work
The main problem we address in this paper is the manual curation or tracking step, whichis necessary for both validation and for handling cases where automatic tracking producesincorrect or no results. In this section, we give a brief overview of (semi-)automatictracking algorithms, then continue with relevant work from the VR, visualization, andeye tracking communities.
Historically, software for solving tracking problems was developed for a specificmodel organism, such as for the roundworm Caenorhabditis elegans, the fruitfly Drosophilamelanogaster, or the zebrafish Danio rerio — all highly studied animals in biology —and relied on stereotypical developmental dynamics within an organism in order to suc-ceed in tracking cells. This approach however either fails entirely or produces unreliableresults for other organisms, or for organisms whose development is not as stereotyped.For that reason, (semi-)automated approaches have been developed that are independentof the model organism and can track large amounts of cells, but often require manualtracking of at least a subset of the cells in a dataset. Examples of such frameworks are:

Bionic Tracking 3
– TGMM, Tracking by Gaussian Mixture Models [2, 1], is an offline tracking solutionthat works by generating oversegmented supervoxels from the original image data,then fit all cell nuclei with a Gaussian Mixture Model and evolve that through time,and finally use the temporal context of a cell track to create the lineage tree.
– TrackMate [31] is a plugin for Fiji [26] that provides automatic, semi-automatic, andmanual tracking of single particles in image datasets. TrackMate can be extendedwith custom spot detection and tracking algorithms.
– MaMuT, the Massive MultiView Tracker [36], is another plugin for Fiji that allowsthe user to manually track cells in large datasets, often originating from multi-viewlightsheet microscopes. MaMuT’s viewer is based on BigDataViewer [22] and isable to handle terabytes of data.
All automated approaches have in common that they need manual curation as a finalstep, as they all make assumptions about cell shapes, modelling them, e.g., as blobs ofGaussian shape, as in the case of TGMM.
Manual tracking and curation is usually done with mouse-and-keyboard interactionto select a cell and create a track, often while just viewing a single slice of a 3D timepoint of the dataset. In Bionic Tracking, we replace this interaction by leveraging theuser’s gaze in a virtual reality headset, while the user can move freely around or inthe dataset. Gaze in general has been used in human-computer interaction for variousinteractions: It has been used as an additional input modality in conjunction with touchinteraction [29] or pedaling [14], and for building user interfaces, e.g., for text entry [19].
The particular kind of eye movements we exploit for Bionic Tracking—smoothpursuits, where the eyes follow a stimulus in a smooth, continuous manner—is notyet explored exhaustively for interacting with 3D or VR content. Applications can befound mainly in 2D interfaces, such as in [15], where the authors use deviations fromsmoothness in smooth pursuits to evaluate cognitive load; or in [34], where smoothpursuits are used for item selection in 2D user interfaces. For smooth pursuits in VR,we are only aware of two works, [24] and [13]: In the first, the authors introduce RadialPursuit, a technique where the user can select an object in a 3D scene by tracking it withher eyes, and it will become more “lensed-out” the longer she focuses on a particularobject. In the latter, the authors explore target selection using smooth pursuits, perform auser study, and make design recommendations for smooth pursuit-based VR interfaces.
All aforementioned works are only concerned with navigation or selection taskson structured, geometric data. In Bionic Tracking however, we use smooth pursuits totrack cells in unstructured, volumetric data that cannot simply be queried for the objectscontained or their positions.
In the context of biomedical image analysis, VR has been applied successfully,e.g., for virtual colonoscopy [21] and for tracing of neurons in connectome data [33].In the latter, the authors show the neurons in VR in order to let the user trace themwith a handheld controller. The authors state that this technique resulted in faster andbetter-quality annotations. Tracking cells using handheld VR controllers is an alternativeto gaze, but could place higher physical strain on the user.

4 Gunther, et al.
3 The Bionic Tracking Approach
For Bionic Tracking, we exploit smooth pursuit eye movements. Smooth pursuits are theonly smooth movements performed by our eyes. The occur when following a stimilus,and cannot be triggered without one [6]. Instead of using a regular 2D screen, weperform the cell tracking process in VR, since VR gives the user improved navigationand situational awareness compared to 2D when exploring a complex 3D/4D dataset [28].
In addition, the HMD tracking data can be used to impose constraints on the dataacquired from the eye trackers. In order to remove outliers from gaze data one cancalculate the quaternion distance between eyeball rotation and head rotation, which isphysiologically limited: a 90-degree angle between eye direction and head direction isnot plausible, and head movement follows eye movement via the vestibo-ocular reflex.
As a system consisting of both a VR HMD and an integrated eye tracking solutionmight be perceived as too complex, we start by explaining why we think that only usingone of the technologies would not solve the problem:
– Without eye tracking, the head orientation from the HMD could still be used asa cursor. However, following small and smooth movements with the head is notsomething humans are used to doing. The eyes always lead the way, and the headfollows via the vestibulo-ocular reflex.
– Without virtual reality, the effective space in which the user can use to follow cellsaround becomes restricted to the rather small part of the visual field a regular screenoccupies. The user furthermore loses the ability to move around freely withoutan additional input modality, e.g. to avoid obstacles (in our case, those might becells not tracked at the moment). As an alternative to HMDs, a system using largescreens or projectors, such as Powerwalls or CAVEs, could be used, but increasesthe technical complexity.
3.1 Hardware selection
We have chosen the HTC Vive as HMD, as it is comfortable to wear, provides goodresolution, and an excellent tracking system for room-scale VR experiences. Furthermore,it is usable with the SteamVR/OpenVR API. For eye tracking, we have chosen the Pupileye trackers produced by Pupil Labs [11], as they provide both an open-source softwareand competitively-priced hardware that is simple to integrate physically into off-the-shelf HMDs. The software is available as LGPL-licensed open-source code and can beextended with custom plugins.
In addition to being open-source, the Pupil software makes the measured gazedata and image frames available to external applications via a simple ZeroMQ- andMessagePack-based protocol8—in contrast to closed-source proprietary libraries re-quired by other products—which enables using the eye tracking data in a local applicationor even over the network.
Alternative solutions, like the HTC Vive Pro Eye, or an HTC Vive with integratedTobii eye tracker were either not available at the time this project started, or were muchmore expensive.
8 See https://docs.pupil-labs.com/developer/core/network-api/ for details on in-teracting with Pupil over the network.

Bionic Tracking 5
3.2 Software framework
We have developed Bionic Tracking using the visualization framework scenery [7], as itsupports rendering of mesh data simultaneously with multi-timepoint volumetric datathat contains the cells or nuclei to be tracked. Crucially for Bionic Tracking, scenerysupports rendering to all SteamVR/OpenVR-supported VR HMDs and supports thePupil eye trackers. In addition, scenery runs on the Java VM and is interoperable withthe image analysis toolkit Fiji, just as the existing tracking tools TrackMate and MaMuT(see Section 2).
Fig. 1: Some example nucleus shapes encountered in our Platynereis test dataset.
3.3 Rendering
We use simple, alpha blending-based volume rendering for displaying the data in theVR headset using scenery’s Vulkan backend. While more advanced algorithms forvolume rendering exist which provide a higher visual quality (e.g. Metropolis LightTransport [16]), achieving a high and ideally consistent framerate is important for VRapplications, which led us to choose alpha blending. For the data used in this work,we have only used in-core rendering, while the framework also supports out-of-corevolume rendering for even larger datasets. To the user, we not only display the volumeon its own, but a gray, unobtrusive box for spatial anchoring around the volume (see thesupplementary video for an impression of how this looks).
4 Tracking Cells with Bionic Tracking
4.1 Preparation
After putting on the VR HMD, making sure the eye tracker’s cameras can see the user’seyes and launching the application, the calibration routine needs to be run first in order toestablish a mapping between the user’s gaze and world space positions in the VR scene.For calibration, we show the user a total of 18 white spheres, with 5 of them layeredon three circles 1 m apart (distances in the VR scene are the same as in the physicalworld). The radius of the circles increases with each layer to achieve a good coverage ofthe field of view. In addition to the spheres on the circles, we show three spheres in thecenter of the circles to also cover the area in the center of the field of view. During thecalibration routine, the user has to look at these spheres as they are shown in the HMD.Since the calibration targets follow the head movements of the user, the user does notneed to stay still. At the end of the calibration, the user will be notified of success orfailure, and can repeat the calibration process if necessary. Calibration typically needsto be run only once per session, and can then be used to track as many cells as the userlikes. Exceptions are if there is significant slippage or if the HMD is removed during the

6 Gunther, et al.
session. Our calibration routine is mostly similar to the one used in Pupil’s HMDeyesUnity example project9.
Movement in VR can be performed either physically, or via buttons on the handheldcontrollers, which additionally allow control of the following functions (handedness canbe swapped, default bindings shown in Supp. Fig. S.1):
– move the dataset by holding the left-hand trigger and moving the controller,
– use the directional pad on the left-hand controller to move the observer (forward,backward, left, or right – with respect to the direction the user is looking to),
– start and stop tracking by pressing the right-hand side trigger,
– deleting the most recently created track by pressing the right-side button, andconfirming within three seconds with another press of the same button,
– play and pause the dataset over time by pressing the right-hand menu button,
– play the dataset faster or slower in time by pressing the right-hand directional padup or down, and
– stepping through the timepoints of the dataset one by one, forward or backward, bypressing the right-hand directional pad left or right.
When the dataset is not playing, the user can also use the directional pad on theright-hand controller to scale the dataset. The initial setting for the scale of the dataset isto make it appear about 2m big.
4.2 Tracking Process
After calibration, the user can position herself freely in space. To track a cell, the userperforms the following steps:
1. Find the timepoint and cell with which the track should start, adjust playback speedbetween one and 20 volumes/second, and start to look at the cell or object of interest,
2. start playback of the multi-timepoint dataset, while continuing to follow the cell bylooking at it, and maybe moving physically to follow the cell around occlusions,
3. end or pause the track at the final timepoint. Tracking will stop automatically whenplayback as reached the end of the dataset, and the dataset will play again from thebeginning.
In order to minimize user strain in smooth pursuit-based VR interactions, the authorsof [13] have provided design guidelines: They suggest large trajectory sizes, clearinstructions what the user has to look at, and relatively short selection times. Whilephysical cell size cannot be influenced, the controls available to the user enable freepositioning and zooming. The selection time, here the tracking time, of course dependson the individual cell to be tracked, but as the tracking can be paused, and the playbackspeed adjusted, the user is free to choose both a comfortable length and speed.
During the tracking procedure, we collect the following data for each timepoint:
9 See https://github.com/pupil-software/hmd-eyes for details.

Bionic Tracking 7
– the entry and exit points of the gaze ray through the volume in normalised volume-local coordinates, i.e., as a vector ∈ [0.0,1.0]3,
– the confidence rating – calculated by the Pupil software – of the gaze ray,
– the user’s head orientation and position,
– the timepoint of the volume, and
– a list of sampling points with uniform spacing along the gaze ray through the volumeand the actual sample values on these points calculated by trilinear interpolationfrom the volume image data.
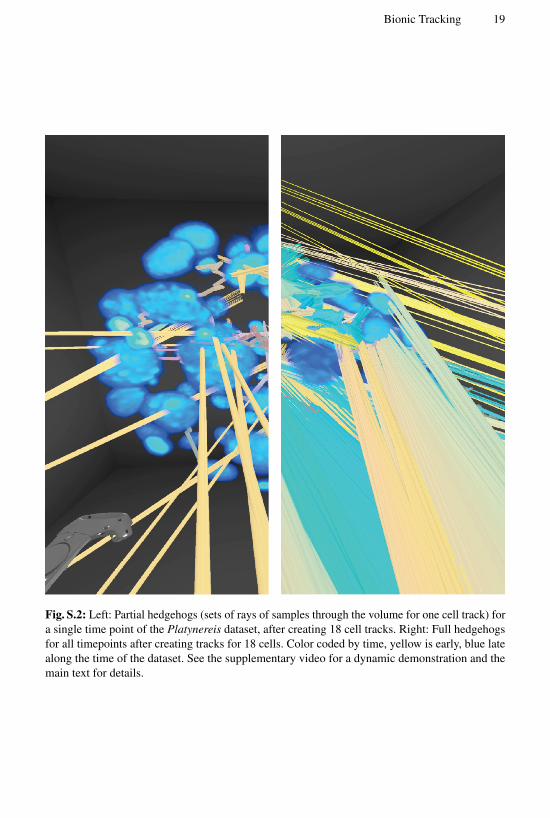
We call a single gaze ray including the above metadata a spine. The set of all spinesfor a single track over time we call a hedgehog – due to its appearance, see Supp. Fig. S.2.By collecting the spines through the volume, we are effectively able to transform each3-dimensional cell localization problem into a 1-dimensional one along a single raythrough the volume and create a cell track. This analysis procedure is explained in detailin the next section.
5 Analysis of the Tracking Data
In previous applications using smooth pursuits (such as in [34, 24]), the tracked objectswere geometric and not volumetric in nature, and therefore well-defined in 2D or 3Dspace with their extents and shape fully known. In our analysis in contrast, we use theindirect information about the objects contained in spines and hedgehogs to find thetracked object in unstructured volumetric data and follow it.
After a full hedgehog has been collected to create a new cell track, all further analysisis done solely on the data contained in this hedgehog. To illustrate the analysis, it isuseful to visualize a hedgehog in two dimensions by laying out all spines in a 2D planenext to each other (see Figure 2). In this plane, time advances along the X axis and depththrough the volume along a given spine is on the Y axis. Note that each line parallel tothe Y axis represents one spine and therefore one gaze sample, of which we collect up to60 per second. In Figure 2, this led to 1614 spines with 16 spines per image timepointon average collected within 30 seconds. In the figure, we have highlighted the localintensity maximum along each spine in red. The track of the cell the user was followingis then mostly visible.
5.1 Graph-based temporal tracking
Movements of the user and temporary occlusion by other cells or objects render itchallenging to reliably extract a space-time trajectory from the information containedin the hedgehog. In order to reliably link cell detections across timepoints, we use anincremental graph-based approach based on all spines that have local maxima in theirsample values. A plot of an exemplary spine through a volume is shown in Supp. Fig. S.3.In the figure, the distance from the observer in voxels along the spine is shown on the Xaxis, while the Y axis shows the intensity value of the volume data at that point alongthe spine. To initialize the algorithm, we assume that when starting a track the user looks

8 Gunther, et al.
Time
Voxe
l alo
ng ra
y
500 1000 1500
A B
Fig. 2: A hedgehog visualized in 2D, with nearest local maxima marked in red. Each vertical lineis one spine of the hedgehog with the observer sitting at the bottom. On the X axis, time runs fromleft to right, and is counted in gaze samples taken. After every 500 spines, a dotted white line isshown at 500, 1000, and 1500 spines recorded. The gray line shortly before 500 spines is the linewhose profile is shown in Supp. Fig. S.3. The discontinuities in the local maxima A and B havedifferent origins: For A, the user seems to have moved further away, resulting in a gap, while forB, another cell appeared closely behind the tracked one and might have mislead the user, leaving itfor the algorithm to filter out. See text for details.
at an unoccluded cell that is visible as the nearest local maximum along the spine. InSupp. Fig. S.3 that would be the leftmost local maximum.
For each timepoint, we have collected a variable number of spines, whose countvaries between 0 and 120; zero spines might be obtained in case that the user closes hereyes, or that no detection was possible for other reasons, and 120 Hz is the maximumframe rate of the eye trackers used.
In order to correctly track a cell across spines over time, and after the initial seedpoint on the first spine has been determined, we step through the spines in the hedgehogone by one, performing the following operations, as illustrated in Figure 3:
1. advance to the next spine in the hedgehog,
2. find the indices of all local maxima along the spine, ordered by world-space distanceto the selected point from the previous spine,
3. connect the selected point from the previous spine with the closest (in world-spacedistance) local maximum in the current spine,
4. calculate the world-space position of the new selected point, and
5. add the selected point to the set of points for the current track.
In addition to connecting discontinuities in the local maxima detected (discontinuityA in Figure 2) world-space distance weighting also excludes cases where another cell isbriefly moving close to the user and the actually tracked cell (discontinuity B in Figure 2).The process of connecting a local maximum to the nearest one at a later time is a variantof dynamic fringe-saving A* search on a grid [30] with all rays extended to the maximumlength in the entire hedgehog along the X axis, and time increasing along the Y axis.
This strategy constructs a cell track from the spines of each hedgehog. The calculationof the final track typically takes less than a second and is visualised right away, such thatthe user can quickly decide whether to keep it, or discard it.

Bionic Tracking 9
spine₁ spine₂spine₄ spine₅
spinen
seedend
dist = 2
dist = 3
dist = 1
time
...
spine₃
Fig. 3: A graphical illustration of the incremental graph-search algorithm used to extract tracksfrom a hedgehog. Time runs along the X axis. spine1 contains the initial seed point where to starttracking. The algorithm is currently at spine4, determining how to proceed to spine5. In this case,the middle track with dist = 1 wins, as it is the shortest world-space distance away from the currentpoint. The algorithm will continue the path search until it has reached the last spine, spinen. Inthis manner, the algorithm closes the gaps around the sample numbers 700 and 1200 in Figure 2,and leaves out the detected cells further along the individual rays. spine3 is connected initially, butremoved in the final statistical pruning step. It is therefore grayed out. See text for details.
5.2 Handling Distraction and Occlusions
In some cases, however, world-space distance weighting is not enough, and a kind ofMidas touch problem [10] remains: When the user briefly looks somewhere else than atthe cell of interest, and another local maximum is detected there, that local maximummay indeed have the smallest world-space distance and win. This would introduce awrong link in the track. Usually, the Midas touch problem is avoided by resorting tomultimodal input (see, e.g., [29, 20]). Here, we aim to avoid the Midas touch problemwithout burdening the user with additional modalities of control. We instead use statistics:for each vertex distance d, we calculate the z-score Z(d) = (d−µdist)/σdist, where µdistis the mean distance in the entire hedgehog and σdist is the standard deviation of alldistances in the entire hedgehog. We then prune all graph vertices with a z-score higherthan 2.0. This corresponds to distances larger than double the standard deviation of alldistances the hedgehog. Pruning and graph calculations are repeated iteratively until novertices with a z-score higher than 2.0 remain, effectively filtering out discontinuitieslike B in Figure 2.
6 Proof of concept
We demonstrate the applicability of the method with two different datasets:
10 Gunther, et al.
– A developmental 101-timepoint dataset of a Platynereis dumerilii embryo, an ocean-dwelling ringworm, acquired using a custom-built OpenSPIM [23] lightsheet mi-croscope, with cell nuclei tagged with the fluorescent GFP protein (16bit stacks,700x660x113 pixel, 100MB/timepoint, 9.8 GByte total size),
– A 12-timepoint dataset of MDA231 human breast cancer cells, embedded in acollagen matrix and infected with viruses tagged with the fluorescent GFP pro-tein, acquired using a commercial Olympus FluoView F1000 confocal microscope(dataset from the Cell Tracking Challenge [32], 16 bit TIFF stacks, 512x512x30pixels, 15MB/timepoint, 98 MByte total size).
The Platynereis dataset was chosen because it poses a current research challenge,with all tested semiautomatic algorithms failing on this dataset, due to the diverse nucleishapes and cell movements. Examples of shapes encountered in the dataset are shownin Figure 1. The MDA231 dataset in turn was chosen because it had the worst successscores for automatic tracking methods on the celltrackingchallenge.net website due tothe diversity of cell shapes and jerky movements in the dataset.
For the Platynereis dataset, we were able to quickly obtain high-quality cell tracksusing our prototype system. A visualization of one such cell track is shown in Supple-mentary Figure S.4. In the companion video, we show both the gaze tracking process tocreate the track and a visualization showing all spines used to generate the track.
For the MDA231 dataset, we are able to obtain tracks for six moving cells in thedataset in about 10 minutes. A visualization of these tracks is shown in Supp. Fig. S.5; seethe companion video for a part of the tracking process. This example also demonstratesthat the Bionic Tracking technique is useful even on nearly “flat” microscopy images inVR, as the dataset only has 30 Z slices, compared to a resolution of 512x512 in X and Y.
All datasets are rendered at their full resolution, with a typical framerate of 60-90fps.
7 Evaluation
We evaluated Bionic tracking by first performing a user study to gain insight into useracceptance and feasibility. We then compared tracks created with Bionic Tracking tothe manually annotated ground truth. Together, these evaluations serve as an initialcharacterization of the usability and performance of Bionic Tracking.
7.1 User Study
We recruited seven cell tracking experts who were either proficient with manual celltracking tasks in biology, proficient in using or developing automated tracking algorithms,or both (median age 36, s.d. 7.23, 1 female, 6 male) to take part in the study. The userswere given the task to track arbitrary cells in the Platynereis dataset already used inSection 6. One of the users was already familiar with this particular dataset. The studywas conducted on a Dell Precision Tower 7910 workstation (Intel Xeon E5-2630v3 CPU,8 cores, 64 GB RAM, GeForce GTX 1080Ti GPU) running Windows 10, build 1909.
Before starting to use the software, all users were informed of the goals and potentialrisks (e.g., simulator sickness) of the study. With a questionnaire, they were asked for

Bionic Tracking 11
presence of any visual or motor impairments (apart from needing to wear glasses orcontact lenses, none were reported), about previous VR experience and physical well-being. After using the software, users were again asked about their physical wellbeing,and had to judge their experience using the NASA Task Load Index (TLX, [8]) andSimulator Sickness Questionnaire (SSQ, [12]). In addition, they were asked both quali-tative and quantative questions about the software based on both the User ExperienceQuestionnaire [17] and the System Usability Scale [3]. We concluded the study for eachparticipant with a short interview where users were asked to state areas of improvement,and what they liked about the software. The full questionnaire used in the study isavailable in the supplementary materials.
After filling the pre-study part of the questionnaire, users were given a brief introduc-tion to the controls in the software. After ensuring a good fit of the HMD on the user’shead, the interpupillary distance (IPD) of the HMD was adjusted to the user’s eyes, aswere the ROIs of the eye tracking cameras. The users then ran the calibration routineon their own. Then, they were able to take time to freely explore the dataset in spaceand time. If the calibration was found to not be sufficiently accurate, we re-adjustedHMD fit and camera ROIs, and ran the calibration routine again. Finally, all users weretasked with tracking the cells in the Platynereis dataset. Users were then able to createcell tracks freely, creating up to 32 cell tracks in 10 to 29 minutes.
All participants in the study had no or very limited experience with using VRinterfaces (5-point scale, 0 means no experience, and 4 daily use: mean 0.43, s.d. 0.53),and only one had previously used any eye-tracking-based user interfaces before (same5-point scale: mean 0.14, s.d. 0.37).
7.2 User Study Results
The average SSQ score was 25.6± 29.8 (median 14.9), which is on par with otherVR applications that have been evaluated using SSQ (see, e.g., [27]). From TLX, weused all categories (mental demand, physical demand, temporal demand, success, effort,insecurity), on a 7-point scale where 0=Very Low and 6=Very High for the demandmetrics, and 0=Perfect, 6=Failure for the performance metrics. Users reported mediumscores for mental demand (2.71±1.70) and for effort (2.86±1.68), while reporting lowscores for physical demand (1.86±1.95), temporal demand (1.57±0.98), and insecurity(1.14±1.68). The participants judged themselves to have been rather successful withthe tracking tasks (1.71±0.75).
All questions asked related to software usability and acceptance are summarised inFigure 4a. The users estimated that the Bionic Tracking method would yield a speedupof a factor 2 to 10 (3.33±6.25) compared to tracking cells with a regular 2D interface,and expressed high interest in using the method for their own tracking tasks (3.43±0.53;5-point scale here and for the following: 0=No agreement, 4=Full agreement), as thetracks created by it looked reasonable (2.57±0.98), it would provide an improvementover their current methods (3.14±0.90), and they could create new cell tracks not onlywith confidence (2.86±0.69), but also faster (3.29±0.76). Users found the softwarerelatively intuitive (2.43± 0.98) and did not need a long time to learn how to use it(0.59±0.79), which they also remarked on the the follow-up interviews:

12 Gunther, et al.
”It was so relaxing, actually, looking at this [cell] and just looking.” (P2, theuser remarked further after the interview that the technique might prevent carpaltunnel issues often encountered when tracking via mouse and keyboard.)
”I figured this could be like a super quick way to generate the [cell] tracks.” (P7)
Furthermore, the user study showed that users tend to adjust playback speed moreoften than image size (in VR). After playing around with different settings – userscould choose speeds from 1 to 20 volumes/second – all users interestingly settled on4-5 volumes/second, corresponding to 200 to 250 ms of viewing time per timepoint,which coincides with the onset delay of smooth pursuit eye movements. Albeit havingno or limited previous VR experience, the users did not feel irritated by the environment(0.00±0.00) nor by the use of eye tracking (0.29±0.49).
Fully
disa
gree
Fully
agree
Avg
Med
ian
Stdd
ev
The software felt responsive to my inputs. 3.14 3.00 0.38
Being in an isolated VR environment irritated me. 0.00 0.00 0.00
I had trouble orienting myself. 0.71 1.00 0.76
I would have liked a di�erent input/control method. 0.57 0.00 0.79
The usage felt very natural and intuitive. 2.43 2.00 0.98
I had to keep track of too many things at once. 0.86 1.00 0.69
I was put o� by the prototype character of the software. 0.29 0.00 0.76
I needed a long time to learn how to use the software. 0.57 0.00 0.79
The interaction felt very precise. 2.43 2.00 0.98
Having my eyes tracked irratated me. 0.29 0.00 0.49
The cell tracks created looked reasonable to me. 2.57 3.00 0.98
I could complete the tracking tasks with confidence. 2.86 3.00 0.69
I could imagine adopting the presented technique for tracking of my datasets. 3.43 3.00 0.53
The presented technique provides an improvement over current techniques. 3.14 3.00 0.90
The presented technique would allow me to perform tracking tasks faster. 3.29 3.00 0.76
The presented technique would allow me to perform tracking tasks more precisely. 2.29 2.00 0.76
Frequency 0 1 2 3 4 5 6
(a) Results of usability and acceptance-relatedquestion from the user study. Please note thatthe questions are formulated both positivelyand negatively.
(b) The 52 tracks we used for comparison withmanual tracking results visualised together withthe volumetric data of one timepoint. This isthe same view the user had, taken from withinthe VR headset. See the supplementary videofor a demonstration of creating these tracks.
Fig. 4: User study and cell tracking results for the Platynereis dataset.
7.3 Comparison with Manual Tracking ResultsTo further characterize the performance of Bionic Tracking, we performed a comparisonto manually annotated tracks. Our primary focus in this comparison is to assess thecapacity of Bionic Tracking to recreate individual manually annotated tracks. We com-pared 52 tracks created by an expert annotator using Bionic Tracking (see Figure 4b) onthe Platynereis dataset to their respective best matching ground truth tracks. We find that25 of the 52 tracks have a distance score [32] that is less than 1 cell diameter, suggestingthat these tracks will, on average, intersect the volume of their corresponding cell.

Bionic Tracking 13
8 Discussion
We were able to show that gaze in VR can be used to reconstruct tracks of biologicalcells in 3D microscopy. Our method does not only accelerates the process, but makesmanual tracking tasks also easier and less demanding. Although our expert-based userstudy was rather small in size, limiting its statistical power, we believe that it providesan indication that the use of Bionic Tracking can improve the user experience and speedfor cell tracking tasks, and that developing it further is worthwhile.
Even though the users had limited previous VR experience before, they were quicklyable to create cell tracks with high confidence. Multiple users complimented the er-gonomics of the technique, although it remains to be seen whether this would still bethe case for longer (1h+) tracking sessions. With the projected speedups, however, itmight not even be necessary to have such long sessions anymore (users indicated that formanual tracking, they would not do sessions longer than 3 to 4 hours, with the estimatedspeedups, this could be potentially reduced to just 20-90 minutes using Bionic Tracking).
For tracking large lineages comprising thousands of cells, Bionic Tracking on it ownis going to be cumbersome, for combinatorial reasons. It can, however, augment existingtechniques for parts of the tracking process, e.g., to track cells only in early stagesof development, where they tend to have less well-defined shapes, or it may provideconstraints and training data for machine-learning algorithms of automated tracking.Furthermore, Bionic Tracking could be used in conjunction with any automatic trackingalgorithm that provides uncertainty scores in order to restrict gaze input to regions wherethe algorithm cannot perform below a given uncertainty threshold. This could be done,e.g., by superimposing a heatmap on the volume rendering to indicate to the user areasthat need additional curation. Hybrid semi-automated/manual approaches are alreadyamong the most popular tools for challenging biological datasets [35].
9 Future Work and Limitations
In the future, we would like to integrate Bionic Tracking into an existing trackingsoftware, such that it can be used by a general audience. Unfortunately, eye tracking-enabled HMDs are not yet widely available, but according to current announcements,this is likely to change. Current developments in eye tracking hardware and VR HMDsindicate falling prices in the near future, such that those devices might soon become morecommon, or even directly integrated into off-the-shelf HMDs. One could imagine justhaving one or two eye tracking-enabled HMDs as an institute, making them availableto users in a bookable item-facility manner. At the moment, the calibration of the eyetrackers can still be a bit problematic, but this is likely to improve in the future, too,with machine learning approaches making the process faster, more reliable, and moreuser-friendly.
In order for Bionic Tracking to become a tool that can be routinely used for researchin biology, it will be necessary to implement interactions that allow the user to indicatecertain events, like cell divisions. Such an interaction could for example include the userpressing a certain button whenever a cell division occurs, and then track until the nextcell division. In such a way, the user can skip from cell division to cell division, literally

14 Gunther, et al.
applying divide-and-conquer for tracking (a part of) the cell lineage tree at hand. Theseadditional features will enable the creation of entire cell lineage trees.
The design and evaluation of algorithms to detect and track entire lineage trees iscurrently an active focus in the systems biology community [32]. In this study, we haveused comparison algorithms from the Particle Tracking Challenge (PTC) [5], which weredesigned to compare single tracks. There are limitations when applying the PTC metricto compare cell tracking annotations. However, until additional tracking events—such asthe aforementioned cell divisions—can be recorded with Bionic Tracking, PTC is theonly metric that can be applied.
In our tests, we have still seen some spurious detections, which lead to tracks obvi-ously not taken by the cell. This calls for more evaluations within crowded environments:While Bionic Tracking seems well suited for crowded scenes in principle – as users can,e.g., move around corners and are tracked by the HMD – it is not yet clear whether eyetracking is precise enough in such situations.
In addition, head tracking data from the HMD could be used to highlight the area ofthe volumetric dataset the user is looking toward (foveated rendering, [18, 4]), e.g., bydimming areas the user is not looking at. We have not yet explored foveation, but couldimagine it might improve tracking accuracy and mental load.
10 Conclusion
We have presented Bionic Tracking, a new method for object tracking in volumetricimage datasets, leveraging gaze data and virtual reality HMDs for biological cell trackingproblems. Our method is able to augment the manual parts of cell tracking tasks in orderto render them faster, more ergonomic, and more enjoyable for the user, while stillgenerating high-quality tracks. Users estimated they could perform cell tracking tasks upto 10-fold faster with Bionic Tracking than with conventional, manual tracking methods.
As part of Bionic Tracking, we have introduced a method for graph-based temporaltracking, which enables to robustly connect gaze samples with cell or object detectionsin volumetric data over time.
The results from our research prototype have been very encouraging, and we planto continue this line of research with further studies, extending the evaluation to moredatasets and users, and adding an evaluation of the accuracy of the created cell trackson datasets that have known associated ground truth. Furthermore, we would like toadd Bionic Tracking to a pipeline where the gaze-determined cell tracks can be used totrain machine-learning algorithms to improve automatic tracking results. Our prototypesoftware is available as open-source software at github.com/scenerygraphics/bionic-tracking.
Acknowledgements
The authors thank all participants of the user study. Thanks to Mette Handberg-Thorsagerfor providing the Platynereis dataset and for feedback on the manuscript. Thanks to

Bionic Tracking 15
Vladimir Ulman and Jean-Yves Tinevez for helpful discussions regarding track compari-son. Thanks to Bevan Cheeseman, Aryaman Gupta, and Stefanie Schmidt for helpfuldiscussions. Thanks to Pupil Labs for help with the eye tracking calibration.
This work was partially funded by the Center for Advanced Systems Understanding(CASUS), financed by Germany’s Federal Ministry of Education and Research (BMBF)and by the Saxon Ministry for Science, Culture and Tourism (SMWK) with tax funds onthe basis of the budget approved by the Saxon State Parliament.
R.D. and I.F.S. were supported by the Deutsche Forschungsgemeinschaft (DFG,German Research Foundation) under Germany´s Excellence Strategy – EXC-2068 –390729961 – Cluster of Excellence Physics of Life of TU Dresden.
References
1. F. Amat, B. Hockendorf, Y. Wan, W. C. Lemon, K. McDole, and P. J. Keller. Efficientprocessing and analysis of large-scale light-sheet microscopy data. Nature Protocols, 10(11),2015. doi: 10.1038/nprot.2015.111
2. F. Amat, W. Lemon, D. P. Mossing, K. McDole, Y. Wan, K. Branson, E. W. Myers, and P. J.Keller. Fast, accurate reconstruction of cell lineages from large-scale fluorescence microscopydata. Nature Methods, 11(9), 2014. doi: 10.1038/nmeth.3036
3. J. Brooke. SUS - A quick and dirty usability scale. In Usability Evaluation In Industry, p. 7.CRC Press, June 1996.
4. V. Bruder, C. Schulz, R. Bauer, S. Frey, D. Weiskopf, and T. Ertl. Voronoi-based FoveatedVolume Rendering. In EUROVIS 2019. Porto, Portugal, 2019.
5. N. Chenouard, I. Smal, F. de Chaumont, M. Maska, I. F. Sbalzarini, Y. Gong, J. Cardinale,C. Carthel, S. Coraluppi, M. Winter, A. R. Cohen, W. J. Godinez, K. Rohr, Y. Kalaidzidis,L. Liang, J. Duncan, H. Shen, Y. Xu, K. E. G. Magnusson, J. Jalden, H. M. Blau, P. Paul-Gilloteaux, P. Roudot, C. Kervrann, F. Waharte, J.-Y. Tinevez, S. L. Shorte, J. Willemse,K. Celler, G. P. van Wezel, H.-W. Dan, Y.-S. Tsai, C. O. de Solorzano, J.-C. Olivo-Marin,and E. Meijering. Objective comparison of particle tracking methods. Nature Methods,11(3):281–289, Mar. 2014. doi: 10.1038/nmeth.2808
6. A. T. Duchowski. Eye Tracking Methodology: Theory and Practice. Springer, Cham, thirdedition ed., 2017. OCLC: 993036172.
7. U. Gunther, T. Pietzsch, A. Gupta, K. I. Harrington, P. Tomancak, S. Gumhold, and I. F.Sbalzarini. Scenery: Flexible Virtual Reality Visualization on the Java VM. In 2019 IEEEVisualization Conference (VIS), pp. 1–5. IEEE, Vancouver, BC, Canada, Oct. 2019. doi: 10.1109/VISUAL.2019.8933605
8. S. G. Hart and L. E. Staveland. Development of NASA-TLX (Task Load Index): Results ofEmpirical and Theoretical Research. Advances in Psychology, 52, 1988. doi: 10.1016/s0166-4115(08)62386-9
9. J. Huisken. Optical Sectioning Deep Inside Live Embryos by Selective Plane IlluminationMicroscopy. Science, 305(5686), 2004. doi: 10.1126/science.1100035
10. R. J. K. Jacob. Eye Tracking in Advanced Interface Design. Virtual Environments andAdvanced Interface Design, pp. 258–290, 1995.
11. M. Kassner, W. Patera, and A. Bulling. Pupil: An open source platform for pervasive eyetracking and mobile gaze-based interaction. In Proceedings of the 2014 ACM InternationalJoint Conference on Pervasive and Ubiquitous Computing, pp. 1151–1160. ACM Press,Seattle, Washington, 2014. doi: 10.1145/2638728.2641695

16 Gunther, et al.
12. R. S. Kennedy, N. E. Lane, K. S. Berbaum, and M. G. Lilienthal. Simulator SicknessQuestionnaire: An Enhanced Method for Quantifying Simulator Sickness. The InternationalJournal of Aviation Psychology, 3(3), 1993. doi: 10.1207/s15327108ijap0303 3
13. M. Khamis, C. Oechsner, F. Alt, and A. Bulling. VRpursuits: Interaction in virtual realityusing smooth pursuit eye movements. In Proceedings of the 2018 International Conferenceon Advanced Visual Interfaces - AVI ’18, pp. 1–8. ACM Press, Castiglione della Pescaia,Grosseto, Italy, 2018. doi: 10.1145/3206505.3206522
14. K. Klamka, A. Siegel, S. Vogt, F. Gobel, S. Stellmach, and R. Dachselt. Look & Pedal:Hands-free Navigation in Zoomable Information Spaces through Gaze-supported Foot Input.In Proceedings of the 2015 ACM on International Conference on Multimodal Interaction -ICMI ’15, pp. 123–130. ACM Press, Seattle, Washington, USA, 2015. doi: 10.1145/2818346.2820751
15. T. Kosch, M. Hassib, P. W. Wozniak, D. Buschek, and F. Alt. Your Eyes Tell: LeveragingSmooth Pursuit for Assessing Cognitive Workload. In Proceedings of the 2018 CHI Confer-ence on Human Factors in Computing Systems - CHI ’18, pp. 1–13. ACM Press, MontrealQC, Canada, 2018. doi: 10.1145/3173574.3174010
16. T. Kroes, F. H. Post, and C. P. Botha. Exposure Render: An Interactive Photo-RealisticVolume Rendering Framework. PLoS ONE, 7(7), 2012. doi: 10.1371/journal.pone.0038586
17. B. Laugwitz and T. Held. Construction and Evaluation of a User Experience Questionnaire.In Proc. USAB 2008, pp. 63–76. Springer, 2008.
18. M. Levoy and R. Whitaker. Gaze-directed volume rendering. ACM SIGGRAPH ComputerGraphics, 24(2), 1990. doi: 10.1145/91385.91449
19. O. H.-M. Lutz, A. C. Venjakob, and S. Ruff. SMOOVS: Towards calibration-free text entryby gaze using smooth pursuit movements. Journal of Eye Movement Research, 8(1), 2015.doi: 10.16910/jemr.8.1.2
20. Y. K. Meena, H. Cecotti, K. Wong-Lin, and G. Prasad. A multimodal interface to resolve theMidas-Touch problem in gaze controlled wheelchair. Conference proceedings : ... AnnualInternational Conference of the IEEE Engineering in Medicine and Biology Society. IEEEEngineering in Medicine and Biology Society. Annual Conference, 2017, 2017. doi: 10.1109/embc.2017.8036971
21. S. Mirhosseini, I. Gutenko, S. Ojal, J. Marino, and A. Kaufman. Immersive VirtualColonoscopy. IEEE Transactions on Visualization and Computer Graphics, 25(5), 2019. doi:10.1109/tvcg.2019.2898763
22. T. Pietzsch, S. Saalfeld, S. Preibisch, and P. Tomancak. BigDataViewer: Visualization andprocessing for large image data sets. Nature Publishing Group, 12(6), 2015. doi: 10.1038/nmeth.3392
23. P. G. Pitrone, J. Schindelin, L. Stuyvenberg, S. Preibisch, M. Weber, K. W. Eliceiri, J. Huisken,and P. Tomancak. OpenSPIM: An open-access light-sheet microscopy platform. NatureMethods, 10(7), 2013. doi: 10.1038/nmeth.2507
24. T. Piumsomboon, G. Lee, R. W. Lindeman, and M. Billinghurst. Exploring natural eye-gaze-based interaction for immersive virtual reality. In 2017 IEEE Symposium on 3D UserInterfaces (3DUI), pp. 36–39. IEEE, Los Angeles, CA, USA, 2017. doi: 10.1109/3DUI.2017.7893315
25. E. G. Reynaud, J. Peychl, J. Huisken, and P. Tomancak. Guide to light-sheet microscopy foradventurous biologists. Nature Methods, 12(1), 2014. doi: 10.1038/nmeth.3222
26. J. Schindelin, I. Arganda-Carreras, E. Frise, V. Kaynig, M. Longair, T. Pietzsch, S. Preibisch,C. Rueden, S. Saalfeld, B. Schmid, J.-Y. Tinevez, D. J. White, V. Hartenstein, K. Eliceiri,P. Tomancak, and A. Cardona. Fiji: An open-source platform for biological-image analysis.Nature Methods, 9(7), 2012. doi: 10.1038/nmeth.2019

Bionic Tracking 17
27. A. Singla, S. Fremerey, W. Robitza, and A. Raake. Measuring and comparing QoE andsimulator sickness of omnidirectional videos in different head mounted displays. In 2017Ninth International Conference on Quality of Multimedia Experience (QoMEX), pp. 1–6, May2017. doi: 10.1109/QoMEX.2017.7965658
28. M. Slater and M. V. Sanchez-Vives. Enhancing Our Lives with Immersive Virtual Reality.Frontiers in Robotics and AI, 3, 2016. doi: 10.3389/frobt.2016.00074
29. S. Stellmach and R. Dachselt. Look & touch: Gaze-supported target acquisition. In Proceed-ings of the 2012 ACM Annual Conference on Human Factors in Computing Systems - CHI
’12, p. 2981. ACM Press, Austin, Texas, USA, 2012. doi: 10.1145/2207676.220870930. X. Sun, W. Yeoh, and S. Koenig. Dynamic fringe-saving A*. In Proceedings of The 8th
International Conference on Autonomous Agents and Multiagent Systems, vol. 2, pp. 891–898.International Foundation for Autonomous Agents and Multiagent Systems, Richland, SC,2009.
31. J.-Y. Tinevez, N. Perry, J. Schindelin, G. M. Hoopes, G. D. Reynolds, E. Laplantine, S. Y.Bednarek, S. L. Shorte, and K. W. Eliceiri. TrackMate: An open and extensible platform forsingle-particle tracking. Methods, 115(IEEE Signal Proc. Mag. 23 3 2006), 2017. doi: 10.1016/j.ymeth.2016.09.016
32. V. Ulman, M. Maska, K. E. G. Magnusson, O. Ronneberger, C. Haubold, N. Harder, P. Matula,P. Matula, D. Svoboda, M. Radojevic, I. Smal, K. Rohr, J. Jalden, H. M. Blau, O. Dzyubachyk,B. Lelieveldt, P. Xiao, Y. Li, S.-Y. Cho, A. C. Dufour, J.-C. Olivo-Marin, C. C. Reyes-Aldasoro, J. A. Solis-Lemus, R. Bensch, T. Brox, J. Stegmaier, R. Mikut, S. Wolf, F. A.Hamprecht, T. Esteves, P. Quelhas, O. Demirel, L. Malmstrom, F. Jug, P. Tomancak, E. Meijer-ing, A. Munoz-Barrutia, M. Kozubek, and C. Ortiz-de-Solorzano. An objective comparison ofcell-tracking algorithms. Nature Methods, 14(12):1141–1152, Dec. 2017. doi: 10.1038/nmeth.4473
33. W. Usher, P. Klacansky, F. Federer, P.-T. Bremer, A. Knoll, J. Yarch, A. Angelucci, andV. Pascucci. A Virtual Reality Visualization Tool for Neuron Tracing. IEEE Transactions onVisualization and Computer Graphics, 24(1), 2017. doi: 10.1109/tvcg.2017.2744079
34. M. Vidal, A. Bulling, and H. Gellersen. Pursuits: Spontaneous interaction with displaysbased on smooth pursuit eye movement and moving targets. In Proceedings of the 2013 ACMInternational Joint Conference on Pervasive and Ubiquitous Computing - UbiComp ’13, p.439. ACM Press, Zurich, Switzerland, 2013. doi: 10.1145/2493432.2493477
35. J. Winnubst, E. Bas, T. A. Ferreira, Z. Wu, M. N. Economo, P. Edson, B. J. Arthur, C. Bruns,K. Rokicki, D. Schauder, D. J. Olbris, S. D. Murphy, D. G. Ackerman, C. Arshadi, P. Baldwin,R. Blake, A. Elsayed, M. Hasan, D. Ramirez, B. Dos Santos, M. Weldon, A. Zafar, J. T.Dudman, C. R. Gerfen, A. W. Hantman, W. Korff, S. M. Sternson, N. Spruston, K. Svoboda,and J. Chandrashekar. Reconstruction of 1,000 Projection Neurons Reveals New Cell Typesand Organization of Long-Range Connectivity in the Mouse Brain. Cell, 179(1):268–281.e13,Sept. 2019. doi: 10.1016/j.cell.2019.07.042
36. C. Wolff, J.-Y. Tinevez, T. Pietzsch, E. Stamataki, B. Harich, L. Guignard, S. Preibisch,S. Shorte, P. J. Keller, P. Tomancak, and A. Pavlopoulos. Multi-view light-sheet imaging andtracking with the MaMuT software reveals the cell lineage of a direct developing arthropodlimb. eLife, 7, 2018. doi: 10.7554/elife.34410

18 Gunther, et al.
Supplementary Material
L R
TriggerPick up & move dataset
Step back
TriggerStart/Stop
trackingPlay/Pause
Play slower
Play fasterStep forward
Moveobserver Side
Delete lasttrack
Fig. S.1: Controller bindings for Bionic Tracking. Handedness can be swapped.
Bionic Tracking 19
Fig. S.2: Left: Partial hedgehogs (sets of rays of samples through the volume for one cell track) fora single time point of the Platynereis dataset, after creating 18 cell tracks. Right: Full hedgehogsfor all timepoints after creating tracks for 18 cells. Color coded by time, yellow is early, blue latealong the time of the dataset. See the supplementary video for a dynamic demonstration and themain text for details.

20 Gunther, et al.
0 50 100 150 200 250 300 3500.00
0.02
0.04
0.06
0.08
Step on ray/voxels
Samplevalue
Example Ray Profile
Fig. S.3: An example intensity value profile along an entire spine/ray through a volumetric dataset.The X axis is step along the spine in voxels, the Y axis volume sample value. In this case, thereare two local maxima along the ray, one close to the observer, at index 70, and another one furtheraway at 284. The profile was taken along the gray line shown in Figure 2 of the main text.

Bionic Tracking 21
Fig. S.4: Visualization of a cell track created in the Platynereis dataset. See the companion videofor the tracking process over time.

22 Gunther, et al.
Fig. S.5: Cell tracks created by Bionic Tracking in the MDA231 dataset, with a single spine usedfor creating a track shown at the top left in purple.

![arXiv:2009.07432v1 [eess.IV] 16 Sep 2020 · Reality ·Computer Assisted Interventions ·Image Guided Surgery 1 Introduction In endoscopic surgery visualising blood vessels is a common](https://img.pdfslide.net/doc/110x75/600bdd56d43bc745e87a2fe2/arxiv200907432v1-eessiv-16-sep-2020-reality-computer-assisted-interventions.jpg)

![September 24, 2018 arXiv:1711.10599v1 [physics.data-an] 28 ... · Parameter Estimation in the presence of Model Inadequacy and Data Uncertainty 3 reality mathematical abstraction](https://img.pdfslide.net/doc/110x75/606b46f4d1dea310f774e1e3/september-24-2018-arxiv171110599v1-28-parameter-estimation-in-the-presence.jpg)
![Abstract arXiv:1910.00116v1 [cs.CV] 30 Sep 2019 · 1Facebook Reality Labs, Sausalito, USA 2University of California, Los Angeles, USA merayxu@gmail.com, sczhu@stat.ucla.edu, tony.tung@fb.com](https://img.pdfslide.net/doc/110x75/5e5e7973cf37ba7e3a783b9f/abstract-arxiv191000116v1-cscv-30-sep-2019-1facebook-reality-labs-sausalito.jpg)


![arXiv:2004.02307v2 [cs.CV] 19 May 2020autonomous driving, surveillance, and augmented reality. The components of a scene can generally be categorized into ‘stuff’ and ‘thing’](https://img.pdfslide.net/doc/110x75/5ed05c42d7c69e1a5c46eda9/arxiv200402307v2-cscv-19-may-2020-autonomous-driving-surveillance-and-augmented.jpg)


![arXiv:1610.07482v2 [physics.bio-ph] 9 Mar 2017 · W. Bealek, Biophysics: Searching for Principles (Princeton University Press, 2012). 2. effect, a biological object might “hide](https://img.pdfslide.net/doc/110x75/5f07fac07e708231d41fb8f9/arxiv161007482v2-9-mar-2017-w-bealek-biophysics-searching-for-principles.jpg)
![Biological measurement beyond the quantum limit - arXiv · PDF filearXiv:1206.6928v1 [quant-ph] 29 Jun 2012 Biological measurement beyond the quantum limit Michael A. Taylor1,2, Jiri](https://img.pdfslide.net/doc/110x75/5ab1ab4d7f8b9ac3348cbb7c/biological-measurement-beyond-the-quantum-limit-arxiv-12066928v1-quant-ph-29.jpg)

![State of Augmented Reality, Virtual Reality and Mixed Reality · State of Augmented Reality, Virtual Reality and Mixed Reality [Microsoft Hololen] [Ready Player One] Augmented Reality](https://img.pdfslide.net/doc/110x75/5f82ab6da2d89130b90d78c7/state-of-augmented-reality-virtual-reality-and-mixed-reality-state-of-augmented.jpg)
![arXiv:1802.10569v1 [cs.CL] 28 Feb 2018 · Simultaneously Self-Attending to All Mentions for Full-Abstract Biological Relation Extraction Patrick Verga, Emma Strubell, Andrew McCallum](https://img.pdfslide.net/doc/110x75/5ecc81b4c487e33d9409992e/arxiv180210569v1-cscl-28-feb-2018-simultaneously-self-attending-to-all-mentions.jpg)
![On the Nature of Reality - arXiv · On the Nature of Reality ... Brazil. Contents 1 Introduction 1 ... In the book ‘The Fabric of Reality’ [1], Deutch perfectly pictures the](https://img.pdfslide.net/doc/110x75/5c11d7c909d3f23b288cbbb0/on-the-nature-of-reality-arxiv-on-the-nature-of-reality-brazil-contents.jpg)