Embed Size (px)
Citation preview
JNCC Report
No. 433
Biological data interpretation of the
Reef East of Shetland Isles Area of Search
Foster-Smith, R., Benson, A. & Foster-Smith, J.
March 2009
© JNCC, Peterborough 2009
ISSN 0963-8091

For further information please contact: Joint Nature Conservation Committee Monkstone House City Road Peterborough Cambridgeshire PE1 1JY Email: [email protected] Tel: +44 (0)1733 866840 Fax: +44 (0)1733 555948 Website: www.jncc.gov.uk
This report should be cited as: Foster-Smith, R, Benson, A and Foster-Smith, J. 2009. Interpretation of Pobie Bank East of Shetland for Annex I Reef, JNCC Report No. 433
Biological date interpretation of the Reef East of Shetland Isles Area of Search
Summary
• The available data provided with the contract and previously reviewed by British Geological Survey (BGS) was studied and this indicated that further analysis might refine the nature and extent of reef features. No additional data were available from other possible data providers.
• The video and stills were analysed and the sediment characteristics and species recorded entered into a spreadsheet. The relevant fields were then entered into Marine Recorder.
• Attempts were made to record as systematically as possible and a trigon was devised that was suitable for recording rocky reef substrata.
• The video was split into clips representing distinct habitats and the clips were the main focus for the habitat descriptions. Stills were sub-sampled where necessary and the data recorded. The data from the stills contributed to the description of the video clips.
• The records were analysed and matched to biotope classes. The range of biotopes was small and only three rocky biotopes were identified: (1) Faunal and algal crusts on exposed to moderately wave-exposed circalittoral rock (CR.MCR.EcCr.FaAlCr), (2) Phakellia ventilabrum and Axinellid sponges on deep, wave-exposed circalittoral rock (CR.HCR.DpSp.PhaAxi) and (3) Caryophyllia smithii, sponges and crustose communities on wave-exposed circalittoral rock (CR.MCR.EcCr.CarSp).
• The infaunal biotopes were largely classed as Circalittoral coarse sand. • Further analysis of the acoustic images identified three main types of potential Annex
I reef: (1) bedrock reef, (2) stony reef and (3) bedrock and stony reef. The latter class was required to encompass areas where the exact composition was unverified by but likely to be a mixture of the two main reef types.
• The findings of the analyses are discussed and maps presented of the most likely extent of reefs and biotopes within the study area. These must be regarded as tentative given the paucity of data for the area.
• Boundaries have been suggested as to the likely extent of probable Annex I reef. It is considered that the majority of qualifying reef lies at depths shallower than the 100m depth contour over Pobie Bank.
Biological date interpretation of the Reef East of Shetland Isles Area of Search
Contents 1 Introduction ........................................................................................................................ 1
1.1 Objectives .................................................................................................................. 1
1.2 Sources of data ........................................................................................................... 2
1.3 Background to Pobie Bank ........................................................................................ 2
2 Methodology ...................................................................................................................... 6
2.1 Analysis of SEA video and stills ............................................................................... 6
2.1.1 Analysis of stills ..................................................................................................... 6
2.1.2 Analysis of video ................................................................................................... 7
2.2 Biotope assignment .................................................................................................... 7
2.2.1 Assignment to sediment class ................................................................................ 7
2.2.2 Analysis of the biota ............................................................................................ 10
2.2.3 Analysis to assign biotope class ........................................................................... 10
2.2.4 The outputs: biotope descriptions ........................................................................ 10
2.3 Analysis of acoustic survey data .............................................................................. 11
2.3.1 Strategy ................................................................................................................ 11
3 Results .............................................................................................................................. 14
3.1 Assessment of redundancy of stills .......................................................................... 14
3.2 Stills as a representation of habitat .......................................................................... 16
3.3 Habitat distribution .................................................................................................. 18
3.4 General description of the biota ............................................................................... 19
3.5 Assessment of habitat-community relationship correlations from video and stills data. .......................................................................................................................... 22
3.5.1 Video clips ........................................................................................................... 22
3.5.2 Stills ..................................................................................................................... 26
3.5.3 Habitat richness .................................................................................................... 28
3.6 Biotopes ................................................................................................................... 28
3.6.1 Biotope assignment .............................................................................................. 28
3.6.2 Critique of biotope assignment ............................................................................ 30
3.6.3 Summary descriptions of biotopes ....................................................................... 31
3.7 Analysis of the acoustic data .................................................................................... 34
3.7.1 Interpretation of substrata .................................................................................... 34
3.7.2 Distribution of substrata and topographic features .............................................. 39
3.7.3 Distribution of Annex I Reef Features ................................................................. 42
3.7.4 Distribution of direct observations of substrata and biotopes .............................. 45
3.8 Annex I Reef distribution and biotope maps ........................................................... 48

Biological date interpretation of the Reef East of Shetland Isles Area of Search
3.8.1 Issues regarding full coverage maps .................................................................... 48
3.8.2 Preparation of the final map of Annexe I reef features ........................................ 48
3.8.3 Preparation of the biotope map ............................................................................ 49
4 Discussion and conclusion ............................................................................................... 52
4.1 Contribution of review to supporting scientific evidence ........................................ 52
4.2 Site overview ........................................................................................................... 52
4.3 Assessment of features relevant to selection criteria ............................................... 53
4.3.1 Representivity ...................................................................................................... 53
4.3.2 Area of habitat ...................................................................................................... 53
4.4 Site Boundary........................................................................................................... 53
5 Acknowledgements .......................................................................................................... 56
6 References ........................................................................................................................ 57
Appendix 1 ............................................................................................................................... 58

Biological date interpretation of the Reef East of Shetland Isles Area of Search
Biological date interpretation of the Reef East of Shetland Isles Area of Search
1
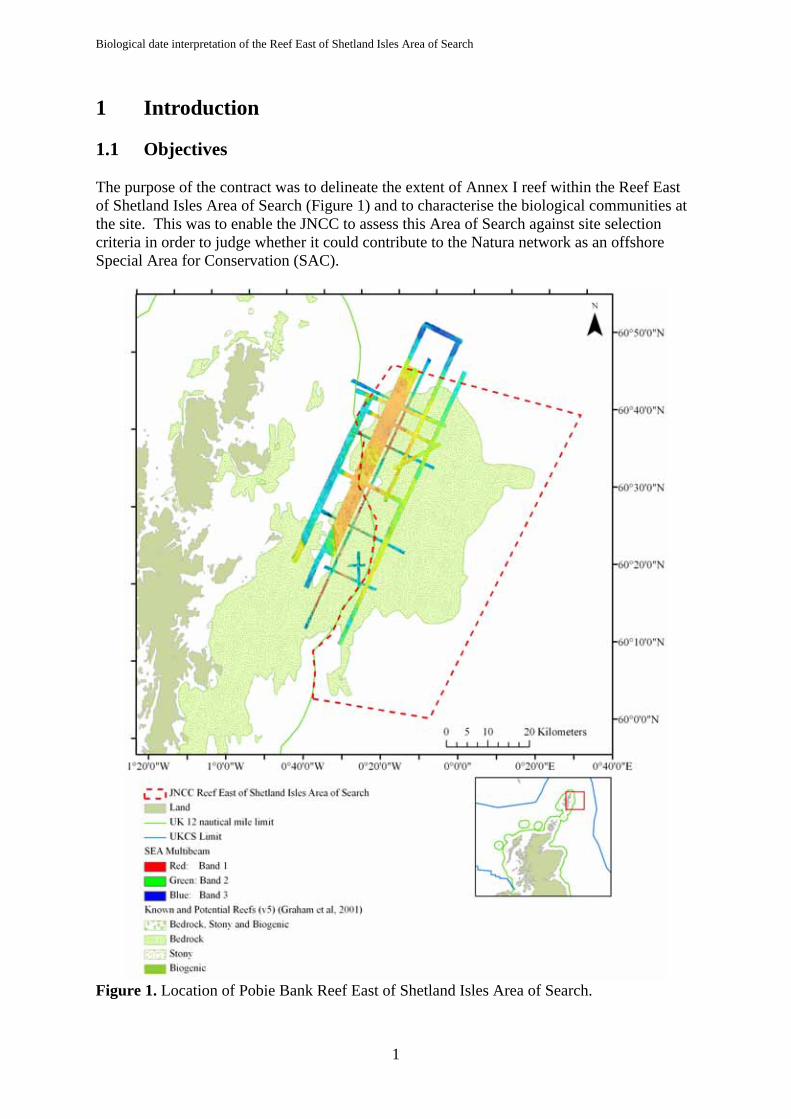
1 Introduction 1.1 Objectives The purpose of the contract was to delineate the extent of Annex I reef within the Reef East of Shetland Isles Area of Search (Figure 1) and to characterise the biological communities at the site. This was to enable the JNCC to assess this Area of Search against site selection criteria in order to judge whether it could contribute to the Natura network as an offshore Special Area for Conservation (SAC).
Figure 1. Location of Pobie Bank Reef East of Shetland Isles Area of Search.

Biological date interpretation of the Reef East of Shetland Isles Area of Search
2
One objective was to analyse the stills and video from surveys conducted in 2003 and 2006 and to enter the resulting data into a spreadsheet and into Marine Recorder. Descriptions of the reef habitats and associated biotopes were based on an analysis of these data. The delineation of the extent of reefs was based on an assessment of existing information. Some of this information was provided in an interpreted form, such as the BGS identification of possible Annex I habitat which was provided as a polygon layer. Other acoustic data were available from the 2003 and 2006 surveys. All information was reviewed and a more detailed inspection of survey data (multibeam, sidescan) and video/photographic data was undertaken to explore the possibility of a more detailed, higher definition of reef features (particularly substratum and topography). The sidescan and swath data sets only covered a limited area of the potential Annex I area (as defined by the BGS study) so that the analysis could only give an indication of the nature of the reefs for that coverage. A further objective of the project was to search for additional data sets relevant to the site. In summary, the main purpose of this report was to derive the best summary description of the nature and extent of the rocky and stony reefs and to fit the best possible boundaries to the features identified from available data. 1.2 Sources of data The main data sources were the 2003 and 2006 surveys and survey reports (Black 2003, McDougall 2003, Howell et al 2007), Strategic Environmental Assessment for Area 5 (Holmes et al 2004) and the review report undertaken by BGS (Green et al 2008). A small allocation of the budget was to explore other sources of data. The Fisheries Research Laboratory in Aberdeen undertakes annual cruises to study anglerfish and megrim on the northern shelf and a Shetland Coast Scallop Survey. Although cameras have been used, no data was available for Pobie Bank. The Offshore Industries Advisor for the JNCC at Aberdeen (Craig Bloomer) was also contacted and no information was available for Pobie Bank. UKOOA data are mostly concentrated to the north and east of Pobie Bank and were not considered relevant. Pipeline surveys were also well to the north of Pobie Bank. BGS were also not aware of any relevant data that they had not already used in their assessment. Thus, the data available for this review consisted of the 2003 and 2006 data (supplied in a variety of formats) and figures included in the various reports. Digbath 250 contours were also available to provide a low resolution background to the higher resolution survey data. 1.3 Background to Pobie Bank Pobie Bank is situated approximately 20km west of Unst, Fetlar and Whalsey in Shetland and is separated from Shetland by the deep Unst Basin (160m deep). ‘Pobie’ is a Shetland name for a high hill and it is presumed that Pobie Bank was so named because Saxa Vord (a hill on Unst) was the only land visible from much of the bank. It is about 70km long, 20km wide with the crest running north east, south west. The crest is generally above 100m and is about 80m deep at its shallowest. Based on the Hydrographic Chart contours, 825 sq km lies above 100m. The western margin follows the line of the Pobie Bank Fault and the seabed slopes steeply on this side and also to the north, creating well defined boundaries on these two sides. The southern tip of Pobie Bank is relatively shallow with only a short distance that falls below 100m separating the bank from the 100m contour bordering Mainland. The east side
Biological date interpretation of the Reef East of Shetland Isles Area of Search
3
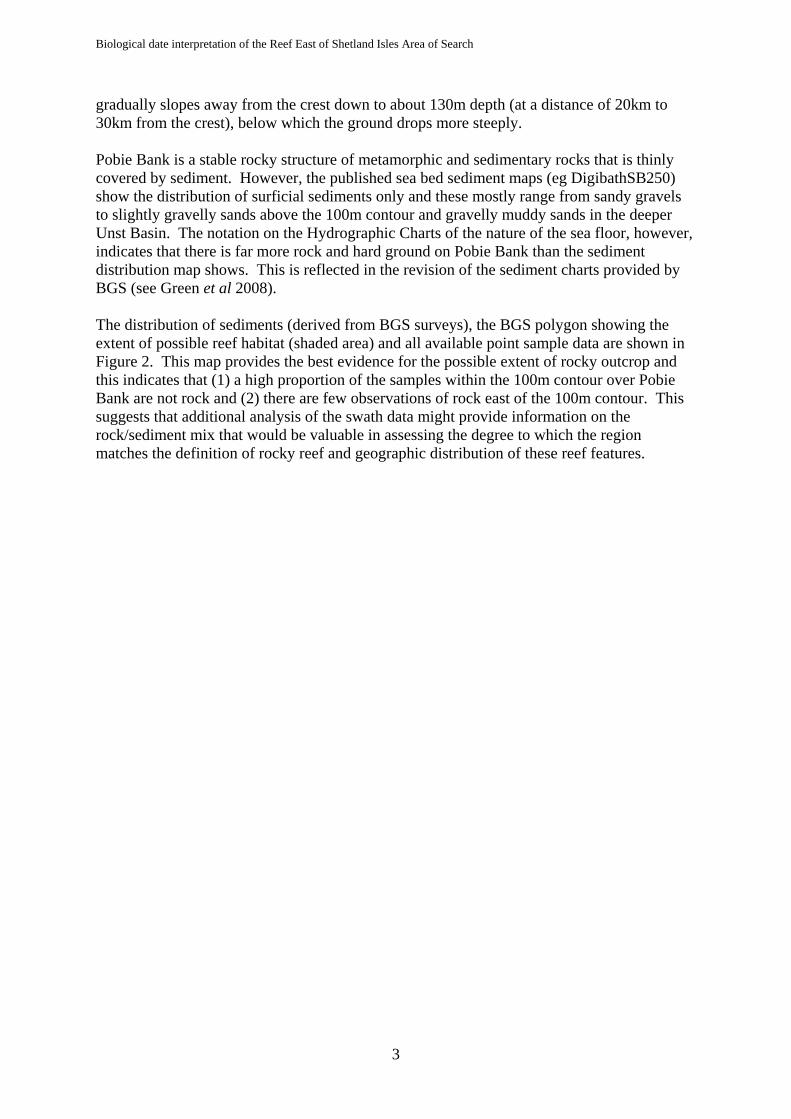
gradually slopes away from the crest down to about 130m depth (at a distance of 20km to 30km from the crest), below which the ground drops more steeply. Pobie Bank is a stable rocky structure of metamorphic and sedimentary rocks that is thinly covered by sediment. However, the published sea bed sediment maps (eg DigibathSB250) show the distribution of surficial sediments only and these mostly range from sandy gravels to slightly gravelly sands above the 100m contour and gravelly muddy sands in the deeper Unst Basin. The notation on the Hydrographic Charts of the nature of the sea floor, however, indicates that there is far more rock and hard ground on Pobie Bank than the sediment distribution map shows. This is reflected in the revision of the sediment charts provided by BGS (see Green et al 2008). The distribution of sediments (derived from BGS surveys), the BGS polygon showing the extent of possible reef habitat (shaded area) and all available point sample data are shown in Figure 2. This map provides the best evidence for the possible extent of rocky outcrop and this indicates that (1) a high proportion of the samples within the 100m contour over Pobie Bank are not rock and (2) there are few observations of rock east of the 100m contour. This suggests that additional analysis of the swath data might provide information on the rock/sediment mix that would be valuable in assessing the degree to which the region matches the definition of rocky reef and geographic distribution of these reef features.
Biological date interpretation of the Reef East of Shetland Isles Area of Search
4
Figure 2. A summary of available information on the distribution of sediments and rock. Sources of data are referred to in the text (above). The 100m contour is indicated by the dark blue line. A useful terrain model of the major topographic features of Pobie Bank can be constructed from the Digibath250 bathymetric data and this is shown in Figure 3.

Biological date interpretation of the Reef East of Shetland Isles Area of Search
5
Figure 3. A shaded terrain model of Pobie Bank derived from the Digibath250 bathymetric data with 10m contours superimposed. The thicker dark blue line shows the 100m contour. The viewpoint is from the south looking north with the Unst Basin (blue) separating the mainland (to the left) from Pobie Bank.

Biological date interpretation of the Reef East of Shetland Isles Area of Search
6
2 Methodology 2.1 Analysis of SEA video and stills The approach to the analysis of the stills and video was to make best use of the strengths of both techniques. The emphasis of video analysis was the identification of changes in biotope and habitat that could be related to features seen on sidescan and multibeam images. Some features were also best identified on moving images rather than stills, especially those with a significant three dimensional structure. By contrast, still images were relied upon to identify species. Particular importance was given to features which are covered by the definition of Annex I reef. The analysis of the stills preceded analysis of the video. This enabled an extensive list of species (or higher taxa) to be prepared from the stills that could be used to inform the video analysis. The information from the video and stills was recorded on separate spreadsheets and subsequently entered into Marine Recorder. There was a difference in the scale of observation between the video clip (section of video tow attributed to a single biotope) and the stills and most clips encompassed a number of stills. Thus, there was a one-to-many relationship between the video records and the stills records. This had consequences for the analysis of the records, as discussed in section 2.2 ‘Biotope assignment’. 2.1.1 Analysis of stills There were about 450 stills available for analysis and it was expected that this number would be reduced where there was redundancy (where there were numerous stills for a video tow and where the sea floor was relatively homogeneous). In order to assess the scope for redundancy, one set of stills was analysed and the summary statistics of the full set was compared with those derived from alternate stills. In general, the range of habitats was small and the heterogeneity was low so that the slides analysed have been considered to be representative of the ground covered by each set of stills and associated video tow. On the basis of the preliminary analysis, a strategy was adopted whereby sets with less than 15 stills were analysed in full, and those with more were reduced in number (eg by taking every second or third still) to reduce the number to about 10 per set. The procedure adopted thereafter was to view all the selected stills and to attempt to identify the full range of species seen. This produced a working species list that was added to the spreadsheets. This was a lengthy process since many deep water, northern species are rarely recorded in the British fauna and not easy to trace in the usual references. Some were more familiar to the Norwegian workers and reference was made to photographic guides from there (eg http://www.seawater.no/fauna/). Many were not identified due to the limitations of the photography for identification. As far as could be judged, these were assigned to descriptive entities in a consistent way. The stills were then fully analysed (ie noting details of substrates and species abundances) and the results entered into a ‘pro forma’ Excel spreadsheet originally provided by JNCC which contained the list of the various features that were to be recorded. The working species list was added to and updated during the full analysis: more species were added and the identity of others revised. After all the stills were analysed the entries were checked to
Biological date interpretation of the Reef East of Shetland Isles Area of Search
7
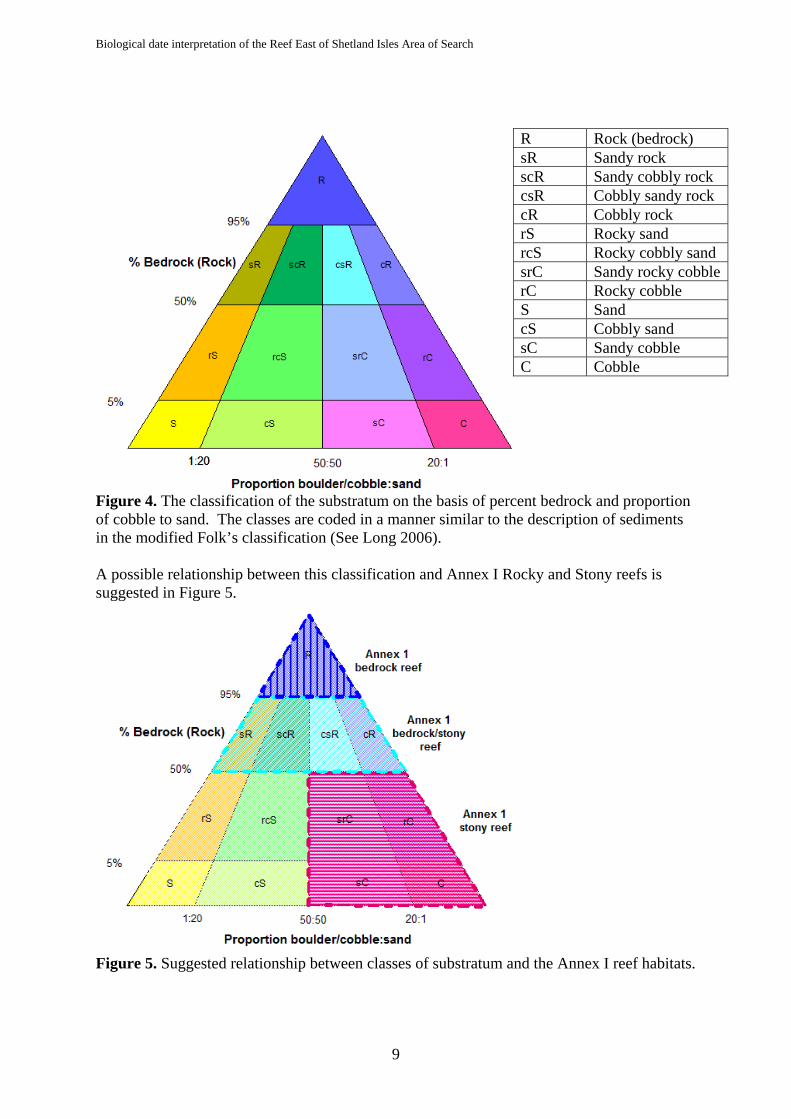
ensure consistency throughout. The appropriate data from final spreadsheet were then transferred to Marine Recorder. 2.1.2 Analysis of video The video footage was inspected to gain an overview of the distribution of habitats along the tow to search for sections that required dividing into separate video clips of uniform habitat type. Times or positions (depending on the information available on the videos) of breaks in habitat were noted. The mixture of substrata was quite varied and only major and enduring changes were used to mark video clips. The video was then replayed for analysis. The video from 2003 was of poor quality and often out of focus. The 2006 video was more sharply in focus but the drifting video was too far away from the seafloor for detailed species analysis. (Close-up video was recorded when the system was lowered onto the seafloor for taking stills, but recording species here would be repetitive of the stills data and was avoided). Thus, the video was not generally suitable for detailed species analysis and the video was used primarily for habitat description. Few species were, in fact, added to the species list from the video (ie that were not already observed in the stills). The varied nature of the habitats meant that, even within video clips, it was difficult to assess the relative cover of the different sized rocks from an overview of the clips. Instead, the video was stopped every minute and forwarded until the next clear view of the seafloor was obtained. The positions where the video was landed onto the seafloor for taking still close-ups were avoided as (1) this would be a repetition of the stills data and (2) the video drifting above the seafloor gave a wider field of view that complemented the stills close-ups. The percentage cover was estimated for each stop and these were averaged over the video clip. The abundances of conspicuous species were recorded where possible. Every attempt was made to record cover/abundance of features and species systematically. Prompt sheets for cover were used to help assess cover and size of rocks. The field of view changed depending on how far the video had been held above the sea floor and the field of view and size of rocks were estimated with reference to regularly occurring species, such as the sponge Axinella infundibuliformis. 2.2 Biotope assignment The sediment and the biota were analysed separately before any attempt was made to combine them into an assigned biotope. This was done for two reasons: Firstly, most of the features that define rocky reefs are based on sediment and topography and a classification of substrata would be useful in its own right for assigning records to Annex I Reef (bedrock or stony). Secondly, many rocky biotopes span a wide range of substrata and it is often instructive to analyse the biota separately to see if different biotopes (or variations of a biotope) can be justified from the biological viewpoint rather than on the basis of substratum. 2.2.1 Assignment to sediment class The sediment of the majority of the samples consisted of various proportions of rock, boulder, cobble and gravel/sands. Additionally, there were many ‘modifiers’. It is difficult to describe the physical habitat in a consistent way with such a large number of variables and descriptors and an attempt was made to take a systematic approach to the assignment of habitat type to the images. A system similar to the Folk’s triangle was proposed for the

Biological date interpretation of the Reef East of Shetland Isles Area of Search
8
classification of the sediment based on percentage rock and the ratio of cobble to sand (Figure 4) and this formed the basis of the physical habitat description. The substrates listed in the JNCC Excel spreadsheet were grouped into three main categories (see Table 1) for the purpose of classification of the substratum. The percentages of the different substrata that were recorded during the video and stills analysis were summed according to these three categories. Table 1. The three categories of substrate types for the classification of the substratum.
The percentage values allocated for each of the following substrate types were summed into the main substrate categories, as below, into stable Rock, Boulder/Cobble and Gravel/Sand.
Rock Bedrock Boulders_over1024mm
Boulder/Cobble Boulders_512to1024mm Boulders_256to512mm Cobbles_64to256mm
Gravel/Sand Pebbles_16to64mm
Gravel_Stone_4to16mm Gravel_Shell_4to16mm Gravel_DeadMaerl Gravel_LiveMaerl Sand_Coarse_1to4mm Sand_Medium_0_25to1mm Sand_Fine_0_063to0_25mm
The percentage rock and ratio of boulder/cobble to gravel/sand was plotted on a ternary (triangular) graph and the samples assigned to the corresponding substrate type (Figure 5).
Biological date interpretation of the Reef East of Shetland Isles Area of Search
9
Figure 4. The classification of the substratum on the basis of percent bedrock and proportion of cobble to sand. The classes are coded in a manner similar to the description of sediments in the modified Folk’s classification (See Long 2006). A possible relationship between this classification and Annex I Rocky and Stony reefs is suggested in Figure 5.
Figure 5. Suggested relationship between classes of substratum and the Annex I reef habitats.
R Rock (bedrock) sR Sandy rock scR Sandy cobbly rock csR Cobbly sandy rock cR Cobbly rock rS Rocky sand rcS Rocky cobbly sand srC Sandy rocky cobblerC Rocky cobble S Sand cS Cobbly sand sC Sandy cobble C Cobble

Biological date interpretation of the Reef East of Shetland Isles Area of Search
10
This basic description was then elaborated upon using the standard set of descriptors that related to the descriptive fields in the JNCC spreadsheet template (eg surface relief, presence of fissures, sand ripples etc.) (Note: The actual percentages for bedrock and proportion cobble:sand used for calculating substratum membership of video assessment records were adjusted slightly as follows: 96% and 52% were used instead of 95% and 50%; 52:48 was used instead of 50:50. This slight bias towards bedrock and stony reef was necessary since many visually assessed values for percentage cover fell exactly on these boundaries resulting in many potentially equivocal records. The adjustments meant that these borderline records fell into the reef categories rather than the non-reef category). 2.2.2 Analysis of the biota Each spatially uniform habitat was described by one video clip record and a number of associated stills records. It is probably more satisfactory for statistics and descriptions of sediment and biotope to be based on the video clip, supported by the associated stills, rather than treating the video clips and stills separately. Thus, each video clip was assigned to a biotope class and the associated stills were also tagged with this biotope class. One exception to this might occur where a video clip is best described as a spatially heterogeneous mixture of two (or more in extremely complex habitats) biotopes, in which case the stills were assigned to the appropriate biotope in the mixture. Multivariate analysis was used as guidance in biotope assignment. Two analyses were carried out: The first took each individual stills record to be a sample and the second took the average abundance of species of the stills contained within each video clip as the sample. Similarity matrices using Bray-Curtis on untransformed abundance data (assuming the SACFOR abundance estimate to be equivalent to a transformation) were subjected to the CLUSTER routine in PRIMER(™) together with SIMPROF. The contribution of each species to significant clusters was determined using SIMPER. The matrices were also subjected to MDS and the axis values exported to Excel(™) and this table supplemented with sediment class information and cluster group. This table was then exported to MapInfo(™) and displayed in non-earth coordinates. MapInfo(™) permits a great versatility in display that is very useful for data exploration and showing correspondence between sediment and biota. 2.2.3 Analysis to assign biotope class Any correspondence between biota class and sediment class was explored. Comparison of records was made to existing EUNIS biotopes to establish if the records were adequately covered by the EUNIS classes or if they warranted either novel biotope status or to be described as a significant variant of an existing biotope. New biotopes would only be created if the records were considered to be sufficiently distinct from existing descriptions. 2.2.4 The outputs: biotope descriptions The biotopes that were assigned were given a summary description accompanied by statistics and were illustrated with appropriate images. Biotope distribution maps were also required and, wherever possible, images from the sidescan and multibeam data were shown to provide a broader scale habitat context for the biotopes. The information from the stills within each
Biological date interpretation of the Reef East of Shetland Isles Area of Search
11
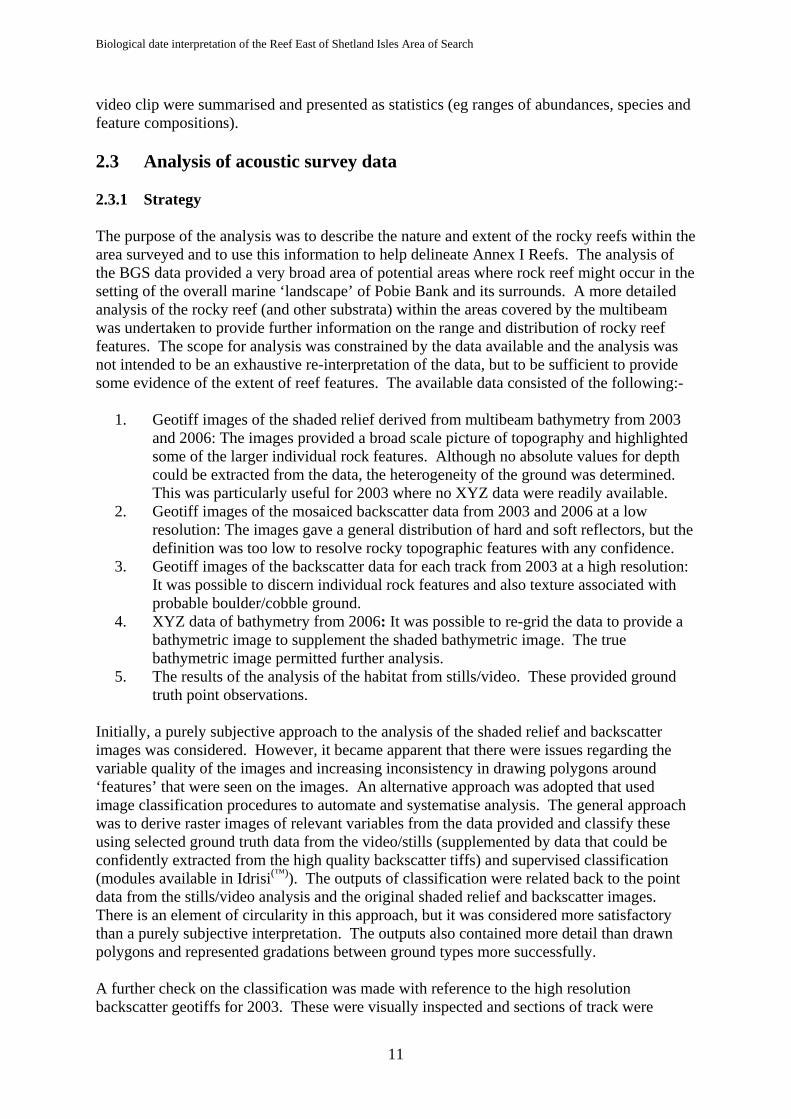
video clip were summarised and presented as statistics (eg ranges of abundances, species and feature compositions). 2.3 Analysis of acoustic survey data 2.3.1 Strategy The purpose of the analysis was to describe the nature and extent of the rocky reefs within the area surveyed and to use this information to help delineate Annex I Reefs. The analysis of the BGS data provided a very broad area of potential areas where rock reef might occur in the setting of the overall marine ‘landscape’ of Pobie Bank and its surrounds. A more detailed analysis of the rocky reef (and other substrata) within the areas covered by the multibeam was undertaken to provide further information on the range and distribution of rocky reef features. The scope for analysis was constrained by the data available and the analysis was not intended to be an exhaustive re-interpretation of the data, but to be sufficient to provide some evidence of the extent of reef features. The available data consisted of the following:-
1. Geotiff images of the shaded relief derived from multibeam bathymetry from 2003 and 2006: The images provided a broad scale picture of topography and highlighted some of the larger individual rock features. Although no absolute values for depth could be extracted from the data, the heterogeneity of the ground was determined. This was particularly useful for 2003 where no XYZ data were readily available.
2. Geotiff images of the mosaiced backscatter data from 2003 and 2006 at a low resolution: The images gave a general distribution of hard and soft reflectors, but the definition was too low to resolve rocky topographic features with any confidence.
3. Geotiff images of the backscatter data for each track from 2003 at a high resolution: It was possible to discern individual rock features and also texture associated with probable boulder/cobble ground.
4. XYZ data of bathymetry from 2006: It was possible to re-grid the data to provide a bathymetric image to supplement the shaded bathymetric image. The true bathymetric image permitted further analysis.
5. The results of the analysis of the habitat from stills/video. These provided ground truth point observations.
Initially, a purely subjective approach to the analysis of the shaded relief and backscatter images was considered. However, it became apparent that there were issues regarding the variable quality of the images and increasing inconsistency in drawing polygons around ‘features’ that were seen on the images. An alternative approach was adopted that used image classification procedures to automate and systematise analysis. The general approach was to derive raster images of relevant variables from the data provided and classify these using selected ground truth data from the video/stills (supplemented by data that could be confidently extracted from the high quality backscatter tiffs) and supervised classification (modules available in Idrisi(™)). The outputs of classification were related back to the point data from the stills/video analysis and the original shaded relief and backscatter images. There is an element of circularity in this approach, but it was considered more satisfactory than a purely subjective interpretation. The outputs also contained more detail than drawn polygons and represented gradations between ground types more successfully. A further check on the classification was made with reference to the high resolution backscatter geotiffs for 2003. These were visually inspected and sections of track were
Biological date interpretation of the Reef East of Shetland Isles Area of Search
12
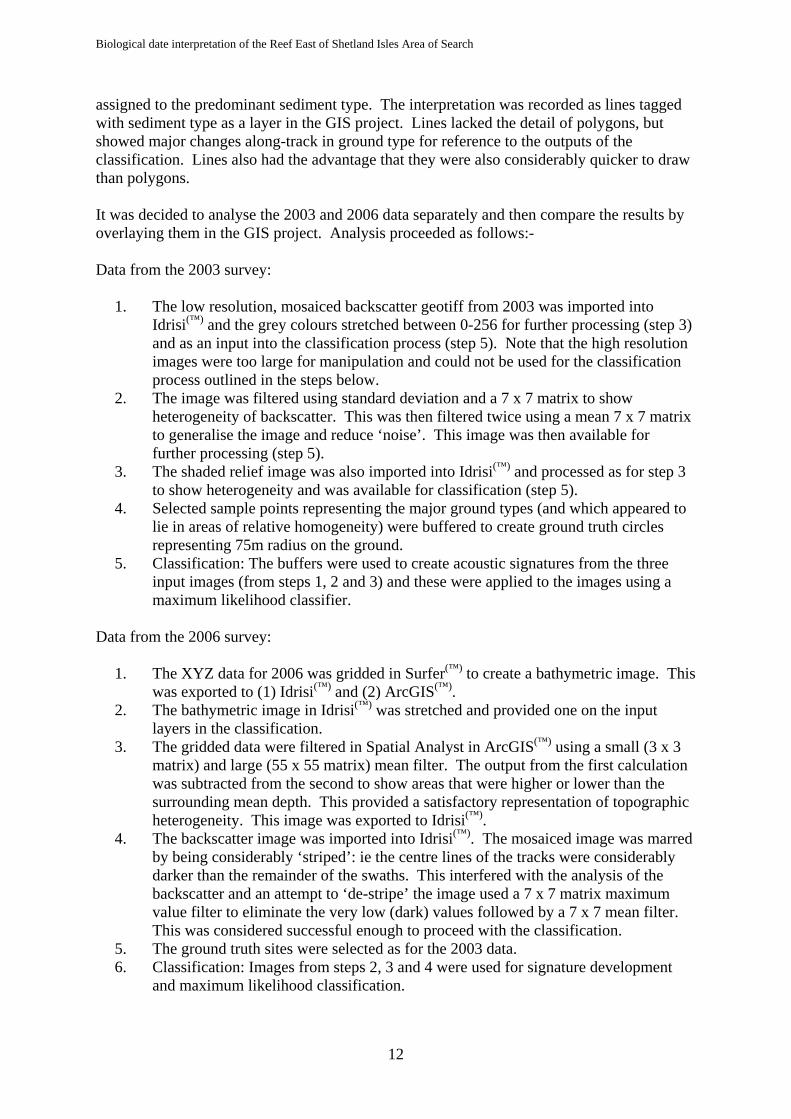
assigned to the predominant sediment type. The interpretation was recorded as lines tagged with sediment type as a layer in the GIS project. Lines lacked the detail of polygons, but showed major changes along-track in ground type for reference to the outputs of the classification. Lines also had the advantage that they were also considerably quicker to draw than polygons. It was decided to analyse the 2003 and 2006 data separately and then compare the results by overlaying them in the GIS project. Analysis proceeded as follows:- Data from the 2003 survey:
1. The low resolution, mosaiced backscatter geotiff from 2003 was imported into Idrisi(™) and the grey colours stretched between 0-256 for further processing (step 3) and as an input into the classification process (step 5). Note that the high resolution images were too large for manipulation and could not be used for the classification process outlined in the steps below.
2. The image was filtered using standard deviation and a 7 x 7 matrix to show heterogeneity of backscatter. This was then filtered twice using a mean 7 x 7 matrix to generalise the image and reduce ‘noise’. This image was then available for further processing (step 5).
3. The shaded relief image was also imported into Idrisi(™) and processed as for step 3 to show heterogeneity and was available for classification (step 5).
4. Selected sample points representing the major ground types (and which appeared to lie in areas of relative homogeneity) were buffered to create ground truth circles representing 75m radius on the ground.
5. Classification: The buffers were used to create acoustic signatures from the three input images (from steps 1, 2 and 3) and these were applied to the images using a maximum likelihood classifier.
Data from the 2006 survey:
1. The XYZ data for 2006 was gridded in Surfer(™) to create a bathymetric image. This was exported to (1) Idrisi(™) and (2) ArcGIS(™).
2. The bathymetric image in Idrisi(™) was stretched and provided one on the input layers in the classification.
3. The gridded data were filtered in Spatial Analyst in ArcGIS(™) using a small (3 x 3 matrix) and large (55 x 55 matrix) mean filter. The output from the first calculation was subtracted from the second to show areas that were higher or lower than the surrounding mean depth. This provided a satisfactory representation of topographic heterogeneity. This image was exported to Idrisi(™).
4. The backscatter image was imported into Idrisi(™). The mosaiced image was marred by being considerably ‘striped’: ie the centre lines of the tracks were considerably darker than the remainder of the swaths. This interfered with the analysis of the backscatter and an attempt to ‘de-stripe’ the image used a 7 x 7 matrix maximum value filter to eliminate the very low (dark) values followed by a 7 x 7 mean filter. This was considered successful enough to proceed with the classification.
5. The ground truth sites were selected as for the 2003 data. 6. Classification: Images from steps 2, 3 and 4 were used for signature development
and maximum likelihood classification.
Biological date interpretation of the Reef East of Shetland Isles Area of Search
13
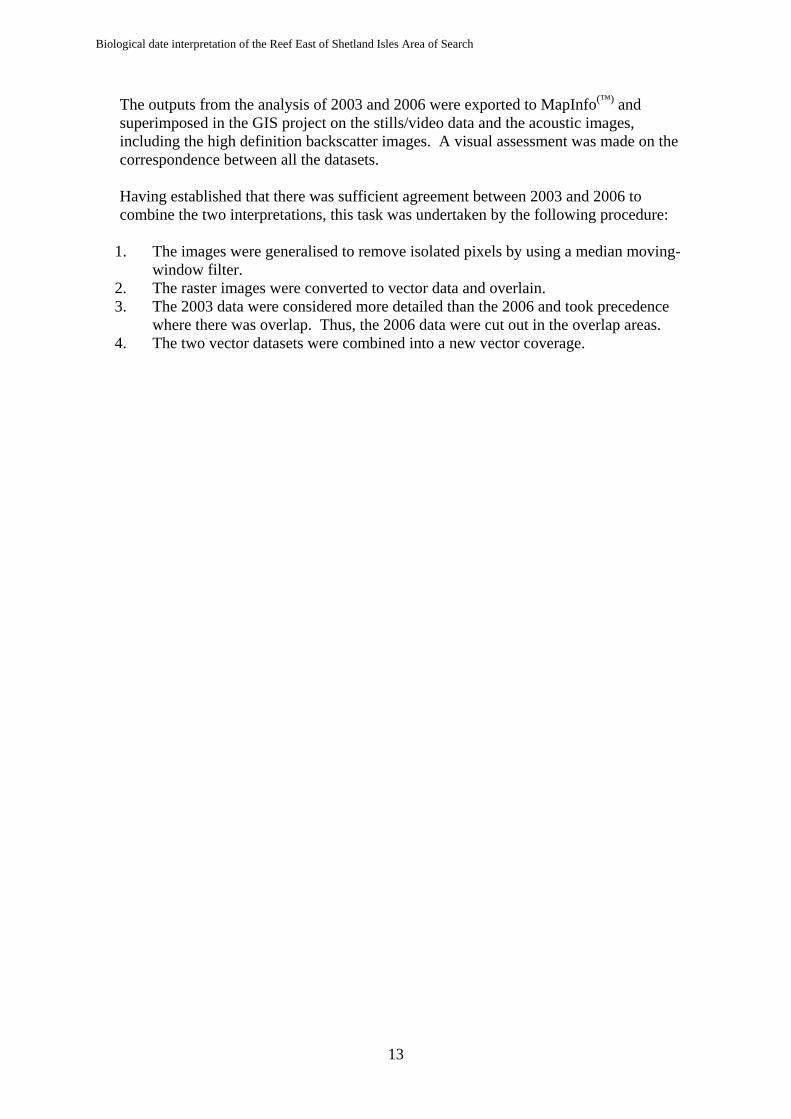
The outputs from the analysis of 2003 and 2006 were exported to MapInfo(™) and superimposed in the GIS project on the stills/video data and the acoustic images, including the high definition backscatter images. A visual assessment was made on the correspondence between all the datasets. Having established that there was sufficient agreement between 2003 and 2006 to combine the two interpretations, this task was undertaken by the following procedure:
1. The images were generalised to remove isolated pixels by using a median moving-window filter.
2. The raster images were converted to vector data and overlain. 3. The 2003 data were considered more detailed than the 2006 and took precedence
where there was overlap. Thus, the 2006 data were cut out in the overlap areas. 4. The two vector datasets were combined into a new vector coverage.
Biological date interpretation of the Reef East of Shetland Isles Area of Search
14
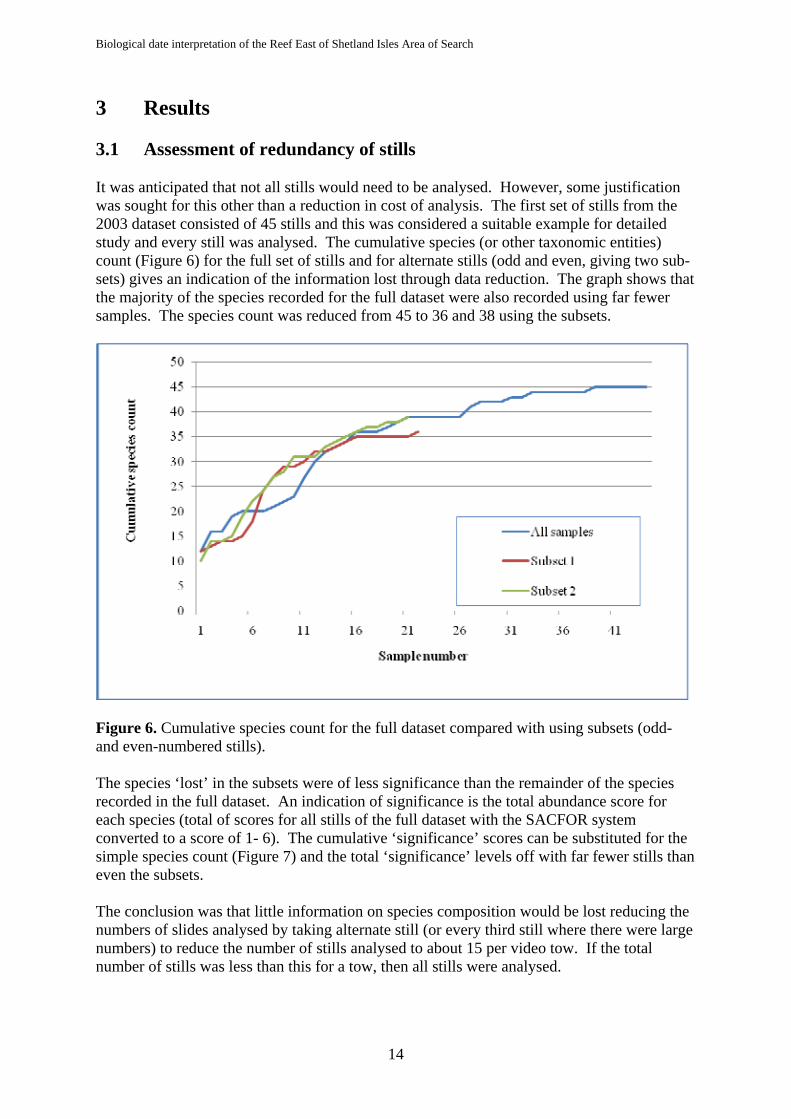
3 Results 3.1 Assessment of redundancy of stills It was anticipated that not all stills would need to be analysed. However, some justification was sought for this other than a reduction in cost of analysis. The first set of stills from the 2003 dataset consisted of 45 stills and this was considered a suitable example for detailed study and every still was analysed. The cumulative species (or other taxonomic entities) count (Figure 6) for the full set of stills and for alternate stills (odd and even, giving two sub-sets) gives an indication of the information lost through data reduction. The graph shows that the majority of the species recorded for the full dataset were also recorded using far fewer samples. The species count was reduced from 45 to 36 and 38 using the subsets.
Figure 6. Cumulative species count for the full dataset compared with using subsets (odd- and even-numbered stills). The species ‘lost’ in the subsets were of less significance than the remainder of the species recorded in the full dataset. An indication of significance is the total abundance score for each species (total of scores for all stills of the full dataset with the SACFOR system converted to a score of 1- 6). The cumulative ‘significance’ scores can be substituted for the simple species count (Figure 7) and the total ‘significance’ levels off with far fewer stills than even the subsets. The conclusion was that little information on species composition would be lost reducing the numbers of slides analysed by taking alternate still (or every third still where there were large numbers) to reduce the number of stills analysed to about 15 per video tow. If the total number of stills was less than this for a tow, then all stills were analysed.

Biological date interpretation of the Reef East of Shetland Isles Area of Search
15
Another issue was the potential loss of habitat information (the range and change of habitat along the transect of the tow). The distances between consecutive slides was computed as far as was possible from the information available and from this information (Tables 2 and 3) it can be seen that the average distance between slides was usually far less than 80m for all stations whether full or selected datasets are considered. It is considered that little information on habitat change would remain unrecorded with the reduction in data.
Figure 7. Cumulative species ‘significance’ (see text for explanation) for the full dataset compared with subsets (odd- and even-numbered stills). There was a wide variation in distance between samples between the two years. In 2003 the position of the ship was recorded for each still and the notional distance ranged from a few metres to 140m (but this might misrepresent the actual distance on the ground) with total tow length ranging from 167m to 1743m. The 2006 data did not have positonal data for the stills for the tows 1-13, but the total tow length ranged from a few metres (ships distance) to 242m (for tows between 1-13) and 1266m for tow 15. Thus, for many of the tows there was, apparently, little movement between consecutive stills. Table 2. Average distances between consecutive stills (full dataset) and selected stills (subset) for the 2003 data. Total lengths of the tows are shown in the right hand column.
Video Average distance between consecutive stills (m)
Redundancy Average distance between selected stills (m)
Total distance (m)
PBV1 41.5 None 83.0 1743.1 PBV2 10.2 Alternate 20.3 284.3 PBV4 9.6 Alternate 19.3 328.0 PBV5 27.1 Alternate 54.1 758.1 PBV6 8.4 Alternate 16.7 167.0 PBV7 25.4 Alternate 50.9 915.8 PBV8 33.1 None 33.1 298.1 PBV9 37.1 None 37.1 445.2

Biological date interpretation of the Reef East of Shetland Isles Area of Search
16
Table 3. Average distances between consecutive stills for the 2006 dataset.
3.2 Stills as a representation of habitat There was the possibility that the stills were taken selectivly by the operator of the camera sledge and might not have been a true representation of the habitat. Since the primary biological data source was to be the stills (because of the problems of identification of species from video as mentioned in section 2.1.2.), a strong bias in habitat in the stills might have implications for the biological description of the habitats based on stills. This concern was prompted by an apparent emphasis on rock substrata over sediments for the stills in at least some of the 2006 stations. In order to gain some reassurance on representivity, a comparison was made between the classified substrata for the video tows and those of the stills that corresponded to the video clips. Tables 4 and 5 show the distribution of the habitat types of the stills (rows) in relation to their corresponding video clip (columns) for 2003 and 2006. Both rows and columns have been ordered from the most rocky (top and left) to the most sandy (bottom and right) so that comparisons are easier to make. Although there was a spread of habitat types amongst the stills for each video clip (which was to be expected), the general correpondence was good. Thus, from the point of view of habitat, the stills could be taken to be reasonably representative of the video clips.
Video Redundancy
used Number of stills
Total distance (m) Average distance between stills (m)
Pobie_C1 None 7 116.8 16.7 Pobie_C2 None 11 43.0 3.4 Pobie_C3 None 7 241.6 34.5 Pobie_C4 None 7 17.2 2.5 Pobie_C5 None 5 11.7 2.3 Pobie_C6 None 7 11.5 1.6 Pobie_C7 None 7 81.8 11.7 Pobie_C8 None 5 84.4 16.9 Pobie_C9 None 7 53.9 7.7 Pobie_C10 None 6 8.3 1.4 Pobie_C11 None 8 21.0 2.6 Pobie_C12 None 9 117.9 13.1 Pobie_C13 None 6 111.9 18.7 Pobie_C14 Two thirds 47 Unknown Unknown Pobie_C15 Two thirds 74 1266.1 17.1

Biological date interpretation of the Reef East of Shetland Isles Area of Search
17
Table 4. Correspondence between habitat classes of the video clips (rows) and the stills (columns) for the data from 2003. Video clip Video
sediment Distribution of stills sediment code
R cR scR csR sR rC C srC sC rS rcS cS SpBV4_a R 2 pBV4_c R 5 1 pBV7_a R 2 1 1 pBV5_c cR 4 2 pBV2_a scR 1 2 1 1 pbv1_c csR 14 3 3 6 4 1 1 1 3pBV5_a csR 2 1 1 pBV7_c csR 3 1 1 1pBV2_c sR 1 1 2 1 pBV2_e sR 1 1 pBV6_a sR 1 1 1pBV6_c sR 1 1 1 1pBV6_d rC 1 1 pbv1_a srC 2 1 1 1pBV4_b srC 1 1 2 1 1pBV8 srC 2 5 1 1 1 pBV4_d sC 1 1 2 pBV6_b rcS 1 1 pbv1_b cS 2pBV7_b cS 1 3 1 4pBV9_a cS 2 4 2pBV9_b cS 1 4pBV2_b S 2pBV2_d S 1pBV5_b S 5

Biological date interpretation of the Reef East of Shetland Isles Area of Search
18
Table 5. Correspondence between habitat classes of the video clips (rows) and the stills (columns) for the data from 2006. Video clip Video
sediment Distribution of stills sediment code
R cR scR csR sR C srC sC rS rcS cS S Pobie_2a R 7 Pobie_1 scR 2 3 1 1 Pobie_C4 csR 5 1 1 Pobie_C6 csR 3 2 2Pobie_C13 csR 1 1 1 3 Pobie_C7 srC 2 1 2 2 Pobie_2b sC 1 1 2 pobie_3a sC 4 2 Pobie_C5 sC 1 4 Pobie_C8 sC 1 1 2 1 Pobie_C9a sC 2 2 pobie_3b cS 1Pobie_C10 cS 6Pobie_C14a cS 1 1 1 4Pobie_C15b cS 4 3Pobie_C9b S 3Pobie_C11 S 8Pobie_C12 S 9Pobie_C14b S 9Pobie_C15a S 13
3.3 Habitat distribution The general distribution of substratum has been plotted for both 2003 and 2006 (Figure 8). The habitats for the sites sampled in 2003 were generally more rocky than those in 2006 where there was a preponderance of cobble and sand. Even rocky sites were far more silt-covered in 2006 than in 2003. The most likely explanation is that the ground to the east of the ridge sampled in 2006 is much less rocky than the ridge itself. This certainly accords with the interpretation of the swath and backscatter images which indicate fewer rocky outcrops to the east of the ridge.

Biological date interpretation of the Reef East of Shetland Isles Area of Search
19
Figure 8. The relative proportion of stills assigned to each habitat type for 2003 and 2006. The greater proportion of sandy classes in 2006 was attributed to the more easterly location of the samples. 3.4 General description of the biota Over 80 entities (species, higher taxa or life forms) were identified from the stills and video. Of these, 33 accounted for 90% of the cumulative abundance (Figure 9).
Figure 9. Cumulative abundance of species ranked by decreasing frequency of occurrence. (The high frequency species to the left end of the x-axis contribute more to the cumulative abundance than the less frequent species on the right).
Biological date interpretation of the Reef East of Shetland Isles Area of Search
20
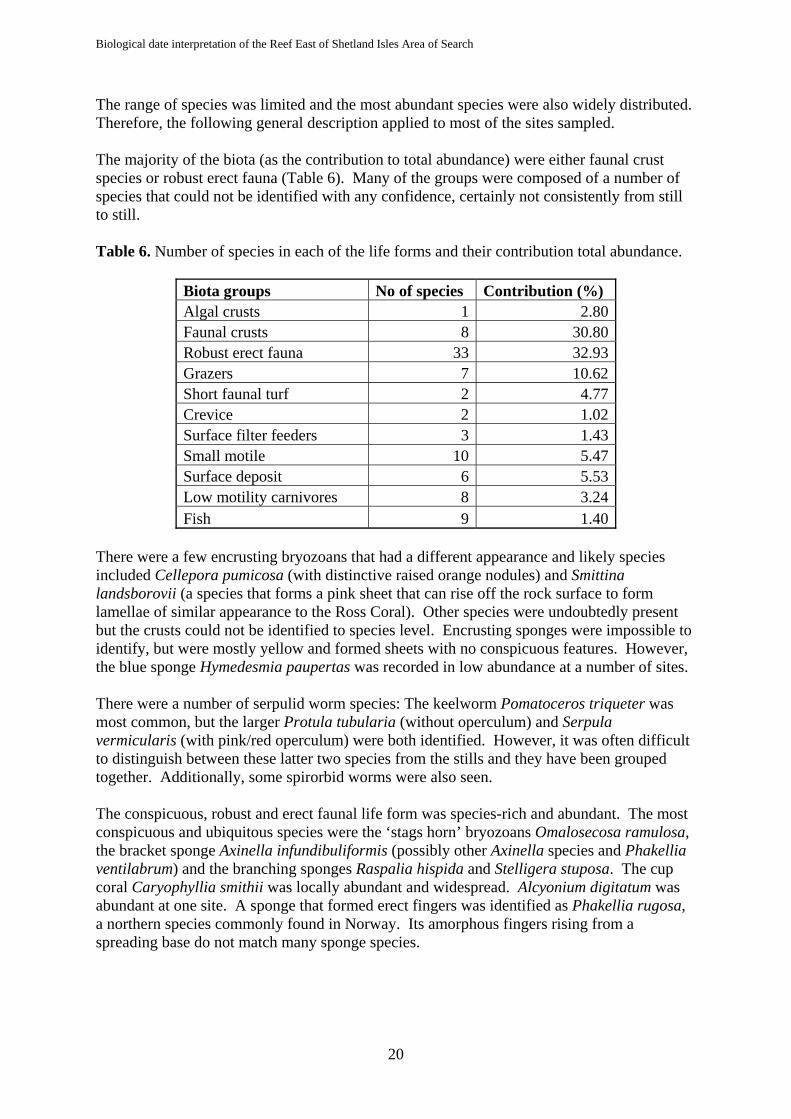
The range of species was limited and the most abundant species were also widely distributed. Therefore, the following general description applied to most of the sites sampled. The majority of the biota (as the contribution to total abundance) were either faunal crust species or robust erect fauna (Table 6). Many of the groups were composed of a number of species that could not be identified with any confidence, certainly not consistently from still to still. Table 6. Number of species in each of the life forms and their contribution total abundance.
Biota groups No of species Contribution (%) Algal crusts 1 2.80 Faunal crusts 8 30.80 Robust erect fauna 33 32.93 Grazers 7 10.62 Short faunal turf 2 4.77 Crevice 2 1.02 Surface filter feeders 3 1.43 Small motile 10 5.47 Surface deposit 6 5.53 Low motility carnivores 8 3.24 Fish 9 1.40
There were a few encrusting bryozoans that had a different appearance and likely species included Cellepora pumicosa (with distinctive raised orange nodules) and Smittina landsborovii (a species that forms a pink sheet that can rise off the rock surface to form lamellae of similar appearance to the Ross Coral). Other species were undoubtedly present but the crusts could not be identified to species level. Encrusting sponges were impossible to identify, but were mostly yellow and formed sheets with no conspicuous features. However, the blue sponge Hymedesmia paupertas was recorded in low abundance at a number of sites. There were a number of serpulid worm species: The keelworm Pomatoceros triqueter was most common, but the larger Protula tubularia (without operculum) and Serpula vermicularis (with pink/red operculum) were both identified. However, it was often difficult to distinguish between these latter two species from the stills and they have been grouped together. Additionally, some spirorbid worms were also seen. The conspicuous, robust and erect faunal life form was species-rich and abundant. The most conspicuous and ubiquitous species were the ‘stags horn’ bryozoans Omalosecosa ramulosa, the bracket sponge Axinella infundibuliformis (possibly other Axinella species and Phakellia ventilabrum) and the branching sponges Raspalia hispida and Stelligera stuposa. The cup coral Caryophyllia smithii was locally abundant and widespread. Alcyonium digitatum was abundant at one site. A sponge that formed erect fingers was identified as Phakellia rugosa, a northern species commonly found in Norway. Its amorphous fingers rising from a spreading base do not match many sponge species.

Biological date interpretation of the Reef East of Shetland Isles Area of Search
21
Hydroids and bryozoans formed a turf of which Abietenaria abietina was a conspicuous member. Other species occurred singly or in more isolated groups, such as Securiflustra securifrons, Diphasia alata, Nemertesia ramosa and Thujiaria thuja. Smaller erect species were more difficult to identify. The bryozoan Reteporella beaniana was distinctive and frequently observed. Other branching bryozoa were less confidently identified, but possibly included a species of Horneridae, Caberea sp. (ellisii?), Porella compressa and Cellaria sp. Some other species, also tentatively identified, would form interesting records if confirmed. These included the small sponge Quasillina brevis (that forms vase-shapes often invaginated at the distil end) found in the Scottish Biodiversity List (http://www.biodiversityscotland.gov.uk/sbl_detail.php) and the unusual colonial anthozoan Parazoanthus (anguicomis?). Grazing species (probably microphagous carnivores or detritivores) were frequent and ubiquitous on rock. The gastropod Calliostoma zizyphinum was regularly seen but in low numbers. Another trochid gastropod, possibly Gibbula tumida (based on size) was also observed, but could not be identified with certainty. A small, limpet-like gastropod identified as the acmaeid Tectura virginea was also seen on scoured rock. Large Echinus esculentus were found rarely, and juveniles were found occasionally. However, this species was never found in numbers sufficient to exert a strong grazing pressure on the rocks. Larger carnivorous echinoderms included the starfish Stichastrella rosea, (rarely Asterias rubens), Solaster endeca and the cushion star Hippasteria phryngiana (rarely Porania pulvillus). The rocks were never heavily pitted or deeply creviced and fissured. Thus, crevice fauna were not abundant although the brittle star Ophiactis balli and the larger Ophiopholis aculetata were frequent at some sites. Small Galathea species (nexa/dispersa?) were frequently seen close to crevices and under cobbles. Munida rugosa was widely distributed throughout the stills and video samples. Other decapods included Ebalia tumefacta, Macropodium sp., unidentified prawns and a clear sighting of the distinctive shrimp Spirontocaris liljeborgi. Although most rocky outcrops were clear of fine sediment on the ridge of Pobie Bank, the rock surveyed to the east in 2006 was more heavily silted. The silt appeared to be consolidated and small tubes were seen. These silty surfaces also supported quite dense populations of Ophiura albida. Fish were rarely seen on the stills, but were commonly seen in the video. Thus, identification was often not certain. The most commonly seen fish were the Norway pout (Trisopterus esmarkii) and the Norway Redfish Sebastes viviparous. Small fish behaving like Sandeels were frequently seen, but the video was not clear enough to confirm their identification with certainty. One sighting of the Twohorn sculpin Icelus bicornis, a species more common in Norway than in British waters, made an interesting record. Small gobies were occasionally seen, but species identification was not possible. Sandy substrata are poorly sampled using video and few species were commonly observed, especially in the coarser sand on the ridge. The siltier sediment supported Ophiura albida and small holes were seen, as were the tests of Spatangus purpureus. The unattached surface living serpulid Ditrupa areatina, with their distinctive curved shells similar to the elephant’s

Biological date interpretation of the Reef East of Shetland Isles Area of Search
22
tusk shell, was seen occasionally on a number of stills and formed very dense aggregations at some sites. This is an unusual species that does not appear in any of the existing EUNIS biotope classes. 3.5 Assessment of habitat-community relationship correlations from
video and stills data. Although the impression from viewing the stills and video was that all the rocky habitats supported similar communities, multivariate analyses were undertaken to explore significant variation between the samples. Analyses were performed on (a) the average abundances for stills within video clips and (b) the complete table of all the selected stills. In both cases the purely sandy habitats were removed from the datasets to focus the analysis on the rocky habitats. 3.5.1 Video clips The initial cluster analysis identified a number of ‘groups’ with only one record. These were mostly sand habitats and the analysis was re-run excluding these predominantly sandy habitats (rcS, cS and S). The cluster analysis identified 3 groups amongst the rocky habitats that were significantly different at the 5% level and most records belonged to the same group. More groups could be defined within the large cluster by increasing the significance level to 10%. Although this might not be good practise statistically, the subdivision did reveal trends in the biota that related to environmental and other factors that were revealed in the MDS plots (Figure 10). Thus, these sub-groups have been retained for the purposes of biotope description.
Group average
pBV
4_c
pBV
4_a
pBV
4_d
Pob
ie_C
13
pBV
2_e
pBV
7_a
pBV
7_c
pBV
2_c
pBV
2_a
pBV
5_c
pBV
5_a
pBV
6_c
pBV
4_b
pBV
6_a
pBV
6_d
Pob
ie_1
Pob
ie_C
5
Pob
ie_C
8
pBV
8
Pob
ie_C
6
Pob
ie_C
7
pbv1
_c
pbv1
_a
Pob
ie_C
4?
Pob
ie_3
a?
Pob
ie_C
9a
Pob
ie_2
a
Pob
ie_2
b100
80
60
40
20
Sim
ilarit
y
Resemblance: S17 Bray Curtis similarity
Figure 10. The dendrogram from the CLUSTER routine showing groups ‘bcd’, ‘a’ and ‘e’ (significant at 5%) and sub-groups ‘b’, ‘c’ and ‘d’ that have a lower significance as discussed in the text.
a b c d e
Biological date interpretation of the Reef East of Shetland Isles Area of Search
23
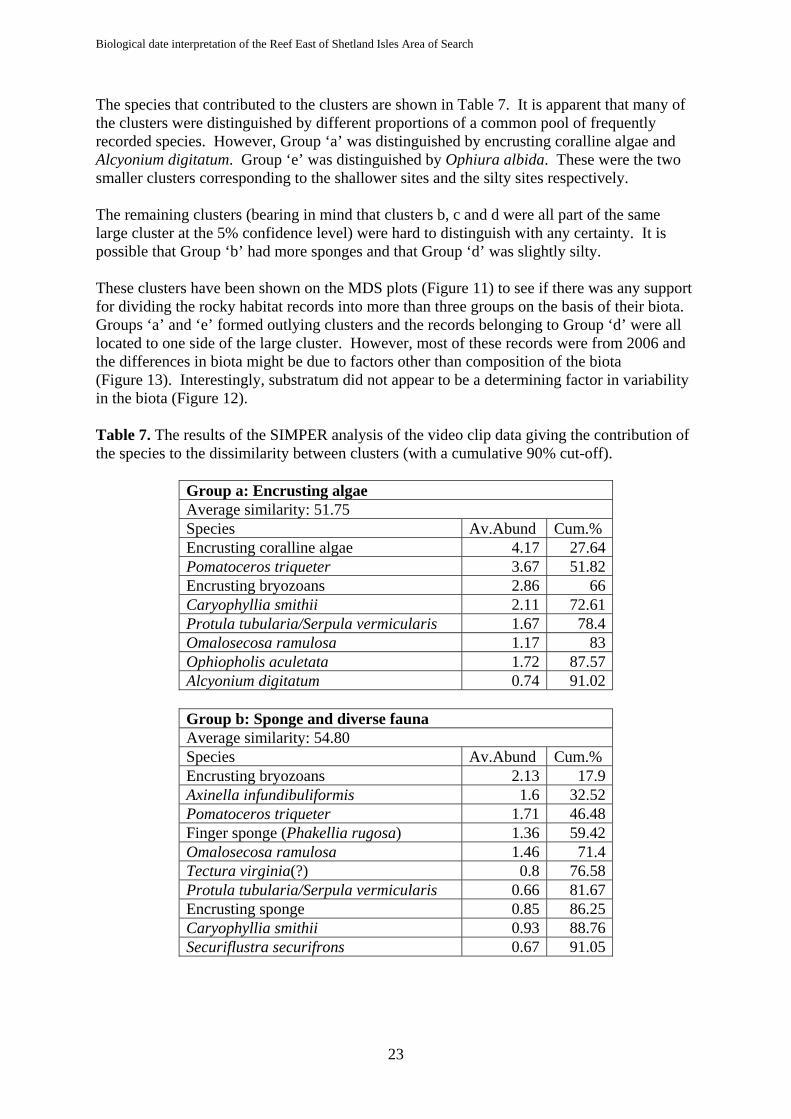
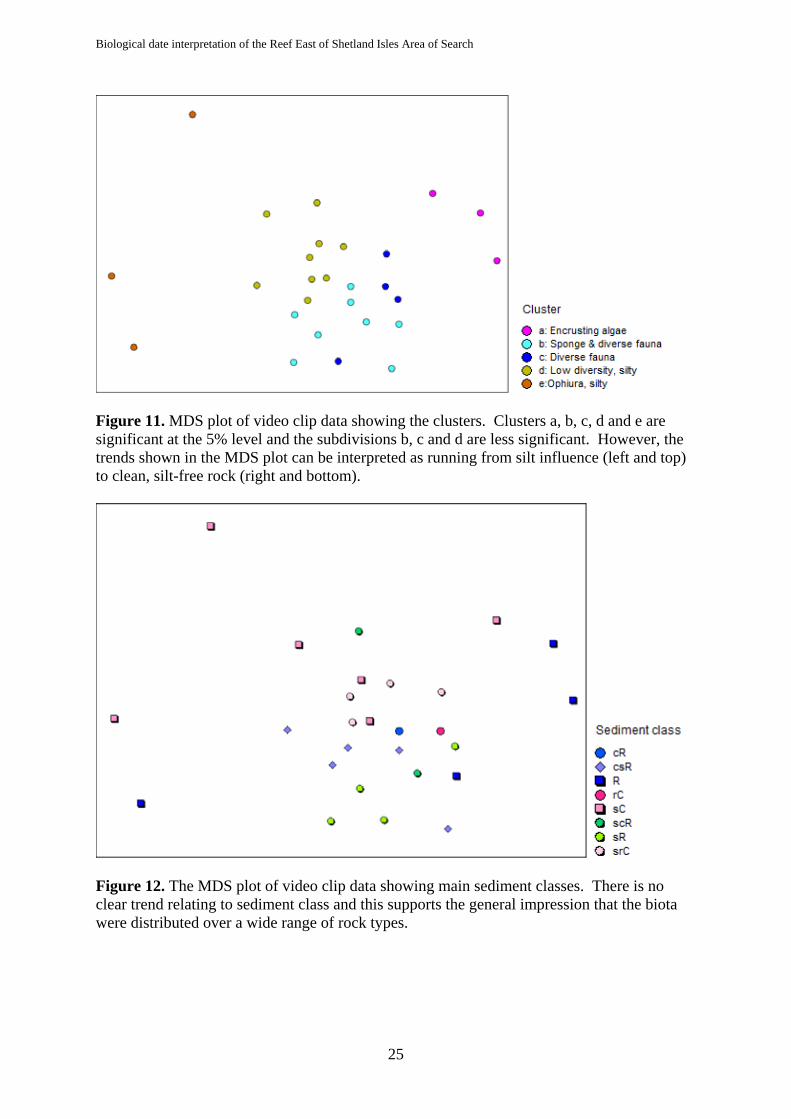
The species that contributed to the clusters are shown in Table 7. It is apparent that many of the clusters were distinguished by different proportions of a common pool of frequently recorded species. However, Group ‘a’ was distinguished by encrusting coralline algae and Alcyonium digitatum. Group ‘e’ was distinguished by Ophiura albida. These were the two smaller clusters corresponding to the shallower sites and the silty sites respectively. The remaining clusters (bearing in mind that clusters b, c and d were all part of the same large cluster at the 5% confidence level) were hard to distinguish with any certainty. It is possible that Group ‘b’ had more sponges and that Group ‘d’ was slightly silty. These clusters have been shown on the MDS plots (Figure 11) to see if there was any support for dividing the rocky habitat records into more than three groups on the basis of their biota. Groups ‘a’ and ‘e’ formed outlying clusters and the records belonging to Group ‘d’ were all located to one side of the large cluster. However, most of these records were from 2006 and the differences in biota might be due to factors other than composition of the biota (Figure 13). Interestingly, substratum did not appear to be a determining factor in variability in the biota (Figure 12). Table 7. The results of the SIMPER analysis of the video clip data giving the contribution of the species to the dissimilarity between clusters (with a cumulative 90% cut-off).
Group a: Encrusting algae Average similarity: 51.75 Species Av.Abund Cum.% Encrusting coralline algae 4.17 27.64 Pomatoceros triqueter 3.67 51.82 Encrusting bryozoans 2.86 66 Caryophyllia smithii 2.11 72.61 Protula tubularia/Serpula vermicularis 1.67 78.4 Omalosecosa ramulosa 1.17 83 Ophiopholis aculetata 1.72 87.57 Alcyonium digitatum 0.74 91.02
Group b: Sponge and diverse fauna Average similarity: 54.80 Species Av.Abund Cum.% Encrusting bryozoans 2.13 17.9 Axinella infundibuliformis 1.6 32.52 Pomatoceros triqueter 1.71 46.48 Finger sponge (Phakellia rugosa) 1.36 59.42 Omalosecosa ramulosa 1.46 71.4 Tectura virginia(?) 0.8 76.58 Protula tubularia/Serpula vermicularis 0.66 81.67 Encrusting sponge 0.85 86.25 Caryophyllia smithii 0.93 88.76 Securiflustra securifrons 0.67 91.05

Biological date interpretation of the Reef East of Shetland Isles Area of Search
24
Table 7. (continued)
Group c: Diverse fauna Average similarity: 56.44 Species Av.Abund Cum.% Encrusting bryozoans 2.13 23.38 Pomatoceros triqueter 1.48 39.88 Omalosecosa ramulosa 1.43 52.47 Encrusting sponge 1.01 61.17 Caryophyllia smithii 1 69.39 Short hydroid turf 0.91 76.63 Tectura virginia(?) 0.7 81.23 Galathea sp. (nexa/dispersa?) 0.54 84.6 Protula tubularia/Serpula vermicularis 0.36 86.44 Axinella infundibuliformis 0.3 88.04 Horneridae 0.19 89.42
Group d: Low diversity, silty Average similarity: 56.16 Species Av.Abund Cum.% Pomatoceros triqueter 1.9 19.53 Encrusting bryozoans 1.96 37.9 Tectura virginia(?) 1.73 54.13 Caryophyllia smithii 1.27 65.42 Axinella infundibuliformis 1.08 75.44 Omalosecosa ramulosa 0.83 83.07 Munida rugosa 0.69 87.15 Small gastropod (ovate) 0.65 90.45
Group e: Ophiura, silty Average similarity: 34.11 Species Av.Abund Cum.% Ophiura albida 2.77 28.57 Omalosecosa ramulosa 1.05 50.13 Short hydroid turf 0.6 62.29 Paguridae 0.38 69.71 Reteporella beaniana 0.46 77.13 Horneridae 0.36 83.42 Quasillina brevis(?) 0.83 86.85 Pomatoceros triqueter 0.43 89.02 Encrusting bryozoans 0.26 90.97
Biological date interpretation of the Reef East of Shetland Isles Area of Search
25
Figure 11. MDS plot of video clip data showing the clusters. Clusters a, b, c, d and e are significant at the 5% level and the subdivisions b, c and d are less significant. However, the trends shown in the MDS plot can be interpreted as running from silt influence (left and top) to clean, silt-free rock (right and bottom).
Figure 12. The MDS plot of video clip data showing main sediment classes. There is no clear trend relating to sediment class and this supports the general impression that the biota were distributed over a wide range of rock types.

Biological date interpretation of the Reef East of Shetland Isles Area of Search
26
Figure 13. The MDS plot of video clip data showing survey year. There is a clear separation related to survey. This could be due to temporal changes and differences in sampling strategy. However, the 2006 sites were generally more silty than 2003 and the plot accords with the trend in siltiness. 3.5.2 Stills A similar approach to the analysis of the stills without grouping into video clips produced far less significant results. With the sandy habitats excluded, CLUSTER the SIMPROF test resulted in one major group and a small number of groups with few records. Lowering the significance level threshold to 10% made little difference. The equivalent MDS plots were also hard to interpret: The points clustered around the ‘centre’ of the plot with a few outliers (Figure 14). However, there was a trend in the biota that was similar to the trend seen in the video clip data: the silty communities (with Ophiura albida and sponge/silt) were distinct from the general rocky habitats (significant at the 5% level) and more weakly defined coralline algal community. There were no obvious patterns when the points of the MDS plots showed substratum (Figure 15). It is presumed that the variability between stills explains the slightly better and more consistent differentiation of the communities using the average abundance values. This supports the strategy of using the video clips as the basis for habitat description and biotope assignment.

Biological date interpretation of the Reef East of Shetland Isles Area of Search
27
Figure 14. MDS plot of stills data showing the clusters. Clusters a, b and c are significant at the 5% level and cluster d was less significant.
Figure 15. The MDS plot of stills data showing main sediment classes. There is no clear trend relating to sediment class and this supports the general impression that the biota were distributed over a wide range of rock types.
Biological date interpretation of the Reef East of Shetland Isles Area of Search
28
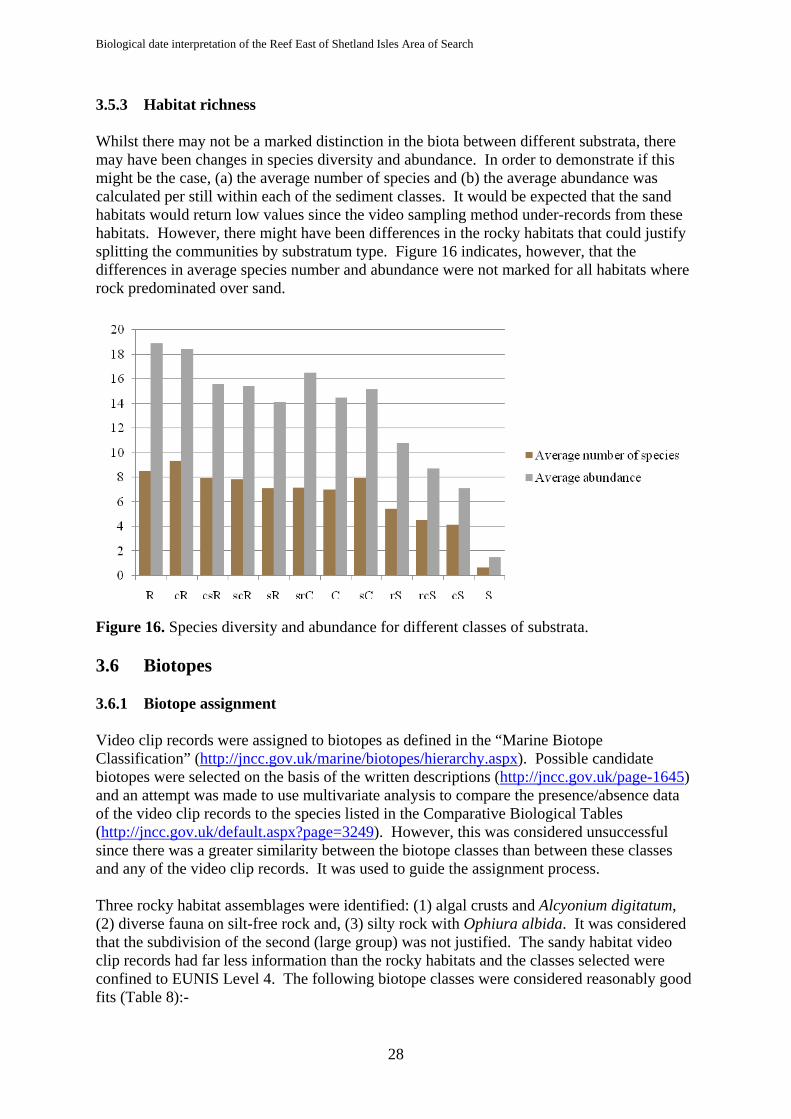
3.5.3 Habitat richness Whilst there may not be a marked distinction in the biota between different substrata, there may have been changes in species diversity and abundance. In order to demonstrate if this might be the case, (a) the average number of species and (b) the average abundance was calculated per still within each of the sediment classes. It would be expected that the sand habitats would return low values since the video sampling method under-records from these habitats. However, there might have been differences in the rocky habitats that could justify splitting the communities by substratum type. Figure 16 indicates, however, that the differences in average species number and abundance were not marked for all habitats where rock predominated over sand.
Figure 16. Species diversity and abundance for different classes of substrata. 3.6 Biotopes 3.6.1 Biotope assignment Video clip records were assigned to biotopes as defined in the “Marine Biotope Classification” (http://jncc.gov.uk/marine/biotopes/hierarchy.aspx). Possible candidate biotopes were selected on the basis of the written descriptions (http://jncc.gov.uk/page-1645) and an attempt was made to use multivariate analysis to compare the presence/absence data of the video clip records to the species listed in the Comparative Biological Tables (http://jncc.gov.uk/default.aspx?page=3249). However, this was considered unsuccessful since there was a greater similarity between the biotope classes than between these classes and any of the video clip records. It was used to guide the assignment process. Three rocky habitat assemblages were identified: (1) algal crusts and Alcyonium digitatum, (2) diverse fauna on silt-free rock and, (3) silty rock with Ophiura albida. It was considered that the subdivision of the second (large group) was not justified. The sandy habitat video clip records had far less information than the rocky habitats and the classes selected were confined to EUNIS Level 4. The following biotope classes were considered reasonably good fits (Table 8):-
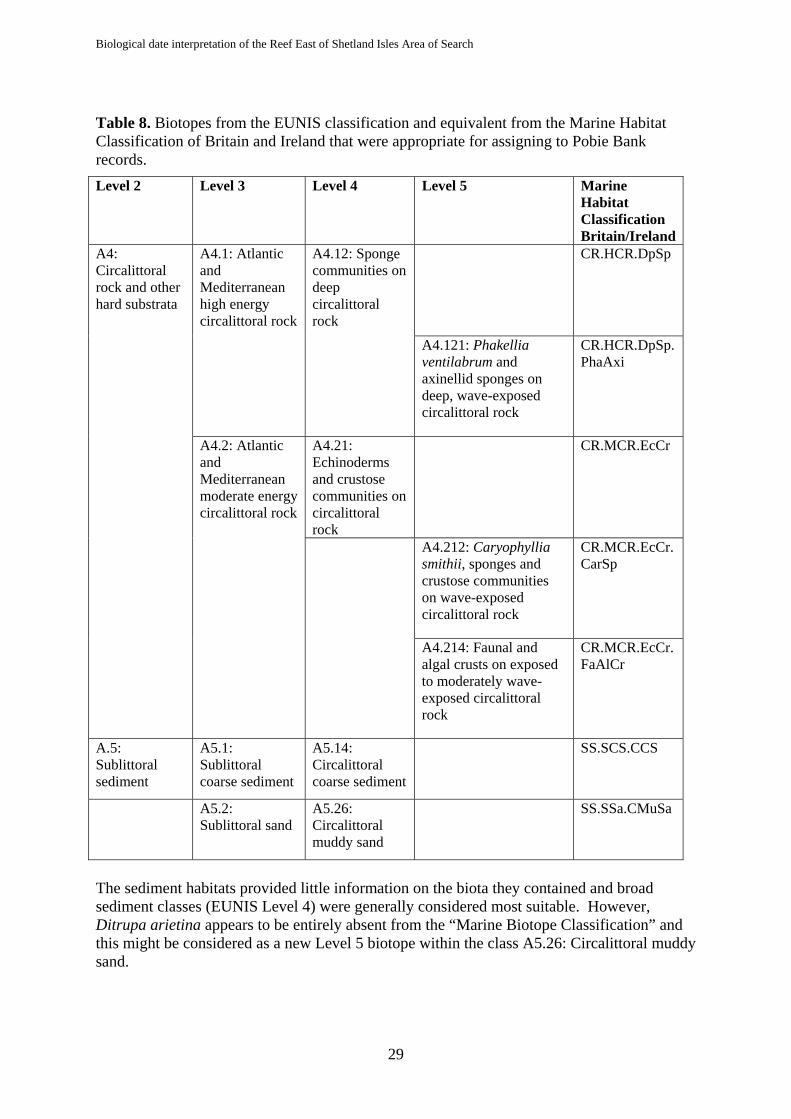
Biological date interpretation of the Reef East of Shetland Isles Area of Search
29
Table 8. Biotopes from the EUNIS classification and equivalent from the Marine Habitat Classification of Britain and Ireland that were appropriate for assigning to Pobie Bank records.
The sediment habitats provided little information on the biota they contained and broad sediment classes (EUNIS Level 4) were generally considered most suitable. However, Ditrupa arietina appears to be entirely absent from the “Marine Biotope Classification” and this might be considered as a new Level 5 biotope within the class A5.26: Circalittoral muddy sand.
Level 2 Level 3 Level 4 Level 5 Marine Habitat Classification Britain/Ireland
A4: Circalittoral rock and other hard substrata
A4.1: Atlantic and Mediterranean high energy circalittoral rock
A4.12: Sponge communities on deep circalittoral rock
CR.HCR.DpSp
A4.121: Phakellia ventilabrum and axinellid sponges on deep, wave-exposed circalittoral rock
CR.HCR.DpSp. PhaAxi
A4.2: Atlantic and Mediterranean moderate energy circalittoral rock
A4.21: Echinoderms and crustose communities on circalittoral rock
CR.MCR.EcCr
A4.212: Caryophyllia smithii, sponges and crustose communities on wave-exposed circalittoral rock
CR.MCR.EcCr. CarSp
A4.214: Faunal and algal crusts on exposed to moderately wave-exposed circalittoral rock
CR.MCR.EcCr. FaAlCr
A.5: Sublittoral sediment
A5.1: Sublittoral coarse sediment
A5.14: Circalittoral coarse sediment
SS.SCS.CCS
A5.2: Sublittoral sand
A5.26: Circalittoral muddy sand
SS.SSa.CMuSa
Biological date interpretation of the Reef East of Shetland Isles Area of Search
30
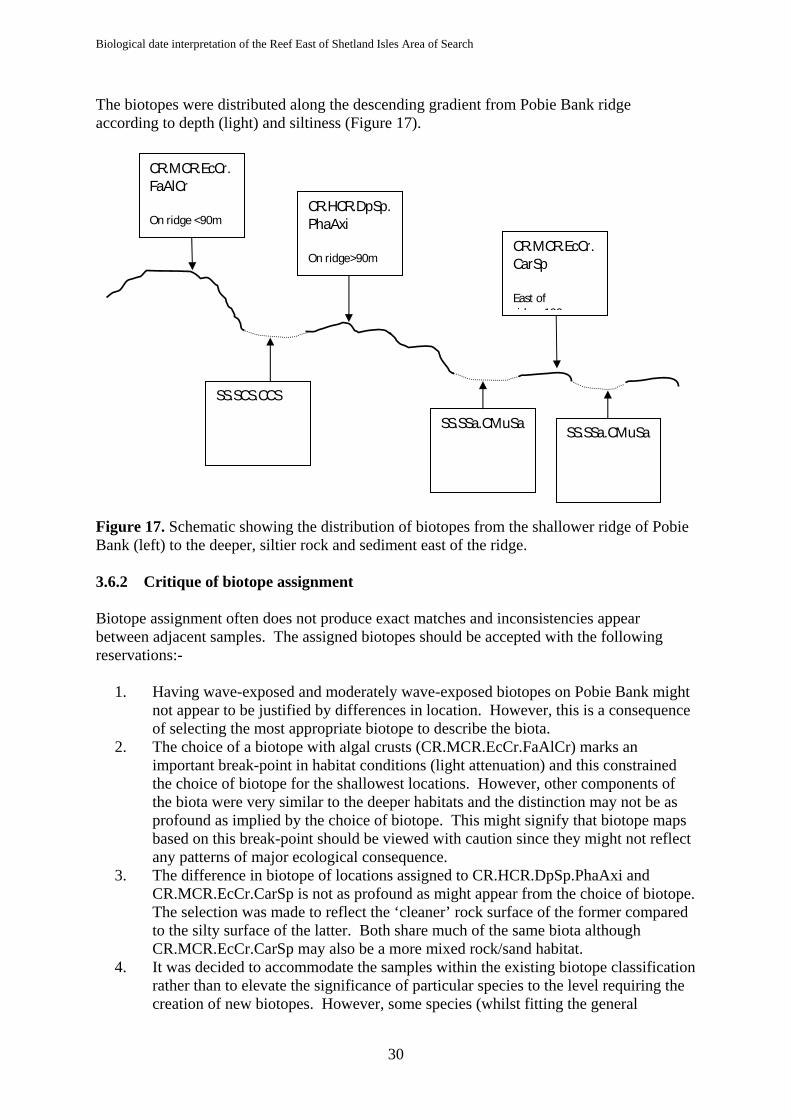
The biotopes were distributed along the descending gradient from Pobie Bank ridge according to depth (light) and siltiness (Figure 17). Figure 17. Schematic showing the distribution of biotopes from the shallower ridge of Pobie Bank (left) to the deeper, siltier rock and sediment east of the ridge. 3.6.2 Critique of biotope assignment Biotope assignment often does not produce exact matches and inconsistencies appear between adjacent samples. The assigned biotopes should be accepted with the following reservations:-
1. Having wave-exposed and moderately wave-exposed biotopes on Pobie Bank might not appear to be justified by differences in location. However, this is a consequence of selecting the most appropriate biotope to describe the biota.
2. The choice of a biotope with algal crusts (CR.MCR.EcCr.FaAlCr) marks an important break-point in habitat conditions (light attenuation) and this constrained the choice of biotope for the shallowest locations. However, other components of the biota were very similar to the deeper habitats and the distinction may not be as profound as implied by the choice of biotope. This might signify that biotope maps based on this break-point should be viewed with caution since they might not reflect any patterns of major ecological consequence.
3. The difference in biotope of locations assigned to CR.HCR.DpSp.PhaAxi and CR.MCR.EcCr.CarSp is not as profound as might appear from the choice of biotope. The selection was made to reflect the ‘cleaner’ rock surface of the former compared to the silty surface of the latter. Both share much of the same biota although CR.MCR.EcCr.CarSp may also be a more mixed rock/sand habitat.
4. It was decided to accommodate the samples within the existing biotope classification rather than to elevate the significance of particular species to the level requiring the creation of new biotopes. However, some species (whilst fitting the general
CR.MCR.EcCr. FaAlCr On ridge <90m
CR.HCR.DpSp. PhaAxi On ridge>90m
CR.MCR.EcCr. CarSp East of id 100
SS.SCS.CCS
SS.SSa.CMuSa
SS.SSa.CMuSa
Biological date interpretation of the Reef East of Shetland Isles Area of Search
31
description of sponge or bryozoans of the biotope classification) were unusual and reflected the northern location of Pobie Bank. Thus, this distinctiveness should be emphasised in any comparison of Pobie Bank with other rocky reef habitats.
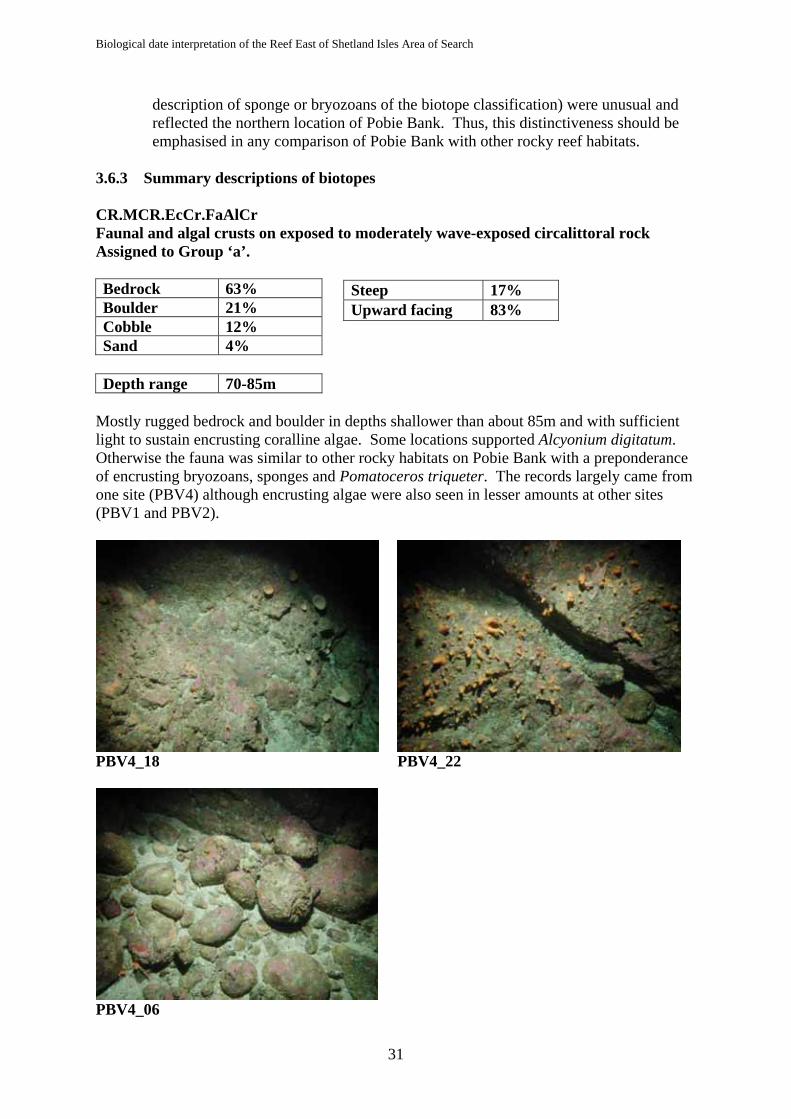
3.6.3 Summary descriptions of biotopes CR.MCR.EcCr.FaAlCr Faunal and algal crusts on exposed to moderately wave-exposed circalittoral rock Assigned to Group ‘a’. Bedrock 63% Boulder 21% Cobble 12% Sand 4%
Depth range 70-85m
Mostly rugged bedrock and boulder in depths shallower than about 85m and with sufficient light to sustain encrusting coralline algae. Some locations supported Alcyonium digitatum. Otherwise the fauna was similar to other rocky habitats on Pobie Bank with a preponderance of encrusting bryozoans, sponges and Pomatoceros triqueter. The records largely came from one site (PBV4) although encrusting algae were also seen in lesser amounts at other sites (PBV1 and PBV2).
PBV4_18 PBV4_22
PBV4_06
Steep 17% Upward facing 83%
Biological date interpretation of the Reef East of Shetland Isles Area of Search
32
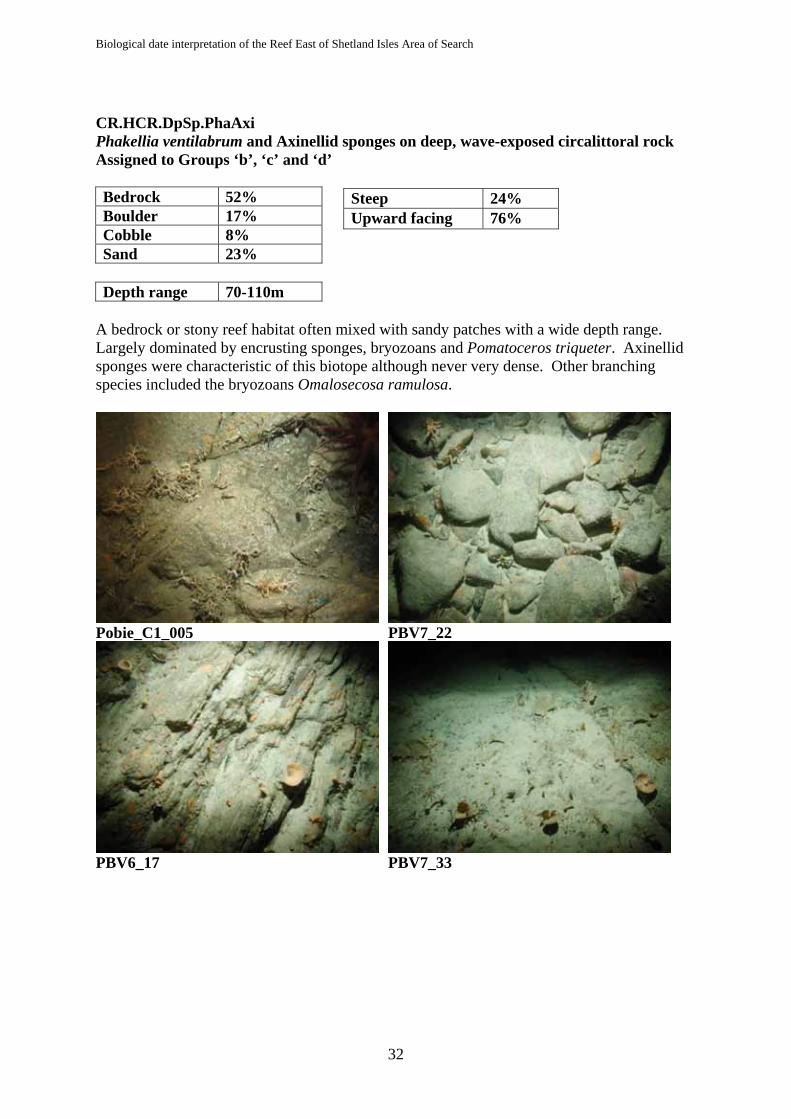
CR.HCR.DpSp.PhaAxi Phakellia ventilabrum and Axinellid sponges on deep, wave-exposed circalittoral rock Assigned to Groups ‘b’, ‘c’ and ‘d’ Bedrock 52% Boulder 17% Cobble 8% Sand 23%
Depth range 70-110m
A bedrock or stony reef habitat often mixed with sandy patches with a wide depth range. Largely dominated by encrusting sponges, bryozoans and Pomatoceros triqueter. Axinellid sponges were characteristic of this biotope although never very dense. Other branching species included the bryozoans Omalosecosa ramulosa.
Pobie_C1_005 PBV7_22
PBV6_17 PBV7_33
Steep 24% Upward facing 76%
Biological date interpretation of the Reef East of Shetland Isles Area of Search
33
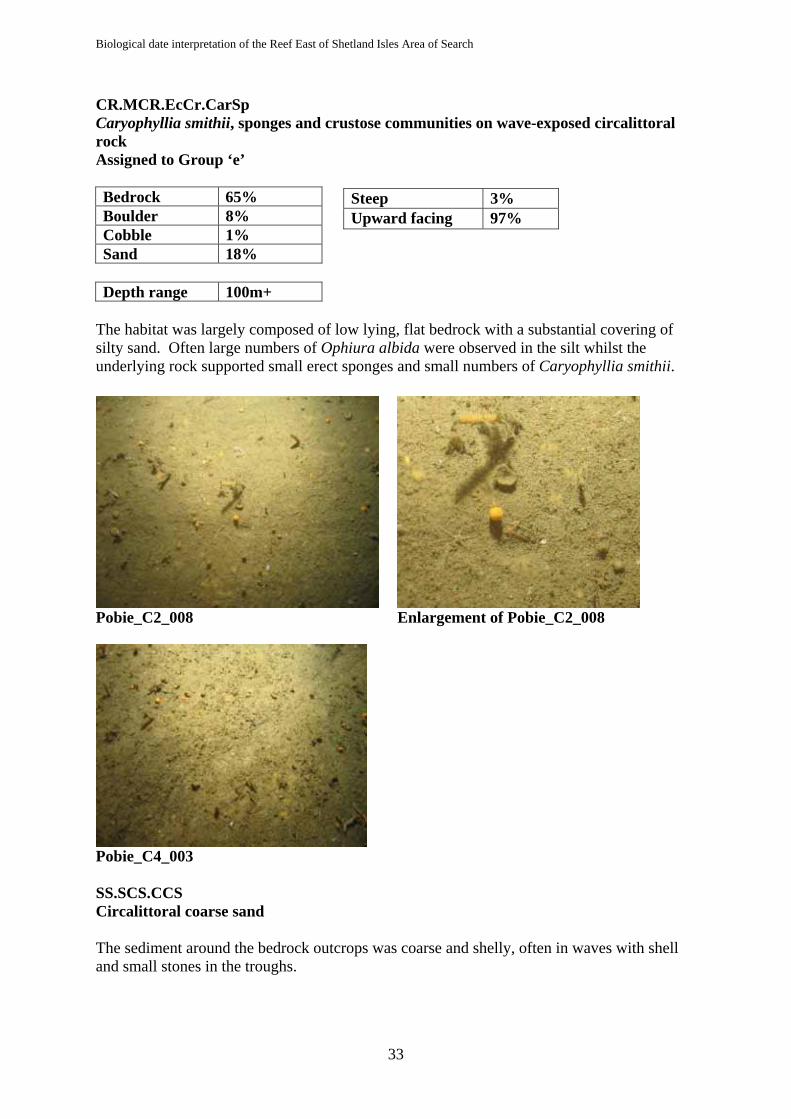
CR.MCR.EcCr.CarSp Caryophyllia smithii, sponges and crustose communities on wave-exposed circalittoral rock Assigned to Group ‘e’ Bedrock 65% Boulder 8% Cobble 1% Sand 18%
Depth range 100m+
The habitat was largely composed of low lying, flat bedrock with a substantial covering of silty sand. Often large numbers of Ophiura albida were observed in the silt whilst the underlying rock supported small erect sponges and small numbers of Caryophyllia smithii.
Pobie_C2_008 Enlargement of Pobie_C2_008
Pobie_C4_003 SS.SCS.CCS Circalittoral coarse sand The sediment around the bedrock outcrops was coarse and shelly, often in waves with shell and small stones in the troughs.
Steep 3% Upward facing 97%

Biological date interpretation of the Reef East of Shetland Isles Area of Search
34
PBV4_16 PBV7_15 SS.SSa.CMuSa Circalittoral muddy sand Much of the sediment was shelly and silty. Little conspicuous infauna was observed other than a few Chaetopterus variopedatus Slightly coarser shelly muddy sand supported the tube worm Ditrupa areatina and this species achieved very high densities at some locations.
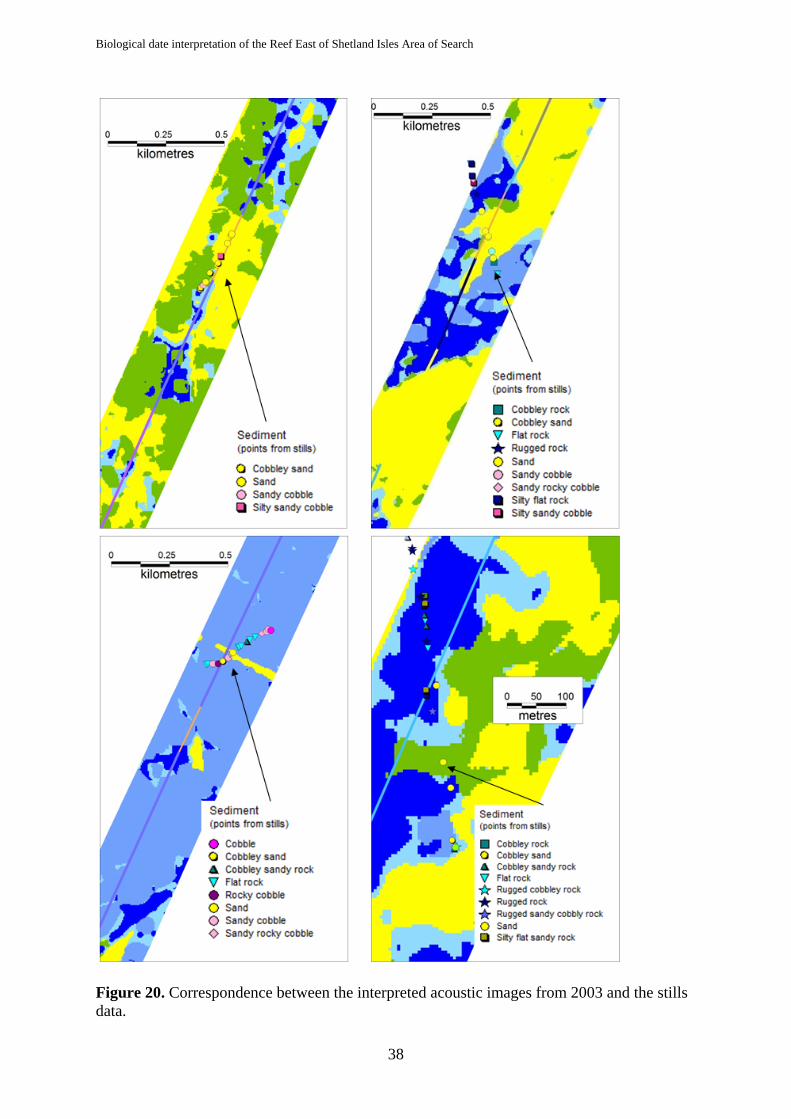
Pobie_C15_038 3.7 Analysis of the acoustic data 3.7.1 Interpretation of substrata The classifications of the 2003 and 2006 data were carried out independently of each other and the two interpretations brought together into a single map. The initial analysis was on raster layers and the raster outputs were converted into polygons and imported into the GIS project in MapInfo(™). The range of sediment classes in the final map was small, but this reflected the level of detail that the interpretation could support. As with all interpretation of remotely sensed data, it must be pointed out that the map is only indicative of the general trends in the distribution of the habitats. Nevertheless, the match between the two interpretations from 2003 and 2006 where there is overlap is very close. The complete coverage is shown in Figure 18. Confidence in the interpretations can be gained by comparing overlapping areas between 2003 and 2006 and some examples of the close correspondence between the interpretations are shown in Figure 19.

Biological date interpretation of the Reef East of Shetland Isles Area of Search
35
Further confidence in the interpretation is gained by overlaying the separate visual interpretation of the high resolution backscatter images from 2003, as shown in Figure 20. The point records from the stills images can also be overlain on the interpreted sediment map and, once again, the match is fairly close. Clearly, accurate location of the samples cannot be assumed (eg many of the positions of the sample points placed them off the acoustic coverage) and precise agreement would not be expected. It is concluded that the substratum interpretation of the acoustic data can be regarded with sufficient confidence to be able to use the sediment map for a general description of the trends across Pobie Bank and for fine scale description of the rocky outcrops.

Biological date interpretation of the Reef East of Shetland Isles Area of Search
36
Figure 18. Classification of the acoustic data from 2003 and 2006 superimposed on bathymetric contours from Digibath250. The dark blue line represents the 100m contour.

Biological date interpretation of the Reef East of Shetland Isles Area of Search
37
Figure 19. Overlap between the interpretation of 2003 data (on top) and 2006 data (underneath) showing good agreement between the two interpretations.
Biological date interpretation of the Reef East of Shetland Isles Area of Search
38
Figure 20. Correspondence between the interpreted acoustic images from 2003 and the stills data.
Biological date interpretation of the Reef East of Shetland Isles Area of Search
39
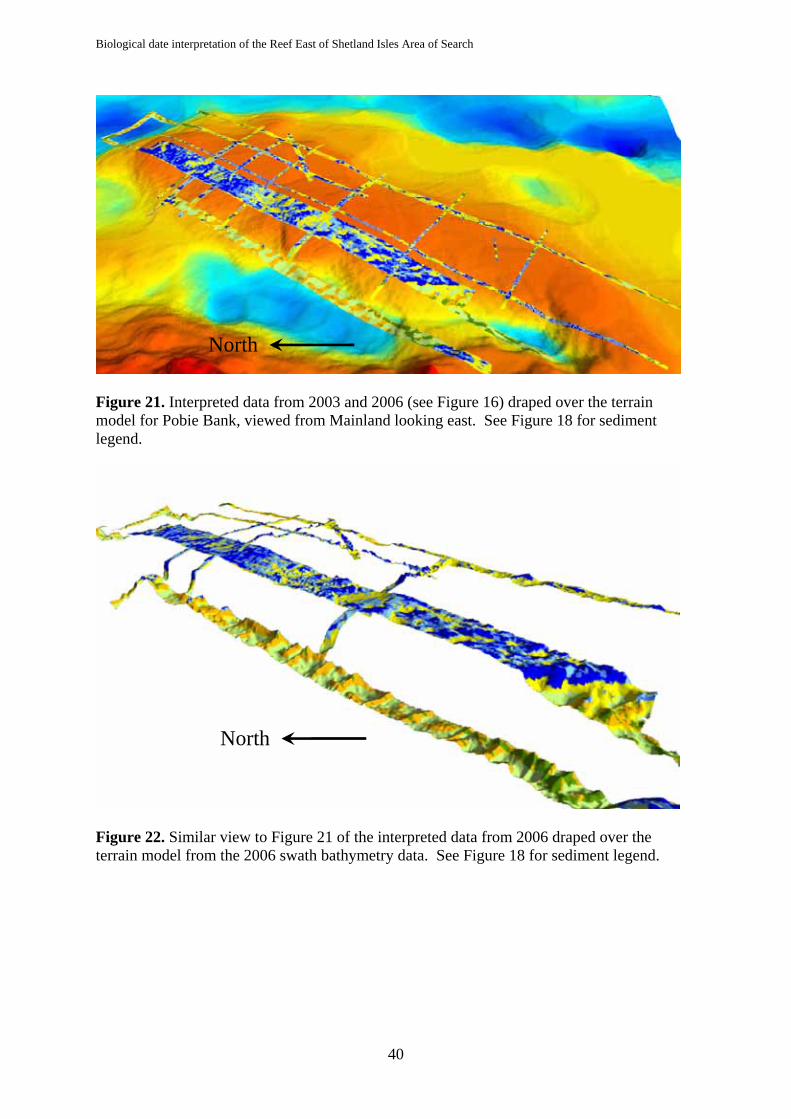
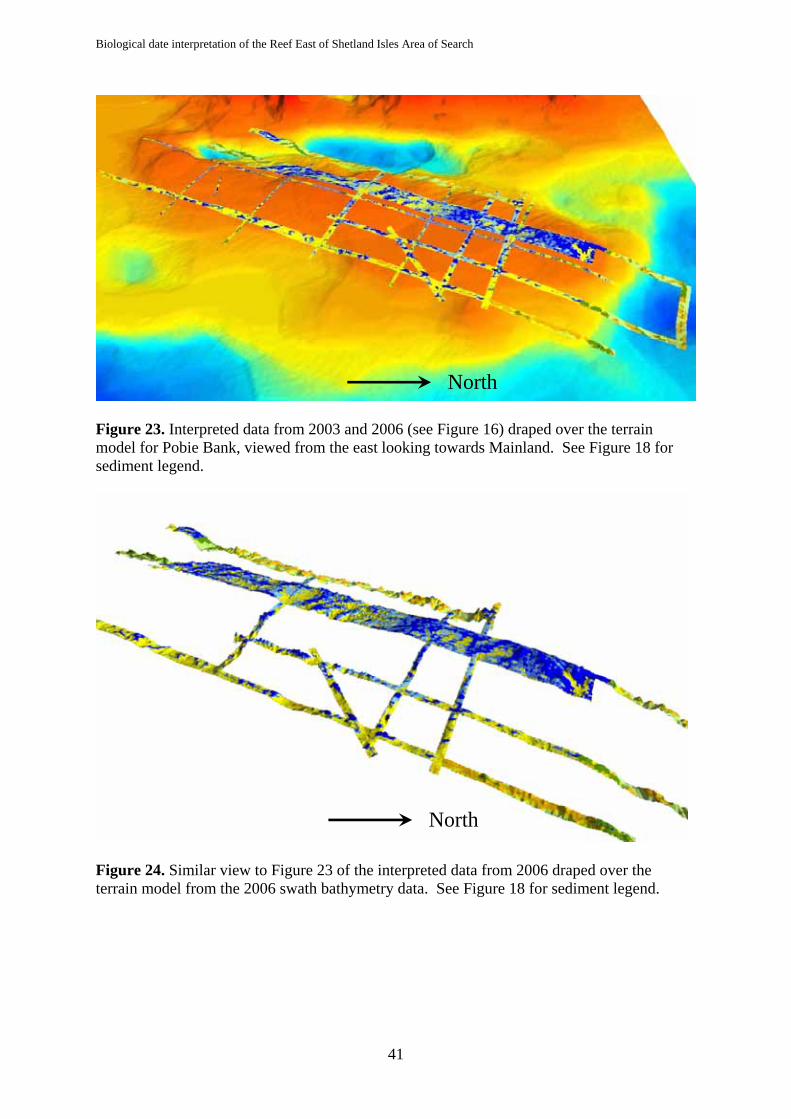
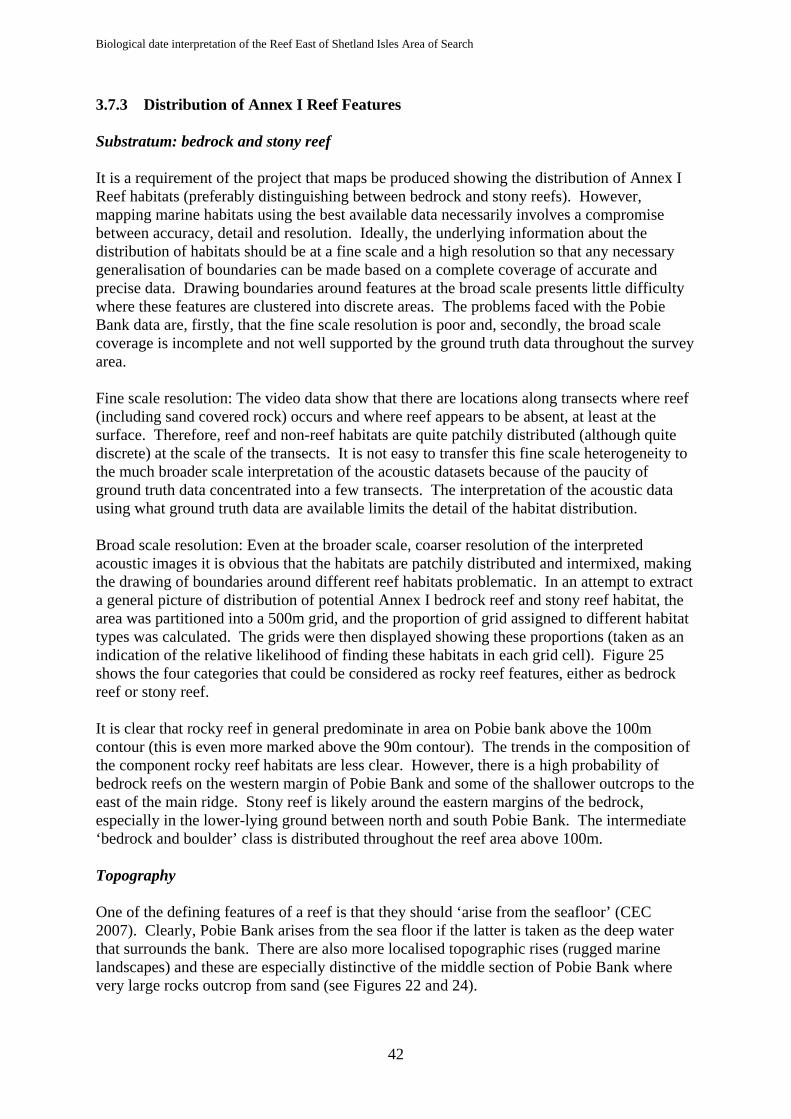
3.7.2 Distribution of substrata and topographic features The incomplete coverage of the interpreted substrata makes it difficult to appreciate the extent of rocky habitats over the whole of Pobie Bank. In particular, the eastward extension of the bank is sparsely covered. Draping the interpreted acoustic map over the terrain model derived from the BGS250 data helps to place the substrata in context (Figures 21 and 23). This shows the bedrock and boulder habitats predominate over the shallower ground on the western side of Pobie Bank and these habitats appear to predominate over the shallow ground to the east to about the 100m contour. Although the terrain model has very low detail, it may be that the more sporadic rocky habitat further east is associated with the shallow ground outliers north east and south east of the main bank, with a depression between these two extensions of the bank. A drape of the model over a more detailed terrain model (such as that derived from the Olex data held by BGS) might shed more light on the association of these sporadic outcrops with topography. The bathymetric data for 2006 data were available for making a high resolution terrain model for that coverage and this is shown (with the 2006 interpreted data draped over) in Figures 22 and 24. They reveal that the ground between the northern and southern blocks of the main Pobie Bank ridge is separated by very rugged rocky sea floor with sand between the outcrops. The plan view maps do not give due emphasis to the rugged nature of the terrain in this section. Although the coverage has resulted in ‘narrow’ strips of detail in the terrain model, it is nevertheless apparent that the rugged ground extends eastward. The detailed terrain model also emphasises the northwest/southeast trend to many of the rocky ridges that run across Pobie Bank and these can often be traced from the broad coverage to the narrow coverage to the east. However, as a generality, the preponderance of bedrock gradually drops from the western edge of Pobie Bank with increasing distance towards the east. This follows the depth profile which rises steeply from the Unst Basin to the ridge and then more gradually to the highest ground before falling gradually eastwards. It would appear that sand predominates as the substratum below 100m on the eastern extension. Although this sand may only be a thin layer over underlying rock, it could reduce the scope for epifaunal growth to a few scattered rocky outcrops.
Biological date interpretation of the Reef East of Shetland Isles Area of Search
40
Figure 21. Interpreted data from 2003 and 2006 (see Figure 16) draped over the terrain model for Pobie Bank, viewed from Mainland looking east. See Figure 18 for sediment legend.
Figure 22. Similar view to Figure 21 of the interpreted data from 2006 draped over the terrain model from the 2006 swath bathymetry data. See Figure 18 for sediment legend.
North
North
Biological date interpretation of the Reef East of Shetland Isles Area of Search
41
Figure 23. Interpreted data from 2003 and 2006 (see Figure 16) draped over the terrain model for Pobie Bank, viewed from the east looking towards Mainland. See Figure 18 for sediment legend.
Figure 24. Similar view to Figure 23 of the interpreted data from 2006 draped over the terrain model from the 2006 swath bathymetry data. See Figure 18 for sediment legend.
North
North
Biological date interpretation of the Reef East of Shetland Isles Area of Search
42
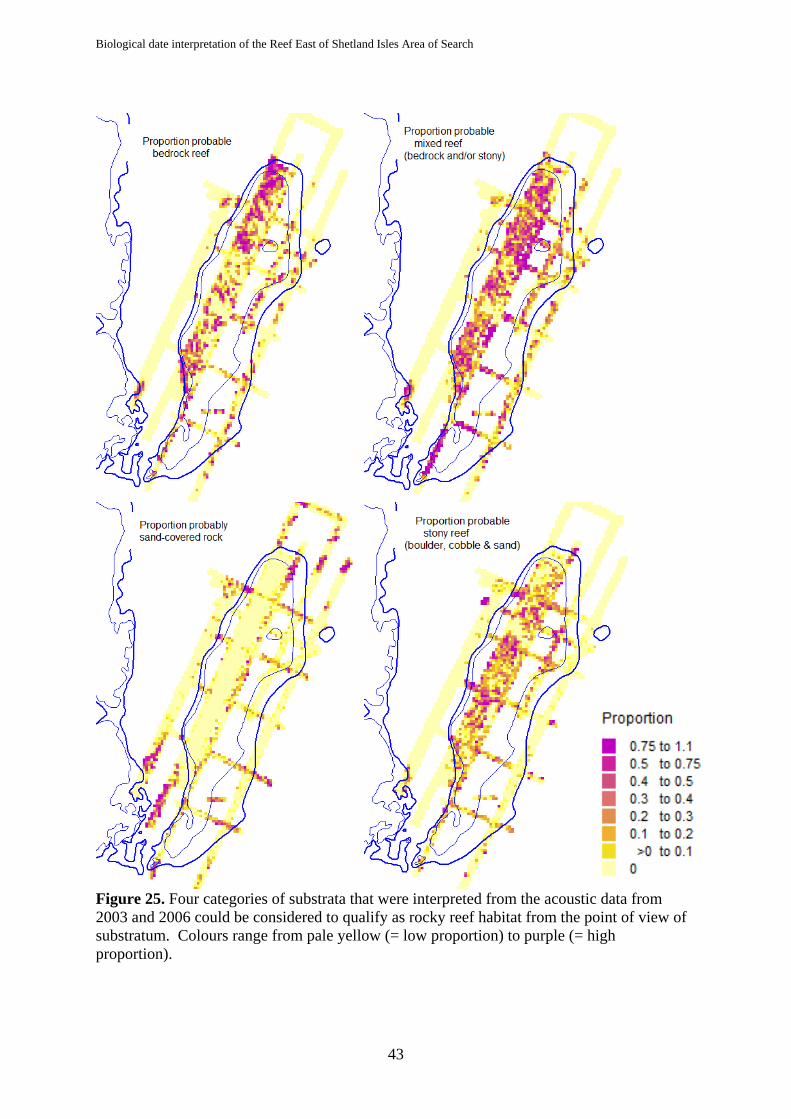
3.7.3 Distribution of Annex I Reef Features Substratum: bedrock and stony reef It is a requirement of the project that maps be produced showing the distribution of Annex I Reef habitats (preferably distinguishing between bedrock and stony reefs). However, mapping marine habitats using the best available data necessarily involves a compromise between accuracy, detail and resolution. Ideally, the underlying information about the distribution of habitats should be at a fine scale and a high resolution so that any necessary generalisation of boundaries can be made based on a complete coverage of accurate and precise data. Drawing boundaries around features at the broad scale presents little difficulty where these features are clustered into discrete areas. The problems faced with the Pobie Bank data are, firstly, that the fine scale resolution is poor and, secondly, the broad scale coverage is incomplete and not well supported by the ground truth data throughout the survey area. Fine scale resolution: The video data show that there are locations along transects where reef (including sand covered rock) occurs and where reef appears to be absent, at least at the surface. Therefore, reef and non-reef habitats are quite patchily distributed (although quite discrete) at the scale of the transects. It is not easy to transfer this fine scale heterogeneity to the much broader scale interpretation of the acoustic datasets because of the paucity of ground truth data concentrated into a few transects. The interpretation of the acoustic data using what ground truth data are available limits the detail of the habitat distribution. Broad scale resolution: Even at the broader scale, coarser resolution of the interpreted acoustic images it is obvious that the habitats are patchily distributed and intermixed, making the drawing of boundaries around different reef habitats problematic. In an attempt to extract a general picture of distribution of potential Annex I bedrock reef and stony reef habitat, the area was partitioned into a 500m grid, and the proportion of grid assigned to different habitat types was calculated. The grids were then displayed showing these proportions (taken as an indication of the relative likelihood of finding these habitats in each grid cell). Figure 25 shows the four categories that could be considered as rocky reef features, either as bedrock reef or stony reef. It is clear that rocky reef in general predominate in area on Pobie bank above the 100m contour (this is even more marked above the 90m contour). The trends in the composition of the component rocky reef habitats are less clear. However, there is a high probability of bedrock reefs on the western margin of Pobie Bank and some of the shallower outcrops to the east of the main ridge. Stony reef is likely around the eastern margins of the bedrock, especially in the lower-lying ground between north and south Pobie Bank. The intermediate ‘bedrock and boulder’ class is distributed throughout the reef area above 100m. Topography One of the defining features of a reef is that they should ‘arise from the seafloor’ (CEC 2007). Clearly, Pobie Bank arises from the sea floor if the latter is taken as the deep water that surrounds the bank. There are also more localised topographic rises (rugged marine landscapes) and these are especially distinctive of the middle section of Pobie Bank where very large rocks outcrop from sand (see Figures 22 and 24).
Biological date interpretation of the Reef East of Shetland Isles Area of Search
43
Figure 25. Four categories of substrata that were interpreted from the acoustic data from 2003 and 2006 could be considered to qualify as rocky reef habitat from the point of view of substratum. Colours range from pale yellow (= low proportion) to purple (= high proportion).

Biological date interpretation of the Reef East of Shetland Isles Area of Search
44
Figure 26. Roughness of the terrain on Pobie Bank and surrounding seabed to the west surveyed in 2006 (for methodology see point 3 under ‘Data from the 2006 survey’ in section 2.3.1). The areas close to the 100m depth contour and the middle area would appear to be rugged rock. Note the large sand waves in the Unst Basin are also shown very clearly.
Biological date interpretation of the Reef East of Shetland Isles Area of Search
45
The terrain model indicates that this central area is rough, consisting of steep-sided rock outcrops and a basement of sand. A more formal analysis was undertaken using a roughness index (for methodology see point 3 under ‘Data from the 2006 survey’ in section 2.3.1). The bathymetric data from 2006 can be used to derive a measure of roughness. A filter was passed over the gridded data comparing the depth of each grid cell with the average depth of cells 250m from the centre. This filter gives a measure (in metres) of the difference in height, either positive (ground is higher than the immediately surrounding area) or negative (ground is lower than its surrounds), and the results are shown in Figure 26. This analysis supports the evidence from the terrain model that the most topographically complex area on Pobie Bank above 100m lies in the central section where the outcrops can be many metres higher than the surrounding sand (up to 10m over a distance of about 250m, at many locations). Other rough ground is likely to occur around the 90-100m contour. Note there are also large gravel/sand waves in the Unst Basin that are highlighted in Figure 22. 3.7.4 Distribution of direct observations of substrata and biotopes In section 3.7.1 the substratum identified from the stills was used to show the close correspondence between substratum and the interpreted acoustic images. It should be remembered that biotopes were assigned to video clips rather than the stills and video clip records have been used to show the general distribution of the substratum and biotopes. These are shown in Figures 27 and 28 (the substratum) and Figures 29 and 30 (biotope code). The records were not widely or evenly distributed throughout Pobie Bank or even the area surveyed. This has meant that there is very little information available from the survey of the broadscale distribution of habitats and biotopes. The information is spatially clustered and can only be indicative of the distribution of Annex I reef and the associated biota that might occur on the substrata. The distribution of substratum classes show no obvious spatial pattern and all classes were found scattered over the survey area. However, the acoustic interpretation indicates that the sample sites might not be representative of the broader locality in which they lay. The distribution of biotopes may support the general distribution shown in Figure 15 where the silty rocks (CR.MCR.EcCr.CarSp) were found around the margins of the rocky outcrops. Examples of the biotopes (illustrated with stills images) and their relation to sidescan images (the most detailed wherever possible) and the interpreted substratum map are included in the Appendix.

Biological date interpretation of the Reef East of Shetland Isles Area of Search
46
Figures 27 and 28. Distribution of direct observations (video clips) of substrata for north (left) and south (right) Pobie Bank. Note there is overlap between the Figure showing north and south parts.

Biological date interpretation of the Reef East of Shetland Isles Area of Search
47
Figures 29 and 30. Distribution of direct observations (video clips) of biotopes for north (left) and south (right) Pobie Bank. Note there is overlap between the Figure showing north and south parts.
Biological date interpretation of the Reef East of Shetland Isles Area of Search
48
3.8 Annex I Reef distribution and biotope maps 3.8.1 Issues regarding full coverage maps An attempt has been made to construct maps of the Annex I reef features and biotope distribution for Pobie Bank (Figures 31 and 32). However, this can only be tentative in view of the obstacles involved in the delineation process, as follows:
1. Perhaps the major obstacle for the delineation of boundaries is the uneven coverage of the survey data. Whilst it might be possible to draw detailed boundaries around the areas surveyed (bearing in mind point ‘2’ below) extrapolation to other parts of Pobie Bank can only be tentative. The procedure adopted for modelling the coverage is explained in section 3.8.2.
2. Although the substrata range from bedrock through boulders and cobble to sand, it is likely that these substrata are closely integrated into topographic features at a relatively small scale and the substratum map indicates a complex pattern of sediment distribution. However, it has to be remembered that the distribution has been interpreted and spatial accuracy and certainty of classification cannot be relied upon for the delineation of boundaries at this small scale. It is suggested that a buffer of at least 500m be used around reef features to account for possible error.
3. The range of biotopes described for Pobie Bank may be limited by the patchy distribution of the sample locations. Although there might be small variations in biotope composition, it is safest to adopt a simple approach to construction of distribution maps based on the available data. It is suggested that generalised distribution maps should be drawn based on a few assumptions which can then be used to re-interpret the acoustic substratum map. The assumptions are:-
a. The photic zone extended down to about 80m (CR.MCR.EcCr.FaAlCr). b. The silty rock biotope (CR.MCR.EcCr.CarSp) was found in deeper water
around the margins of the bank on rock that was not rugged. c. All other rock supported CR.HCR.DpSp.PhaAxi.
The procedure adopted for construction of the full coverage biotope map is explained in section 3.8.3. 3.8.2 Preparation of the final map of Annexe I reef features Note that in the following explanation ‘probable’ reef refers to the process of the mathematical estimation of probabilities whilst ‘possible’ reef is a much weaker statement about the likelihood of occurrence of reef based on a visual inspection of the evidence for the distribution of reef features – particularly outliers. The proportions of habitats within the 500m grids (as described in section 3.7.3), omitting blank grid cells, were interpolated up to 10km from the nearest real data. This distance was sufficient to fill in gaps in the coverage and allow for the empty cell values to be computed from a wide range of surrounding real values. The interpolated images for each of the main habitat types were imported into Idrisi. Firstly, all the potential reef habitats (bedrock, stony, bedrock and stony, and silty rock) were combined and all the potential non-reef habitats (predominantly sandy) combined. These two images were then compared in the Idrisi module ‘HARDEN’ that assigns pixels to the class
Biological date interpretation of the Reef East of Shetland Isles Area of Search
49
(reef/non-reef) with the highest probability. This was used to determine the probable reef area. The process was then repeated only for the four reef habitats to calculate the most probable distribution of these habitats. Note that silty rock was combined with the mixed bedrock and stony reef class to reduce the original four classes to three). The resulting image was trimmed to lie within the previously calculated probable reef area (Figure 29). However, the data also indicate that there may be rocky outliers beyond this probable extent and, although not contributing greatly to the total area of reef, may still be considered to extend the possible area of reef. The line delineating the extent of possible reef has been drawn by eye to include the most significant of these outliers within a single boundary. Note that the areas that have been surveyed for which there is evidence of sand rather than reef (ie positive evidence that reef does not exist) have been shown as sandy irrespective of the size of these patches. 3.8.3 Preparation of the biotope map The procedure for mapping the probable distribution of biotopes started with the gridded data for all habitats also used in 3.8.2. The 80m contour from DigBath was used to select all rocky habitats laying shallower than this depth and these were assigned to the biotope ‘Faunal and algal crusts on exposed to moderately wave-exposed circalittoral rock’ CR.MCR.EcCr.FaAlCr). The bedrock, stony and bedrock and stony habitats below this depth were assigned to ‘Phakellia ventilabrum and Axinellid sponges on deep, wave-exposed circalittoral rock’ (CR.HCR.DpSp.PhaAxi). The silty rock biotope was separated from the mixed reef habitat class and assigned to ‘Caryophyllia smithii, sponges and crustose communities on wave-exposed circalittoral rock’ (CR.MCR.EcCr.CarSp). The distribution of these biotopes was extended by eye to cover the possible extent of reef features. As with the reef map, the tentative nature of these maps must be stressed.
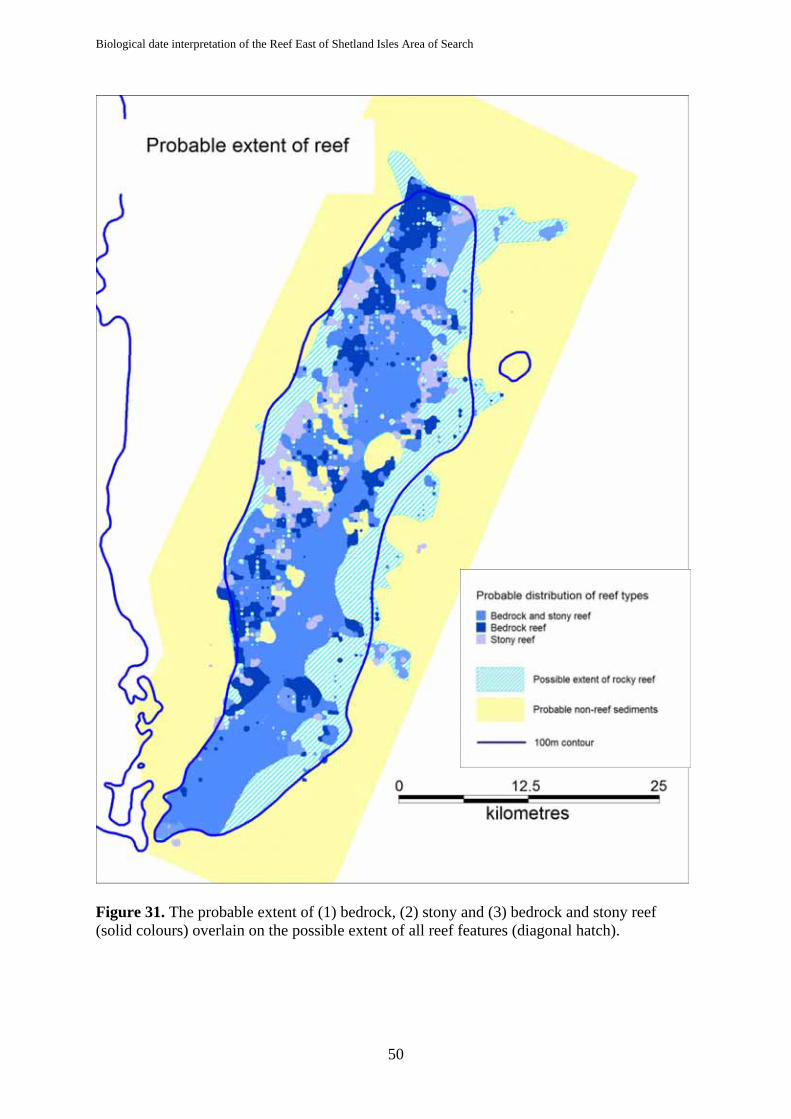
Biological date interpretation of the Reef East of Shetland Isles Area of Search
50
Figure 31. The probable extent of (1) bedrock, (2) stony and (3) bedrock and stony reef (solid colours) overlain on the possible extent of all reef features (diagonal hatch).
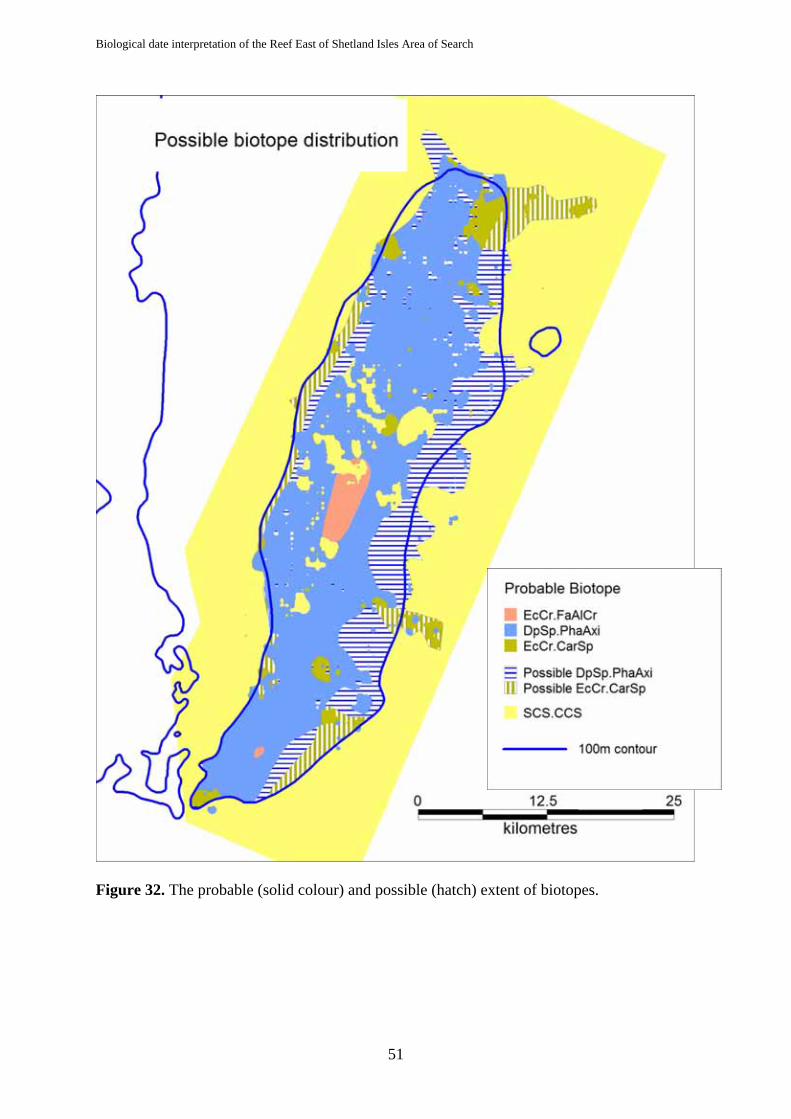
Biological date interpretation of the Reef East of Shetland Isles Area of Search
51
Figure 32. The probable (solid colour) and possible (hatch) extent of biotopes.
Biological date interpretation of the Reef East of Shetland Isles Area of Search
52
4 Discussion and conclusion 4.1 Contribution of review to supporting scientific evidence Previous to this present study, scientific support for the presence of reefs were from reports and data from surveys conducted in 2003 (Black 2003) and 2006 (Howell et al 2007). Green et al (2008) reviewed the geological data from these surveys combined with data held by BGS. Howell et al (2007) presented a summary of the findings of the biota for Pobie Bank and other surveys conducted on the Scottish Continental Shelf. The current review has extended the analysis of the acoustic data collected in 2003 and 2006 to provide information on the composition of the reef (bedrock, stony and bedrock/stony) in more detail, as well as to describe the patchiness and topography of the reefs. A detailed analysis of the video was an important objective of the review and this has provided data for a full and detailed description of the biology of Pobie Bank. The purpose of these analyses was to support the SAC Selection Assessment with information to be used for defining the site boundary and an appraisal of interest features relevant to the selection criteria. 4.2 Site overview Pobie Bank is located in the Northern North Sea Regional Sea. Its location is towards the extreme northern boundary of this Regional Sea with the adjacent Scottish Continental Shelf Regional Sea and it might be expected that Pobie Bank shares many similar features with the latter Regional Sea. Its position might also account for the described species more typical of the Norwegian fauna than of other parts of the Northern North Sea. Pobie Bank rises steeply from the Unst Basin in the west to about 80m and then drops gradually eastwards to about the 130m contour. It is approximately 70km long from north to south and the width ranges from about 16km to 30km. Although rock underlies Pobie Bank, rocky outcrops predominate above the 100m contour and elsewhere much of the rock appears to be overlain with sand with sporadic rocky outcrops. Pobie Bank topography is of medium to high complexity with very rugged bedrock rocky outcrops aligned north-west/south-east. These rocky outcrops are often skirted by large boulder skrees and cobble/sand. The outcrops are most pronounced in the central third of Pobie Bank whilst smoother rock outcrops and extensive stony reefs are more typical of the northern and southern thirds. Both bedrock and stony reefs are present on Pobie Bank and much of the bank is most accurately described as a mixture of these two reef types. Pobie Bank is wave-exposed or moderately wave-exposed and the biota was predominantly of encrusting or robust sponges and bryozoans. Water clarity is likely to be high and encrusting coralline algae were abundant on the shallowest rocks at about 70m (CR.MCR.EcCr.FaAlCr). The majority of the reefs below this depth were characterised by Axinellid sponges (CR.HCR.DpSp.PhaAxi). Silty bedrock was found particularly to the east of the ridge with sponge fauna (CR.MCR.EcCr.CarSp).
Biological date interpretation of the Reef East of Shetland Isles Area of Search
53
4.3 Assessment of features relevant to selection criteria 4.3.1 Representivity The biotope CR.MCR.EcCr.FaAlCr is widely distributed, but previous records of the biotopes CR.HCR.DpSp.PhaAxi and CR.MCR.EcCr.CarSp are mainly from the west coast of Ireland with a small number from the west coast of Scotland. The lack of records of these latter biotopes in the Northern North Sea may be due in part to the depth of Pobie Bank. The habitat and biota at Pobie Bank are reported as being similar to that for Papa Bank west of Orkney (which lies in the Scottish Continental Shelf Regional Sea) and to similar habitats at equivalent depths west of the Hebrides (Mitchell 2005; Howell et al 2006). However, a deep water rocky reef is unusual in this Regional Sea. Although the site is not as species rich compared with shallower rocky reefs in other locations, some species were unusual and have not been included as standard species found in any biotope in the Marine Habitat Classification for Britain and Ireland (Connor et al 2004). For example, the ‘stagshorn’ bryozoans Omalosecosa ramulosa was one of the most conspicuous species observed at Pobie Bank but this does not form a ‘descriptor’ species for any of the ‘official’ biotopes. Other species may be representative of the northerly location of Pobie Bank within the British Isles, such as the Norway Redfish Sebastes viviparous. 4.3.2 Area of habitat The areas of habitat have been estimated assuming that the part of Pobie Bank that has been surveyed is also representative of the unsurveyed area. It has been pointed out that the majority of the evidence for reef lies on Pobie Bank above the 100m contour. Taking the proportions of the ground covered by the reef features (see section 3.7.3) and applying this to the whole of the area encompassed by the 100m contour, then the total reef feature covers an estimated 55,000 hectares. If the area of potential reef is extended to the east of Pobie Bank to the 110m contour, then the feature covers the slightly greater area of 57,900 hectares. Thus, it is estimated that increasing the area eastwards includes a large area that may not be reef whilst making a small difference to the size of the reef feature (Table 9). Table 9. Estimation of areas of reef habitat within Pobie Bank.
Annex1 Reef Area within 100m contour
Area including 110m contour east of Pobie Bank
Stony 16,100 17,000 Bedrock/stony 22,500 23,300 Bedrock 16,400 17,600 Total reef area 55,000 57,900 Non-reef 27,200 42,000
4.4 Site Boundary The data coverage of Pobie Bank is by no means complete and the boundaries are based on an assumption that the areas surveyed are representative of the whole of Pobie Bank. The western margin bordering the Unst Basin and the northern margin are well defined, but the eastern margin is less clear since Pobie Bank slopes gradually towards the east. Nevertheless,
Biological date interpretation of the Reef East of Shetland Isles Area of Search
54
the best interpretation of the evidence suggests that the main reef features are likely to be found within the 100m contour that covers Pobie Bank. Extending the eastern margin to the 110m contour may encompass some isolated rocky outcrops, but these may not add substantially to the area of reef (see Table 9). The reef was patchy in places, particularly in the central third of the Bank. However, the outcrops of rock were very rugged and irregular in outline with patches of sand rarely more than 1000m in width. Whilst it might be possible to delineate reef from non-reef, it would be difficult to do this with confidence given the coverage of data available. A precautionary approach might be taken for boundary delineation in which the patchy, rugged reefs are included within an encompassing boundary. The question of a suitable location of the eastern margin is more problematic since the coverage is lowest here and the evidence suggests that the reefs become more isolated eastwards of Pobie Bank. Figure 33 presents a boundary based on the probable and possible extent of reef (Figure 29) but with the sediment within the boundary discounted. The decision about the exact location of boundaries for any potential SAC might take into consideration the complexity of this boundary, the requirement to remove larger areas of sandy habitat from within the reef extent and the ease of using a simple depth contour. The limitations of the data have been stressed throughout. It would be fair to say that these maps represent the best estimate of distribution and extent based on the evidence available. The confidence that can be placed in them is moderately high (where there are real data underpinning the interpretation), through moderate (where interpolation is close to real data) to low (where boundaries have been drawn by eye). Nevertheless, it is felt that the results of the analyses have been reasonably successful and that the overall objective to delineate a boundary around the most significant reef features has been achieved.
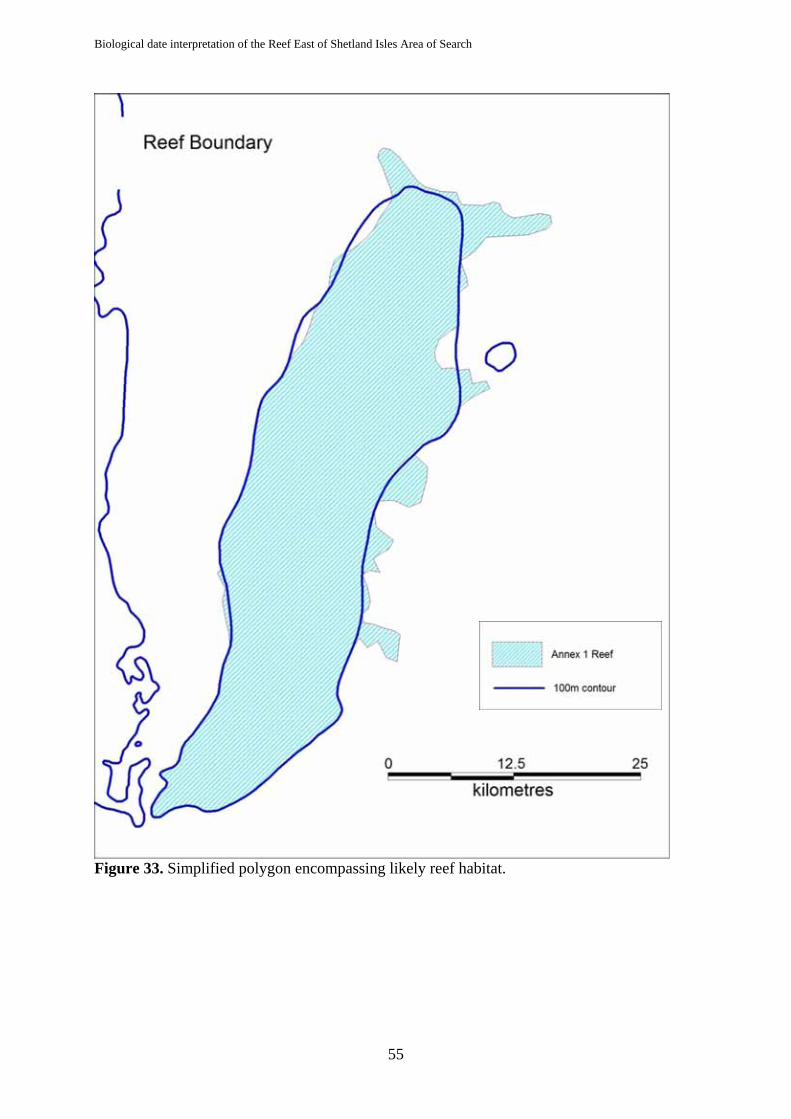
Biological date interpretation of the Reef East of Shetland Isles Area of Search
55
Figure 33. Simplified polygon encompassing likely reef habitat.

Biological date interpretation of the Reef East of Shetland Isles Area of Search
56
5 Acknowledgements Envision Mapping Ltd. has received much support and encouragement from the staff at the JNCC both at Peterborough and Aberdeen. We would also like to acknowledge the helpful discussions we have had with David Long, BGS and we would like to thank Heather Stewart, BGS for trying to extract information from the Olex data.
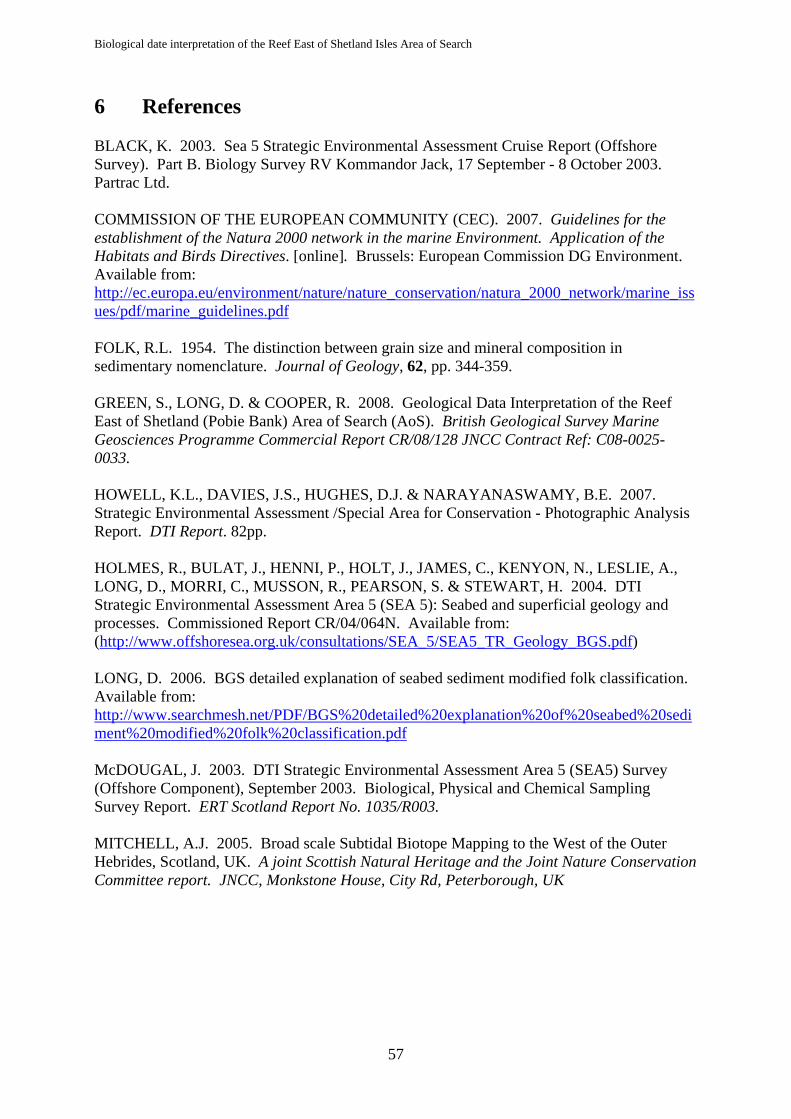
Biological date interpretation of the Reef East of Shetland Isles Area of Search
57
6 References BLACK, K. 2003. Sea 5 Strategic Environmental Assessment Cruise Report (Offshore Survey). Part B. Biology Survey RV Kommandor Jack, 17 September - 8 October 2003. Partrac Ltd. COMMISSION OF THE EUROPEAN COMMUNITY (CEC). 2007. Guidelines for the establishment of the Natura 2000 network in the marine Environment. Application of the Habitats and Birds Directives. [online]. Brussels: European Commission DG Environment. Available from: http://ec.europa.eu/environment/nature/nature_conservation/natura_2000_network/marine_issues/pdf/marine_guidelines.pdf FOLK, R.L. 1954. The distinction between grain size and mineral composition in sedimentary nomenclature. Journal of Geology, 62, pp. 344-359. GREEN, S., LONG, D. & COOPER, R. 2008. Geological Data Interpretation of the Reef East of Shetland (Pobie Bank) Area of Search (AoS). British Geological Survey Marine Geosciences Programme Commercial Report CR/08/128 JNCC Contract Ref: C08-0025-0033. HOWELL, K.L., DAVIES, J.S., HUGHES, D.J. & NARAYANASWAMY, B.E. 2007. Strategic Environmental Assessment /Special Area for Conservation - Photographic Analysis Report. DTI Report. 82pp. HOLMES, R., BULAT, J., HENNI, P., HOLT, J., JAMES, C., KENYON, N., LESLIE, A., LONG, D., MORRI, C., MUSSON, R., PEARSON, S. & STEWART, H. 2004. DTI Strategic Environmental Assessment Area 5 (SEA 5): Seabed and superficial geology and processes. Commissioned Report CR/04/064N. Available from: (http://www.offshoresea.org.uk/consultations/SEA_5/SEA5_TR_Geology_BGS.pdf) LONG, D. 2006. BGS detailed explanation of seabed sediment modified folk classification. Available from: http://www.searchmesh.net/PDF/BGS%20detailed%20explanation%20of%20seabed%20sediment%20modified%20folk%20classification.pdf McDOUGAL, J. 2003. DTI Strategic Environmental Assessment Area 5 (SEA5) Survey (Offshore Component), September 2003. Biological, Physical and Chemical Sampling Survey Report. ERT Scotland Report No. 1035/R003. MITCHELL, A.J. 2005. Broad scale Subtidal Biotope Mapping to the West of the Outer Hebrides, Scotland, UK. A joint Scottish Natural Heritage and the Joint Nature Conservation Committee report. JNCC, Monkstone House, City Rd, Peterborough, UK

Biological date interpretation of the Reef East of Shetland Isles Area of Search
58
Appendix 1 Examples of stills with their location on sidescan images and interpreted acoustic maps.
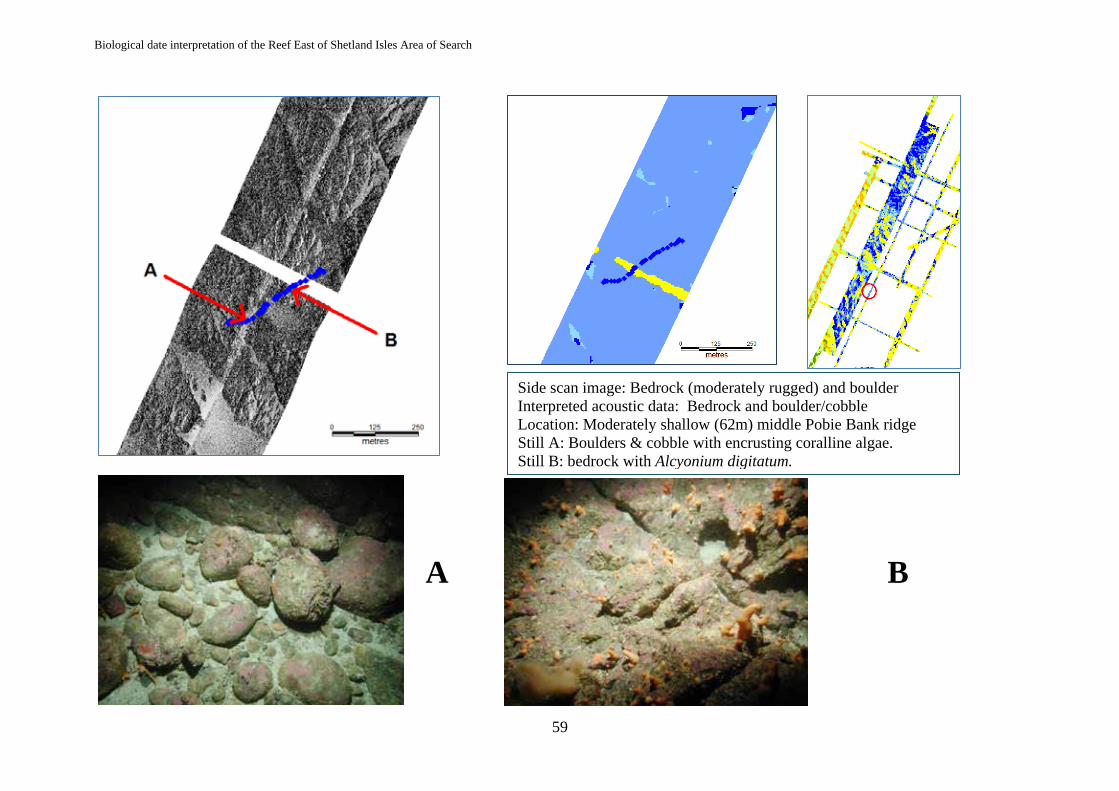
Biological date interpretation of the Reef East of Shetland Isles Area of Search
59
A B
Side scan image: Bedrock (moderately rugged) and boulder Interpreted acoustic data: Bedrock and boulder/cobble Location: Moderately shallow (62m) middle Pobie Bank ridge Still A: Boulders & cobble with encrusting coralline algae. Still B: bedrock with Alcyonium digitatum.

Biological date interpretation of the Reef East of Shetland Isles Area of Search
60
A B
Side scan image: Bedrock (moderately rugged) and boulder Interpreted acoustic data: Bedrock and boulder/cobble Location: Moderately shallow middle Pobie Bank ridge Still A: Bedrock with branching bryozoans and Axinella infundibuliformis. Still B: Boulder and sand.

Biological date interpretation of the Reef East of Shetland Isles Area of Search
61
A B
Side scan image: Bedrock and boulder Interpreted acoustic data: Bedrock and boulder/cobble Location: Moderately shallow middle Pobie Bank ridge Still A: Boulders & cobble. Still B: Sand covered bedrock with Axinella infundibuliformis.

Biological date interpretation of the Reef East of Shetland Isles Area of Search
62
A B
Side scan image: Ridges (waves?) of course and soft sediment Interpreted acoustic data: Sand covered rock and sand Location: Northern margin of Pobie Bank Still A: Coarse sand. Still B: Mixed sand and boulder.
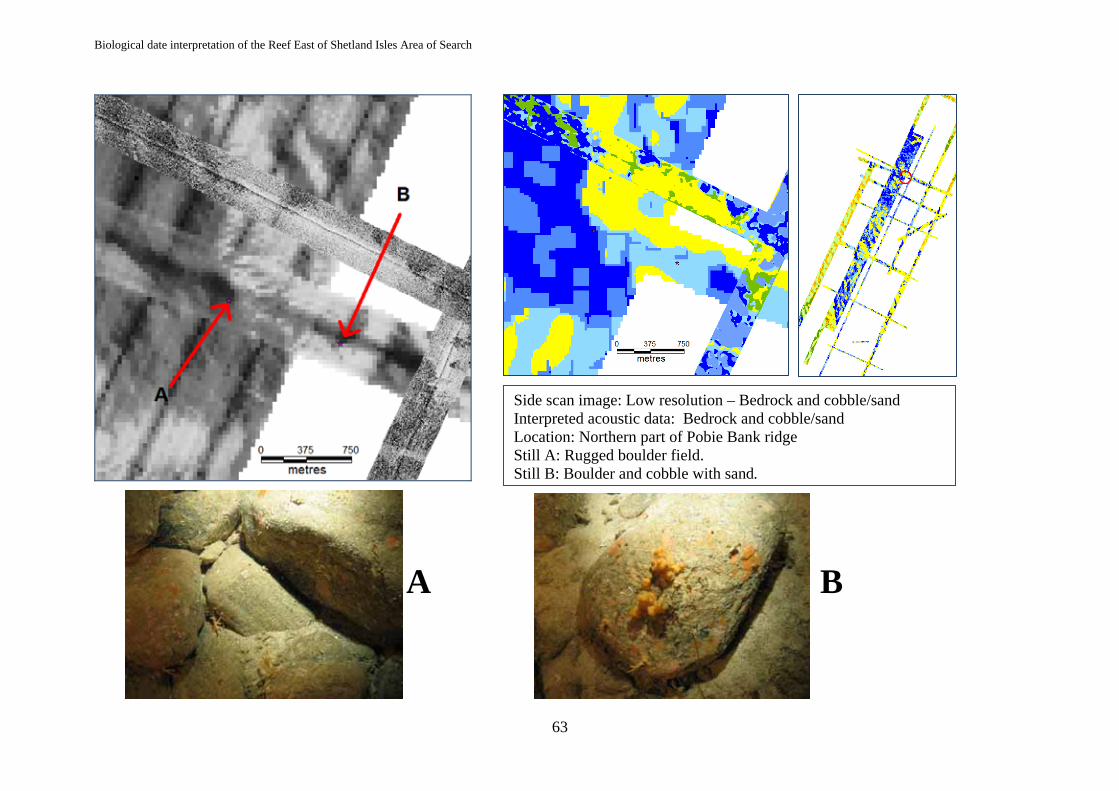
Biological date interpretation of the Reef East of Shetland Isles Area of Search
63
A B
Side scan image: Low resolution – Bedrock and cobble/sand Interpreted acoustic data: Bedrock and cobble/sand Location: Northern part of Pobie Bank ridge Still A: Rugged boulder field. Still B: Boulder and cobble with sand.

Biological date interpretation of the Reef East of Shetland Isles Area of Search
64
A B
Side scan image: Low resolution – bedrock and sand Interpreted acoustic data: Bedrock, boulder/cobble and sand Location: Eastern margin of Pobie Bank ridge Still A: Silty bedrock with Axinellids and sponges. Still B: Boulders with Munida rugosa and encrusting bryozoans.
Biological date interpretation of the Reef East of Shetland Isles Area of Search
65
Side scan image: Silty sand covered bedrock Interpreted acoustic data: Bedrock and sand covered bedrock Location: Slope of Pobie Bank bordering the Unst deeps Still: Silt covered bedrock with hydroid turf and Hymedesmia paupertas

Biological date interpretation of the Reef East of Shetland Isles Area of Search
66
A B
Side scan image: Ridges (waves?) of course and soft sediment Interpreted acoustic data: Sand covered rock and sand Location: Northern margin of Pobie Bank Still A: Coarse sand. Still B: Mixed sand and boulder.
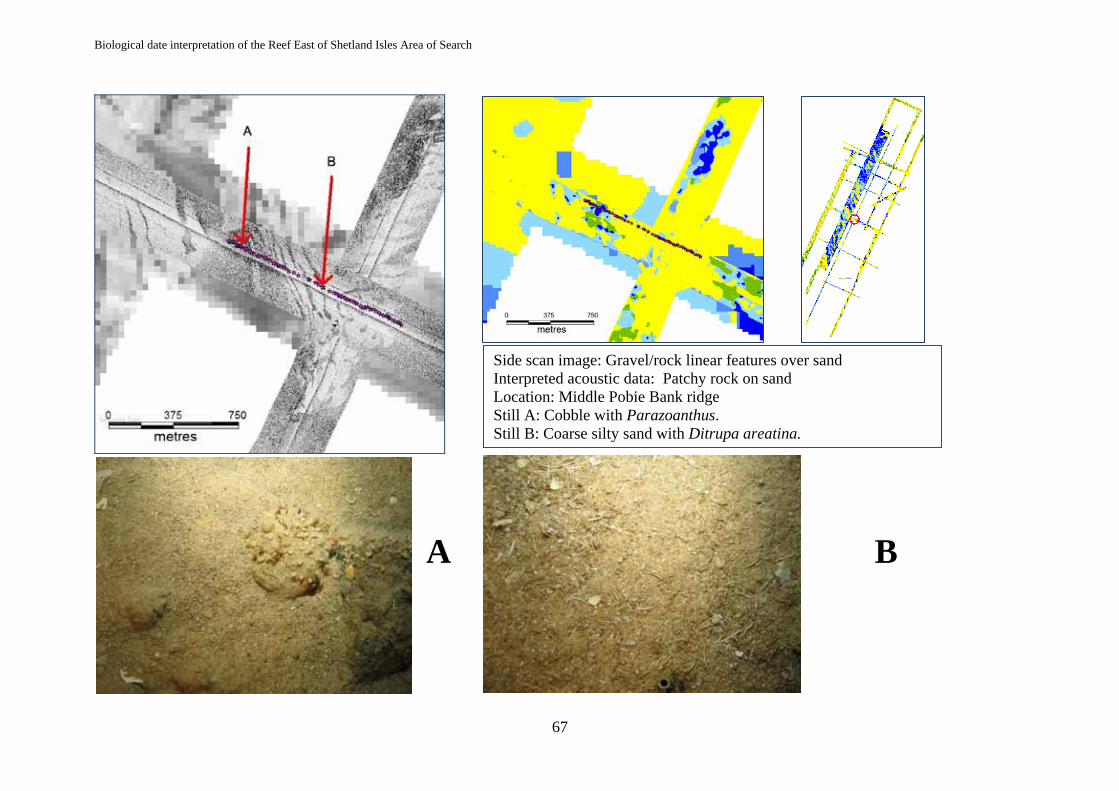
Biological date interpretation of the Reef East of Shetland Isles Area of Search
67
A B
Side scan image: Gravel/rock linear features over sand Interpreted acoustic data: Patchy rock on sand Location: Middle Pobie Bank ridge Still A: Cobble with Parazoanthus. Still B: Coarse silty sand with Ditrupa areatina.


![Physical and Biological Controls on the Carbonate ...€¦ · benthic reef metabolism alters the carbonate chemistry of coral reef waters [27–30], comparatively little attention](https://img.pdfslide.net/doc/110x75/5f5fa1bddd20960eff25f736/physical-and-biological-controls-on-the-carbonate-benthic-reef-metabolism-alters.jpg)