Embed Size (px)
DESCRIPTION
Biological diversity estimation and comparison: problems and solutions W.B. Batista, S.B. Perelman and L.E. Puhl. A simple conceptual model of plant-species diversity The rationale of diversity estimation Some essential diversity-estimator functions Parametric Non-parametric - PowerPoint PPT Presentation
Citation preview
Biological diversity estimation and comparison: problems and solutions
W.B. Batista, S.B. Perelman and L.E. Puhl
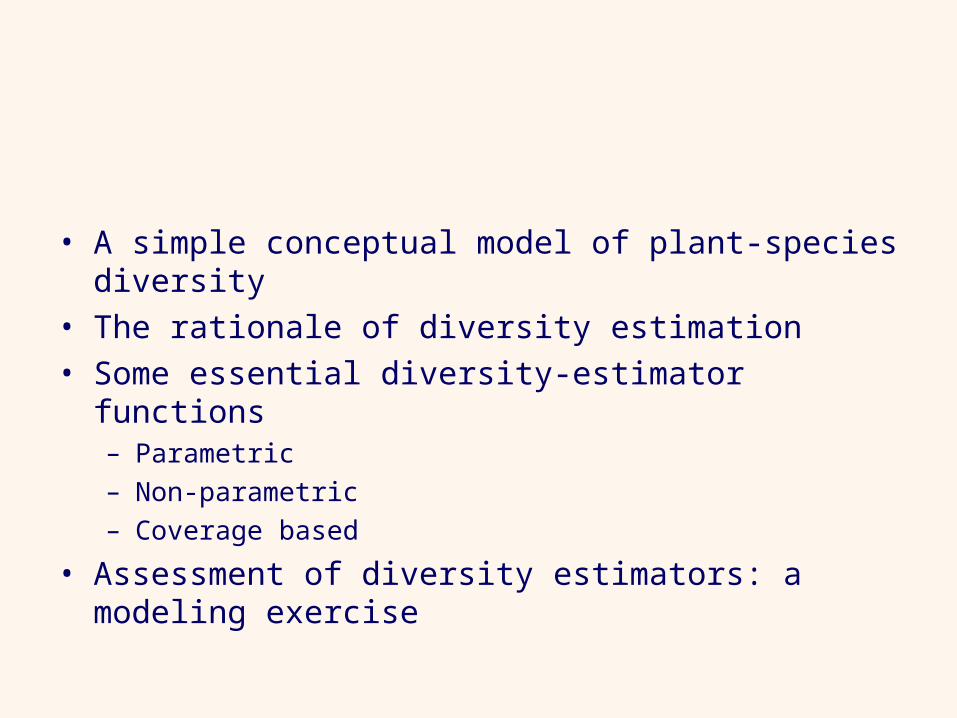
• A simple conceptual model of plant-species diversity• The rationale of diversity estimation• Some essential diversity-estimator functions
– Parametric– Non-parametric– Coverage based
• Assessment of diversity estimators: a modeling exercise
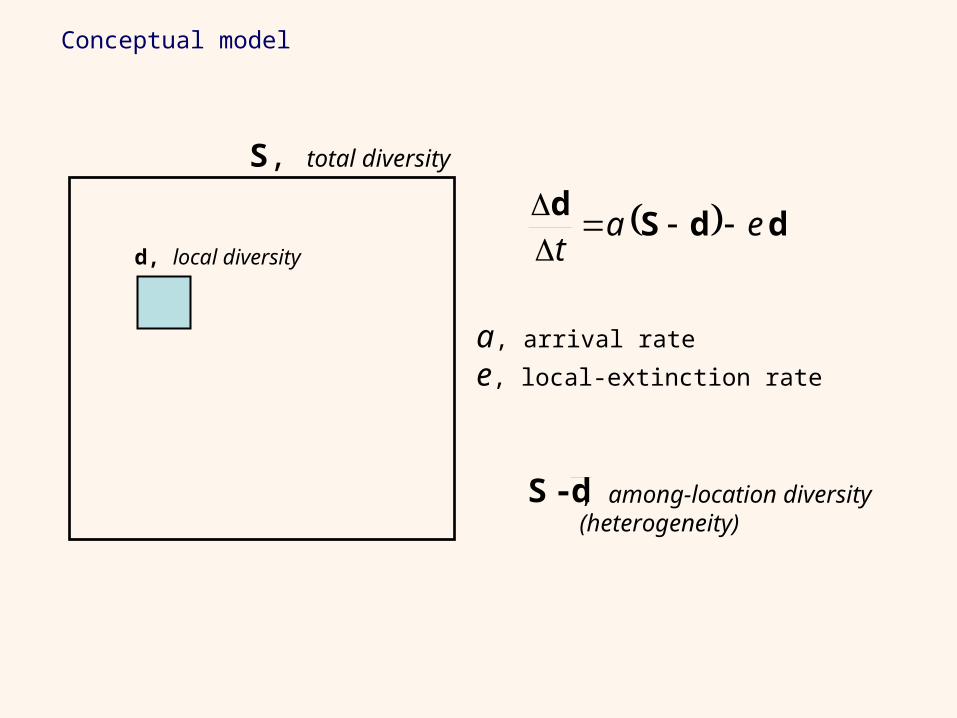
S, total diversity
d, local diversity
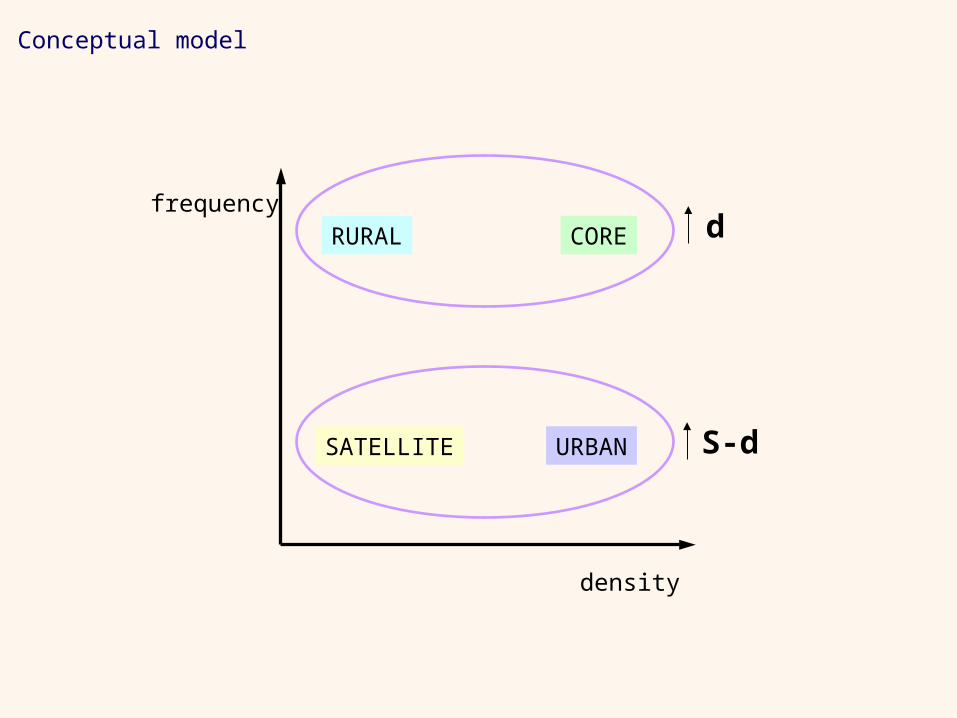
Conceptual model
a, arrival rate
e, local-extinction rate
ddSd
eat
d-S , among-location diversity(heterogeneity)
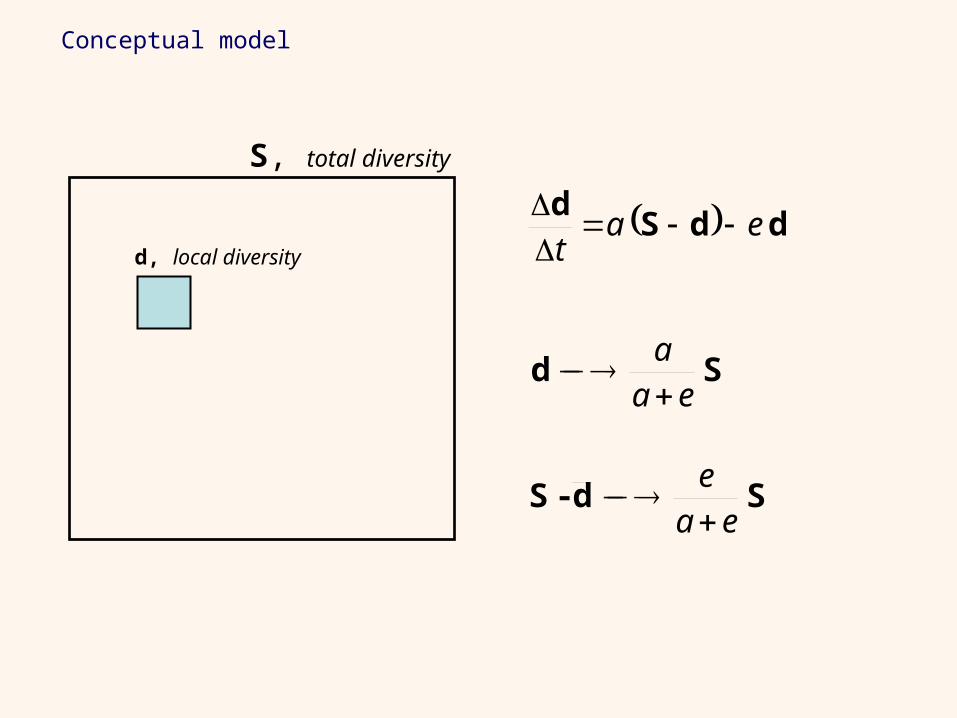
S, total diversity
d, local diversity
Conceptual model
ddSd
eat
Sdeaa
Sd-Seae
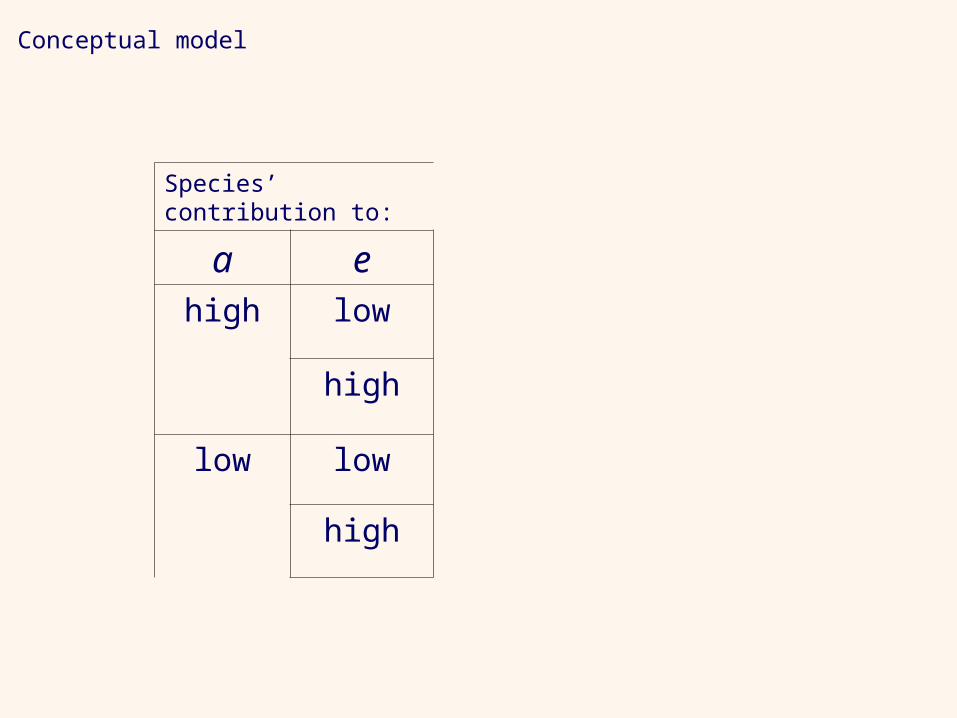
Conceptual model
Species’ contribution to:
a ehigh low
high
low low
high
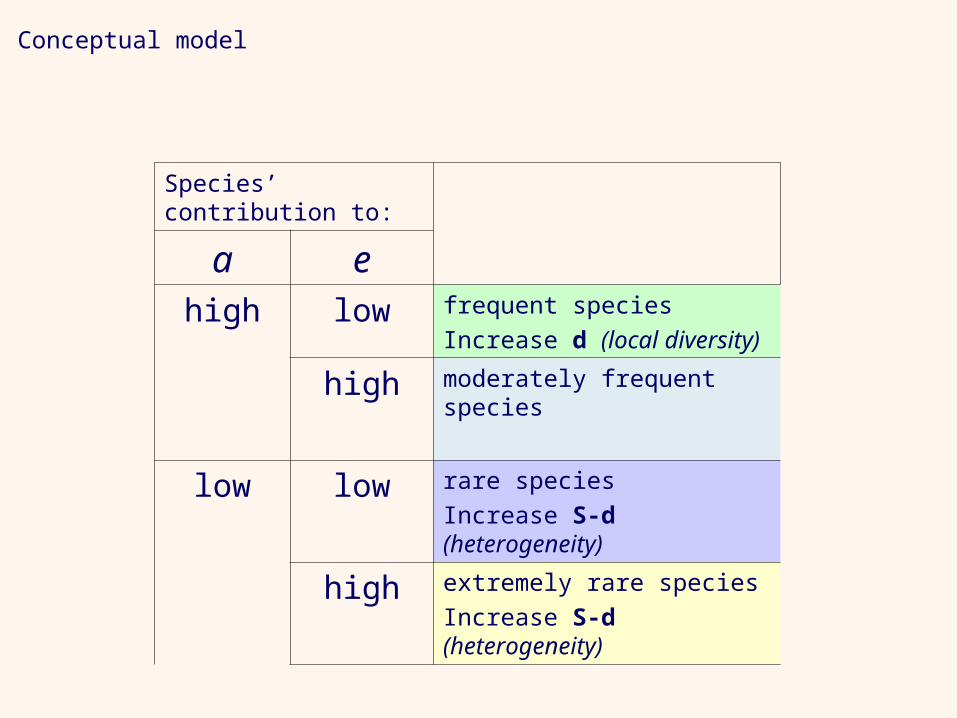
Conceptual model
Species’ contribution to:
a ehigh low frequent species
Increase d (local diversity)
high moderately frequent species
low low rare species
Increase S-d (heterogeneity)
high extremely rare species
Increase S-d (heterogeneity)
Conceptual model
density
frequency
URBAN
CORE
SATELLITE
RURAL d
S-d
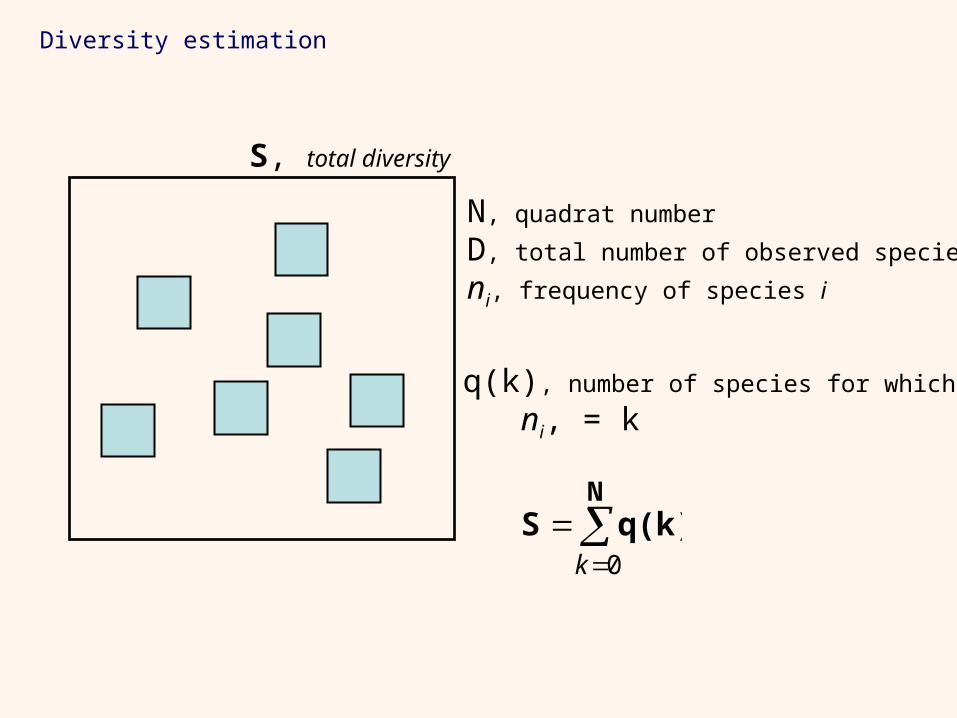
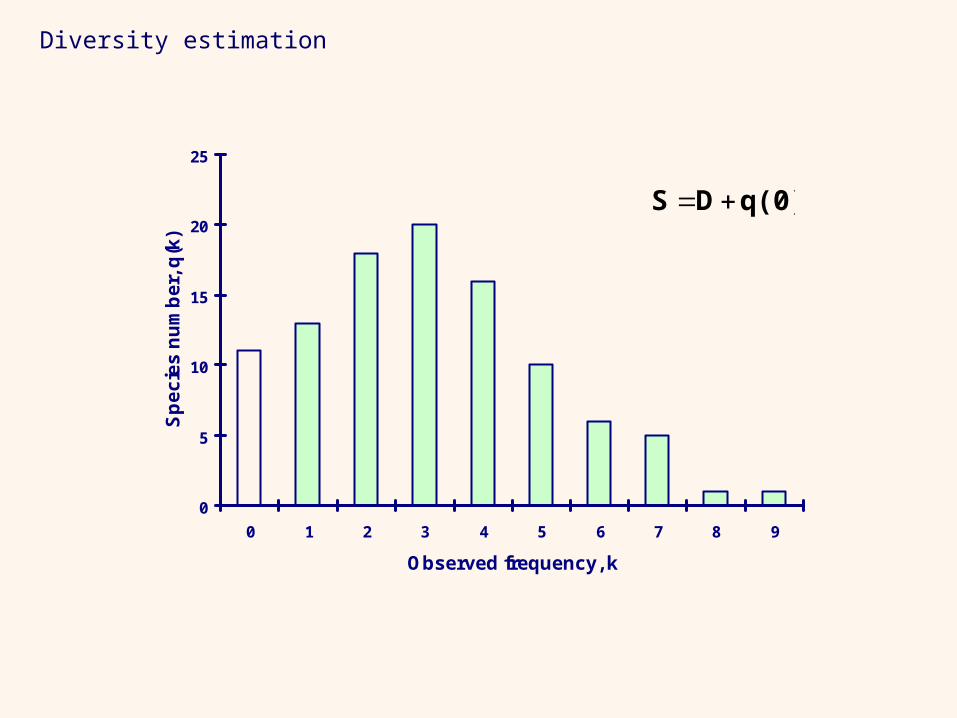
Diversity estimation
S, total diversity
N, quadrat number
D, total number of observed species
ni, frequency of species i
q(k), number of species for which
ni, = k
N
q(k)S0k
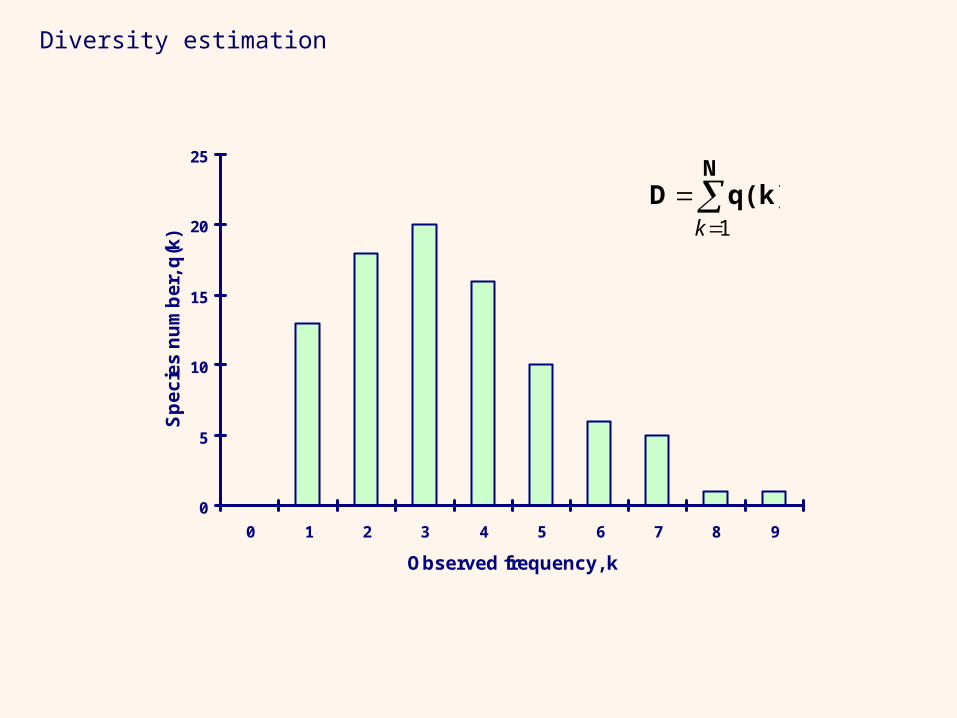
Diversity estimation
0
5
10
15
20
25
0 1 2 3 4 5 6 7 8 9
Observed frequency, k
Sp
ec
ies
nu
mb
er,
q(k
)
N
q(k)D1k
Diversity estimation
0
5
10
15
20
25
0 1 2 3 4 5 6 7 8 9
Observed frequency, k
Sp
ec
ies
nu
mb
er,
q(k
)
N
q(k)D1k
Diversity estimation
0
5
10
15
20
25
0 1 2 3 4 5 6 7 8 9
Observed frequency, k
Sp
ec
ies
nu
mb
er,
q(k
)
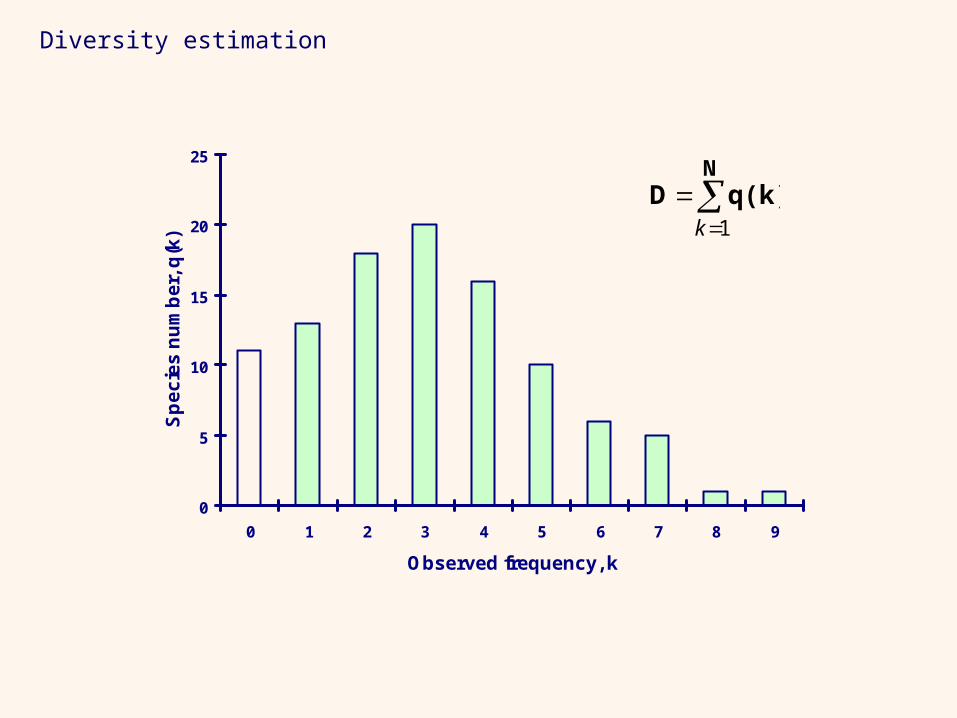
q(0)DS
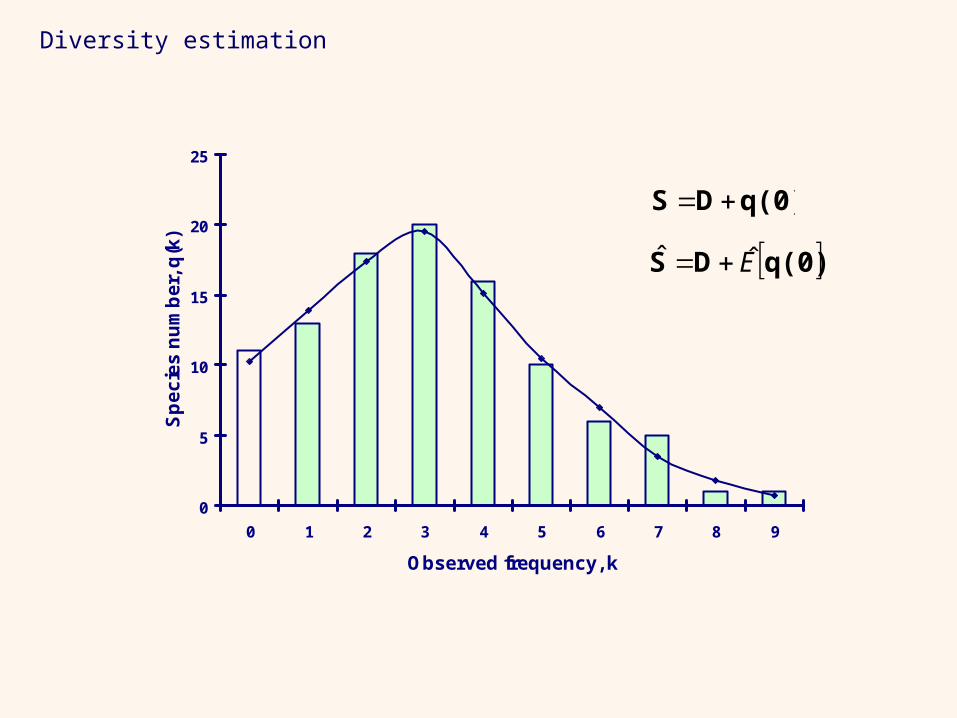
Diversity estimation
0
5
10
15
20
25
0 1 2 3 4 5 6 7 8 9
Observed frequency, k
Sp
ec
ies
nu
mb
er,
q(k
)
q(0)DS
q(0)DS Eˆ
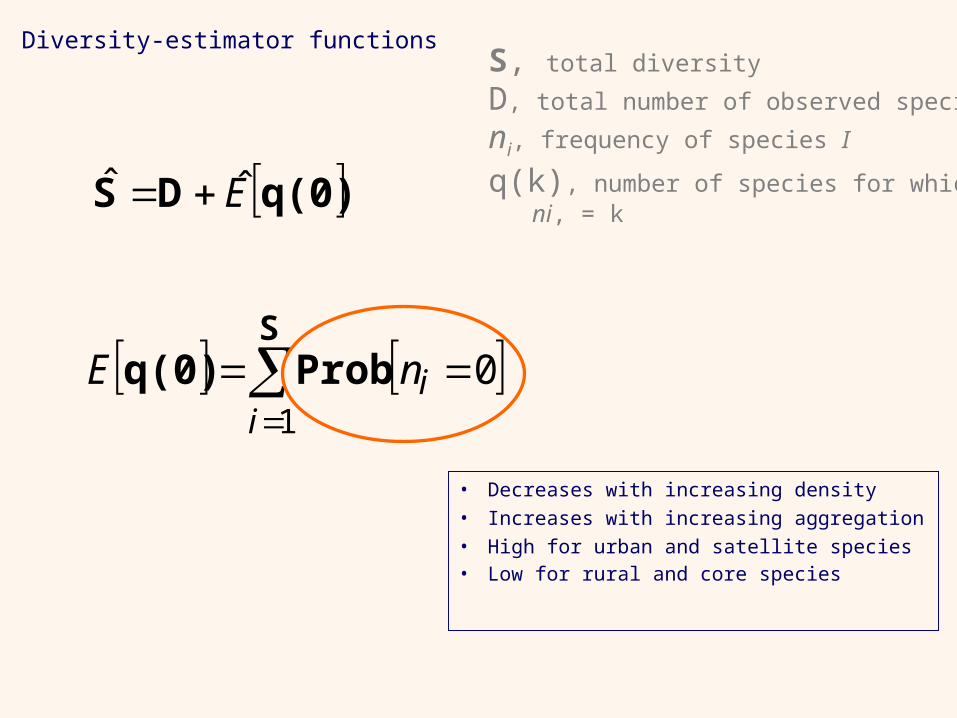
Diversity-estimator functionsS, total diversity
D, total number of observed species
ni, frequency of species I
q(k), number of species for which ni, = k
q(0)DS Eˆ
S
Probq(0)1
0i
inE
• Decreases with increasing density
• Increases with increasing aggregation
• High for urban and satellite species• Low for rural and core species
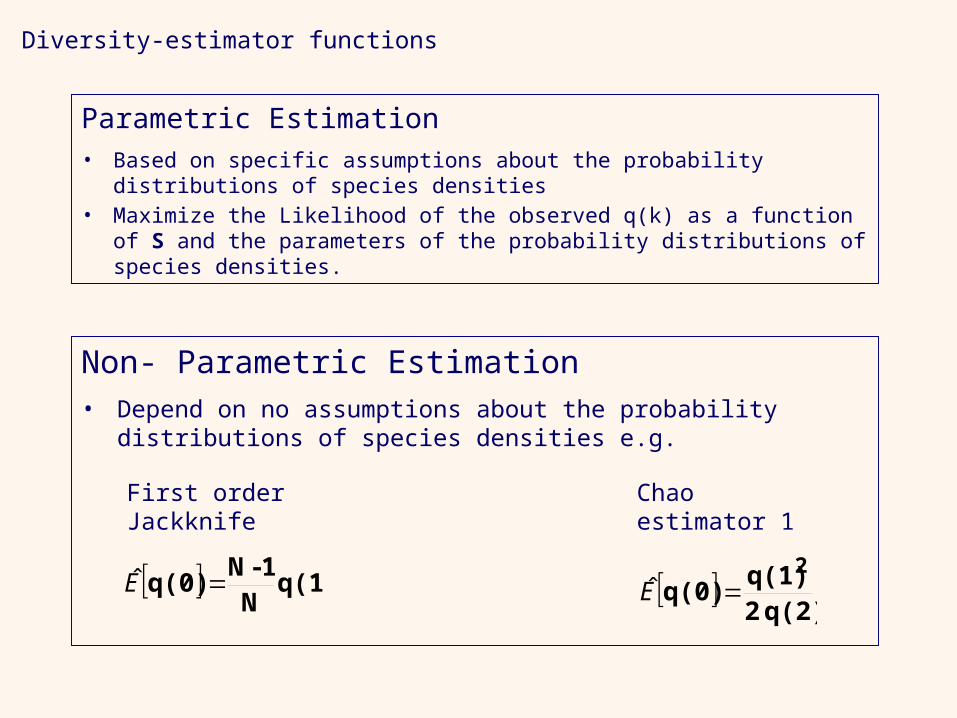
Diversity-estimator functions
Parametric Estimation• Based on specific assumptions about the probability distributions of
species densities• Maximize the Likelihood of the observed q(k) as a function of S and the
parameters of the probability distributions of species densities.
Non- Parametric Estimation• Depend on no assumptions about the probability distributions of
species densities e.g.
q(2)2
q(1)q(0)
2E
Chao estimator 1First order Jackknife
q(1)N
1-Nq(0) E
Diversity-estimator functions
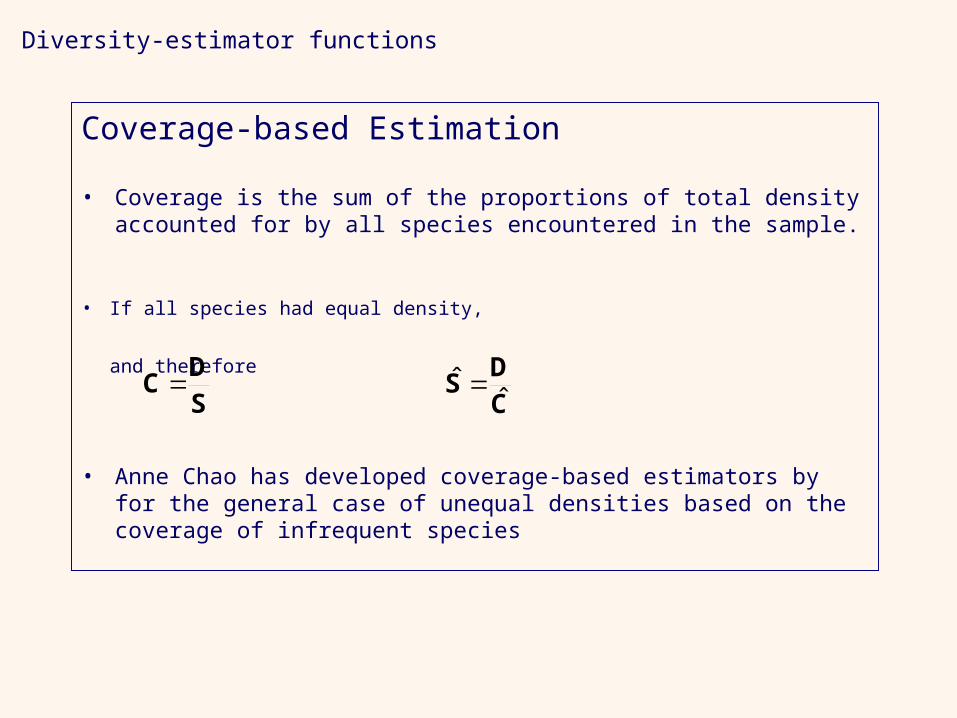
Coverage-based Estimation
• Coverage is the sum of the proportions of total density accounted for by all species encountered in the sample.
• Anne Chao has developed coverage-based estimators by for the general case of unequal densities based on the coverage of infrequent species
• If all species had equal density,
and therefore
SD
C CD
Sˆ
ˆ
Diversity-estimator functions
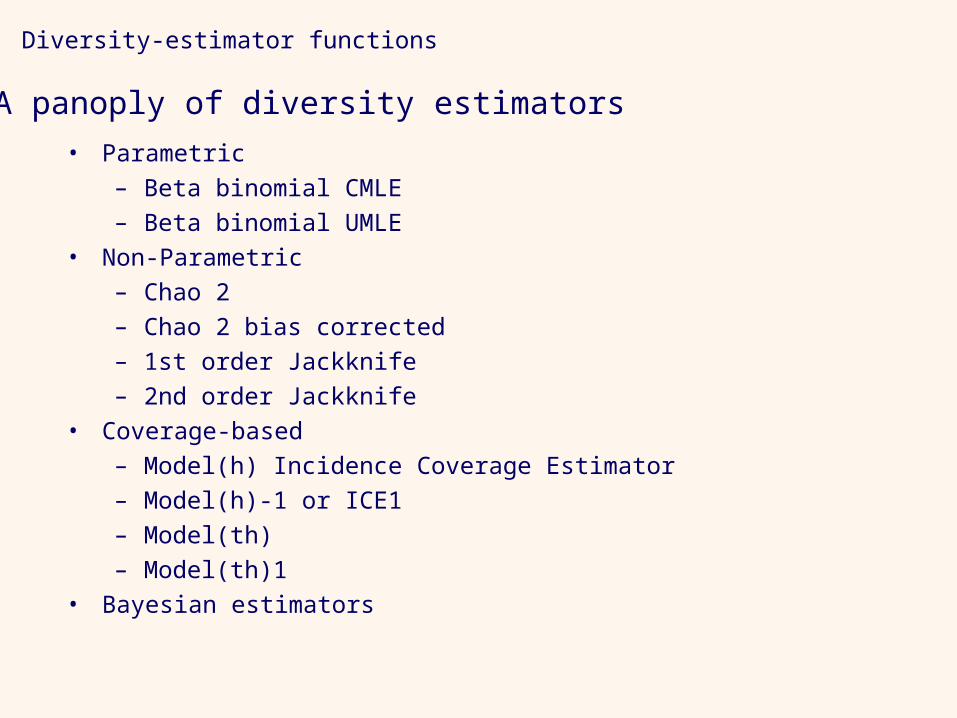
A panoply of diversity estimators
• Parametric
– Beta binomial CMLE
– Beta binomial UMLE
• Non-Parametric
– Chao 2
– Chao 2 bias corrected
– 1st order Jackknife
– 2nd order Jackknife
• Coverage-based
– Model(h) Incidence Coverage Estimator
– Model(h)-1 or ICE1
– Model(th)
– Model(th)1
• Bayesian estimators
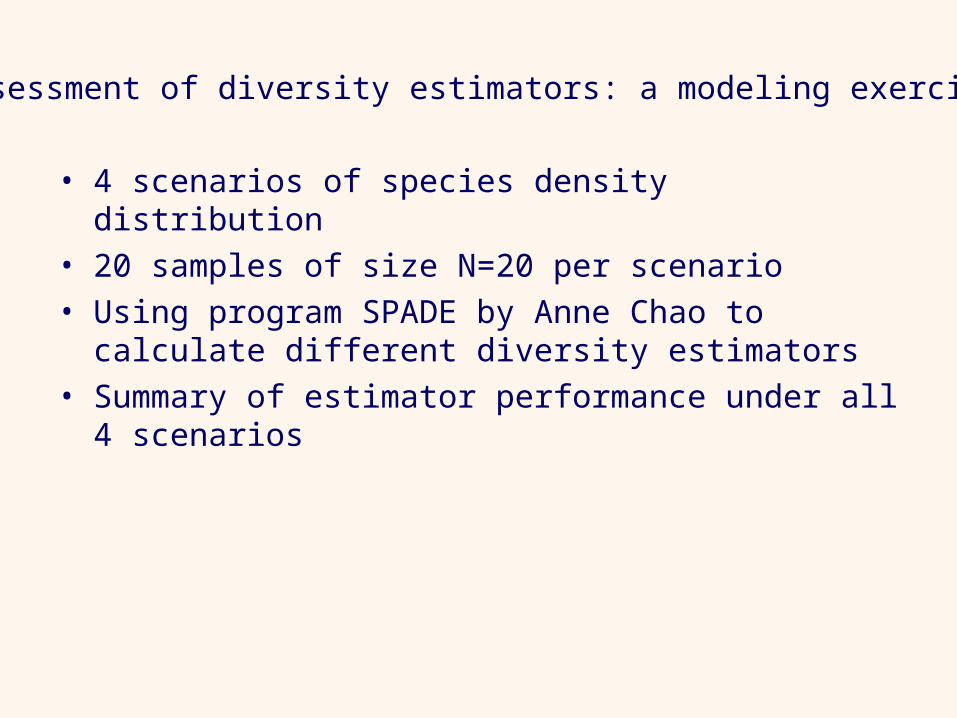
Assessment of diversity estimators: a modeling exercise
• 4 scenarios of species density distribution• 20 samples of size N=20 per scenario• Using program SPADE by Anne Chao to calculate
different diversity estimators• Summary of estimator performance under all 4 scenarios
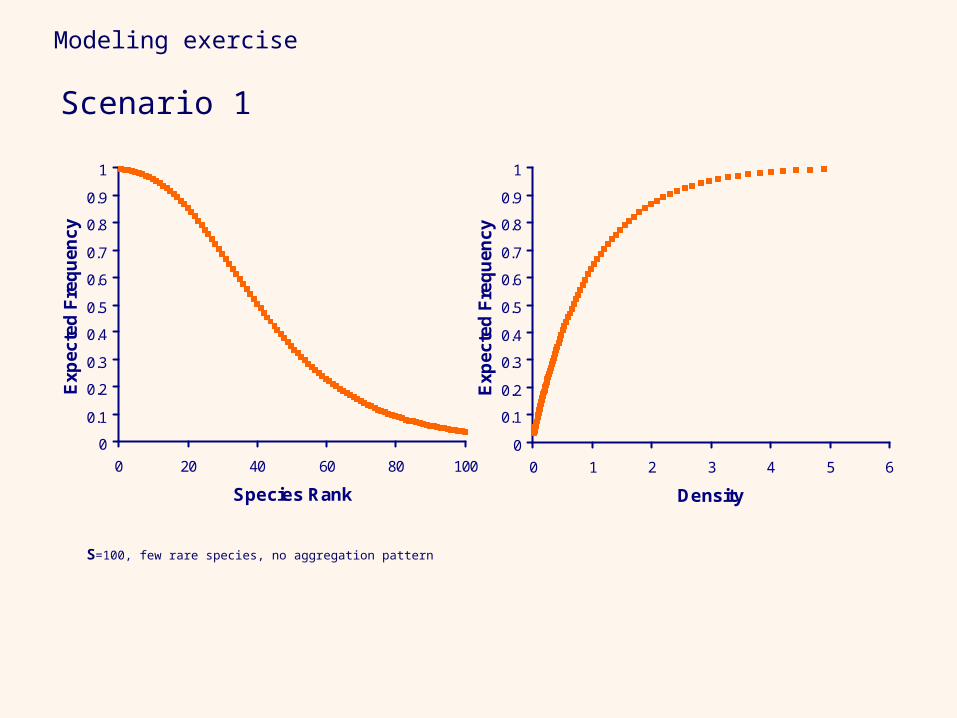
Modeling exercise
S=100, few rare species, no aggregation pattern
Scenario 1
0
0.1
0.2
0.3
0.4
0.5
0.6
0.7
0.8
0.9
1
0 20 40 60 80 100
Species Rank
Exp
ecte
d F
req
uen
cy
0
0.1
0.2
0.3
0.4
0.5
0.6
0.7
0.8
0.9
1
0 1 2 3 4 5 6
DensityE
xpec
ted
Fre
qu
ency
Modeling exercise
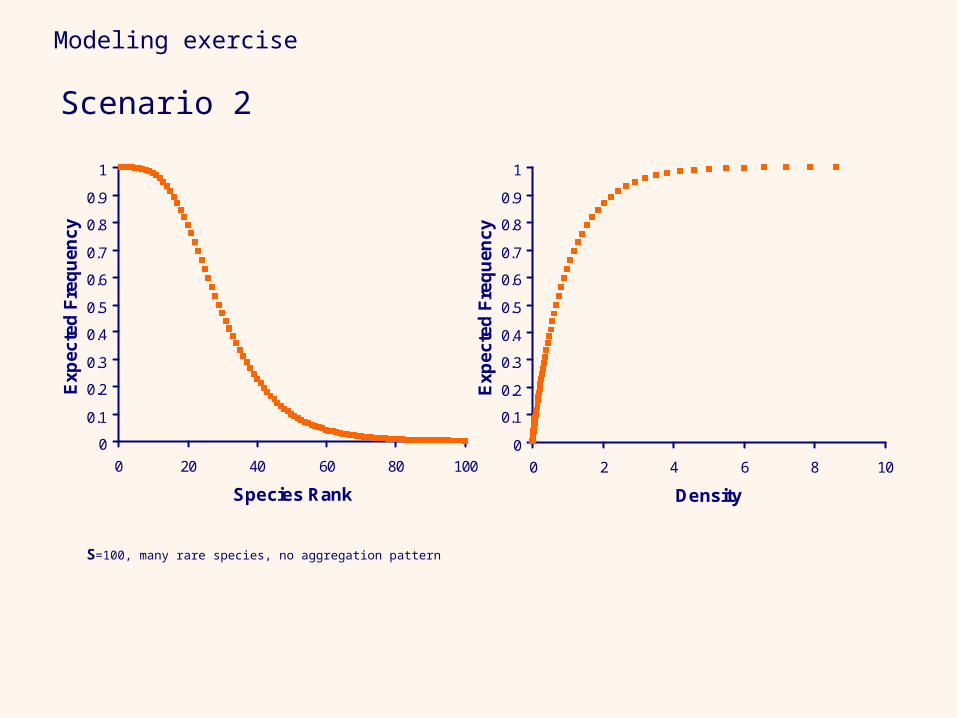
Scenario 2
0
0.1
0.2
0.3
0.4
0.5
0.6
0.7
0.8
0.9
1
0 2 4 6 8 10
DensityE
xpec
ted
Fre
qu
ency
0
0.1
0.2
0.3
0.4
0.5
0.6
0.7
0.8
0.9
1
0 20 40 60 80 100
Species Rank
Exp
ecte
d F
req
uen
cy
S=100, many rare species, no aggregation pattern
Modeling exercise
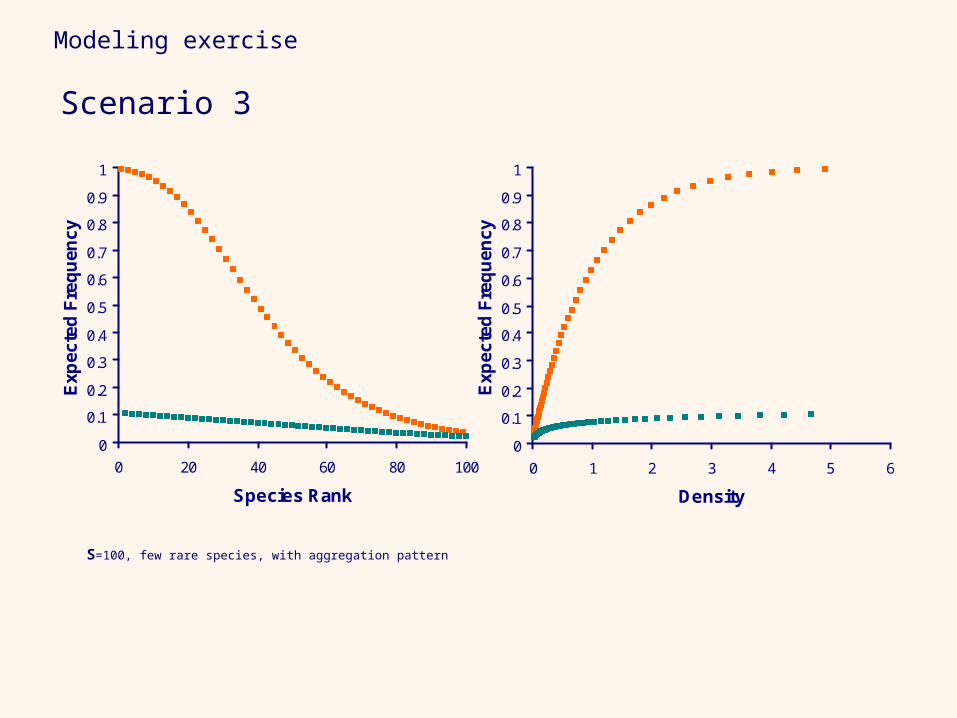
Scenario 3
S=100, few rare species, with aggregation pattern
0
0.1
0.2
0.3
0.4
0.5
0.6
0.7
0.8
0.9
1
0 20 40 60 80 100
Species Rank
Exp
ecte
d F
req
uen
cy
0
0.1
0.2
0.3
0.4
0.5
0.6
0.7
0.8
0.9
1
0 1 2 3 4 5 6
DensityE
xpec
ted
Fre
qu
ency
Modeling exercise
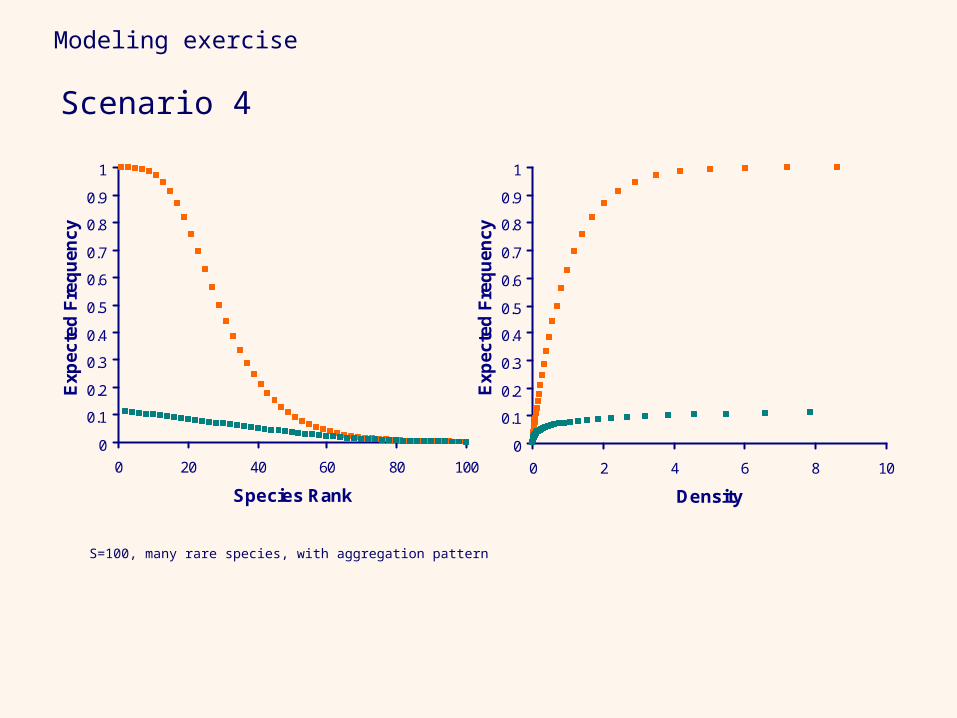
Scenario 4
S=100, many rare species, with aggregation pattern
0
0.1
0.2
0.3
0.4
0.5
0.6
0.7
0.8
0.9
1
0 20 40 60 80 100
Species Rank
Exp
ecte
d F
req
uen
cy
0
0.1
0.2
0.3
0.4
0.5
0.6
0.7
0.8
0.9
1
0 2 4 6 8 10
DensityE
xpec
ted
Fre
qu
ency
Modeling exercise
d N 1 N 2 N 3 N 4 C 1 C 2 C 3 C 4 B5 0
6 0
7 0
8 0
9 0
1 0 0
1 1 0
1 2 0
1 3 0
1 4 0
1 5 0E
sti
ma
ted
Div
ers
ity
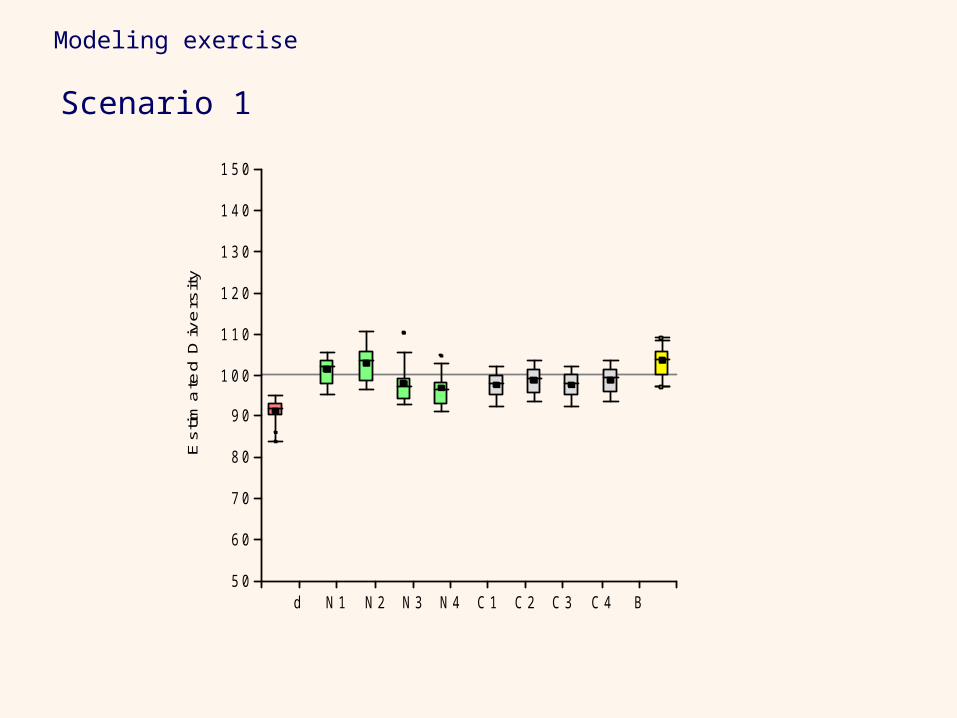
Scenario 1
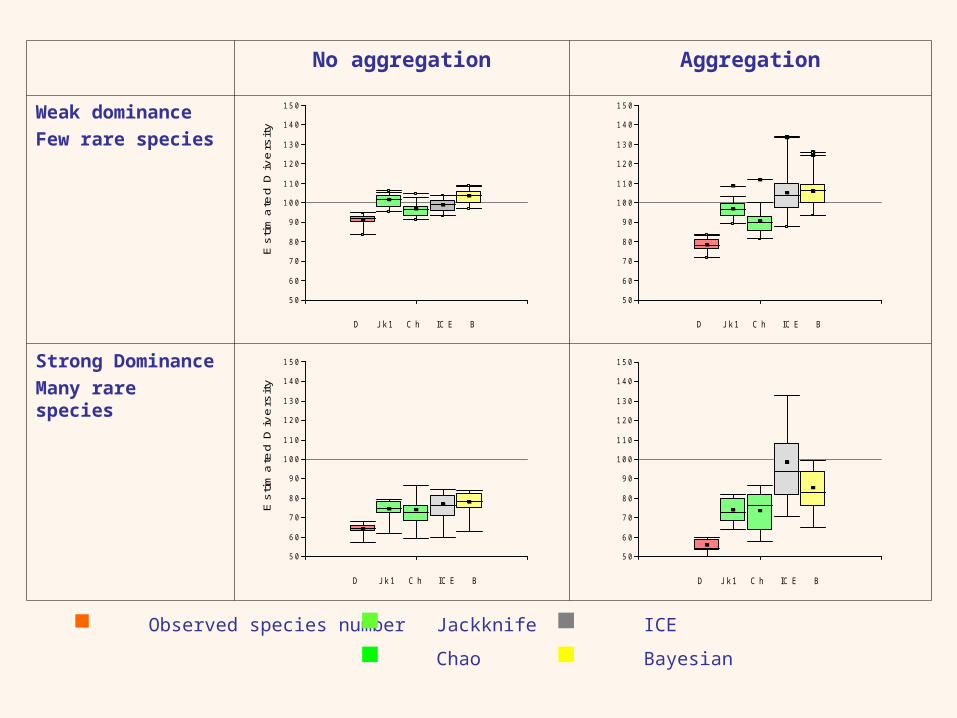
No aggregation Aggregation
Weak dominance
Few rare species
Strong Dominance
Many rare species
D J k 1 C h IC E B
5 0
6 0
7 0
8 0
9 0
1 0 0
1 1 0
1 2 0
1 3 0
1 4 0
1 5 0
Es
tim
ate
d D
ive
rsit
y
D J k 1 C h IC E B
5 0
6 0
7 0
8 0
9 0
1 0 0
1 1 0
1 2 0
1 3 0
1 4 0
1 5 0
D J k 1 C h IC E B
5 0
6 0
7 0
8 0
9 0
1 0 0
1 1 0
1 2 0
1 3 0
1 4 0
1 5 0
Es
tim
ate
d D
ive
rsit
y
D J k 1 C h IC E B
5 0
6 0
7 0
8 0
9 0
1 0 0
1 1 0
1 2 0
1 3 0
1 4 0
1 5 0
Observed species number Jackknife
Chao
ICE
Bayesian
Modeling exercise
• Parametric estimators either failed to converge or produced extremely biased results.
• When no species were very rare and no species had aggregation pattern most estimators worked well, but then so did the naïve estimator D.
• Some of the coverage-based estimators were relatively robust to the differences among the scenarios we tested.
• Diversity estimation is a delicate task.
• It should be aided by assessment of the patterns of species density and aggregation.