Embed Size (px)
Citation preview
Journal of Hydrology 376 (2009) 116–125
Contents lists available at ScienceDirect
Journal of Hydrology
journal homepage: www.elsevier .com/locate / jhydrol
Biological flocculation of suspended particles in nutrient-rich aqueous ecosystems
Federico Maggi *
School of Civil Engineering, The University of Sydney, Bld. J05, 2006 Sydney, AustraliaCivil and Environmental Engineering, Berkeley Water Center, 413 O’Brien Hall, University of California, Berkeley, CA 94720-1710, USA
a r t i c l e i n f o s u m m a r y
Article history:Received 21 November 2008Received in revised form 1 May 2009Accepted 7 July 2009
This manuscript was handled by L. Charlet,Editor-in-Chief, with the assistance of EddyY. Zeng, Associate Editor
Keywords:FlocculationSuspended matter dynamicsMicrobial biomassFloc sizeSettling velocityFractal dimension
0022-1694/$ - see front matter � 2009 Elsevier B.V. Adoi:10.1016/j.jhydrol.2009.07.040
* Tel.: +612 9351 2115.E-mail addresses: [email protected], fmaggi@lbl
We describe the development and testing of a mechanistic model (BFLOC) to predict the average size ofsediment aggregates in nutrient-rich aqueous ecosystems. The original capability of BFLOC is to coupleturbulence-induced flocculation of suspended minerals and micro-organisms with the nutrient-relateddynamics of aggregate-attached micro-organisms. The model, calibrated and validated against the aver-age floc size recorded at two stations in the Belgian North Sea [Fettweis, M., Francken, F., Pison V., Ven denEynde, D., 2006. Suspended particulate matter dynamics and aggregate sizes in a high turbidity area.Marine Geology 235, 63–74], closely captured site conditions and significantly clarified interpretationof field measurements. Modeling results indicated that an accurate prediction of time-varying floc sizeswas possible only by taking into account the organic fraction of the suspended particle matter and themicro-organism colonization of the floc micro-environment. BFLOC showed that the floc excess densitystrongly correlated with the floc biomass volume, while the settling velocity strongly correlated withthe floc mineral volume. We noticed that the settling velocity was poorly correlated with the total flocvolume (and floc size), suggesting a revision of current methods that assess suspended matter depositionuniquely on the basis of the floc size.
Additionally, various hypotheses tested with BFLOC suggested that the effect of aggregate-attachedbiomass on aggregation and breakup rates was very small when it was accounted for with a first-orderdescription. More generally, the sediment and biomass parameters found here were nearly site indepen-dent suggesting that the mechanistic approach of BFLOC was relatively robust.
� 2009 Elsevier B.V. All rights reserved.
Introduction
The dynamics and biochemical functions of suspended particlematter (SPM) in natural aqueous environments is of particularinterest in relation to morphodynamic changes of estuaries, rivers,lakes, coastal zones (e.g., Dyer, 1989; Seminara and Blodeaux,2001; McAnally and Mehta, 2001), biogeochemical nutrient cycling(e.g., denitrification Knowles, 1982; Herbert, 1999; Laverman et al.,2006), organic carbon and contaminant segregation to deep sea(e.g., Cho and Azam, 1988; Boyd and Trull, 2007) ecosystem func-tion, water quality, eutrophication, and food web stability (e.g.,Cloern, 2001; Simon et al., 2002).
Natural SPM comprises many different substances with concen-trations that are generally site specific and time varying. Althoughan accurate taxonomy is currently lacking, the SPM can be dividedby inorganic and organic fractions. The inorganic fraction mainlyconsists of various fine cohesive minerals (e.g., kaolinite, illite,montmorillonite, carbonate, Van Leussen, 1994; McAnally, 1999).The organic fraction of the SPM is prevalently made of a varietyof micro-organisms, their metabolic products (extracellular poly-
ll rights reserved.
.gov
meric substances – EPS, and transparent exopolymeric particles –TEP), residuals from dead organisms, and fecal pellets (Simonet al., 2002; Grossart et al., 2003a,b; Riebesell, 1991a,b; Crumpand Baross, 2000; Bhaskar et al., 2005; Alldredge and Silver,1988; Mehta, 1989; Droppo et al., 1997). The two fractions of theSPM are intimately related by physical, biological and chemicalprocesses which make the SPM a complex, reactive biomaterialdistributed in the water body. Flocculation of SPM forms aggre-gates that increase in size by collecting suspended minerals, organ-ic particles, and micro-organisms. These micro-organisms cancolonize the aggregates’ microhabitat by feeding on dissolvedand adsorbed nutrients, dead cells, and grazing on other attachedmicro-organisms and their waste. It has been recognized thataggregate-attached micro-organisms grow at rates up to one orderof magnitude faster as compared to free-living micro-organisms(Riebesell, 1991b; Simon et al., 2002; Azua et al., 2003), and arepresent at concentrations up to three orders of magnitude higherthan in the surrounding environment (e.g., Stemmann et al.,2004). These aspects suggest that floc microbial colonization cansubstantially contribute to increase the aggregate size. Althoughfloc colonization depends on environmental conditions amongwhich SPM concentration and mineralogy, shear rate, temperature,light exposure, nutrient concentration, and oxygen concentration,
Nomenclature
c [g l�1] suspended particle matter concentrationcM [g l�1] suspended mineral concentrationcB [g l�1] suspended biomass concentrationd [–] fractal dimensionFy [N] floc strengthG [s�1] turbulent shear rateL [lm] floc sizeLp [lm] primary particle sizek0a ½—� aggregation parameterk0b ½—� breakup parameterKm [mol l�1] half-saturation concentrationK [mm3] floc carrying capacityN [mol l�1] nutrient concentration
t [h] timev [m s�1] floc settling velocityV [mm3] floc volumeVM [mm3] floc mineral volumeVB [mm3] floc biomass volumeDqe [kg m�3] floc excess densitygmax [s�1] maximum specific growth rateX suspended matter biomass fractionq [kg m�3] floc specific weightqM [kg m�3] mineral specific weightqB [kg m�3] biomass specific weightqw [kg m�3] water specific weightf [–] floc biomass volume fraction
F. Maggi / Journal of Hydrology 376 (2009) 116–125 117
the capability of suspended aggregates to capture nutrients is themajor factor controlling microbial growth within the aggregate.
There is a general consensus that the interaction between sus-pended minerals and micro-organisms may exert manifold im-pacts on chemical and mechanical floc responses. Experiments incontrolled conditions and field observations have given evidencethat the organic matter had substantial effects on flocculation time,floc size, density, and settling velocity (Avnimelech et al., 1982;Guenther and Bozelli, 2004; Passow and De La Rocha, 2006; Bow-ers et al., 2007). Furthermore, it is generally accepted that EPS andTEP increase the SPM aggregation efficiency (e.g., Kiorboe et al.,1990), while relatively little is known about the effect on flocbreakup (e.g., Alldredge et al., 1990).
Mechanistic models to describe the interaction between min-eral particles and micro-organisms are an instrumental aid tointerpreting SPM dynamics. Models for particle aggregation andsettling based on the coagulation theory (Smoluchowski, 1917)and Stokes’ equations have been used to describe the dynamicsof suspended clays in many instances (e.g., Edzwald et al., 1974;O’Melia, 1980; O’Melia, 1986; Lick and Lick, 1988; Mehta et al.,1989; Lick et al., 1993; Spicer et al., 1996; Serra and Casamitjana,1998; Winterwerp, 1998; Rahmani et al., 2003; Maggi, 2007). Sim-ilar approaches have been employed to model micro-organismsbloom and aggregation (Jackson, 1990; Kiorboe, 2001; Thornton,2002; Stemmann et al., 2004), aggregate colonization (e.g., Kiorboe,2003), and coastal waters eutrophication (e.g., Lacroix et al., 2007).Yet, none of these works explicitly coupled mineral and biomassdynamics at length scales comparable to the floc size, thus leavinga serious gap in our understanding of the feedback betweenmineral particles and micro-organisms. Coupling mineral andmicro-organism dynamics represents therefore the best target tounderstand the implication and fate of biomass-affected sus-pended sediment that commonly occur in natural conditions.
The aim of this work is to develop and test a mechanistic model(BFLOC) of floc formation and sinking following simultaneous floc-culation of mineral and organic SPM, and growth of aggregate-attached micro-organisms in nutrient-rich conditions.
We use experimental observations of SPM concentration, turbu-lent shear rate and average floc size collected in the Belgian NorthSea by (Fettweis et al., 2006) to calibrate and test BFLOC. The re-sults from numerical simulations focus on: (i) the differences infloc size evolution in biomass-free and biomass-affected condi-tions, (ii) the relative dynamics of mineral and biomass within afloc, (iii) the effect of biomass dynamics on floc excess densityand settling velocity, and (iv) the effect of biomass dynamics onaggregation and breakup rates. Finally, we summarize someachievements of BFLOC and we discuss important directions formodel improvement.
Methods
Experimental data
In situ recordings of SPM concentration, turbulent shear rate,and floc size were carried out in the Belgian zone of the NorthSea (sea water) at the Zeebrugge site for 13 h from 8:00 PM ofday 8 September 2003, and at the Kwinte Bank site from day 2March 2004 for 43 h (Fettweis et al., 2006). The measurements atthe Zeebrugge site were located inside the high turbidity area,while at the Kwinte Bank were carried out just outside or at theedge of the high turbidity zone. The water depth at the Zeebruggesize is less than about 10 m below MLLWS (Mean Low Low WaterSpring level), whereas at the Kwinte Bank the depth varies from 5to 22 m below MLLWS in the swales. The hydrodynamics in thearea is mainly determined by tides. Because of the shallownessof the area waves may have an important influence on sedimenttransport. The high tidal ranges (mean spring range is 4.6 m, meanneap amplitude is 3.0 m) and tidal velocities (maximum 1.0 m s�1)result in generally well mixed waters. The winds are mainly fromthe southwest or the northeast. The significant wave height atabout 20 km offshore is below 2.0 m 87% of the time. The SPM con-centration has a characteristic distribution in the Belgian Dutchcoastal zone, which is due to hydrodynamics, prevailing winds, in-put of suspended matter (mainly) from the English Channel, andre-suspension and/or erosion of recent and old fine grained sedi-ments. SPM concentrations of minimum 20 � 70 mg/l and maxi-mum 100 � 600 mg/l have been measured in the high turbidityarea. These variations are seasonal and, on smaller time scales,due to tides, neap-spring tidal cycles, storm events (erosion), andwind.
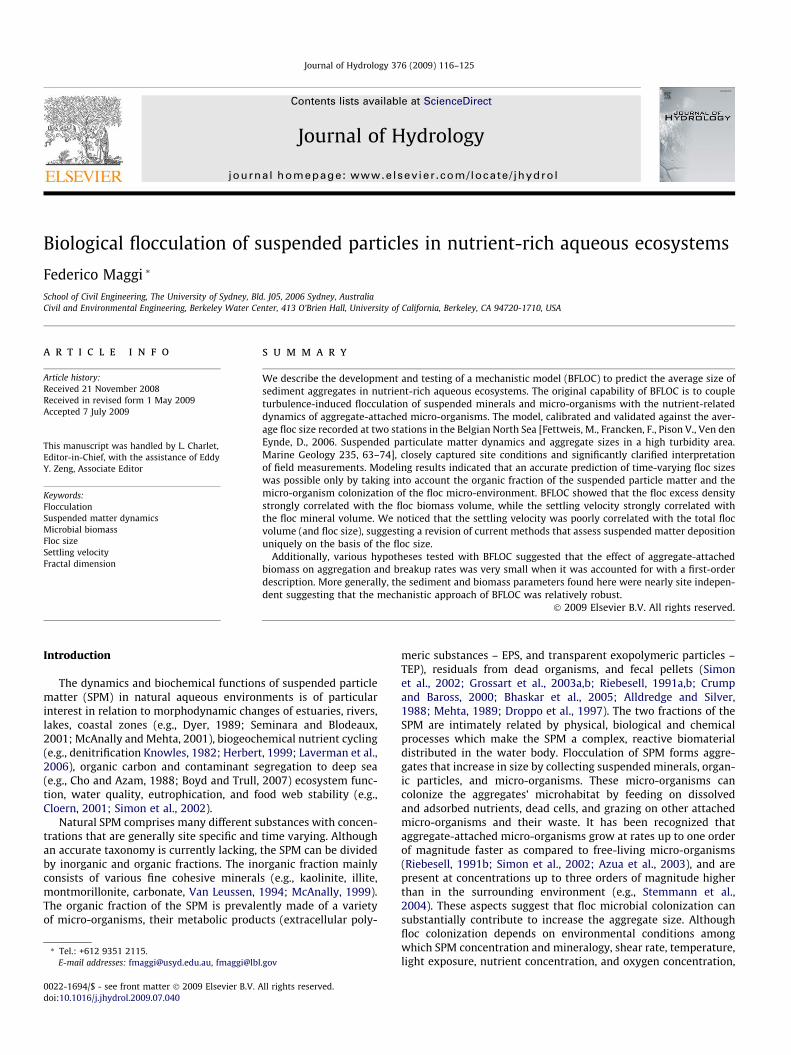
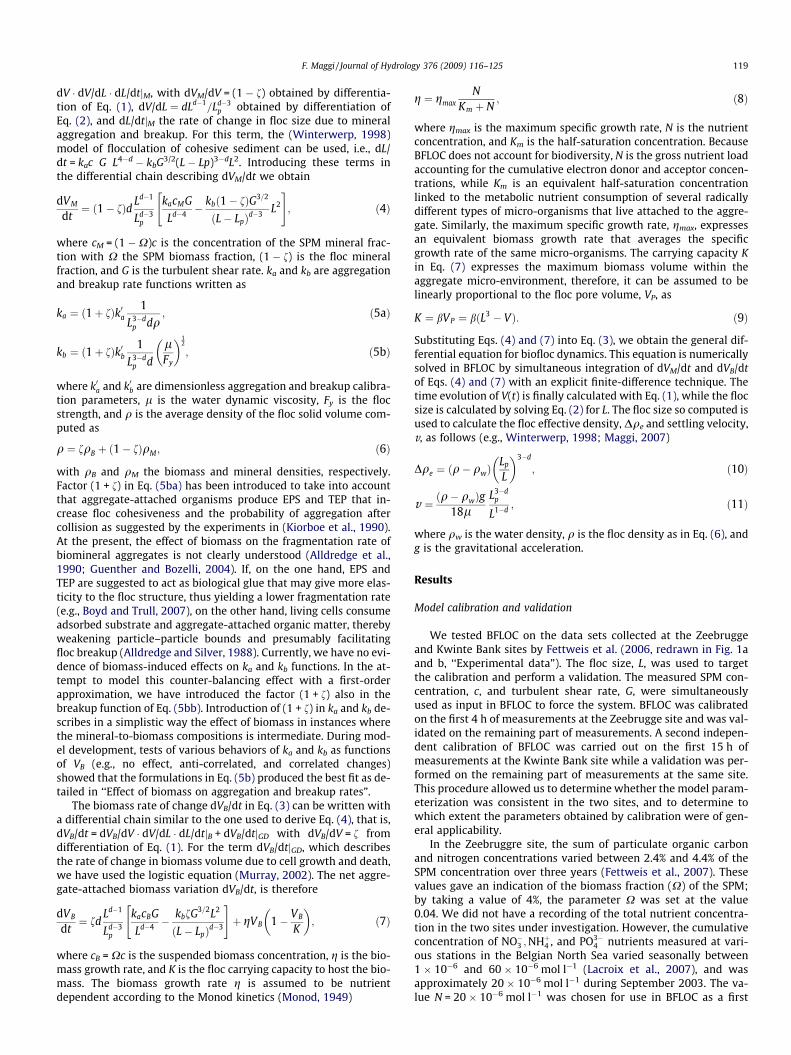
The SPM concentration was measured with an optical backscat-ter turbidity sensor (OBS), while current velocity was measuredwith Acustic Doppler Current Profilers (ADCP) (at the Zeebruggesite) or modeled with COHERENS-3D (at the Kwinte Bank), andused to estimate the Kolmogorov microscale and turbulent shearrate G (Fig. 1a and c). The floc size was measured with a laser in-situ scattering and transmissometer LISST 100C (Fig. 1b and d).More details on site, numerical modeling, and sampling techniquescan be found in (Fettweis et al., 2006).
The experimental data represented in Fig. 1 were used to cali-brate and validate BFLOC as described in ‘‘Model calibration andvalidation”.
Model description
As already mentioned in ‘‘Introduction”, the SPM is an intricateensemble of mineral and organic particles of various sizes and
0 2 4 6 8 10 12 140
0.1
0.2
SPM
[g/l]
Time [h]
(a)
Zeebrugge
0
10
20
G [1
/s]
SPMG
0 2 4 6 8 10 12 140
50
100
150
Time [h]
L [μ
m]
(b)
Zeebrugge
0 10 20 30 40 500
0.02
0.04
0.06
0.08
0.1
SPM
[g/l]
Time [h]
(c)Kwinte Bank0
2
4
6
8
10
G [1
/s]
SPMG
0 10 20 30 40 5050
100
150
200
Time [h]
L [μ
m]
(d)Kwinte Bank
Fig. 1. (a) and (b) suspended matter concentration (SPM), turbulent shear rate, G, and average floc size, L, measured during the campaign in September 2003 at Zeebruggesite. (c) and (d) same quantities recorded at Kwinte Bank site during the survey carried out in March 2004. The data sets redrawn here were kindly provided by MichaelFettweis Fettweis et al., 2006.
118 F. Maggi / Journal of Hydrology 376 (2009) 116–125
physico-chemical properties that includes diverse micro-organ-isms. To frame the complicated structure of natural SPM, we con-ceptualize the BFLOC model around two major pools: (1) themineral fraction of the SPM, which describes the inorganic partic-ulate, and (2) the biomass fraction of the SPM, which describes theorganic particulate. The biomass fraction defined above comprisesall organic particles and, therefore, embeds into a single pool bothliving and non-living particulate. The biomass fraction so definedhas to be intended as a proxy of the effective concentration of mi-cro-organisms. The extent to which this simplification is validstrongly depends on the actual characteristics of the SPM organicfraction. In instances where the fraction of living micro-organismsversus other organic particles is high, this definition of biomassapproximates well the total micro-organism load. Conversely, ifthe concentration of micro-organisms is low then a different poolstructure may be introduced to describe living micro-organismsas a subfraction of the organic fraction of the SPM. In the measure-ments performed at the Zeebrugge and Kwinte Bank sites in 2003,the fraction of living organisms within the organic fraction of theSPM varied seasonally from 4–10% during winter up to 40–65%during summer (Rousseau personal communication). Because thedata sets used here were collected in early September at the Zee-brugge site and early March at the Kwinte Bank site, we can rea-sonable assume that 30–50% of the organic fraction of the SPMwas made of living organisms. Under this circumstances, a sin-gle-pool description of the biomass, comprising both living andnon-living organisms, was used. This model structure allows totreat in a relatively simple way the mathematics describing theinteraction between mineral and organic fractions of the SPM, taskwhich otherwise would be more difficult as compared to the for-mulations presented in this section.
The Lagrangian model BFLOC describes floc dynamics as super-imposed contribution of mineral and biomass dynamics. The flocsolid volume V is described by the sum of the mineral and biomassvolumes, VM and VB, respectively, as
V ¼ VM þ VB ¼ ð1� fÞV þ fV ; ð1Þ
where f = VB/V represents the floc biomass fraction, and (1 � f) rep-resents the mineral fraction. We assume that flocs have fractalgeometry, and that floc volume can be scaled with its size L as
V ¼ vpLLp
� �d
¼ Ld
Ld�3p
; ð2Þ
where d is the floc fractal dimension, and Lp and vp ¼ L3p are the size
and volume, respectively, of the primary particles, i.e., the flocbuilding units. We assume that the primary particles are stable bio-mineral micro-clusters mono-distributed in size. Normally, realSPM primary particles are not monodistributed in size; the situa-tions under which neglecting a primary particle distribution can af-fect floc description is limited to the early stage of flocculation,when the floc size is only few (<10) times larger than the primaryparticles. The error introduced by the assumption of monodistribut-ed primary particles becomes rapidly small when flocs increase tosizes larger than 10 times the primary particle size, and becomenegligible for sizes above 100 times the primary particle size.
Any change in floc volume, V (t), results from changes in mineralor biomass volumes as
dVdt¼ dVM
dtþ dVB
dt: ð3Þ
Because mineral and biomass fractions possess cohesive properties,the terms dVM/dt and dVB/dt account for aggregation and breakupprocesses, that is, the floc volume increases due to aggregation ofsuspended minerals and biomass, and decreases due to detachmentof minerals and biomass from the floc. Additionally, the floc volumeincreases and decreases due to growth and death of aggregate-at-tached micro-organisms, contributions which are accounted for interm dVB/dt. The terms dVM/dt and dVB/dt are defined as follows.
The rate of change dVM/dt in Eq. (3) can be written in terms offloc size L by means of the differential chain dVM/dt = dVM/
F. Maggi / Journal of Hydrology 376 (2009) 116–125 119
dV � dV/dL � dL/dtjM, with dVM/dV = (1 � f) obtained by differentia-tion of Eq. (1), dV/dL ¼ dLd�1
=Ld�3p obtained by differentiation of
Eq. (2), and dL/dtjM the rate of change in floc size due to mineralaggregation and breakup. For this term, the (Winterwerp, 1998)model of flocculation of cohesive sediment can be used, i.e., dL/dt = kac G L4�d � kbG3/2(L � Lp)3�dL2. Introducing these terms inthe differential chain describing dVM/dt we obtain
dVM
dt¼ ð1� fÞd Ld�1
Ld�3p
kacMG
Ld�4 �kbð1� fÞG3=2
ðL� LpÞd�3 L2
" #; ð4Þ
where cM = (1 �X)c is the concentration of the SPM mineral frac-tion with X the SPM biomass fraction, (1 � f) is the floc mineralfraction, and G is the turbulent shear rate. ka and kb are aggregationand breakup rate functions written as
ka ¼ ð1þ fÞk0a1
L3�dp dq
; ð5aÞ
kb ¼ ð1þ fÞk0b1
L3�dp d
lFy
� �12
; ð5bÞ
where k0a and k0b are dimensionless aggregation and breakup calibra-tion parameters, l is the water dynamic viscosity, Fy is the flocstrength, and q is the average density of the floc solid volume com-puted as
q ¼ fqB þ ð1� fÞqM; ð6Þ
with qB and qM the biomass and mineral densities, respectively.Factor (1 + f) in Eq. (5ba) has been introduced to take into accountthat aggregate-attached organisms produce EPS and TEP that in-crease floc cohesiveness and the probability of aggregation aftercollision as suggested by the experiments in (Kiorboe et al., 1990).At the present, the effect of biomass on the fragmentation rate ofbiomineral aggregates is not clearly understood (Alldredge et al.,1990; Guenther and Bozelli, 2004). If, on the one hand, EPS andTEP are suggested to act as biological glue that may give more elas-ticity to the floc structure, thus yielding a lower fragmentation rate(e.g., Boyd and Trull, 2007), on the other hand, living cells consumeadsorbed substrate and aggregate-attached organic matter, therebyweakening particle–particle bounds and presumably facilitatingfloc breakup (Alldredge and Silver, 1988). Currently, we have no evi-dence of biomass-induced effects on ka and kb functions. In the at-tempt to model this counter-balancing effect with a first-orderapproximation, we have introduced the factor (1 + f) also in thebreakup function of Eq. (5bb). Introduction of (1 + f) in ka and kb de-scribes in a simplistic way the effect of biomass in instances wherethe mineral-to-biomass compositions is intermediate. During mod-el development, tests of various behaviors of ka and kb as functionsof VB (e.g., no effect, anti-correlated, and correlated changes)showed that the formulations in Eq. (5b) produced the best fit as de-tailed in ‘‘Effect of biomass on aggregation and breakup rates”.
The biomass rate of change dVB/dt in Eq. (3) can be written witha differential chain similar to the one used to derive Eq. (4), that is,dVB/dt = dVB/dV � dV/dL � dL/dtjB + dVB/dtjGD with dVB/dV = f fromdifferentiation of Eq. (1). For the term dVB/dtjGD, which describesthe rate of change in biomass volume due to cell growth and death,we have used the logistic equation (Murray, 2002). The net aggre-gate-attached biomass variation dVB/dt, is therefore
dVB
dt¼ fd
Ld�1
Ld�3p
kacBG
Ld�4 �kbfG3=2L2
ðL� LpÞd�3
" #þ gVB 1� VB
K
� �; ð7Þ
where cB = Xc is the suspended biomass concentration, g is the bio-mass growth rate, and K is the floc carrying capacity to host the bio-mass. The biomass growth rate g is assumed to be nutrientdependent according to the Monod kinetics (Monod, 1949)
g ¼ gmaxN
Km þ N; ð8Þ
where gmax is the maximum specific growth rate, N is the nutrientconcentration, and Km is the half-saturation concentration. BecauseBFLOC does not account for biodiversity, N is the gross nutrient loadaccounting for the cumulative electron donor and acceptor concen-trations, while Km is an equivalent half-saturation concentrationlinked to the metabolic nutrient consumption of several radicallydifferent types of micro-organisms that live attached to the aggre-gate. Similarly, the maximum specific growth rate, gmax, expressesan equivalent biomass growth rate that averages the specificgrowth rate of the same micro-organisms. The carrying capacity Kin Eq. (7) expresses the maximum biomass volume within theaggregate micro-environment, therefore, it can be assumed to belinearly proportional to the floc pore volume, VP, as
K ¼ bVP ¼ bðL3 � VÞ: ð9Þ
Substituting Eqs. (4) and (7) into Eq. (3), we obtain the general dif-ferential equation for biofloc dynamics. This equation is numericallysolved in BFLOC by simultaneous integration of dVM/dt and dVB/dtof Eqs. (4) and (7) with an explicit finite-difference technique. Thetime evolution of V(t) is finally calculated with Eq. (1), while the flocsize is calculated by solving Eq. (2) for L. The floc size so computed isused to calculate the floc effective density, Dqe and settling velocity,v, as follows (e.g., Winterwerp, 1998; Maggi, 2007)
Dqe ¼ ðq� qwÞLp
L
� �3�d
; ð10Þ
v ¼ ðq� qwÞg18l
L3�dp
L1�d; ð11Þ
where qw is the water density, q is the floc density as in Eq. (6), andg is the gravitational acceleration.
Results
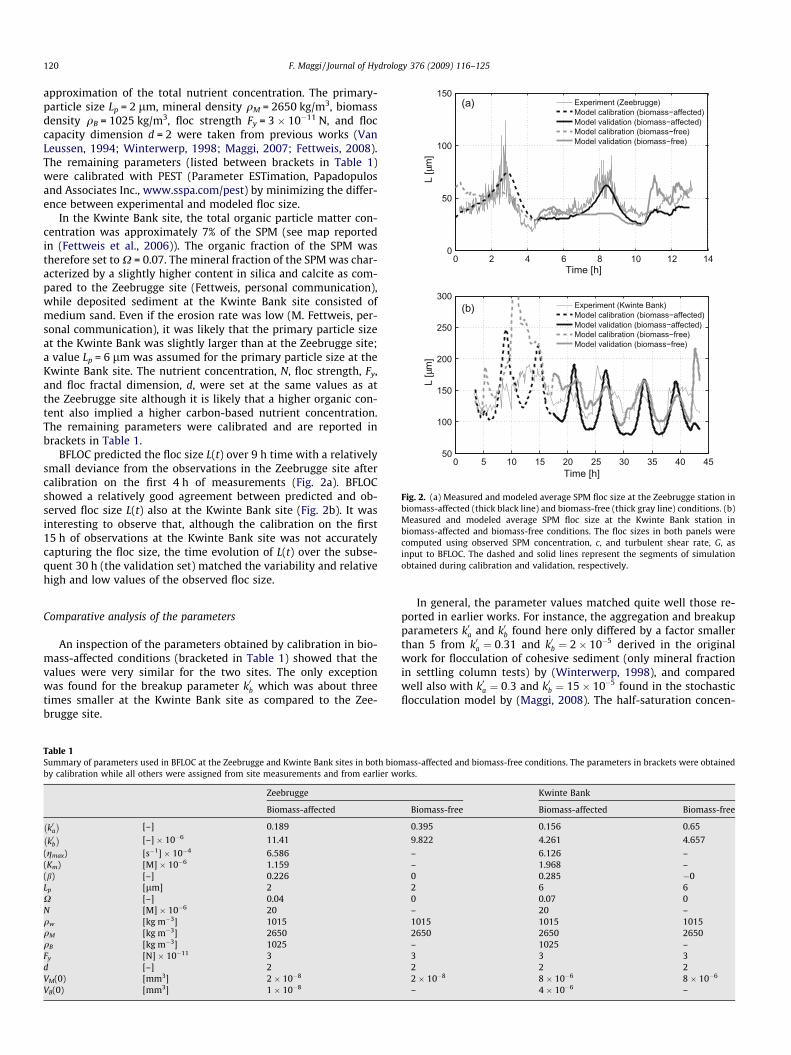
Model calibration and validation
We tested BFLOC on the data sets collected at the Zeebruggeand Kwinte Bank sites by Fettweis et al. (2006, redrawn in Fig. 1aand b, ‘‘Experimental data”). The floc size, L, was used to targetthe calibration and perform a validation. The measured SPM con-centration, c, and turbulent shear rate, G, were simultaneouslyused as input in BFLOC to force the system. BFLOC was calibratedon the first 4 h of measurements at the Zeebrugge site and was val-idated on the remaining part of measurements. A second indepen-dent calibration of BFLOC was carried out on the first 15 h ofmeasurements at the Kwinte Bank site while a validation was per-formed on the remaining part of measurements at the same site.This procedure allowed us to determine whether the model param-eterization was consistent in the two sites, and to determine towhich extent the parameters obtained by calibration were of gen-eral applicability.
In the Zeebruggre site, the sum of particulate organic carbonand nitrogen concentrations varied between 2.4% and 4.4% of theSPM concentration over three years (Fettweis et al., 2007). Thesevalues gave an indication of the biomass fraction (X) of the SPM;by taking a value of 4%, the parameter X was set at the value0.04. We did not have a recording of the total nutrient concentra-tion in the two sites under investigation. However, the cumulativeconcentration of NO�3 ;NHþ4 , and PO3�
4 nutrients measured at vari-ous stations in the Belgian North Sea varied seasonally between1 � 10�6 and 60 � 10�6 mol l�1 (Lacroix et al., 2007), and wasapproximately 20 � 10�6 mol l�1 during September 2003. The va-lue N = 20 � 10�6 mol l�1 was chosen for use in BFLOC as a first
0 2 4 6 8 10 12 140
50
100
150
Time [h]
L [μ
m]
(a) Experiment (Zeebrugge)Model calibration (biomass−affected)Model validation (biomass−affected)Model calibration (biomass−free)Model validation (biomass−free)
0 5 10 15 20 25 30 35 40 4550
100
150
200
250
300
Time [h]
L [μ
m]
(b) Experiment (Kwinte Bank)Model calibration (biomass−affected)Model validation (biomass−affected)Model calibration (biomass−free)Model validation (biomass−free)
Fig. 2. (a) Measured and modeled average SPM floc size at the Zeebrugge station inbiomass-affected (thick black line) and biomass-free (thick gray line) conditions. (b)Measured and modeled average SPM floc size at the Kwinte Bank station inbiomass-affected and biomass-free conditions. The floc sizes in both panels werecomputed using observed SPM concentration, c, and turbulent shear rate, G, asinput to BFLOC. The dashed and solid lines represent the segments of simulationobtained during calibration and validation, respectively.
120 F. Maggi / Journal of Hydrology 376 (2009) 116–125
approximation of the total nutrient concentration. The primary-particle size Lp = 2 lm, mineral density qM = 2650 kg/m3, biomassdensity qB = 1025 kg/m3, floc strength Fy = 3 � 10�11 N, and floccapacity dimension d = 2 were taken from previous works (VanLeussen, 1994; Winterwerp, 1998; Maggi, 2007; Fettweis, 2008).The remaining parameters (listed between brackets in Table 1)were calibrated with PEST (Parameter ESTimation, Papadopulosand Associates Inc., www.sspa.com/pest) by minimizing the differ-ence between experimental and modeled floc size.
In the Kwinte Bank site, the total organic particle matter con-centration was approximately 7% of the SPM (see map reportedin (Fettweis et al., 2006)). The organic fraction of the SPM wastherefore set to X = 0.07. The mineral fraction of the SPM was char-acterized by a slightly higher content in silica and calcite as com-pared to the Zeebrugge site (Fettweis, personal communication),while deposited sediment at the Kwinte Bank site consisted ofmedium sand. Even if the erosion rate was low (M. Fettweis, per-sonal communication), it was likely that the primary particle sizeat the Kwinte Bank was slightly larger than at the Zeebrugge site;a value Lp = 6 lm was assumed for the primary particle size at theKwinte Bank site. The nutrient concentration, N, floc strength, Fy,and floc fractal dimension, d, were set at the same values as atthe Zeebrugge site although it is likely that a higher organic con-tent also implied a higher carbon-based nutrient concentration.The remaining parameters were calibrated and are reported inbrackets in Table 1.
BFLOC predicted the floc size L(t) over 9 h time with a relativelysmall deviance from the observations in the Zeebrugge site aftercalibration on the first 4 h of measurements (Fig. 2a). BFLOCshowed a relatively good agreement between predicted and ob-served floc size L(t) also at the Kwinte Bank site (Fig. 2b). It wasinteresting to observe that, although the calibration on the first15 h of observations at the Kwinte Bank site was not accuratelycapturing the floc size, the time evolution of L(t) over the subse-quent 30 h (the validation set) matched the variability and relativehigh and low values of the observed floc size.
Comparative analysis of the parameters
An inspection of the parameters obtained by calibration in bio-mass-affected conditions (bracketed in Table 1) showed that thevalues were very similar for the two sites. The only exceptionwas found for the breakup parameter k0b which was about threetimes smaller at the Kwinte Bank site as compared to the Zee-brugge site.
Table 1Summary of parameters used in BFLOC at the Zeebrugge and Kwinte Bank sites in both bioby calibration while all others were assigned from site measurements and from earlier w
Zeebrugge
Biomass-affected
k0a� �
[–] 0.189
k0b� �
[–] � 10�6 11.41
(gmax) [s�1] � 10�4 6.586(Km) [M] � 10�6 1.159(b) [–] 0.226Lp [lm] 2X [–] 0.04N [M] � 10�6 20qw [kg m�3] 1015qM [kg m�3] 2650qB [kg m�3] 1025Fy [N] � 10�11 3d [–] 2VM(0) [mm3] 2 � 10�8
VB(0) [mm3] 1 � 10�8
In general, the parameter values matched quite well those re-ported in earlier works. For instance, the aggregation and breakupparameters k0a and k0b found here only differed by a factor smallerthan 5 from k0a ¼ 0:31 and k0b ¼ 2� 10�5 derived in the originalwork for flocculation of cohesive sediment (only mineral fractionin settling column tests) by (Winterwerp, 1998), and comparedwell also with k0a ¼ 0:3 and k0b ¼ 15� 10�5 found in the stochasticflocculation model by (Maggi, 2008). The half-saturation concen-
mass-affected and biomass-free conditions. The parameters in brackets were obtainedorks.
Kwinte Bank
Biomass-free Biomass-affected Biomass-free
0.395 0.156 0.65
9.822 4.261 4.657
– 6.126 –– 1.968 –0 0.285 �02 6 60 0.07 0– 20 –1015 1015 10152650 2650 2650– 1025 –3 3 32 2 22 � 10�8 8 � 10�6 8 � 10�6
– 4 � 10�6 –
F. Maggi / Journal of Hydrology 376 (2009) 116–125 121
trations Km = 1.16 � 10�6 mol l�1 and Km = 1.97 � 10�6 mol l�1 atthe two sites were very similar to Km � 10�6 mol l�1 reported in(Ploug and Grossart, 1999), whereas the maximum specific growthrates gmax = 6.58 � 10�4 s�1 and gmax = 6.12 � 10�4 s�1 were oneorder of magnitude higher than approximately 10�5 s�1 found in(Kiorboe, 2003). The difference in gmax can presumably be ascribedto the fact that BFLOC does not take into account microbial biodi-versity whereas the value mentioned above from (Kiorboe, 2003)was species specific. It is likely that modeling a consortium of dif-ferent micro-organisms as an equivalent biomass averages out awide range of growth rate values. However, more importantly, mi-cro-organisms attached to mixed organic and mineral aggregateshave been observed to grow at rates up to one order of magnitudefaster as compared to free-living micro-organisms (Riebesell,1991b; Simon et al., 2002; Azua et al., 2003). This may explainthe difference with the growth rate in Kiorboe’s experiments,which were performed on non-mixed (i.e., mainly organic)aggregates.
Monte Carlo sensitivity analysis
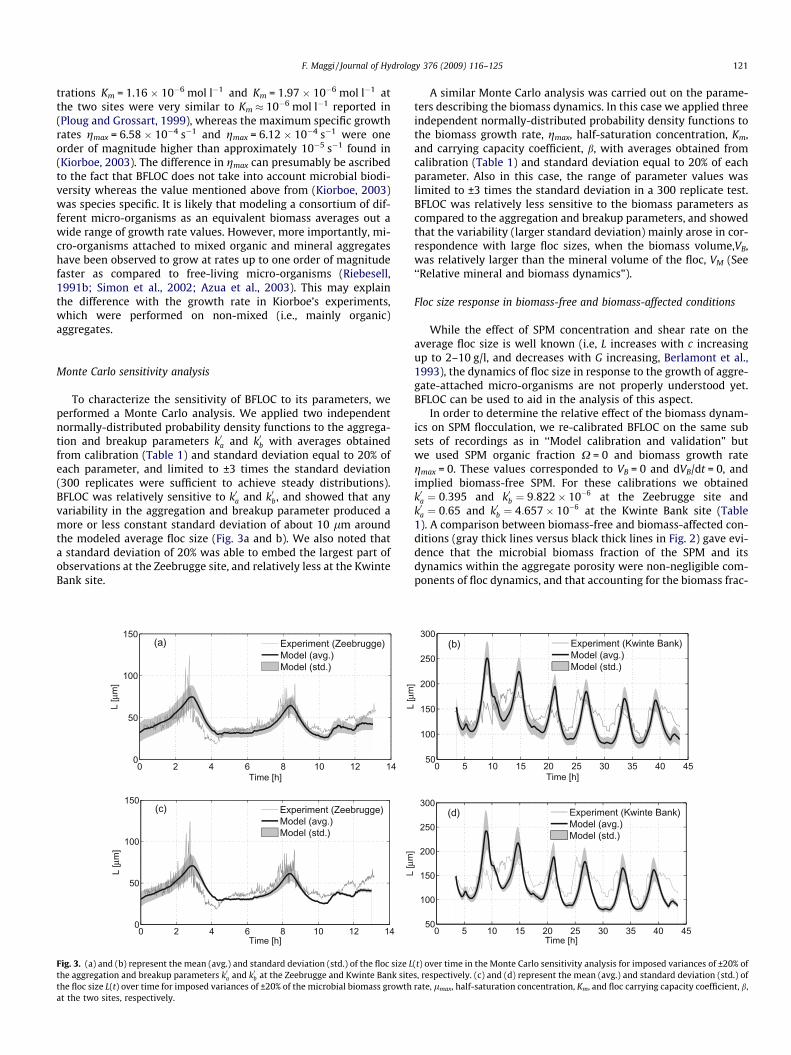
To characterize the sensitivity of BFLOC to its parameters, weperformed a Monte Carlo analysis. We applied two independentnormally-distributed probability density functions to the aggrega-tion and breakup parameters k0a and k0b with averages obtainedfrom calibration (Table 1) and standard deviation equal to 20% ofeach parameter, and limited to ±3 times the standard deviation(300 replicates were sufficient to achieve steady distributions).BFLOC was relatively sensitive to k0a and k0b, and showed that anyvariability in the aggregation and breakup parameter produced amore or less constant standard deviation of about 10 lm aroundthe modeled average floc size (Fig. 3a and b). We also noted thata standard deviation of 20% was able to embed the largest part ofobservations at the Zeebrugge site, and relatively less at the KwinteBank site.
Time [h]
L [μ
m]
(a)
0 2 4 6 8 10 12 140
50
100
150Experiment (Zeebrugge)Model (avg.)Model (std.)
Time [h]
L [μ
m]
(c)
0 2 4 6 8 10 12 140
50
100
150Experiment (Zeebrugge)Model (avg.)Model (std.)
Fig. 3. (a) and (b) represent the mean (avg.) and standard deviation (std.) of the floc size Lthe aggregation and breakup parameters k0a and k0b at the Zeebrugge and Kwinte Bank sitethe floc size L(t) over time for imposed variances of ±20% of the microbial biomass growthat the two sites, respectively.
A similar Monte Carlo analysis was carried out on the parame-ters describing the biomass dynamics. In this case we applied threeindependent normally-distributed probability density functions tothe biomass growth rate, gmax, half-saturation concentration, Km,and carrying capacity coefficient, b, with averages obtained fromcalibration (Table 1) and standard deviation equal to 20% of eachparameter. Also in this case, the range of parameter values waslimited to ±3 times the standard deviation in a 300 replicate test.BFLOC was relatively less sensitive to the biomass parameters ascompared to the aggregation and breakup parameters, and showedthat the variability (larger standard deviation) mainly arose in cor-respondence with large floc sizes, when the biomass volume,VB,was relatively larger than the mineral volume of the floc, VM (See‘‘Relative mineral and biomass dynamics”).
Floc size response in biomass-free and biomass-affected conditions
While the effect of SPM concentration and shear rate on theaverage floc size is well known (i.e, L increases with c increasingup to 2–10 g/l, and decreases with G increasing, Berlamont et al.,1993), the dynamics of floc size in response to the growth of aggre-gate-attached micro-organisms are not properly understood yet.BFLOC can be used to aid in the analysis of this aspect.
In order to determine the relative effect of the biomass dynam-ics on SPM flocculation, we re-calibrated BFLOC on the same subsets of recordings as in ‘‘Model calibration and validation” butwe used SPM organic fraction X = 0 and biomass growth rategmax = 0. These values corresponded to VB = 0 and dVB/dt = 0, andimplied biomass-free SPM. For these calibrations we obtainedk0a ¼ 0:395 and k0b ¼ 9:822� 10�6 at the Zeebrugge site andk0a ¼ 0:65 and k0b ¼ 4:657� 10�6 at the Kwinte Bank site (Table1). A comparison between biomass-free and biomass-affected con-ditions (gray thick lines versus black thick lines in Fig. 2) gave evi-dence that the microbial biomass fraction of the SPM and itsdynamics within the aggregate porosity were non-negligible com-ponents of floc dynamics, and that accounting for the biomass frac-
Time [h]
L [μ
m]
(b)
0 5 10 15 20 25 30 35 40 4550
100
150
200
250
300Experiment (Kwinte Bank)Model (avg.)Model (std.)
Time [h]
L [μ
m]
(d)
0 5 10 15 20 25 30 35 40 4550
100
150
200
250
300Experiment (Kwinte Bank)Model (avg.)Model (std.)
(t) over time in the Monte Carlo sensitivity analysis for imposed variances of ±20% ofs, respectively. (c) and (d) represent the mean (avg.) and standard deviation (std.) ofrate, lmax, half-saturation concentration, Km, and floc carrying capacity coefficient, b,
122 F. Maggi / Journal of Hydrology 376 (2009) 116–125
tion enabled a better prediction of the average SPM floc size. Thisaspect was particularly evident at the Zeebrugge site, where exclu-sion of the biomass underestimated the floc size by approximately50 lm around t = 8 h and overestimated it by approximately35 lm around t = 11 h.
The difference between modeled L in biomass-free and bio-mass-affected conditions at Kwinte Bank site was less evident thanat Zeebrugge (Fig. 2b). Except for the first 15 h, where the floc sizewas overestimated by more than 100 lm at about t = 10 h, the im-pact of biomass dynamics on the average floc size was smaller aftert = 15 h as compared to the Zeebrugge site and could be ascribed toa different SPM structure (silica and calcite content, see ‘‘Modelcalibration and validation”), hydrodynamic forcing, aggregationtime, and turbidity (Kwinte Bank is located at the edge of the tur-bidity maximum, while Zeebrugge is at the center).
Relative mineral and biomass dynamics
The time evolutions of V(t),VM(t) and VB(t) had similar patternsin both sites (Fig. 4). Yet, the floc size and volume were morestrongly correlated to VB than to VM at high L-values (small turbu-lence shear rate G), and, conversely, were more correlated to VM atlow L-values (large turbulence shear rate).
A comparison between the normalized values of VM and VB inthe phase space (inserts in Fig. 4) showed that VM and VB changedasynchronously over time with characteristic elongated rings thatoccurred with a small phase lag. In both sites, the biomass volumeVB increased slightly earlier than the mineral volume VM, thus sug-
0 2 4 6 8 10 12 140
0.5
1
1.5 x 10⁻⁵
Time [h]
Volu
me
[mm
3 ]
(a) ZeebruggeV
VM
VB
0 10
1
VM /VM,max
V B /VB,
max
0 5 10 15 20 25 30 35 40 450
1
2
3
4 x 10⁻⁴
Time [h]
Volu
me
[mm
3 ]
(b) Kwinte BankV
VM
VB
0 10
1
VM /VM,max
V B /VB,
max
Fig. 4. Modeled floc volume, V(t), mineral floc volume, VM(t), and biomass flocvolume, VB(t), at the Zeebrugge site, (a), and Kwinte Bank site, (b). The insertsrepresent the biomass volume, VB, as a function of the mineral volume, VM,normalized by their maximum values.
gesting that growth of aggregate-attached biomass fed back aslight increase in VM. This feedback could be ascribed to the factthat ka in Eq. (5ba) increased with VB relatively faster than kb, turn-ing into an overall balance in favor of aggregation and, therefore,facilitating also the aggregation of suspended minerals.
Floc excess density and settling velocity in biomass-free and biomass-affected conditions
The floc size was shown to be strongly affected by aggregate-at-tached micro-organisms (Fig. 2). Nevertheless, the importance ofaccounting for microbial biomass dynamics goes beyond the capa-bility to assess the effect on the floc size and extends to the overallsediment dynamics within the ecosystem. The floc excess density,Dqe, and settling velocity, v, determine the floc residence time inthe water column and are proxy quantities of sediment transportand deposition rates. The excess density and settling velocity ofEqs. (10) and (11) scale with L as Dqe / Ld�3 and v / Ld�1, respec-tively. For the fractal dimension d = 2 used in our simulations,Dqe and v are first-order functions of the floc size L. However, an-other factor as important as L in determining floc dynamics is thedifference in specific density between the microbial biomass andthe minerals, term which appears as first-order in the definitionof q of Eq. (6) and, consequently, in (q � qw) of Eqs. (10) and(11). The difference (qM � qB) can be more than 1600 kg m�3
and, depending on the value of f, it can have a strong effect onDqe and v. The results that follow bring to light the impact of VB
on floc dynamics.Aggregate-attached micro-organisms were found to cause a de-
crease by more than 50% in Dqe at both sites as compared to bio-mass-free conditions (Fig. 5a and b). Similarly, decreases by morethan 70% were found for the settling velocity of biomass-affectedaggregates as compared to biomass-free aggregates (Fig. 5c andd). The correlation coefficients listed in Table 2 show that the flocexcess density Dqe was always more correlated to VB as compared
0 0.4 0.8 1.2x 10⁻⁵
101
102
V [mm3]
Δρe [k
g/m
3 ]
(a)
Zeebrugge
0 1 2 3 4 5x 10⁻⁴
101
102
V [mm3]
(b)Kwinte Bank
20 40 60 800
2.5
5
7.5 x 10⁻⁵
L [μm]
v [m
/s]
(c)
Zeebrugge
Biomass affectedBiomass free
50 100 150 200 2500
0.5
1 x 10⁻³
L [μm]
(d)Kwinte Bank
Fig. 5. (a) and (b) modeled floc excess density, Dqe, as a function of floc volume V inbiomass-affected and biomass-free conditions at the Zeebrugge and Kwinte Banksites, respectively. (c) and (d) modeled floc settling velocity, v, as a function of thefloc size L in biomass-affected and biomass-free conditions at both sites,respectively.
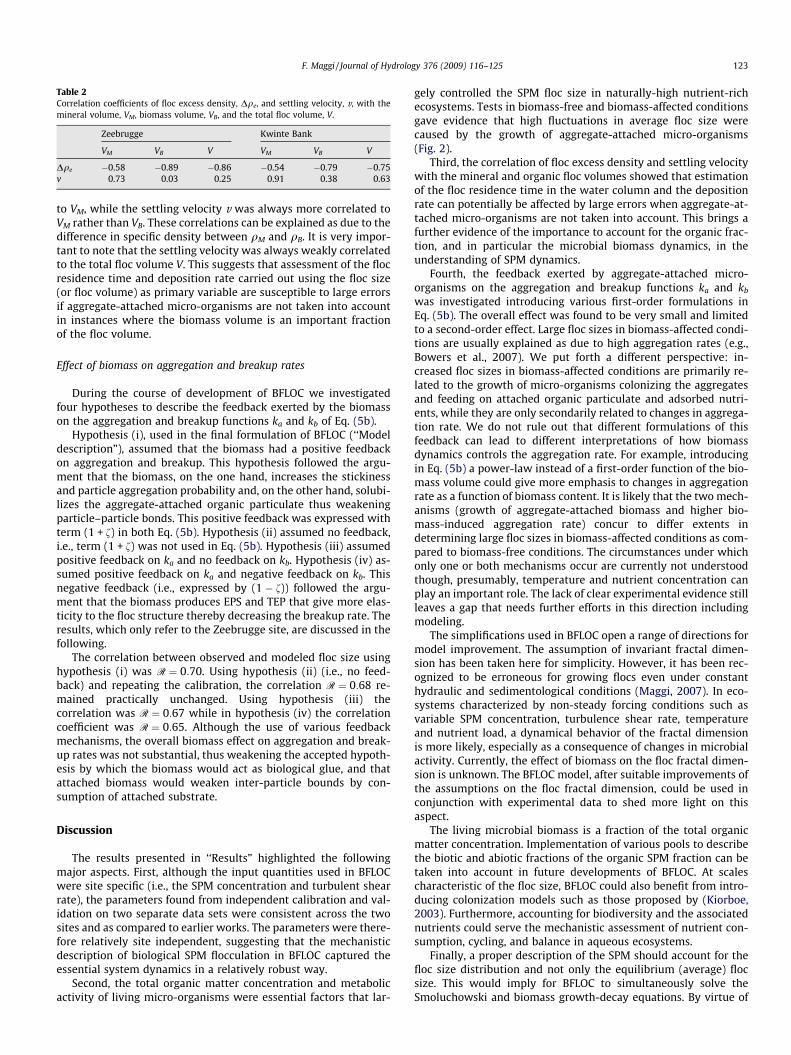
Table 2Correlation coefficients of floc excess density, Dqe, and settling velocity, v, with themineral volume, VM, biomass volume, VB, and the total floc volume, V.
Zeebrugge Kwinte Bank
VM VB V VM VB V
Dqe �0.58 �0.89 �0.86 �0.54 �0.79 �0.75v 0.73 0.03 0.25 0.91 0.38 0.63
F. Maggi / Journal of Hydrology 376 (2009) 116–125 123
to VM, while the settling velocity v was always more correlated toVM rather than VB. These correlations can be explained as due to thedifference in specific density between qM and qB. It is very impor-tant to note that the settling velocity was always weakly correlatedto the total floc volume V. This suggests that assessment of the flocresidence time and deposition rate carried out using the floc size(or floc volume) as primary variable are susceptible to large errorsif aggregate-attached micro-organisms are not taken into accountin instances where the biomass volume is an important fractionof the floc volume.
Effect of biomass on aggregation and breakup rates
During the course of development of BFLOC we investigatedfour hypotheses to describe the feedback exerted by the biomasson the aggregation and breakup functions ka and kb of Eq. (5b).
Hypothesis (i), used in the final formulation of BFLOC (‘‘Modeldescription”), assumed that the biomass had a positive feedbackon aggregation and breakup. This hypothesis followed the argu-ment that the biomass, on the one hand, increases the stickinessand particle aggregation probability and, on the other hand, solubi-lizes the aggregate-attached organic particulate thus weakeningparticle–particle bonds. This positive feedback was expressed withterm (1 + f) in both Eq. (5b). Hypothesis (ii) assumed no feedback,i.e., term (1 + f) was not used in Eq. (5b). Hypothesis (iii) assumedpositive feedback on ka and no feedback on kb. Hypothesis (iv) as-sumed positive feedback on ka and negative feedback on kb. Thisnegative feedback (i.e., expressed by (1 � f)) followed the argu-ment that the biomass produces EPS and TEP that give more elas-ticity to the floc structure thereby decreasing the breakup rate. Theresults, which only refer to the Zeebrugge site, are discussed in thefollowing.
The correlation between observed and modeled floc size usinghypothesis (i) was R ¼ 0:70. Using hypothesis (ii) (i.e., no feed-back) and repeating the calibration, the correlation R ¼ 0:68 re-mained practically unchanged. Using hypothesis (iii) thecorrelation was R ¼ 0:67 while in hypothesis (iv) the correlationcoefficient was R ¼ 0:65. Although the use of various feedbackmechanisms, the overall biomass effect on aggregation and break-up rates was not substantial, thus weakening the accepted hypoth-esis by which the biomass would act as biological glue, and thatattached biomass would weaken inter-particle bounds by con-sumption of attached substrate.
Discussion
The results presented in ‘‘Results” highlighted the followingmajor aspects. First, although the input quantities used in BFLOCwere site specific (i.e., the SPM concentration and turbulent shearrate), the parameters found from independent calibration and val-idation on two separate data sets were consistent across the twosites and as compared to earlier works. The parameters were there-fore relatively site independent, suggesting that the mechanisticdescription of biological SPM flocculation in BFLOC captured theessential system dynamics in a relatively robust way.
Second, the total organic matter concentration and metabolicactivity of living micro-organisms were essential factors that lar-
gely controlled the SPM floc size in naturally-high nutrient-richecosystems. Tests in biomass-free and biomass-affected conditionsgave evidence that high fluctuations in average floc size werecaused by the growth of aggregate-attached micro-organisms(Fig. 2).
Third, the correlation of floc excess density and settling velocitywith the mineral and organic floc volumes showed that estimationof the floc residence time in the water column and the depositionrate can potentially be affected by large errors when aggregate-at-tached micro-organisms are not taken into account. This brings afurther evidence of the importance to account for the organic frac-tion, and in particular the microbial biomass dynamics, in theunderstanding of SPM dynamics.
Fourth, the feedback exerted by aggregate-attached micro-organisms on the aggregation and breakup functions ka and kb
was investigated introducing various first-order formulations inEq. (5b). The overall effect was found to be very small and limitedto a second-order effect. Large floc sizes in biomass-affected condi-tions are usually explained as due to high aggregation rates (e.g.,Bowers et al., 2007). We put forth a different perspective: in-creased floc sizes in biomass-affected conditions are primarily re-lated to the growth of micro-organisms colonizing the aggregatesand feeding on attached organic particulate and adsorbed nutri-ents, while they are only secondarily related to changes in aggrega-tion rate. We do not rule out that different formulations of thisfeedback can lead to different interpretations of how biomassdynamics controls the aggregation rate. For example, introducingin Eq. (5b) a power-law instead of a first-order function of the bio-mass volume could give more emphasis to changes in aggregationrate as a function of biomass content. It is likely that the two mech-anisms (growth of aggregate-attached biomass and higher bio-mass-induced aggregation rate) concur to differ extents indetermining large floc sizes in biomass-affected conditions as com-pared to biomass-free conditions. The circumstances under whichonly one or both mechanisms occur are currently not understoodthough, presumably, temperature and nutrient concentration canplay an important role. The lack of clear experimental evidence stillleaves a gap that needs further efforts in this direction includingmodeling.
The simplifications used in BFLOC open a range of directions formodel improvement. The assumption of invariant fractal dimen-sion has been taken here for simplicity. However, it has been rec-ognized to be erroneous for growing flocs even under constanthydraulic and sedimentological conditions (Maggi, 2007). In eco-systems characterized by non-steady forcing conditions such asvariable SPM concentration, turbulence shear rate, temperatureand nutrient load, a dynamical behavior of the fractal dimensionis more likely, especially as a consequence of changes in microbialactivity. Currently, the effect of biomass on the floc fractal dimen-sion is unknown. The BFLOC model, after suitable improvements ofthe assumptions on the floc fractal dimension, could be used inconjunction with experimental data to shed more light on thisaspect.
The living microbial biomass is a fraction of the total organicmatter concentration. Implementation of various pools to describethe biotic and abiotic fractions of the organic SPM fraction can betaken into account in future developments of BFLOC. At scalescharacteristic of the floc size, BFLOC could also benefit from intro-ducing colonization models such as those proposed by (Kiorboe,2003). Furthermore, accounting for biodiversity and the associatednutrients could serve the mechanistic assessment of nutrient con-sumption, cycling, and balance in aqueous ecosystems.
Finally, a proper description of the SPM should account for thefloc size distribution and not only the equilibrium (average) flocsize. This would imply for BFLOC to simultaneously solve theSmoluchowski and biomass growth-decay equations. By virtue of
124 F. Maggi / Journal of Hydrology 376 (2009) 116–125
the promising results presented here, this could be the mostimportant improvement to widen the applicability of BFLOC in pre-dicting cohesive sediment dynamics and ecosystem stability inbiomass-affected and nutrient-rich aqueous environments.
Conclusions
A comprehensive understanding of suspended particle matterdynamics and its implications in coastal morphodynamics and bio-geochemical ecosystem stability cannot be limited to the mineralfraction as much as it cannot be limited to the microbial fractionand associated nutrients. The model BFLOC proposed here chal-lenged the widespread approach to exclusively accounting eitherfor the mineral or for the organic fraction. BFLOC was developedinvoking the idea that mineral and biomass dynamics are insepara-ble components of the suspended particle matter in natural aque-ous environments.
Major achievements of this work can be summarized as: (i) thedynamics of microbial biomass suspended in the water body led toa non-negligible effect on SPM dynamics and strongly affected theaverage floc size; (ii) floc excess density and settling velocity wereclosely correlated with the microbial biomass and mineral frac-tions, respectively, and were only weakly correlated with the flocvolume and size. These correlations suggested that sediment trans-port can primarily be scaled with the floc biomass volume whilesedimentation rate can mainly be correlated with the mineral flocvolume; (iii) although aggregate-attached micro-organisms canmodify the chemical and physical properties of the aggregates,the overall net effect on aggregation and breakup rates was rela-tively small if accounted for as first-order; and (iv) mineral and or-ganic parameters used in the model were relatively siteindependent, suggesting that the mechanistic description of BFLOCis robust.
Acknowledgements
I am particularly indebted to Michael Fettweis and VeroniqueRousseau for having provided in situ measurements of SPM con-centration, turbulent shear rate, average floc size, and organic mat-ter concentrations, and for the important comments to themanuscript. I thank also James Hunt for his comments to the over-all presentation and content of this work, and an anonymous re-viewer for his beneficial suggestions.
References
Alldredge, A.L., Silver, M.W., 1988. Characteristics, dynamics and significance ofmarine snow. Progress in Oceanography 20, 41–82.
Alldredge, A.L., Granata, T.C., Gotschalk, C.C., Dickey, T.D., 1990. The physicalstrength of marine snow and its implications for particle disaggregation in theocean. Limnology and Oceanography 35 (7), 1415–1428.
Avnimelech, Y., Troeger, B.W., Reed, L.W., 1982. Mutual flocculation of algae andclay: evidence and implications. Science 216 (April), 63–65.
Azua, I., Unane, M., Ayo, B., Artolozaga, I., Arrieta, J.M., Iriberri, J., 2003. Influence oforganic matter quality in the cleavage of polymers by marine bacterialcommunities. Journal of Plankton Research 25 (12), 1451–1460.
Berlamont, J., Ockenden, M., Toorman, E., Winterwerp, J.C., 1993. Thecharacterisation of cohesive sediment properties. Coastal Engineering 21,105–128.
Bhaskar, P.V., Grossart, H.P., Bhosle, N.B., Simon, M., 2005. Production ofmacroaggregates from dissolved exopolymeric substances (EPS) of bacterialand diatom origin. FEMS Microbiology Ecology 53 (2), 255–264.
Bowers, D.G., Binding, C.E., Ellis, K.M., 2007. Satellite remote sensing of thegeographical distribution of suspended particle size in an energetic shelf sea.Estuarine, Coastal and Shelf Science 73, 457–466.
Boyd, P.W., Trull, T.W., 2007. Understanding the export of biogenic particles inoceanic waters: is there consensus? Progress in Oceanography 72 (4), 276–312.
Cho, B.C., Azam, F., 1988. Major role of bacteria in biogeochemical fluxes in theocean’s interior. Nature 332 (March), 441–443.
Cloern, J.E., 2001. Our evolving conceptual model of the coastal eutrophicationproblem. Marine Ecology – Progress Series 210, 223–253.
Crump, B.C., Baross, J.A., 2000. Characterization of the bacterially-active particlefraction in the Columbia River estuary. Marine Ecology – Progress Series 206,13–22.
Droppo, I.G., Leppard, G.G., Flanning, D.T., Liss, S.N., 1997. The freshwater floc: afunctional relationship of water and organic and inorganic floc constituentsaffecting suspended sediment properties. Water, Air and Soil Pollution 99, 43–54.
Dyer, K.R., 1989. Sediment processes in estuaries: future research requirements.Journal of Geophysical Research 94 (c10), 14. 327–332.
Edzwald, J.K., Upchurch, J.B., O’Melia, C.R., 1974. Coagulation in estuaries.Environmental Science and Technology 8 (1), 58–63.
Fettweis, M., 2008. Uncertainty of excess density and settling velocity of mud flocsderived from in situ measurements. Estuarine, Coastal and Shelf Science.doi:10.1016/j.ecss. 2008.01.007.
Fettweis, M., Francken, F., Pison, V., Ven den Eynde, D., 2006. Suspended particulatematter dynamics and aggregate sizes in a high turbidity area. Marine Geology235, 63–74.
Fettweis, M., Francken, F., Ven den Eynde, D., 2007. MOnitoring en MOdellering vanhet cohesieve sedimenttransport en evaluatie van de effecten op het marieneecosysteem ten gevolge van bagger – en stortoperatie (MOMO).Activiteisrapport 2, BMM, Brussel, Belgie.
Grossart, H.P., Hietanen, S., Ploug, H., 2003a. Microbial dynamics on diatomaggregates in Oresund, Denmark. Marine Ecology – Progress Series 249, 69–78.
Grossart, H.P., Kiorboe, T., Tang, K., Ploug, H., 2003b. Bacterial colonization ofparticles: growth and interactions. Applied and Environmental Microbiology 69(6), 3500–3509.
Guenther, M., Bozelli, R., 2004. Factors influencing algae–clay aggregation.Hydrobiologia 523 (1-3), 217–223.
Herbert, R.A., 1999. Nitrogen cycling in coastal marine ecosystems. FEMSMicrobiology Reviews 23 (5), 563–590.
Jackson, G.A., 1990. A model of the formation of marine algal flocs by physicalcoagulation processes. Deep-Sea Research 37 (8), 1197–1211.
Kiorboe, T., 2001. Formation and fate of marine snow: small-scale processes withlarge-scale implications. Scientia Marine 65 (2), 57–71.
Kiorboe, T., 2003. Marine snow microbial communities: scaling of abundances withaggregate size. Aquatic Microbial Ecology 33 (1), 67–75.
Kiorboe, T., Andersen, K.P., Dam, H.G., 1990. Coagulation efficiency and aggregateformation in marine-phytoplankton. Marine Biology 107 (2), 235–245.
Knowles, R., 1982. Denitrification. In: Microbiological Review, pp. 43–70.Lacroix, G., Ruddick, K., Park, Y., Gypens, N., Lancelot, C., 2007. Validation of the 3D
biogeochemical model MIRO & CO with field nutrient and phytoplankton dataand MERIS-derived surface chlorophyll a images. Journal of Marine Systems 64,66–88.
Laverman, A.M., Van Cappellen, P., van Rotterdam-Los, D., Pallud, C., Abell, J., 2006.Potential rates and pathways of microbial nitrate reduction in coastalsediments. FEMS Microbiology Ecology 58 (2), 179–192.
Lick, W., Lick, J., 1988. On the aggregation and disaggregation of fine-grainedsediments. Journal of Great Lakes Research 14 (4), 514–523.
Lick, W., Huang, H., Jepsen, R., 1993. Flocculation of fine-grained sediments due todifferential settling. Journal of Geophysical Research 98 ((C6)-10), 279–288.
Maggi, F., 2007. Variable fractal dimension: a major control for floc structure andflocculation kinematics of suspended cohesive sediment. Journal of GeophysicalResearch. doi:10.1029/2006JC003951.
Maggi, F., 2008. Stochastic flocculation of cohesive sediment: analysis of flocmobility within the floc size spectrum. Water Resources Research 44, W01433.doi:10.1029/ 2007WR006109.
McAnally, W., 1999. Aggregation and deposition of estuarial fine sediment. Ph.D.Thesis, University of Florida, USA.
McAnally, W.H., Mehta, A.J., 2001. Coastal and estuarine fine sediment processes.Proceedings in Marine Science, vol. 3. Elsevier, Amsterdam, The Netherlands.
Mehta, A.J., 1989. On estuarine cohesive sediment suspension behavior. Journal ofGeophysical Research – Oceans 94 (c10), 14303–14314.
Mehta, A.J., Hayter, E.J., Parker, W.R., Krone, R.B., Teeter, A.M., 1989. Cohesivesediment transport 1: process description. Journal of Hydraulic Engineering –ASCE 115 (8), 1076–1093.
Monod, J., 1949. The growth of bacterial cultures. Annual Reviews in Microbiology3, 371–394.
Murray, J.D., 2002. In: Antman, S.S., Marsden, J.E., Sirovich, J., Wiggins, S. (Eds.),Mathematical Biology I. An Introduction, third ed. Springer, p. 51p.
O’Melia, C., 1980. Aquasols: the behaviour of small particles in aquatic systems.ES&T 14 (9), 1052–1060.
O’Melia, C., 1986. The influence of coagulation and sedimentation on the fate ofparticles, associated pollutants, and nutrients in lakes. Chemical Proceeding,207–224.
Passow, U., De La Rocha, C., 2006. Accumulation of mineral ballast on organicaggregates. Global Biogeochemical Cycles 20, GB1013. doi:10.1029/2005GB002579.
Ploug, H., Grossart, H.P., 1999. Bacterial production and respiration in suspendedaggregates – a matter of the incubation method. Aquatic Microbial Ecology 20,21–29.
Rahmani, N., Masliyah, J., Dabros, T., 2003. Characterization of asphaltenesaggregation and fragmentation in a shear field. AIChE Journal 49, 1645–1650.
Riebesell, U., 1991a. Particle aggregation during a diatom bloom: 1 physical aspects.Marine Ecology – Progress Series 69 (3), 273–280.
Riebesell, U., 1991b. Particle aggregation during a diatom bloom: 2 biologicalaspects. Marine Ecology – Progress Series 69 (3), 281–291.
F. Maggi / Journal of Hydrology 376 (2009) 116–125 125
Seminara, G., Blodeaux, P., 2001. River, Coastal and Estuarine Morphodynamics.Springer-Verlag, Berlin, Germany.
Serra, T., Casamitjana, X., 1998. Modelling the aggregation and break-up of fractalaggregates in shear flow. Applied Scientific Research 59, 255–268.
Simon, M., Grossart, H.P., Schweitzer, B., Ploug, H., 2002. Microbial ecology oforganic aggregates in aquatic ecosystems. Aquatic Microbial Ecology 28, 175–211.
Smoluchowski, von M., 1917. Versuch einer Mathematischen Theorie derKoagulationskinetik Kolloidaler Losungen. Zeitschrift fur Physikalische Chemie92, 129–168 (Leipzig, in German).
Spicer, P.T., Pratsinis, S.E., Trennepohl, M.D., Meesters, G.H.M., 1996. Coagulationand fragmentation: the variation of shear rate and time lag for attainment of
steady state. Industrial & Engineering Chemistry Research 35, 3074–3080.
Stemmann, L., Jackson, G.A., Ianson, D., 2004. A vertical model of particle sizedistributions and fluxes in the midwater column that includes biological andphysical processes – part I: model formulation. Deep-Sea Research I –Oceanographic Research Papers 51 (7), 865–884.
Thornton, D.C.O., 2002. Diatom aggregation in the sea: mechanisms and ecologicalimplications. European Journal of Phycology 37 (2), 149–161.
Van Leussen, W., 1994. Estuarine Macroflocs. Ph.D. Thesis, University of Utrecht,The Netherlands.
Winterwerp, J.C., 1998. A simple model for turbulence induced flocculation ofcohesive sediment. Journal of Hydraulic Engineering Research 36 (3), 309–326.


![Electrocoagulation/electroflotation of real printing ... · cations form metal hydroxides in aqueous media.[11] Metal hydroxide species provide effective destabiliza-tion of suspended](https://img.pdfslide.net/doc/110x75/5eb9b0a183e83f52193ff72d/electrocoagulationelectroflotation-of-real-printing-cations-form-metal-hydroxides.jpg)