Embed Size (px)
Citation preview
BIOLOGICAL NUTRIENT REMOVAL FROM INDUSTRIAL
WASTEWATER USING A SEQUENCING BATCH REACTOR
Siphesihle Mangena Khumalo
(21752152)
A dissertation submitted to the Faculty of Engineering and the Built Environment at Durban
University of Technology, KwaZulu-Natal, in fulfilment of the requirements for the degree
of Master of Engineering in the Department of Chemical Engineering.
August, 2018
Supervisor(s): Dr B.F. Bakare Prof S. Rathilal
Page | i
DECLARATION
I, the undersigned Siphesihle Mangena Khumalo hereby declare that,
i. The research reported in this dissertation, except where otherwise indicated, is my own
original work.
ii. This dissertation has not been submitted for any degree or examinations at any other
university.
iii. This dissertation does not contain data, pictures, graphs or other information belonging
to other people, unless specially acknowledged as being sourced from other persons.
iv. This dissertation does not contain the writing of others, unless specifically
acknowledged as being sourced from other researchers. Where other sources have been
quoted then:
a) Their words have been re-written but the general information attributed to them has
been referenced;
b) Where their exact words have been used, their writing has been placed inside
quotations marks, and referenced.
v. Where I have reproduced a publication of which I am an author or co-author, I have
indicated in detail which part of the publication was actually written by myself alone
and have fully referenced such publications.
vi. This dissertation does not contain text, graphics or tables and pasted from the internet,
unless specifically acknowledged, and the source being detailed in the thesis and in the
reference sections.
Siphesihle Mangena Khumalo
As the candidate supervisors we have approved this dissertation for submission
Dr B.F. Bakare Prof. S. Rathilal
Page | ii
DEDICATION
To
My loving and caring mother, Ntombikayise Dlamini and my aunt Mumcy Dlamini all I am or
hope to be, I truly owe to you
And
In memory of my father, Erasmus Khumalo, as well as the ones who were gone before us and
the ones who are yet to come
Page | iii
ACKNOWLEDGEMENTS
John Donne, (1572-1631) one of the greatest poets in history wrote that “no man is an island,
entire of himself”. I would like to express my heartfelt gratitude to the following persons and
organisations for their endless help and support they furnished me during the period I was
conducting this research work. Without their passionate participation and input this study could
not have been successful.
i. My supervisors, Dr B.F. Bakare and Prof S. Rathilal for their passionate support and
supervision.
ii. The Environmental Pollution and Remediation Research Group at Mangosuthu
University of Technology (MUT) and the Durban University of Technology (DUT) for
funding this research work.
iii. The South African Breweries Company for granting me access for sampling.
iv. Mr K.P. Shabangu, (Industrial Technician: Department of Chemical Engineering
MUT) and Mr J. Bwapwa (Lecturer: Department of Civil Engineering MUT) for their
valuable contribution.
Page | iv
ABSTRACT
South Africa is not an exception when it comes to the issue of fresh water scarcity perpetuated
by environmental pollution among many other factors. Industrial wastewater particularly
emanating from the brewing industry, contains high-strength organic, inorganic, and biological
compounds which are toxic to the environment. Due to stringent industrial effluent dewatering
standards enforced by both local and international environmental protection entities, industrial
wastewater cannot be discharged into receiving water bodies prior to treatment.
The overall aim of this study was to evaluate the performance or treatment efficacy of a
laboratory scale sequencing batch reactor on biological nutrient removal using industrial
wastewater from brewery. In this study, two laboratory scale sequencing batch reactors (SBRs)
operated in a cyclic aerobic-anaerobic configuration inoculated with activated sludge were
investigated for their removal of orthophosphates and nitrogen compounds from brewery
wastewater. SBR-1 was investigated for nitrogen group pollutant removal and SBR-2 was
investigated for orthophosphate removal. The findings of the study are reported based on
overall removal efficacies for the following process monitoring parameters: orthophosphates,
ammoniacal nitrogen, total Kjeldahl nitrogen, total nitrogen, total organic nitrogen, total
inorganic nitrogen and NO3-N+NO2-N.
From the investigation, the following overall removal efficacies were obtained: 69%
orthophosphates, 69% ammoniacal nitrogen, 59% total Kjeldahl nitrogen, 60% total nitrogen,
64% total organic nitrogen, 67% total inorganic nitrogen and 56% NO3-N+NO2-N at an organic
loading rate of 3.17 kg Total Chemical Oxygen Demand (TCOD) /m3.day with a food to
microorganism ratio of 2.86 g TCOD/g Volatile Suspended Solids (VSS).day. These removal
efficacies were attained for a hydraulic retention time of 18 hours for both SBRs with a solids
retention time of 5 days for SBR-1 and 7 days for SBR-2.
Both reactors were operated at a mesophilic temperature range of 23 to 26˚C and a pH range
of 5 to 8.5. The temperature was left unadjusted because it was observed that it did not hinder
any microbial activities during the biodegradation process. The Michealis-Menten’s and
Monod models were implemented to study the substrate utilisation rate kinetics and microbial
growth rate kinetics recording 15 141 g COD/m3.day; 12 518 g VSS/g VSS.day; 20 343 g
Page | v
COD/m3.day and 16 860 g VSS/g VSS.day for SBR-1 and SBR-2, respectively. The Monod
model demonstrated a strong correlation fit between the substrate utilisation rate and microbial
growth rate recording a polynomial correlation constant of R2 = 0.947 and 0.9582 for SBR-1
and SBR-2, respectively.
The findings of this study showed that the cyclic aerobic-anaerobic configuration on a
laboratory scale SBR inoculated with activated sludge for treatment of brewery wastewater for
biological nutrients was feasible.
Page | vi
PREFACE
The work presented in this dissertation was conducted at Mangosuthu University of
Technology (MUT), Faculty of Engineering in the Department of Chemical Engineering. All
laboratory analyses were done at MUT Wastewater Management Research Laboratory.
Furthermore, this project was funded by both the Durban University of Technology and the
Environmental Pollution and Remediation Research Group (EPRG) at MUT. From the work
presented in this dissertation, so far two journal articles which are currently under review as
indicated in the research output section have been written.
Page | vii
RESEARCH OUTPUT
1. Khumalo, S.M., Bakare, B.F. and Rathilal, S. 2018. Biological Nitrogen Removal
Processes from Industrial Wastewater with High-strength Ammonium and Low
Organic Substrate: A Review. Chemical Engineering & Technology (submitted).
2. Khumalo, S.M., Bakare, B.F. and Rathilal, S. 2018. Characterization of Industrial
Wastewater Generated from the Brewery with Variation of Oxidation Reduction
Potential: Case of South African Breweries. Journal of Water Reuse and Desalination
(submitted).
Page | viii
TABLE OF CONTENTS
DECLARATION ........................................................................................................................ i
DEDICATION ........................................................................................................................... ii
ACKNOWLEDGEMENTS ..................................................................................................... iii
ABSTRACT .............................................................................................................................. iv
PREFACE ................................................................................................................................. vi
RESEARCH OUTPUT ............................................................................................................ vii
TABLE OF CONTENTS ....................................................................................................... viii
LIST OF FIGURES ................................................................................................................. xii
LIST OF TABLES .................................................................................................................. xiv
GLOSSARY ............................................................................................................................ xv
LIST OF ABBREVIATIONS ................................................................................................ xvii
TABLE OF NOMENCLATURE ........................................................................................ xviii
CHAPTER ONE ........................................................................................................................ 1
INTRODUCTION ..................................................................................................................... 1
1.1 Background Information and Motivation ......................................................................... 1
1.2 Problem Statement ........................................................................................................... 3
1.3 Aim and objectives of the study ....................................................................................... 3
1.4 Significance of the study .................................................................................................. 4
1.5 Dissertation outline .......................................................................................................... 4
CHAPTER TWO ....................................................................................................................... 5
REVIEW OF LITERATURE .................................................................................................... 5
2.1 Biological Nutrients in Wastewater ................................................................................. 5
2.1.1 Biological Nutrient Removal ..................................................................................... 6
2.1.2 Biological Nitrogen Removal .................................................................................... 6
2.1.3 Biological Phosphorus Removal ............................................................................. 10
Page | ix
2.2 Parameters Affecting Biological Nutrient Removal ...................................................... 15
2.2.1 Wastewater composition .......................................................................................... 15
2.2.2 Temperature ............................................................................................................. 16
2.2.3 pH control ................................................................................................................ 17
2.2.4 Dissolved Oxygen (DO) .......................................................................................... 17
2.2.5 Sludge quality and settleability................................................................................ 17
2.2.6 Volatile Fatty Acids (VFA) ..................................................................................... 18
2.2.7 Solids Retention Time (SRT) .................................................................................. 18
2.3 Brewery Wastewater ...................................................................................................... 19
2.3.1 Characteristics of brewery wastewater .................................................................... 19
2.4 Brewery wastewater treatment methods ........................................................................ 21
2.4.1 Brewery wastewater biological treatment methods ................................................. 22
2.5 Microbial Growth Kinetics............................................................................................. 30
2.5.1 Structured versus unstructured models .................................................................... 31
2.6 Summary of literature review ......................................................................................... 33
CHAPTER THREE ................................................................................................................. 35
MATERIALS AND METHODS ............................................................................................. 35
3.1 Introduction .................................................................................................................... 35
3.2 Experimental Materials .................................................................................................. 35
3.2.1 Raw Brewery Wastewater ....................................................................................... 35
3.2.2 Sludge sampling and preparation ............................................................................ 35
3.3 Experimental Methods ................................................................................................... 36
3.3.1 Equipment Design ................................................................................................... 36
3.3.2 Experimental Approach ........................................................................................... 38
3.3.3 Experimental Design ............................................................................................... 41
3.5 Analytical Techniques .................................................................................................... 41
3.6 Microbiology Kinetics.................................................................................................... 45
Page | x
3.7 Data Analysis ................................................................................................................. 46
CHAPTER FOUR .................................................................................................................... 47
RESULTS AND DISCUSSION .............................................................................................. 47
4.1 Results on Characterisation of Brewery Wastewater Composition ............................... 47
4.2 The Effect of Sludge Retention Time (STR) on Orthophosphate Removal Efficiency . 48
4.2.1 The Effect of Hydraulic Retention Time on Orthophosphate Removal .................. 50
4.3 Total Chemical Oxygen Demand (TCOD) Removal Results ........................................ 51
4.3.1 Orthophosphates and TCOD Removal Results ....................................................... 52
4.4 Summary of Results on Orthophosphates Material Balance .......................................... 54
4.5 The Effect of Sludge Retention Time on Ammoniacal Nitrogen Removal ................... 57
4.5.1 The Effect of Ammoniacal-N concentration on the SBR Treatment Efficacy ........ 58
4.5.2 SBR Results on (NO3-N + NO2-N) Removal .......................................................... 59
4.5.3 The Effect of Organic Volumetric Loading Rate (OVLR) on Biological Nutrient
Removal ............................................................................................................................ 60
4.5.4 Effect of Reactor Temperature ................................................................................ 65
4.5.5 The Effect of pH on Biological Nutrient Removal .................................................. 66
4.6 Summary of results for an aerobic-anaerobic SBR treatment efficacy on biological
nutrients removal .................................................................................................................. 67
4.7 Substrate utilization rate kinetics and microbial growth rate kinetics ........................... 68
4.7.1 Results on Substrate Utilization Rate with COD Variation .................................... 68
4.7.2 Results on Microbial Population Growth Rate from Substrate Utilization Rate
Kinetics ............................................................................................................................. 70
4.8 Ammonia-Oxidising Rate and Ammonia Oxidising Bacteria (AOB) Growth Rate
Kinetics Models.................................................................................................................... 71
4.8.1 Results on Ammonia Oxidising Bacteria (AOB) Specific Growth Rate ................. 71
4.8.2 Overall Results on Microbial Growth Rate and Substrate Utilization Rate Kinetics
.......................................................................................................................................... 72
CHAPTER FIVE ..................................................................................................................... 74
Page | xi
CONCLUSIONS AND RECOMMENDATIONS .................................................................. 74
5.1 Conclusions .................................................................................................................... 74
5.1.1 Characterisation of brewery wastewater composition ............................................. 74
5.1.2 Effect of SRT and HRT on biological nutrient removal ......................................... 75
5.1.3 Effect of organic volumetric loading rate (OVLR) on biological nutrients removal
.......................................................................................................................................... 75
5.1.4 Orthophosphates removal ........................................................................................ 75
5.1.6 Nitrogen Removal.................................................................................................... 76
5.1.7 Substrate utilization rate kinetics and microbial growth rate kinetics ..................... 76
5.2 Recommendations .......................................................................................................... 77
5.2.1 Wastewater composition C:N:P ratio balance ......................................................... 77
5.2.2 Temperature variation within the reactor ................................................................ 77
5.2.3 Use of acclimated sludge ......................................................................................... 77
REFERENCES ........................................................................................................................ 78
APPENDIX A .......................................................................................................................... 88
Minitab 15 Descriptive Statistics Results on Raw Brewery Wastewater Characteristics ... 88
APPENDIX B .......................................................................................................................... 89
Biological Nutrients and TCOD Removal Student’s t-Test Results ..................................... 89
APPENDIX C .......................................................................................................................... 94
Microbiology Kinetics and OVLR Descriptive Statistics Results......................................... 94
APPENDIX D .......................................................................................................................... 98
Substrate Utilisation Rate Kinetics Models Constants ........................................................ 98
Food to Microorganism (F/M) Ratio ................................................................................... 98
Organic Volumetric Loading Rate ....................................................................................... 98
Page | xii
LIST OF FIGURES
Figure 2.1: Concentration profile of BOD and phosphorus in EBPR process. ...................... 12
Figure 2.2: Anaerobic/Oxic phosphorus removal process ...................................................... 13
Figure 2.3: Conventional activated sludge process diagram. ................................................. 24
Figure 2.4: Enhanced membrane bioreactor schematic diagram ............................................ 27
Figure 2.5: Schematic diagram of different reactions involved in anaerobic digestion of
complex organic matter in wastewater. ................................................................................... 28
Figure 3.1: Activated sludge sample harvested from an anaerobic digester. ......................... 36
Figure 3.2: Isometric view of the sequencing batch reactor. .................................................. 38
Figure 3.3: Laboratory scale sequencing batch reactor in operation. ..................................... 39
Figure 4.1: Orthophosphates removal profile with SRT variation. ........................................ 49
Figure 4.2: Orthophosphate concentration profile with variation of HRT. ............................ 50
Figure 4.3: TCOD Removal Results (SRT of 7 days and HRT of 18 hours). ........................ 51
Figure 4.4: Orthophosphates and TCOD removal results....................................................... 52
Figure 4.5: Orthophosphate removal with variation in OVLR. .............................................. 53
Figure 4.6: Overall removal on orthophosphates and TCOD. ................................................ 54
Figure 4.7: Overall material balance on orthophosphate. ....................................................... 55
Figure 4.8: Ammoniacal-N removal profile with SRT variation............................................ 57
Figure 4.9: The effect of ammoniacal-N concentration on the SBR efficacy with a variation in
SRT, (a) = week 1 and (b) = week 2. ....................................................................................... 58
Figure 4.10: Results for the SBR-1 on (NO3-N + NO2-N) removal. ..................................... 60
Figure 4.11: Effect of OVLR on TIN removal. ...................................................................... 61
Figure 4.12: Effect of OVLR on ammoniacal-N removal. ..................................................... 61
Figure 4.13: The effect of OVLR on TON removal. .............................................................. 62
Figure 4.14: SBR-1 removal efficacies on TKN with variation on OVLR. ........................... 64
Figure 4.15: SBR-1 treatment efficacies on TN removal with variation on OVLR. .............. 64
Figure 4.16: SBR-1 treatment efficacy on NO3-N + NO2-N removal with variation on OVLR.
.................................................................................................................................................. 65
Figure 4.17: Temperature profile for SBR-1 and SBR-2. ....................................................... 65
Figure 4.18: pH profile for both SBR-1 and SBR-2. .............................................................. 66
Figure 4.19: SBR-1 overall treatment efficacy for all biological nutrients investigated. ....... 67
Figure 4.20: Findings of the study on substrate utilization rate for SBR-1. .......................... 69
Page | xiii
Figure 4.21: Findings of the study on substrate utilisation rate for SBR-2. ........................... 69
Figure 4.22: Microbial population growth-rate (SBR-1) results. ........................................... 70
Figure 4.23: Microbial growth-rate (SBR-2) results. ............................................................. 71
Figure 4.24: Findings of the study on AOB specific growth rate kinetics. ............................ 72
Page | xiv
LIST OF TABLES
Table 2.1: Characteristics of brewery wastewater before treatment ....................................... 21
Table 3.1: Experimental design. ............................................................................................. 41
Table 4.1: Summary of results for the characteristics of brewery wastewater composition. . 48
Table 4.2: Orthophosphates material balance results for all experimental runs. .................... 56
Table 4.3: TON removal results with variation in OVLR for experimental runs. .................. 63
Table 4.4: Results on Microbial Growth Rate and Substrate Utilization Rate Kinetics. ........ 73
Table A.1: Descriptive Statistics Results on BWW Characteristics ....................................... 88
Table B.1: Orthophosphates removal statistical analyses results. ........................................... 89
Table B.2: TCOD removal in SBR-2 statistical analyses results. ........................................... 89
Table B.3: Material balance on SBR-2 statistical analyses. ................................................... 90
Table B.4: Presents NH3-N removal statistical analyses results. ........................................... 90
Table B.5: NO3-N+NO2-N removal statistical analyses results. ............................................. 91
Table B.6: TIN removal statistical analyses results. ............................................................... 91
Table B.7: TON removal statistical analyses results. ............................................................. 92
Table B.8: TKN removal statistical analyses results. ............................................................. 92
Table B.9: TN removal statistical analyses results. ................................................................ 93
Table B.10: SBR-2 TCOD removal statistical analyses results. ............................................. 93
Table C.1: SBR-1 substrate utilisation rate descriptive analyses results. ............................... 94
Table C.2: SBR-2 substrate utilisation rate descriptive analyses results. ............................... 94
Table C.3: SBR-1 microbial growth rate kinetics descriptive analyses results. ..................... 95
Table C.4: SBR-1 microbial growth rate kinetics descriptive analyses results. ..................... 95
Table C.5: AOB growth rate descriptive analyses results. ..................................................... 96
Table C.6: Ammonia-oxidising rate statistics descriptive analyses results. ........................... 96
Table C.7: OVLR descriptive analyses results. ...................................................................... 97
Table C.8: F/M ratio descriptive analyses results. .................................................................. 97
Table D.1: Microbiology kinetics equations constants of k and Ks. ...................................... 98
Table D.2: Activated sludge design kinetic coefficients at 20˚C. ........................................... 99
Page | xv
GLOSSARY
Term Definition
Acclimate The adaptation of microorganisms to a new environment.
Activated sludge process Biological treatment process that involves the conversion of
organic matter and/or other constituents in the wastewater
to gases and cell tissue by a large mass of aerobic
microorganisms maintained in suspension mixing and
aeration.
Aerobic process Biological treatment process that occur in the presence of
free dissolved oxygen, whereby oxygen is consumed by
aerobic microorganisms in oxidation reactions to produce
energy for cell growth and cell maintenance.
Anaerobic process Biological treatment process that occur in the absence of
oxygen.
Anoxic process Biological treatment process that occurs in the absence of
free dissolved oxygen where nitrate and nitrite are used as
the main electron acceptors in biological
oxidation/reduction reactions.
Biomass The total mass of biosolids in a reactor consisting mainly of
organic matter and microorganisms.
Biochemical oxygen demand Is the amount of dissolved oxygen needed by
aerobic biological organisms to break down organic
material present in wastewater sample at certain
temperature over a specific time period.
Bioreactor A vessel in which a chemical process is carried out which
involves organisms or biochemically active substances
derived from such organisms. This process can either be
aerobic, anaerobic, or anoxic.
Chemical oxygen demand Is a measure of the capacity of wastewater to
consume oxygen during the decomposition of organic
Page | xvi
matter and the oxidation of inorganic chemicals such as
ammonia and nitrite.
Denitrification The biological process by which nitrate or nitrite is reduced
to nitrogen and other gaseous end products.
Eutrophication The process by which a body of water becomes enriched in
dissolved nutrients (such as phosphates) that stimulate the
growth of aquatic plant life usually resulting in the
depletion of dissolved oxygen thus, killing fish.
Flow equalization Is a technique used to consolidate wastewater effluent in
holding tanks for “equalizing” before introducing
wastewater into downstream brewery treatment processes
or for that matter directly into the municipal sewage system.
Grit removal Is a process in which wastewater is allowed to flow into a
grit chamber where sand, grit, and small stones settle to the
bottom.
Hydraulic retention time The average time spent by wastewater inside the reactor
during treatment.
Inoculum The act of introducing microorganisms into a culture
medium.
Mesophilic conditions Temperature range between 20 – 50 ̊ C.
Microorganism An organism that can be seen only with the aid of a
microscope and that typically consists of only a single cell
(i.e., bacteria, protozoans, and certain algae and fungi).
Mixed liquor suspended
solids
The mixture of bio-solids from activated sludge and
wastewater in the bio-reactor.
Nitrification The two-step biological process by which nitrogen is
converted to nitrite and then to nitrate.
Solid retention time The average time spent by bio-solids inside the reactor.
Substrate The organic matter or nutrients that are converted during
biological treatment.
Page | xvii
LIST OF ABBREVIATIONS
ANAMMOX : Anaerobic ammonium oxidation
AOB : Ammonia Oxidising Bacteria
APHA : American Public Health Association
BNR : Biological Nutrient Removal
BWW : Brewery Wastewater
C : Carbon
COD : Chemical Oxygen Demand
DEA : Department of Environmental Affairs
DWAF : Department of Water Affairs
EBPR : Enhanced Biological Phosphorus Removal
FVS : Fixed Volatile Solids
HRT : Hydraulic Retention Time
JLR : Jet Loop Reactor
N : Nitrogen
P : Phosphorus
PAO : Polyphosphates Accumulating Organisms
PCOD : Particulate Chemical Oxygen Demand
SAB : South African Breweries
SCOD : Soluble Chemical Oxygen Demand
SD : Standard Deviation
SBR : Sequencing Batch Reactor
SRT : Solids Retention Time
TCOD : Total Chemical Oxygen Demand
TDS : Total Dissolved Solids
TIN : Total Inorganic Nitrogen
TKN : Total Kjeldahl Nitrogen
TN : Total Nitrogen
TON : Total Organic Nitrogen
TP : Total Phosphorus
TS : Total Solids
VFA : Volatile Fatty Acids
VSS : Volatile Suspended Solids
Page | xviii
TABLE OF NOMENCLATURE
Symbol Meaning Units
p Alpha value ---
rNH Ammonia-oxidising rate g/m3.day
X Biomass concentration g VSS/m3
So Concentration mg/L
EC Electrical conductivity µS/cm
Q Flowrate m3/day
KO,AOB Half-velocity for AOB mg/L
KNH Half-velocity for NH3-N mg/L
µmax,AOB Maximum specific growth rate of AOB g VSS/VSS.day
rg Microbial growth rate g VSS/m3.day
SNH NH3-N concentration mg/L
ORP Oxidation-reduction potential mV
bAOB Specific endogenous decay rate of AOB G VSS lost/g VSS.day
µAOB Specific growth rate of AOB g VSS/g VSS.day
rsu Substrate utilisation rate g TCOD/m3.day
Lorg Volumetric organic loading rate kg TCOD/m3.day
V Volume m3
Chemical Formula Full Name
NH3-N Ammoniacal nitrogen
NH4+ Ammonium ion
Cr3+ Chromic ion
Cr2O72- Dichromate ion
PO43- Orthophosphates
NO3-N Nitrate
NO2-N Nitrite
Page | 1
CHAPTER ONE
INTRODUCTION
1.1 Background Information and Motivation
The discharge of industrial wastewater with a high-concentration of biological nutrients (i.e.
nitrogen and phosphorus compounds) and organic matter pollutants into receiving water bodies
stimulates the growth of algae which promotes eutrophication, thus destroying aquatic life and
resulting in environmental pollution (Liu and Liptak 1999; Safafar et al. 2015). Eutrophic
waters are characterised by high concentrations of aquatic weeds and algae, which eventually
die, sink to the bottom and decay, thus reducing the levels of dissolved oxygen in water (Liu
and Liptak 1999; Sathasivan 2009; Haberman and Haldna 2014). Furthermore, according to
Metcalf and Eddy (1991), this phenomena is also perpetuated by the cycling of dissolved
oxygen which accompanies the process of photosynthesis and respiration.
The choice of industrial wastewater treatment which could be either biological or chemical
methods depends solely on the composition of the pollutants. Industrial wastewater from food
and beverage industries contain significant amounts of biodegradable compounds which can
be treated by biological methods (Ochieng, Odiyo and Mutsago 2003; Atalay and Ersöz 2016).
The brewing industry is said to be one of the largest consumers of fresh water for beer
production as well as being amongst the largest producers of industrial effluent which
contributes to environmental pollution (Parawira et al. 2005; Tansiphorn, Suraphong and
Prasert 2009; Simate 2015). Brewery effluent is characterised by its high-concentration of
organic, inorganic and biological pollutants in terms of chemical oxygen demand (COD),
biochemical oxygen demand (BOD), ammoniacal nitrogen, total Kjeldhal nitrogen (TKN),
inorganic nitrogen (i.e. nitrate and nitrite), phosphorus (i.e. orthophosphates) and other
pollutants depending on the chemicals that are used during the cleaning process (Goldammer
2008; Abimbola et al. 2015; Simate 2015).
The use of only aerobic biological processes for wastewater treatment results in the generation
of large amounts of biomass which needs to be handled and disposed, thus increasing treatment
costs (Zvauya, Parawira and Wawadza 1994; Parawira et al. 2005; Ahn and Logan 2013).
Recently, a number of studies have been reported on anaerobic processes for treating brewery
wastewater (Shao et al. 2008; Wang et al. 2010; Hill 2015). The use of anaerobic systems is
Page | 2
associated with advantages such as: less energy is required because there is no aeration needed;
methane is produced which can be used for energy production; small amounts of biomass and
sludge are formed, thus resulting in lower disposal costs (Parawira et al. 2005). However, the
anaerobic system comes with its own disadvantages. The common problem is associated with
the start-up and operation of the anaerobic treatment process due to the complexity of the
process which is carried out by a consortium of unidentified and interdependent
microorganisms, which makes the process unstable and difficult to monitor (Lettinga 1995;
Jeinson and Chamy 1999; Parawira et al. 2005).
The application of biological nutrient removal processes in industrial wastewater treatment
using sequencing batch reactors (SBRs) has come with its own benefits such as environmental,
economical, and operational benefits. Activated sludge SBR operated under
aerobic/anaerobic/aerobic-anaerobic conditions has demonstrated high nutrient removal
efficacies which is an environmental benefit. In SBR systems both the reaction and settling
phases take place in one vessel which makes the system to be inexpensive to set-up compared
to previously adopted conventional systems which require separate settling tanks, and lastly
the system has cemented its application due to its easy operation (Arun 2011). To date, there
are other technologies besides the SBR which are used in treating industrial wastewater, such
as the application of up-flow anaerobic sludge beds, biogas-lift reactors, fluidised bed
bioreactors etc., however, they all face difficulties in treating wastewater with high solids
content (Gregor, Matej and Milenko 2007; Shu-Guang et al. 2007; Fu et al. 2013). Therefore,
they require solids removal prior to treatment.
In this study, a cyclic aerobic-anaerobic laboratory scale SBR under activated sludge was used
to treat brewery wastewater for biological nutrient removal (i.e. nitrogen and phosphorus
pollutants). The system performance parameters were measured in terms of removal efficiency
of ammoniacal nitrogen, TKN, total nitrogen (TN), total organic nitrogen (TON), total
inorganic nitrogen (TIN) and orthophosphates. The controlled and monitored parameters were
dissolved oxygen, pH and temperature respectively.
In South Africa, the Department of Water Affairs and Forestry (DWAF) is the custodian of the
country’s water resources. Part of the DWAF’s mission is to ensure that the quality of water
resources remains fit for recognised water uses and to protect aquatic life (Holmes 1995).
Through the DWAF and the department of environmental affairs (DEA), the Republic of South
Page | 3
Africa regulates industrial effluent discharged into receiving bodies. This is done by putting
into practice the National Water Act (NWA), 1999 (Act No. 20526 of 1999) and Integrated
Coastal Management Act, 2008 (Act No. 240 of 2008) by setting allowable pollutant limits for
wastewater to be discharged into receiving water bodies, however, most industries are still
struggling to meet the allowable wastewater discharge limits. According to the South African
NWA,1999 (Act No. 20526 of 1999) wastewater discharged to water receiving bodies must
not have more than a COD of 75 mg/L, ammonia as nitrogen of 3 mg/L, nitrate or nitrite as
nitrogen of 15 mg/L, orthophosphate as phosphorus of 10 mg/L, and a pH range of 5.5 to 9.5.
This research study is aligned with both the DWAF and DEA’s mission which is to protect
aquatic life by reducing biological pollutants from industrial effluent to allowable discharge
limits.
1.2 Problem Statement
Many municipal wastewater treatment plants are designed to handle domestic wastewater.
Industrial wastewater, specifically brewery wastewater, tends to upset the treatment system due
to its high-concentration of organic and inorganic matter content thus compromising the
treatment efficacy (Parawira et al. 2005; Aguado et al. 2009; Matthew et al. 2010). Recently
new processes for simultaneous nitrogen and phosphorus removal from wastewater have been
developed, such as: partial nitrification (nitritation), anaerobic ammonium oxidation
(ANAMMOX), autotrophic nitrogen removal over nitrite (CANON), etc. (Khin and
Annachhatre 2004; Wei et al. 2014; Chan, Guisasola and Baeza 2017). However, these systems
are all limited in treating wastewater with high-concentration ammonium and low organic
matter, thus presenting a number of drawbacks in terms of treatment capacity and efficiency of
wastewater with high organic and biological nutrient pollutants (Gregor, Matej and Milenko
2007; Shao et al. 2008). This study focus on reducing biological nutrient pollutants in industrial
wastewater from the brewery prior to being discharged into municipal sewer to improve
wastewater treatment plants efficacy as well as minimizing nitrogen and phosphorus pollution.
1.3 Aim and objectives of the study
Based on the challenges stated earlier, the aim of the research study is to evaluate the
performance/treatment efficacy of a cyclic aerobic-anaerobic laboratory scale SBR under
activated sludge microbial population for biological nutrient removal using industrial
wastewater from a brewery.
Page | 4
The objectives of the research study are to:
Characterise wastewater generated from the brewery.
Determine the sequencing batch reactor treatment efficiency in treating brewery
wastewater for biological nutrients in terms of percentage removal.
Investigate the effect of influent organic pollutant strength/organic volumetric loading
rate in terms of chemical oxygen demand, in treating brewery wastewater for biological
nutrients.
Use Monod and Michaelis-Menten’s models to study the microbiology kinetics in terms
of substrate utilisation rate kinetics, and microbial growth rate kinetics.
1.4 Significance of the study
Looking at the objectives described in the previous sub-section, the significance of conducting
the study was to successfully treat industrial wastewater from the brewery for biological
nutrient removal, using a cyclic aerobic-anaerobic SBR under activated sludge heterotrophic
bacteria. The study aims to assist wastewater producing industries in developing in-house
wastewater pre-treatment processes to reduce biological pollutants to meet dewatering
standards as stipulated by local government entities, thus reducing the load on municipal
wastewater treatment plants.
1.5 Dissertation outline
Apart from the introduction which constitutes Chapter One, the dissertation is structured as
follows:
Chapter Two focus on reviews related to biological nutrients found in wastewater as well as
latest removal processes, characteristics of brewery wastewater (BWW), biological processes
used in treating BWW as well as previously done studies on BWW treatment using activated
sludge systems. The chapter concludes with a brief description of the importance of microbial
kinetics growth models specifically unstructured Monod model. Chapter Three gives a
detailed description of the materials and methods used during experimental runs on biological
nutrient removal. This chapter explains the operation of a SBR, sampling methods conducted,
as well as statistical methods used for data analysis. Chapter Four presents the results obtained
during the experimental study and a discussion of results. In this chapter the results are
presented in tables and graphs. Chapter Five presents conclusions drawn on this study based
on the findings presented in Chapter Four as well as recommendations.
Page | 5
CHAPTER TWO
REVIEW OF LITERATURE
This chapter presents an organisation of literature relevant to the understanding of biological
processes, particularly activated sludge systems, that are used for industrial wastewater
treatment for biological nutrient removal, specifically brewery wastewater, prior to discharge
into water receiving bodies. Section 2.1 presents an overview of information on biological
nutrients which are found in wastewater and methods used in treating wastewater for nutrient
removal. Section 2.2 presents a review of literature relevant to the parameters affecting
biological systems in nutrient removal from wastewater. Section 2.3 presents a review of
literature pertinent to the general characteristics of brewery wastewater. Section 2.4 presents
brewery wastewater treatment methods as well as previously done research work related to
each method. Section 2.5 provides information on microbial growth kinetics, the importance
of studying microbial growth as well as empirical models which are widely used in microbial
growth studies. A summary of the reviewed literature is presented as the last section of this
chapter.
2.1 Biological Nutrients in Wastewater
Biological nutrients in industrial wastewater are characterised by both nitrogen and phosphorus
pollutants, which perpetuates the process of eutrophication in water bodies (Liu and Liptak
1999; Henze et al. 2008; Safafar et al. 2015). Nitrogen pollutants in wastewater exist in two
different forms i.e. organic nitrogen which is estimated as TKN and inorganic nitrogen
(ammonia, nitrate and nitrite). Ammonia is considered a toxic nitrogen compound in
wastewater, moreover, ammonia is associated with a high solubility in water, thus it exists as
an ammonium ion (𝑁𝐻4+) (Philips et al. 2002). This biological nutrient is imperative for plant
growth, therefore, enrichment of water bodies with ammonium ions perpetuates the growth of
algae which results in the reduction of dissolved oxygen in water, thus killing aquatic life e.g.
fish (Mulkerrins, Dobson and Colleran 2004; Safafar et al. 2015).
On the other hand, phosphorus pollutants in industrial wastewater are made up of dissolved
forms, which are characterised as orthophosphates, inorganic forms characterised as
polyphosphates, and organically bonded phosphorus compounds. The combination of these
different forms of phosphorus is characterised as total phosphorus. However, in wastewater
treatment processes the quantity of phosphorus is measured in terms of orthophosphates since
Page | 6
both the inorganic phosphorus and organically bonded phosphorus during analysis are
dissolved and converted to orthophosphates. According to Henze et al. (2008) and Safafar et
al. (2015), phosphorus is the key element which promotes the growth of aquatic plants and
algae thus promoting eutrophication.
2.1.1 Biological Nutrient Removal
According to Metcalf and Eddy (2014), biological nutrient removal (BNR) is defined as the
removal of nitrogen and phosphorus by means of biological treatment processes. Biological
processes which are used for nutrient removal in wastewater are divided into two main
categories i.e. suspended growth and attached growth processes (Metcalf and Eddy 2014). In
suspended growth processes, the microorganisms responsible for treatment are maintained in
liquid suspension and the activated sludge process is commonly used in wastewater treatment
processes as discussed in section 2.4 of this chapter. Moreover, in attached growth processes
the microorganisms responsible for the conversion of biological nutrients and organic material
are attached to an inert packing material. In attached growth processes, wastewater treatment
is done by the flowing of wastewater through the attached growth also known as biofilm. For
the attached growth processes the trickling filter technology has cemented its application in
wastewater treatment plants. Both the suspended growth and attached growth processes can be
operated as aerobic or anaerobic or anoxic processes (Arun 2011; Metcalf and Eddy 2014). The
biochemistry of nitrogen and phosphorus removal is discussed in detail in the consequent sub-
sections.
2.1.2 Biological Nitrogen Removal
Nitrogen removal from wastewater is mostly done through the process of nitrification and
denitrification (Carrera et al. 2003; Jeyanayagam 2005; Wei et al. 2014). According to Metcalf
and Eddy (2014) the process of nitrification is a two step process which takes place in the
presence of oxygen involving two groups of autotrophic bacteria i.e. Nitrosomonas and
Nitrobacteria. Metcalf and Eddy (2014) and Wei et al. (2014) indicated that during the first
stage of the nitrification process, ammonia is oxidised into nitrite by Nitrosomonas bacteria,
and the second nitrification stage involves the oxidation of nitrite into nitrate by Nitrobacteria.
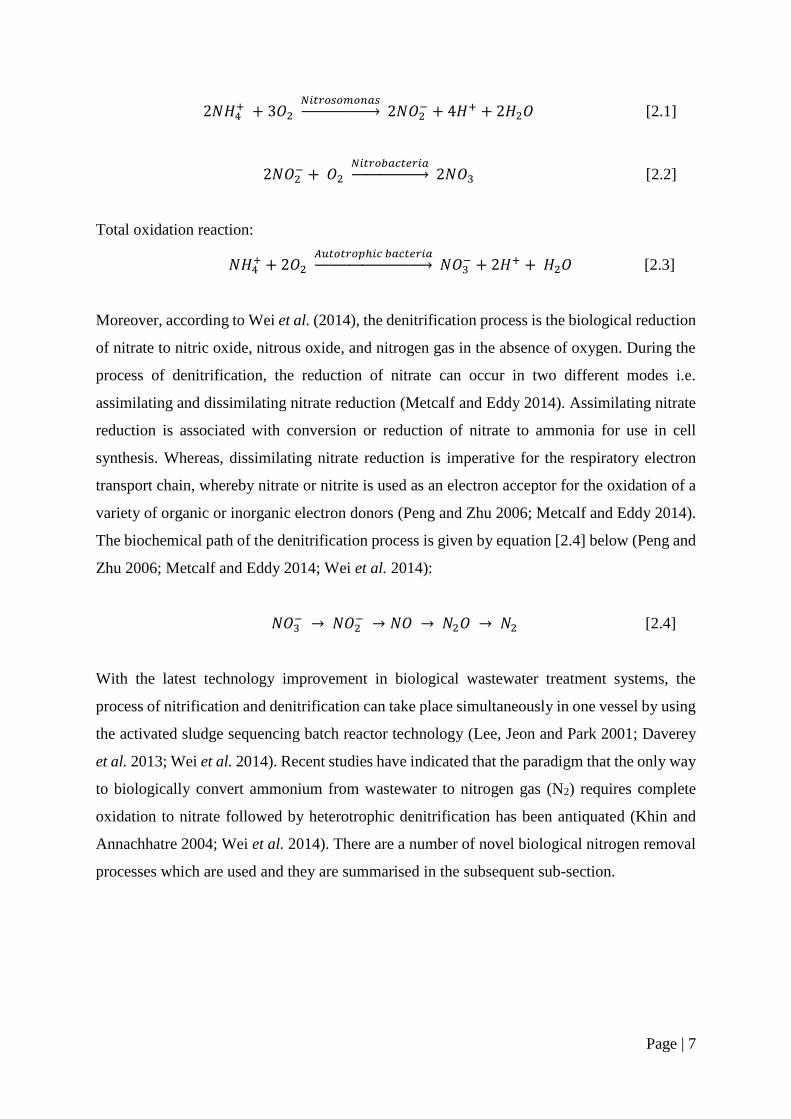
The biochemical path for the nitrification process is presented by equations [2.1],[2.2] and [2.3]
below (Metcalf and Eddy 2014):
Page | 7
2𝑁𝐻4+ + 3𝑂2
𝑁𝑖𝑡𝑟𝑜𝑠𝑜𝑚𝑜𝑛𝑎𝑠→ 2𝑁𝑂2
− + 4𝐻+ + 2𝐻2𝑂 [2.1]
2𝑁𝑂2− + 𝑂2
𝑁𝑖𝑡𝑟𝑜𝑏𝑎𝑐𝑡𝑒𝑟𝑖𝑎→ 2𝑁𝑂3 [2.2]
Total oxidation reaction:
𝑁𝐻4+ + 2𝑂2
𝐴𝑢𝑡𝑜𝑡𝑟𝑜𝑝ℎ𝑖𝑐 𝑏𝑎𝑐𝑡𝑒𝑟𝑖𝑎→ 𝑁𝑂3
− + 2𝐻+ + 𝐻2𝑂 [2.3]
Moreover, according to Wei et al. (2014), the denitrification process is the biological reduction
of nitrate to nitric oxide, nitrous oxide, and nitrogen gas in the absence of oxygen. During the
process of denitrification, the reduction of nitrate can occur in two different modes i.e.
assimilating and dissimilating nitrate reduction (Metcalf and Eddy 2014). Assimilating nitrate
reduction is associated with conversion or reduction of nitrate to ammonia for use in cell
synthesis. Whereas, dissimilating nitrate reduction is imperative for the respiratory electron
transport chain, whereby nitrate or nitrite is used as an electron acceptor for the oxidation of a
variety of organic or inorganic electron donors (Peng and Zhu 2006; Metcalf and Eddy 2014).
The biochemical path of the denitrification process is given by equation [2.4] below (Peng and
Zhu 2006; Metcalf and Eddy 2014; Wei et al. 2014):
𝑁𝑂3− → 𝑁𝑂2
− → 𝑁𝑂 → 𝑁2𝑂 → 𝑁2 [2.4]
With the latest technology improvement in biological wastewater treatment systems, the
process of nitrification and denitrification can take place simultaneously in one vessel by using
the activated sludge sequencing batch reactor technology (Lee, Jeon and Park 2001; Daverey
et al. 2013; Wei et al. 2014). Recent studies have indicated that the paradigm that the only way
to biologically convert ammonium from wastewater to nitrogen gas (N2) requires complete
oxidation to nitrate followed by heterotrophic denitrification has been antiquated (Khin and
Annachhatre 2004; Wei et al. 2014). There are a number of novel biological nitrogen removal
processes which are used and they are summarised in the subsequent sub-section.
Page | 8
Partial Nitrification
The removal of nitrogen pollutants from wastewater by the process of partial nitrification is
defined by She et al. (2016) and Schmidt et al. (2003) as the oxidation of ammonium into nitrite
as the end product. The process is known as nitritation. Conventional nitrogen removal
processes use heterotrophic bacteria to facilitate the process of nitrification and denitrification
which require a carbon source for metabolic processes (Yongzhen et al. 2007; She et al. 2016).
Whereas, the nitritation process use aerobic chemoautotrophs as ammonium and nitrite
oxidising bacteria producing nitrogen gas, which does not require organic matter as a carbon
source for metabolic processes, however, these bacteria use carbon dioxide as a carbon source
to oxidise inorganic compounds (i.e. 𝑁𝐻4+ and 𝑁𝑂2
−) to nitrogen gas (Metcalf and Eddy 2014).
This process has cemented its application in industrial wastewater treatment with a low
carbon : nitrogen ratio. Wei et al. (2014) and Yongzhen et al. (2007) with practical evidence
reported that under temperature conditions above 30˚C, pH levels of above 7.5 and DO
concentration between 0.5 and 1 mg/L, the nitritation process is favoured. Moreover, under the
above mentioned operating conditions, Wei et al. (2014) reported a sludge volume index from
115.6 to 56.6 mL/g.
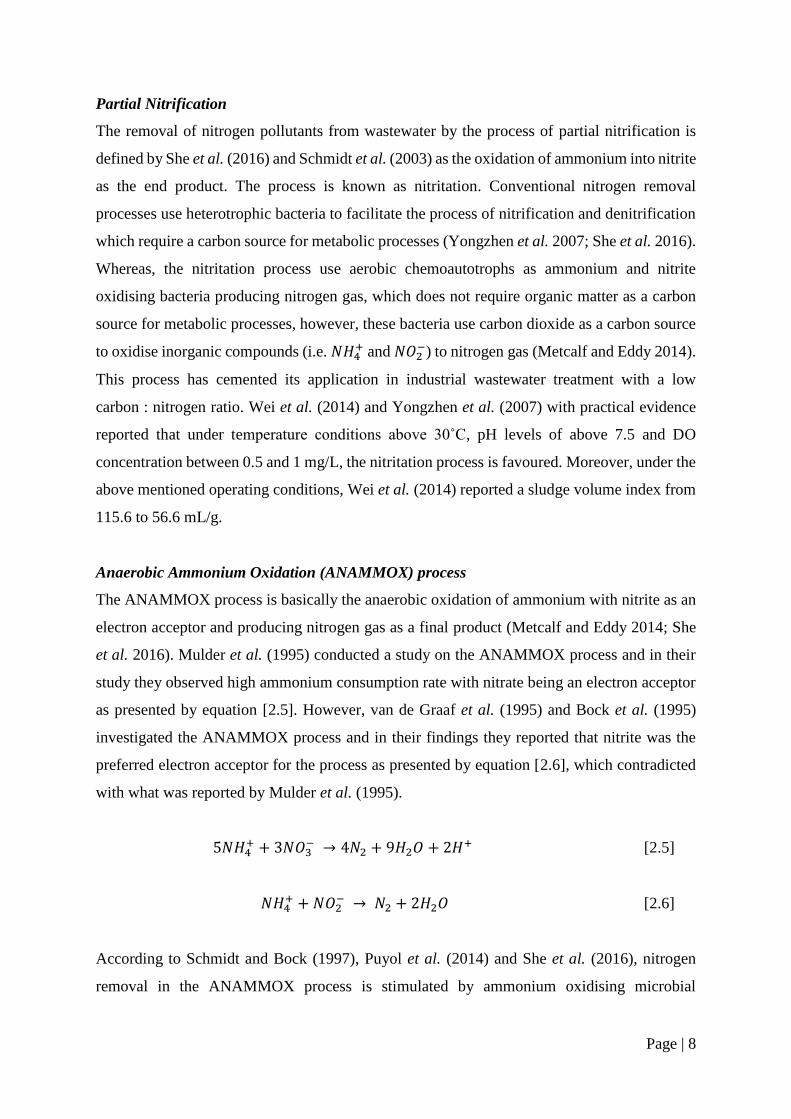
Anaerobic Ammonium Oxidation (ANAMMOX) process
The ANAMMOX process is basically the anaerobic oxidation of ammonium with nitrite as an
electron acceptor and producing nitrogen gas as a final product (Metcalf and Eddy 2014; She
et al. 2016). Mulder et al. (1995) conducted a study on the ANAMMOX process and in their
study they observed high ammonium consumption rate with nitrate being an electron acceptor
as presented by equation [2.5]. However, van de Graaf et al. (1995) and Bock et al. (1995)
investigated the ANAMMOX process and in their findings they reported that nitrite was the
preferred electron acceptor for the process as presented by equation [2.6], which contradicted
with what was reported by Mulder et al. (1995).
5𝑁𝐻4+ + 3𝑁𝑂3
− → 4𝑁2 + 9𝐻2𝑂 + 2𝐻+ [2.5]
𝑁𝐻4+ + 𝑁𝑂2
− → 𝑁2 + 2𝐻2𝑂 [2.6]
According to Schmidt and Bock (1997), Puyol et al. (2014) and She et al. (2016), nitrogen
removal in the ANAMMOX process is stimulated by ammonium oxidising microbial
Page | 9
community which are able to oxidise ammonium in the presence of gaseous nitrogen dioxide
under anoxic conditions. The ANAMMOX microbial community was investigated by Strous
et al. (1997), who reported that it was an autotrophic bacterium under the Planctomycetales,
and it required no organic carbon for cell growth, however, it uses carbon dioxide as a carbon
source. The ANAMMOX bacteria is characterised by a slow growth-rate, Schmidt et al. (2003)
reported that it can take 100 – 150 days before an ANAMMOX reactor seeded with activated
sludge can reach full capacity.
Completely autotrophic nitrogen removal over nitrite (CANON) process
Zhu et al. (2008) and Zhang et al. (2015b), reported that the CANON process is a novel
biological nitrogen removal process from wastewater with low organic loads. Furthermore, the
process is based on partial nitrification and anoxic oxidation of ammonia. This process was
motivated by wastewater characterised with high-strength ammonium load and low
carbon : nitrogen ratios which has demonstrated a high amount of nitrogen pollutant loss in the
form of element nitrogen (Hippen et al. 1997; Koch et al. 2000; Khin and Annachhatre 2004).
This phenomenon is explained by Daverey et al. (2013) and Khin and Annachhatre (2004)
where they reported that it is as a result of the microorganisms responsible which are
characterised as autotrophic microbial population which is able to denitrify under low dissolved
oxygen conditions.
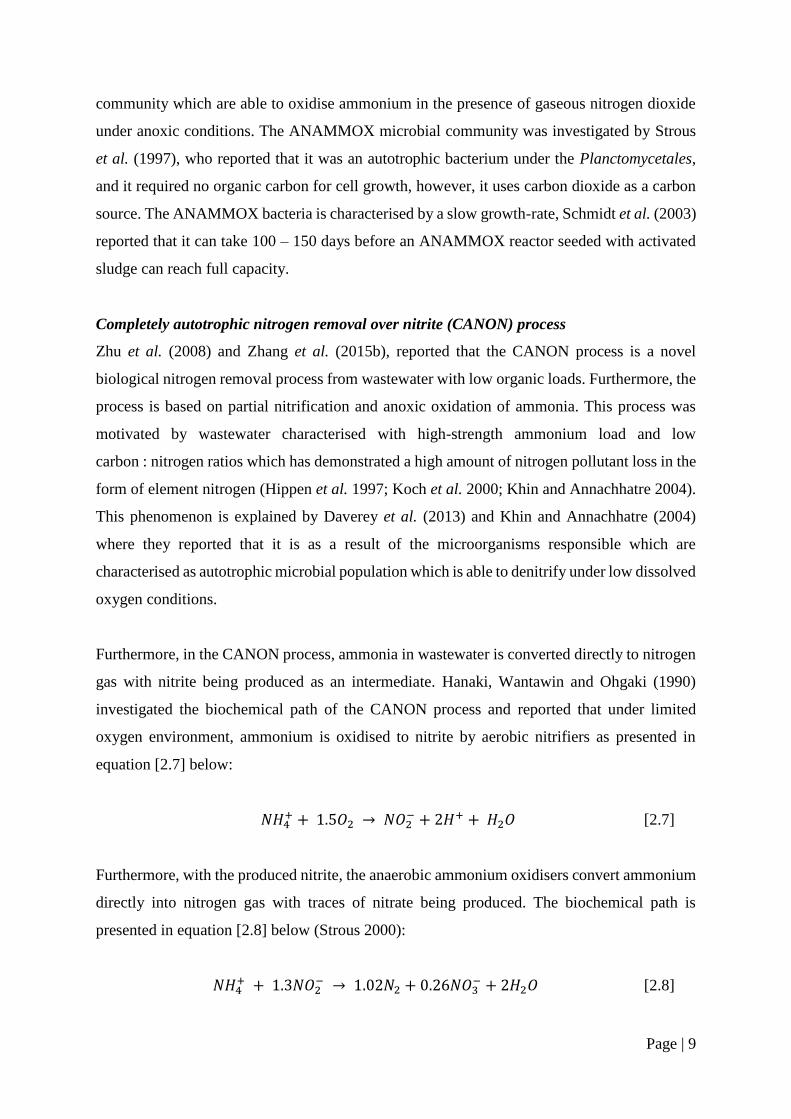
Furthermore, in the CANON process, ammonia in wastewater is converted directly to nitrogen
gas with nitrite being produced as an intermediate. Hanaki, Wantawin and Ohgaki (1990)
investigated the biochemical path of the CANON process and reported that under limited
oxygen environment, ammonium is oxidised to nitrite by aerobic nitrifiers as presented in
equation [2.7] below:
𝑁𝐻4+ + 1.5𝑂2 → 𝑁𝑂2
− + 2𝐻+ + 𝐻2𝑂 [2.7]
Furthermore, with the produced nitrite, the anaerobic ammonium oxidisers convert ammonium
directly into nitrogen gas with traces of nitrate being produced. The biochemical path is
presented in equation [2.8] below (Strous 2000):
𝑁𝐻4+ + 1.3𝑁𝑂2
− → 1.02𝑁2 + 0.26𝑁𝑂3− + 2𝐻2𝑂 [2.8]
Page | 10
The wastewater treatment efficacy in the application of the CANON process is highly
dependent on the interaction of both the aerobic and anaerobic ammonium-oxidising bacteria.
Moreover, the removal of nitrogen from wastewater can be achieved within a single reactor
vessel.
The novel biological nitrogen removal processes discussed in this section have demonstrated a
number of advantages over the conventional biological nitrogen removal from wastewater
namely;
They require less energy for aeration, thus they are characterised by low sludge
production rate which is expensive to handle and dispose,
These phenomenal processes use a microbial population which does not require an
organic carbon source nor chemicals to provide a carbon source, thus making the
process easy to operate, and
The processes discussed in this section can take place in a single reactor tank which
associates them with low start-up costs.
However, these novel biological nitrogen removal processes focus on nitrogen removal from
wastewater with high-strength ammonium and low organic loads. This study focuses on
removal of nitrogen from industrial wastewater with high organic loads since brewery
wastewater is characterised by high levels of COD and BOD (Alvarado-Lassman et al. 2008;
Goldammer 2008; Abimbola et al. 2015).
2.1.3 Biological Phosphorus Removal
The conventional biological phosphorus removal results from biomass produced by cell growth
by heterotrophic bacteria from biochemical oxygen demand (BOD) removal which contain
about 0.015 g P/g VSS. This system is reported to achieve a phosphorus removal efficiency of
about 10 to 20% from wastewater (Metcalf and Eddy 2014). However, since the late 1970’s a
lot of research work has been done on advanced technologies for phosphorus removal. This
has led to the design of treatment plant configurations favouring the phosphorus storing
bacteria well known as Polyphosphorus Accumulating Organisms (PAOs), which have been
used to provide a biological phosphorus removal efficiency of more than 80% (McLaren and
Wood 1976; Barnard 1998; Liu and Liptak 1999; Metcalf and Eddy 2014). To date, this process
has cemented its application in wastewater treatment plants because it is associated with less
Page | 11
sludge production and reduced chemical costs as compared to chemical precipitation (Metcalf
and Eddy 2014). This process is now referred as the enhanced biological phosphorus removal
(EBPR).
The enhanced biological phosphorus removal process is the biological uptake and removal of
phosphorus by activated sludge systems in excess of the amount that is removed by complete
aerobic activated sludge systems (Henze et al. 2008; Metcalf and Eddy 2014; Saad et al. 2016).
This phosphorus removal process is characterised by circulation of activated sludge through
the anaerobic and aerobic environment, coupled with the introduction of influent wastewater
in the anaerobic phase (Mulkerrins, Dobson and Colleran 2004; Saad et al. 2016).
According to Grady Jr et al. (2011), the enhanced biological phosphorus removal process is a
two-step process in which an anaerobic environment or phase is followed by an aerobic phase.
During the anaerobic phase polyphosphorus accumulating organisms transport and consume
influent that is readily biodegradable in the form of volatile fatty acids by using energy made
available from stored phosphorus as polyphosphate, thus enabling the polyphosphorus
accumulating organisms to become dominant (Metcalf and Eddy 2014; Saad et al. 2016). The
anaerobic phase favours the polyphosphorus accumulating organisms because the other
heterotrophic bacteria under anaerobic conditions require an electron acceptor such as oxygen,
nitrite or nitrate for oxidation reduction reactions to provide energy for substrate utilization
organisms (Metcalf and Eddy 2014).
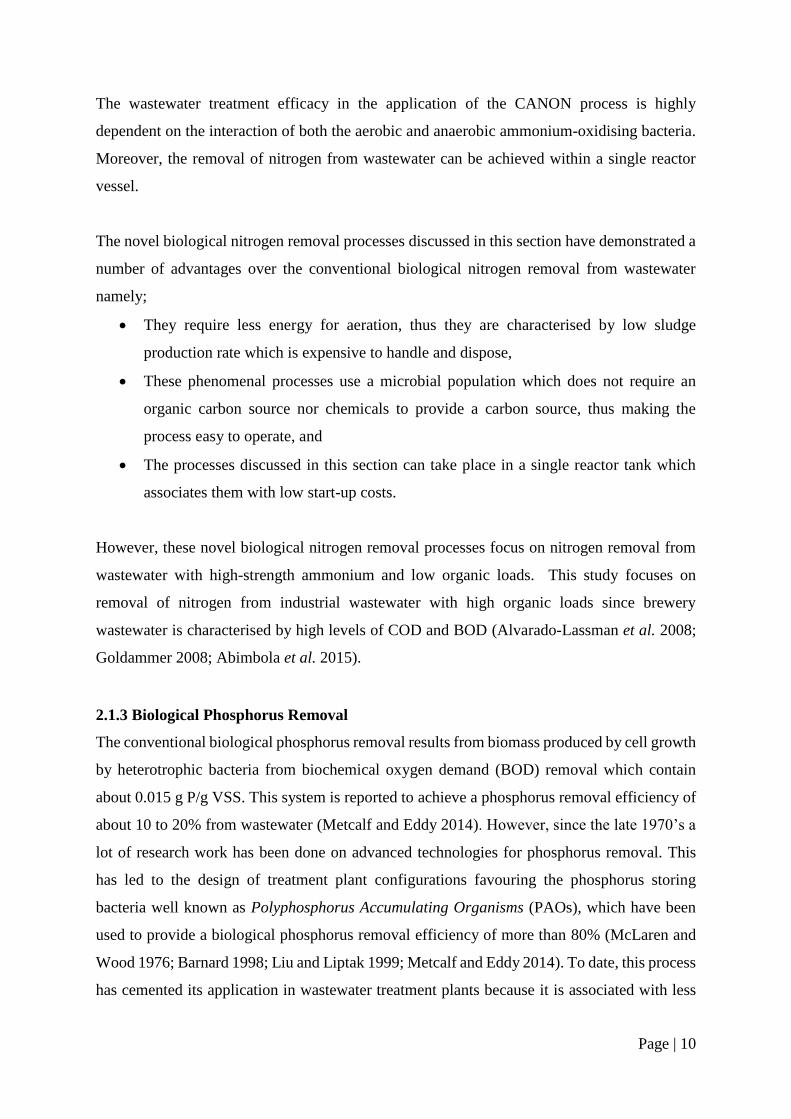
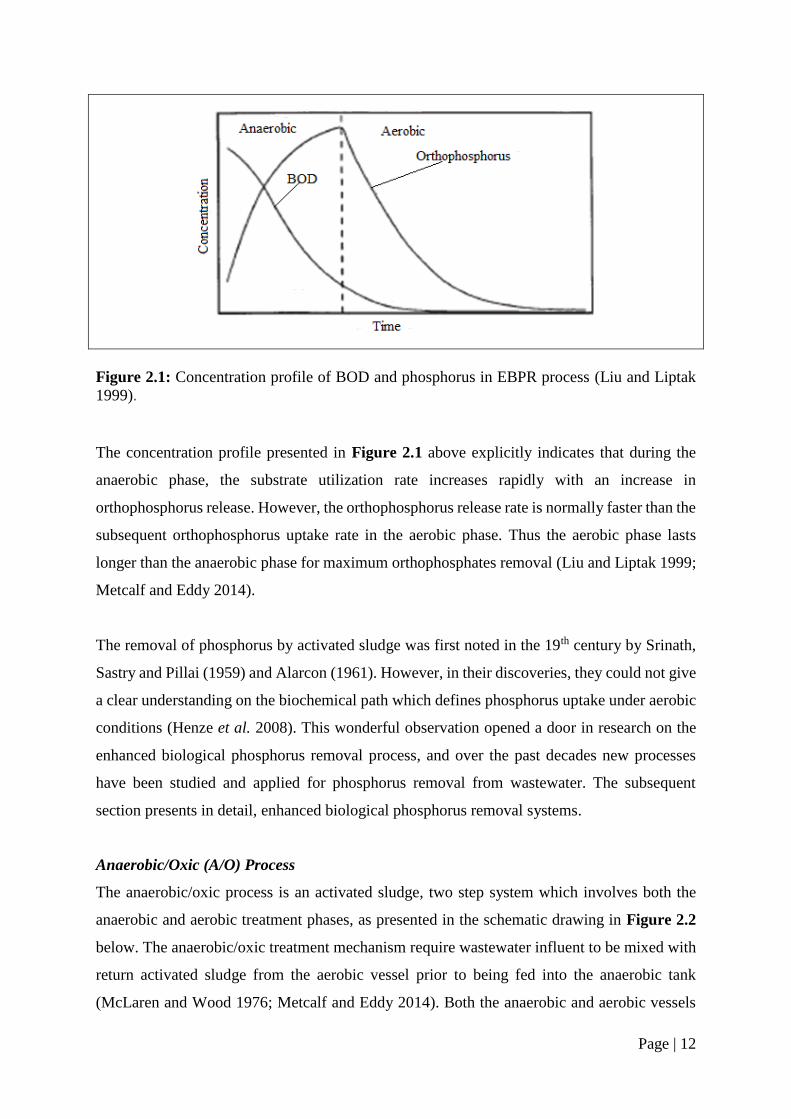
Furthermore, during the aerobic phase or environment in which microorganisms grow new
biomass and take up phosphorus, typically more than the amount they released in the anaerobic
phase. Figure 2.1 presents a typical concentration profile of BOD as a substrate and
orthophosphorus.
Page | 12
Figure 2.1: Concentration profile of BOD and phosphorus in EBPR process (Liu and Liptak
1999).
The concentration profile presented in Figure 2.1 above explicitly indicates that during the
anaerobic phase, the substrate utilization rate increases rapidly with an increase in
orthophosphorus release. However, the orthophosphorus release rate is normally faster than the
subsequent orthophosphorus uptake rate in the aerobic phase. Thus the aerobic phase lasts
longer than the anaerobic phase for maximum orthophosphates removal (Liu and Liptak 1999;
Metcalf and Eddy 2014).
The removal of phosphorus by activated sludge was first noted in the 19th century by Srinath,
Sastry and Pillai (1959) and Alarcon (1961). However, in their discoveries, they could not give
a clear understanding on the biochemical path which defines phosphorus uptake under aerobic
conditions (Henze et al. 2008). This wonderful observation opened a door in research on the
enhanced biological phosphorus removal process, and over the past decades new processes
have been studied and applied for phosphorus removal from wastewater. The subsequent
section presents in detail, enhanced biological phosphorus removal systems.
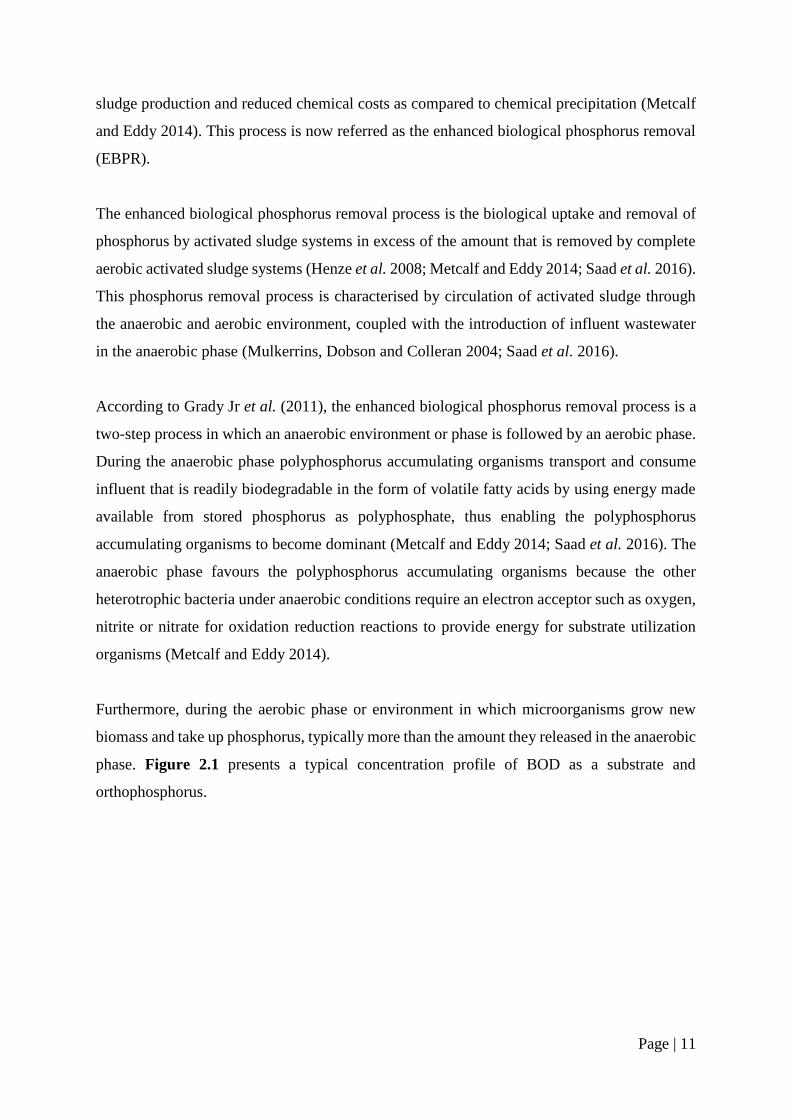
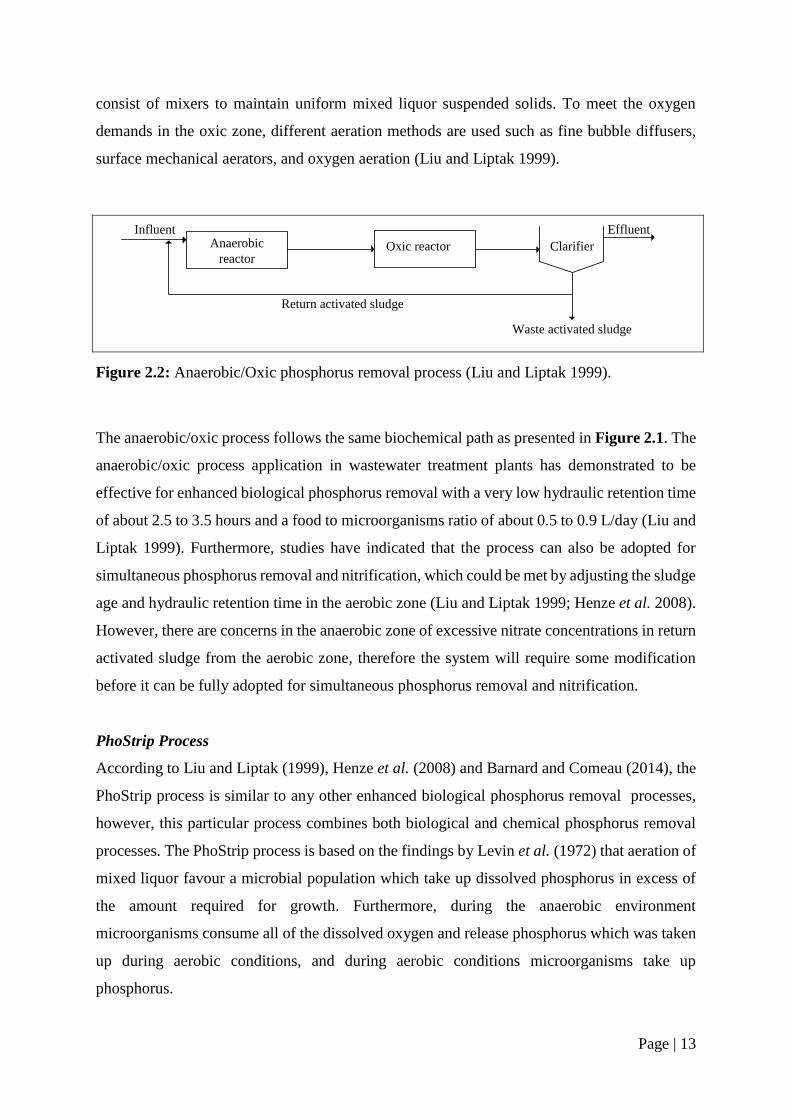
Anaerobic/Oxic (A/O) Process
The anaerobic/oxic process is an activated sludge, two step system which involves both the
anaerobic and aerobic treatment phases, as presented in the schematic drawing in Figure 2.2
below. The anaerobic/oxic treatment mechanism require wastewater influent to be mixed with
return activated sludge from the aerobic vessel prior to being fed into the anaerobic tank
(McLaren and Wood 1976; Metcalf and Eddy 2014). Both the anaerobic and aerobic vessels
Page | 13
consist of mixers to maintain uniform mixed liquor suspended solids. To meet the oxygen
demands in the oxic zone, different aeration methods are used such as fine bubble diffusers,
surface mechanical aerators, and oxygen aeration (Liu and Liptak 1999).
InfluentAnaerobic
reactorOxic reactor Clarifier
Effluent
Waste activated sludge
Return activated sludge
P-6
Figure 2.2: Anaerobic/Oxic phosphorus removal process (Liu and Liptak 1999).
The anaerobic/oxic process follows the same biochemical path as presented in Figure 2.1. The
anaerobic/oxic process application in wastewater treatment plants has demonstrated to be
effective for enhanced biological phosphorus removal with a very low hydraulic retention time
of about 2.5 to 3.5 hours and a food to microorganisms ratio of about 0.5 to 0.9 L/day (Liu and
Liptak 1999). Furthermore, studies have indicated that the process can also be adopted for
simultaneous phosphorus removal and nitrification, which could be met by adjusting the sludge
age and hydraulic retention time in the aerobic zone (Liu and Liptak 1999; Henze et al. 2008).
However, there are concerns in the anaerobic zone of excessive nitrate concentrations in return
activated sludge from the aerobic zone, therefore the system will require some modification
before it can be fully adopted for simultaneous phosphorus removal and nitrification.
PhoStrip Process
According to Liu and Liptak (1999), Henze et al. (2008) and Barnard and Comeau (2014), the
PhoStrip process is similar to any other enhanced biological phosphorus removal processes,
however, this particular process combines both biological and chemical phosphorus removal
processes. The PhoStrip process is based on the findings by Levin et al. (1972) that aeration of
mixed liquor favour a microbial population which take up dissolved phosphorus in excess of
the amount required for growth. Furthermore, during the anaerobic environment
microorganisms consume all of the dissolved oxygen and release phosphorus which was taken
up during aerobic conditions, and during aerobic conditions microorganisms take up
phosphorus.
Page | 14
According to Henze et al. (2008) and Barnard and Comeau (2014), the PhoStrip process
consists of a single aeration vessel with a clarifier. The process diverts from other enhanced
biological phosphorus removal processes because it consists of a side-stream enriched with
phosphorus (with a flow rate of about 10 to 30% of the influent flow rate) from the underflow
of the clarifier to an anaerobic stripper which promotes the release of intracellular phosphate.
The phosphorus enriched supernatant is then treated with lime in a precipitator tank to
chemically precipitate phosphorus which is settled and wasted. The precipitator tank
supernatant is either returned to the influent for further phosphorus removal or taken to the
effluent stream. The application of the PhoStrip in wastewater treatment has demonstrated
higher phosphorus removal efficiencies. Jin et al. (2014) conducted a study on treating
domestic sewage using the Phostrip process and lime as the phosphorus removal chemical.
They reported overall removal efficiencies on COD, TN and TP of 86, 62.8 and 98.1%
respectively.
Other Enhanced Biological Phosphorus Removal Processes
With practical research evidence presented by Fuhs and Chen (1975) and Barnard (1947), the
enhanced biological phosphorus removal process from waste streams follow the same
phosphorus removal mechanism which is basically subjecting activated sludge microbial
population to a sequence of anaerobic and aerobic conditions. Furthermore, Fuhs and Chen
(1975) studied the microbiological aspect of the enhanced biological phosphorus removal
process and they reported that the Aeinetobacter is the main organism genus which stimulates
phosphorus removal. There are other enhanced biological phosphorus removal processes which
are used, however, they all follow the same phosphorus removal mechanism processes like the
Phoredox method which was introduced by Barnard (1976).
For the Phoredox phosphorus removal process Barnard (1976), explained the phosphorus
removal mechanism from a different point of scientific view. In the Phoredox method Barnard
(1976) states that it is not the phosphorus release which stimulates phosphrus removal,
however, the release of phosphorus indicates the establishment of a low redox in the anaerobic
environment, therefore phosphorus removal is stimulated by the low redox potential. In further
studying the Phoredox process, Barnard (1976) experienced some challenges in measuring the
redox potential which led to a conclusion that by measuring phosphorus release in the anaerobic
zone could serve as a parameter to indicate that conditions necessary for enhanced biological
phosphorus removal prevailed (Henze et al. 2008). In preventing nitrate from affecting the
Page | 15
phosphorus removal process in the Phoredox system, the retention time of the anaerobic reactor
is increased to one hour which is suggested to be the nominal time (Liu and Liptak 1999; Henze
et al. 2008).
To date, studies are still being conducted in improving the phosphorus removal processes from
waste streams, and the sequencing batch reactor system has been investigated for biological
nutrient removal, not just phosphorus removal (Mittal 2011). Enhanced biological phosphorus
removal can be achieved by employing the sequencing batch reactor system. This phosphorus
removal system has cemented its application in wastewater treatment plants due to its flexible
operation configuration (Mittal 2011; Metcalf and Eddy 2014). Phosphorus removal in the
sequencing batch reactor system is met by peforming a sequence of operations which are
basically anaerobic, mixing, aeration and clarification with all steps taking place in a single
reactor (Liu and Liptak 1999; Mittal 2011; Metcalf and Eddy 2014).
The sequencing batch reactor system application in wastewater treatment for phosphorus
removal has demonstrated some advantages over other enhanced biological phosphorus
removal systems. The sequencing batch reactor system can accomplish biological phosphorus
removal alone or it can be modified to accomplish phosphorus removal with nitrification
(Manning and Irvine 1985; Metcalf and Eddy 2014).
2.2 Parameters Affecting Biological Nutrient Removal
There are a number of factors which can limit the performance of any biological nutrient
removal system from wastewater, thus they need to be taken into consideration. The subsequent
sub-sections discuss some of these factors.
2.2.1 Wastewater composition
The composition of industrial wastewater fluctuates significantly depending on the activities
taking place inside. Biological nutrient removal processes are sensitive to disturbances caused
by pollutant fluctuations in wastewater which result in sudden drastic changes to the system
(Shehab et al. 1996; Mulkerrins, Dobson and Colleran 2004). Fluctuations of organic loads in
influent streams compromise the treatment efficiency of biological nutrients removal, in
particular phosphates which can increase about 60% in the effluent stream (Carucci et al.
1999).
Page | 16
Furthermore, biological nutrient removal processes involve the use of microorganisms which
are sensitive to disturbances. Changes in influent organic pollutants composition, such as from
volatile fatty acids to sugars, stimulate the accumulation of glycogen accumulating organisms
(Satoh, Mino and Matsuo 1994). Moreover, it is imperative to determine the optimal COD
loading rate since excessive COD loading rates can lead to deterioration of the nutrient removal
process (Satoh, Mino and Matsuo 1994). According to Randall, Barnard and Stensel (1992),
for optimal removal of phosphorus the influent in the anaerobic zone of the biological
phosphorus removal process should have a BOD : TP ratio of > 20 : 1 or COD : P ratio of
> 40 : 1. Based on the above discussed parameters it is clear that wastewater composition or
pollutant concentration can have a direct effect on the treatment efficiency for biological
nutrient removal.
2.2.2 Temperature
According to Metcalf and Eddy (2003) and Gou et al. (2014), the performance or efficiency of
any biological process can be greatly affected by temperature, since it has a direct effect on the
metabolic activities of the microbial population, the gas transfer rate as well as the settling
characteristics of bio-solids. Furthermore, Mulkerrins, Dobson and Colleran (2004) reported
that biological nutrient removal higher effeciencies are achieved at a temperature range of 20
to 37˚C. However, Mulkerrins, Dobson and Colleran (2004) also indicated that there is
available literature in contrast, which state that better nutrient removal particularly phosphorus
removal is observed at a lower temperature range of 10 to 15˚C. The light in understanding the
contrast in optimum temperature range is given by Metcalf and Eddy (2003), where it was
indicated that microorganisms are classified according to certain temperature ranges in which
they function best. Therefore, bacteria is classified as chrophilic, mesophilic, or thermophilic
with an optimum temperature range of 12 to 18˚C, 25 to 40˚C and 55 to 65˚C respectively.
Furthermore, the different bacteria categories growth rate doubles with approximately every
10˚C increase in temperature until the optimum temperature is reached (Metcalf and Eddy
2003).
Brdjonovic et al. (1997) investigated the effect of temperature on dissolved oxygen
consumption rate for biological phosphorus removal. In their findings, they reported that
incomplete phosphorus uptake was observed at temperatures between 5 and 10 ̊ C in the aerobic
environment. Moreover, at temperatures between 20 and 30˚C complete phosphorus uptake
Page | 17
was observed. Similar observations were reported for the nitrification process (Mulkerrins,
Dobson and Colleran 2004). Gou et al. (2014) reported that temperature has a significant effect
on metabolic activities of microbial population compared to the organic loading rate.
2.2.3 pH control
From basic chemistry knowledge, lower pH values indicate acidic environment and higher pH
values indicate alkaline environment. According to Carrera et al. (2003), the optimum pH range
is from 7.5 to 8.5 for effective microbial population activity for the nitrification process.
Furthermore, Carrera et al. (2003) indicates that higher pH values are associated with the
equilibrium ammonium-ammonia being displaced to ammonia, thus inhibiting the nitrification
process. Metcalf and Eddy (2014), explains that the pH of an environment is a major factor in
the growth rate of organisms, moreover, at pH levels of above 9.5 or below 4.0, microbial
population metabolic activities are inhibited. Furthermore, Surampalli et al. (1997), with
practical evidence, reported that the nitrification rate decreases with pH. At pH levels of 6 and
below the nitrification process ceases.
2.2.4 Dissolved Oxygen (DO)
In a combined biological nutrient removal process it is imperative for the process to be designed
such that it satisfies the oxygen demand for all microbial communities present in the system
(Mulkerrins, Dobson and Colleran 2004). Louzeiro et al. (2002) investigated the potential for
denitrification and phosphorus removal of a full-scale sequencing batch reactor, with the use
of methanol as an external carbon source. In their findings, they reported that for biological
nutrient removal, DO levels of at least 2 mg/L are required and the optimum concentration
range is 3 to 4 mg/L for nitrification. Moreover, DO levels greater than 4 mg/L do not stimulate
any biological nutrient removal, thus they are associated with a waste of energy in terms of
aeration (Mulkerrins, Dobson and Colleran 2004).
2.2.5 Sludge quality and settleability
Zhang et al. (2015a) defines sludge settling as the separation from water by gravitational means
of suspended particles which are heavier than water. A good settling sludge is imperative for a
solid free effluent, thus improving the treatment efficacy of wastewater treatment processes.
According to Metcalf and Eddy (2003), the characteristics of activated sludge is determined by
the sludge volume index (SVI), which is basically the volume of 1 g of sludge after 30 minutes
Page | 18
of settling. Furthermore, SVI values below 100 are desired and values above 150 are normally
associated with filamentous growth.
Moreover, according to Mulkerrins, Dobson and Colleran (2004), activated sludge treatment
facilities experience filamentous bulking which result when “filamentous organisms proliferate
to such an extent as to interfere with the proper compaction of settling sludge.” Andreasen and
Sigvardsen (1996) investigated the settling properties of activated sludge. In their findings,
they reported that phosphorus removal processes have demonstrated good sludge settling
characteristics, while plants performing simultaneous denitrification have demonstrated
otherwise. Chang, Chiou and Ouyang (1996) investigated the sludge settleability for a process
treating wastewater with high COD : P ratio. In their study they reported SVI values fluctuating
between 69 and 370 mL/g with phosphorus removal of 75% on average. Krishna and van
Loosdrecht (1999) with practical evidence, reported that for the sequencing batch reactor
system, the SVI increased with temperature from 15 to 35˚C.
2.2.6 Volatile Fatty Acids (VFA)
According to Comeau et al. (1996), one of the factors considered for process optimisation in
biological nutrient removal processes is maximasing VFA production, particularly in
phosphorus removal systems. The effect of VFA on nutrient removal was investigated by
Pitman (1999) and Ruel et al. (2002) where they reported that VFA is essential for effective
biological phosphorus removal. For every 1 mg of phosphorus removed, about 7 – 9 mg of
VFA is needed. Moreover, effluent phosphorus levels of 0.2 – 0.3 mg/L has been reported by
Oldham et al. (1994) where they used VFA to stimulate phosphorus removal. Apart from VFA
there are other organic compounds which can be used by PAOs under anaerobic environment
compounds such as carboxylic acids, sugars and amino acids. Moreover, the maximum rate of
phosphorus release under anaerobic conditions can be achieve when acetate and propionate are
utilised as the carbon source (Satoh et al. 1996).
2.2.7 Solids Retention Time (SRT)
The SRT is defined as the average period of time that sludge has remained in the system. For
activated sludge process design the SRT is considered as a critical parameter since it affects
the process performance, reactor volume, sludge production, and oxygen requirements. The
SRT may vary from 3 to 5 days depending on the mixed-liquor temperature. Under mesophilic
Page | 19
conditions a SRT of 3 days is desired. However, under low temperature conditions the SRT
tends to be longer since under operation conditions of 10˚C a SRT of 5 to 6 days is
recommended by Metcalf and Eddy (2003).
A number of studies have been conducted on SRT variation for optimum biological nutrient
removal, in particular for phosphorus removal. Mamais and Jenkins (1992) obtained higher
nutrient removal at SRT greater than 2.9 days. Moreover, Chuang et al. (1998) achieved higher
phosphorus removal at a SRT of 10 days. Chang, Chiou and Ouyang (1996) investigated SRT
variation on phosphorus removal using a SRT of 5, 10 and 15 days and in their findings they
reported a higher phosphorus removal efficiency at a SRT of 10 days. On the other hand, Ge,
Batstone and Keller (2015) investigated the performance of an SBR for enhanced phosphorus
removal under very low SRT between 0.5 to 2 days using abattoir wastewater with a high
organic loading rate. The findings of their study reported a stable EBPR system with SRT of 2
to 2.5 days with 80 % COD and phosphorus removal.
2.3 Brewery Wastewater
The brewing industry is considered to be one of the industries which use voluminous quantities
of fresh water and generate enormous amounts of wastewater during beer production. Industrial
wastewater generated from the brewery is characterised by large quantities of toxic chemicals,
biological nutrients and organic matter pollutants. These pollutants may pose serious risk to
the environment, particularly to water receiving bodies if not properly treated prior to being
disposed (Goldammer 2008; Geoffrey et al. 2011; Abimbola et al. 2015).
The subsequent sub-sections of this chapter focus on brewery wastewater characteristics,
biological methods that are used for brewery wastewater treatment as well as previously done
studies on wastewater.
2.3.1 Characteristics of brewery wastewater
Wastewater from the brewery contains high concentrations of biodegradable organic and
inorganic pollutants which are characterised by the 5-day biochemical oxygen demand (BOD5),
chemical oxygen demand (COD), ammonia, and total suspended solids (TSS) (Gregor, Matej
and Milenko 2007; Fu et al. 2013; Bakare, Shabangu and Chetty 2017). The organic pollutants
Page | 20
which are found in brewery wastewater are mainly sugars, soluble starch, ethanol, volatile fatty
acids and many more (Goldammer 2008).
Previously done studies on brewery wastewater indicate that pollutant composition in brewery
wastewater fluctuates greatly depending on the activities taking place inside the brewing house
(Cronin and Lo 1998; Carrera et al. 2003; Goldammer 2008; Fu et al. 2013). The brewing
process involves a number of batch operations which require voluminous water usage when
processing raw material to the final beer product (Parawira et al. 2005; Geoffrey et al. 2011;
Abimbola et al. 2015). Moreover, after each batch large volumes of water are used for general
washing of floors, cleaning the brewing-house, cellars and cleaning-in-place, thus resulting in
the production of brewery effluent high in organic and inorganic pollutants as well as being
acidic (Parawira et al. 2005; Tansiphorn, Suraphong and Prasert 2009).
According to a research study conducted by Goldammer (2008), brewery wastewater have
temperatures ranging from 25 to 38˚C, but occasionally reaching much higher temperatures.
pH levels range from 2 to 12 and are influenced by the amount and type of chemicals used in
the cleaning and sanitizing process which are normally caustic soda, phosphoric acid and nitric
acid. Furthermore, besides the organic pollutant characteristics of brewery wastewater
mentioned above which are BOD5, COD and TSS, brewery wastewater is also characterized
by the concentration of biological nutrients, particularly nitrogen as nitrates and phosphorus as
orthophosphates (Ochieng, Odiyo and Mutsago 2003; Goldammer 2008). Wastewater from the
brewery requires treatment prior to being discharged into receiving bodies since it contains a
high-strength of organic and inorganic pollutants which require oxygen for degradation
(Geoffrey et al. 2011). Table 2.1, which was formulated from previously done research work
on brewery wastewater, presents pollutant composition in brewery wastewater.
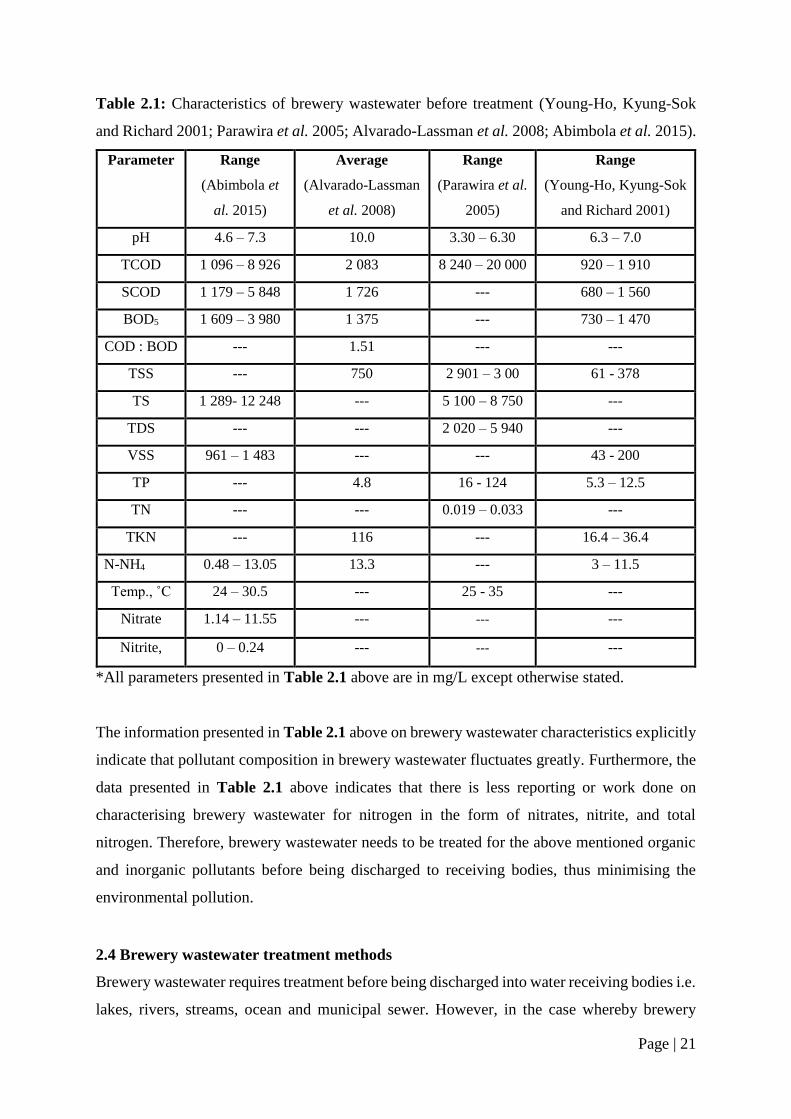
Page | 21
Table 2.1: Characteristics of brewery wastewater before treatment (Young-Ho, Kyung-Sok
and Richard 2001; Parawira et al. 2005; Alvarado-Lassman et al. 2008; Abimbola et al. 2015).
Parameter Range
(Abimbola et
al. 2015)
Average
(Alvarado-Lassman
et al. 2008)
Range
(Parawira et al.
2005)
Range
(Young-Ho, Kyung-Sok
and Richard 2001)
pH 4.6 – 7.3 10.0 3.30 – 6.30 6.3 – 7.0
TCOD 1 096 – 8 926 2 083 8 240 – 20 000 920 – 1 910
SCOD 1 179 – 5 848 1 726 --- 680 – 1 560
BOD5 1 609 – 3 980 1 375 --- 730 – 1 470
COD : BOD --- 1.51 --- ---
TSS --- 750 2 901 – 3 00 61 - 378
TS 1 289- 12 248 --- 5 100 – 8 750 ---
TDS --- --- 2 020 – 5 940 ---
VSS 961 – 1 483 --- --- 43 - 200
TP --- 4.8 16 - 124 5.3 – 12.5
TN --- --- 0.019 – 0.033 ---
TKN --- 116 --- 16.4 – 36.4
N-NH4 0.48 – 13.05 13.3 --- 3 – 11.5
Temp., ˚C 24 – 30.5 --- 25 - 35 ---
Nitrate 1.14 – 11.55 --- --- ---
Nitrite, 0 – 0.24 --- --- ---
*All parameters presented in Table 2.1 above are in mg/L except otherwise stated.
The information presented in Table 2.1 above on brewery wastewater characteristics explicitly
indicate that pollutant composition in brewery wastewater fluctuates greatly. Furthermore, the
data presented in Table 2.1 above indicates that there is less reporting or work done on
characterising brewery wastewater for nitrogen in the form of nitrates, nitrite, and total
nitrogen. Therefore, brewery wastewater needs to be treated for the above mentioned organic
and inorganic pollutants before being discharged to receiving bodies, thus minimising the
environmental pollution.
2.4 Brewery wastewater treatment methods
Brewery wastewater requires treatment before being discharged into water receiving bodies i.e.
lakes, rivers, streams, ocean and municipal sewer. However, in the case whereby brewery
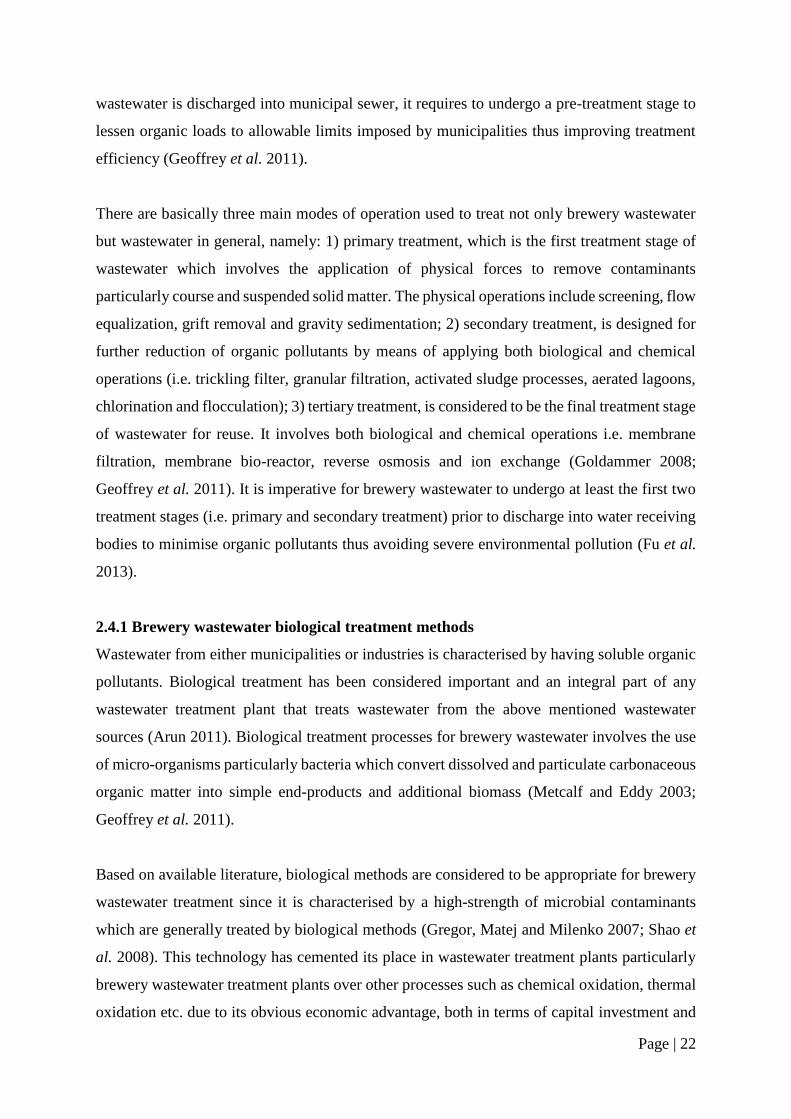
Page | 22
wastewater is discharged into municipal sewer, it requires to undergo a pre-treatment stage to
lessen organic loads to allowable limits imposed by municipalities thus improving treatment
efficiency (Geoffrey et al. 2011).
There are basically three main modes of operation used to treat not only brewery wastewater
but wastewater in general, namely: 1) primary treatment, which is the first treatment stage of
wastewater which involves the application of physical forces to remove contaminants
particularly course and suspended solid matter. The physical operations include screening, flow
equalization, grift removal and gravity sedimentation; 2) secondary treatment, is designed for
further reduction of organic pollutants by means of applying both biological and chemical
operations (i.e. trickling filter, granular filtration, activated sludge processes, aerated lagoons,
chlorination and flocculation); 3) tertiary treatment, is considered to be the final treatment stage
of wastewater for reuse. It involves both biological and chemical operations i.e. membrane
filtration, membrane bio-reactor, reverse osmosis and ion exchange (Goldammer 2008;
Geoffrey et al. 2011). It is imperative for brewery wastewater to undergo at least the first two
treatment stages (i.e. primary and secondary treatment) prior to discharge into water receiving
bodies to minimise organic pollutants thus avoiding severe environmental pollution (Fu et al.
2013).
2.4.1 Brewery wastewater biological treatment methods
Wastewater from either municipalities or industries is characterised by having soluble organic
pollutants. Biological treatment has been considered important and an integral part of any
wastewater treatment plant that treats wastewater from the above mentioned wastewater
sources (Arun 2011). Biological treatment processes for brewery wastewater involves the use
of micro-organisms particularly bacteria which convert dissolved and particulate carbonaceous
organic matter into simple end-products and additional biomass (Metcalf and Eddy 2003;
Geoffrey et al. 2011).
Based on available literature, biological methods are considered to be appropriate for brewery
wastewater treatment since it is characterised by a high-strength of microbial contaminants
which are generally treated by biological methods (Gregor, Matej and Milenko 2007; Shao et
al. 2008). This technology has cemented its place in wastewater treatment plants particularly
brewery wastewater treatment plants over other processes such as chemical oxidation, thermal
oxidation etc. due to its obvious economic advantage, both in terms of capital investment and
Page | 23
operation costs (Arun 2011). Biological treatment methods of brewery wastewater can be either
aerobic, anaerobic, or anoxic (Goldammer 2008; Shao et al. 2008) as discussed in more detail
in the subsequent sections.
2.4.1.1 Aerobic biological treatment processes for brewery wastewater
Aerobic biological treatment can be defined as a process which takes place in the presence of
oxygen using micro-organisms called aerobes particularly bacteria that metabolize organic
pollutants in wastewater thereby producing biomass and inorganic end-products (Arun 2011;
Geoffrey et al. 2011). Traditionally brewery wastewater is treated by employing aerobic
processes (Shao et al. 2008). In practice there are multitudes of aerobic and anaerobic
biological treatment processes, however, in this dissertation three processes which are widely
applicable in industrial wastewater treatment, specifically brewery wastewater are discussed
namely; 1) conventional activated sludge process system; 2) cyclic activated sludge process
system; 3) membrane bioreactor system. However, research studies conducted on brewery
wastewater treatment indicates that aerobic treatments require an intensive amount of energy
for aeration. Furthermore, aerobic treatment processes produce large amounts of wasted sludge,
thus making the process to be costly since large capital is required for the handling and disposal
of sludge (Parawira et al. 2005; Shao et al. 2008; Matthew et al. 2010).
Conventional activated sludge process system
This technology is considered to be the ancient and most common biological treatment process
used to treat both municipal and industrial wastewater. After the primary treatment stage of
wastewater i.e. the removal of suspended solids particularly in brewery wastewater, the
conventional activated sludge process which is basically a biological process is then employed
as the next treatment stage for wastewater. The system consists of an aeration vessel/tank which
could be absolute mixed or a plug flow bioreactor operating under specific concentration of
biomass measured as mixed liquor suspended solids (MLSS) maintained with sufficient
dissolved oxygen for effective biodegradation of solute organic impurities. The MLSS from
the aerated vessel is allowed to overflow by gravity to a secondary clarifier unit to separate out
biomass from clarified treated water (Metcalf and Eddy 2003; Arun 2011; Geoffrey et al.
2011). Figure 2.3 is a schematic presentation of a conventional activated sludge process giving
an overview summary of the process.
Page | 24
Wastewater influentClarifier
Effluent
Waste activated sludgeReturn activated sludge
Aeration tank
Figure 2.3: Conventional activated sludge process diagram (Arun 2011).
The Jet Loop Reactor (JLR) is considered to be widely employed in the conventional activated
sludge process system for wastewater treatment (James, Anderson and Willey 1995). Yildiza
et al. (2005), investigated the suitability of an aerobic JLR for biological treatment of
wastewater with a high strength of organic pollutants, and brewery wastewater is characterised
with a high strength of organic pollutants as mentioned in section 2.3 of this chapter. In their
study a treatment efficiency of 97% in terms of COD removal was attained, for an organic load
of 68 kg COD/m3.day over a period of 10 weeks. However, in their study, the treatment
efficiency decreased to 60% for higher organic loads and it was concluded that the decrease in
treatment efficiency was as a result of insufficient oxygen intake. Aerobic activated sludge
processes are associated with biomass or sludge formation. Yildiza et al. (2005), in their study
at a food/microorganism ratio of above 17/day sludge with unsatisfactory settling
characteristics formed under turbulent conditions.
Furthermore, the performance of a high rate aerobic JLR activated sludge process for biological
treatment of brewery wastewater was investigated by James, Anderson and Willey (1995). In
their study, a treatment efficiency of 97% in terms of COD removal was attained with a loading
rate of 50 kg COD/m3.day over a period of 5 weeks. The study also gave acceptable sludge
settleability with a maximum growth rate of 12.2/day and a yield of 0.4 kg VSS produced/kg
COD removed. Eusebio et al. (2004) also investigated the performance of an aerobic JLR for
biological treatment of winery wastewater. In their study an overall treatment efficiency of
80% in terms of COD removal was achieved at a retention time range of 0.8 – 1 day. Based on
the studies discussed above which were conducted by (James, Anderson and Willey 1995;
Eusebio et al. 2004; Yildiza et al. 2005). The aerobic JLR activated sludge system under the
mentioned operating conditions demonstrated higher treatment efficiencies which makes it
suitable for brewery wastewater pre-treatment with a 97% treatment efficiency. Moreover,
based on the unsatisfactory sludge settling obtained by Yildiza et al. (2005), in their study a
Page | 25
recommendation can be made that further investigation needs to be done in the reactor aeration
system to be able to handle higher organic loading rates.
Cyclic activated sludge system (CASS) or Sequencing Batch Reactor (SBR) System
To date, wastewater from municipal sewers and a variety of industries including food
processing plants, brewery wastewater treatment plants, refineries and petroleum wastewater
treatment plants use the cyclic activated sludge treatment system (Arun 2011). The CASS is
basically one of the most popular sequencing batch reactor (SBR) systems employed in treating
wastewater from the above mentioned wastewater sources. This biological treatment system of
wastewater has cemented its application in wastewater treatment plants because it offers
several operational and performance advantages over conventional ASP systems namely; 1)
performs all the functions of a conventional activated sludge process in a single basin under
alternating mode of operation; 2) offers a methodology that has operational simplicity,
flexibility and reliability which is not available in conventionally configured activated sludge
systems (Metcalf and Eddy 2003; Arun 2011).
To date, studies are conducted on biological nutrient removal from industrial wastewater
particularly brewery wastewater for further improvement of the SBR technology which has
cemented its application in most wastewater treatment plants (Arun 2011). Rodrigues, Brito
and Melo (2001) investigated the performance of a SBR for biological post-treatment of
brewery wastewater rejected by an upflow anaerobic sludge blanket reactor. The main
objective of their research study was the removal of biological nutrients, specifically the
nitrogen group pollutants from brewery wastewater to achieve the required wastewater quality
discharge to surface water. In their study, the SBR was operated in an aerobic-anoxic sequence
to allow simultaneous nitrification and denitrification processes to take place. An ammonium
(NH4 – N) removal efficiency of 97% was achieved at a maximum rate of 0.175 kg NH4 – N/kg
VSS.day, however, it was reported that the denitrification process was supressed when the bulk
liquid oxygen concerntration was increased above 6 mg O2/L.
Based on the above mentioned findings of the study, it can be concluded that the SBR
technology demonstrated a high treatment efficiency on biological nutrient removal from
brewery wastewater when operated under the above mentioned conditions. Moreover, in their
study, they did not experience any sludge settling challenges which is a fundamental factor to
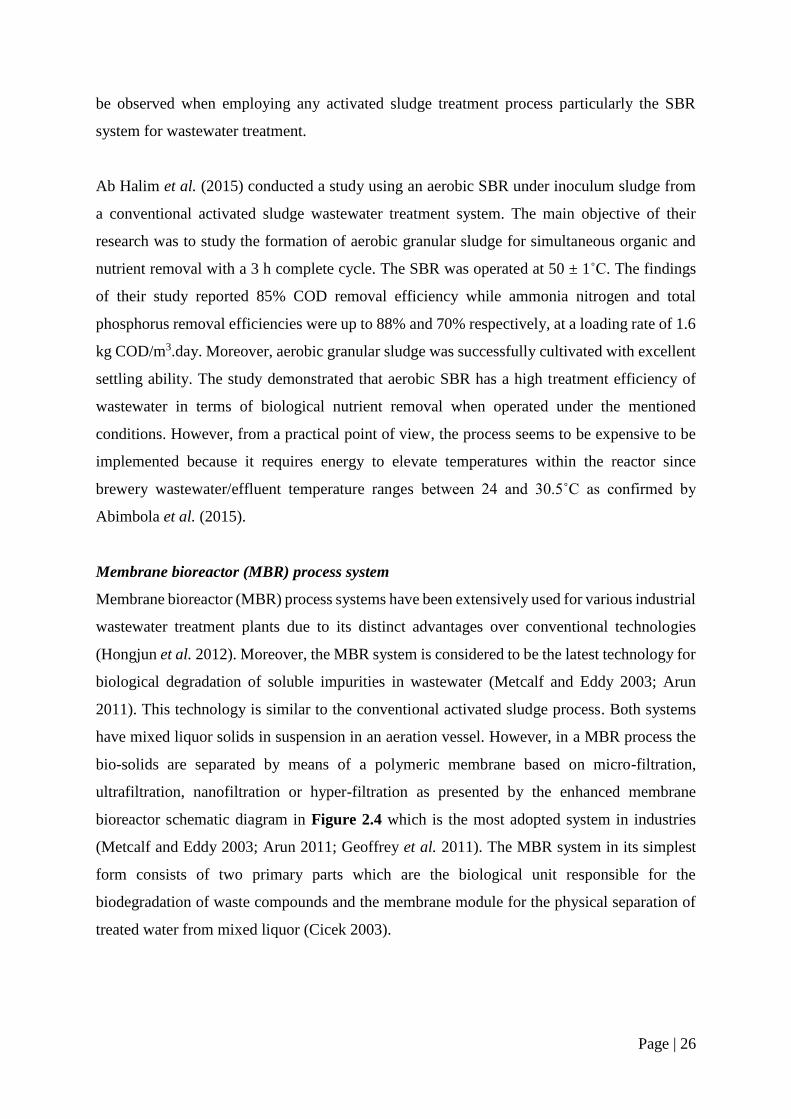
Page | 26
be observed when employing any activated sludge treatment process particularly the SBR
system for wastewater treatment.
Ab Halim et al. (2015) conducted a study using an aerobic SBR under inoculum sludge from
a conventional activated sludge wastewater treatment system. The main objective of their
research was to study the formation of aerobic granular sludge for simultaneous organic and
nutrient removal with a 3 h complete cycle. The SBR was operated at 50 ± 1˚C. The findings
of their study reported 85% COD removal efficiency while ammonia nitrogen and total
phosphorus removal efficiencies were up to 88% and 70% respectively, at a loading rate of 1.6
kg COD/m3.day. Moreover, aerobic granular sludge was successfully cultivated with excellent
settling ability. The study demonstrated that aerobic SBR has a high treatment efficiency of
wastewater in terms of biological nutrient removal when operated under the mentioned
conditions. However, from a practical point of view, the process seems to be expensive to be
implemented because it requires energy to elevate temperatures within the reactor since
brewery wastewater/effluent temperature ranges between 24 and 30.5˚C as confirmed by
Abimbola et al. (2015).
Membrane bioreactor (MBR) process system
Membrane bioreactor (MBR) process systems have been extensively used for various industrial
wastewater treatment plants due to its distinct advantages over conventional technologies
(Hongjun et al. 2012). Moreover, the MBR system is considered to be the latest technology for
biological degradation of soluble impurities in wastewater (Metcalf and Eddy 2003; Arun
2011). This technology is similar to the conventional activated sludge process. Both systems
have mixed liquor solids in suspension in an aeration vessel. However, in a MBR process the
bio-solids are separated by means of a polymeric membrane based on micro-filtration,
ultrafiltration, nanofiltration or hyper-filtration as presented by the enhanced membrane
bioreactor schematic diagram in Figure 2.4 which is the most adopted system in industries
(Metcalf and Eddy 2003; Arun 2011; Geoffrey et al. 2011). The MBR system in its simplest
form consists of two primary parts which are the biological unit responsible for the
biodegradation of waste compounds and the membrane module for the physical separation of
treated water from mixed liquor (Cicek 2003).
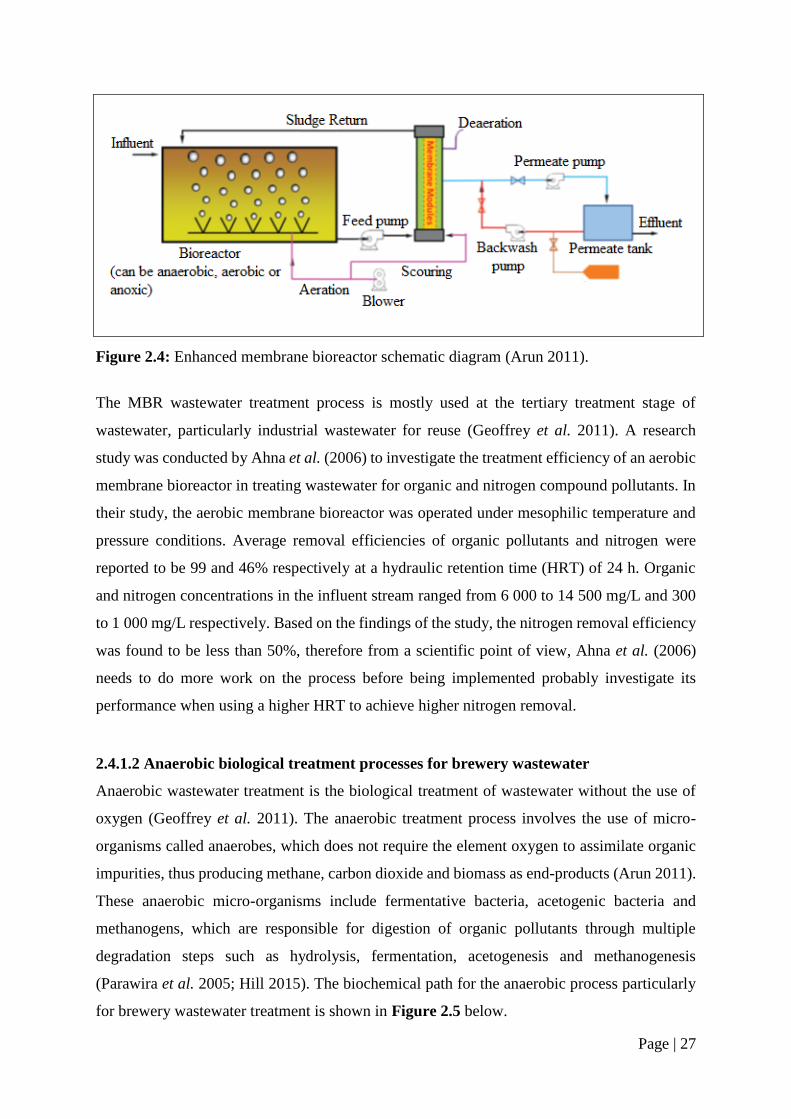
Page | 27
Figure 2.4: Enhanced membrane bioreactor schematic diagram (Arun 2011).
The MBR wastewater treatment process is mostly used at the tertiary treatment stage of
wastewater, particularly industrial wastewater for reuse (Geoffrey et al. 2011). A research
study was conducted by Ahna et al. (2006) to investigate the treatment efficiency of an aerobic
membrane bioreactor in treating wastewater for organic and nitrogen compound pollutants. In
their study, the aerobic membrane bioreactor was operated under mesophilic temperature and
pressure conditions. Average removal efficiencies of organic pollutants and nitrogen were
reported to be 99 and 46% respectively at a hydraulic retention time (HRT) of 24 h. Organic
and nitrogen concentrations in the influent stream ranged from 6 000 to 14 500 mg/L and 300
to 1 000 mg/L respectively. Based on the findings of the study, the nitrogen removal efficiency
was found to be less than 50%, therefore from a scientific point of view, Ahna et al. (2006)
needs to do more work on the process before being implemented probably investigate its
performance when using a higher HRT to achieve higher nitrogen removal.
2.4.1.2 Anaerobic biological treatment processes for brewery wastewater
Anaerobic wastewater treatment is the biological treatment of wastewater without the use of
oxygen (Geoffrey et al. 2011). The anaerobic treatment process involves the use of micro-
organisms called anaerobes, which does not require the element oxygen to assimilate organic
impurities, thus producing methane, carbon dioxide and biomass as end-products (Arun 2011).
These anaerobic micro-organisms include fermentative bacteria, acetogenic bacteria and
methanogens, which are responsible for digestion of organic pollutants through multiple
degradation steps such as hydrolysis, fermentation, acetogenesis and methanogenesis
(Parawira et al. 2005; Hill 2015). The biochemical path for the anaerobic process particularly
for brewery wastewater treatment is shown in Figure 2.5 below.
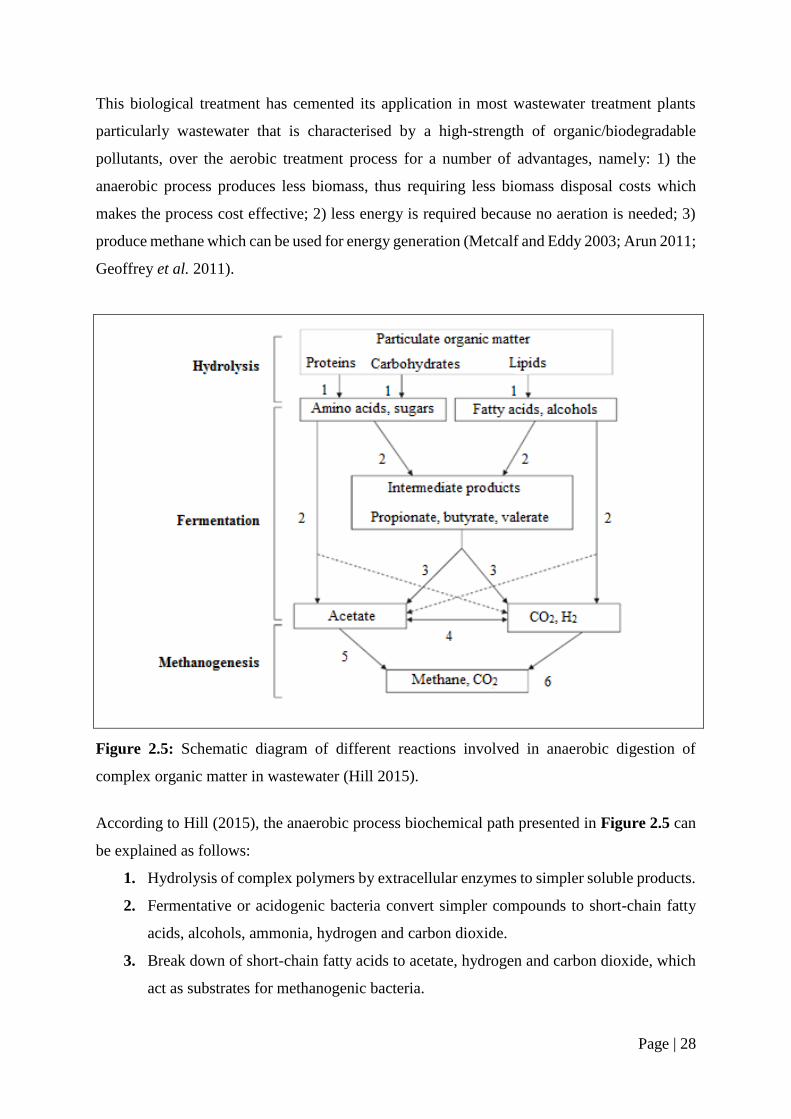
Page | 28
This biological treatment has cemented its application in most wastewater treatment plants
particularly wastewater that is characterised by a high-strength of organic/biodegradable
pollutants, over the aerobic treatment process for a number of advantages, namely: 1) the
anaerobic process produces less biomass, thus requiring less biomass disposal costs which
makes the process cost effective; 2) less energy is required because no aeration is needed; 3)
produce methane which can be used for energy generation (Metcalf and Eddy 2003; Arun 2011;
Geoffrey et al. 2011).
Figure 2.5: Schematic diagram of different reactions involved in anaerobic digestion of
complex organic matter in wastewater (Hill 2015).
According to Hill (2015), the anaerobic process biochemical path presented in Figure 2.5 can
be explained as follows:
1. Hydrolysis of complex polymers by extracellular enzymes to simpler soluble products.
2. Fermentative or acidogenic bacteria convert simpler compounds to short-chain fatty
acids, alcohols, ammonia, hydrogen and carbon dioxide.
3. Break down of short-chain fatty acids to acetate, hydrogen and carbon dioxide, which
act as substrates for methanogenic bacteria.
Page | 29
4. Reaction carried out by acetogenic bacteria.
5. About 70% of methane is produced by aceticlastic methanogens using acetate as a
substrate.
6. Methane production by hydrogenophillic methanogens using carbon dioxide and
hydrogen.
Application of Anaerobic Sequencing Batch Reactors in Wastewater Treatment
From available documented literature, in recent years there has been an increasing interest in
the application of anaerobic treatment for brewery wastewater since the nature and strength of
brewery wastewater often provides ideal conditions for anaerobic operations (Parawira et al.
2005). Shao et al. (2008) investigated the performance of a pilot-scale SBR in treating brewery
wastewater for organic pollutants. The reactor was operated under mesophilic conditions at a
controlled temperature of ±33˚C, with a working reactor volume of 45 L. The findings of their
study reported a COD removal of more than 90% for a controlled organic loading rate between
1.5 kg COD/m3.d and 5.0 kg COD/m3.d at a HRT of one (1) day. Furthermore, sludge
granulation was achieved in the reactor at approximately 60 days. Moreover, in their study a
high treatment efficiency of more than 90% was achieved at a HRT of one day which is less
than the reported HRT by Kim et al. (2006) of 8 to 12 days under mesophilic conditions. Their
work demonstrated that the anaerobic SBR technology can be implemented for brewery
wastewater treatment operating under the mentioned organic loading rate. However, nothing
was reported on the amount of methane produced, therefore, futher investigation has to be
conducted in determining the quantity of methane produced by the system.
Wang et al. (2010) investigated the effect of high-strength ammonia nitrogen acclimation on
sludge activity in a SBR system. In their study, two batch experiments were conducted to treat
a series of wastewater influent with ammonia nitrogen concerntration ranging from 59 to 1152
mg/L, one with activated sludge acclimated to higher ammonia nitrogen concerntration and the
other with unacclimated activated sludge. The findings of their study reported a COD removal
greater than 83.81% and ammonia nitrogen removal of 99.83% for all 5 experimental runs
respectively, for activated sludge acclimated to higher ammonia nitrogen. Furthermore, a COD
removal of 54.16% and ammonia nitrogen removal of 61.98% was reported for the
unacclimated sludge treatment process. In their research study, it was found that activated
sludge acclimated to higher ammonia nitrogen concerntrations revealed higher COD and
ammonia nitrogen removal efficiencies. The findings of their study indicated that the activities
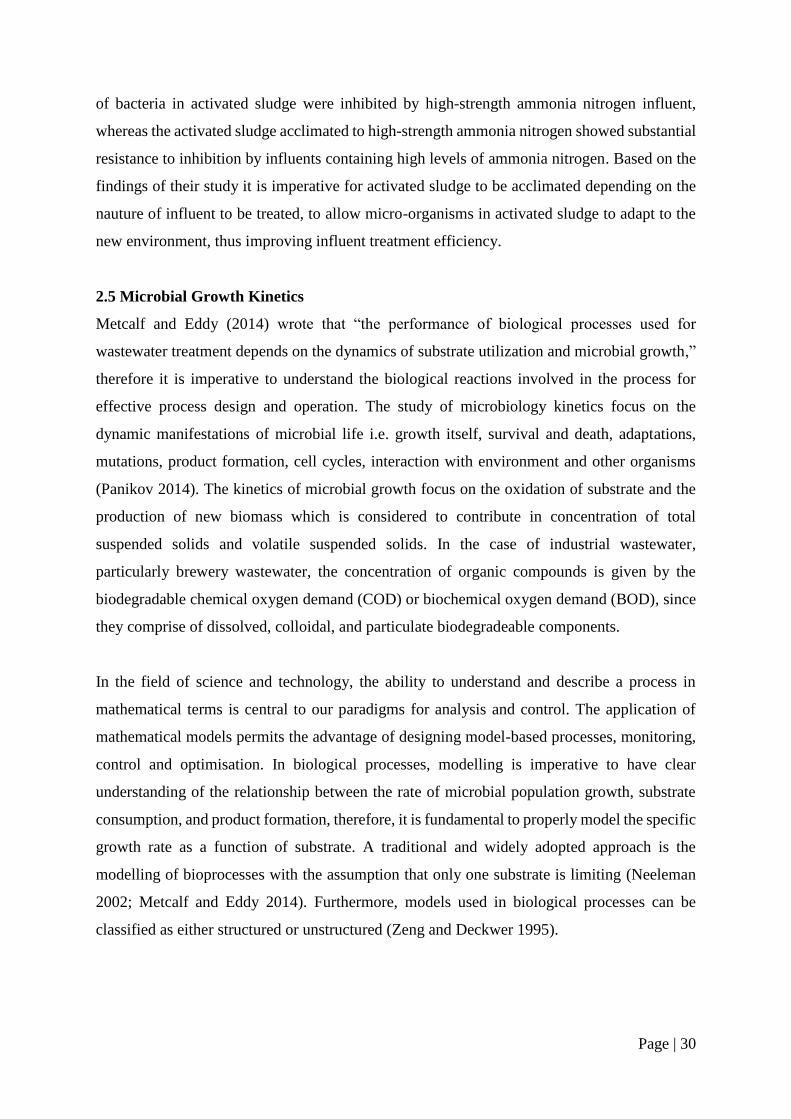
Page | 30
of bacteria in activated sludge were inhibited by high-strength ammonia nitrogen influent,
whereas the activated sludge acclimated to high-strength ammonia nitrogen showed substantial
resistance to inhibition by influents containing high levels of ammonia nitrogen. Based on the
findings of their study it is imperative for activated sludge to be acclimated depending on the
nauture of influent to be treated, to allow micro-organisms in activated sludge to adapt to the
new environment, thus improving influent treatment efficiency.
2.5 Microbial Growth Kinetics
Metcalf and Eddy (2014) wrote that “the performance of biological processes used for
wastewater treatment depends on the dynamics of substrate utilization and microbial growth,”
therefore it is imperative to understand the biological reactions involved in the process for
effective process design and operation. The study of microbiology kinetics focus on the
dynamic manifestations of microbial life i.e. growth itself, survival and death, adaptations,
mutations, product formation, cell cycles, interaction with environment and other organisms
(Panikov 2014). The kinetics of microbial growth focus on the oxidation of substrate and the
production of new biomass which is considered to contribute in concentration of total
suspended solids and volatile suspended solids. In the case of industrial wastewater,
particularly brewery wastewater, the concentration of organic compounds is given by the
biodegradable chemical oxygen demand (COD) or biochemical oxygen demand (BOD), since
they comprise of dissolved, colloidal, and particulate biodegradeable components.
In the field of science and technology, the ability to understand and describe a process in
mathematical terms is central to our paradigms for analysis and control. The application of
mathematical models permits the advantage of designing model-based processes, monitoring,
control and optimisation. In biological processes, modelling is imperative to have clear
understanding of the relationship between the rate of microbial population growth, substrate
consumption, and product formation, therefore, it is fundamental to properly model the specific
growth rate as a function of substrate. A traditional and widely adopted approach is the
modelling of bioprocesses with the assumption that only one substrate is limiting (Neeleman
2002; Metcalf and Eddy 2014). Furthermore, models used in biological processes can be
classified as either structured or unstructured (Zeng and Deckwer 1995).
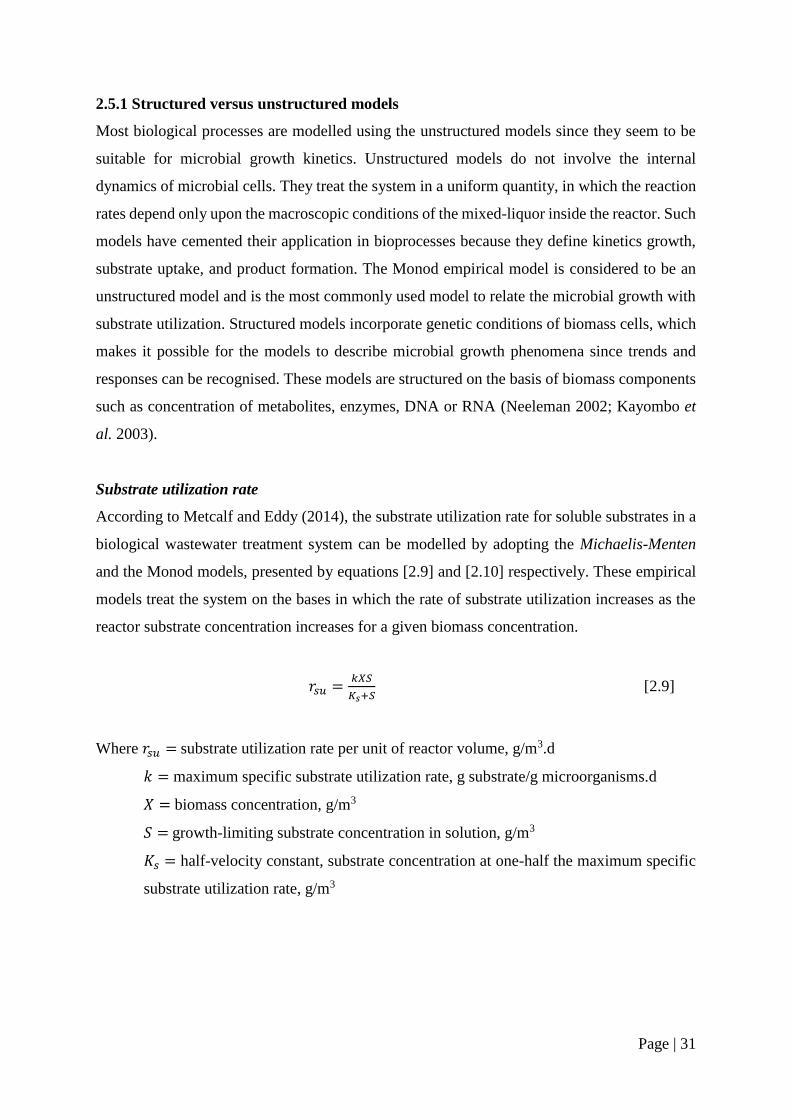
Page | 31
2.5.1 Structured versus unstructured models
Most biological processes are modelled using the unstructured models since they seem to be
suitable for microbial growth kinetics. Unstructured models do not involve the internal
dynamics of microbial cells. They treat the system in a uniform quantity, in which the reaction
rates depend only upon the macroscopic conditions of the mixed-liquor inside the reactor. Such
models have cemented their application in bioprocesses because they define kinetics growth,
substrate uptake, and product formation. The Monod empirical model is considered to be an
unstructured model and is the most commonly used model to relate the microbial growth with
substrate utilization. Structured models incorporate genetic conditions of biomass cells, which
makes it possible for the models to describe microbial growth phenomena since trends and
responses can be recognised. These models are structured on the basis of biomass components
such as concentration of metabolites, enzymes, DNA or RNA (Neeleman 2002; Kayombo et
al. 2003).
Substrate utilization rate
According to Metcalf and Eddy (2014), the substrate utilization rate for soluble substrates in a
biological wastewater treatment system can be modelled by adopting the Michaelis-Menten
and the Monod models, presented by equations [2.9] and [2.10] respectively. These empirical
models treat the system on the bases in which the rate of substrate utilization increases as the
reactor substrate concentration increases for a given biomass concentration.
𝑟𝑠𝑢 =𝑘𝑋𝑆
𝐾𝑠+𝑆 [2.9]
Where 𝑟𝑠𝑢 = substrate utilization rate per unit of reactor volume, g/m3.d
𝑘 = maximum specific substrate utilization rate, g substrate/g microorganisms.d
𝑋 = biomass concentration, g/m3
𝑆 = growth-limiting substrate concentration in solution, g/m3
𝐾𝑠 = half-velocity constant, substrate concentration at one-half the maximum specific
substrate utilization rate, g/m3
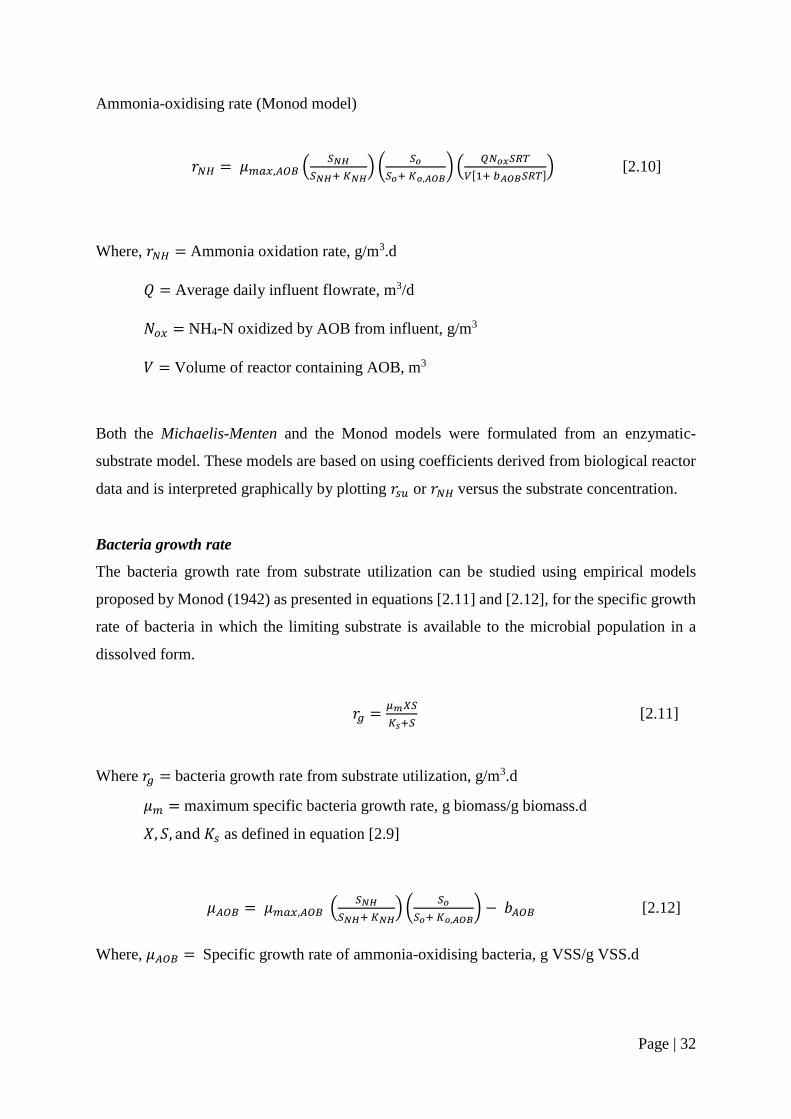
Page | 32
Ammonia-oxidising rate (Monod model)
𝑟𝑁𝐻 = 𝜇𝑚𝑎𝑥,𝐴𝑂𝐵 (𝑆𝑁𝐻
𝑆𝑁𝐻+ 𝐾𝑁𝐻) (
𝑆𝑜
𝑆𝑜+ 𝐾𝑜,𝐴𝑂𝐵) (
𝑄𝑁𝑜𝑥𝑆𝑅𝑇
𝑉[1+ 𝑏𝐴𝑂𝐵𝑆𝑅𝑇]) [2.10]
Where, 𝑟𝑁𝐻 = Ammonia oxidation rate, g/m3.d
𝑄 = Average daily influent flowrate, m3/d
𝑁𝑜𝑥 = NH4-N oxidized by AOB from influent, g/m3
𝑉 = Volume of reactor containing AOB, m3
Both the Michaelis-Menten and the Monod models were formulated from an enzymatic-
substrate model. These models are based on using coefficients derived from biological reactor
data and is interpreted graphically by plotting 𝑟𝑠𝑢 or 𝑟𝑁𝐻 versus the substrate concentration.
Bacteria growth rate
The bacteria growth rate from substrate utilization can be studied using empirical models
proposed by Monod (1942) as presented in equations [2.11] and [2.12], for the specific growth
rate of bacteria in which the limiting substrate is available to the microbial population in a
dissolved form.
𝑟𝑔 =𝜇𝑚𝑋𝑆
𝐾𝑠+𝑆 [2.11]
Where 𝑟𝑔 = bacteria growth rate from substrate utilization, g/m3.d
𝜇𝑚 = maximum specific bacteria growth rate, g biomass/g biomass.d
𝑋, 𝑆, and 𝐾𝑠 as defined in equation [2.9]
𝜇𝐴𝑂𝐵 = 𝜇𝑚𝑎𝑥,𝐴𝑂𝐵 (𝑆𝑁𝐻
𝑆𝑁𝐻+ 𝐾𝑁𝐻) (
𝑆𝑜
𝑆𝑜+ 𝐾𝑜,𝐴𝑂𝐵) − 𝑏𝐴𝑂𝐵 [2.12]
Where, 𝜇𝐴𝑂𝐵 = Specific growth rate of ammonia-oxidising bacteria, g VSS/g VSS.d
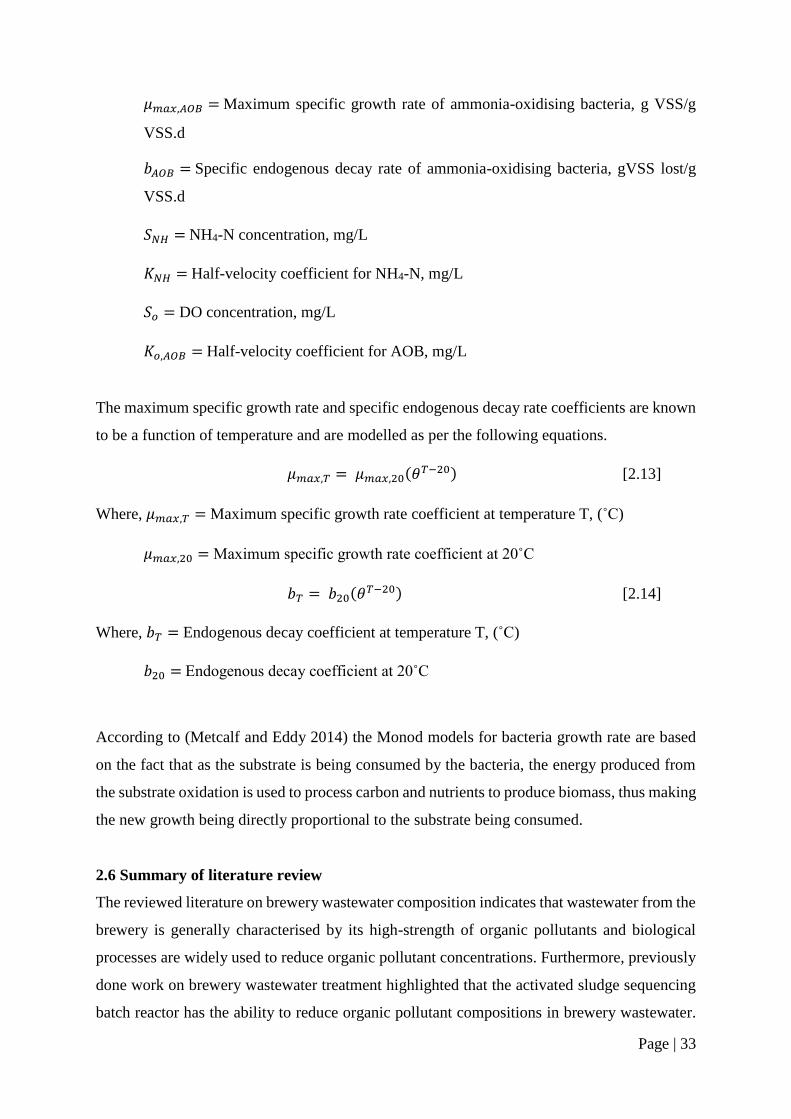
Page | 33
𝜇𝑚𝑎𝑥,𝐴𝑂𝐵 = Maximum specific growth rate of ammonia-oxidising bacteria, g VSS/g
VSS.d
𝑏𝐴𝑂𝐵 = Specific endogenous decay rate of ammonia-oxidising bacteria, gVSS lost/g
VSS.d
𝑆𝑁𝐻 = NH4-N concentration, mg/L
𝐾𝑁𝐻 = Half-velocity coefficient for NH4-N, mg/L
𝑆𝑜 = DO concentration, mg/L
𝐾𝑜,𝐴𝑂𝐵 = Half-velocity coefficient for AOB, mg/L
The maximum specific growth rate and specific endogenous decay rate coefficients are known
to be a function of temperature and are modelled as per the following equations.
𝜇𝑚𝑎𝑥,𝑇 = 𝜇𝑚𝑎𝑥,20(𝜃𝑇−20) [2.13]
Where, 𝜇𝑚𝑎𝑥,𝑇 = Maximum specific growth rate coefficient at temperature T, (˚C)
𝜇𝑚𝑎𝑥,20 = Maximum specific growth rate coefficient at 20˚C
𝑏𝑇 = 𝑏20(𝜃𝑇−20) [2.14]
Where, 𝑏𝑇 = Endogenous decay coefficient at temperature T, (˚C)
𝑏20 = Endogenous decay coefficient at 20˚C
According to (Metcalf and Eddy 2014) the Monod models for bacteria growth rate are based
on the fact that as the substrate is being consumed by the bacteria, the energy produced from
the substrate oxidation is used to process carbon and nutrients to produce biomass, thus making
the new growth being directly proportional to the substrate being consumed.
2.6 Summary of literature review
The reviewed literature on brewery wastewater composition indicates that wastewater from the
brewery is generally characterised by its high-strength of organic pollutants and biological
processes are widely used to reduce organic pollutant concentrations. Furthermore, previously
done work on brewery wastewater treatment highlighted that the activated sludge sequencing
batch reactor has the ability to reduce organic pollutant compositions in brewery wastewater.
Page | 34
However, most of the work done on brewery wastewater treatment focused on reducing organic
pollutants in terms of COD removal under anaerobic conditions since the system produces less
biomass compared to aerobic operating conditions. Moreover, the reviewed literature indicates
that it is imperative to study microbial growth kinetics for process optimisation and design.
Based on the reviewed literature, there is less reported work done on reducing brewery
wastewater pollutants in terms of nitrogen and phosphorus removal. A lot of studies focused
on COD removal. Furthermore, there is a gap in designing systems to handle wasted sludge in
a cost effective way. This research is driven by the necessity to reduce organic pollutant
concentrations, particularly biological nutrients i.e. nitrogen and phosphorus compounds in
industrial effluent which promotes eutrophication in receiving water bodies.
Page | 35
CHAPTER THREE
MATERIALS AND METHODS
3.1 Introduction
This chapter presents the experimental approach and materials used in this study, which covers
the aspect related to sample collection and preparation; detailed description of the equipment
design and the operational approach that was adopted in executing the study; the analytical
techniques which covers the type of sample analyses which were conducted and the methods
which were used. The chapter closes with a section of data analyses which explicitly discuss
the kind of statistical data analyses done and the tools which were used.
3.2 Experimental Materials
3.2.1 Raw Brewery Wastewater
In achieving the overall objective of the study, industrial wastewater samples were collected
from a local brewery wastewater treatment plant in Durban, South Africa. Samples were
collected mainly for characterisation and operation of the two laboratory scale SBRs to
investigate the performnace of the SBR system on orthophosphates, ammoniacal nitrogen,
nitrate and nitrite, total Kjeldhal nitrogen, total nitrogen, total inorganic nitrogen and total
organic nitrogen removal from industrial wastewater generated from the brewery. Collected
samples were transported to the laboratory in a cooler box full of ice to avoid any biological
activities, thus maintaining the sample’s biological condition from the sampling point to the
laboratory. Upon arrival at the laboratory, samples were allowed to warm up to room
temperature to conduct physicochemical analyses, thereafter charged to the reactors (i.e. SBR-
1 for nitrogen removal and SBR-2 for orthophosphates removal) to commence treatment
immediately. In cases whereby it was not possible to conduct all analyses immediately, samples
were stored in a refrigerator at 4˚C and analyses were conducted within 48 hours from the time
of sampling.
3.2.2 Sludge sampling and preparation
Activated sludge (microorganisms) was harvested from an anaerobic digester at a local brewery
wastewater treatment plant. Sludge was harvested using a 10 L bucket and then transported to
the laboratory as presented in Figure 3.1 below. In preparing the harvested sludge for
treatment, no chemicals were added in brewery wastewater nor to the microorganisms to
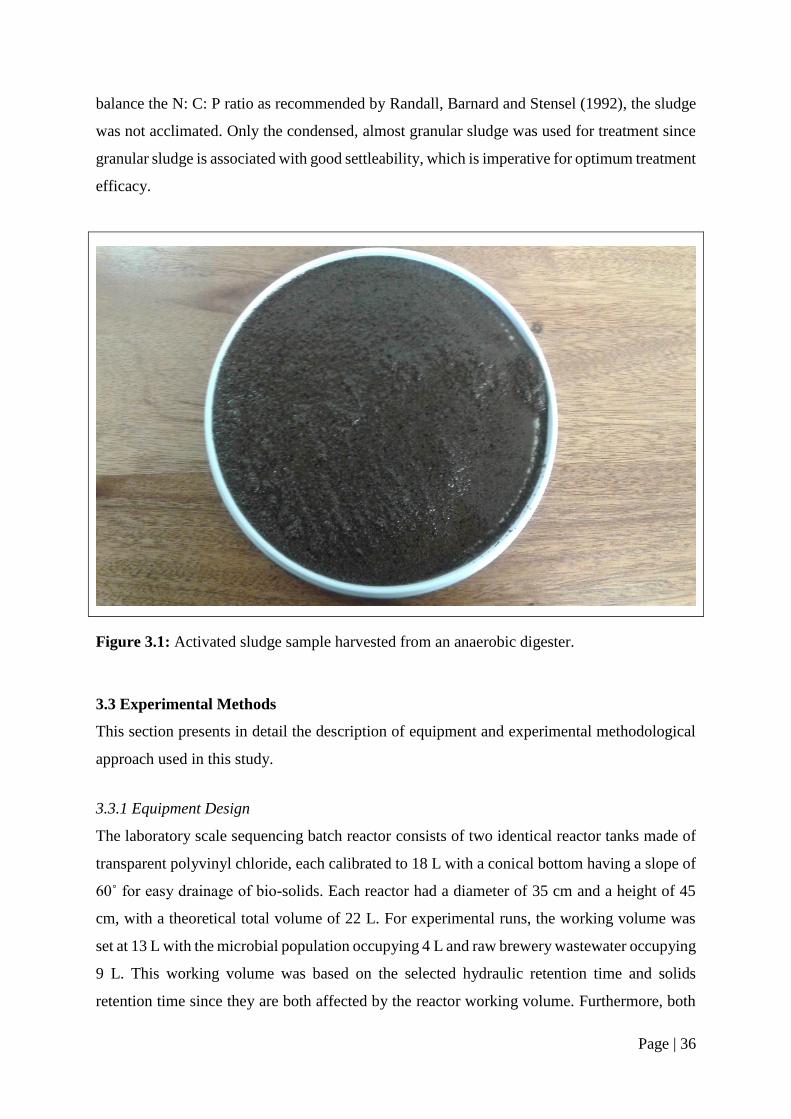
Page | 36
balance the N: C: P ratio as recommended by Randall, Barnard and Stensel (1992), the sludge
was not acclimated. Only the condensed, almost granular sludge was used for treatment since
granular sludge is associated with good settleability, which is imperative for optimum treatment
efficacy.
Figure 3.1: Activated sludge sample harvested from an anaerobic digester.
3.3 Experimental Methods
This section presents in detail the description of equipment and experimental methodological
approach used in this study.
3.3.1 Equipment Design
The laboratory scale sequencing batch reactor consists of two identical reactor tanks made of
transparent polyvinyl chloride, each calibrated to 18 L with a conical bottom having a slope of
60˚ for easy drainage of bio-solids. Each reactor had a diameter of 35 cm and a height of 45
cm, with a theoretical total volume of 22 L. For experimental runs, the working volume was
set at 13 L with the microbial population occupying 4 L and raw brewery wastewater occupying
9 L. This working volume was based on the selected hydraulic retention time and solids
retention time since they are both affected by the reactor working volume. Furthermore, both
Page | 37
reactors were not utilised to their maximum working volume to accommodate sludge bulking
since the bacteria growth rate is directly proportional to the substrate utilisation rate (Monod
1942; Metcalf and Eddy 2014). The conical bottom of the reactor tanks allowed a quiescent
and easy gravitational settling mechanism.
Each reactor tank had three spigot valves as shown in Figure 3.2 for sample collection as well
as for mixed liquor suspended solids drainage. Furthermore, both reactor tanks had a portable
shaft mixer which was operated continuously to keep bio-solids suspended inside the reactor,
thus allowing perfect mixing. Both the mixer shaft and impeller blades were made of stainless
steel, with a drive motor mounted at the top of the reactor tanks in a rubber gasket operating at
10 W and 350 rpm. The impeller blade design reduced the shear mechanism during mixing,
thus avoiding sludge bulking, since microorganisms in nature are very sensitive to shear
mechanism. Moreover, the mixing shafts were positioned at about 15 cm above the bottom of
the reactor tanks to allow the dispersion of large solids as presented in Figure 3.2. The
sequencing batch reactor had an aeration pump, which provided oxygen in the form of air by
means of a 5.0 mm diameter pipeline connecting from the top down to the central height of the
reactor tanks.
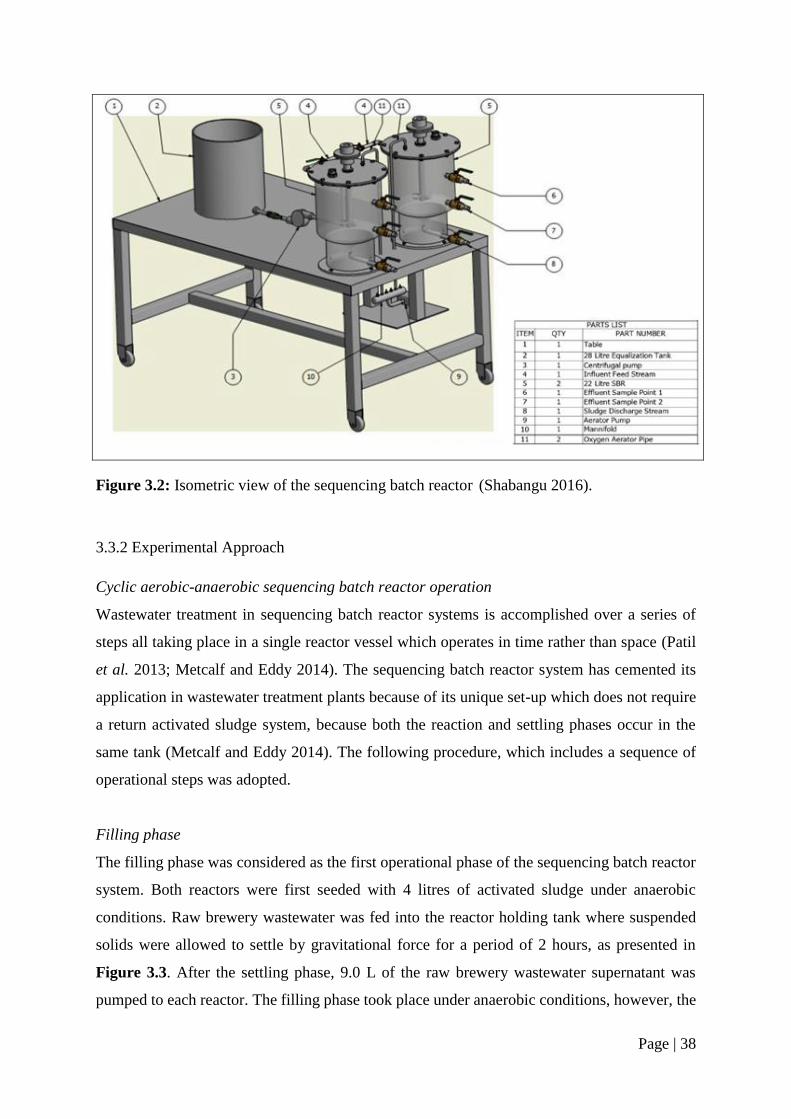
Page | 38
Figure 3.2: Isometric view of the sequencing batch reactor (Shabangu 2016).
3.3.2 Experimental Approach
Cyclic aerobic-anaerobic sequencing batch reactor operation
Wastewater treatment in sequencing batch reactor systems is accomplished over a series of
steps all taking place in a single reactor vessel which operates in time rather than space (Patil
et al. 2013; Metcalf and Eddy 2014). The sequencing batch reactor system has cemented its
application in wastewater treatment plants because of its unique set-up which does not require
a return activated sludge system, because both the reaction and settling phases occur in the
same tank (Metcalf and Eddy 2014). The following procedure, which includes a sequence of
operational steps was adopted.
Filling phase
The filling phase was considered as the first operational phase of the sequencing batch reactor
system. Both reactors were first seeded with 4 litres of activated sludge under anaerobic
conditions. Raw brewery wastewater was fed into the reactor holding tank where suspended
solids were allowed to settle by gravitational force for a period of 2 hours, as presented in
Figure 3.3. After the settling phase, 9.0 L of the raw brewery wastewater supernatant was
pumped to each reactor. The filling phase took place under anaerobic conditions, however, the
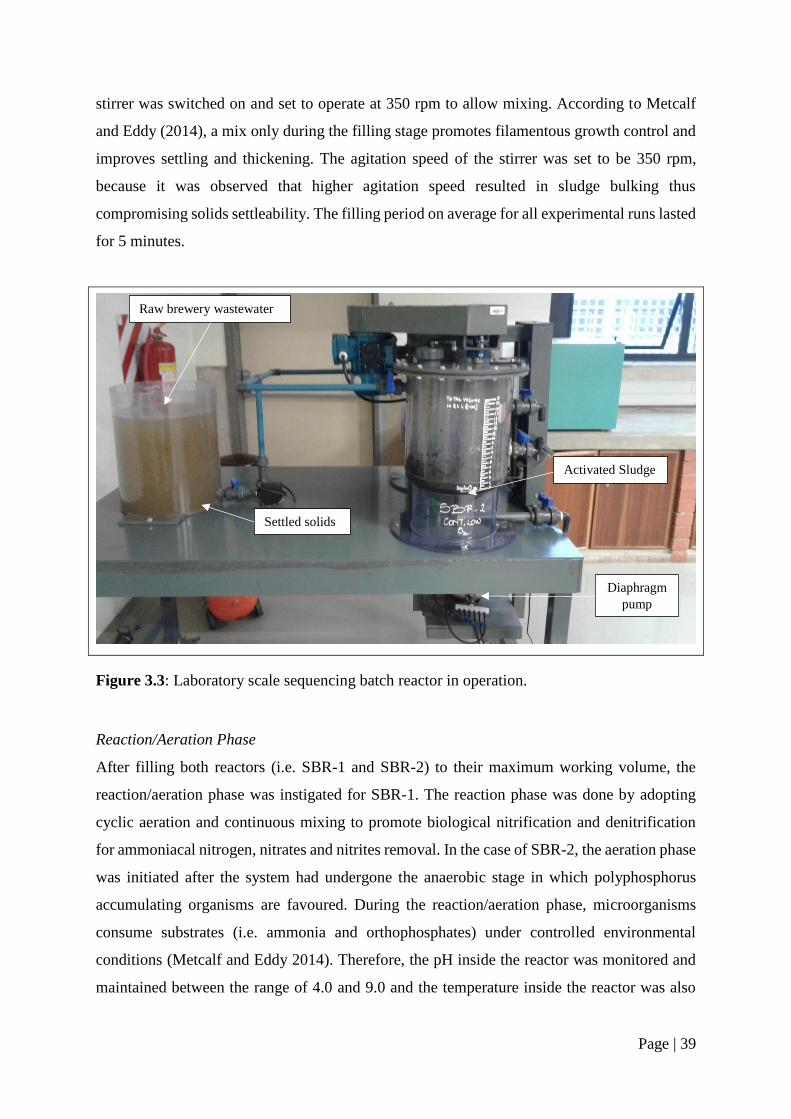
Page | 39
stirrer was switched on and set to operate at 350 rpm to allow mixing. According to Metcalf
and Eddy (2014), a mix only during the filling stage promotes filamentous growth control and
improves settling and thickening. The agitation speed of the stirrer was set to be 350 rpm,
because it was observed that higher agitation speed resulted in sludge bulking thus
compromising solids settleability. The filling period on average for all experimental runs lasted
for 5 minutes.
Figure 3.3: Laboratory scale sequencing batch reactor in operation.
Reaction/Aeration Phase
After filling both reactors (i.e. SBR-1 and SBR-2) to their maximum working volume, the
reaction/aeration phase was instigated for SBR-1. The reaction phase was done by adopting
cyclic aeration and continuous mixing to promote biological nitrification and denitrification
for ammoniacal nitrogen, nitrates and nitrites removal. In the case of SBR-2, the aeration phase
was initiated after the system had undergone the anaerobic stage in which polyphosphorus
accumulating organisms are favoured. During the reaction/aeration phase, microorganisms
consume substrates (i.e. ammonia and orthophosphates) under controlled environmental
conditions (Metcalf and Eddy 2014). Therefore, the pH inside the reactor was monitored and
maintained between the range of 4.0 and 9.0 and the temperature inside the reactor was also
Activated Sludge
Raw brewery wastewater
Settled solids
Diaphragm
pump
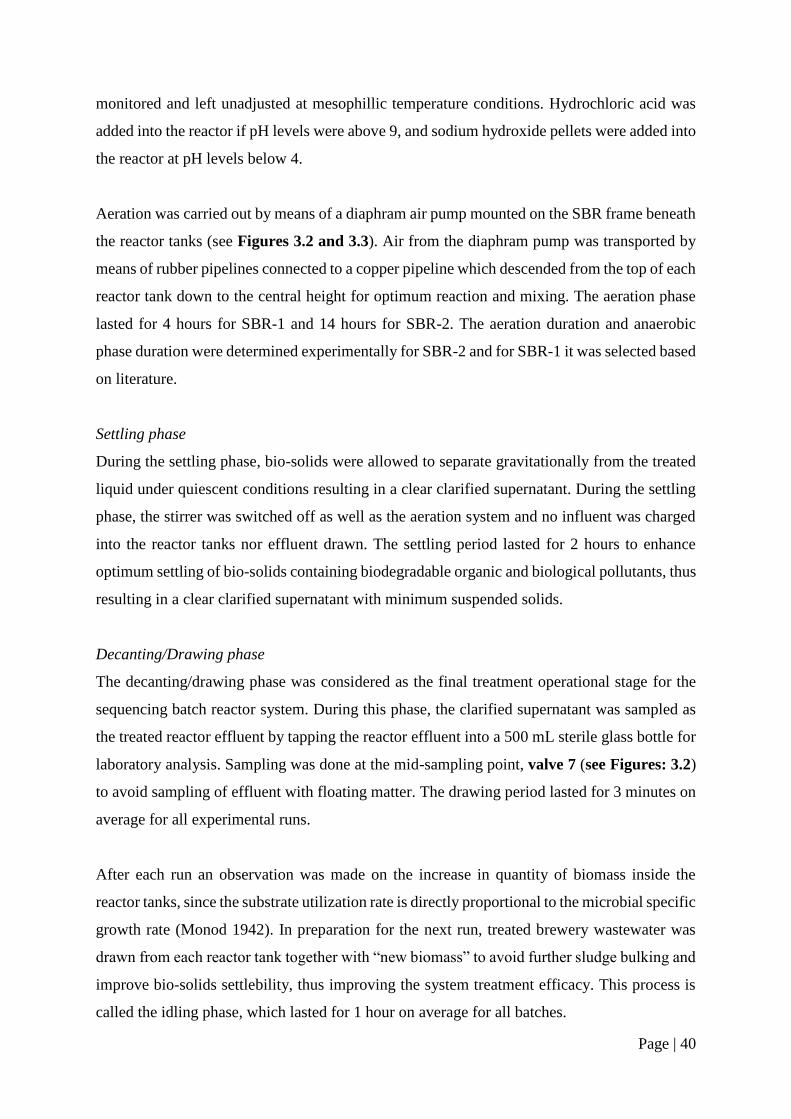
Page | 40
monitored and left unadjusted at mesophillic temperature conditions. Hydrochloric acid was
added into the reactor if pH levels were above 9, and sodium hydroxide pellets were added into
the reactor at pH levels below 4.
Aeration was carried out by means of a diaphram air pump mounted on the SBR frame beneath
the reactor tanks (see Figures 3.2 and 3.3). Air from the diaphram pump was transported by
means of rubber pipelines connected to a copper pipeline which descended from the top of each
reactor tank down to the central height for optimum reaction and mixing. The aeration phase
lasted for 4 hours for SBR-1 and 14 hours for SBR-2. The aeration duration and anaerobic
phase duration were determined experimentally for SBR-2 and for SBR-1 it was selected based
on literature.
Settling phase
During the settling phase, bio-solids were allowed to separate gravitationally from the treated
liquid under quiescent conditions resulting in a clear clarified supernatant. During the settling
phase, the stirrer was switched off as well as the aeration system and no influent was charged
into the reactor tanks nor effluent drawn. The settling period lasted for 2 hours to enhance
optimum settling of bio-solids containing biodegradable organic and biological pollutants, thus
resulting in a clear clarified supernatant with minimum suspended solids.
Decanting/Drawing phase
The decanting/drawing phase was considered as the final treatment operational stage for the
sequencing batch reactor system. During this phase, the clarified supernatant was sampled as
the treated reactor effluent by tapping the reactor effluent into a 500 mL sterile glass bottle for
laboratory analysis. Sampling was done at the mid-sampling point, valve 7 (see Figures: 3.2)
to avoid sampling of effluent with floating matter. The drawing period lasted for 3 minutes on
average for all experimental runs.
After each run an observation was made on the increase in quantity of biomass inside the
reactor tanks, since the substrate utilization rate is directly proportional to the microbial specific
growth rate (Monod 1942). In preparation for the next run, treated brewery wastewater was
drawn from each reactor tank together with “new biomass” to avoid further sludge bulking and
improve bio-solids settlebility, thus improving the system treatment efficacy. This process is
called the idling phase, which lasted for 1 hour on average for all batches.
Page | 41
3.3.3 Experimental Design
A summary of biological nutrients, organic load as well as physicochemical properties tested
and number of replicates for each analysis conducted in this study is presented in Table 3.1.
Table 3.1: Experimental design.
Sample Tested Parameter Replicates
Influent and effluent
PO3-4
3
NH3-N
TKN
NO3-N + NO2-N
TN
TCOD
Inffluent SCOD
Online Temperature
Inffluent and online pH
Inffluent and effluent
ORP
Conductivity
Turbidity
TD
TDS
VSS
3.5 Analytical Techniques
This section describes the analytical techniques used in analysing raw brewery wastewater and
treated brewery wastewater. Analysis were conducted in accordance with the Standard
Methods for the Examination of Water and Wastewater (APHA 2012) standard method.
Ammoniacal-Nitrogen (NH3-N)
Nitrogen pollutants exist in different forms in wastewater. In this study, ammoniacal ntrogen
(ammonia) was used to evaluate the treatment efficacy of the SBR system in treating industrial
wastewater for nitrogen pollutants (i.e. ammonia). Ammonia, a toxic pollutant in wastewater,
is considered to be highly soluble in water and exists as ammonium ion (Philips et al. 2002),
thus this parameter was measured to give an approximate concentration of nitrogen pollutants
in the form of ammonia contained in brewery wastewater. During experimental runs both the
reactor influent and effluent were analysed for NH3-N and the difference between influent
stream and effluent stream in NH3-N concentration gave the percentage removal which was
used to evaluate the SBR treatment efficacy.
Page | 42
Measurement: NH3-N concentration was measured colorimerically using a Hach DR 3900
spectrophotometer. Ammonium ions reacted with hypochlorite ions and salicylate ions in the
presence of sodium nitroprusside as a catalyst to form indophenol. The amount of colour
fromed is directly proportional to the ammoniacal nitrogen present in the sample. Samples were
measured at a wavelenght of 694 nm, using test vials. For data credibility all samples were
analysed in triplicates.
Total Kjeldahl Nitrogen (TKN)
Wastewater is characterised by a variety of organic compounds containing nitrogen which can
not be analysed by a single test which can allow each compound to respond in an equal manner.
TKN is basically the combination of organically bound nitrogen and ammonia in wastewater.
In this study, TKN anlysis were conducted to quantify the amount of nitrogen contained in the
organic form. Nitrogen pollutants in wastewater exist as both organic and inorganic forms. The
reactor influent and effluent was analysed for TKN and the difference between the reactor
influent and effluent TKN concentration was used in evaluating the SBR system for organic
nitrogen removal.
Measurement: TKN was measured colorimetrically using a Hach DR 3900 spectrophotometer.
In this test method inorganic and organic nitrogen was oxidized to nitrate by digestion with
peroxodisulfate. The nitrate ions reacted with 2,3-dimethylphenol in a solution of sulfuirc and
phosphoric acid to form a nitrophenol. Oxidized froms of nitrogen i.e. nitrite and nitrate are
also determined. Samples were measured at a wavelenght of 345 nm. For data credibility,
samples were analysed in triplicates. Total organic nitrogen (TON) and total inorganic nitrogen
(TIN) concentrations were estimated using equations [3.1] and [3.2] respectively.
𝑇𝑂𝑁 = 𝑇𝐾𝑁 − (𝑁𝐻3𝑁 + 𝑁𝐻4𝑁) [3.1]
𝑇𝐼𝑁 = (𝑁𝐻3𝑁 +𝑁𝐻4𝑁) + (𝑁𝑂3𝑁 + 𝑁𝑂2𝑁) [3.2]
Page | 43
Orthophosphates (𝑃𝑂43−)
Phosphorus in wastewater is found in different forms, including the dissolved
(orthophosphates), inorganic (reactive plus condensed or acid hydrolyzable phosphate) and
organically bound forms. In this study, phosphorus concentration was measured as
orthophosphates since industrial wastewater from the brewery is characterised by a high
fraction of inorganic orthophosphates (Rossle and Pretorius 2001; Abimbola et al. 2015). All
analyses were done in triplicates for data credibilty.
Measurement: orthophosphates concentration was measured colorimetrically using a Hach DR
3900 spectrophotometer by adopting the molybdovanadate method. In the molybdovanadate
method, orthophosphate reacts with molubdate in an acid medium to produce a mixed
phosphate/molybdate complex. In the presence of vanadium, a yellow
molybdovanadophosphiric acid is formed. The intensity of the yellow colour is proportional to
the phosphate concentration. Samples were measured at a wavelength of 430 nm. All data
obtained was validated at 95% confidence level.
Chemical Oxygen Demand
The measure of capacity of water to consume dissolved oxygen during the decomposition of
organic matter and the oxidation of inorganic chemicals such as ammonia and nitrite, is known
as chemical oxygen demand (COD). In this study, the COD application was used to quantify
organic pollutants concentration in industrial wastewater generated from the brewery, which
was considered to be a quick indicator of organic pollutant in brewery wastewater. The COD
was expressed in milligrams of oxygen per litre (mg O2/L) which is the amount of oxygen
consumed per litre of solution. In this case it was the amount of oxygen consumed per litre of
brewery wastewater. Both the reactor influent and treated effluent were characterised for COD.
No analyses on COD were conducted during treatment.
Measurement: COD was measured spetrophotometrically (DR 3900) using the colorimetric
method. Samples were heated for 2 hours at 150˚C in the presence of sulfuric acid and a strong
oxidizing agent, potassium dichromate. Oxidizable organic compounds reacted, reducing the
dichromate ion (𝐶𝑟2𝑂72−) to green chromic ion (𝐶𝑟3+). The amount of chromic ion produced
was measured spectophotometrically at a wavelength of 620 nm to give COD concentration.
Page | 44
Moreover, the COD reagent also contains silver and mercury ions. Silver act as a catalyst and
mercury is used to complex chloride interferences.
pH and oxidation reduction potential (ORP)
The pH is an important parameter in biological wastewater treatment systems because it affects
the microbial metabolic process, thus compromising wastewater treatment efficacy as well as
the environment and aquatic life when disposed. Microorganisms in their nature are pH
sensitive, such that at pH levels less than 4 and pH levels more than 9.5 they do not perform
well (Metcalf and Eddy 2014). The pH was analysed during characterisation of reactor influent
and treated effluent in accordance with the APHA (2012) standard methods. Furthermore,
samples were analysed in triplicates to ensure data credibility.
Measurement: during treatment process, pH monitoring inside the reactor tanks was done
every 2 hours, by directly measuring the pH inside the reactor tanks using a calibrated Thermo
Scientific Orion Star A215 pH/conductivity meter.
Conductivity
Conductivity is a measure of the ability of water to pass an electric current. In water treatment
systems, conductivity is greatly affected by the presence of inorganic dissolved solids such as
nitrate, phosphates anions etc. Organic compounds like alcohol and sugars do not conduct
electrical current very well, therefore they have low conductivity in water (Cintron 2016). In
this research study, conductivity was used to give a quantitative measure of the total dissolved
solids in water.
Measurement: conductivity was measured using a calibrated Thermo Scienctific Orion Star
A215 pH/conductivity in micro Siemens per centimeter. Conductivity data was statistically
validated at 95% confidence level.
Dissolved Oxyegn (DO)
Biological treatment is defined as an aerobic activated-sludge process in the aeration zone for
treating wastewater. For this study, DO with the units of mg O2/L was considered as an
important parameter to make certain that the microbial community in the aerobic zone has
enough DO to remain alive. During experimental runs air was supplied to both reactors by
Page | 45
means of a diaphram air pump to maintain a DO minimum concentration of 2 mg O2/L for the
survival of the microbial community in the aerobic zone. The DO concentration was measured
directly in the reactors using an online calibrated DO probe Orbeco Hellige Series 150. The
dissolved oxygen was measured during the aerobic phase for process monitoring purposes.
Total Solids (TS) and Total Dissolved Solids (TDS)
According to the Standard methods for the Examination of Water and Wastewater (APHA
2012), TS are total dissolved solids plus suspended and settleable solids in water. In the case
of brewery wastewater dissolved solids consist of nitrate, phosphorus and other particles. On
the other hand suspended solids include fine organic debris and other particulate matter. The
difference between dissolved solids and suspened solids is that dissolved solids can pass
through a filter with pores around 2 microns and suspended solids can not pass through a 2
micron filter. This parameter was measured to quantify the amount of solids in both the
inffluent and effluent streams.
Mesurement: total solids and total dissolved solids were mearured gravimetrically in mg TS/L
and mg TDS/L respectively. A well-mixed sample was dryed at 105 ̊ C for 24 hours. The TS
fraction was given by the wight of the residue after drying.
Volatile Suspended Solids (VSS) and Fixed Volatile Solids (VFS)
In this study, the VSS was measured to quantify the amount of organic matter and the VFS was
used as a meaurement for the inorganic solids fraction in both the reactor influent and effluent
steams.
Measurement: the VSS was measured gravimetrically in mg VSS/ L by igniting samples in a
muffle furnace at 550 ̊C. The portion lost during the ignition process was taken to be equavalent
to the organic fraction, and the residue after ignition gave the FVS fraction.
3.6 Microbiology Kinetics
The Monod and Michaelis-Menten’s empirical equations, as discussed in sub-section 2.5 of
Chapter Two, were used to study the substrate (i.e. TCOD) concentration in relation to the
substrate utilisation rate kinetics and microbial growth rate kinetics. Reference should be made
Page | 46
to Appendix D, for detailed kinetics equations and constants that were used in this research
study.
3.7 Data Analysis
Data obtained in this research study was statistically analysed using Minitab 15 and Microsoft
Office Excel as statistics tools. The data was first checked for normality distribution through
the skewness and kurtosis value, and was analysed using descriptive statistics to obtain the
mean, standard deviation and range. The two tail Student’s t-Test with unequal variances at a
95% confidence level was implemented. Furthermore, the data was used to study the
relationship between output variables and tested parameters, as discussed in Chapter Four.
Page | 47
CHAPTER FOUR
RESULTS AND DISCUSSION
This chapter presents results obtained in this study as well as the discussion of results. Section
4.1 presents the findings of the study and discussion on characterisation of brewery wastewater
composition. Section 4.2 presents the results obtained and their discussion on investigating the
effect of sludge retention time and hydraulic retention time on orthophosphates removal.
Section 4.3 presents results and discussion on total chemical oxygen demand removal as well
as orthophosphate removal with variation in organic volumetric loading rates. Section 4.4
presents results and discussion on orthophosphates and total chemical oxygen demand overall
percentage removal as well as orthophosphate material balance results. Section 4.5 presents the
findings of the study as well as discussion on the effect of sludge retention time on ammoniacal-
N removal, effect of ammoniacal-N concentration on the sequencing batch reactor treatment
efficacy, effect of organic volumetric loading rate on nitrogen pollutant removal, as well as
temperature and pH effects on biological nutrient removal. Section 4.6 presents the overall
results and discussion on the sequencing batch reactor treatment efficacy on biological nutrient
removal. The chapter ends with section 4.7 which presents the findings of the study and
discussion on substrate utilisation rate kinetics and microbial growth rate kinetics.
4.1 Results on Characterisation of Brewery Wastewater Composition
Table 4.1 presents a summary of results on the characterisation of brewery wastewater
composition used in conducting this experimental research study. The findings of the study on
brewery wastewater characterisation are presented in terms of the mean expressed in standard
deviation and the range, which were statistically analysed at a 95% confidence level (reference
should be made on Table A.1 from APPENDIX A).
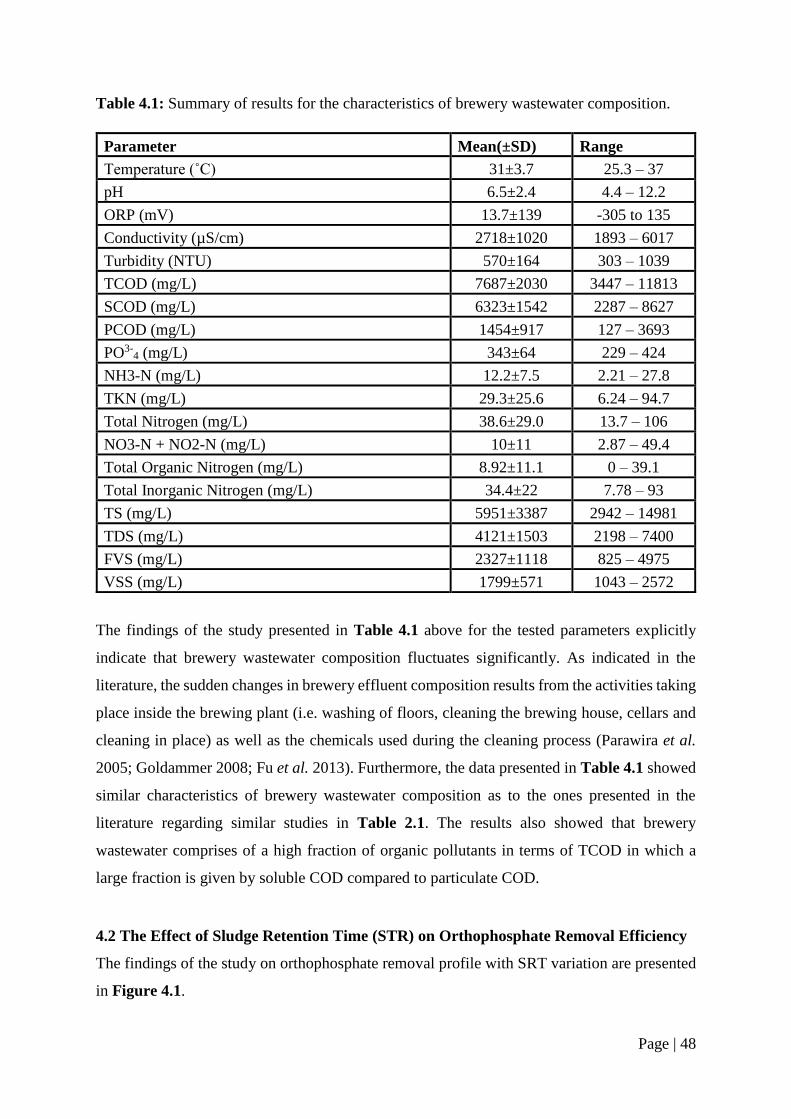
Page | 48
Table 4.1: Summary of results for the characteristics of brewery wastewater composition.
Parameter Mean(±SD) Range
Temperature (˚C) 31±3.7 25.3 – 37
pH 6.5±2.4 4.4 – 12.2
ORP (mV) 13.7±139 -305 to 135
Conductivity (µS/cm) 2718±1020 1893 – 6017
Turbidity (NTU) 570±164 303 – 1039
TCOD (mg/L) 7687±2030 3447 – 11813
SCOD (mg/L) 6323±1542 2287 – 8627
PCOD (mg/L) 1454±917 127 – 3693
PO3-4 (mg/L) 343±64 229 – 424
NH3-N (mg/L) 12.2±7.5 2.21 – 27.8
TKN (mg/L) 29.3±25.6 6.24 – 94.7
Total Nitrogen (mg/L) 38.6±29.0 13.7 – 106
NO3-N + NO2-N (mg/L) 10±11 2.87 – 49.4
Total Organic Nitrogen (mg/L) 8.92±11.1 0 – 39.1
Total Inorganic Nitrogen (mg/L) 34.4±22 7.78 – 93
TS (mg/L) 5951±3387 2942 – 14981
TDS (mg/L) 4121±1503 2198 – 7400
FVS (mg/L) 2327±1118 825 – 4975
VSS (mg/L) 1799±571 1043 – 2572
The findings of the study presented in Table 4.1 above for the tested parameters explicitly
indicate that brewery wastewater composition fluctuates significantly. As indicated in the
literature, the sudden changes in brewery effluent composition results from the activities taking
place inside the brewing plant (i.e. washing of floors, cleaning the brewing house, cellars and
cleaning in place) as well as the chemicals used during the cleaning process (Parawira et al.
2005; Goldammer 2008; Fu et al. 2013). Furthermore, the data presented in Table 4.1 showed
similar characteristics of brewery wastewater composition as to the ones presented in the
literature regarding similar studies in Table 2.1. The results also showed that brewery
wastewater comprises of a high fraction of organic pollutants in terms of TCOD in which a
large fraction is given by soluble COD compared to particulate COD.
4.2 The Effect of Sludge Retention Time (STR) on Orthophosphate Removal Efficiency
The findings of the study on orthophosphate removal profile with SRT variation are presented
in Figure 4.1.
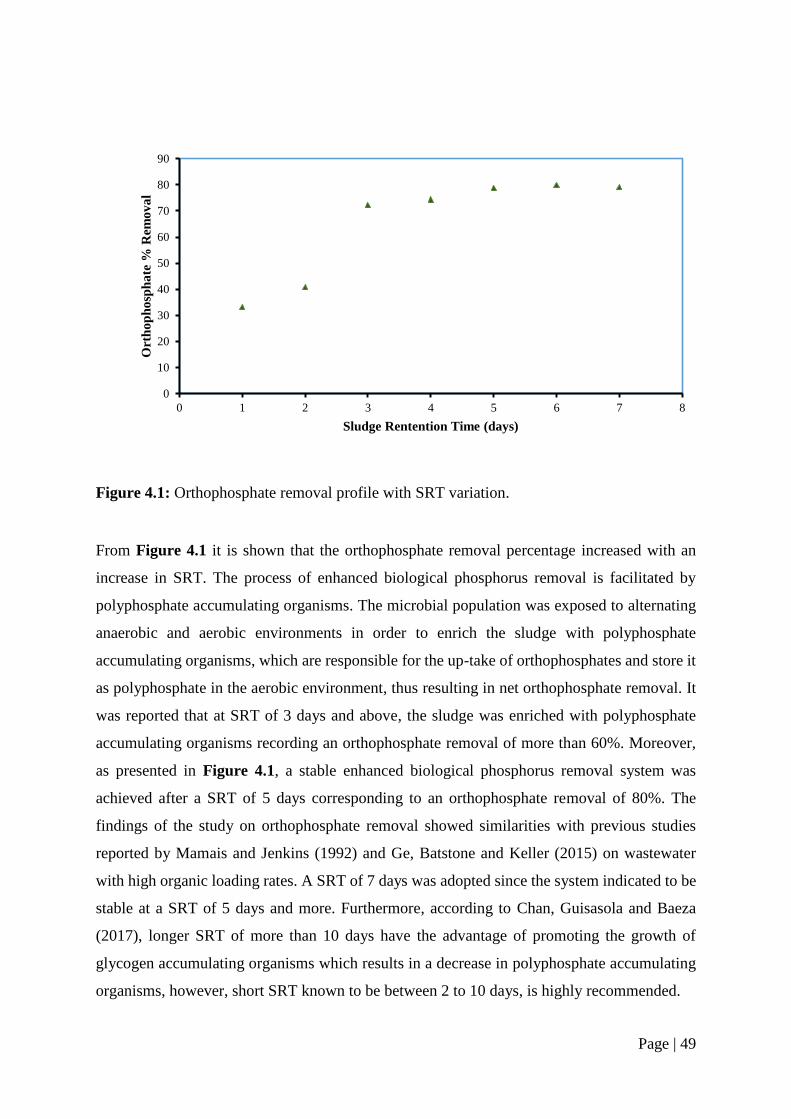
Page | 49
Figure 4.1: Orthophosphate removal profile with SRT variation.
From Figure 4.1 it is shown that the orthophosphate removal percentage increased with an
increase in SRT. The process of enhanced biological phosphorus removal is facilitated by
polyphosphate accumulating organisms. The microbial population was exposed to alternating
anaerobic and aerobic environments in order to enrich the sludge with polyphosphate
accumulating organisms, which are responsible for the up-take of orthophosphates and store it
as polyphosphate in the aerobic environment, thus resulting in net orthophosphate removal. It
was reported that at SRT of 3 days and above, the sludge was enriched with polyphosphate
accumulating organisms recording an orthophosphate removal of more than 60%. Moreover,
as presented in Figure 4.1, a stable enhanced biological phosphorus removal system was
achieved after a SRT of 5 days corresponding to an orthophosphate removal of 80%. The
findings of the study on orthophosphate removal showed similarities with previous studies
reported by Mamais and Jenkins (1992) and Ge, Batstone and Keller (2015) on wastewater
with high organic loading rates. A SRT of 7 days was adopted since the system indicated to be
stable at a SRT of 5 days and more. Furthermore, according to Chan, Guisasola and Baeza
(2017), longer SRT of more than 10 days have the advantage of promoting the growth of
glycogen accumulating organisms which results in a decrease in polyphosphate accumulating
organisms, however, short SRT known to be between 2 to 10 days, is highly recommended.
0
10
20
30
40
50
60
70
80
90
0 1 2 3 4 5 6 7 8
Ort
ho
ph
osp
ha
te %
Rem
ov
al
Sludge Rentention Time (days)
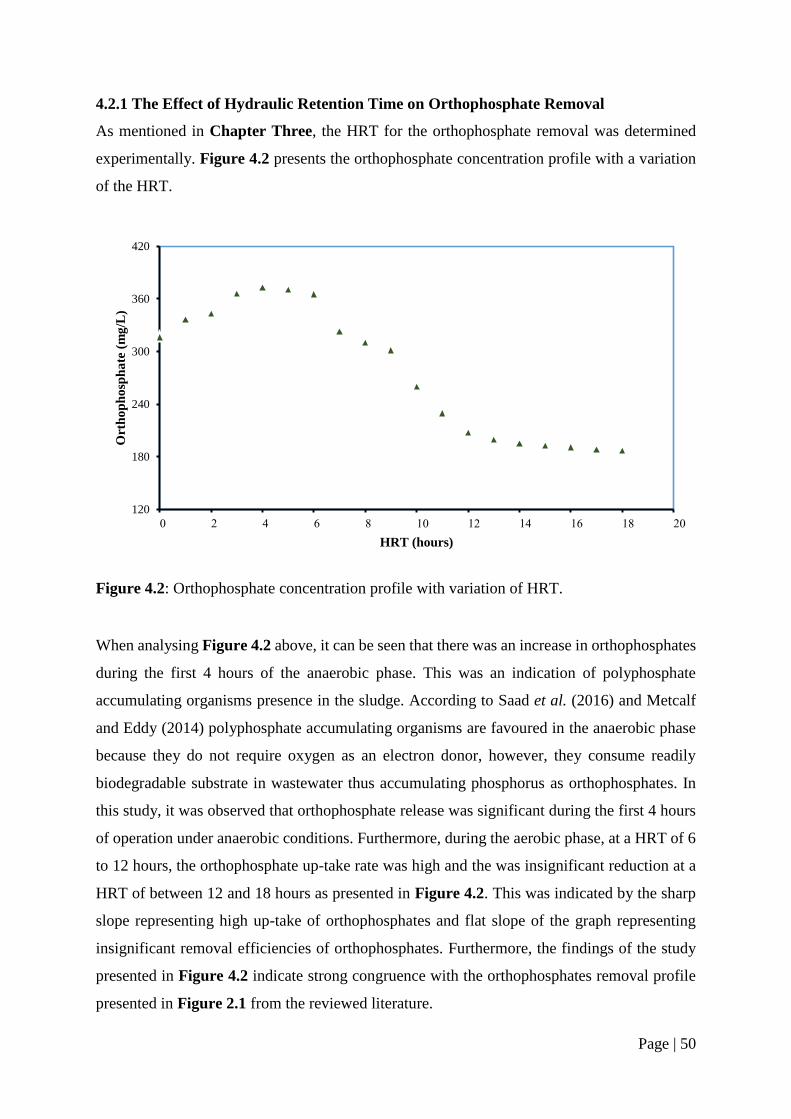
Page | 50
4.2.1 The Effect of Hydraulic Retention Time on Orthophosphate Removal
As mentioned in Chapter Three, the HRT for the orthophosphate removal was determined
experimentally. Figure 4.2 presents the orthophosphate concentration profile with a variation
of the HRT.
Figure 4.2: Orthophosphate concentration profile with variation of HRT.
When analysing Figure 4.2 above, it can be seen that there was an increase in orthophosphates
during the first 4 hours of the anaerobic phase. This was an indication of polyphosphate
accumulating organisms presence in the sludge. According to Saad et al. (2016) and Metcalf
and Eddy (2014) polyphosphate accumulating organisms are favoured in the anaerobic phase
because they do not require oxygen as an electron donor, however, they consume readily
biodegradable substrate in wastewater thus accumulating phosphorus as orthophosphates. In
this study, it was observed that orthophosphate release was significant during the first 4 hours
of operation under anaerobic conditions. Furthermore, during the aerobic phase, at a HRT of 6
to 12 hours, the orthophosphate up-take rate was high and the was insignificant reduction at a
HRT of between 12 and 18 hours as presented in Figure 4.2. This was indicated by the sharp
slope representing high up-take of orthophosphates and flat slope of the graph representing
insignificant removal efficiencies of orthophosphates. Furthermore, the findings of the study
presented in Figure 4.2 indicate strong congruence with the orthophosphates removal profile
presented in Figure 2.1 from the reviewed literature.
120
180
240
300
360
420
Ort
ho
ph
osp
ha
te (
mg
/L)
HRT (hours)
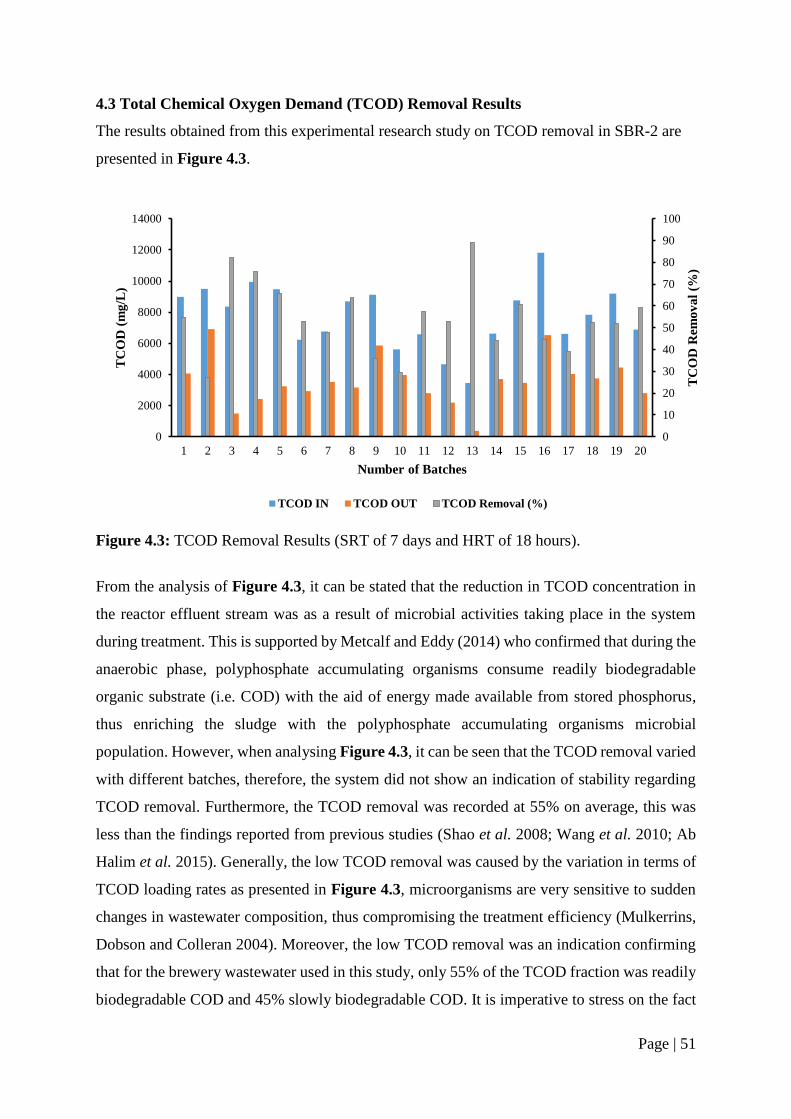
Page | 51
4.3 Total Chemical Oxygen Demand (TCOD) Removal Results
The results obtained from this experimental research study on TCOD removal in SBR-2 are
presented in Figure 4.3.
Figure 4.3: TCOD Removal Results (SRT of 7 days and HRT of 18 hours).
From the analysis of Figure 4.3, it can be stated that the reduction in TCOD concentration in
the reactor effluent stream was as a result of microbial activities taking place in the system
during treatment. This is supported by Metcalf and Eddy (2014) who confirmed that during the
anaerobic phase, polyphosphate accumulating organisms consume readily biodegradable
organic substrate (i.e. COD) with the aid of energy made available from stored phosphorus,
thus enriching the sludge with the polyphosphate accumulating organisms microbial
population. However, when analysing Figure 4.3, it can be seen that the TCOD removal varied
with different batches, therefore, the system did not show an indication of stability regarding
TCOD removal. Furthermore, the TCOD removal was recorded at 55% on average, this was
less than the findings reported from previous studies (Shao et al. 2008; Wang et al. 2010; Ab
Halim et al. 2015). Generally, the low TCOD removal was caused by the variation in terms of
TCOD loading rates as presented in Figure 4.3, microorganisms are very sensitive to sudden
changes in wastewater composition, thus compromising the treatment efficiency (Mulkerrins,
Dobson and Colleran 2004). Moreover, the low TCOD removal was an indication confirming
that for the brewery wastewater used in this study, only 55% of the TCOD fraction was readily
biodegradable COD and 45% slowly biodegradable COD. It is imperative to stress on the fact
0
10
20
30
40
50
60
70
80
90
100
0
2000
4000
6000
8000
10000
12000
14000
1 2 3 4 5 6 7 8 9 10 11 12 13 14 15 16 17 18 19 20
TC
OD
Rem
ov
al
(%)
TC
OD
(m
g/L
)
Number of Batches
TCOD IN TCOD OUT TCOD Removal (%)
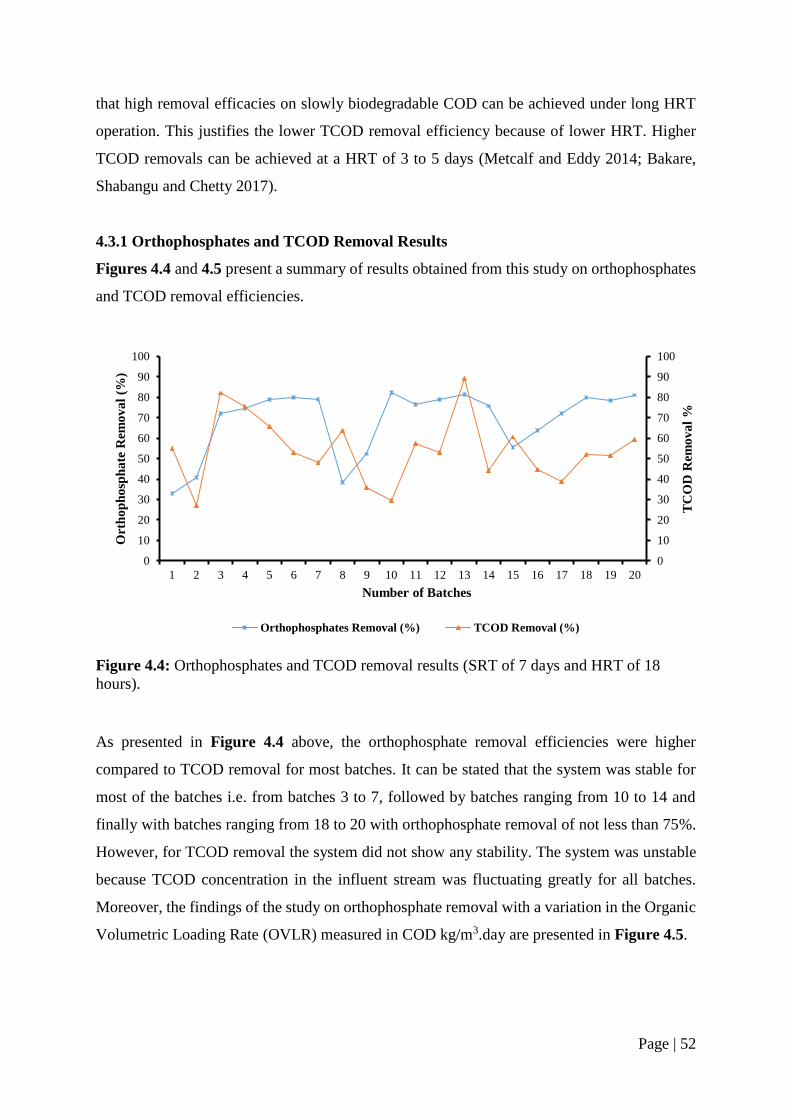
Page | 52
that high removal efficacies on slowly biodegradable COD can be achieved under long HRT
operation. This justifies the lower TCOD removal efficiency because of lower HRT. Higher
TCOD removals can be achieved at a HRT of 3 to 5 days (Metcalf and Eddy 2014; Bakare,
Shabangu and Chetty 2017).
4.3.1 Orthophosphates and TCOD Removal Results
Figures 4.4 and 4.5 present a summary of results obtained from this study on orthophosphates
and TCOD removal efficiencies.
Figure 4.4: Orthophosphates and TCOD removal results (SRT of 7 days and HRT of 18
hours).
As presented in Figure 4.4 above, the orthophosphate removal efficiencies were higher
compared to TCOD removal for most batches. It can be stated that the system was stable for
most of the batches i.e. from batches 3 to 7, followed by batches ranging from 10 to 14 and
finally with batches ranging from 18 to 20 with orthophosphate removal of not less than 75%.
However, for TCOD removal the system did not show any stability. The system was unstable
because TCOD concentration in the influent stream was fluctuating greatly for all batches.
Moreover, the findings of the study on orthophosphate removal with a variation in the Organic
Volumetric Loading Rate (OVLR) measured in COD kg/m3.day are presented in Figure 4.5.
0
10
20
30
40
50
60
70
80
90
100
0
10
20
30
40
50
60
70
80
90
100
1 2 3 4 5 6 7 8 9 10 11 12 13 14 15 16 17 18 19 20
TC
OD
Rem
ov
al
%
Ort
ho
ph
osp
ha
te R
emo
va
l (%
)
Number of Batches
Orthophosphates Removal (%) TCOD Removal (%)
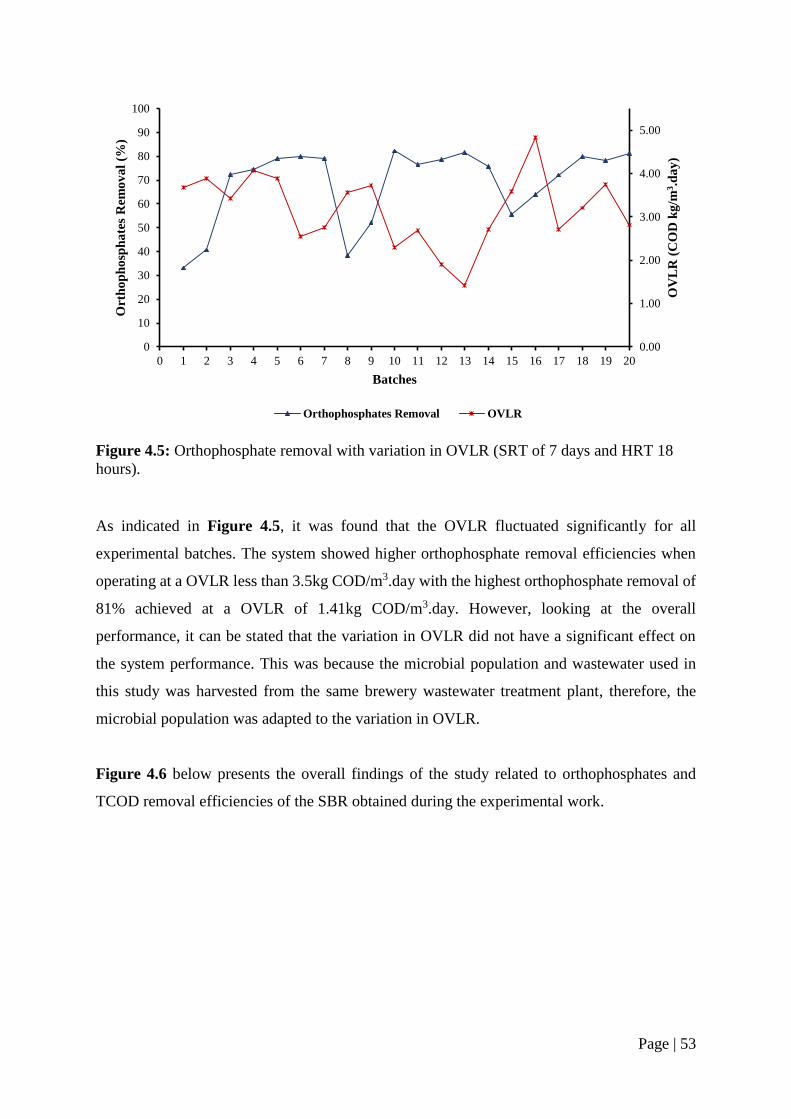
Page | 53
Figure 4.5: Orthophosphate removal with variation in OVLR (SRT of 7 days and HRT 18
hours).
As indicated in Figure 4.5, it was found that the OVLR fluctuated significantly for all
experimental batches. The system showed higher orthophosphate removal efficiencies when
operating at a OVLR less than 3.5kg COD/m3.day with the highest orthophosphate removal of
81% achieved at a OVLR of 1.41kg COD/m3.day. However, looking at the overall
performance, it can be stated that the variation in OVLR did not have a significant effect on
the system performance. This was because the microbial population and wastewater used in
this study was harvested from the same brewery wastewater treatment plant, therefore, the
microbial population was adapted to the variation in OVLR.
Figure 4.6 below presents the overall findings of the study related to orthophosphates and
TCOD removal efficiencies of the SBR obtained during the experimental work.
0.00
1.00
2.00
3.00
4.00
5.00
0
10
20
30
40
50
60
70
80
90
100
0 1 2 3 4 5 6 7 8 9 10 11 12 13 14 15 16 17 18 19 20
OV
LR
(C
OD
kg
/m3.d
ay
)
Ort
ho
ph
osp
ha
tes
Rem
ov
al
(%)
Batches
Orthophosphates Removal OVLR
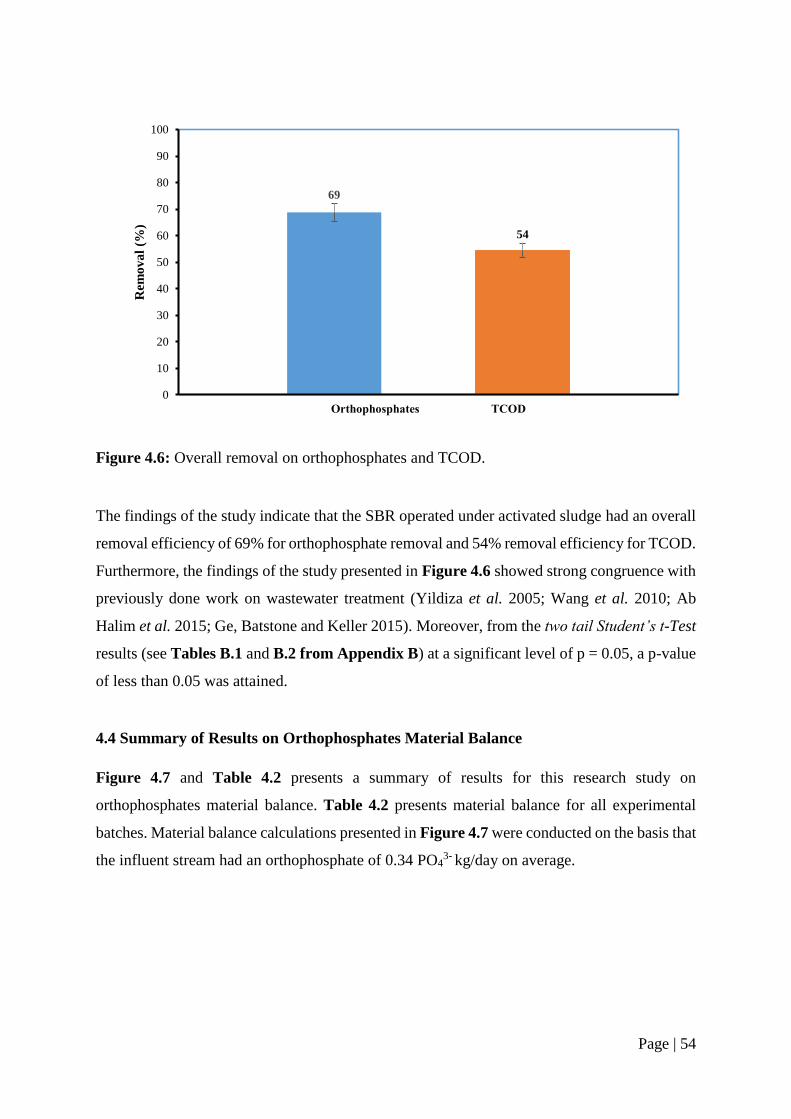
Page | 54
Figure 4.6: Overall removal on orthophosphates and TCOD.
The findings of the study indicate that the SBR operated under activated sludge had an overall
removal efficiency of 69% for orthophosphate removal and 54% removal efficiency for TCOD.
Furthermore, the findings of the study presented in Figure 4.6 showed strong congruence with
previously done work on wastewater treatment (Yildiza et al. 2005; Wang et al. 2010; Ab
Halim et al. 2015; Ge, Batstone and Keller 2015). Moreover, from the two tail Student’s t-Test
results (see Tables B.1 and B.2 from Appendix B) at a significant level of p = 0.05, a p-value
of less than 0.05 was attained.
4.4 Summary of Results on Orthophosphates Material Balance
Figure 4.7 and Table 4.2 presents a summary of results for this research study on
orthophosphates material balance. Table 4.2 presents material balance for all experimental
batches. Material balance calculations presented in Figure 4.7 were conducted on the basis that
the influent stream had an orthophosphate of 0.34 PO43- kg/day on average.
69
54
0
10
20
30
40
50
60
70
80
90
100R
emo
va
l (%
)
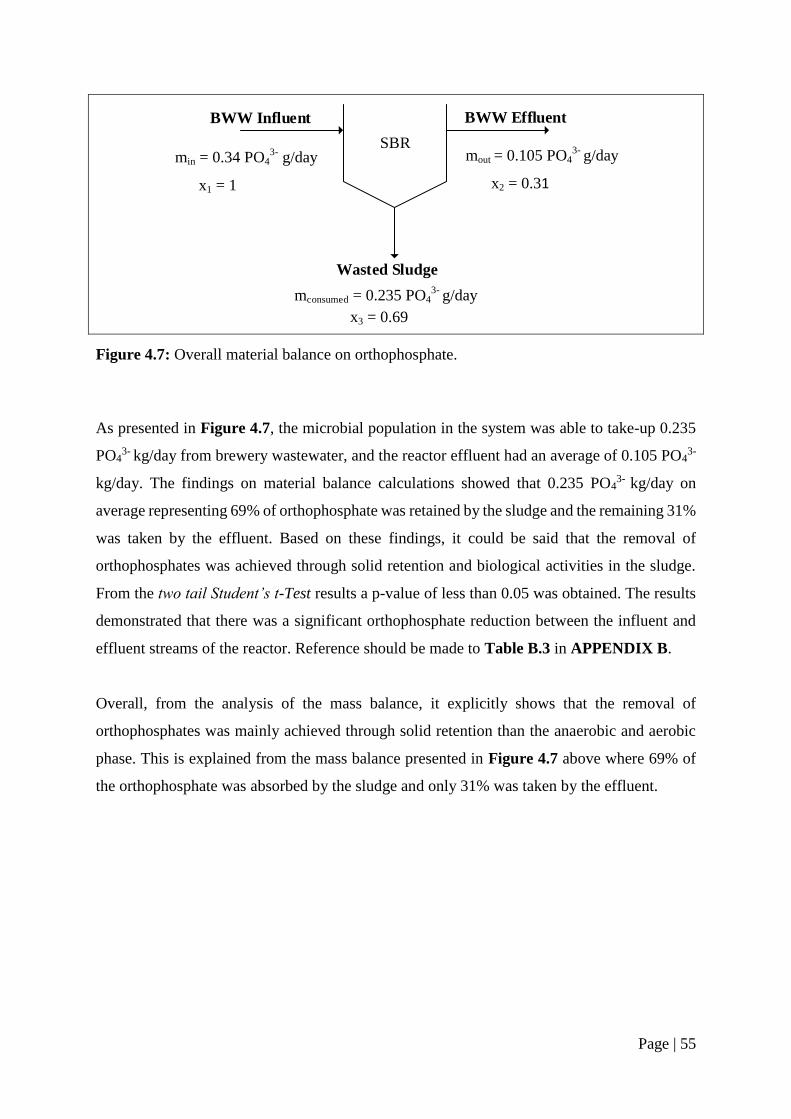
Page | 55
SBRmin = 0.34 PO4
3- g/day
x1 = 1
mout = 0.105 PO43-
g/day
x2 = 0.31
mconsumed = 0.235 PO43- g/day
x3 = 0.69
BWW Influent BWW Effluent
Wasted Sludge
Figure 4.7: Overall material balance on orthophosphate.
As presented in Figure 4.7, the microbial population in the system was able to take-up 0.235
PO43- kg/day from brewery wastewater, and the reactor effluent had an average of 0.105 PO4
3-
kg/day. The findings on material balance calculations showed that 0.235 PO43- kg/day on
average representing 69% of orthophosphate was retained by the sludge and the remaining 31%
was taken by the effluent. Based on these findings, it could be said that the removal of
orthophosphates was achieved through solid retention and biological activities in the sludge.
From the two tail Student’s t-Test results a p-value of less than 0.05 was obtained. The results
demonstrated that there was a significant orthophosphate reduction between the influent and
effluent streams of the reactor. Reference should be made to Table B.3 in APPENDIX B.
Overall, from the analysis of the mass balance, it explicitly shows that the removal of
orthophosphates was mainly achieved through solid retention than the anaerobic and aerobic
phase. This is explained from the mass balance presented in Figure 4.7 above where 69% of
the orthophosphate was absorbed by the sludge and only 31% was taken by the effluent.
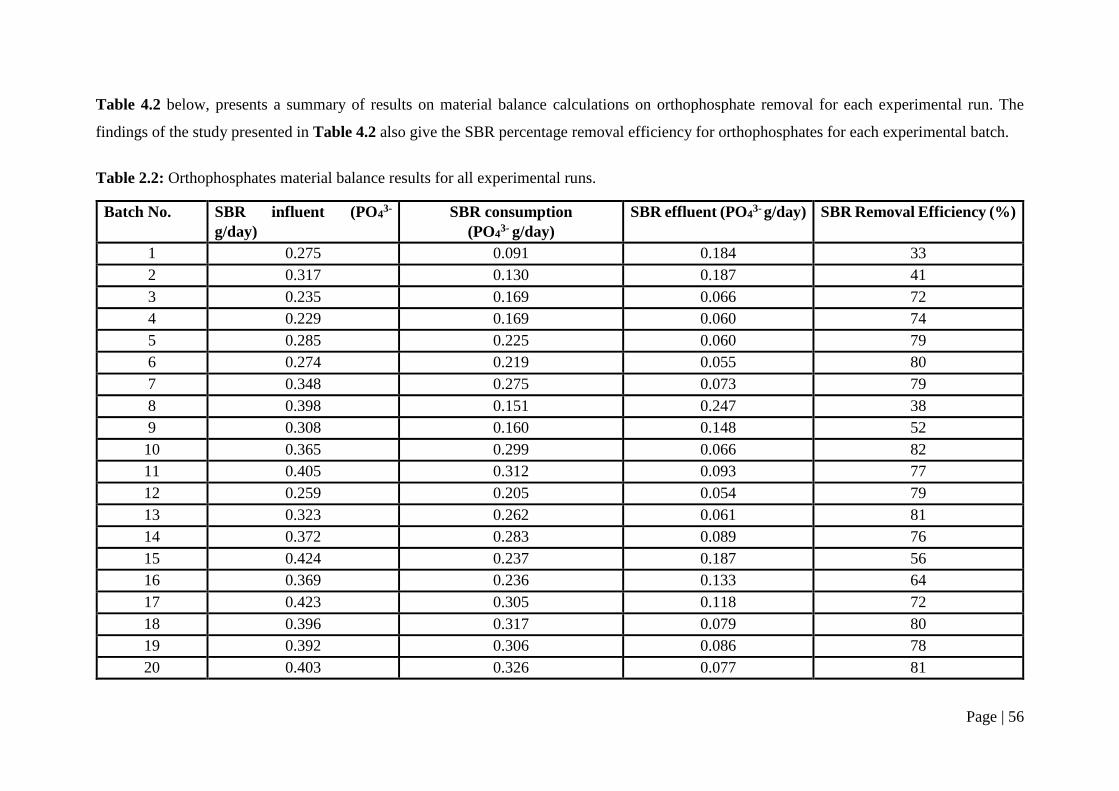
Page | 56
Table 4.2 below, presents a summary of results on material balance calculations on orthophosphate removal for each experimental run. The
findings of the study presented in Table 4.2 also give the SBR percentage removal efficiency for orthophosphates for each experimental batch.
Table 2.2: Orthophosphates material balance results for all experimental runs.
Batch No. SBR influent (PO43-
g/day)
SBR consumption
(PO43- g/day)
SBR effluent (PO43- g/day) SBR Removal Efficiency (%)
1 0.275 0.091 0.184 33
2 0.317 0.130 0.187 41
3 0.235 0.169 0.066 72
4 0.229 0.169 0.060 74
5 0.285 0.225 0.060 79
6 0.274 0.219 0.055 80
7 0.348 0.275 0.073 79
8 0.398 0.151 0.247 38
9 0.308 0.160 0.148 52
10 0.365 0.299 0.066 82
11 0.405 0.312 0.093 77
12 0.259 0.205 0.054 79
13 0.323 0.262 0.061 81
14 0.372 0.283 0.089 76
15 0.424 0.237 0.187 56
16 0.369 0.236 0.133 64
17 0.423 0.305 0.118 72
18 0.396 0.317 0.079 80
19 0.392 0.306 0.086 78
20 0.403 0.326 0.077 81
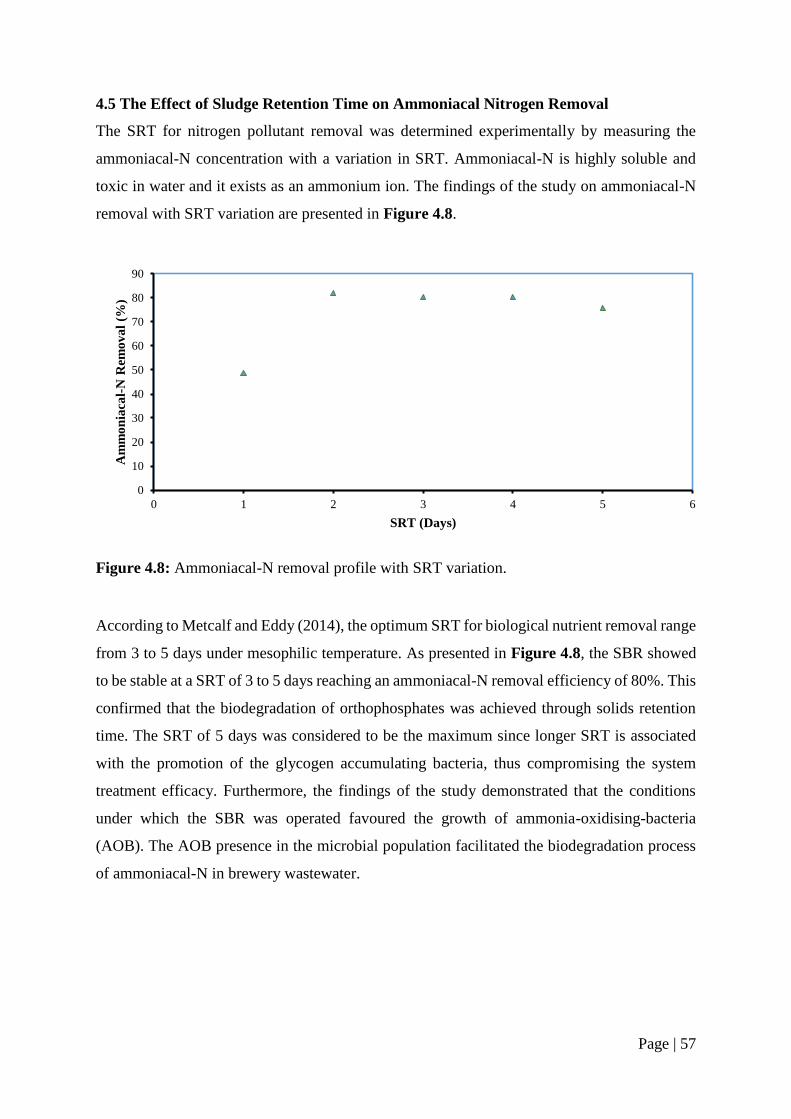
Page | 57
4.5 The Effect of Sludge Retention Time on Ammoniacal Nitrogen Removal
The SRT for nitrogen pollutant removal was determined experimentally by measuring the
ammoniacal-N concentration with a variation in SRT. Ammoniacal-N is highly soluble and
toxic in water and it exists as an ammonium ion. The findings of the study on ammoniacal-N
removal with SRT variation are presented in Figure 4.8.
Figure 4.8: Ammoniacal-N removal profile with SRT variation.
According to Metcalf and Eddy (2014), the optimum SRT for biological nutrient removal range
from 3 to 5 days under mesophilic temperature. As presented in Figure 4.8, the SBR showed
to be stable at a SRT of 3 to 5 days reaching an ammoniacal-N removal efficiency of 80%. This
confirmed that the biodegradation of orthophosphates was achieved through solids retention
time. The SRT of 5 days was considered to be the maximum since longer SRT is associated
with the promotion of the glycogen accumulating bacteria, thus compromising the system
treatment efficacy. Furthermore, the findings of the study demonstrated that the conditions
under which the SBR was operated favoured the growth of ammonia-oxidising-bacteria
(AOB). The AOB presence in the microbial population facilitated the biodegradation process
of ammoniacal-N in brewery wastewater.
0
10
20
30
40
50
60
70
80
90
0 1 2 3 4 5 6
Am
mo
nia
cal-
N R
emo
va
l (%
)
SRT (Days)
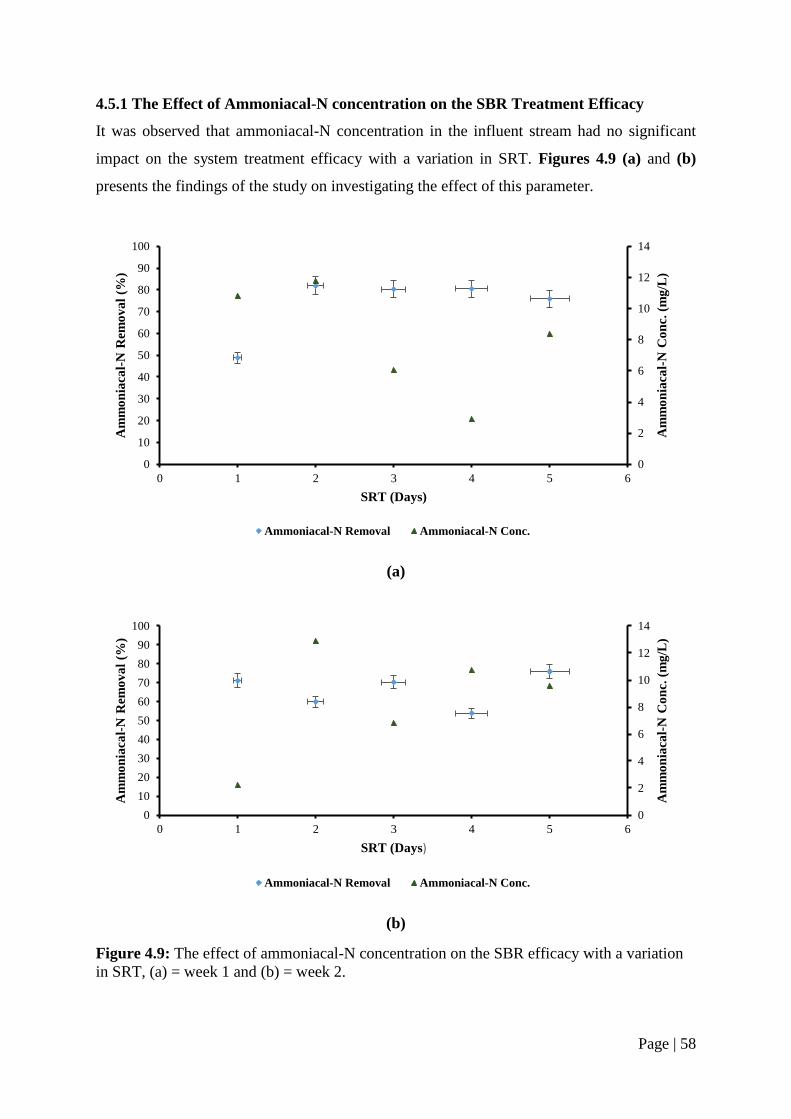
Page | 58
4.5.1 The Effect of Ammoniacal-N concentration on the SBR Treatment Efficacy
It was observed that ammoniacal-N concentration in the influent stream had no significant
impact on the system treatment efficacy with a variation in SRT. Figures 4.9 (a) and (b)
presents the findings of the study on investigating the effect of this parameter.
(a)
(b)
Figure 4.9: The effect of ammoniacal-N concentration on the SBR efficacy with a variation
in SRT, (a) = week 1 and (b) = week 2.
0
2
4
6
8
10
12
14
0
10
20
30
40
50
60
70
80
90
100
0 1 2 3 4 5 6
Am
mo
nia
cal-
N C
on
c. (
mg
/L)
Am
mo
nia
cal-
N R
emo
va
l (%
)
SRT (Days)
Ammoniacal-N Removal Ammoniacal-N Conc.
0
2
4
6
8
10
12
14
0
10
20
30
40
50
60
70
80
90
100
0 1 2 3 4 5 6
Am
mo
nia
cal-
N C
on
c. (
mg
/L)
Am
mo
nia
cal-
N R
emo
va
l (%
)
SRT (Days)
Ammoniacal-N Removal Ammoniacal-N Conc.
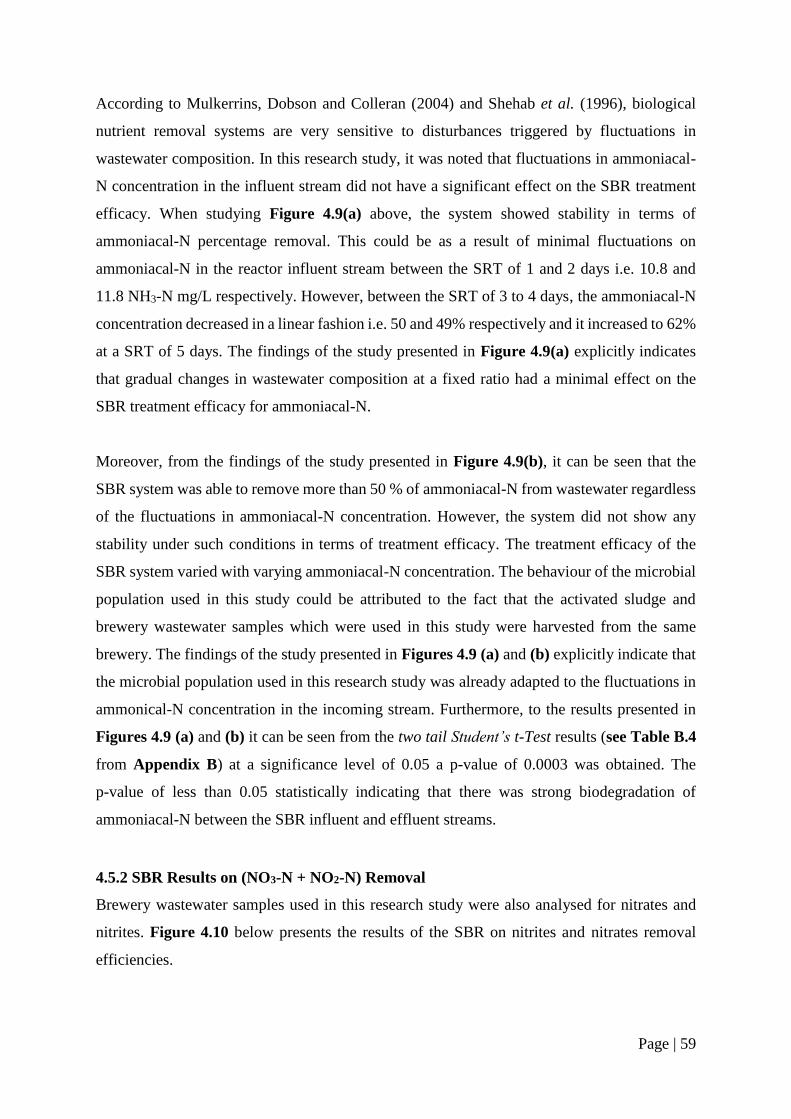
Page | 59
According to Mulkerrins, Dobson and Colleran (2004) and Shehab et al. (1996), biological
nutrient removal systems are very sensitive to disturbances triggered by fluctuations in
wastewater composition. In this research study, it was noted that fluctuations in ammoniacal-
N concentration in the influent stream did not have a significant effect on the SBR treatment
efficacy. When studying Figure 4.9(a) above, the system showed stability in terms of
ammoniacal-N percentage removal. This could be as a result of minimal fluctuations on
ammoniacal-N in the reactor influent stream between the SRT of 1 and 2 days i.e. 10.8 and
11.8 NH3-N mg/L respectively. However, between the SRT of 3 to 4 days, the ammoniacal-N
concentration decreased in a linear fashion i.e. 50 and 49% respectively and it increased to 62%
at a SRT of 5 days. The findings of the study presented in Figure 4.9(a) explicitly indicates
that gradual changes in wastewater composition at a fixed ratio had a minimal effect on the
SBR treatment efficacy for ammoniacal-N.
Moreover, from the findings of the study presented in Figure 4.9(b), it can be seen that the
SBR system was able to remove more than 50 % of ammoniacal-N from wastewater regardless
of the fluctuations in ammoniacal-N concentration. However, the system did not show any
stability under such conditions in terms of treatment efficacy. The treatment efficacy of the
SBR system varied with varying ammoniacal-N concentration. The behaviour of the microbial
population used in this study could be attributed to the fact that the activated sludge and
brewery wastewater samples which were used in this study were harvested from the same
brewery. The findings of the study presented in Figures 4.9 (a) and (b) explicitly indicate that
the microbial population used in this research study was already adapted to the fluctuations in
ammonical-N concentration in the incoming stream. Furthermore, to the results presented in
Figures 4.9 (a) and (b) it can be seen from the two tail Student’s t-Test results (see Table B.4
from Appendix B) at a significance level of 0.05 a p-value of 0.0003 was obtained. The
p-value of less than 0.05 statistically indicating that there was strong biodegradation of
ammoniacal-N between the SBR influent and effluent streams.
4.5.2 SBR Results on (NO3-N + NO2-N) Removal
Brewery wastewater samples used in this research study were also analysed for nitrates and
nitrites. Figure 4.10 below presents the results of the SBR on nitrites and nitrates removal
efficiencies.
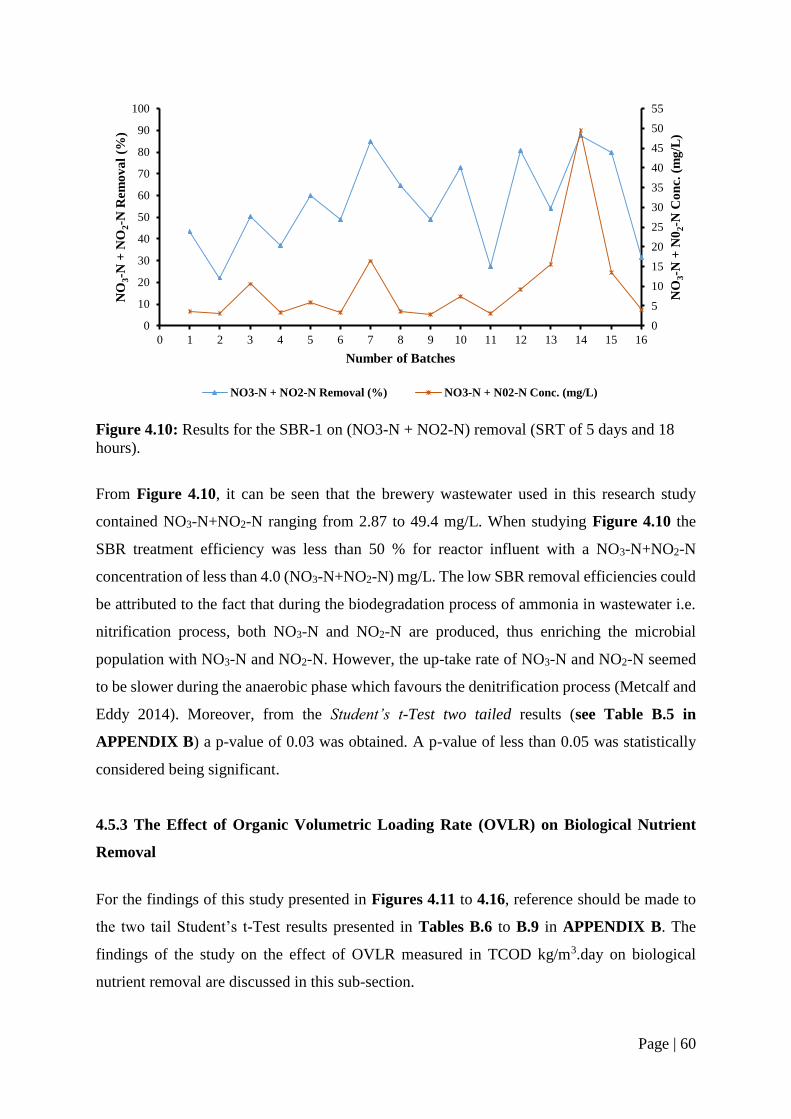
Page | 60
Figure 4.10: Results for the SBR-1 on (NO3-N + NO2-N) removal (SRT of 5 days and 18
hours).
From Figure 4.10, it can be seen that the brewery wastewater used in this research study
contained NO3-N+NO2-N ranging from 2.87 to 49.4 mg/L. When studying Figure 4.10 the
SBR treatment efficiency was less than 50 % for reactor influent with a NO3-N+NO2-N
concentration of less than 4.0 (NO3-N+NO2-N) mg/L. The low SBR removal efficiencies could
be attributed to the fact that during the biodegradation process of ammonia in wastewater i.e.
nitrification process, both NO3-N and NO2-N are produced, thus enriching the microbial
population with NO3-N and NO2-N. However, the up-take rate of NO3-N and NO2-N seemed
to be slower during the anaerobic phase which favours the denitrification process (Metcalf and
Eddy 2014). Moreover, from the Student’s t-Test two tailed results (see Table B.5 in
APPENDIX B) a p-value of 0.03 was obtained. A p-value of less than 0.05 was statistically
considered being significant.
4.5.3 The Effect of Organic Volumetric Loading Rate (OVLR) on Biological Nutrient
Removal
For the findings of this study presented in Figures 4.11 to 4.16, reference should be made to
the two tail Student’s t-Test results presented in Tables B.6 to B.9 in APPENDIX B. The
findings of the study on the effect of OVLR measured in TCOD kg/m3.day on biological
nutrient removal are discussed in this sub-section.
0
5
10
15
20
25
30
35
40
45
50
55
0
10
20
30
40
50
60
70
80
90
100
0 1 2 3 4 5 6 7 8 9 10 11 12 13 14 15 16
NO
3-N
+ N
02-N
Co
nc.
(m
g/L
)
NO
3-N
+ N
O2-N
Rem
ov
al
(%)
Number of Batches
NO3-N + NO2-N Removal (%) NO3-N + N02-N Conc. (mg/L)
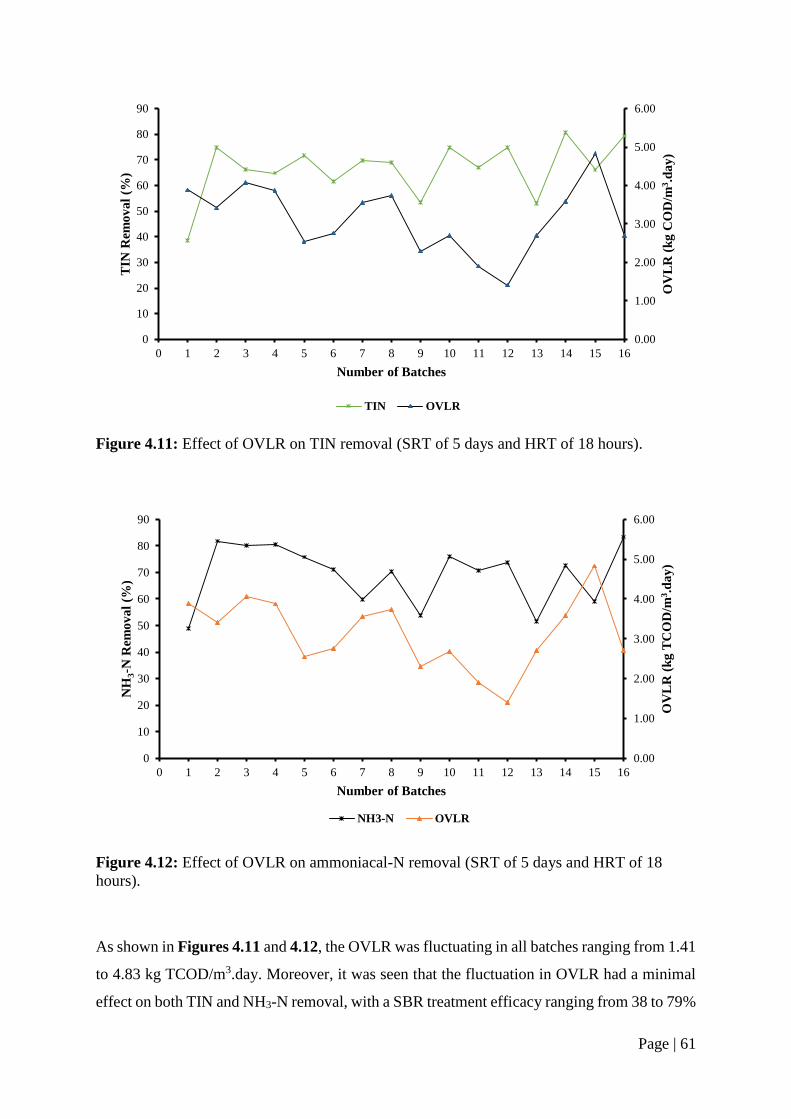
Page | 61
Figure 4.11: Effect of OVLR on TIN removal (SRT of 5 days and HRT of 18 hours).
Figure 4.12: Effect of OVLR on ammoniacal-N removal (SRT of 5 days and HRT of 18
hours).
As shown in Figures 4.11 and 4.12, the OVLR was fluctuating in all batches ranging from 1.41
to 4.83 kg TCOD/m3.day. Moreover, it was seen that the fluctuation in OVLR had a minimal
effect on both TIN and NH3-N removal, with a SBR treatment efficacy ranging from 38 to 79%
0.00
1.00
2.00
3.00
4.00
5.00
6.00
0
10
20
30
40
50
60
70
80
90
0 1 2 3 4 5 6 7 8 9 10 11 12 13 14 15 16
OV
LR
(k
g C
OD
/m3.d
ay
)
TIN
Rem
ov
al
(%)
Number of Batches
TIN OVLR
0.00
1.00
2.00
3.00
4.00
5.00
6.00
0
10
20
30
40
50
60
70
80
90
0 1 2 3 4 5 6 7 8 9 10 11 12 13 14 15 16
OV
LR
(k
g T
CO
D/m
3.d
ay
)
NH
3-N
Rem
ov
al
(%)
Number of Batches
NH3-N OVLR
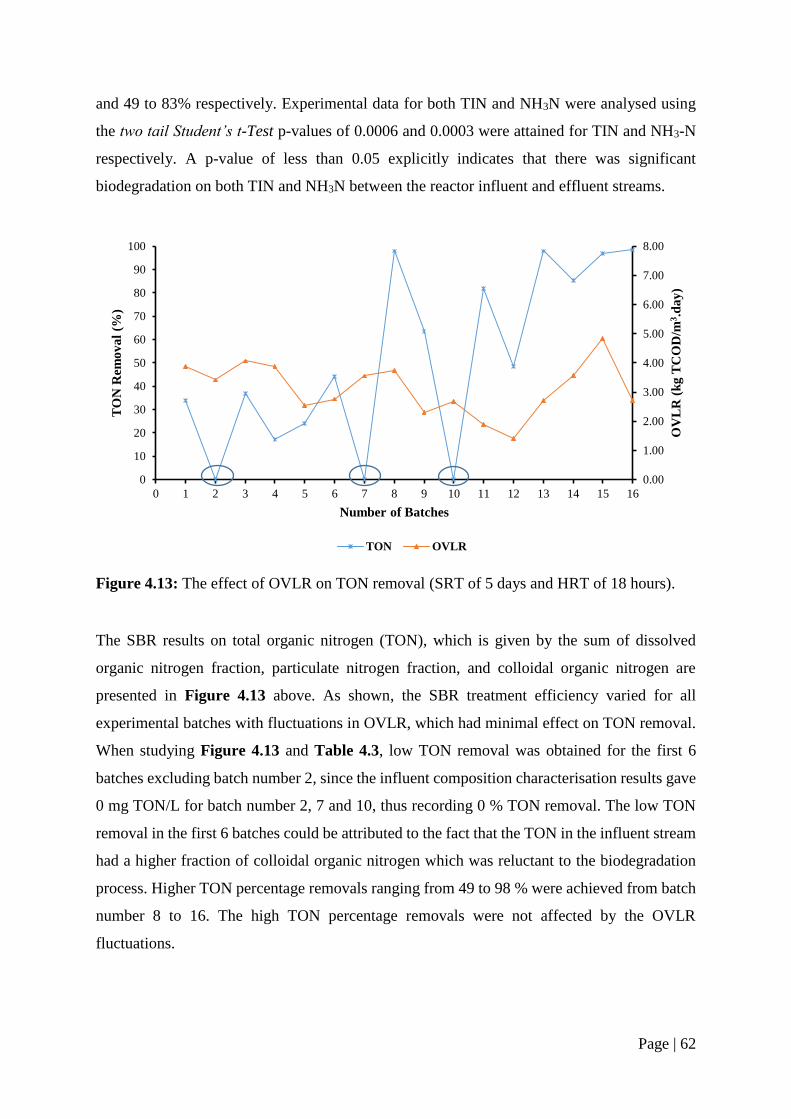
Page | 62
and 49 to 83% respectively. Experimental data for both TIN and NH3N were analysed using
the two tail Student’s t-Test p-values of 0.0006 and 0.0003 were attained for TIN and NH3-N
respectively. A p-value of less than 0.05 explicitly indicates that there was significant
biodegradation on both TIN and NH3N between the reactor influent and effluent streams.
Figure 4.13: The effect of OVLR on TON removal (SRT of 5 days and HRT of 18 hours).
The SBR results on total organic nitrogen (TON), which is given by the sum of dissolved
organic nitrogen fraction, particulate nitrogen fraction, and colloidal organic nitrogen are
presented in Figure 4.13 above. As shown, the SBR treatment efficiency varied for all
experimental batches with fluctuations in OVLR, which had minimal effect on TON removal.
When studying Figure 4.13 and Table 4.3, low TON removal was obtained for the first 6
batches excluding batch number 2, since the influent composition characterisation results gave
0 mg TON/L for batch number 2, 7 and 10, thus recording 0 % TON removal. The low TON
removal in the first 6 batches could be attributed to the fact that the TON in the influent stream
had a higher fraction of colloidal organic nitrogen which was reluctant to the biodegradation
process. Higher TON percentage removals ranging from 49 to 98 % were achieved from batch
number 8 to 16. The high TON percentage removals were not affected by the OVLR
fluctuations.
0.00
1.00
2.00
3.00
4.00
5.00
6.00
7.00
8.00
0
10
20
30
40
50
60
70
80
90
100
0 1 2 3 4 5 6 7 8 9 10 11 12 13 14 15 16
OV
LR
(k
g T
CO
D/m
3.d
ay
)
TO
N R
emo
va
l (%
)
Number of Batches
TON OVLR
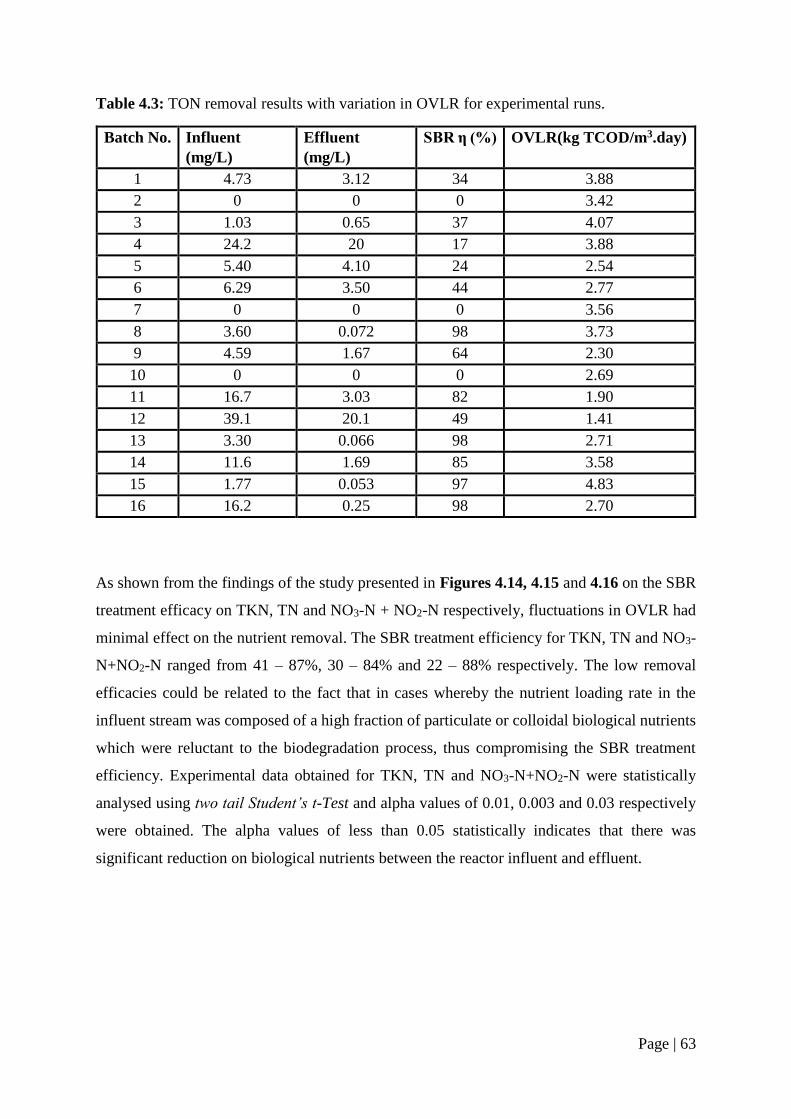
Page | 63
Table 4.3: TON removal results with variation in OVLR for experimental runs.
Batch No. Influent
(mg/L)
Effluent
(mg/L)
SBR η (%) OVLR(kg TCOD/m3.day)
1 4.73 3.12 34 3.88
2 0 0 0 3.42
3 1.03 0.65 37 4.07
4 24.2 20 17 3.88
5 5.40 4.10 24 2.54
6 6.29 3.50 44 2.77
7 0 0 0 3.56
8 3.60 0.072 98 3.73
9 4.59 1.67 64 2.30
10 0 0 0 2.69
11 16.7 3.03 82 1.90
12 39.1 20.1 49 1.41
13 3.30 0.066 98 2.71
14 11.6 1.69 85 3.58
15 1.77 0.053 97 4.83
16 16.2 0.25 98 2.70
As shown from the findings of the study presented in Figures 4.14, 4.15 and 4.16 on the SBR
treatment efficacy on TKN, TN and NO3-N + NO2-N respectively, fluctuations in OVLR had
minimal effect on the nutrient removal. The SBR treatment efficiency for TKN, TN and NO3-
N+NO2-N ranged from 41 – 87%, 30 – 84% and 22 – 88% respectively. The low removal
efficacies could be related to the fact that in cases whereby the nutrient loading rate in the
influent stream was composed of a high fraction of particulate or colloidal biological nutrients
which were reluctant to the biodegradation process, thus compromising the SBR treatment
efficiency. Experimental data obtained for TKN, TN and NO3-N+NO2-N were statistically
analysed using two tail Student’s t-Test and alpha values of 0.01, 0.003 and 0.03 respectively
were obtained. The alpha values of less than 0.05 statistically indicates that there was
significant reduction on biological nutrients between the reactor influent and effluent.
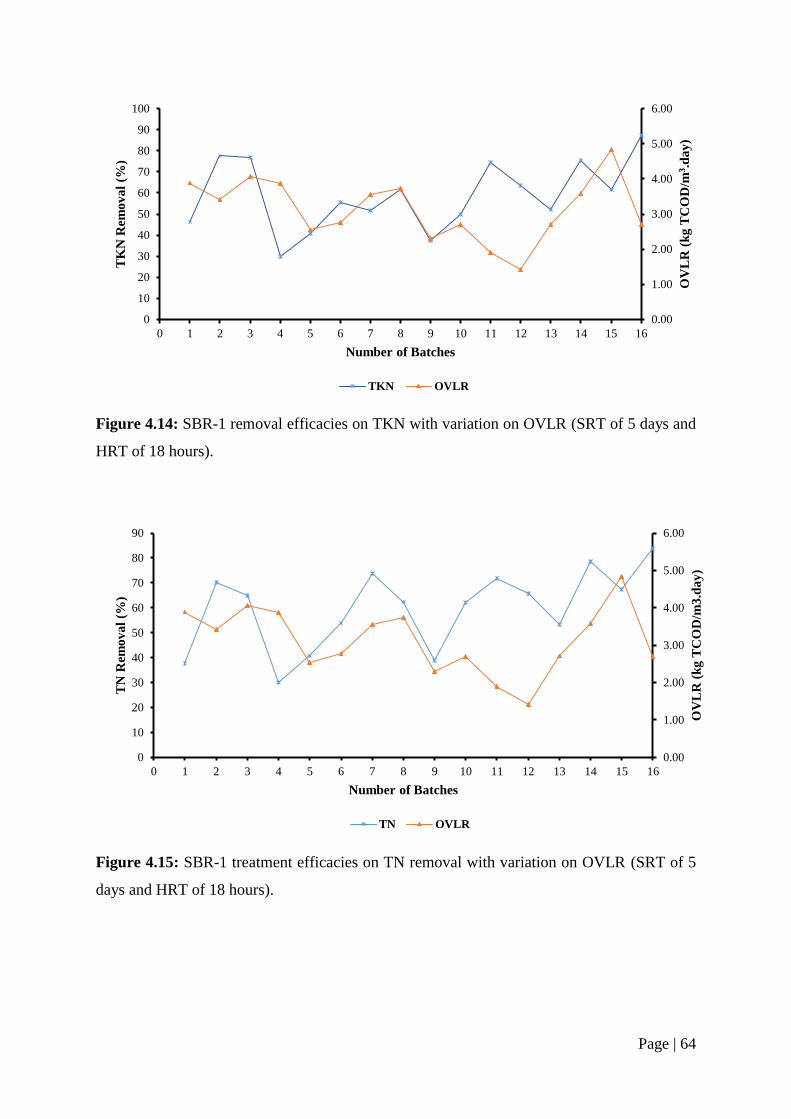
Page | 64
Figure 4.14: SBR-1 removal efficacies on TKN with variation on OVLR (SRT of 5 days and
HRT of 18 hours).
Figure 4.15: SBR-1 treatment efficacies on TN removal with variation on OVLR (SRT of 5
days and HRT of 18 hours).
0.00
1.00
2.00
3.00
4.00
5.00
6.00
0
10
20
30
40
50
60
70
80
90
100
0 1 2 3 4 5 6 7 8 9 10 11 12 13 14 15 16
OV
LR
(k
g T
CO
D/m
3.d
ay
)
TK
N R
emo
va
l (%
)
Number of Batches
TKN OVLR
0.00
1.00
2.00
3.00
4.00
5.00
6.00
0
10
20
30
40
50
60
70
80
90
0 1 2 3 4 5 6 7 8 9 10 11 12 13 14 15 16
OV
LR
(k
g T
CO
D/m
3.d
ay
)
TN
Rem
ov
al
(%)
Number of Batches
TN OVLR
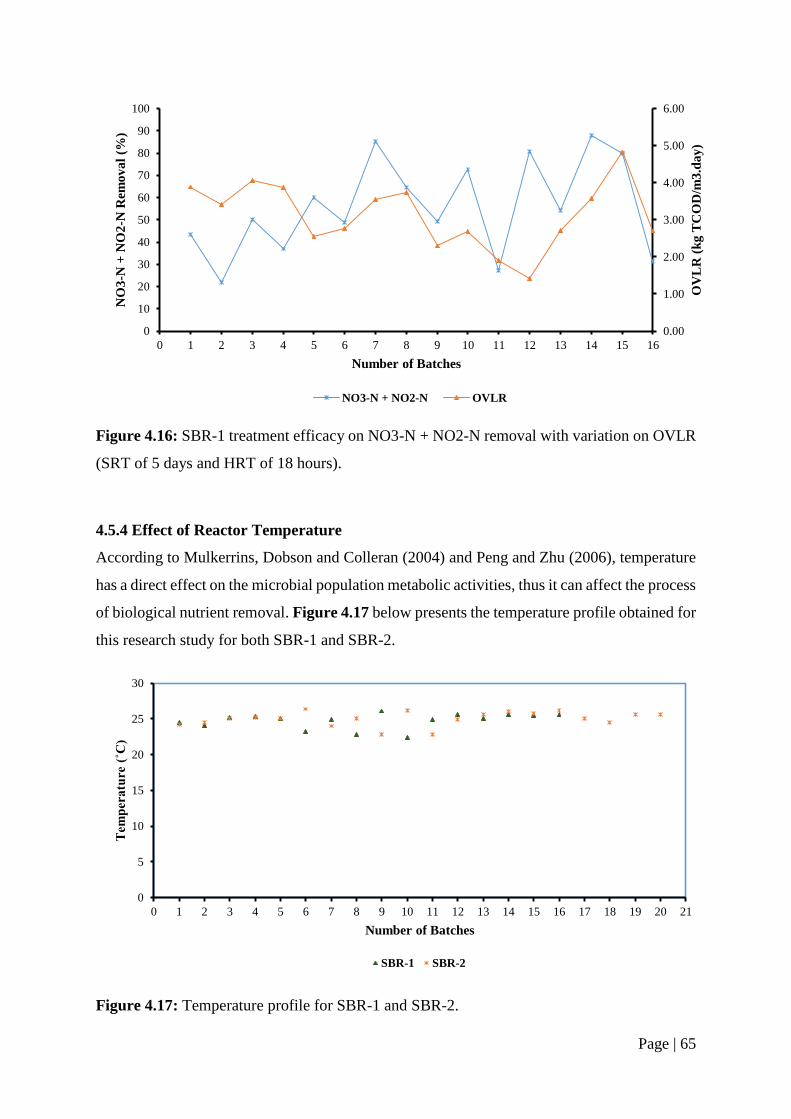
Page | 65
Figure 4.16: SBR-1 treatment efficacy on NO3-N + NO2-N removal with variation on OVLR
(SRT of 5 days and HRT of 18 hours).
4.5.4 Effect of Reactor Temperature
According to Mulkerrins, Dobson and Colleran (2004) and Peng and Zhu (2006), temperature
has a direct effect on the microbial population metabolic activities, thus it can affect the process
of biological nutrient removal. Figure 4.17 below presents the temperature profile obtained for
this research study for both SBR-1 and SBR-2.
Figure 4.17: Temperature profile for SBR-1 and SBR-2.
0.00
1.00
2.00
3.00
4.00
5.00
6.00
0
10
20
30
40
50
60
70
80
90
100
0 1 2 3 4 5 6 7 8 9 10 11 12 13 14 15 16
OV
LR
(k
g T
CO
D/m
3.d
ay
)
NO
3-N
+ N
O2
-N R
emo
va
l (%
)
Number of Batches
NO3-N + NO2-N OVLR
0
5
10
15
20
25
30
0 1 2 3 4 5 6 7 8 9 10 11 12 13 14 15 16 17 18 19 20 21
Tem
per
atu
re (
˚C)
Number of Batches
SBR-1 SBR-2
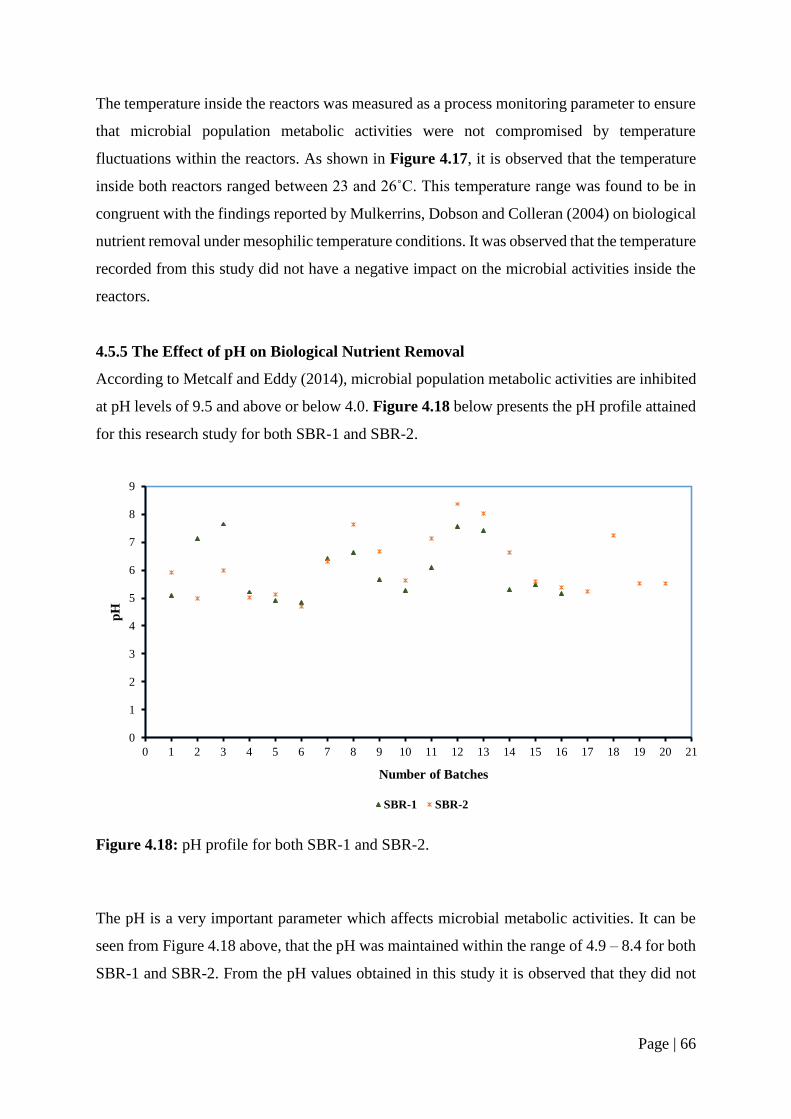
Page | 66
The temperature inside the reactors was measured as a process monitoring parameter to ensure
that microbial population metabolic activities were not compromised by temperature
fluctuations within the reactors. As shown in Figure 4.17, it is observed that the temperature
inside both reactors ranged between 23 and 26˚C. This temperature range was found to be in
congruent with the findings reported by Mulkerrins, Dobson and Colleran (2004) on biological
nutrient removal under mesophilic temperature conditions. It was observed that the temperature
recorded from this study did not have a negative impact on the microbial activities inside the
reactors.
4.5.5 The Effect of pH on Biological Nutrient Removal
According to Metcalf and Eddy (2014), microbial population metabolic activities are inhibited
at pH levels of 9.5 and above or below 4.0. Figure 4.18 below presents the pH profile attained
for this research study for both SBR-1 and SBR-2.
Figure 4.18: pH profile for both SBR-1 and SBR-2.
The pH is a very important parameter which affects microbial metabolic activities. It can be
seen from Figure 4.18 above, that the pH was maintained within the range of 4.9 – 8.4 for both
SBR-1 and SBR-2. From the pH values obtained in this study it is observed that they did not
0
1
2
3
4
5
6
7
8
9
0 1 2 3 4 5 6 7 8 9 10 11 12 13 14 15 16 17 18 19 20 21
pH
Number of Batches
SBR-1 SBR-2
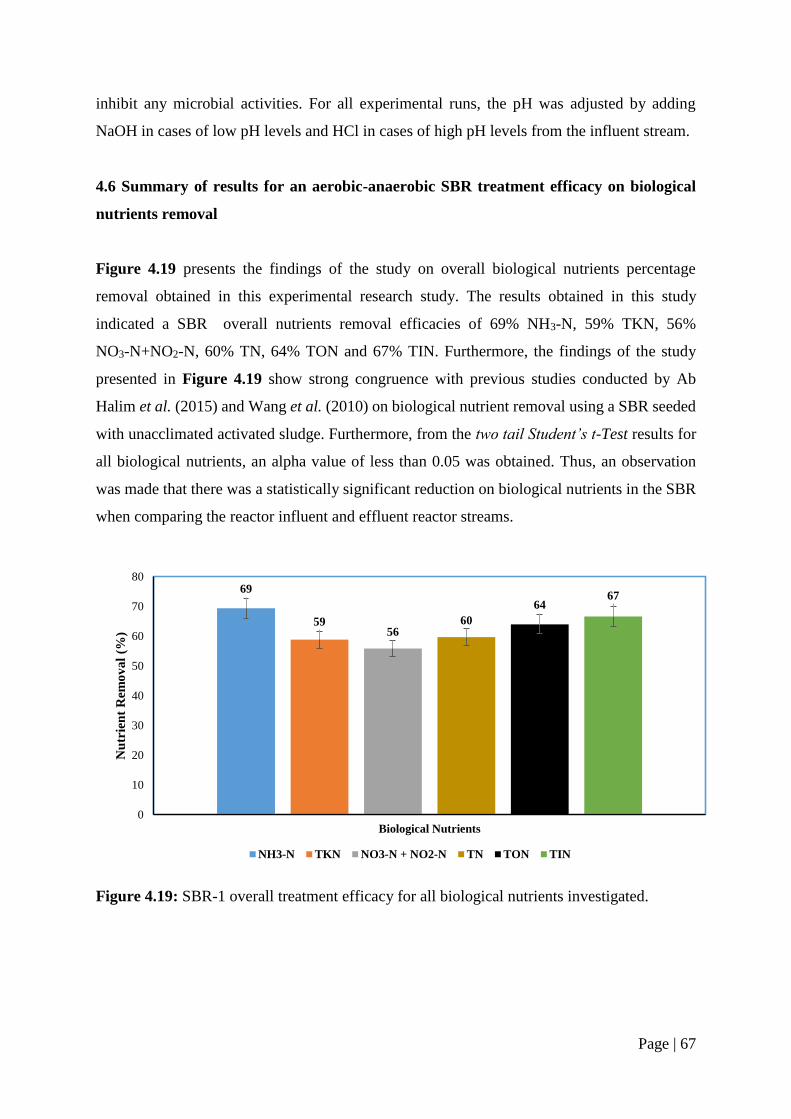
Page | 67
inhibit any microbial activities. For all experimental runs, the pH was adjusted by adding
NaOH in cases of low pH levels and HCl in cases of high pH levels from the influent stream.
4.6 Summary of results for an aerobic-anaerobic SBR treatment efficacy on biological
nutrients removal
Figure 4.19 presents the findings of the study on overall biological nutrients percentage
removal obtained in this experimental research study. The results obtained in this study
indicated a SBR overall nutrients removal efficacies of 69% NH3-N, 59% TKN, 56%
NO3-N+NO2-N, 60% TN, 64% TON and 67% TIN. Furthermore, the findings of the study
presented in Figure 4.19 show strong congruence with previous studies conducted by Ab
Halim et al. (2015) and Wang et al. (2010) on biological nutrient removal using a SBR seeded
with unacclimated activated sludge. Furthermore, from the two tail Student’s t-Test results for
all biological nutrients, an alpha value of less than 0.05 was obtained. Thus, an observation
was made that there was a statistically significant reduction on biological nutrients in the SBR
when comparing the reactor influent and effluent reactor streams.
Figure 4.19: SBR-1 overall treatment efficacy for all biological nutrients investigated.
69
5956
60
6467
0
10
20
30
40
50
60
70
80
Biological Nutrients
Nu
trie
nt
Rem
ov
al
(%)
NH3-N TKN NO3-N + NO2-N TN TON TIN
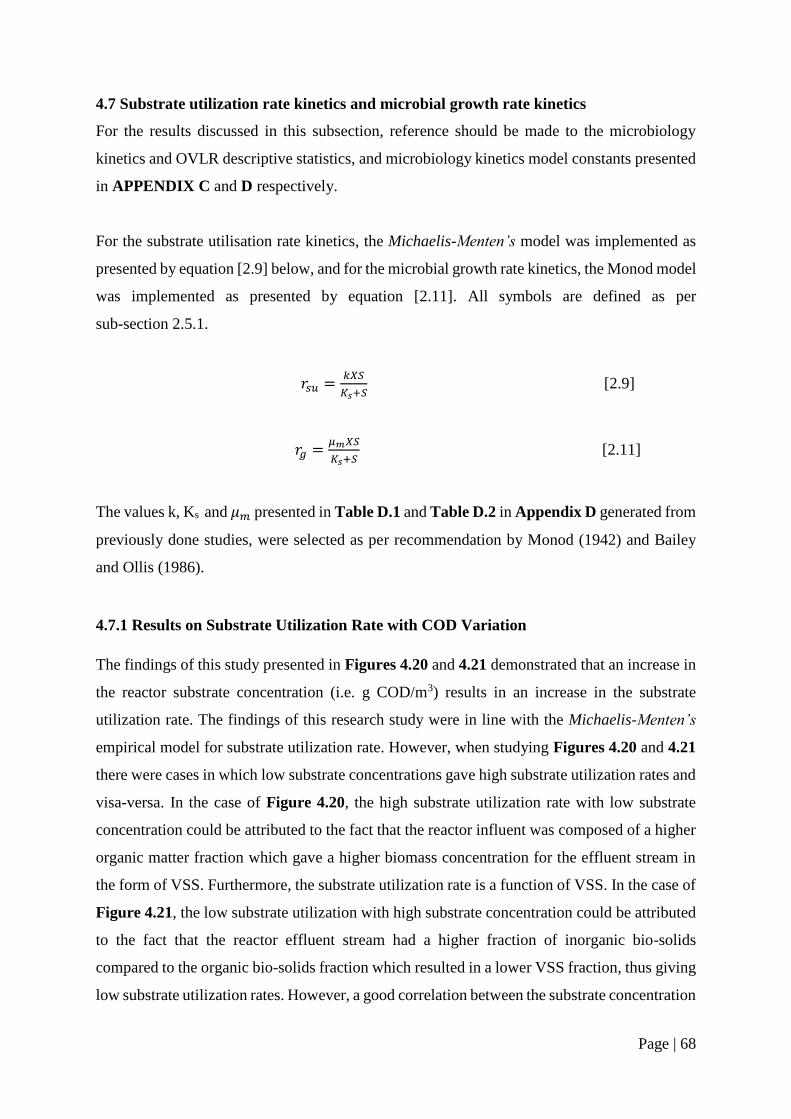
Page | 68
4.7 Substrate utilization rate kinetics and microbial growth rate kinetics
For the results discussed in this subsection, reference should be made to the microbiology
kinetics and OVLR descriptive statistics, and microbiology kinetics model constants presented
in APPENDIX C and D respectively.
For the substrate utilisation rate kinetics, the Michaelis-Menten’s model was implemented as
presented by equation [2.9] below, and for the microbial growth rate kinetics, the Monod model
was implemented as presented by equation [2.11]. All symbols are defined as per
sub-section 2.5.1.
𝑟𝑠𝑢 =𝑘𝑋𝑆
𝐾𝑠+𝑆 [2.9]
𝑟𝑔 =𝜇𝑚𝑋𝑆
𝐾𝑠+𝑆 [2.11]
The values k, Ks and 𝜇𝑚 presented in Table D.1 and Table D.2 in Appendix D generated from
previously done studies, were selected as per recommendation by Monod (1942) and Bailey
and Ollis (1986).
4.7.1 Results on Substrate Utilization Rate with COD Variation
The findings of this study presented in Figures 4.20 and 4.21 demonstrated that an increase in
the reactor substrate concentration (i.e. g COD/m3) results in an increase in the substrate
utilization rate. The findings of this research study were in line with the Michaelis-Menten’s
empirical model for substrate utilization rate. However, when studying Figures 4.20 and 4.21
there were cases in which low substrate concentrations gave high substrate utilization rates and
visa-versa. In the case of Figure 4.20, the high substrate utilization rate with low substrate
concentration could be attributed to the fact that the reactor influent was composed of a higher
organic matter fraction which gave a higher biomass concentration for the effluent stream in
the form of VSS. Furthermore, the substrate utilization rate is a function of VSS. In the case of
Figure 4.21, the low substrate utilization with high substrate concentration could be attributed
to the fact that the reactor effluent stream had a higher fraction of inorganic bio-solids
compared to the organic bio-solids fraction which resulted in a lower VSS fraction, thus giving
low substrate utilization rates. However, a good correlation between the substrate concentration
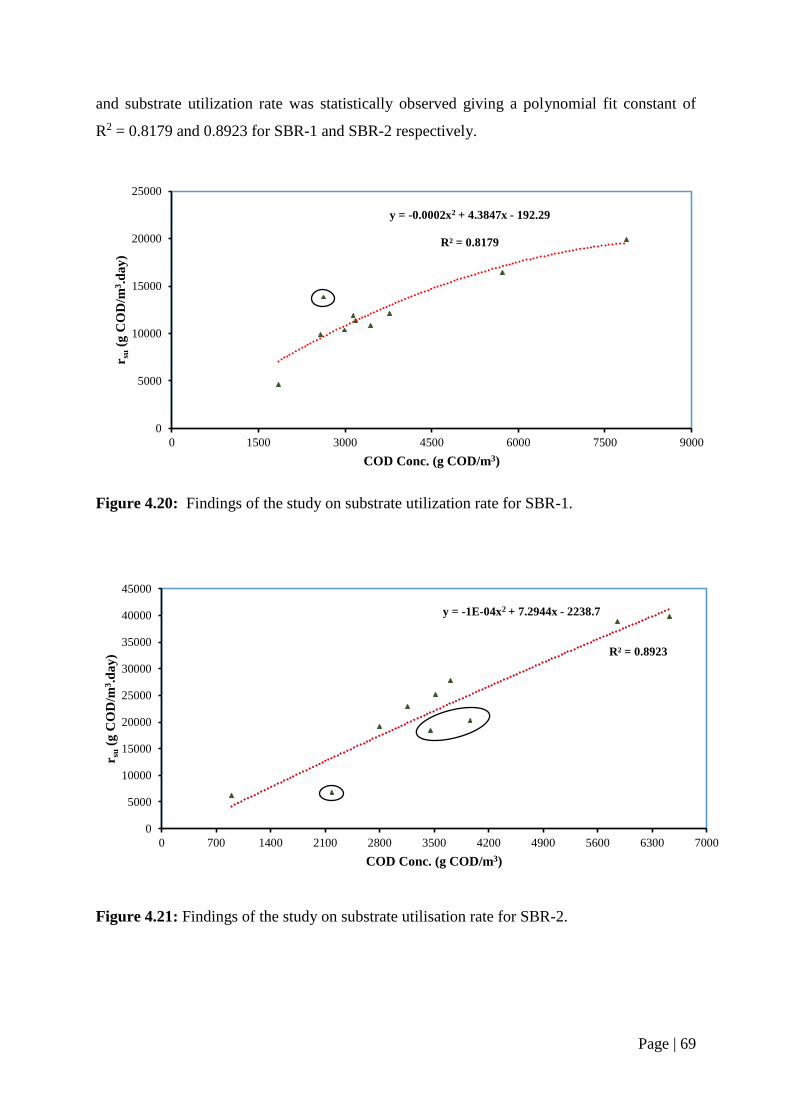
Page | 69
and substrate utilization rate was statistically observed giving a polynomial fit constant of
R2 = 0.8179 and 0.8923 for SBR-1 and SBR-2 respectively.
Figure 4.20: Findings of the study on substrate utilization rate for SBR-1.
Figure 4.21: Findings of the study on substrate utilisation rate for SBR-2.
y = -0.0002x2 + 4.3847x - 192.29
R² = 0.8179
0
5000
10000
15000
20000
25000
0 1500 3000 4500 6000 7500 9000
r su
(g C
OD
/m3.d
ay
)
COD Conc. (g COD/m3)
R² = 0.8923
y = -1E-04x2 + 7.2944x - 2238.7
0
5000
10000
15000
20000
25000
30000
35000
40000
45000
0 700 1400 2100 2800 3500 4200 4900 5600 6300 7000
r su
(g C
OD
/m3.d
ay
)
COD Conc. (g COD/m3)
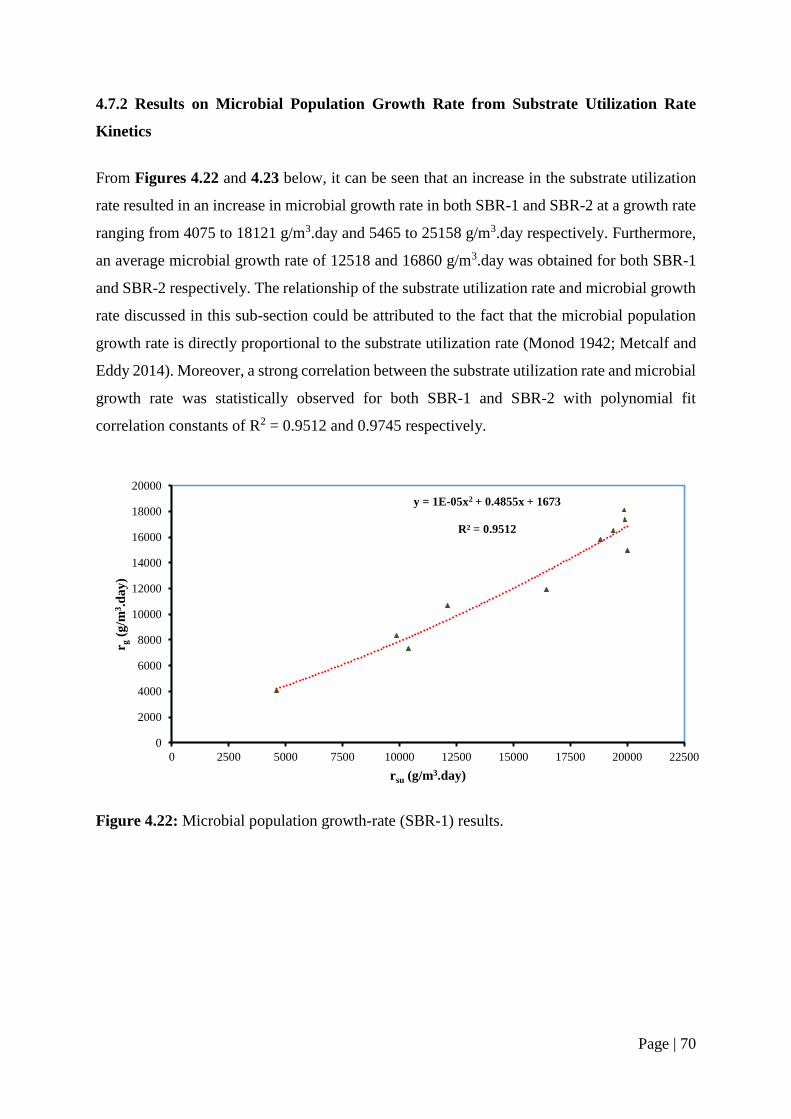
Page | 70
4.7.2 Results on Microbial Population Growth Rate from Substrate Utilization Rate
Kinetics
From Figures 4.22 and 4.23 below, it can be seen that an increase in the substrate utilization
rate resulted in an increase in microbial growth rate in both SBR-1 and SBR-2 at a growth rate
ranging from 4075 to 18121 g/m3.day and 5465 to 25158 g/m3.day respectively. Furthermore,
an average microbial growth rate of 12518 and 16860 g/m3.day was obtained for both SBR-1
and SBR-2 respectively. The relationship of the substrate utilization rate and microbial growth
rate discussed in this sub-section could be attributed to the fact that the microbial population
growth rate is directly proportional to the substrate utilization rate (Monod 1942; Metcalf and
Eddy 2014). Moreover, a strong correlation between the substrate utilization rate and microbial
growth rate was statistically observed for both SBR-1 and SBR-2 with polynomial fit
correlation constants of R2 = 0.9512 and 0.9745 respectively.
Figure 4.22: Microbial population growth-rate (SBR-1) results.
y = 1E-05x2 + 0.4855x + 1673
R² = 0.9512
0
2000
4000
6000
8000
10000
12000
14000
16000
18000
20000
0 2500 5000 7500 10000 12500 15000 17500 20000 22500
r g(g
/m3.d
ay
)
rsu (g/m3.day)
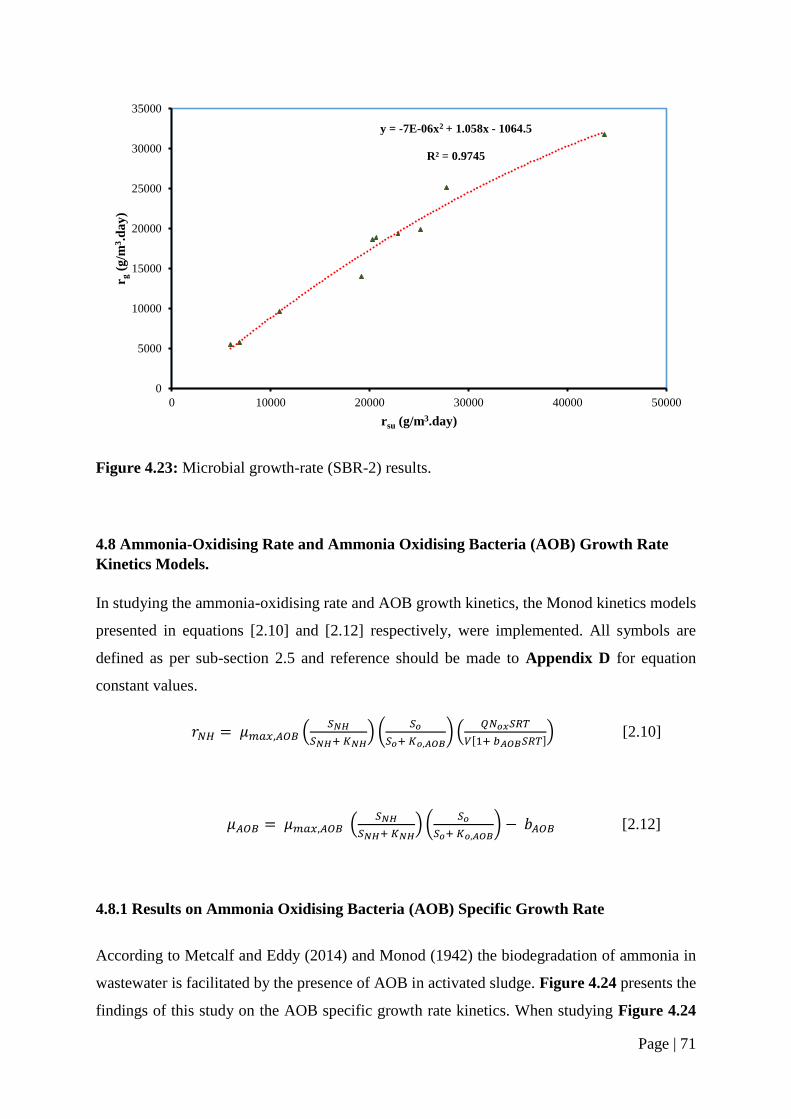
Page | 71
Figure 4.23: Microbial growth-rate (SBR-2) results.
4.8 Ammonia-Oxidising Rate and Ammonia Oxidising Bacteria (AOB) Growth Rate
Kinetics Models.
In studying the ammonia-oxidising rate and AOB growth kinetics, the Monod kinetics models
presented in equations [2.10] and [2.12] respectively, were implemented. All symbols are
defined as per sub-section 2.5 and reference should be made to Appendix D for equation
constant values.
𝑟𝑁𝐻 = 𝜇𝑚𝑎𝑥,𝐴𝑂𝐵 (𝑆𝑁𝐻
𝑆𝑁𝐻+ 𝐾𝑁𝐻) (
𝑆𝑜
𝑆𝑜+ 𝐾𝑜,𝐴𝑂𝐵) (
𝑄𝑁𝑜𝑥𝑆𝑅𝑇
𝑉[1+ 𝑏𝐴𝑂𝐵𝑆𝑅𝑇]) [2.10]
𝜇𝐴𝑂𝐵 = 𝜇𝑚𝑎𝑥,𝐴𝑂𝐵 (𝑆𝑁𝐻
𝑆𝑁𝐻+ 𝐾𝑁𝐻) (
𝑆𝑜
𝑆𝑜+ 𝐾𝑜,𝐴𝑂𝐵) − 𝑏𝐴𝑂𝐵 [2.12]
4.8.1 Results on Ammonia Oxidising Bacteria (AOB) Specific Growth Rate
According to Metcalf and Eddy (2014) and Monod (1942) the biodegradation of ammonia in
wastewater is facilitated by the presence of AOB in activated sludge. Figure 4.24 presents the
findings of this study on the AOB specific growth rate kinetics. When studying Figure 4.24
y = -7E-06x2 + 1.058x - 1064.5
R² = 0.9745
0
5000
10000
15000
20000
25000
30000
35000
0 10000 20000 30000 40000 50000
r g(g
/m3.d
ay
)
rsu (g/m3.day)
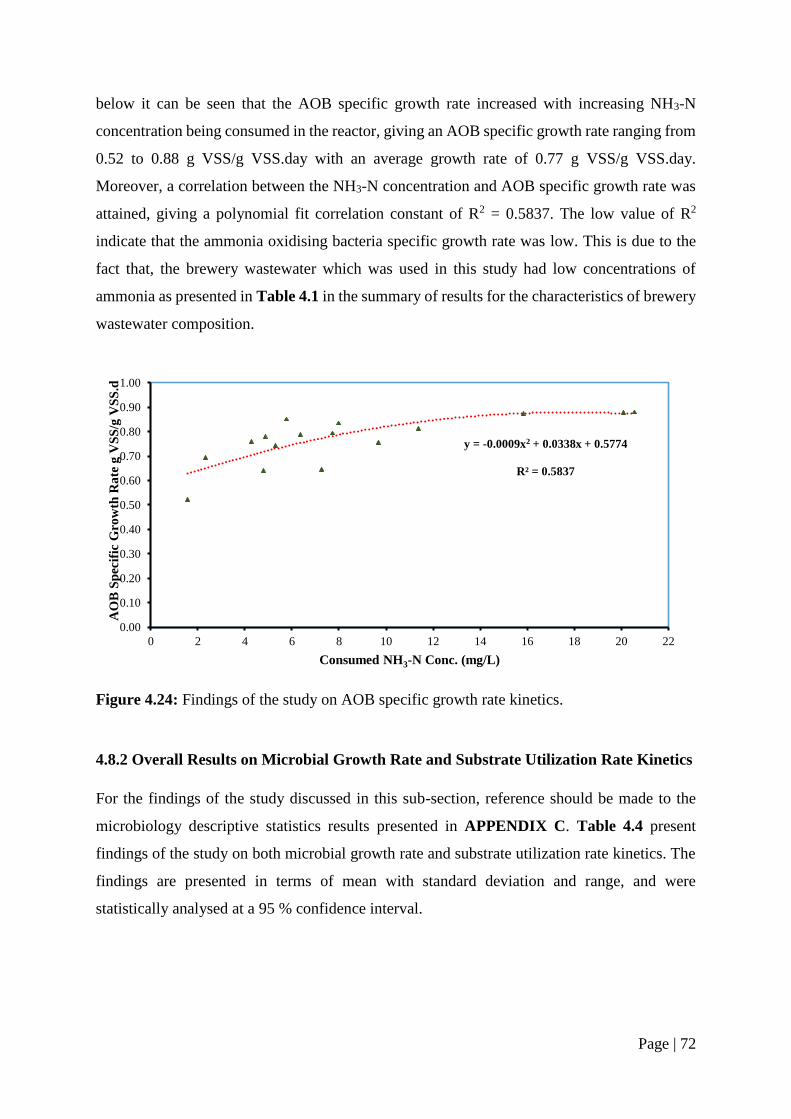
Page | 72
below it can be seen that the AOB specific growth rate increased with increasing NH3-N
concentration being consumed in the reactor, giving an AOB specific growth rate ranging from
0.52 to 0.88 g VSS/g VSS.day with an average growth rate of 0.77 g VSS/g VSS.day.
Moreover, a correlation between the NH3-N concentration and AOB specific growth rate was
attained, giving a polynomial fit correlation constant of R2 = 0.5837. The low value of R2
indicate that the ammonia oxidising bacteria specific growth rate was low. This is due to the
fact that, the brewery wastewater which was used in this study had low concentrations of
ammonia as presented in Table 4.1 in the summary of results for the characteristics of brewery
wastewater composition.
Figure 4.24: Findings of the study on AOB specific growth rate kinetics.
4.8.2 Overall Results on Microbial Growth Rate and Substrate Utilization Rate Kinetics
For the findings of the study discussed in this sub-section, reference should be made to the
microbiology descriptive statistics results presented in APPENDIX C. Table 4.4 present
findings of the study on both microbial growth rate and substrate utilization rate kinetics. The
findings are presented in terms of mean with standard deviation and range, and were
statistically analysed at a 95 % confidence interval.
y = -0.0009x2 + 0.0338x + 0.5774
R² = 0.5837
0.00
0.10
0.20
0.30
0.40
0.50
0.60
0.70
0.80
0.90
1.00
0 2 4 6 8 10 12 14 16 18 20 22
AO
B S
pec
ific
Gro
wth
Ra
te g
VS
S/g
VS
S.d
Consumed NH3-N Conc. (mg/L)
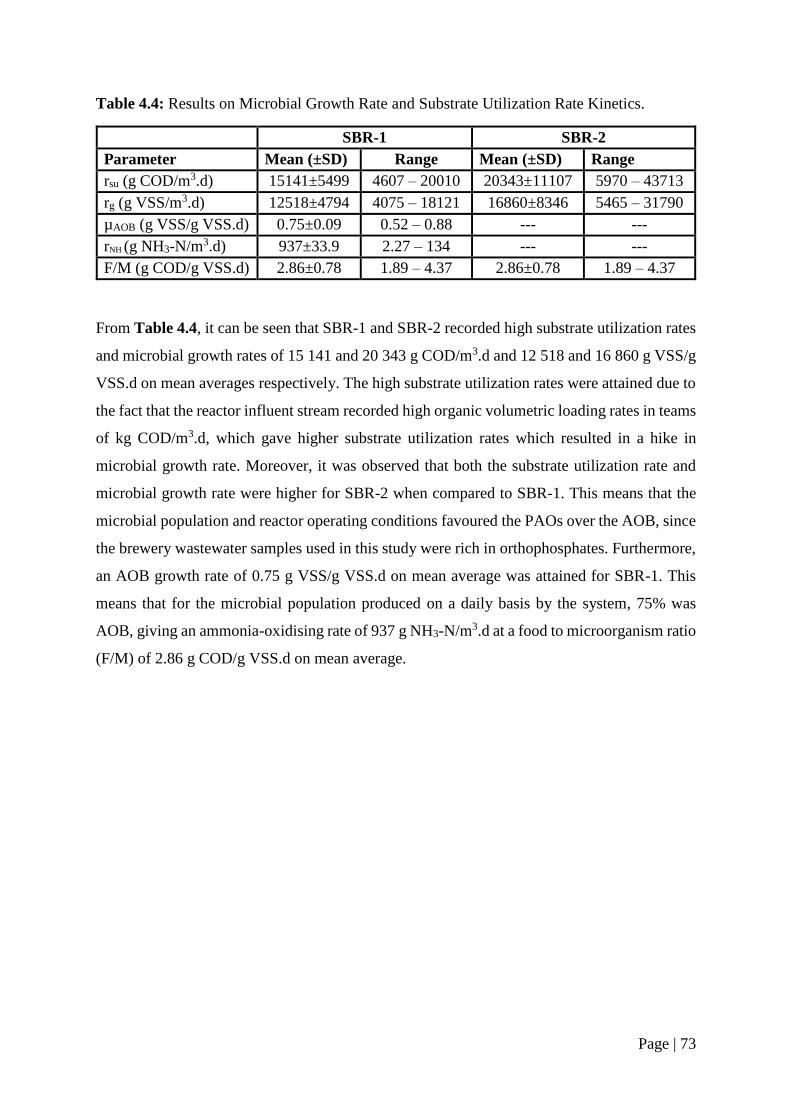
Page | 73
Table 4.4: Results on Microbial Growth Rate and Substrate Utilization Rate Kinetics.
SBR-1 SBR-2
Parameter Mean (±SD) Range Mean (±SD) Range
rsu (g COD/m3.d) 15141±5499 4607 – 20010 20343±11107 5970 – 43713
rg (g VSS/m3.d) 12518±4794 4075 – 18121 16860±8346 5465 – 31790
µAOB (g VSS/g VSS.d) 0.75±0.09 0.52 – 0.88 --- ---
rNH (g NH3-N/m3.d) 937±33.9 2.27 – 134 --- ---
F/M (g COD/g VSS.d) 2.86±0.78 1.89 – 4.37 2.86±0.78 1.89 – 4.37
From Table 4.4, it can be seen that SBR-1 and SBR-2 recorded high substrate utilization rates
and microbial growth rates of 15 141 and 20 343 g COD/m3.d and 12 518 and 16 860 g VSS/g
VSS.d on mean averages respectively. The high substrate utilization rates were attained due to
the fact that the reactor influent stream recorded high organic volumetric loading rates in teams
of kg COD/m3.d, which gave higher substrate utilization rates which resulted in a hike in
microbial growth rate. Moreover, it was observed that both the substrate utilization rate and
microbial growth rate were higher for SBR-2 when compared to SBR-1. This means that the
microbial population and reactor operating conditions favoured the PAOs over the AOB, since
the brewery wastewater samples used in this study were rich in orthophosphates. Furthermore,
an AOB growth rate of 0.75 g VSS/g VSS.d on mean average was attained for SBR-1. This
means that for the microbial population produced on a daily basis by the system, 75% was
AOB, giving an ammonia-oxidising rate of 937 g NH3-N/m3.d at a food to microorganism ratio
(F/M) of 2.86 g COD/g VSS.d on mean average.
Page | 74
CHAPTER FIVE
CONCLUSIONS AND RECOMMENDATIONS
5.1 Conclusions
The aim of this experimental research study was to investigate the performance of a cyclic
aerobic-anaerobic SBR inoculated with activated sludge for the removal of orthophosphates
and nitrogen group pollutants from industrial wastewater generated from the brewery. This
section presents the conclusions and recommendations made on the basis of the findings
presented in Chapter Four. In achieving the aim of the research study, the objectives of the
study were defined as follows:
Characterising wastewater generated from the brewery.
Determine the sequencing batch reactor treatment efficiency in treating brewery
wastewater for biological nutrient removal in terms of percentage removal.
Investigate the effect of influent organic pollutant strength/organic volumetric loading
rate in terms of chemical oxygen demand in treating brewery wastewater for biological
nutrients.
Use Monod and Michaelis-Menten’s empirical models to study the microbiology
kinetics in terms of substrate utilisation rate kinetics, and microbial growth rate kinetics.
5.1.1 Characterisation of brewery wastewater composition
The results which were attained in this study on characterisation of brewery wastewater
composition explicitly showed that wastewater generated from the brewery contained high
organic, inorganic, and biological nutrients pollutants. It was also observed that the
composition of brewery wastewater samples used in this study fluctuated greatly which was
congruent to previously done studies on brewery wastewater characterisation. Moreover, the
brewery effluent did not meet the industrial wastewater discharge limits set by the South
African Department of Water Affairs, therefore brewery wastewater required treatment prior
to discharge into water receiving bodies.
Page | 75
5.1.2 Effect of SRT and HRT on biological nutrient removal
The results obtained from this study showed that higher biological nutrient removal was
achieved with increasing SRT particularly on orthophosphates removal. The findings of the
study on mass balance results explicitly showed that biodegradation of biological nutrients
were mostly achieved through the solids retention time more than the HRT for both the aerobic
and anaerobic phases. It was also observed that an increase in HRT resulted in an increase in
biological nutrient removal. Moreover, the HRT of 18 hours and SRT of 5 and 7 days for
nitrogen and orthophosphates respectively was found to be optimum for the biodegradation of
biological nutrients from industrial wastewater generated from the brewery.
5.1.3 Effect of organic volumetric loading rate (OVLR) on biological nutrients removal
The findings of the study showed that brewery wastewater samples used in this research study
fluctuated greatly in terms of OVLR for all experimental runs. It was observed that the
fluctuations in OVLR had a minimal effect on biological nutrient removal. On average an
OVLR of 3.17 kg COD/m3.d was attained. This was due to the fact that the microbial
population and brewery wastewater samples used in this study were harvested from the same
brewery, thus the microbial population was adaptable to the fluctuations in OVLR. It may be
said that an OVLR of 3.17 kg COD/m3.d did not inhibit the biodegradation process of
biological nutrients in brewery wastewater.
5.1.4 Orthophosphates removal
The findings of the study on the investigation of the SBR for orthophosphates removal efficacy
demonstrated high removal efficacies ranging from 33 to 81% and recording 69% on average.
From the findings of the study, it was found that higher orthophosphates removal efficacies
were achieved at a SRT of 5 days and above. Furthermore, the system was found to be stable
at a SRT of 3 days with minimal effects from OVLR fluctuations. Based on the findings of the
study attained, it may be concluded that the SBR demonstrated high orthophosphate removal
efficacies at a SRT of 5 days and above, moreover, the SBR was found to be stable at a SRT
of 3 days.
Page | 76
5.1.6 Nitrogen Removal
The SBR system under cyclic aerobic-anaerobic configuration was also investigated for
nitrogen pollutant removal by measuring the percentage removal of NH3-N, TKN, NO3-N +
NO2-N, TN, TON, and TIN. The findings of the study on SBR cyclic anaerobic-aerobic
configuration indicated good nitrogen pollutant removal efficacies of 69% NH3-N, 67% TIN,
64% TON, 60% TN, 59% TKN, and 56% NO3-N+NO2-N on average. Based on the
experimental results, the SBR under cyclic anaerobic-aerobic configuration demonstrated good
biological nutrient removal efficacies from industrial wastewater generated from the brewery
characterised with high organic load. Therefore, the SBR system demonstrated to be a sound
technology to be implemented as a treatment process for industrial wastewater with high
organic load prior to discharge into water receiving bodies, thus eliminating nitrogen pollutants
from waste streams, which will enable the remediation of nitrogen pollution.
5.1.7 Substrate utilization rate kinetics and microbial growth rate kinetics
As discussed in detail in the literature presented in Chapter Two, it is imperative to study
microbiology kinetics for the understanding of the dynamic manifestations of microbial life.
Higher substrate concentration in the form of readily biodegradable COD were found to impact
positively on the substrate utilization rate. Higher COD concentrations resulted in higher
substrate utilisation rates. The findings of the study showed strong congruence with the
Michaelis-Menten’s empirical model for substrate utilisation rates. According to the Michaelis-
Menten’s empirical model, the substrate utilization rate increases with an increase in the
substrate concentration. Furthermore, based on the findings of the study, it was found that
higher substrate utilisation rates gave an increase in microbial growth rate. Microbial growth
rates of 12 518 and 16 860 g VSS/g VSS.d on average were recorded for SBR-1 and SBR-2
respectively, with an AOB growth rate of 0.75g VSS/g VSS.d. Based on the findings of the
study on microbial growth and substrate utilisation rate, the microbial population used in this
study demonstrated higher substrate utilisation rates and good microbial population growth
rates. Thus, facilitating the biodegradation process of biological nutrients from industrial
wastewater with high organic load.
Page | 77
5.2 Recommendations
From the knowledge attained in this research work, the following recommendations are
proposed for further studies to be conducted on biological nutrient removal from industrial
wastewater characterised with high organic load.
5.2.1 Wastewater composition C:N:P ratio balance
This study indicated that brewery wastewater pollutants fluctuate greatly which led to
fluctuations in nutrient removal efficacies, particularly nitrogen pollutants. It is recommended
that an investigation on biological nutrient removal using brewery wastewater with a well-
balanced C:N:P ratio should be done to improve biological nutrient removal efficacies.
5.2.2 Temperature variation within the reactor
For this research work, the temperature within the reactor was left un-adjusted. It is
recommended that further studies has to be done on SBR systems for biological nutrient
removal with temperature variation to investigate the effect of temperature on the SBR
performance for biological nutrient removal.
5.2.3 Use of acclimated sludge
The SBR was inoculated with un-acclimated sludge, since both the sludge and brewery
wastewater were taken from the same plant. A recommendation is made that further studies
could be conducted using well acclimated sludge under cyclic aerobic-anaerobic configuration.
This could improve the biodegradation of biological nutrients during the cyclic operating
configuration of the SBR system.
Page | 78
REFERENCES
Ab Halim, M. H., Azmi, S. I., Jamal, A. N. S., Anuar, A. N., Ujang, Z. and Bob, M. M. 2015.
Cultivation and characteristics of aerobic granular sludge for simultaneous organics and
nutrients removal performances at high temperature. Malaysian Journal of Civil Engineering,
2 (27): 301-310.
Abimbola, E. M., Josiah, A. S., Kumari, Feroz, S. M. and Faizal, B. 2015. Characterization of
Brewery Wastewater Composition. International Journal of Environmental, Chemical,
Ecological, Geological and Geophysical Engineering, 9 (9): 1015-1018.
Aguado, D., Ribes, J., Montoya, T., Ferrer, J. and Seco, A. 2009. A methodology for
sequencing batch reactor identification with artificial neural networks: A case study.
Computers and Chemical Engineering, 33: 465-472.
Ahn, Y. and Logan, B. E. 2013. Domestic wastewater treatment using multi-electrode
continuous flow MFCs with a separator electrode assembly design. Applied microbiology and
biotechnology, 97 (1): 409-416.
Ahna, Y. T., Kang, S. T., Chae, S. R., Leed, C. Y., Bae, B. U. and Shin, H. S. 2006.
Simultaneous high-strength organic and nitrogen removal with combined anaerobic upflow bed
filter and aerobic membrane bioreactor. Desalination, 202 (3): 114 –121.
Alarcon, G. O. 1961. Removal of phosphorus from sewage. Master's essay, Johns Hopkins
University, Baltimore, Md.
Alvarado-Lassman, A., Rustrian, E., Garcia-Alvarado, M. A., Rodriguez-Jimenez, G. C. and
Houbron, E. 2008. Brewery wastewater treatment using anaerobic inverse fluidized bed
reactors. Bioresource Technology, 99: 3009–3015.
Andreasen, K. and Sigvardsen, L. 1996. Experiences with sludge settleability in different
process alternatives for nutrient removal. Water Science and Technology, 33 (12): 137-146.
APHA. 2012. Standard Methods for the Examination of Water and Wastewater. Washington,
DC: American Water Works Association and Water Environmental Federation.
Arun, M. 2011. Biological Wastewater Treatment. Water Today, 1 (1): 32-44.
Atalay, S. and Ersöz, G. 2016. Advanced Oxidation Processes. In: Novel Catalysts in Advanced
Oxidation of Organic Pollutants. Basel: Springer International Publishing, 23-34.
Page | 79
Bailey, J. E. and Ollis, D. F. 1986. Biochemical Engineering Fundamentals. New York:
McGraw-Hill.
Bakare, B., Shabangu, K. and Chetty, M. 2017. Brewery wastewater treatment using laboratory
scale aerobic sequencing batch reactor. South African Journal of Chemical Engineering, 24:
128-134.
Barnard, J. and Comeau, Y. 2014. Phosphorus removal in activated sludge. IWA Publishing,
London, UK.
Barnard, J. L. 1947. Cut P and N without chemicals. Water and Wastes Engineering, 11 (8):
41-44.
Barnard, J. L. 1976. A review of biological phosphorus removal in the activated sludge process.
Water SA, 2 (3): 136-144.
Barnard, J. L. 1998. The Development of Nutrient Removal Processes. Water and Environment
Journal, 12 (5): 330-337.
Bock, E., Schmidt, I., Stuven, R. and Zart, D. 1995. Nitrogen loss caused by denitrifying
Nitrosomonas cells using ammonia or hydrogen as electron donors and nitrite as electron
acceptor. Archives of Microbiology, 163: 16-20.
Brdjonovic, D., van Loosdrecht, M. C. M., Hooijmans, C. M., Alaerts, G. J. and Heijnen, J. J.
1997. Temperature effects on physiology of biological phosphorus removal. Journal of
Environmental Engineering, 123 (2): 144-153.
Carrera, J., Baeza, J. A., Vicent, T. and Lafuente, J. 2003. Biological nitrogen removal of high-
strength ammonium industrial wastewater with two-sludge system. Water Research, 37: 4211-
4221.
Carucci, A., Lindrea, K., Majone, M. and Ramadori, R. 1999. Different mechanisms for the
anaerobic storage of organic substrates and their effect on enhanced biological phosphate
removal (EBPR). Water Science and Technology, 39 (6): 21-28.
Chan, C., Guisasola, A. and Baeza, J. A. 2017. Enhanced Biological Phosphorus Removal at
low Sludge Retention Time in view of its integration in A-stage systems. Water Research, 118:
217-226.
Chang, W. C., Chiou, R. J. and Ouyang, C. F. 1996. The effect of residual substrate utilisation
on sludge settling in an enhanced biological phosphorus removal process. Water Science and
Technology, 34 (1-2): 425-430.
Page | 80
Chuang, S. H., Ouyang, C. F., Yuang, H. C. and You, S. J. 1998. Phosphorus and
polyhydroxyalkanoates variation in a combined process with activated sludge and biofilm.
Water Science and Technology, 37 (4-5): 593-597.
Cicek, N. 2003. A review of membrane bioreactors and their potential application in the
treatment of agricultural wastewater. Biosystems Engineering, 45: 6.37-36.49.
Cintron, N. 2016. Effects of Environmental and Anthropogenic Factors on Water Quality in
the Rock Creek Watershed. Uniformed Services University of the Health Sciences, Bethesda,
United States.
Comeau, Y., Lamarre, D., Roberge, F., Perrier, M., Desjardins, G., Hade, C. and Mayer, R.
1996. Biological nutrient removal from a phosphorus-rich pre-fermented industrial wastewater.
Water Science and Technology, 34 (1-2): 169-177.
Cronin, C. and Lo, K. 1998. Anaerobic treatment of brewery wastewater using UASB reactors
seeded with activated sludge. Bioresource Technology, 64: 33-38.
Daverey, A., Su, S.-H., Huang, Y.-T., Chen, S.-S., Sung, S. and Lin, J.-G. 2013. Partial
nitrification and anammox process: A method for high strength optoelectronic industrial
wastewater treatment. Water Research, 47: 2929-2937.
EPA, U. S. 1993. Nitrogen Control Manual. EPA/625/R-93/010. Cincinnati, OH.: Office of
Research and Development.
Eusebio, A., Petruccioli, M., Lageiro, M., Federici, F. and Duarte, J. C. 2004. Microbial
characterisation of activated sludge in jet-loop bioreactors treating winery wastewaters.
Journal of Industrial Microbiology and Biotechnology, 31 (1): 29–34.
Fu, X., Zhenxing, H., Hengfeng, M., Hongyan, R., Mingxing, Z. and Wenquan, R. 2013.
Identical full-scale biogas-lift reactors (BLRs) with anaerobic granular sludge and residual
activated sludge for brewery wastewater treatment and kinetic modeling. Journal of
Environmental Sciences, 25 (10): 2031-2040.
Fuhs, W. G. and Chen, M. 1975. Microbiological basis of phosphate removal in the activated
sludge process for the treatment of wastewater. Microbial Ecology, 2 (2): 119-138.
Ge, H., Batstone, D. J. and Keller, J. 2015. Biological phosphorus removal from abattoir
wastewater at very short sludge ages mediated by novel PAO clade Comamonadaceae. Water
Research, (69): 173-182.
Geoffrey, S., John, C., Sunny, I., Evans, M., Sehliselo, N., Lubinda, W. and Allex, A. 2011.
The treatment of brewery wastewater for reuse: State of the art. Desalination, (273): 235-247.
Page | 81
Goldammer, T. 2008. The Brewers' Handbook. Clifton: Apex Publishers.
Gou, C., Yang, Z., Huang, J., Wang, H., Xu, H. and Wang, L. 2014. Effects of temperature and
organic loading rate on the performance and microbial community of anaerobic co-digestion
of waste activated sludge and food waste. Chemosphere, 105: 146-151.
Grady Jr, L. C. P., Daigger, G. T., Love, N. G. and Filipe, C. D. M. 2011. Biological wastewater
treatment. London IWA Publishing.
Gregor, Z. D., Matej, S. and Milenko, R. 2007. Treatment of brewery slurry in thermophilic
anaerobic sequencing batch reactor. Bioresource Technology, 98: 2714-2722.
Haberman, J. and Haldna, M. 2014. Indices of zooplankton community as valuable tools in
assessing the trophic state and water quality of eutrophic lakes: long term study of Lake
Võrtsjärv. Journal of Limnology, 73 (2): 263-273.
Hanaki, K., Wantawin, C. and Ohgaki, S. 1990. Nitrification at low level of DO with and
without organic loading in a suspended growth reactor. Water Research, 24: 297-302.
Henze, M., van Loosdrecht, M. C. M., Ekama, G. A. and Brdjanovic, D. 2008. Biological
Wastewater Treatment. IWA Publishing.
Hill, A. 2015. Brewing Microbiology: Managing Microbes, Ensuring Quality and Valorising
Waste. Cambridge Woodhead Publishing.
Hippen, A., Rosenwinkel, K. H., Baumgarten, G. and Seyfried, C. F. 1997. Aerobic
deammonification: A new experience in the treatmnent of wastewaters. Water Science and
Technology, 35 (10): 111-120.
Holmes, S. 1995. South African Water Quality Guidelines. Department of Water Affairs and
Forestry.
Hongjun, L., Weijue, G., Fangang, M., Bao-Qiang, L., Kam-Tin, L., Leihong, Z., Jianrong, C.
and Huachang, H. 2012. Membrane Bioreactors for Industrial Wastewater Treatment: A
Critical Review. Environmental Science and Technology, (42): 677–740.
James, B. C., Anderson, G. K. and Willey, A. R. 1995. High rate aerobic treatment of brewery
wastewater using the jet loop reactor. Water Resource, 29 (5): 1217-1223.
Jeinson, D. and Chamy, R. 1999. Comparison of the Behaviour of Expanded Granular Sludge
Bed (EGSB) and Upflow Anaerobic Sludge Blanket (UASB) Reactors in Dilute and
Concentrated Wastewater Treatment. Water Science Technology, 40 (8): 91 - 97.
Page | 82
Jeyanayagam, S. 2005. True Confessions of the Biological Nutrient Removal Process. Florida
Water Resources Journal, (1): 37- 46.
Jin, Z., Ji, F.Y., Xu, X., Xu, X.Y., Chen, Q.K. and Li, Q. 2014. Microbial and metabolic
characterization of a denitrifying phosphorus-uptake/side stream phosphorus removal system
for treating domestic sewage. Biodegradation, 25: 777-786.
Kayombo, S., Mbwette, T. S. A., Katima, J. H. Y. and Jorgensen, S. E. 2003. Effects of
substrate concentrations on the growth of heterotrophic bacteria and algae in secondary
facultative ponds. Water Research, 37 (1): 2937-2943.
Khin, T. and Annachhatre, A. P. 2004. Novel microbial nitrogen removal processes.
Biotechnology Advances, 22: 519-532.
Kim, J. K., Oh, B. R., Chun, Y. N. and Kim, S. W. 2006. Effects of Temperature and Hydraulic
Retention Time on Anaerobic Digestion of Food Waste. Journal of Bioscience and
Bioengineering, 102 (4): 328–332.
Koch, G., Egli, K., van der Meer, J. R. and Siegrist, H. 2000. Mathematical modelling of
autotrophic denitrification in a nitrifying biofilm of a rotating biological contactor. Water
Science and Technology, 41 (4-5): 191-198.
Krishna, C. and van Loosdrecht, M. C. M. 1999. Effect of temperature on storage polymers
and settleability of activated sludge. Water Research, 33 (10): 2374-2382.
Lee, D. S., Jeon, C. O. and Park, J. M. 2001. Biological nitrogen removal with enhanced
phosphate uptake in a sequencing batch reactor using single sludge system. Water Research,
35 (16): 3968–3976.
Lettinga, G. 1995. Anaerobic Digestion and Wastewater Treatment Systems. Antonie Van
Leeuwenhoek, 67 (1): 3-27.
Levin, G. V., Topol, G. J., Tarnay, A. C. and Samworth, R. B. 1972. Pilot plant tests of a
phosphorus removal process. Journal of Water Pollution and Control Federation, 44 (10):
1940-1954.
Liu, D. H. F. and Liptak, B. G. 1999. Environmental Engineers' Handbook. Oxford: Taylor &
Francis Group.
Louzeiro, N. R., Mavinic, D. S., Oldham, W. K., Meisen, A. and Gardner, I. S. 2002. Methanol-
induced biological nutrient removal kinetics in a full-scale sequencing batch reactor. Water
Research, 36 (11): 2721-2732.
Page | 83
Mamais, D. and Jenkins, D. 1992. The effects of MCRT and temperature on enhanced
biological phosphorus removal. Water Science and Technology, 25 (5-6): 955-965.
Manning, J. F. and Irvine, R. L. 1985. The Biological Removal of Phosphorus in a Sequencing
Batch Reactor. Water Pollution Control Federation, 57 (1): 87-94.
Matthew, A. T., Zeynep, A., Theresa, C. A., Allen, B. R. and Largus, A. T. 2010. Anaerobic
digestion of brewery primary sludge to enhance bioenergy generation:A comparison between
low- and high-rate solids treatment and different temperatures. Bioresource Technology, (101):
5842-5852.
McLaren, A. R. and Wood, R. J. 1976. Effective phosphorus removal from sewage by
biological means. Water SA, 2 (21): 47-50.
Metcalf and Eddy. 1991. Wastewater Engineering: Treatment, Disposal and Resue. New York:
McGraw-Hill Education.
Metcalf and Eddy. 2003. Wastewater Engineering Treatment and Reuse. McGraw-Hill
Companies, Inc.
Metcalf and Eddy. 2014. Wastewater Engineering: Treatment and Resources Recovery,
Volume 1. New York: McGraw-Hill Education.
Mittal, A. 2011. Biological Wastewater Treatment. Water Today, 1: 32-44.
Monod, J. 1942. Researches sur la croissance de cultures bacteriennes. Paris: Herman et Cie.
Mulder, A., van de Graaf, A. A., Roberstson, L. A. and Kuenen, J. G. 1995. Anaerobic
Ammonium Oxidation Discovered in a Denitrifying Fluidized Bed Reactor. FEMS
Microbiology, 16: 177-184.
Mulkerrins, D., Dobson, A. D. W. and Colleran, E. 2004. Parameters affecting biological
phosphate removal from wastewaters. Environment International, 30: 249– 259.
Neeleman, R. 2002. Biomass Performance: Monitoring and Control in Pharmaceutical
Production, Doctorial Dissertation, Wageningen University and Research, Wageningen:
Netherlands.
Ochieng, A., Odiyo, J. O. and Mutsago, M. 2003. Biological treatment of mixed industrial
wastewaters in a fluidised bed reactor. Journal of Hazardous Materials, 96: 79-90.
Page | 84
Oldham, W. K., Abraham, K., Dawson, R. N. and McGeachie, G. 1994. Primary sludge
fermentation design and optimisation for biological nutrient removal plants. Nutrient removal
from wastewaters. Lancaster, PA: Technomic: 187-198.
Panikov, N. S. 2014. Kinetics, microbial growth. Encyclopedia of Bioprocess Technology:
Fermentation, Biocatalysis and Bioseparation, 1513-1543.
Parawira, W., Kudita, I., Nyandoroh, M. G. and Zvauya, R. 2005. A study of industrial
anaerobic treatment of opaque beer brewery wastewater in a tropical climate using a full-scale
UASB reactor seeded with activated sludge. Process Biochemistry, 40: 593-599.
Patil, P. G., Kulkarni, G. S., Kore, S. S. V. and Kore, S. V. S. 2013. Aerobic Sequencing Batch
Reactor for wastewater treatment: A review. International Journal of Engineering Research &
Technology, 2 (10): 534-550.
Peng, Y. and Zhu, G. 2006. Biological nitrogen removal with nitrification and denitrification
via nitrite pathway. Applied Microbiology and Biotechnology, 73: 15–26.
Philips, S., Wyffels, S., Sprengers, R. and Verstraete, W. 2002. Oxygen-limited autotrophic
nitrification/denitrification by ammonia oxidisers enables upward motion towards more
favourable conditions. Applied Microbiology and Biotechnology, 59: 557-566.
Pitman, A. R. 1999. Management of biological nutrient removal plant sludges-change the
paradigms. Water Research, 33 (5): 1141-1146.
Puyol, D., Carvajal-Arroyo, J., Sierra-Alvarez, R. and Field, J. 2014. Nitrite (not free nitrous
acid) is the main inhibitor of the anammox process at common pH conditions. Biotechnology
Letters, 36 (3): 547-551.
Randall, C. W., Barnard, J. L. and Stensel, D. H. 1992. Design and retrofit of wastewater
treatment plants for biological nutrients removal. Lancaster: Technomic Publishing Company,
Inc.
Rodrigues, A. C., Brito, A. G. and Melo, L. F. 2001. Posttreatment of brewery wastewater
using a sequencing batch reactor. Water Environment Research, 73 (1): 45-51.
Rossle, W. H. and Pretorius, W. A. 2001. A review of characterisation requirements for in-line
prefermenters: Wastewater characterisation. Water SA, 27 (3): 405-412.
Ruel, S. M., Comeau, Y., Heduit, A., Deronzier, G., Ginestet, P. and Audic, J. M. 2002.
Operating conditions for the determination of the biochemical acidogenic potential of
wastewater. Water Research, 36 (9): 2337-2341.
Page | 85
Saad, S. A., Welles, L., Abbas, B., Lopez-Vazquez, C. M., van Loosdrecht, M. C. M. and
Brdjanovic, D. 2016. Denitrification of nitrate and nitrite by 'Cadidatus Accumulibacter
phosphatis" clade IC. Water Research, 105: 97-109.
Safafar, H., Van Wagenen, J., Møller, P. and Jacobsen, C. 2015. Carotenoids, phenolic
compounds and tocopherols contribute to the antioxidative properties of some microalgae
species grown on industrial wastewater. Marine Drugs, 13 (12): 7339-7356.
Sathasivan, A. 2009. Biological phosphorus removal processes for wastewater treatment.
Water and wastewater treatment technologies. Oxford (UK): Encyclopedia of Life Support
Systems (EOLSS): 1-23.
Satoh, H., D, R. W., Koch, F. A., Oldham, W. K., Mino, T. and Matsuo, T. 1996. Anaerobic
substrate uptake by the enhanced biological phosphorus removal activated sludge treating real
sewage. Water Scxience and Technology, 34 (4): 8-15.
Satoh, H., Mino, T. and Matsuo, T. 1994. Deterioration of enhanced biological phosphorus
removal by the domination of microorganisms without polyphosphate accumulation. Water
Science Technology, 30 (11): 203 –211.
Schmidt, I. and Bock, E. 1997. Anaerobic ammonia oxidation with nitrogen dioxide by
Nitrosomonas eutropha. Archives of Microbiology, 167: 106-111.
Schmidt, I., Sliekers, O., Schmid, M., Bock, E., Fuerst, J., Kuenen, G. J., Jetten, M. S. M. and
Strous, M. 2003. New concepts of microbial treatment processes for nitrogen removal in
wastewater. FEMS Microbiology Reviews, 27: 481-492.
Shabangu, K. P. 2016. Aerobic sequencing batch reactor for the treatment of industrial
wastewater from the brewery: Doctorial Dissertation, Durban University of Technology, South
Africa. Durban.
Shao, X., Peng, D., Teng, Z. and Ju, X. 2008. Treatment of brewery wastewater using anaerobic
sequencing batch reactor (ASBR). Bioresource Technology, 99: 3182-3186.
She, Z., Zhao, L., Zhang, X., Jin, C., Guo, L., Yang, S., Zhao, Y. and Gao, M. 2016. Partial
nitrification and denitrification in a sequencing batch reactor treating high-salinity wastewater.
Chemical Engineering Journal, 288: 207-215.
Shehab, O., Deininger, R., Porta, F. and Wojewski, T. 1996. Optimising phosphorus removal
at the Ann Arbor wastewater treatment plant. Water Science and Technology, 34 (1-2): 493-
439.
Page | 86
Shu-Guang, W., Xian-Wei, L., Wen-Xin, G., Bao-Yu, G., Dong-Hua, Z. and Han-Qing, Y.
2007. Aerobic Granulation with Brewery Wastewater in a Sequencing Batch Reactor.
Bioresource Technology, 98: 2142-2147.
Simate, G. S. 2015. The treatment of brewery wastewater for reuse by integration of
coagulation/flocculation and sedimentation with carbon nanotubes ‘sandwiched’in a granular
filter bed. Journal of Industrial and Engineering Chemistry, 21: 1277-1285.
Srinath, E. G., Sastry, C. A. and Pillai, S. C. 1959. Rapid removal of phosphorus from sewage
by activated sludge. Cellular and Molecular Life Sciences, 15 (9): 339-334.
Strous, M. 2000. Microbiology of anaerobic ammonium oxidation, PhD Thesis. Delft: Delft
University of Technology.
Strous, M., Van Gerven, E., Zheng, P., Kuenen, G. J. and Jetten, M. S. M. 1997. Ammonium
Removal from Concentrated Waste Streams With the Anaerobic Ammonium Oxidation
(Anammox) Process in Different Reactor Configuration. Water Research, 31: 1955-1962.
Surampalli, R. Y., Tyagi, R. D., Scheble, O. K. and Heidman, J. A. 1997. Nitrification,
denitrification and phosphorus removal in sequential batch reactors. Bioresource Technology,
62 (2): 151-157.
Tansiphorn, J., Suraphong, W. and Prasert, P. 2009. Characterization of brewery wastewater
with spectrofluorometry analysis. Journal of Environmental Management, 90: 1184-1190.
van de Graaf, A. A., Mulder, A., De Bruijin, P., Jetten, M. S. M., Robertson, L. A. and Kuenen,
J. G. 1995. Anaerobic oxidation of ammonium is a biologically mediated process. Applied and
Environmental Microbiology, 61: 1246-1251.
Wang, F., Ding, Y., Ge, L., Ren, H. and Ding, L. 2010. Effect of high-strength ammonia
nitrogen acclimation on sludge activity in sequencing batch reactor. Journal of Environmental
Sciences, 22 (11): 1683–1688.
Wei, D., Du, B., Xue, X., Dai, P. and Zhang, J. 2014. Analysis of factors affecting the
performance of partial nitrification in a sequencing batch reactor. Applied Microbiology and
Biotechnology, 98: 1863-1870.
Zhu, G., Peng, Y., Li, B., Guo, J., Yang, Q., Wang, S. 2008. Biological Removal of Nitrogen
from Wastewater. In: Whitacre, D.M. ed. Reviews of Environmental Contamination and
Toxicology. New York: Springer 159-195.
Yildiza, E., Keskinler, B., Pekdemir, T., Akay, G. and Nuhoglua, A. 2005. High strength
wastewater treatment in a jet loop-membrane bioreactor: kinetics and performance evaluation.
Chemical Engineering Science, 60 (4): 1103-1116.
Page | 87
Yongzhen, P., Shouyou, G., Shuying, W. and Bai, L. 2007. Partial Nitrification from Domestic
Wastewater by Aeration Control at Ambient Temperature. China Journal of Chemical
Engineering, 15: 115-121.
Young-Ho, A., Kyung-Sok, M. and Richard, S. E. 2001. Pre-Acidification in Anaerobic Sludge
Bed Process Treating Brewery Wastewater. Water Resource, 35 (18): 4267-4276.
Zeng, A.-P. and Deckwer, W.-D. 1995. A kinetic model for substrate and energy consumption
of microbial growth under substrate-sufficient conditions. Biotechnology Progress, 11 (1): 71-
79.
Zhang, W., Yang, P., Xiao, P., Xu, S., Liu, Y., Liu, F. and Wang, D. 2015a. Dynamic variation
in physicochemical properties of activated sludge floc from different WWTPs and its influence
on sludge dewaterability and settleability. Colloids and Surfaces A: Physicochemical and
Engineering Aspects, 467: 124-134.
Zhang, X., Zhang, H., Ye, C., Wei, M. and Du, J. 2015b. Effect of COD/N ratio on nitrogen
removal and microbial communities of CANON process in membrane bioreactors. Bioresource
Technology, 189: 302-308.
Zvauya, R., Parawira, W. and Wawadza, C. 1994. Aspects of aerobic thermophilic treatment
of Zimbabwean traditional opaque-beer brewery wastewater. Bioresource Technology, 48:
272-274.
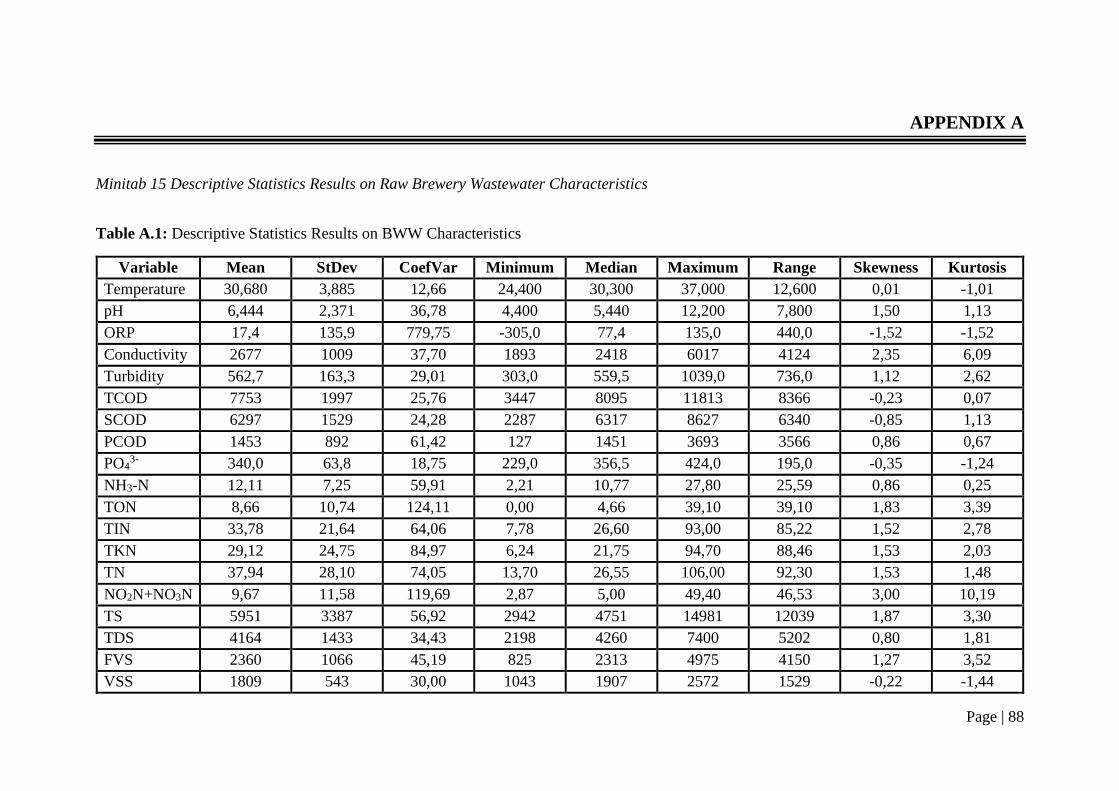
Page | 88
APPENDIX A
Minitab 15 Descriptive Statistics Results on Raw Brewery Wastewater Characteristics
Table A.1: Descriptive Statistics Results on BWW Characteristics
Variable Mean StDev CoefVar Minimum Median Maximum Range Skewness Kurtosis
Temperature 30,680 3,885 12,66 24,400 30,300 37,000 12,600 0,01 -1,01
pH 6,444 2,371 36,78 4,400 5,440 12,200 7,800 1,50 1,13
ORP 17,4 135,9 779,75 -305,0 77,4 135,0 440,0 -1,52 -1,52
Conductivity 2677 1009 37,70 1893 2418 6017 4124 2,35 6,09
Turbidity 562,7 163,3 29,01 303,0 559,5 1039,0 736,0 1,12 2,62
TCOD 7753 1997 25,76 3447 8095 11813 8366 -0,23 0,07
SCOD 6297 1529 24,28 2287 6317 8627 6340 -0,85 1,13
PCOD 1453 892 61,42 127 1451 3693 3566 0,86 0,67
PO43- 340,0 63,8 18,75 229,0 356,5 424,0 195,0 -0,35 -1,24
NH3-N 12,11 7,25 59,91 2,21 10,77 27,80 25,59 0,86 0,25
TON 8,66 10,74 124,11 0,00 4,66 39,10 39,10 1,83 3,39
TIN 33,78 21,64 64,06 7,78 26,60 93,00 85,22 1,52 2,78
TKN 29,12 24,75 84,97 6,24 21,75 94,70 88,46 1,53 2,03
TN 37,94 28,10 74,05 13,70 26,55 106,00 92,30 1,53 1,48
NO2N+NO3N 9,67 11,58 119,69 2,87 5,00 49,40 46,53 3,00 10,19
TS 5951 3387 56,92 2942 4751 14981 12039 1,87 3,30
TDS 4164 1433 34,43 2198 4260 7400 5202 0,80 1,81
FVS 2360 1066 45,19 825 2313 4975 4150 1,27 3,52
VSS 1809 543 30,00 1043 1907 2572 1529 -0,22 -1,44
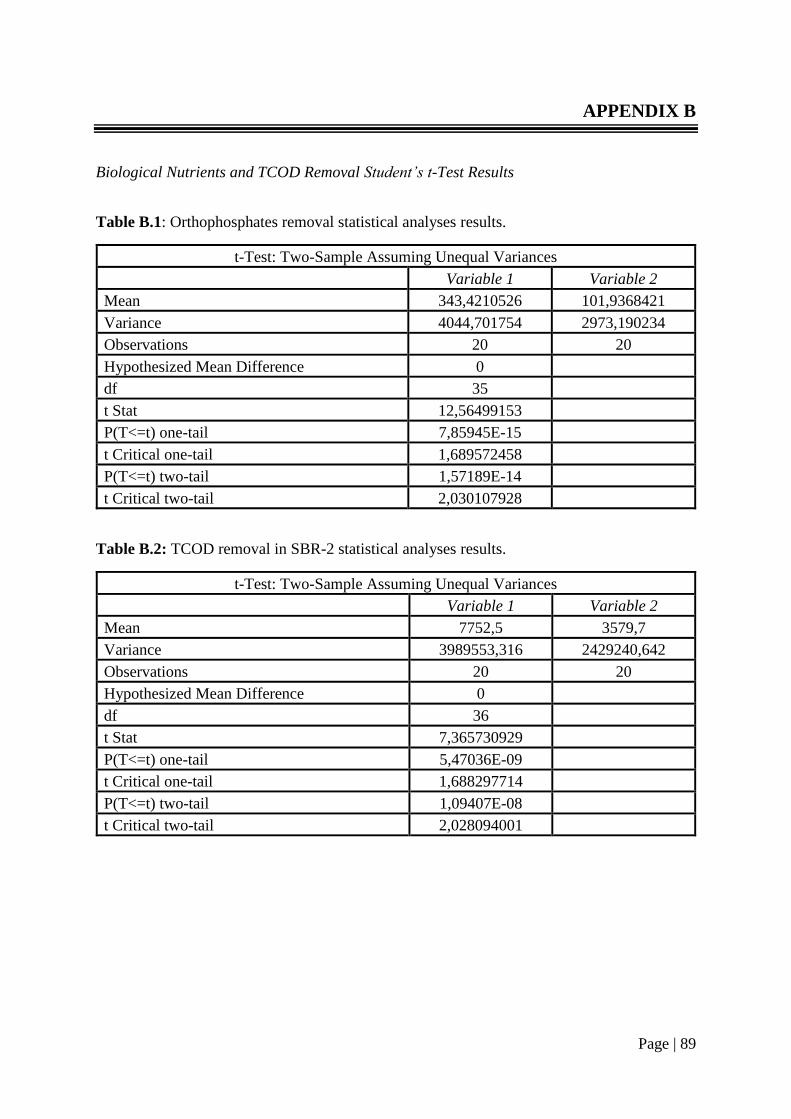
Page | 89
APPENDIX B
Biological Nutrients and TCOD Removal Student’s t-Test Results
Table B.1: Orthophosphates removal statistical analyses results.
t-Test: Two-Sample Assuming Unequal Variances
Variable 1 Variable 2
Mean 343,4210526 101,9368421
Variance 4044,701754 2973,190234
Observations 20 20
Hypothesized Mean Difference 0 df 35 t Stat 12,56499153 P(T<=t) one-tail 7,85945E-15 t Critical one-tail 1,689572458 P(T<=t) two-tail 1,57189E-14 t Critical two-tail 2,030107928
Table B.2: TCOD removal in SBR-2 statistical analyses results.
t-Test: Two-Sample Assuming Unequal Variances
Variable 1 Variable 2
Mean 7752,5 3579,7
Variance 3989553,316 2429240,642
Observations 20 20
Hypothesized Mean Difference 0 df 36 t Stat 7,365730929 P(T<=t) one-tail 5,47036E-09 t Critical one-tail 1,688297714 P(T<=t) two-tail 1,09407E-08
t Critical two-tail 2,028094001
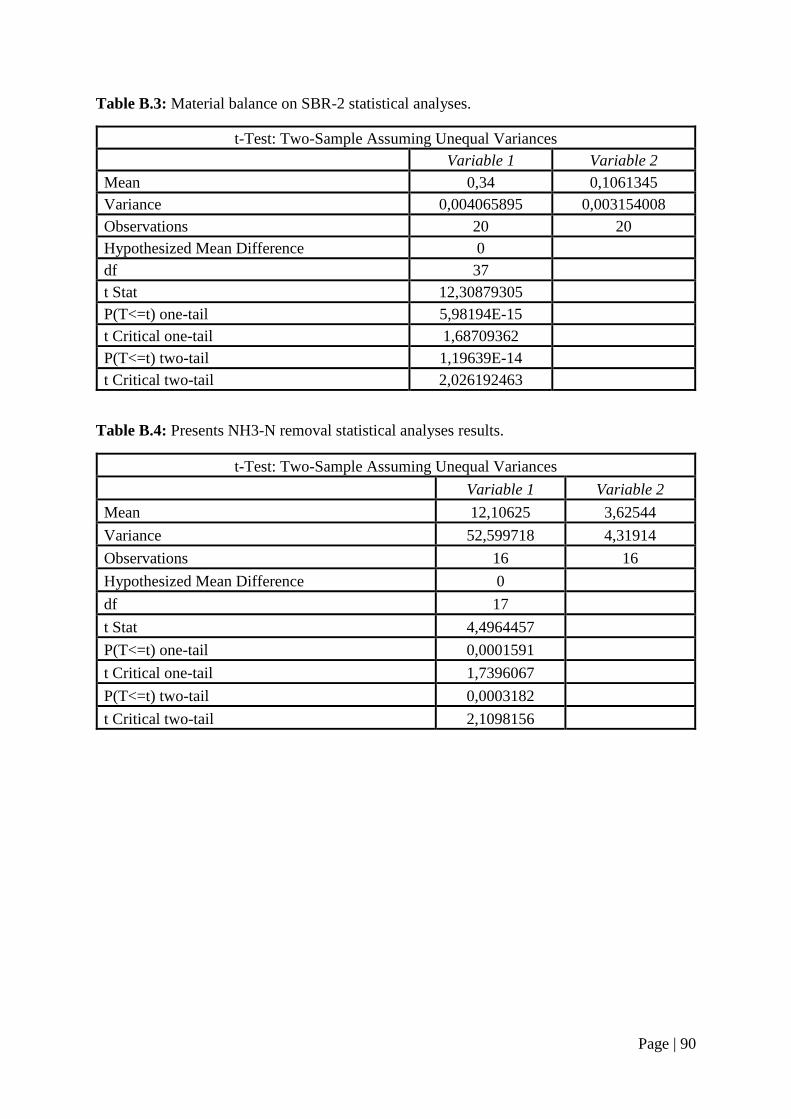
Page | 90
Table B.3: Material balance on SBR-2 statistical analyses.
t-Test: Two-Sample Assuming Unequal Variances
Variable 1 Variable 2
Mean 0,34 0,1061345
Variance 0,004065895 0,003154008
Observations 20 20
Hypothesized Mean Difference 0 df 37 t Stat 12,30879305 P(T<=t) one-tail 5,98194E-15 t Critical one-tail 1,68709362 P(T<=t) two-tail 1,19639E-14 t Critical two-tail 2,026192463
Table B.4: Presents NH3-N removal statistical analyses results.
t-Test: Two-Sample Assuming Unequal Variances
Variable 1 Variable 2
Mean 12,10625 3,62544
Variance 52,599718 4,31914
Observations 16 16
Hypothesized Mean Difference 0
df 17
t Stat 4,4964457
P(T<=t) one-tail 0,0001591
t Critical one-tail 1,7396067
P(T<=t) two-tail 0,0003182
t Critical two-tail 2,1098156
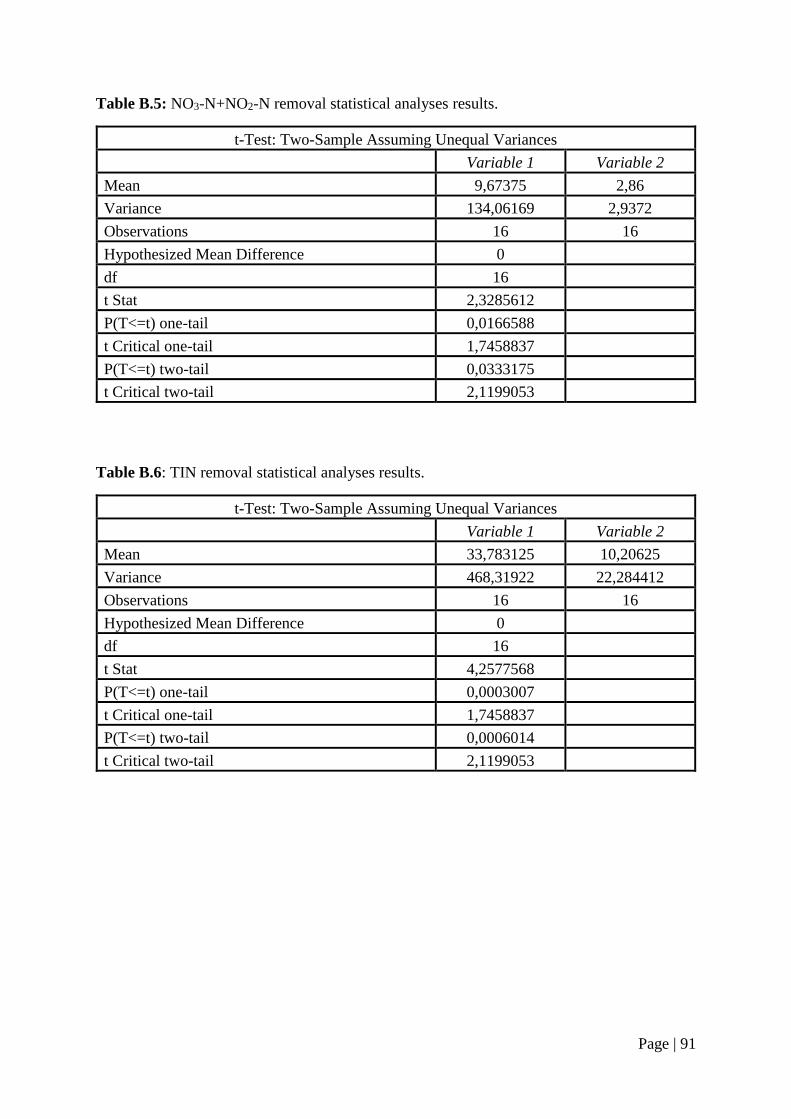
Page | 91
Table B.5: NO3-N+NO2-N removal statistical analyses results.
t-Test: Two-Sample Assuming Unequal Variances
Variable 1 Variable 2
Mean 9,67375 2,86
Variance 134,06169 2,9372
Observations 16 16
Hypothesized Mean Difference 0
df 16
t Stat 2,3285612
P(T<=t) one-tail 0,0166588
t Critical one-tail 1,7458837
P(T<=t) two-tail 0,0333175
t Critical two-tail 2,1199053
Table B.6: TIN removal statistical analyses results.
t-Test: Two-Sample Assuming Unequal Variances
Variable 1 Variable 2
Mean 33,783125 10,20625
Variance 468,31922 22,284412
Observations 16 16
Hypothesized Mean Difference 0
df 16
t Stat 4,2577568
P(T<=t) one-tail 0,0003007
t Critical one-tail 1,7458837
P(T<=t) two-tail 0,0006014
t Critical two-tail 2,1199053
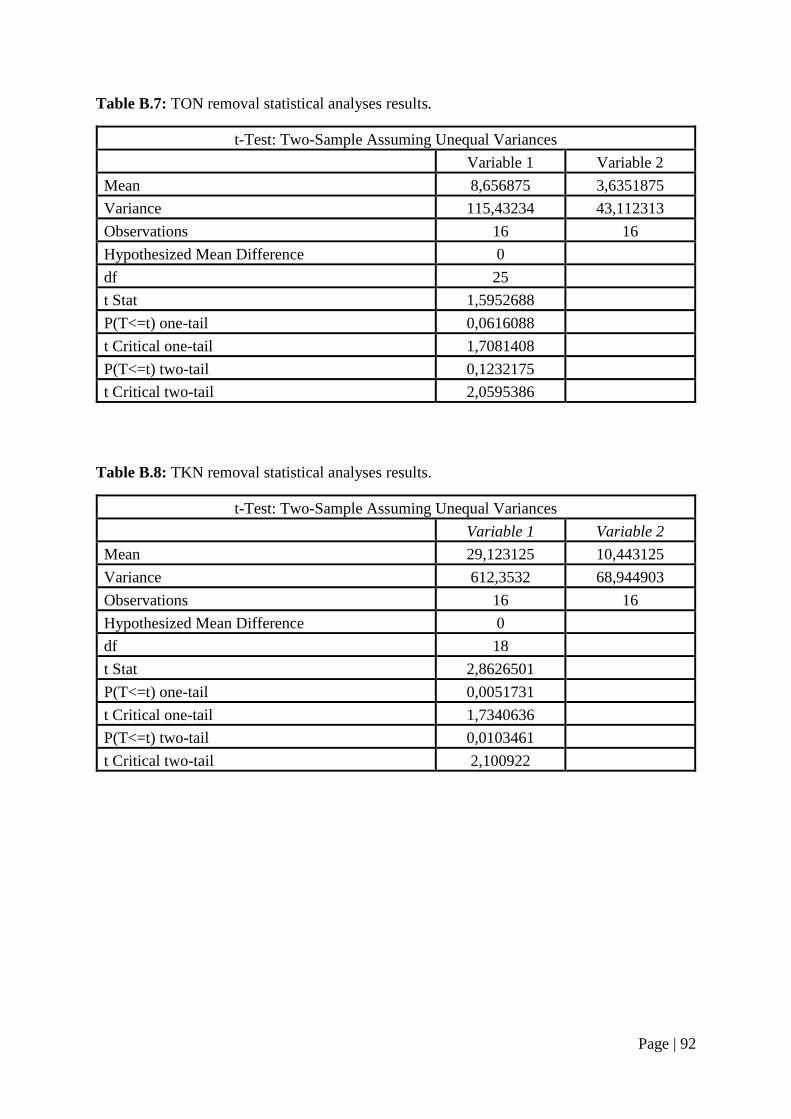
Page | 92
Table B.7: TON removal statistical analyses results.
t-Test: Two-Sample Assuming Unequal Variances
Variable 1 Variable 2
Mean 8,656875 3,6351875
Variance 115,43234 43,112313
Observations 16 16
Hypothesized Mean Difference 0
df 25
t Stat 1,5952688
P(T<=t) one-tail 0,0616088
t Critical one-tail 1,7081408
P(T<=t) two-tail 0,1232175
t Critical two-tail 2,0595386
Table B.8: TKN removal statistical analyses results.
t-Test: Two-Sample Assuming Unequal Variances
Variable 1 Variable 2
Mean 29,123125 10,443125
Variance 612,3532 68,944903
Observations 16 16
Hypothesized Mean Difference 0
df 18
t Stat 2,8626501
P(T<=t) one-tail 0,0051731
t Critical one-tail 1,7340636
P(T<=t) two-tail 0,0103461
t Critical two-tail 2,100922
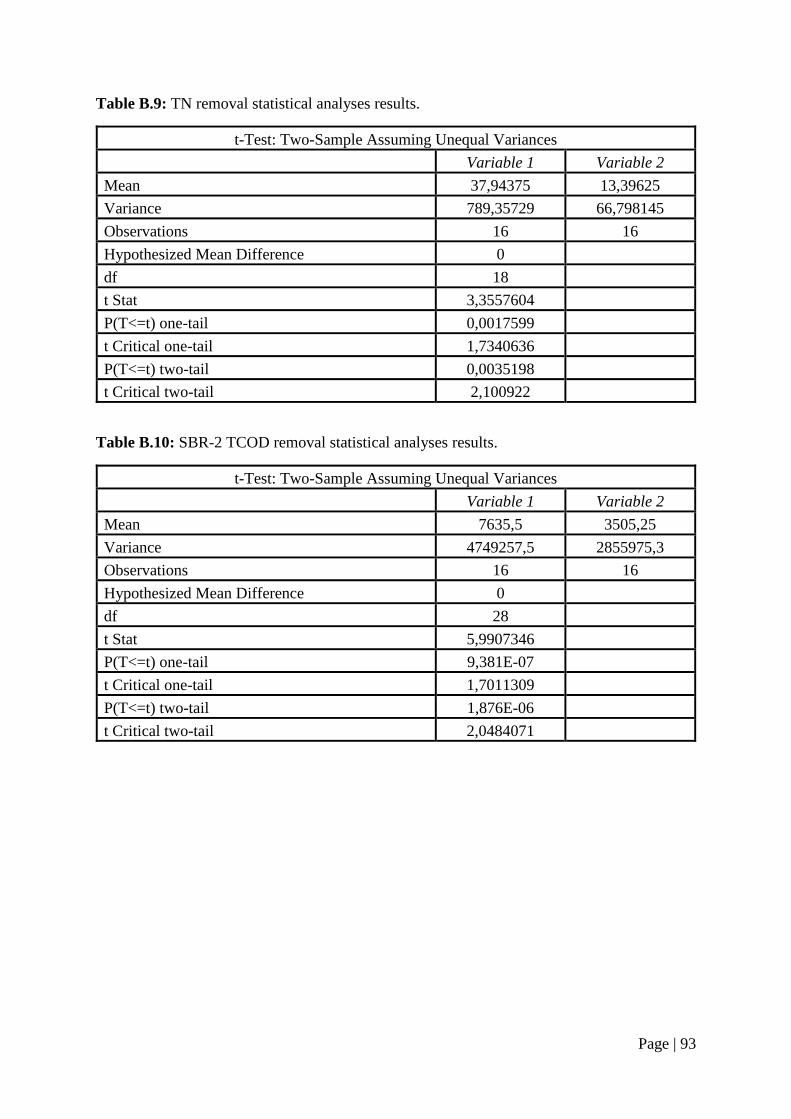
Page | 93
Table B.9: TN removal statistical analyses results.
t-Test: Two-Sample Assuming Unequal Variances
Variable 1 Variable 2
Mean 37,94375 13,39625
Variance 789,35729 66,798145
Observations 16 16
Hypothesized Mean Difference 0
df 18
t Stat 3,3557604
P(T<=t) one-tail 0,0017599
t Critical one-tail 1,7340636
P(T<=t) two-tail 0,0035198
t Critical two-tail 2,100922
Table B.10: SBR-2 TCOD removal statistical analyses results.
t-Test: Two-Sample Assuming Unequal Variances
Variable 1 Variable 2
Mean 7635,5 3505,25
Variance 4749257,5 2855975,3
Observations 16 16
Hypothesized Mean Difference 0
df 28
t Stat 5,9907346
P(T<=t) one-tail 9,381E-07
t Critical one-tail 1,7011309
P(T<=t) two-tail 1,876E-06
t Critical two-tail 2,0484071
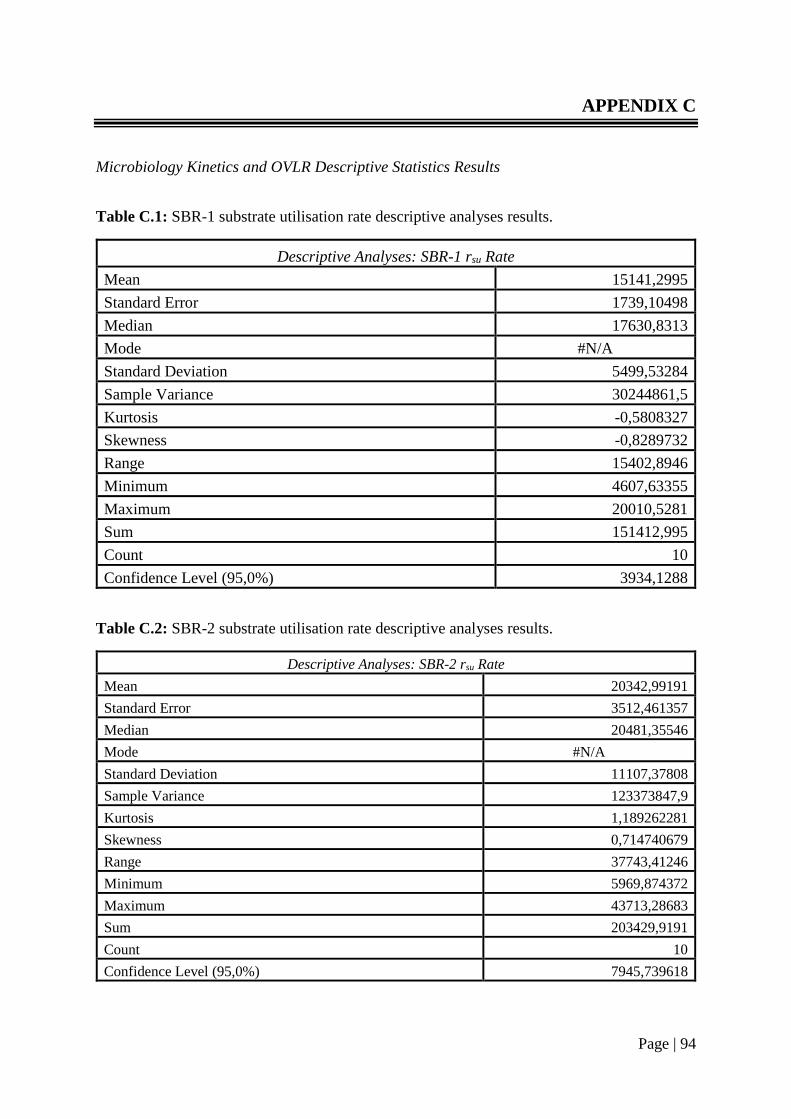
Page | 94
APPENDIX C
Microbiology Kinetics and OVLR Descriptive Statistics Results
Table C.1: SBR-1 substrate utilisation rate descriptive analyses results.
Descriptive Analyses: SBR-1 rsu Rate
Mean 15141,2995
Standard Error 1739,10498
Median 17630,8313
Mode #N/A
Standard Deviation 5499,53284
Sample Variance 30244861,5
Kurtosis -0,5808327
Skewness -0,8289732
Range 15402,8946
Minimum 4607,63355
Maximum 20010,5281
Sum 151412,995
Count 10
Confidence Level (95,0%) 3934,1288
Table C.2: SBR-2 substrate utilisation rate descriptive analyses results.
Descriptive Analyses: SBR-2 rsu Rate
Mean 20342,99191
Standard Error 3512,461357
Median 20481,35546
Mode #N/A
Standard Deviation 11107,37808
Sample Variance 123373847,9
Kurtosis 1,189262281
Skewness 0,714740679
Range 37743,41246
Minimum 5969,874372
Maximum 43713,28683
Sum 203429,9191
Count 10
Confidence Level (95,0%) 7945,739618
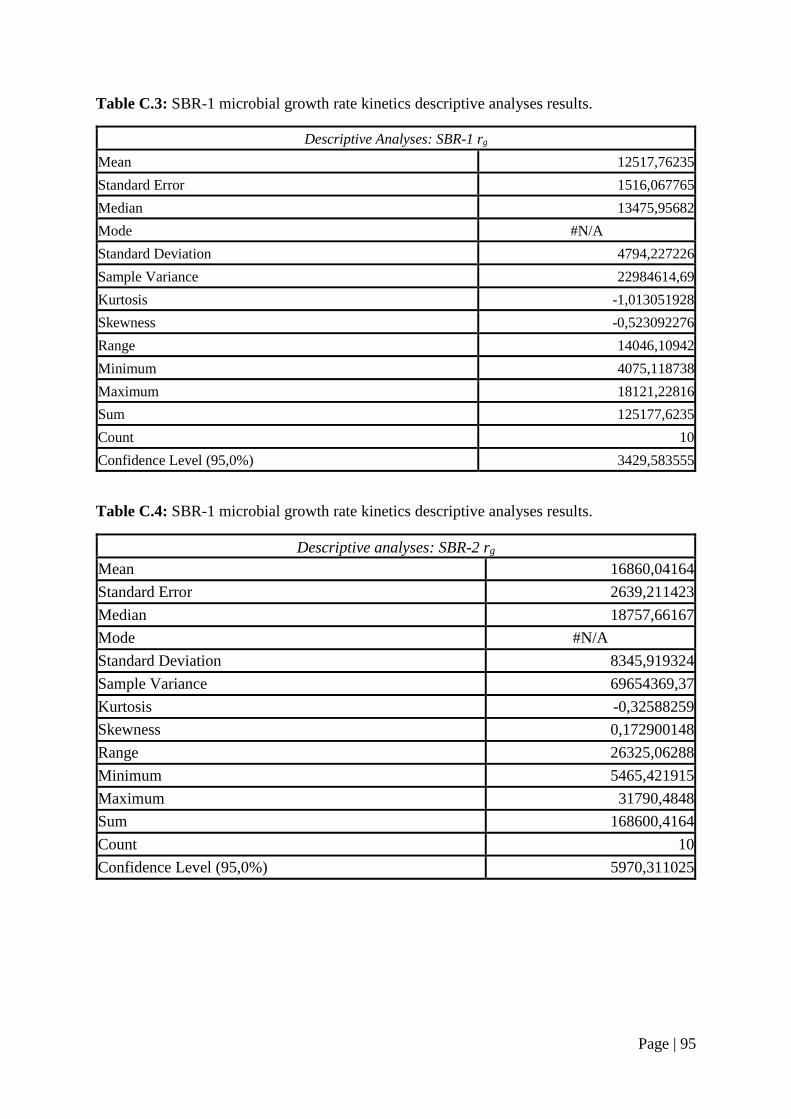
Page | 95
Table C.3: SBR-1 microbial growth rate kinetics descriptive analyses results.
Descriptive Analyses: SBR-1 rg
Mean 12517,76235
Standard Error 1516,067765
Median 13475,95682
Mode #N/A
Standard Deviation 4794,227226
Sample Variance 22984614,69
Kurtosis -1,013051928
Skewness -0,523092276
Range 14046,10942
Minimum 4075,118738
Maximum 18121,22816
Sum 125177,6235
Count 10
Confidence Level (95,0%) 3429,583555
Table C.4: SBR-1 microbial growth rate kinetics descriptive analyses results.
Descriptive analyses: SBR-2 rg
Mean 16860,04164
Standard Error 2639,211423
Median 18757,66167
Mode #N/A
Standard Deviation 8345,919324
Sample Variance 69654369,37
Kurtosis -0,32588259
Skewness 0,172900148
Range 26325,06288
Minimum 5465,421915
Maximum 31790,4848
Sum 168600,4164
Count 10
Confidence Level (95,0%) 5970,311025
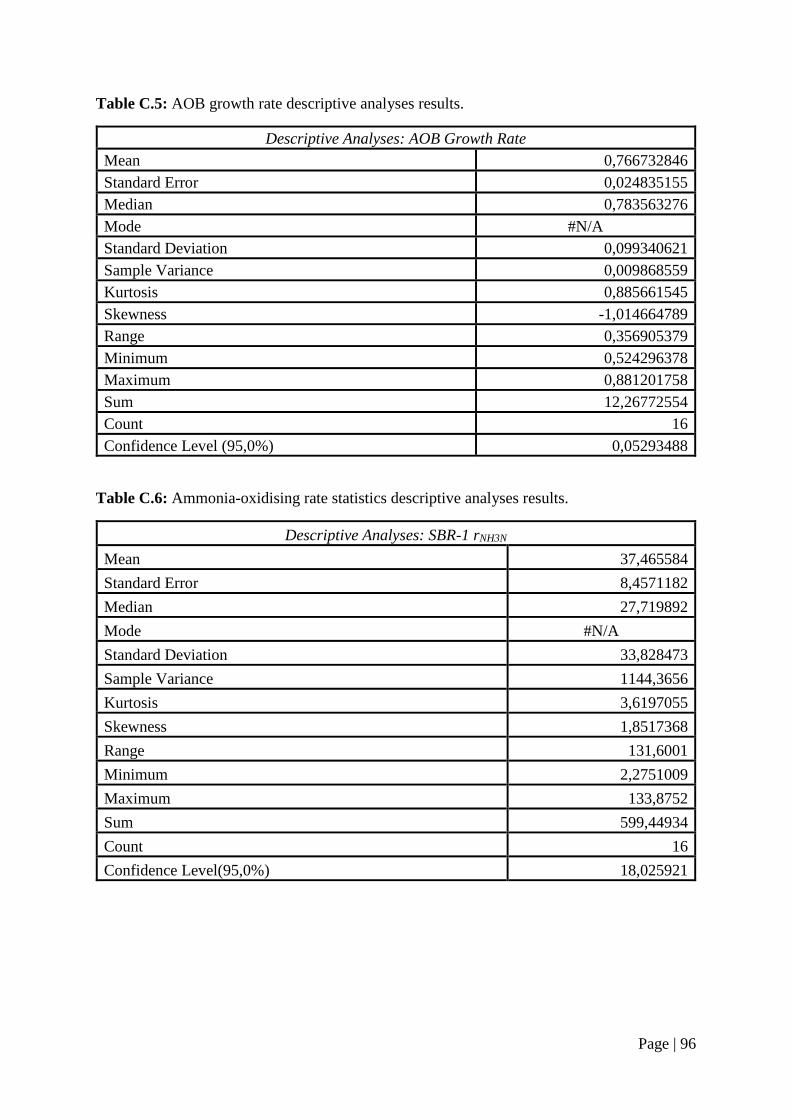
Page | 96
Table C.5: AOB growth rate descriptive analyses results.
Descriptive Analyses: AOB Growth Rate
Mean 0,766732846
Standard Error 0,024835155
Median 0,783563276
Mode #N/A
Standard Deviation 0,099340621
Sample Variance 0,009868559
Kurtosis 0,885661545
Skewness -1,014664789
Range 0,356905379
Minimum 0,524296378
Maximum 0,881201758
Sum 12,26772554
Count 16
Confidence Level (95,0%) 0,05293488
Table C.6: Ammonia-oxidising rate statistics descriptive analyses results.
Descriptive Analyses: SBR-1 rNH3N
Mean 37,465584
Standard Error 8,4571182
Median 27,719892
Mode #N/A
Standard Deviation 33,828473
Sample Variance 1144,3656
Kurtosis 3,6197055
Skewness 1,8517368
Range 131,6001
Minimum 2,2751009
Maximum 133,8752
Sum 599,44934
Count 16
Confidence Level(95,0%) 18,025921
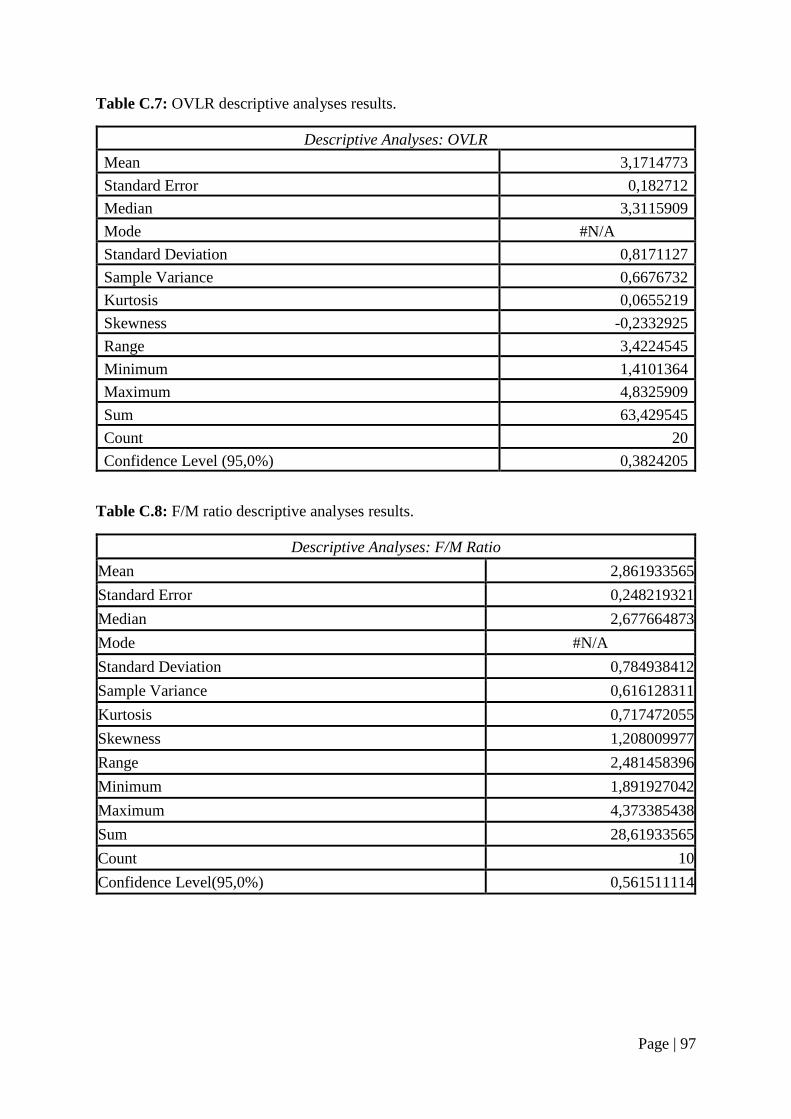
Page | 97
Table C.7: OVLR descriptive analyses results.
Descriptive Analyses: OVLR
Mean 3,1714773
Standard Error 0,182712
Median 3,3115909
Mode #N/A
Standard Deviation 0,8171127
Sample Variance 0,6676732
Kurtosis 0,0655219
Skewness -0,2332925
Range 3,4224545
Minimum 1,4101364
Maximum 4,8325909
Sum 63,429545
Count 20
Confidence Level (95,0%) 0,3824205
Table C.8: F/M ratio descriptive analyses results.
Descriptive Analyses: F/M Ratio
Mean 2,861933565
Standard Error 0,248219321
Median 2,677664873
Mode #N/A
Standard Deviation 0,784938412
Sample Variance 0,616128311
Kurtosis 0,717472055
Skewness 1,208009977
Range 2,481458396
Minimum 1,891927042
Maximum 4,373385438
Sum 28,61933565
Count 10
Confidence Level(95,0%) 0,561511114
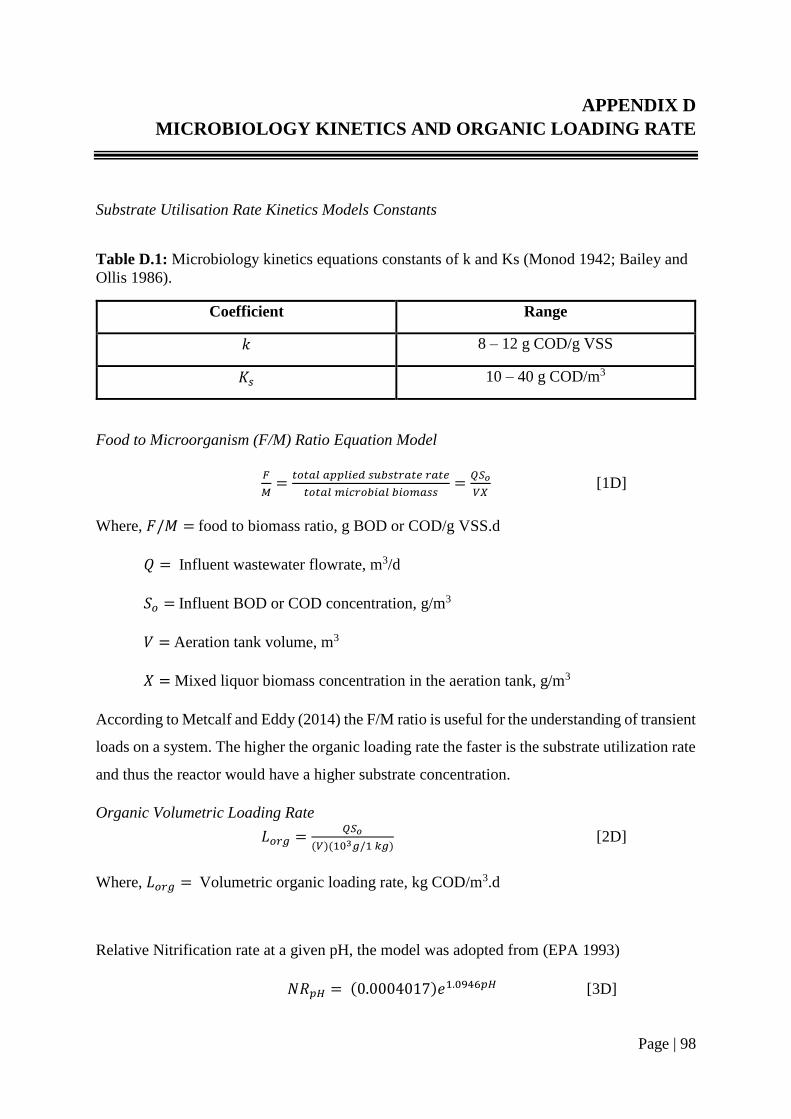
Page | 98
APPENDIX D
MICROBIOLOGY KINETICS AND ORGANIC LOADING RATE
Substrate Utilisation Rate Kinetics Models Constants
Table D.1: Microbiology kinetics equations constants of k and Ks (Monod 1942; Bailey and
Ollis 1986).
Coefficient Range
𝑘 8 – 12 g COD/g VSS
𝐾𝑠 10 – 40 g COD/m3
Food to Microorganism (F/M) Ratio Equation Model
𝐹
𝑀=𝑡𝑜𝑡𝑎𝑙 𝑎𝑝𝑝𝑙𝑖𝑒𝑑 𝑠𝑢𝑏𝑠𝑡𝑟𝑎𝑡𝑒 𝑟𝑎𝑡𝑒
𝑡𝑜𝑡𝑎𝑙 𝑚𝑖𝑐𝑟𝑜𝑏𝑖𝑎𝑙 𝑏𝑖𝑜𝑚𝑎𝑠𝑠=𝑄𝑆𝑜
𝑉𝑋 [1D]
Where, 𝐹/𝑀 = food to biomass ratio, g BOD or COD/g VSS.d
𝑄 = Influent wastewater flowrate, m3/d
𝑆𝑜 = Influent BOD or COD concentration, g/m3
𝑉 = Aeration tank volume, m3
𝑋 = Mixed liquor biomass concentration in the aeration tank, g/m3
According to Metcalf and Eddy (2014) the F/M ratio is useful for the understanding of transient
loads on a system. The higher the organic loading rate the faster is the substrate utilization rate
and thus the reactor would have a higher substrate concentration.
Organic Volumetric Loading Rate
𝐿𝑜𝑟𝑔 =𝑄𝑆𝑜
(𝑉)(103𝑔/1 𝑘𝑔) [2D]
Where, 𝐿𝑜𝑟𝑔 = Volumetric organic loading rate, kg COD/m3.d
Relative Nitrification rate at a given pH, the model was adopted from (EPA 1993)
𝑁𝑅𝑝𝐻 = (0.0004017)𝑒1.0946𝑝𝐻 [3D]
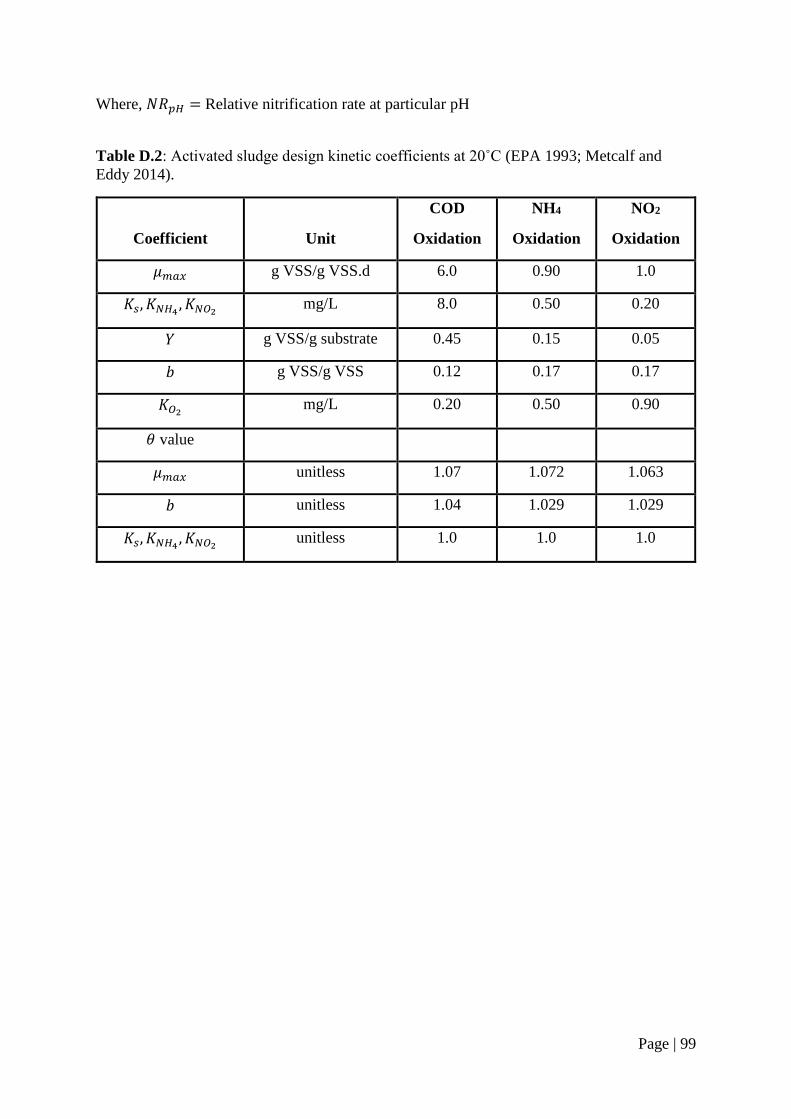
Page | 99
Where, 𝑁𝑅𝑝𝐻 = Relative nitrification rate at particular pH
Table D.2: Activated sludge design kinetic coefficients at 20˚C (EPA 1993; Metcalf and
Eddy 2014).
Coefficient
Unit
COD
Oxidation
NH4
Oxidation
NO2
Oxidation
𝜇𝑚𝑎𝑥 g VSS/g VSS.d 6.0 0.90 1.0
𝐾𝑠, 𝐾𝑁𝐻4 , 𝐾𝑁𝑂2 mg/L 8.0 0.50 0.20
𝑌 g VSS/g substrate 0.45 0.15 0.05
𝑏 g VSS/g VSS 0.12 0.17 0.17
𝐾𝑂2 mg/L 0.20 0.50 0.90
𝜃 value
𝜇𝑚𝑎𝑥 unitless 1.07 1.072 1.063
𝑏 unitless 1.04 1.029 1.029
𝐾𝑠, 𝐾𝑁𝐻4 , 𝐾𝑁𝑂2 unitless 1.0 1.0 1.0


![PowerPoint Presentation ANALYSIS. Nitrogen Testing. Total Nitrogen (TN) Total Kjeldahl Nitrogen (TKN) [Organic Nitrogen + Ammonia (inorganic )] Nitrate (NO. 3-) Nitrite (NO. 2-) Inorganic](https://img.pdfslide.net/doc/110x75/5e97650d317cbf0e395cb525/powerpoint-presentation-analysis-nitrogen-testing-total-nitrogen-tn-total-kjeldahl.jpg)


![Simultaneous Measurement of Total Nitrogen and Phosphorus ... · digestion procedures found in U.S. EPA 351.2 (Total Kjeldahl Nitrogen [TKN]) and 365.4 (Total Kjeldahl Phosphorus](https://img.pdfslide.net/doc/110x75/60608f94db713f558836050e/simultaneous-measurement-of-total-nitrogen-and-phosphorus-digestion-procedures.jpg)