Embed Size (px)
Citation preview
Biological role of the expression of tumor necrosis
factor receptor-ligand family molecules on acute
lymphoblastic leukemia cells
Inaugural - Dissertation
zur
Erlangung des Doktorgrades
der Mathematisch-Naturwissenschaftlichen Fakultat
der Heinrich-Heine-Universitat Dusseldorf
vorgelegt von
Ludmila Glouchkova
aus Podolsk
Dusseldorf
2003

Gedruckt mit der Genehmigung der Mathematisch-Naturwissenschaftlichen Fakultät der Heinrich-Heine Universität Düsseldrof
1. Referent: Prof. Dr. Ulrich Göbel 2. Korreferent: Prof. Dr. Heinz Mehlhorn 3. Korreferent: PD Dr. med. Dagmar Dilloo
Tag der mündlichen Prüfung: 1. Dezember 2003
Contents ii
Contents
1 Introduction 1
1.1 Leukemia development, biology and classification . . . . . . . . . . . . . . 1
1.2 Stimulation of anti-leukemia immune response . . . . . . . . . . . . . . . . 3
1.2.1 Costimulatory molecules CD80 and CD86 . . . . . . . . . . . . . . 4
1.2.2 CD27-CD70 costimulatory pathway . . . . . . . . . . . . . . . . . 6
1.2.3 Costimulatory molecule CD40 . . . . . . . . . . . . . . . . . . . . . 8
1.3 Vaccine strategies . . . . . . . . . . . . . . . . . . . . . . . . . . . . . . . . 9
1.4 CD95-mediated programmed cell death . . . . . . . . . . . . . . . . . . . . 10
1.5 Aims of the study . . . . . . . . . . . . . . . . . . . . . . . . . . . . . . . . 12
1.6 Plan of the study . . . . . . . . . . . . . . . . . . . . . . . . . . . . . . . . 14
2 Patients, materials and methods 18
2.1 Patients selection and characteristic . . . . . . . . . . . . . . . . . . . . . . 18
2.2 Chemicals . . . . . . . . . . . . . . . . . . . . . . . . . . . . . . . . . . . . 25
2.3 Enzymes . . . . . . . . . . . . . . . . . . . . . . . . . . . . . . . . . . . . . 25
2.4 Antibodies and Cytokines . . . . . . . . . . . . . . . . . . . . . . . . . . . 26
2.5 Apoptosis-detection kit . . . . . . . . . . . . . . . . . . . . . . . . . . . . . 26
2.6 Enzyme Linked Immuno Sorbent Assay (ELISA) . . . . . . . . . . . . . . . 27
2.7 Cell lines . . . . . . . . . . . . . . . . . . . . . . . . . . . . . . . . . . . . . 27
2.8 Media . . . . . . . . . . . . . . . . . . . . . . . . . . . . . . . . . . . . . . 27
2.9 Isolation of mononuclear cells and leukemia cells . . . . . . . . . . . . . . . 27
2.10 Isolation of T lymphocytes . . . . . . . . . . . . . . . . . . . . . . . . . . . 28
2.10.1 Production of neuraminidase-treated sheep erythrocytes . . . . . . 28
2.10.2 T lymphocytes isolation . . . . . . . . . . . . . . . . . . . . . . . . 28
2.11 Isolation of ultrapure B-lymphocytes using positive Magnetic Activated Cell
Sorter (MACS)-selection . . . . . . . . . . . . . . . . . . . . . . . . . . . . 29
2.11.1 Cell staining with antibodies-coupling magnetic beads . . . . . . . . 30
2.11.2 Magnetic cell separation . . . . . . . . . . . . . . . . . . . . . . . . 30
2.12 Surface and intracellular marker analysis by flow cytometry using a Fluo-
rescence Activated Cell Sorter (FACScan) . . . . . . . . . . . . . . . . . . . 31
Contents iii
2.12.1 Staining of surface molecules . . . . . . . . . . . . . . . . . . . . . . 31
2.13 Detection of cytokine secretion by using Enzyme Linked Immuno Sorbent
Assay (ELISA) . . . . . . . . . . . . . . . . . . . . . . . . . . . . . . . . . 32
2.14 Cultivation of cells . . . . . . . . . . . . . . . . . . . . . . . . . . . . . . . 32
2.14.1 Cultivation of cell lines . . . . . . . . . . . . . . . . . . . . . . . . . 32
2.14.2 Cryoconserving and thawing of cells . . . . . . . . . . . . . . . . . . 33
2.14.3 Stimulation of leukemia cells by CD40 cross-linking . . . . . . . . . 33
2.15 Primary Mixed Lymphocytes Reaction (MLR) . . . . . . . . . . . . . . . . 34
2.16 Generation of anti-leukemia-specific T-cell lines . . . . . . . . . . . . . . . 34
2.17 Cytotoxic assay . . . . . . . . . . . . . . . . . . . . . . . . . . . . . . . . . 35
2.18 Apoptosis . . . . . . . . . . . . . . . . . . . . . . . . . . . . . . . . . . . . 36
2.18.1 Induction of apoptosis . . . . . . . . . . . . . . . . . . . . . . . . . 36
2.18.2 Apoptosis detection . . . . . . . . . . . . . . . . . . . . . . . . . . 36
2.19 Statistical analysis . . . . . . . . . . . . . . . . . . . . . . . . . . . . . . . 37
3 Results 38
3.1 CD40 expression on ALL blasts . . . . . . . . . . . . . . . . . . . . . . . . 38
3.2 Expression of costimulatory molecules and CD27 on ALL blasts . . . . . . 39
3.3 Stimulation of ALL blasts by CD40-cross-linking . . . . . . . . . . . . . . 42
3.4 Analysis of the correlation between the expression of costimulatory molecules
and the biological course of leukemia . . . . . . . . . . . . . . . . . . . . . 47
3.4.1 Patients’ characteristics . . . . . . . . . . . . . . . . . . . . . . . . 47
3.4.2 Prognostic factors and expression of costimulatory molecules on pri-
mary ALL blasts . . . . . . . . . . . . . . . . . . . . . . . . . . . . 50
3.4.3 Association between expression of CD80 and CD86 on primary ALL
blasts and prognostic factors . . . . . . . . . . . . . . . . . . . . . . 51
3.4.4 Association between expression of CD27 and CD70 on primary ALL
blasts and prognostic factors . . . . . . . . . . . . . . . . . . . . . . 53
3.4.5 Prognostic factors and expression of costimulatory molecules on CD40-
stimulated ALL blasts . . . . . . . . . . . . . . . . . . . . . . . . . 55
Contents iv
3.4.6 Expression of costimulatory molecules and CD27 and CNS disease
on ALL patients . . . . . . . . . . . . . . . . . . . . . . . . . . . . 56
3.4.7 Prognostic factors and expression of costimulatory molecules: summary 57
3.5 T-cell stimulatory capacity of CD40-stimulated ALL blasts . . . . . . . . . 59
3.6 Generation of anti-leukemia specific cytotoxic T-cells . . . . . . . . . . . . 65
3.6.1 Characteristics of cells used for generation of anti-leukemia cytotoxic
T-cells . . . . . . . . . . . . . . . . . . . . . . . . . . . . . . . . . . 65
3.6.2 Role of CD70 for the expansion of T-cell lines using CD40-stimulated
or unstimulated ALL blasts. . . . . . . . . . . . . . . . . . . . . . . 67
3.6.3 Anti-leukemia cytotoxicity of T-cell lines generated using unstimu-
lated or CD40-stimulated ALL blasts. . . . . . . . . . . . . . . . . . 71
3.6.4 Role of CD70 for the anti-leukemia cytotoxic activity of T-cell lines
generated with unstimulated or CD40-stimulated ALL blasts. . . . 75
3.7 CD95 system in ALL blasts . . . . . . . . . . . . . . . . . . . . . . . . . . 77
3.7.1 CD95 expression on primary ALL blasts . . . . . . . . . . . . . . . 77
3.7.2 CD95-mediated apoptosis in primary ALL blasts . . . . . . . . . . 77
3.8 Survival and CD95 expression on ALL blasts after CD40 engagement . . . 79
3.8.1 Survival of ALL blasts during cultivation on fibroblasts . . . . . . . 79
3.8.2 Dynamic of CD95 expression on ALL blasts during the CD40-stimulation 80
3.8.3 CD95 expression on CD40-stimulated ALL blasts . . . . . . . . . . 81
3.9 Functional activity of CD95 expression induced by CD40-stimulation on
ALL blasts . . . . . . . . . . . . . . . . . . . . . . . . . . . . . . . . . . . . 83
3.10 Effect of protein synthesis inhibitor to CD95-mediated apoptosis of CD40-
stimulated ALL blasts . . . . . . . . . . . . . . . . . . . . . . . . . . . . . 85
3.11 Clinical relevance of the expression and function of CD95 on ALL blasts . 87
3.11.1 Patients’ characteristics . . . . . . . . . . . . . . . . . . . . . . . . 87
3.11.2 Association between CD95 expression and function on primary and
CD40-stimulated ALL blasts and prognosis factors . . . . . . . . . 91
4 Discussion 93
Contents v
4.1 Expression of CD70 and CD27 on ALL cells can be modified via in vitro
cocultivation of primary ALL cells with CD40L-expressing fibroblasts . . . 93
4.2 The CD70-CD27 pathway synergistically enhances the CD80 and CD86-
CD28 pathway of antigen presentation by ALL cells . . . . . . . . . . . . . 94
4.3 The CD70-CD27 pathway is necessary for the generation of anti-leukemia
cytotoxic T-cells . . . . . . . . . . . . . . . . . . . . . . . . . . . . . . . . . 95
4.4 A high CD27 expression rate correlates with patients belonging to the low
risk group . . . . . . . . . . . . . . . . . . . . . . . . . . . . . . . . . . . . 98
4.5 Induction of CD95 expression does not completely sensitize ALL cells for
CD95-mediated apoptosis . . . . . . . . . . . . . . . . . . . . . . . . . . . 100
4.6 Anti-apoptotic proteins are involved in low sensitivity of ALL cells to CD95-
mediated apoptosis . . . . . . . . . . . . . . . . . . . . . . . . . . . . . . . 102
5 Summary 104
6 References 105
vi
Abbreviation
Ag Antigen
ALL Acute lymphoblastic leukemia
AML Acute myelogenous leukemia
APC Antigen-presenting cell
BM Bone marrow
BMT Bone marrow transplantation
BSA Bovine serum albumin
◦C Celsius degree
CLL Chronic lymphocytic leukemia
CML Chronic myelogenous leukemia
CNS Central nervous system
CHX Cycloheximide
cpm Count per minute
CTL Cytotoxic T lymphocyte
CTLA-4 Cytotoxic T lymphocyte Ag-4
DMSO Dimethylsulfochlorid
DNA Deoxyribonucleic acid
EDTA Ethylendiamintetraacetat
ELISA Enzyme linked immuno sorbent assay
FACS Fluorescence activated cell sorter
FCS Fetal calf serum
Fig. Figure
FITC Fluorescein isothiocyanat
g Gram
h Hour
Ig Immunoglobulin
IFN Interferon
IL Interleukin
L Ligand
Abbreviation vii
M Molar
m Milli (1x−3)
µ Micro (1x−6)
mAb Monoclonal antibodies
MACS Magnetic activated cell sorter
MHC Major histocompatibility complex
min Minute
MLR Mixed lymphocyte reaction
MNC Mononuclear cells
MMC Mitomycin C
nm Nanometer (1x−9)
NK Natural killer
NHL Non Hodgkin’s lymphoma
PB Peripheral blood
PBS Phosphate buffered saline
PE Phycoerythrin
PI Propidium iodide
PHA Phytohemagglutinin
PMA Phorbol myiristic acetate
RNA Ribonucleic acid
Tab. Table
TNF Tumor necrosis factor
% Percent
1
1 Introduction
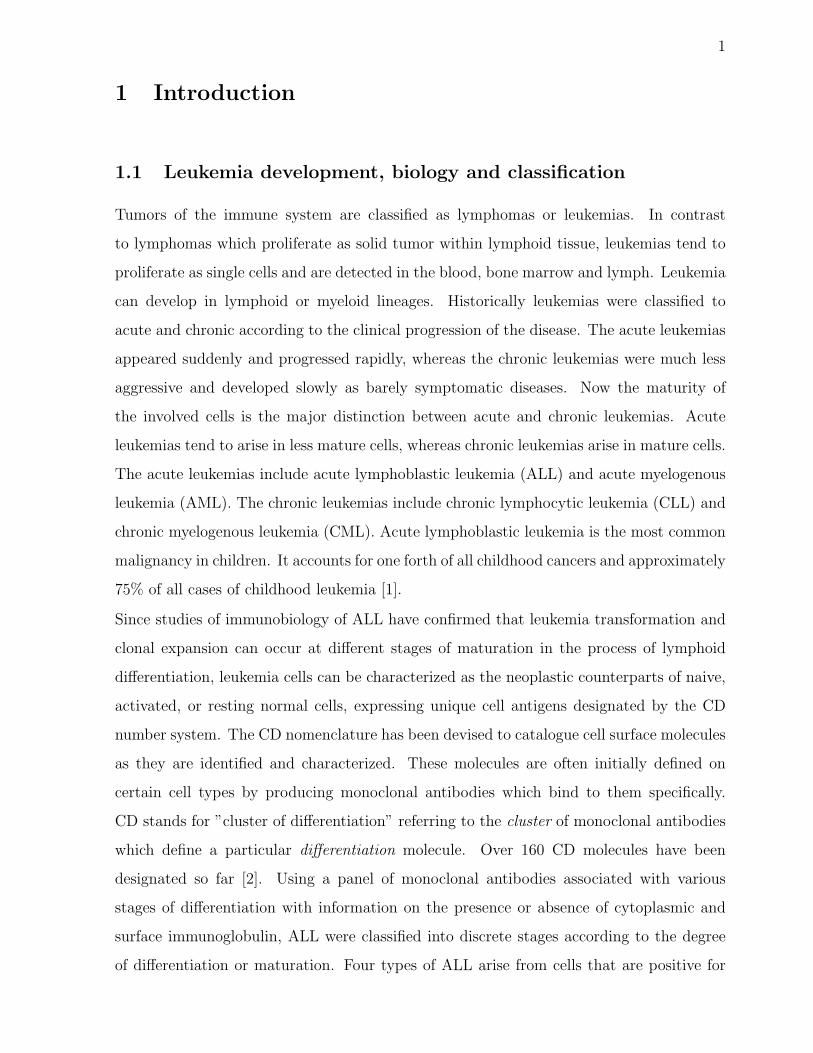
1.1 Leukemia development, biology and classification
Tumors of the immune system are classified as lymphomas or leukemias. In contrast
to lymphomas which proliferate as solid tumor within lymphoid tissue, leukemias tend to
proliferate as single cells and are detected in the blood, bone marrow and lymph. Leukemia
can develop in lymphoid or myeloid lineages. Historically leukemias were classified to
acute and chronic according to the clinical progression of the disease. The acute leukemias
appeared suddenly and progressed rapidly, whereas the chronic leukemias were much less
aggressive and developed slowly as barely symptomatic diseases. Now the maturity of
the involved cells is the major distinction between acute and chronic leukemias. Acute
leukemias tend to arise in less mature cells, whereas chronic leukemias arise in mature cells.
The acute leukemias include acute lymphoblastic leukemia (ALL) and acute myelogenous
leukemia (AML). The chronic leukemias include chronic lymphocytic leukemia (CLL) and
chronic myelogenous leukemia (CML). Acute lymphoblastic leukemia is the most common
malignancy in children. It accounts for one forth of all childhood cancers and approximately
75% of all cases of childhood leukemia [1].
Since studies of immunobiology of ALL have confirmed that leukemia transformation and
clonal expansion can occur at different stages of maturation in the process of lymphoid
differentiation, leukemia cells can be characterized as the neoplastic counterparts of naive,
activated, or resting normal cells, expressing unique cell antigens designated by the CD
number system. The CD nomenclature has been devised to catalogue cell surface molecules
as they are identified and characterized. These molecules are often initially defined on
certain cell types by producing monoclonal antibodies which bind to them specifically.
CD stands for ”cluster of differentiation” referring to the cluster of monoclonal antibodies
which define a particular differentiation molecule. Over 160 CD molecules have been
designated so far [2]. Using a panel of monoclonal antibodies associated with various
stages of differentiation with information on the presence or absence of cytoplasmic and
surface immunoglobulin, ALL were classified into discrete stages according to the degree
of differentiation or maturation. Four types of ALL arise from cells that are positive for
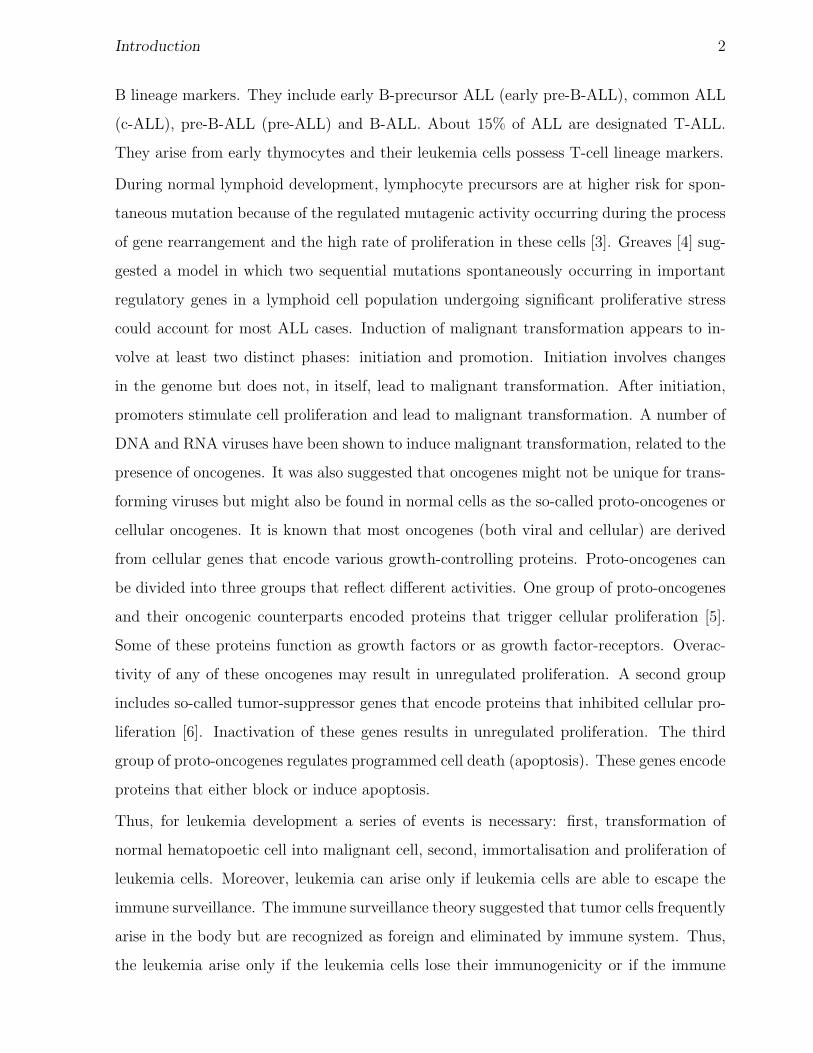
Introduction 2
B lineage markers. They include early B-precursor ALL (early pre-B-ALL), common ALL
(c-ALL), pre-B-ALL (pre-ALL) and B-ALL. About 15% of ALL are designated T-ALL.
They arise from early thymocytes and their leukemia cells possess T-cell lineage markers.
During normal lymphoid development, lymphocyte precursors are at higher risk for spon-
taneous mutation because of the regulated mutagenic activity occurring during the process
of gene rearrangement and the high rate of proliferation in these cells [3]. Greaves [4] sug-
gested a model in which two sequential mutations spontaneously occurring in important
regulatory genes in a lymphoid cell population undergoing significant proliferative stress
could account for most ALL cases. Induction of malignant transformation appears to in-
volve at least two distinct phases: initiation and promotion. Initiation involves changes
in the genome but does not, in itself, lead to malignant transformation. After initiation,
promoters stimulate cell proliferation and lead to malignant transformation. A number of
DNA and RNA viruses have been shown to induce malignant transformation, related to the
presence of oncogenes. It was also suggested that oncogenes might not be unique for trans-
forming viruses but might also be found in normal cells as the so-called proto-oncogenes or
cellular oncogenes. It is known that most oncogenes (both viral and cellular) are derived
from cellular genes that encode various growth-controlling proteins. Proto-oncogenes can
be divided into three groups that reflect different activities. One group of proto-oncogenes
and their oncogenic counterparts encoded proteins that trigger cellular proliferation [5].
Some of these proteins function as growth factors or as growth factor-receptors. Overac-
tivity of any of these oncogenes may result in unregulated proliferation. A second group
includes so-called tumor-suppressor genes that encode proteins that inhibited cellular pro-
liferation [6]. Inactivation of these genes results in unregulated proliferation. The third
group of proto-oncogenes regulates programmed cell death (apoptosis). These genes encode
proteins that either block or induce apoptosis.
Thus, for leukemia development a series of events is necessary: first, transformation of
normal hematopoetic cell into malignant cell, second, immortalisation and proliferation of
leukemia cells. Moreover, leukemia can arise only if leukemia cells are able to escape the
immune surveillance. The immune surveillance theory suggested that tumor cells frequently
arise in the body but are recognized as foreign and eliminated by immune system. Thus,
the leukemia arise only if the leukemia cells lose their immunogenicity or if the immune
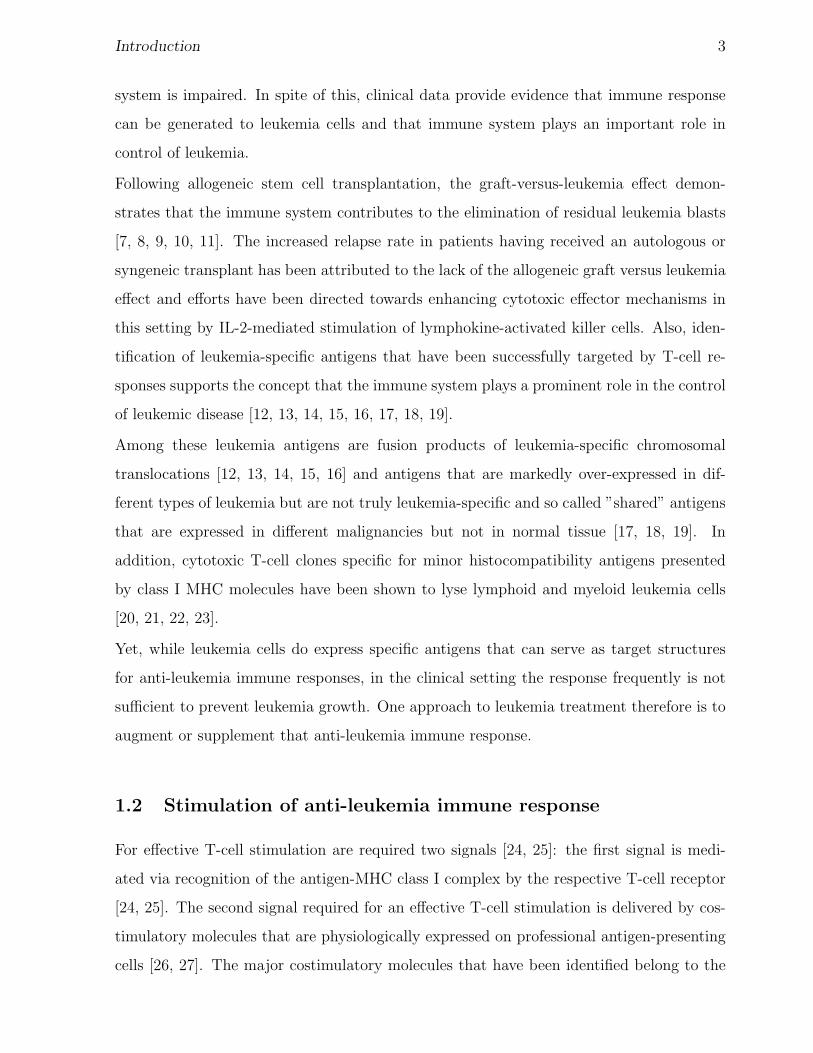
Introduction 3
system is impaired. In spite of this, clinical data provide evidence that immune response
can be generated to leukemia cells and that immune system plays an important role in
control of leukemia.
Following allogeneic stem cell transplantation, the graft-versus-leukemia effect demon-
strates that the immune system contributes to the elimination of residual leukemia blasts
[7, 8, 9, 10, 11]. The increased relapse rate in patients having received an autologous or
syngeneic transplant has been attributed to the lack of the allogeneic graft versus leukemia
effect and efforts have been directed towards enhancing cytotoxic effector mechanisms in
this setting by IL-2-mediated stimulation of lymphokine-activated killer cells. Also, iden-
tification of leukemia-specific antigens that have been successfully targeted by T-cell re-
sponses supports the concept that the immune system plays a prominent role in the control
of leukemic disease [12, 13, 14, 15, 16, 17, 18, 19].
Among these leukemia antigens are fusion products of leukemia-specific chromosomal
translocations [12, 13, 14, 15, 16] and antigens that are markedly over-expressed in dif-
ferent types of leukemia but are not truly leukemia-specific and so called ”shared” antigens
that are expressed in different malignancies but not in normal tissue [17, 18, 19]. In
addition, cytotoxic T-cell clones specific for minor histocompatibility antigens presented
by class I MHC molecules have been shown to lyse lymphoid and myeloid leukemia cells
[20, 21, 22, 23].
Yet, while leukemia cells do express specific antigens that can serve as target structures
for anti-leukemia immune responses, in the clinical setting the response frequently is not
sufficient to prevent leukemia growth. One approach to leukemia treatment therefore is to
augment or supplement that anti-leukemia immune response.
1.2 Stimulation of anti-leukemia immune response
For effective T-cell stimulation are required two signals [24, 25]: the first signal is medi-
ated via recognition of the antigen-MHC class I complex by the respective T-cell receptor
[24, 25]. The second signal required for an effective T-cell stimulation is delivered by cos-
timulatory molecules that are physiologically expressed on professional antigen-presenting
cells [26, 27]. The major costimulatory molecules that have been identified belong to the
Introduction 4
B7 family of costimulatory molecules (B7-1/CD80 and B7-2/CD86). In the absence of
such secondary signals T-cells are rendered anergic to the presented antigen [24].
Thus deficient immunogenicity of leukemia cells may in principle be due to defective
antigen-processing and/or presentation or lack of costimulatory molecules. As leukemia
cells generally express MHC class I molecules to high levels, their reduced T-cell stimula-
tory capacity is largely attributed to deficient costimulation.
1.2.1 Costimulatory molecules CD80 and CD86
Costimulatory molecules of the B7 family deliver important costimulatory signal for T-
cells via binding to their receptor CD28 on T-cell [28, 29]. Interaction of both CD80 and
CD86 with CD28 receptor, expressed on resting and activated T-cells [30] results in T-cell
proliferation, cytotoxic T-cell generation, immunoglobulin (Ig) and cytokine production
on B-cells [31, 32, 33, 34, 35]. In addition to CD28, some population of T-cells may also
transiently express CTLA-4 (cytotoxic T lymphocyte Ag-4), a second receptor for CD80
and CD86 [36]. CTLA-4 engagement may transduce an “off” signal, disengaging T-cells
from further activation and proliferation [34, 37].
Both costimulatory molecules CD80 and CD86 are members of the immunoglobulin su-
perfamily [38, 39]. CD80 a B-cell activation molecule first described in 1981 by Yokochi
et al [40] was the first ligand to be identified for the CD28 molecule. In addition to its
expression on activated B-cells, CD80 was also detected on a variety of antigen-presenting
cells (APCs) including dendritic cells, Langerhans cells, activated monocytes and activated
T-cells [41]. The functional importance of the CD80 molecule has been demonstrated in
a number of studies of T-cell activation. Both anti-CD3 and phorbol myristic acetate
(PMA)-induced T-cell proliferation was enhanced by the addition of CD80-transfectants
and this activation was blocked by anti-CD28 monoclonal antibodies (mAbs) [42, 38].
The structure of CD86 molecule was found to be very similar to CD80 [39]. Similar to
CD80, CD86 transfectants augment T-cell proliferation and IL-2 production to suboptimal
stimulation with anti-CD3 or PMA [43, 39]. Either anti-CD86 or anti-CD80 mAbs alone
have been shown to be inefficient in their ability to block allogeneic mixed lymphocyte
reactions (MLRs) [44, 45]. A combination of both anti-CD80 and anti-CD86 mAbs were
the most effective at inhibiting the MLR [46, 47]. The role for both molecules in primary
Introduction 5
responses was further supported by the finding that a combination of anti-CD80 and anti-
CD86 antibodies can induce anergy [46].
Resting B-cells express undetectable level of CD80 and very low levels of CD86, while
both CD80 and CD86 are upregulated following B-cell activation [44]. The regulation of
CD80/CD86 expression is controlled via cell-cell interaction and cytokines. The CD40-
CD40L pathway plays an important role in controlling CD80 and CD86 expression. Both
CD80 and CD86 were induced by signaling through CD40, either through anti-CD40 mAbs
or activated T-cells which expressed the CD40 ligand [48]. Also a number of cytokines
have been shown to regulate expression of CD80 and CD86. IL-4 is one of the most potent
inducers of CD86 [49]. It is also can stimulate to a less extent CD80 on B-cells [49]. IFN-γ
increases the expression of CD86 on B-cells [44].
CD28-CD80/CD86-mediated costimulation has provided a new approach to cancer ther-
apy, because the inability of several tumors to stimulate sufficient immune response has
been in some cases correlated with deficient CD80/CD86-costimulation. It was shown that
leukemia cells are unable to stimulate efficient immune response in vivo and that can be
explained by the low expression levels of costimulatory molecules. Indeed, it was demon-
strated that leukemia cells exhibit low levels of CD80 and heterogeneous pattern of CD86
expression [50, 51]. Therefore, stimulation of CD80 and/or CD86 expression on leukemia
cells could convert them into functional APCs. In fact, in leukemias, transgenic expression
of the costimulatory surface molecule CD80 enhances the immunogenicity of myeloid and
lymphoid leukemia cells [52, 53, 54, 55, 56, 57]. The potency of CD80 as a costimulator is
documented in a murine ALL model. Immunization of mice with leukemia cells transduced
with CD80 protected the animal from further challenge with non-transfected leukemia cells
[57]. In vitro, retroviral transduction of murine AML cells with CD80 enhances the ex-
pansion of leukemia-reactive CTLs mediating graft-versus-leukemia reactions when infused
after syngeneic bone marrow transplantation (BMT) [55].
The function of CD86 as costimulator has been also studied. It has been demonstrated that
myeloid leukemia cells transduced with CD86 have improved their reduced immunogenicity,
but were unable to stimulate protective anti-leukemia immune response [58]. In other in
vivo studies, the myeloid leukemia cells transduced to express CD86 have stimulated an
anti-leukemia immune response and were able to protect animals against wild-type tumor
Introduction 6
challenge and to eradicate minimal residual disease [54, 59].
However, the transfection of CD80 or CD86 molecules into tumor cells has been not uni-
formly successful in inducting tumor immunity. In some low immunogenic solid tumor
models, tumor cells did not induce an immune response even when cotransfected with CD80
and CD86 [60, 61], what suggests that other costimulatory molecules might contribute for
sufficient T-cell stimulation. In addition to CD80 and CD86 molecules, members of the
tumor necrosis factor(TNF) family and their ligands are known to be involved in the mod-
ulation of immunological responses [62]. As the members of this superfamily, CD70 and
its receptor CD27 are important costimulatory molecules involved in antigen-dependent
T-cell activation [63, 31, 64].
1.2.2 CD27-CD70 costimulatory pathway
CD27 is a type I glycoprotein belonging to the TNF-receptor family and is expressed on the
majority of peripheral T-cells and natural killer (NK) cells [32, 31]. CD27 is differentially
expressed on B-cells subpopulations depending on their stage of differentiation. CD27 is
absent on immature and mature naive B-cells, but is expressed on tonsillary germinal center
B-cells and on memory peripheral B-cells [65, 66]. Primed, memory B-cells expressing CD27
differentiate into plasma cells by contact with CD70 on T-cells in cooperation with IL-10.
Thus, the CD27-CD70 interaction is involved in the differentiation of B-cells into plasma
cells, in which CD27+ rather than CD27− cells produce Ig [67, 68, 69, 70, 71, 72, 73, 74, 75].
A soluble turnicated form of CD27 (sCD27) was found in vivo in human plasma, urine and
spinal fluid [76].
Beside CD27 expression on normal cells, CD27 can be detected in many malignancies cor-
responding to the counterparts of B-cells such as ALL, CLL, mantle cell lymphoma and
several non-Hodgkin’s lymphomas including follicular lymphoma (FL) [77, 78, 79, 80]. In-
creased levels of sCD27 in serum were observed in serum and cerebrospinal fluid (CSF)
of patients with CLL and low-grade non-Hodgkin’s lymphoma (NHL) [80]. It was also
described that sCD27 can be useful in the differential diagnosis of CNS involvement in
lymphoid malignancies as a tumor marker in patients with either meningeal localization
of lymphoid malignancies or primary central nervous system lymphoma [81]. In leukemia
B-cells CD27 expression appears to be dysregulated and this dysregulation may have conse-
Introduction 7
quences for the behavior of malignant B-cells in vivo. Moreover, if membrane-bound CD27
is involved in the functional activity of CD27+ T- and B-cells, the presence of soluble CD27
in plasma might interfere with these function.
CD70, the ligand for CD27, is a transmembran glycoprotein type II, belonging to the TNF
family and is expressed by activated T cells, on a small subset (10%) of activated memory
peripheral B lymphocytes and on B-cells in the limited number of tonsillary germinal cen-
ters [31, 64, 66]. It is well documented that CD27-CD70 interactions provide a proliferative
signal for T-cells expressing CD27 that is distinct from that of mediated through CD28
by its counterparts [82, 83]. It has also been described, that the CD27-CD70 interaction
enhances NK activity in the presence of IL-2 or IL-12 and is involved in the regulation of
cytolytic function of cytotoxic T-cells [84, 85, 86]. CD70 function as costimulatory molecule
for both CD4+ and CD8+ T-cell proliferation, enhanced cytokine secretion (TNF-α, IL-10,
IL-4, IL-2) and induces the generation of cytotoxic T-cells in mixed lymphocyte culture
[87, 31].
CD70 has been reported to be expressed on CLL cells and lymphoma cells such as hairy
lymphoma cells, non-Hodgkins lymphoma cells, diffuse large B-cell lymphoma cells and
follicle center lymphoma cells [82, 78, 79]. Until now CD70 expression on ALL cells has
not been well studied with exception of one early report [88].
Since the failure of leukemia cells to function as efficient antigen-presenting cells has been
attributed not only to low levels of costimulatory molecules CD80 and CD86 on their
surface, CD70-CD27 costimulatory pathway is of particular interest. However, only in
few reports the importance of the costimulatory CD70-CD27 pathway in leukemia and
lymphoma cells has been studied. In one report, CD70 expression on CLL cells has been
modulated via CD40-stimulation with reciprocal changes of CD27 expression. It has been
demonstrated that these changes in CD70 and CD27 expression contribute to the enhanced
antigen-presenting capacity of CLL cells [82]. In another report, it has been demonstrated
that the CD27-CD70 pathway plays a role in the reduced immunogenicity of follicular
lymphoma cells [89].
In few murine solid in vivo tumor models it has already been demonstrated that CD70
expression is able to improve tumor immunogenicity and to induce antitumor immunity at
levels similar or even superior to CD80 when tested either in vaccination or therapy models
Introduction 8
[90, 91]. Moreover, coexpression of CD70 and CD80 results in additive T-cell responses
[92] and is synergistic in inducing an protective antitumor response [91, 93, 94].
To our best knowledge, the role of CD70 expression on ALL cells is presently unknown.
Since the low CD70 expression contributes to low immunogenicity of lymphoma and chronic
leukemia cells [82, 89], it would be interesting to investigate whether the CD70-CD27
pathway is also involved in reduced immunogenicity and antigen-presenting capacity of
ALL cells.
1.2.3 Costimulatory molecule CD40
Another potent pairs of costimulatory surface molecules of TNF receptor-ligand family are
the CD40 and its ligand CD40L which is transiently expressed on activated T-cells [95, 96].
CD40 receptor can be found on B-cells, monocytes and dendritic cells [97, 98]. Gener-
ally, CD40-CD40L interactions are critical for interaction between T-cells and antigen-
presenting cells, in particular for B-cells [99, 100, 101]. Engagement of the CD40 recep-
tor on normal B-cells induces differentiation and survival of mature B-cells promoting Ig
class switch, antigen-processing [102, 103], increased MHC expression and up-regulation
of costimulatory surface molecules such as CD80 and CD86. Thus CD40L enhances the
antigen-presenting capacity of mature B-cells [48, 104].
Since leukemia cells express CD40 [105, 106, 79] it is possible to modify the leukemia cells by
cocultivation with CD40L-expressing feeder-cells or with the CD40L-trimer. CD40-induced
maturation has been successfully employed in AML [107] enhancing the T-cell stimulatory
capacity of myelogenous blasts, induced T-cell-proliferation and cytokine secretion [107].
It has been well documented that CLL and FL cells after CD40-stimulation express cos-
timulatory molecules CD80 and CD86 [48, 108, 109, 110, 111]. CD40-activation turns
leukemia cells into efficient antigen presenting cells and this enhanced APC function is
mediated in part by the up-regulation of CD80 and CD86 expression on the leukemia cells
[48, 108, 109, 111, 112].
It has been shown that after cocultivation of ALL cells with CD40L-trimer or on CD40L-
expressing feeder-cells the ALL cells express high levels of MHC class I and II molecules,
up-regulate expression of ICAM-1 and LFA-3, and markedly increase expression of CD80
and CD86 [113, 114, 115].
Introduction 9
In contrast, expression of CD70 and its receptor CD27 after CD40-stimulation on ALL
cells and their costimulatory activity are presently unknown. It would be interesting to
study whether CD40-stimulation can modulate CD70 expression on ALL cells and improve
therefore their reduced immunogenicity.
1.3 Vaccine strategies
Vaccine strategies aim to compensate the reduced immunogenicity of leukemia cells. In
this end, a number of vaccine cells are generated to express leukemia-specific antigens in
the context of adequate costimulation. Vaccine cells are then administered via different
routes of application in order to stimulate a systemic leukemia-specific immune responses.
One of different possible vaccine strategies is to modify the leukemia cells by activation in
order to improve their antigen-presenting capacity. This can be achieved by cultivation the
leukemia blasts ex vivo on CD40L-expressing feeder-cells or in the presence of the CD40L-
trimer. These CD40-activated leukemia cells could be used for stimulation of anti-leukemia
T-cell response.
Indeed, leukemia-specific cytotoxic T-cell lines has been generated in vitro when CD40-
stimulated lymphoma or chronic leukemia cells were used for stimulation of allogeneic
T-cells [109, 111, 116, 117]. In a clinical phase I study infusion of autologous CD40L-
transduced CLL cells results in an increase in the frequency of leukemia-specific T-cells.
In some patients a decrease in the absolute leukemia cell count associated with reduction
in lymph node size was observed [118].
It has been shown that ALL cells improve their antigen-presenting capacity after CD40
activation and stimulate anti-leukemia cytotoxic T-cell response in vitro [119]. The role
of CD28-CD80/CD86 interaction in the improved immunogenicity of ALL cells has been
described [119], whereas the role of CD27-CD70 costimulation remains unclear. The under-
standing of the importance of CD27-CD70 costimulation in the generation of anti-leukemia
T-cell response, could provide additional strategies for immunotherapy of ALL.
Introduction 10
1.4 CD95-mediated programmed cell death
Progression of acute leukemia is characterized by a rapid proliferation and accumulation
of malignant hematopoetic cells. Multiple mechanisms may explain why leukemia cells
escape the control of the immune system. One of common cause includes the defects in
the programmed cell death (apoptosis) pathways.
The best characterized molecule which was initially found as a cell surface molecule directly
mediate apoptosis is the CD95 antigen [120, 121, 122]. CD95 is a type I transmembrane
glycoprotein, belonging to the TNF receptor superfamily. It is expressed at low level on
resting T lymphocytes and is up-regulated on activated T-cells [123, 124]. On B-cells CD95
is expressed at a restricted developmental stage. It can be found on activated B-cells, but
not on naive mature B-cells [125, 126].
The ligand for CD95 (CD95L) is a type II membrane protein, which is originally expressed
on activated T lymphocytes and NK cells [121, 127]. CD95L can undergo proteolytic
cleavage and can be secreted in a soluble form. Both forms have proven to be able to
execute a functional death signal on CD95 secreting cells [121].
CD95-CD95L cooperation plays an important role in the peripheral elimination of au-
toreactive B-cells, regulation and limitation of immune responses by deletion of mature
activated T and B-cells. The CD95-mediated apoptosis is also involved in killing targets
such as virus-infected cells or cancer cells by cytotoxic T-cells and NK cells.
B-cells are characterized by the dual expression of CD40 and CD95, which can mediate
their survival and death, respectively. The balance between the dynamically opposing func-
tions of these two receptors is important for B-cell selection, maturation and homeostasis.
It is shown that in a normal immune environment, induction of CD40L on T-cells by B-cell
antigen presentation is necessary for B-cells to trigger sensitivity to CD95-mediated apop-
tosis. Ligation of CD40 inhibits apoptosis and stimulates proliferation of normal B-cells,
whereas ligation of CD95 induces apoptosis of activated lymphocytes [128, 129]. Aberrant
signaling through the CD40 and CD95 antigens could participate in the pathogenesis of
lymphoid malignancies.
It has been well documented, that primary leukemia cells such as ALL, CLL and lymphoma
cells express detectable, though low levels of CD95 [124, 130, 131, 132, 133]. In contrast, T
Introduction 11
lineage ALL and AML cells express heterogeneous levels of CD95 [134, 135]. On AML cells,
CD95 expression was associated with good response to chemotherapy and low expression of
CD95 is related to a low complete remission rate after chemotherapy induction [136, 137].
In high grade B-cell lymphomas, loss of CD95 expression or function have been attributed
with a more aggressive tumor grade [138].
Whether expression of CD95 on primary ALL cells is also clinical relevant remains unclear.
The results of several published investigations are controversial. In one report [139], it has
been shown, that CD95 is most frequently expressed in clinically favorable ALL and is
associated with increased relapse-free and overall survival. However, these findings were
not confirmed in another study [140]. CD95 expression was not found to be correlated with
the response to chemotherapy or relapse rate, either for B-cell precursor or T-ALL [140].
Since it was demonstrated that in leukemia cells the CD95 system involved in chemotherapy-
induced apoptosis [141, 142], many investigations have been focused on the functional ac-
tivity of CD95 in leukemias. CLL and B lineage ALL leukemia cells were shown to be
resistant toward CD95-mediated apoptosis [130, 143]. In B lineage ALL, their resistance is
not caused by a mutation of the CD95 molecule [144]. In primary AML and T-ALL cells,
that express heterogeneous level of CD95, apoptosis can be induced through CD95 in some
cases [132, 135].
Since CD95-mediated apoptosis is associated with B cell activation, it can be affected by
costimulation through other accessory signaling molecules like CD40. As it has been shown
that CLL, ALL cells and lymphoma cells [145, 143] up-regulate CD95 after CD40 ligation
similar to normal B-cells. The CD40-induced CD95 expression was reported to enhance
sensitivity toward CD95-apoptosis only in lymphoma cells [145], but not in cases of CLL
[146, 147, 143]. It has been shown in one report that in 5 from 10 ALL samples tested
CD40-stimulation sensitized the leukemia cells to CD95-mediated apoptosis, however at
low level.
Thus, the importance of CD95 expression on primary and CD40-activated ALL cells re-
mains unclear. It is worth therefore studying the biological role of CD95 expression and
its functional activity on primary ALL blasts. It is also interesting to investigate whether
CD40 stimulation can sensitize the ALL cells to CD95-mediated apoptosis.
12
1.5 Aims of the study
The aim of the present work is to study the biological role of the expression of the costim-
ulatory molecules CD70-CD27 and apoptosis-mediating CD95 molecule on ALL cells.
I. In the first part of our work we examine the expression levels of CD70, CD27 as well as
CD80 and CD86 on primary ALL blasts. We also analyse the association between expres-
sion levels of CD70, CD27, CD80 and CD86 molecules on primary and CD40-stimulated
ALL blasts with some prognostic factors. We investigate whether baseline or CD40-induced
expression of these molecules is correlate with poor or favorable clinical outcome.
II. In the second part of our work we investigate the modulation of CD70 and CD27
expression on ALL cells after CD40-stimulation.
III. In the third part of our study we determined the role of CD70 expression on CD40-
stimulated ALL blasts for their enhanced antigen-presenting capacity. We investigate fur-
ther the importance of CD70-CD27 costimulation for the expansion and cytotoxic activity
of T-cells generated using CD40-stimulated ALL blasts.
IV. In the next part of our work we investigate the baseline expression of CD95 on ALL
cells.
V. We also examine whether the expression of CD95 on ALL cells can be enhanced by
CD40-stimulation.
VI. Next we determine the sensitivity of primary and CD40-stimulated ALL blasts to
CD95-mediated apoptosis. We also analyse whether expression level of CD95 on ALL
blasts before and after CD40-stimulation correlate with generally accepted prognostic risk
factors.
Aims of the study 13
The results of the present study can help to clear the role of CD70 and CD27 expression
on the ALL blasts and in particular their importance for the antigen-presenting capacity
of ALL cells. Since the design of efficient leukemia vaccine is based on the enhancement
of reduced tumorgenicity of leukemia cells, a deeper understanding of the molecules and
mechanisms that are responsible for the induction of the immunogenicity of leukemia cells
can have implication for the immunotherapy of ALL.
On the other hand, manipulation of the expression levels and activity of apoptosis-mediated
molecules on ALL cells in order to turn them into an efficient target for effector T-cells, can
also be have an application for the development of additional therapy strategies of ALL.
The results of our study may help to elucidate of the mechanisms underlying resistance of
ALL cells to CD95-mediated apoptosis and facilitate the development of novel therapeutic
approaches.
14
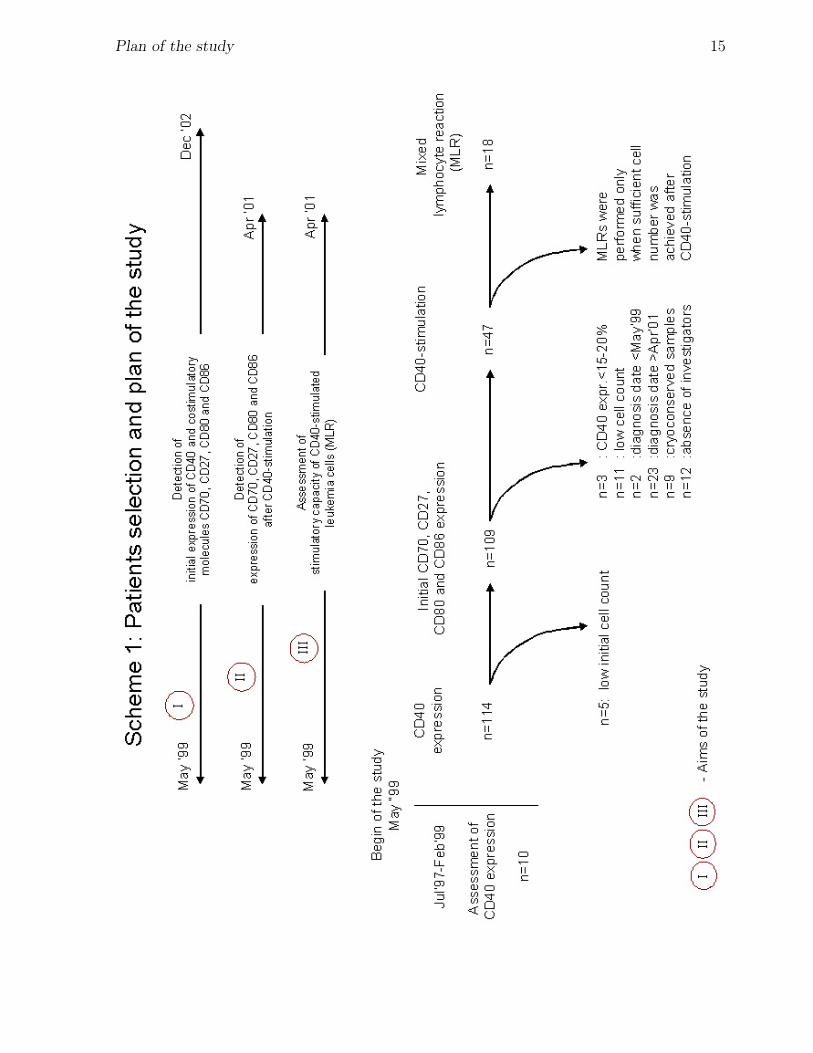
1.6 Plan of the study
According to aims of the present work the following schema of study was designed as shown
on page 15 and 17.
Scheme 1. In preliminary experiments (11.1997-2.1999) we have evaluated the expression
of CD40 on limited number of ALL samples (n=10). Further, we have determined initial
expression of CD40 and costimulatory molecules CD80, CD86, CD70 and CD27 on the
blasts from newly diagnosed patients (n=124) with ALL. In the period of time from May
1999 to December 2002 we have analysed expression of these molecules on primary ALL
cells from 73 patients which were diagnosed and treated in our clinic (Dusseldorf). Also
the ALL samples from 51 patients with ALL were delivered for our experimental purposes
from other clinics (Hamburg and Krefeld).
In the period of time from May 1999 to April 2001 we have investigated the expression of
costimulatory molecules and CD70 in particular on the CD40-activated ALL blasts. ALL
blasts from selected 47 patients were used for CD40 stimulation. The following selection
criteria were used: CD40 expression at level more than 15-20% and sufficient initial cell
number. Importantly, to delay any modulation processes by cryoconcervation only fresh
isolated ALL cells were used for CD40-stimulation.
After CD40 stimulation ALL blasts from 18 patients were used for mixed lymphocyte
reaction in order to investigate the stimulatory capacity of CD40-stimulated ALL blasts.
Sufficient number of CD40-stimulated ALL cells was the only selection criterion in these
experiments.
Plan of the study 15
Plan of the study 16
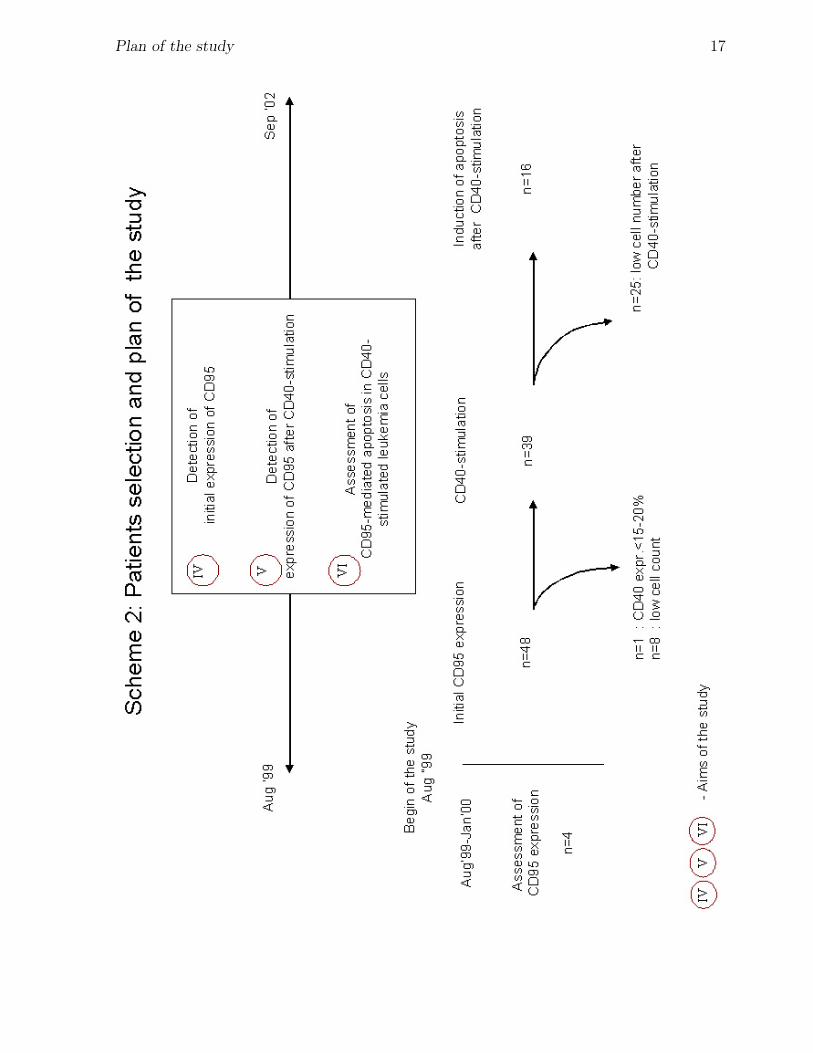
Scheme 2. In the period of time from August 1999 to September 2002 the expression of
CD95 on the blasts from newly diagnosed patients with ALL was investigated.
Initial CD95 expression on the primary ALL blasts was assessed in a total 48 patients,
whose blasts were also used for assessment of expression of costimulatory molecules.
With aim to study the expression of CD95 on CD40-stimulated ALL blasts, cells from 39
selected patients were stimulated with CD40. The major selection criteria were sufficient
cell number and CD40 expression at level more than 15-20%.
Further analysis of CD95-mediated apoptosis on CD40-stimulated ALL cells was performed
only in cases when sufficient cell number was obtained after CD40-stimulation (n=16).
Plan of the study 17
18
2 Patients, materials and methods
2.1 Patients selection and characteristic
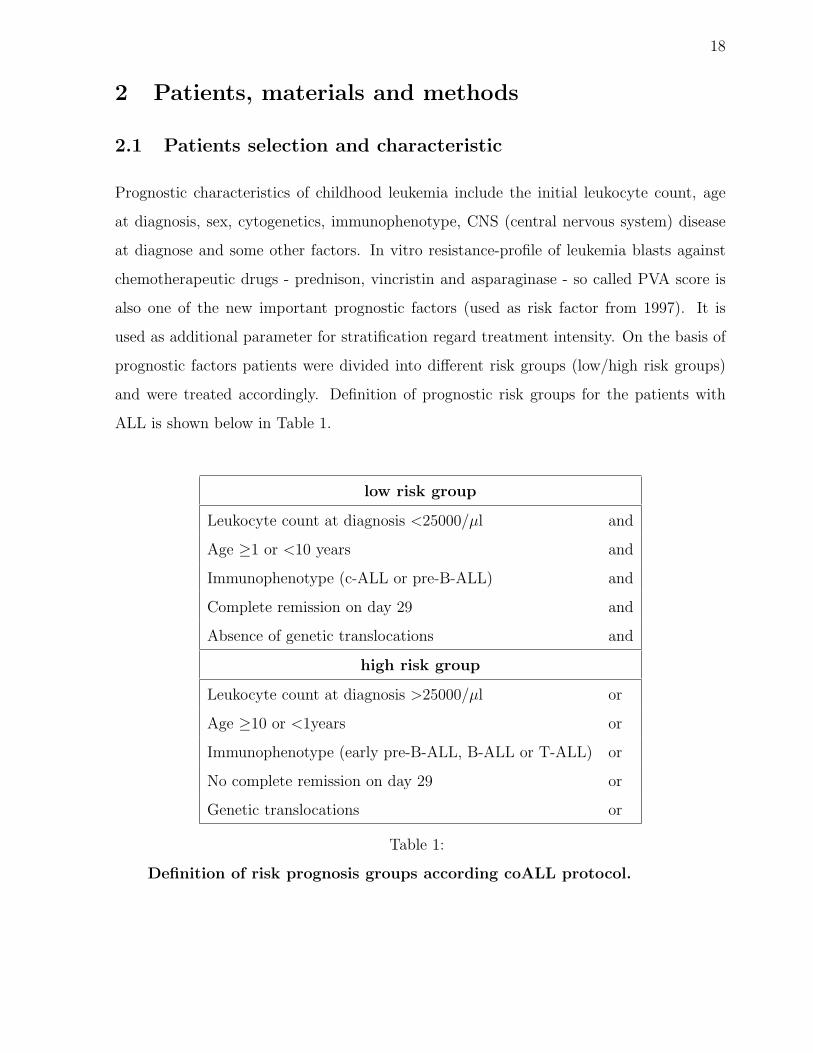
Prognostic characteristics of childhood leukemia include the initial leukocyte count, age
at diagnosis, sex, cytogenetics, immunophenotype, CNS (central nervous system) disease
at diagnose and some other factors. In vitro resistance-profile of leukemia blasts against
chemotherapeutic drugs - prednison, vincristin and asparaginase - so called PVA score is
also one of the new important prognostic factors (used as risk factor from 1997). It is
used as additional parameter for stratification regard treatment intensity. On the basis of
prognostic factors patients were divided into different risk groups (low/high risk groups)
and were treated accordingly. Definition of prognostic risk groups for the patients with
ALL is shown below in Table 1.
low risk group
Leukocyte count at diagnosis <25000/µl and
Age ≥1 or <10 years and
Immunophenotype (c-ALL or pre-B-ALL) and
Complete remission on day 29 and
Absence of genetic translocations and
high risk group
Leukocyte count at diagnosis >25000/µl or
Age ≥10 or <1years or
Immunophenotype (early pre-B-ALL, B-ALL or T-ALL) or
No complete remission on day 29 or
Genetic translocations or
Table 1:
Definition of risk prognosis groups according coALL protocol.
Patients, materials and methods 19
In our study were used the bone marrow or peripheral blood from patients with acute
B lymphoblastic leukemia with initial diagnosis date from 1980 to 2002. Patients were
treated according the respective coALL protocols active at the time of diagnosis. All
research samples were collected in accordance with ethics committee approval. Patients
or parents were informed and gave written consent to give blood or bone marrow for our
particular experimental purpose. ALL cells from 73 patients diagnosed and treated in our
clinic (Dussleldorf) and 51 patients from other clinics (Hamburg and Krefeld) were used in
experiments described in present work. The ALL cells from cryoconserved samples (n=11)
were used only to determine the initial expression of tested molecules.
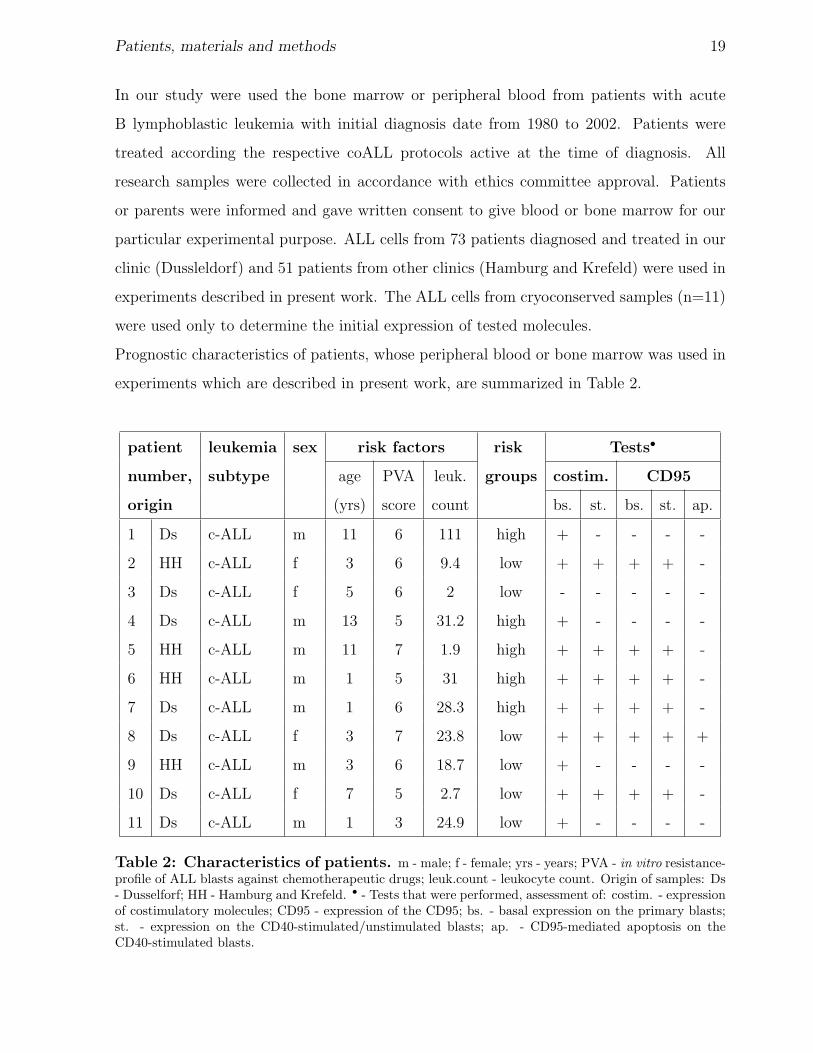
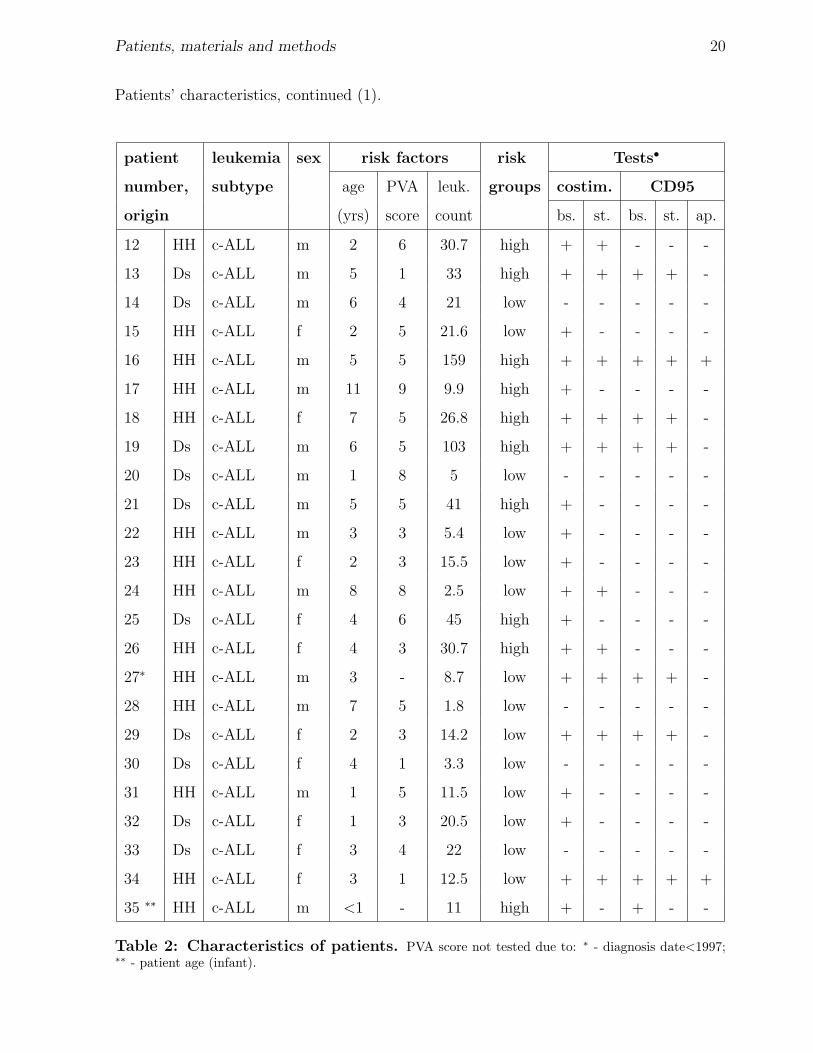
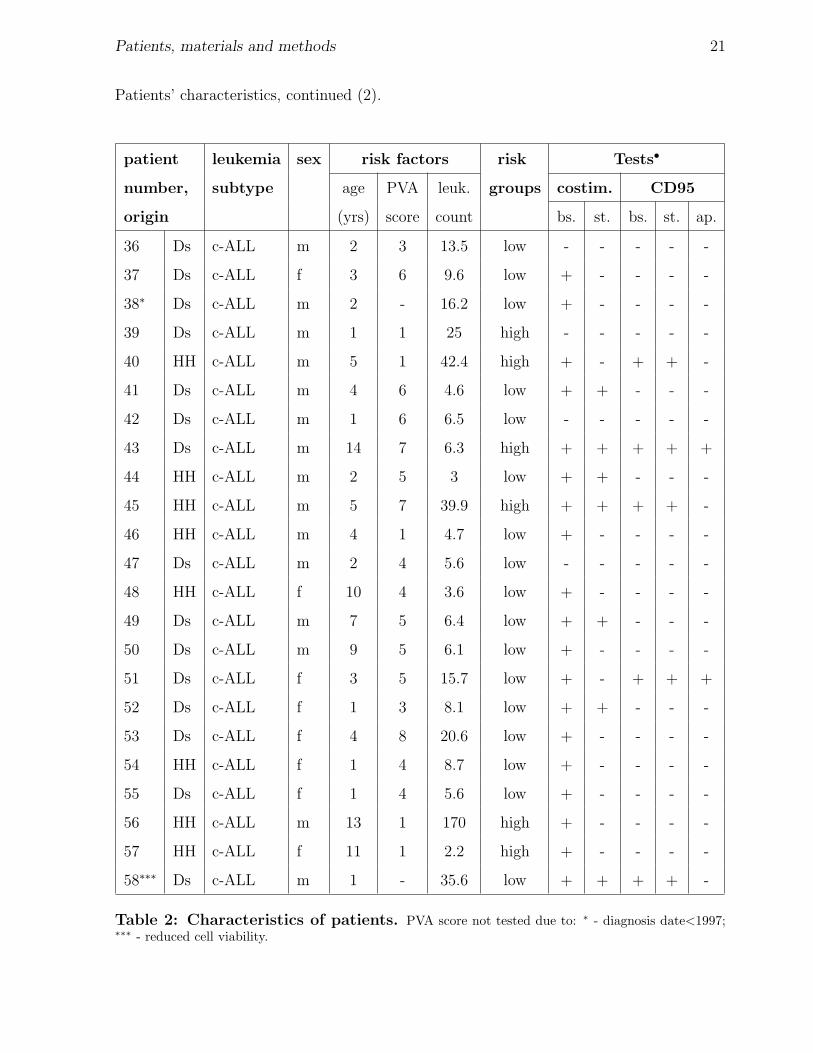
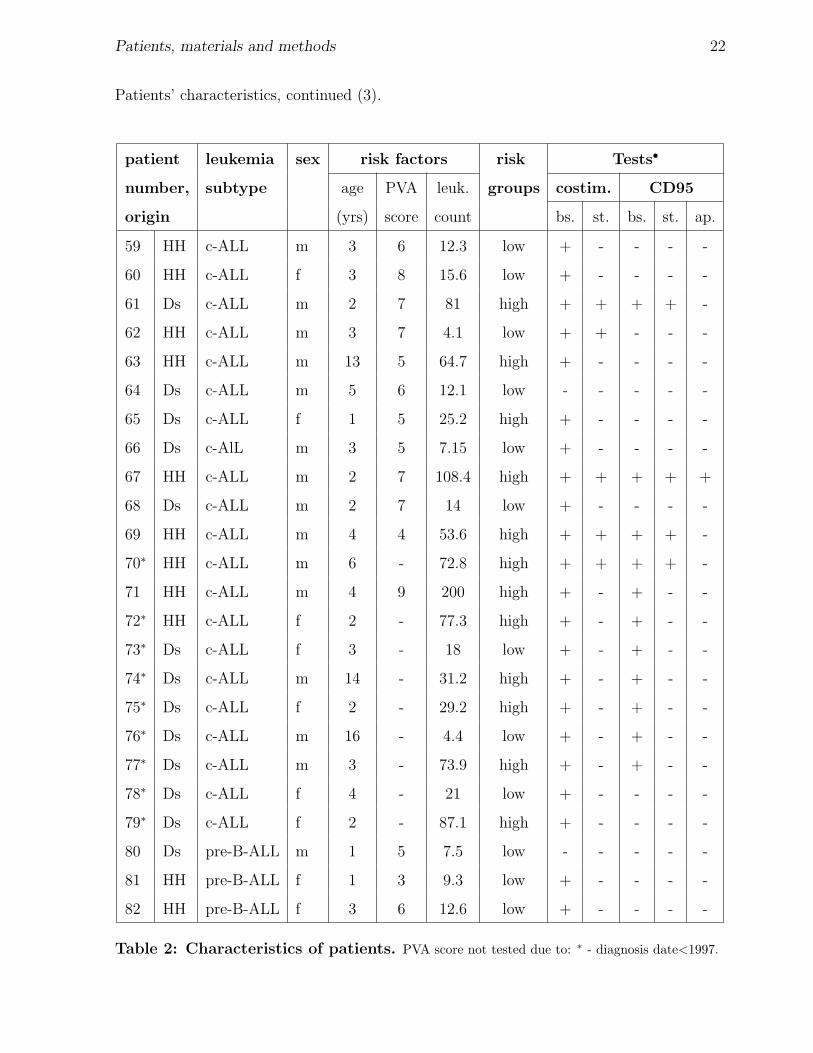
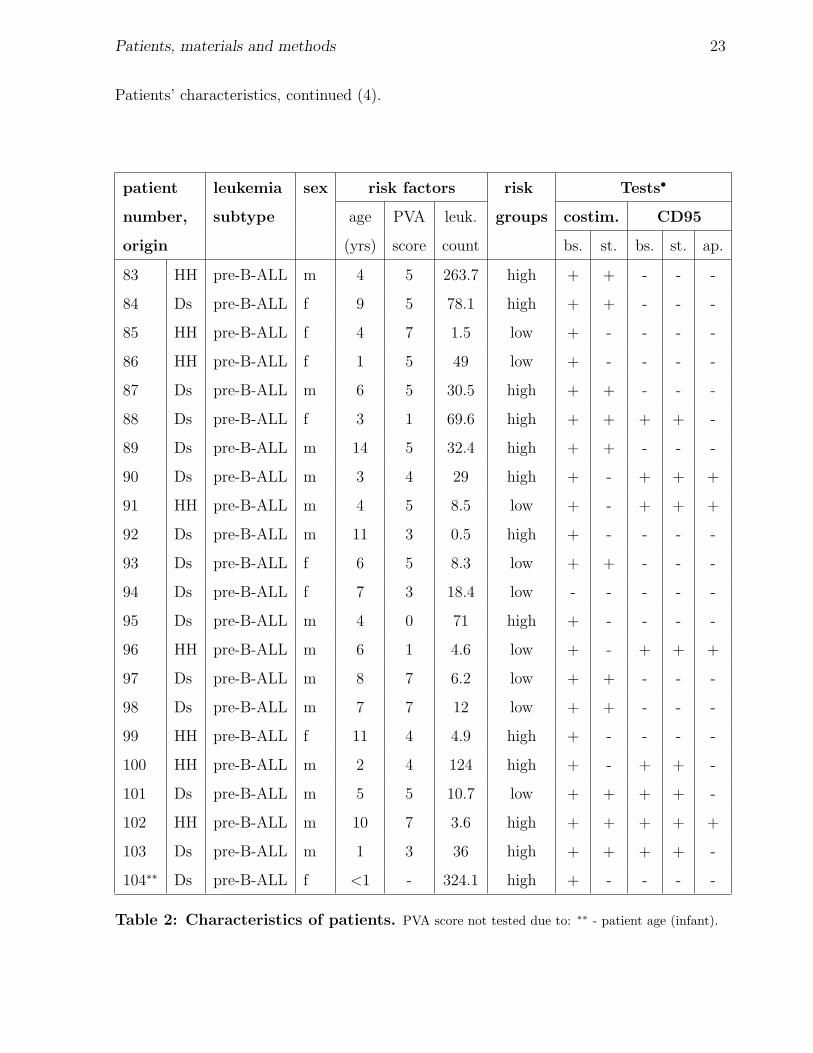
Prognostic characteristics of patients, whose peripheral blood or bone marrow was used in
experiments which are described in present work, are summarized in Table 2.
patient leukemia sex risk factors risk Tests•
number, subtype age PVA leuk. groups costim. CD95
origin (yrs) score count bs. st. bs. st. ap.
1 Ds c-ALL m 11 6 111 high + - - - -
2 HH c-ALL f 3 6 9.4 low + + + + -
3 Ds c-ALL f 5 6 2 low - - - - -
4 Ds c-ALL m 13 5 31.2 high + - - - -
5 HH c-ALL m 11 7 1.9 high + + + + -
6 HH c-ALL m 1 5 31 high + + + + -
7 Ds c-ALL m 1 6 28.3 high + + + + -
8 Ds c-ALL f 3 7 23.8 low + + + + +
9 HH c-ALL m 3 6 18.7 low + - - - -
10 Ds c-ALL f 7 5 2.7 low + + + + -
11 Ds c-ALL m 1 3 24.9 low + - - - -
Table 2: Characteristics of patients. m - male; f - female; yrs - years; PVA - in vitro resistance-profile of ALL blasts against chemotherapeutic drugs; leuk.count - leukocyte count. Origin of samples: Ds- Dusselforf; HH - Hamburg and Krefeld. • - Tests that were performed, assessment of: costim. - expressionof costimulatory molecules; CD95 - expression of the CD95; bs. - basal expression on the primary blasts;st. - expression on the CD40-stimulated/unstimulated blasts; ap. - CD95-mediated apoptosis on theCD40-stimulated blasts.
Patients, materials and methods 20
Patients’ characteristics, continued (1).
patient leukemia sex risk factors risk Tests•
number, subtype age PVA leuk. groups costim. CD95
origin (yrs) score count bs. st. bs. st. ap.
12 HH c-ALL m 2 6 30.7 high + + - - -
13 Ds c-ALL m 5 1 33 high + + + + -
14 Ds c-ALL m 6 4 21 low - - - - -
15 HH c-ALL f 2 5 21.6 low + - - - -
16 HH c-ALL m 5 5 159 high + + + + +
17 HH c-ALL m 11 9 9.9 high + - - - -
18 HH c-ALL f 7 5 26.8 high + + + + -
19 Ds c-ALL m 6 5 103 high + + + + -
20 Ds c-ALL m 1 8 5 low - - - - -
21 Ds c-ALL m 5 5 41 high + - - - -
22 HH c-ALL m 3 3 5.4 low + - - - -
23 HH c-ALL f 2 3 15.5 low + - - - -
24 HH c-ALL m 8 8 2.5 low + + - - -
25 Ds c-ALL f 4 6 45 high + - - - -
26 HH c-ALL f 4 3 30.7 high + + - - -
27∗ HH c-ALL m 3 - 8.7 low + + + + -
28 HH c-ALL m 7 5 1.8 low - - - - -
29 Ds c-ALL f 2 3 14.2 low + + + + -
30 Ds c-ALL f 4 1 3.3 low - - - - -
31 HH c-ALL m 1 5 11.5 low + - - - -
32 Ds c-ALL f 1 3 20.5 low + - - - -
33 Ds c-ALL f 3 4 22 low - - - - -
34 HH c-ALL f 3 1 12.5 low + + + + +
35 ∗∗ HH c-ALL m <1 - 11 high + - + - -
Table 2: Characteristics of patients. PVA score not tested due to: ∗ - diagnosis date<1997;∗∗ - patient age (infant).
Patients, materials and methods 21
Patients’ characteristics, continued (2).
patient leukemia sex risk factors risk Tests•
number, subtype age PVA leuk. groups costim. CD95
origin (yrs) score count bs. st. bs. st. ap.
36 Ds c-ALL m 2 3 13.5 low - - - - -
37 Ds c-ALL f 3 6 9.6 low + - - - -
38∗ Ds c-ALL m 2 - 16.2 low + - - - -
39 Ds c-ALL m 1 1 25 high - - - - -
40 HH c-ALL m 5 1 42.4 high + - + + -
41 Ds c-ALL m 4 6 4.6 low + + - - -
42 Ds c-ALL m 1 6 6.5 low - - - - -
43 Ds c-ALL m 14 7 6.3 high + + + + +
44 HH c-ALL m 2 5 3 low + + - - -
45 HH c-ALL m 5 7 39.9 high + + + + -
46 HH c-ALL m 4 1 4.7 low + - - - -
47 Ds c-ALL m 2 4 5.6 low - - - - -
48 HH c-ALL f 10 4 3.6 low + - - - -
49 Ds c-ALL m 7 5 6.4 low + + - - -
50 Ds c-ALL m 9 5 6.1 low + - - - -
51 Ds c-ALL f 3 5 15.7 low + - + + +
52 Ds c-ALL f 1 3 8.1 low + + - - -
53 Ds c-ALL f 4 8 20.6 low + - - - -
54 HH c-ALL f 1 4 8.7 low + - - - -
55 Ds c-ALL f 1 4 5.6 low + - - - -
56 HH c-ALL m 13 1 170 high + - - - -
57 HH c-ALL f 11 1 2.2 high + - - - -
58∗∗∗ Ds c-ALL m 1 - 35.6 low + + + + -
Table 2: Characteristics of patients. PVA score not tested due to: ∗ - diagnosis date<1997;∗∗∗ - reduced cell viability.
Patients, materials and methods 22
Patients’ characteristics, continued (3).
patient leukemia sex risk factors risk Tests•
number, subtype age PVA leuk. groups costim. CD95
origin (yrs) score count bs. st. bs. st. ap.
59 HH c-ALL m 3 6 12.3 low + - - - -
60 HH c-ALL f 3 8 15.6 low + - - - -
61 Ds c-ALL m 2 7 81 high + + + + -
62 HH c-ALL m 3 7 4.1 low + + - - -
63 HH c-ALL m 13 5 64.7 high + - - - -
64 Ds c-ALL m 5 6 12.1 low - - - - -
65 Ds c-ALL f 1 5 25.2 high + - - - -
66 Ds c-AlL m 3 5 7.15 low + - - - -
67 HH c-ALL m 2 7 108.4 high + + + + +
68 Ds c-ALL m 2 7 14 low + - - - -
69 HH c-ALL m 4 4 53.6 high + + + + -
70∗ HH c-ALL m 6 - 72.8 high + + + + -
71 HH c-ALL m 4 9 200 high + - + - -
72∗ HH c-ALL f 2 - 77.3 high + - + - -
73∗ Ds c-ALL f 3 - 18 low + - + - -
74∗ Ds c-ALL m 14 - 31.2 high + - + - -
75∗ Ds c-ALL f 2 - 29.2 high + - + - -
76∗ Ds c-ALL m 16 - 4.4 low + - + - -
77∗ Ds c-ALL m 3 - 73.9 high + - + - -
78∗ Ds c-ALL f 4 - 21 low + - - - -
79∗ Ds c-ALL f 2 - 87.1 high + - - - -
80 Ds pre-B-ALL m 1 5 7.5 low - - - - -
81 HH pre-B-ALL f 1 3 9.3 low + - - - -
82 HH pre-B-ALL f 3 6 12.6 low + - - - -
Table 2: Characteristics of patients. PVA score not tested due to: ∗ - diagnosis date<1997.
Patients, materials and methods 23
Patients’ characteristics, continued (4).
patient leukemia sex risk factors risk Tests•
number, subtype age PVA leuk. groups costim. CD95
origin (yrs) score count bs. st. bs. st. ap.
83 HH pre-B-ALL m 4 5 263.7 high + + - - -
84 Ds pre-B-ALL f 9 5 78.1 high + + - - -
85 HH pre-B-ALL f 4 7 1.5 low + - - - -
86 HH pre-B-ALL f 1 5 49 low + - - - -
87 Ds pre-B-ALL m 6 5 30.5 high + + - - -
88 Ds pre-B-ALL f 3 1 69.6 high + + + + -
89 Ds pre-B-ALL m 14 5 32.4 high + + - - -
90 Ds pre-B-ALL m 3 4 29 high + - + + +
91 HH pre-B-ALL m 4 5 8.5 low + - + + +
92 Ds pre-B-ALL m 11 3 0.5 high + - - - -
93 Ds pre-B-ALL f 6 5 8.3 low + + - - -
94 Ds pre-B-ALL f 7 3 18.4 low - - - - -
95 Ds pre-B-ALL m 4 0 71 high + - - - -
96 HH pre-B-ALL m 6 1 4.6 low + - + + +
97 Ds pre-B-ALL m 8 7 6.2 low + + - - -
98 Ds pre-B-ALL m 7 7 12 low + + - - -
99 HH pre-B-ALL f 11 4 4.9 high + - - - -
100 HH pre-B-ALL m 2 4 124 high + - + + -
101 Ds pre-B-ALL m 5 5 10.7 low + + + + -
102 HH pre-B-ALL m 10 7 3.6 high + + + + +
103 Ds pre-B-ALL m 1 3 36 high + + + + -
104∗∗ Ds pre-B-ALL f <1 - 324.1 high + - - - -
Table 2: Characteristics of patients. PVA score not tested due to: ∗∗ - patient age (infant).
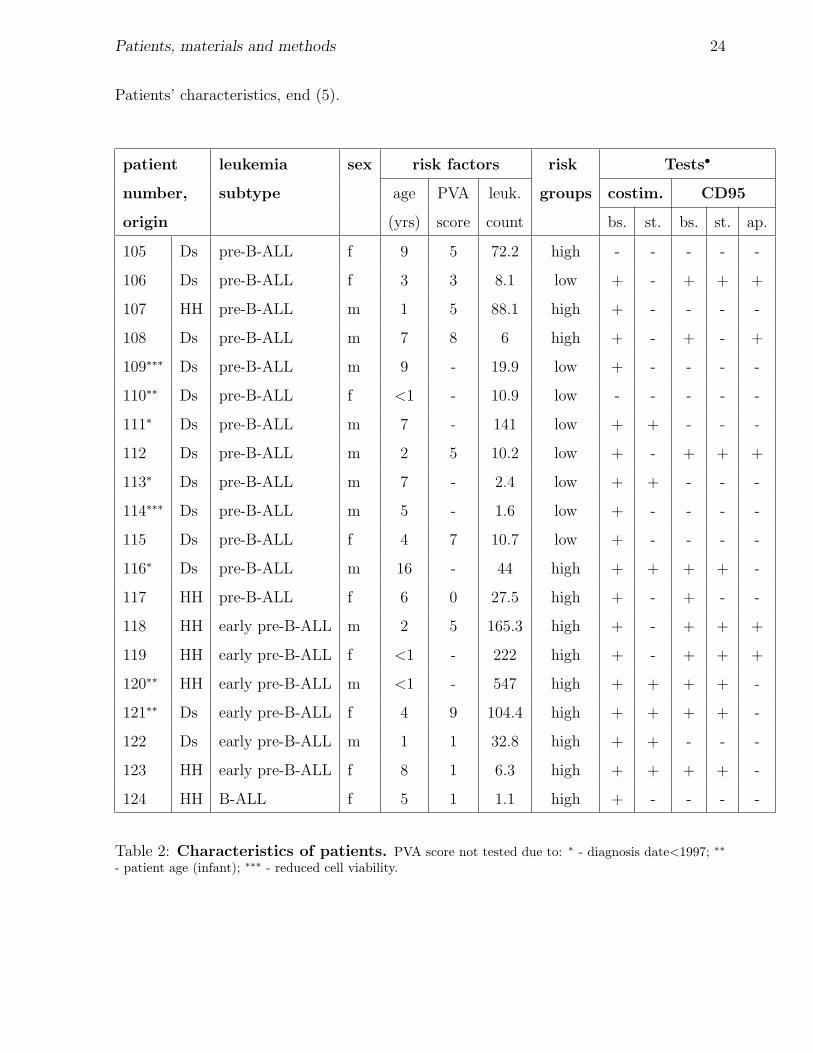
Patients, materials and methods 24
Patients’ characteristics, end (5).
patient leukemia sex risk factors risk Tests•
number, subtype age PVA leuk. groups costim. CD95
origin (yrs) score count bs. st. bs. st. ap.
105 Ds pre-B-ALL f 9 5 72.2 high - - - - -
106 Ds pre-B-ALL f 3 3 8.1 low + - + + +
107 HH pre-B-ALL m 1 5 88.1 high + - - - -
108 Ds pre-B-ALL m 7 8 6 high + - + - +
109∗∗∗ Ds pre-B-ALL m 9 - 19.9 low + - - - -
110∗∗ Ds pre-B-ALL f <1 - 10.9 low - - - - -
111∗ Ds pre-B-ALL m 7 - 141 low + + - - -
112 Ds pre-B-ALL m 2 5 10.2 low + - + + +
113∗ Ds pre-B-ALL m 7 - 2.4 low + + - - -
114∗∗∗ Ds pre-B-ALL m 5 - 1.6 low + - - - -
115 Ds pre-B-ALL f 4 7 10.7 low + - - - -
116∗ Ds pre-B-ALL m 16 - 44 high + + + + -
117 HH pre-B-ALL f 6 0 27.5 high + - + - -
118 HH early pre-B-ALL m 2 5 165.3 high + - + + +
119 HH early pre-B-ALL f <1 - 222 high + - + + +
120∗∗ HH early pre-B-ALL m <1 - 547 high + + + + -
121∗∗ Ds early pre-B-ALL f 4 9 104.4 high + + + + -
122 Ds early pre-B-ALL m 1 1 32.8 high + + - - -
123 HH early pre-B-ALL f 8 1 6.3 high + + + + -
124 HH B-ALL f 5 1 1.1 high + - - - -
Table 2: Characteristics of patients. PVA score not tested due to: ∗ - diagnosis date<1997; ∗∗
- patient age (infant); ∗∗∗ - reduced cell viability.
Patients, materials and methods 25
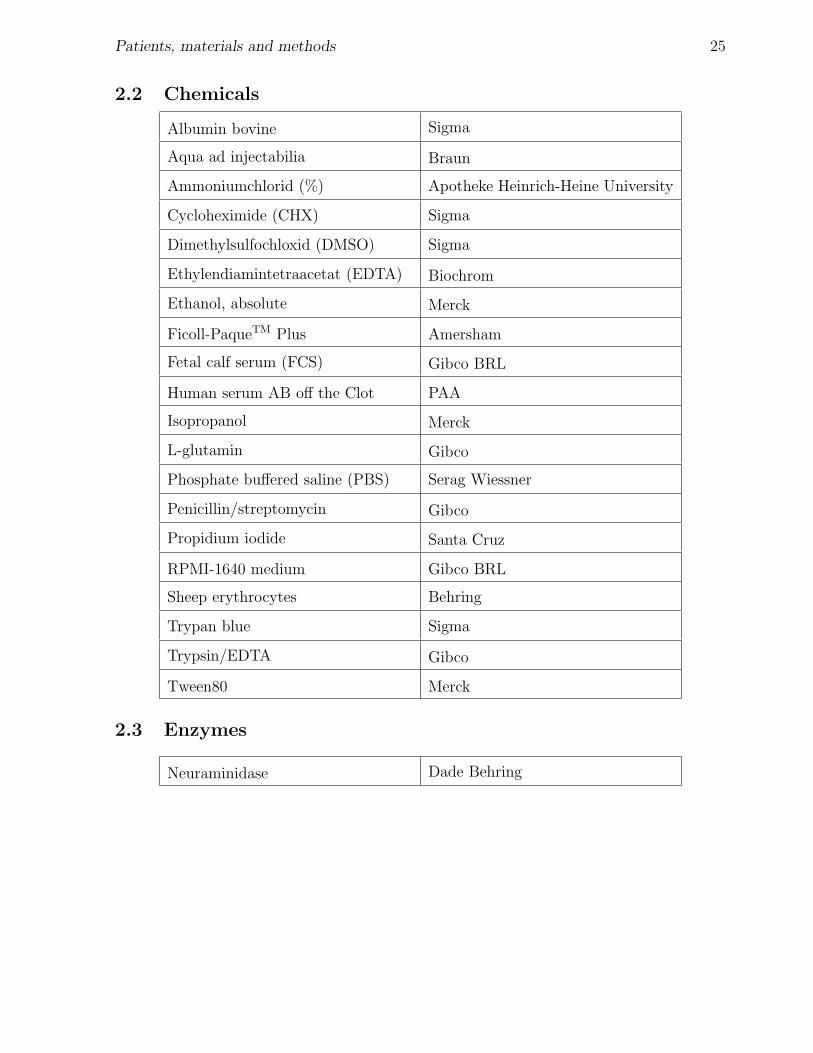
2.2 Chemicals
Albumin bovine Sigma
Aqua ad injectabilia Braun
Ammoniumchlorid (%) Apotheke Heinrich-Heine University
Cycloheximide (CHX) Sigma
Dimethylsulfochloxid (DMSO) Sigma
Ethylendiamintetraacetat (EDTA) Biochrom
Ethanol, absolute Merck
Ficoll-PaqueTM Plus Amersham
Fetal calf serum (FCS) Gibco BRL
Human serum AB off the Clot PAA
Isopropanol Merck
L-glutamin Gibco
Phosphate buffered saline (PBS) Serag Wiessner
Penicillin/streptomycin Gibco
Propidium iodide Santa Cruz
RPMI-1640 medium Gibco BRL
Sheep erythrocytes Behring
Trypan blue Sigma
Trypsin/EDTA Gibco
Tween80 Merck
2.3 Enzymes
Neuraminidase Dade Behring
Patients, materials and methods 26
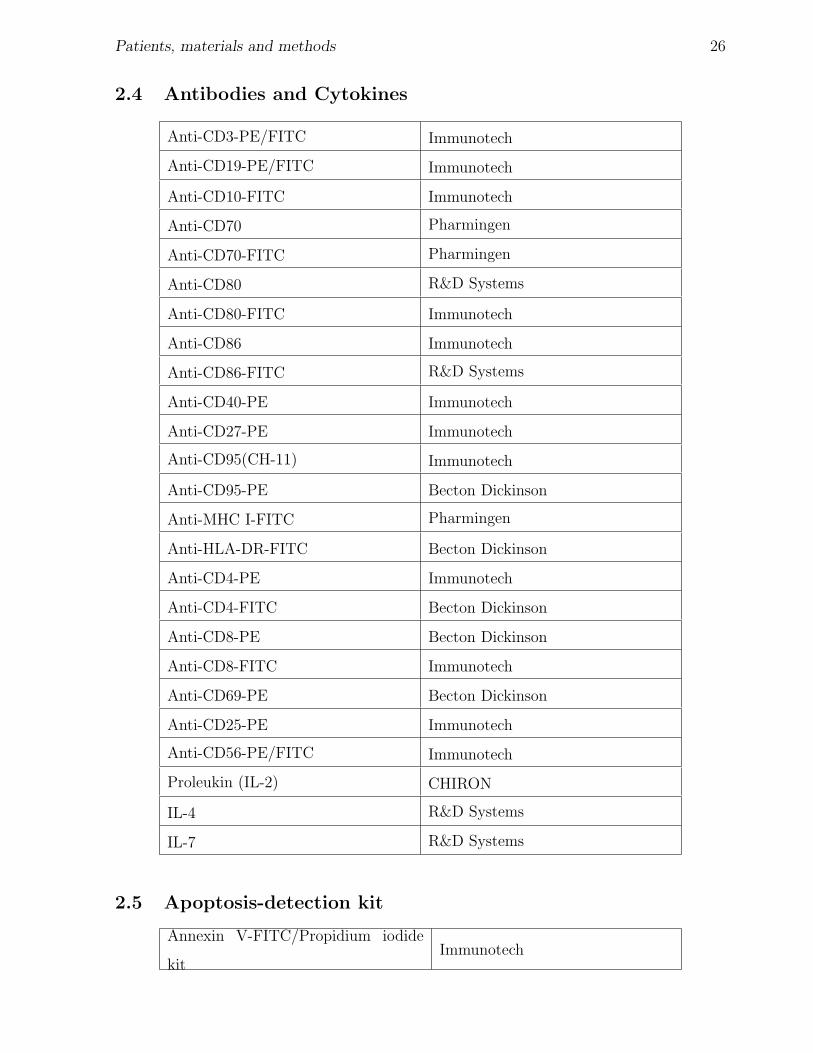
2.4 Antibodies and Cytokines
Anti-CD3-PE/FITC Immunotech
Anti-CD19-PE/FITC Immunotech
Anti-CD10-FITC Immunotech
Anti-CD70 Pharmingen
Anti-CD70-FITC Pharmingen
Anti-CD80 R&D Systems
Anti-CD80-FITC Immunotech
Anti-CD86 Immunotech
Anti-CD86-FITC R&D Systems
Anti-CD40-PE Immunotech
Anti-CD27-PE Immunotech
Anti-CD95(CH-11) Immunotech
Anti-CD95-PE Becton Dickinson
Anti-MHC I-FITC Pharmingen
Anti-HLA-DR-FITC Becton Dickinson
Anti-CD4-PE Immunotech
Anti-CD4-FITC Becton Dickinson
Anti-CD8-PE Becton Dickinson
Anti-CD8-FITC Immunotech
Anti-CD69-PE Becton Dickinson
Anti-CD25-PE Immunotech
Anti-CD56-PE/FITC Immunotech
Proleukin (IL-2) CHIRON
IL-4 R&D Systems
IL-7 R&D Systems
2.5 Apoptosis-detection kit
Annexin V-FITC/Propidium iodide
kitImmunotech
Patients, materials and methods 27
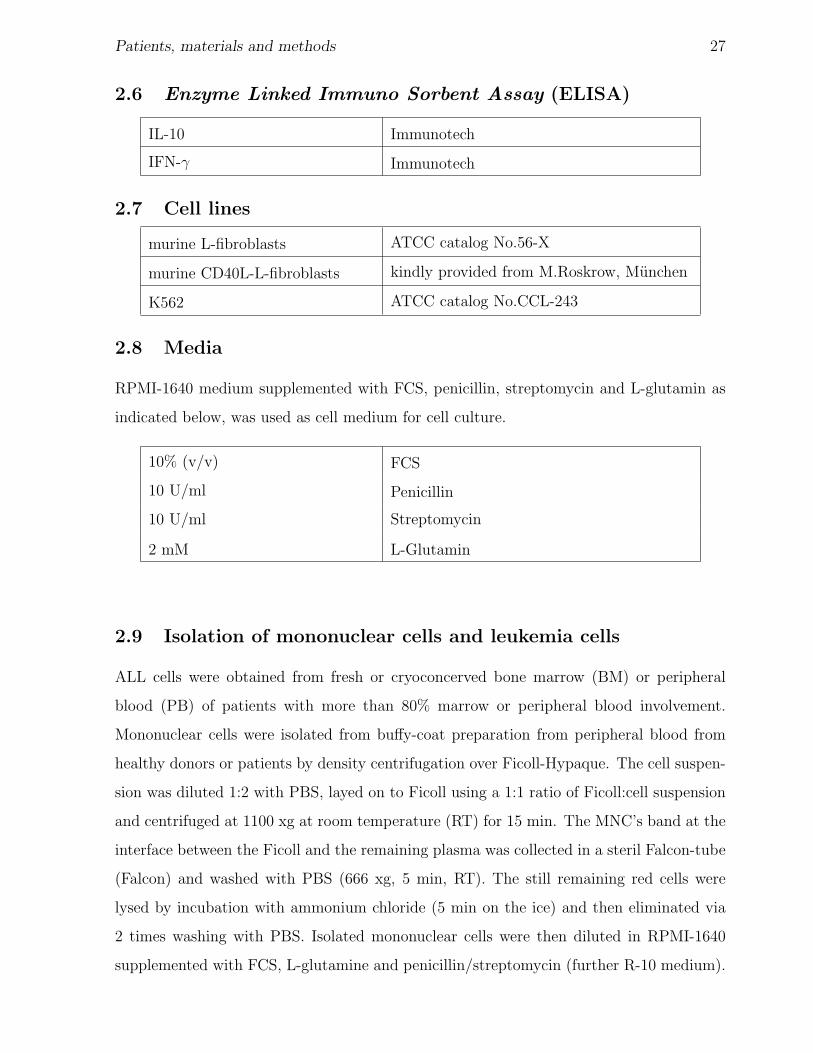
2.6 Enzyme Linked Immuno Sorbent Assay (ELISA)
IL-10 Immunotech
IFN-γ Immunotech
2.7 Cell lines
murine L-fibroblasts ATCC catalog No.56-X
murine CD40L-L-fibroblasts kindly provided from M.Roskrow, Munchen
K562 ATCC catalog No.CCL-243
2.8 Media
RPMI-1640 medium supplemented with FCS, penicillin, streptomycin and L-glutamin as
indicated below, was used as cell medium for cell culture.
10% (v/v) FCS
10 U/ml Penicillin
10 U/ml Streptomycin
2 mM L-Glutamin
2.9 Isolation of mononuclear cells and leukemia cells
ALL cells were obtained from fresh or cryoconcerved bone marrow (BM) or peripheral
blood (PB) of patients with more than 80% marrow or peripheral blood involvement.
Mononuclear cells were isolated from buffy-coat preparation from peripheral blood from
healthy donors or patients by density centrifugation over Ficoll-Hypaque. The cell suspen-
sion was diluted 1:2 with PBS, layed on to Ficoll using a 1:1 ratio of Ficoll:cell suspension
and centrifuged at 1100 xg at room temperature (RT) for 15 min. The MNC’s band at the
interface between the Ficoll and the remaining plasma was collected in a steril Falcon-tube
(Falcon) and washed with PBS (666 xg, 5 min, RT). The still remaining red cells were
lysed by incubation with ammonium chloride (5 min on the ice) and then eliminated via
2 times washing with PBS. Isolated mononuclear cells were then diluted in RPMI-1640
supplemented with FCS, L-glutamine and penicillin/streptomycin (further R-10 medium).
Patients, materials and methods 28
Cell viability was determined by trypan blue staining. Due to the impaired membrane
integrity dead cells take up the trupan blue dye and can be assessed by counting under a
microscope.
Methodically the sufficient number of leukemia cells is rapidly to obtain from bone mar-
row or peripheral blood of patients, whereas the maintenance of leukemia cells in culture
remains the major technical problem. We have observed that culture of leukemia cells
isolated from patients PB or BM that have been pre-incubated over 24 hours at room tem-
perature shown lower viability when compared to culture of fresh isolated leukemia cells.
The ALL cells were therefore isolated as soon as possible from fresh obtained BM or PB
samples.
2.10 Isolation of T lymphocytes
2.10.1 Production of neuraminidase-treated sheep erythrocytes
10ml sheep erythrocytes (Behring) were centrifuged at 1185 xg for 9 min and cell-free
supernatant was removed. The erythrocytes were then washed 2 times with PBS (1185 xg
for 9 min, RT). The erythrocytes were diluted in 25ml PBS and cocultivated with 0.5ml
neuraminidase for 2 hours at 37 ◦C. The erythrocytes were then washed 2 times with PBS.
The pelleted erythrocytes were diluted in 25ml of R-10 medium and stored before use at
4 ◦C.
2.10.2 T lymphocytes isolation
For the isolation of T lymphocytes mononuclear cells were isolated as described (see sub-
section 2.9, page 27) and diluted at concentration of 25 x 106 cells in 10ml of PBS. After
addition of neuraminidase-treated sheep erythrocytes (2ml) cells were pelleted by cen-
trifugation (132 xg, 6 min, RT) and incubated on ice for 1 hour. The cells were then
resuspended and subjected to a second Ficoll-density centrifugation. The T lymphocytes
were then sedimentated through Ficoll, due to their bounding with sheep erythrocytes.
Erythrocytes were lysed using ammonium chloride. The remaining T lymphocytes were
washed 3 times in PBS. Using trypan blue staining, viability was checked to be 95%. The
purity of the T-cell population was determined by staining with antibodies directed against
Patients, materials and methods 29
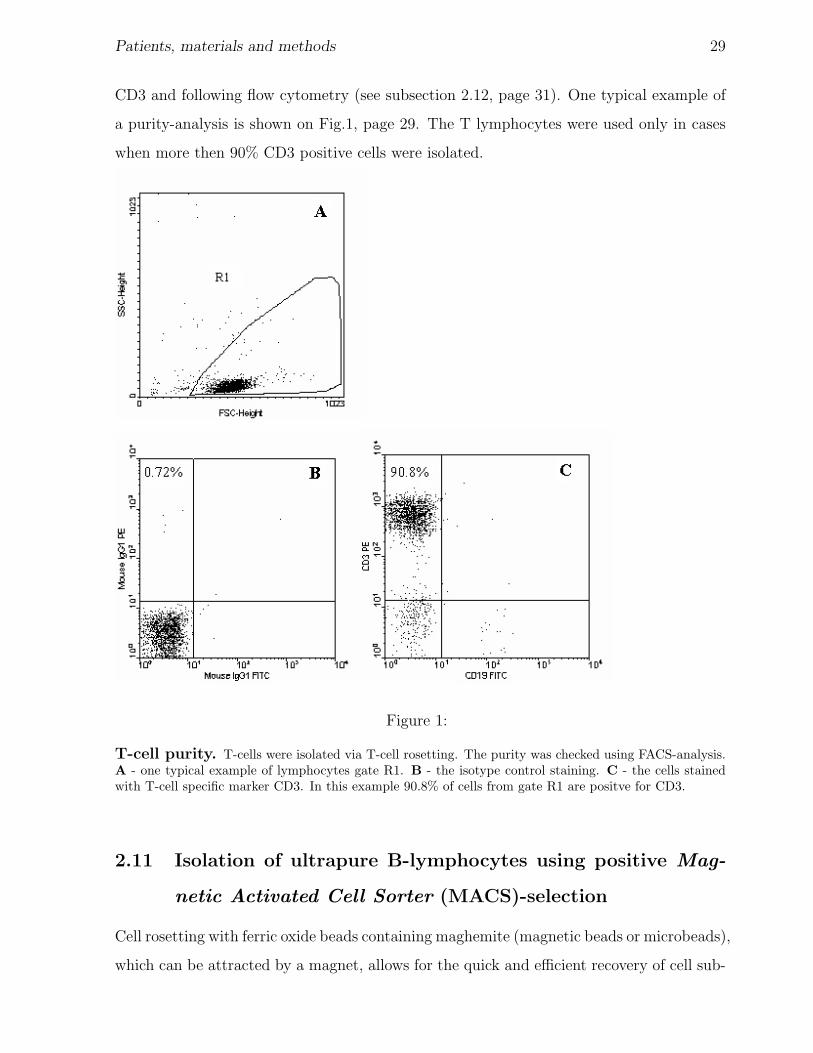
CD3 and following flow cytometry (see subsection 2.12, page 31). One typical example of
a purity-analysis is shown on Fig.1, page 29. The T lymphocytes were used only in cases
when more then 90% CD3 positive cells were isolated.
Figure 1:
T-cell purity. T-cells were isolated via T-cell rosetting. The purity was checked using FACS-analysis.A - one typical example of lymphocytes gate R1. B - the isotype control staining. C - the cells stainedwith T-cell specific marker CD3. In this example 90.8% of cells from gate R1 are positve for CD3.
2.11 Isolation of ultrapure B-lymphocytes using positive Mag-
netic Activated Cell Sorter (MACS)-selection
Cell rosetting with ferric oxide beads containing maghemite (magnetic beads or microbeads),
which can be attracted by a magnet, allows for the quick and efficient recovery of cell sub-
Patients, materials and methods 30
population. Selective binding of beads occurs if they have a specific antibodies coupled
to them (direct method). For MACS separation, cells are magnetically labeled with mi-
crobeads and separated on a column which is placed in the magnetic field of a MACS
separator. The magnetically labeled cells are retained in the column while the unlabeled
cells run through. After removal of the column from the magnetic field, magnetically
retained cells can be eluted as positively selected cell fraction.
2.11.1 Cell staining with antibodies-coupling magnetic beads
Mononuclear cells were isolated as described (see subsection 2.9, page 27) and pelleted
via centrifugation (666 xg, 6 min, RT). The supernatant was removed and the cell pellet
was resuspended in 80µl of MACS buffer (2mM EDTA, 0.5% BSA in PBS) and 20µl of
anti-CD19 microbeads per 107 total cells were added. After incubation for 15 min at 4 ◦C
cells were washed and diluted in 500µl MACS-buffer .
2.11.2 Magnetic cell separation
For MACS separation, cells are magnetically labeled with CD19 microbeads and separated
on a column which is placed in the magnetic field of a MACS separator. The magnet-
ically labeled CD19+ cells are retained in the column while the unlabeled CD19− cells
run through. After removal of the column from the magnetic field, the magnetically re-
tained CD19+ cells can be eluted as positively selected cell fraction. The positive selection
columns type MS+/MR+ for 104-108 positive cells were chosen. The columns were first
washed with 1ml MACS-buffer. The cell suspension in appropriate buffer amount was then
applied into the column. The magnetically labeled CD19+ cells are retained in the column
while the unlabeled CD19− cells run through. The column was washed with appropri-
ate amount (1-2ml) of buffer. The purity of positively selected cells was determined by
immunoflourescence staining and FACS-analysis (see 2.12, page 31). The B-lymphocytes
were used only in cases when more then 90% CD19 positive cells were isolated.
Patients, materials and methods 31
2.12 Surface and intracellular marker analysis by flow cytometry
using a Fluorescence Activated Cell Sorter (FACScan)
Flow cytometry measures optical and fluorescence characteristics of single cells. Physical
properties, such as size (represented by forward angle light scatter) and internal complexity
(represented by side-angle scatter) can resolve certain cell populations. Antibodies con-
jugated to fluorescent dyes can bind specific proteins on cell membranes or inside cells.
When labeled cells are passed through a light source, the fluorescent molecules are excited
to a higher energy state. Upon returning to their stable states, the fluorochromes emit
light energy at certain wavelengths. The use of multiple fluorochromes, each with similar
excitation wavelengths and different emission wavelengths (or ”colors”), allows several cell
properties to be measured simultaneously. Commonly used dyes include propidium iodide
(PI), phycoerythrin and fluorescein, although many other dyes are available. A single cell
suspension is hydrodynamically focused with sheath fluid to intersect an argon-ion laser.
Signals are collected by a forward angle light scatter detector (FSC), a side-scatter detec-
tor (SSC), and multiple fluorescence emission detectors: green (525 nm; FL1-detector), red
(578 nm; FL2-detector) and dark-red (680 nm; FL3-Detector). The signals are amplified
and converted to digital form for analysis and display on a computer screen. The FSC
parameter is the cell size measure, while the intracellular granularity can be assessed by
SSC. Using dot-plot-picture the dead cells could be separated from viable cells. PI-staining
can also be used to determine dead cells.
2.12.1 Staining of surface molecules
0.5-0.1x10⁶ cells were pelleted in polypropylene-tubes (Falcon) and the supernatant was
eliminated. The cells were then incubated with 15µl direct-conjugated antibodies 15 min in
dark at RT (direct staining). After washing with PBS (666 xg, 6 min, RT) cells were diluted
in 200µl of PBS. When non-conjugated antibodies were used (indirect staining) the cells
were stained in two steps. Cells stained as described above with non-conjugated antibodies
were then incubated in darkness with mouse-immunoglobulin-specific, fluorescence-labeled
secondary antibodies for 15 min at RT. Cells were washed twice with PBS (666 xg, 6 min,
RT), diluted in 200µl of PBS and stored at 4 ◦C before analysis. Nonspecific staining was
Patients, materials and methods 32
determined using FITC/PE-conjugated Ig control mAbs.
Determination of CD40, CD70, CD80, CD86, CD27 expression on ALL blasts was per-
formed as part of the routine laboratory leukemia immunophenotyping.
2.13 Detection of cytokine secretion by using Enzyme Linked
Immuno Sorbent Assay (ELISA)
The secretion of cytokines was determined using commercial ELISA kit (Immunotech).
Mitomycin C-treated (0.01mg/ml) unstimulated or CD40-stimulated leukemia cells were
cocultured in 24-well flat-bottom plates at concentration of 0.5 x 10⁶ cells/well in a final
volume of 1ml with allogeneic T-cells, obtained from buffy coat (1 x 10⁶ cells/well), in
presence or absence of blocking antibodies as indicated in the text. After 5 days of incuba-
tion at 37 ◦C in 5% CO2 supernatants were collected and stored at -80 ◦C till usage. The
96-well plates coated with antibodies against IFN-γ or IL-10 were used for IFN-γ and IL-10
determination, respectively. The 50µl of examined supernatants or human IFN-γ/IL-10 as
standard were placed into each well. Plates were incubated for 2 hours at RT. Plates were
further washed 3 times with washing buffer (0.05% Tween 80 in PBS). Next 50µl of bi-
otinylated antibodies to IFN-γ/IL-10 and 100µl of horseradish peroxidase conjugated with
streptavidin were added to each well. Plates were incubated for 30 min at RT and washed
3 times. After development with colorimetric reagent (100µl/well) for horseradish perox-
idase (tetramethylbensidin) at RT in the dark for 15 min, 50µl of stop solution (H2SO4)
was added to each well. Cytokine concentration in each well was determined by absorbance
reading with ELISA reader (TECAN) at the wavelength of 450nm.
2.14 Cultivation of cells
2.14.1 Cultivation of cell lines
The used cell lines (see subsection 2.7, page 27) were cultured in cell culture flasks (Corning
Costar) with R-10 medium (see subsection 2.8, page 27) at 37 ◦C in a 5% CO2, 95% air
humidified atmosphere. The cell lines were diluted with fresh R-10 medium one or two
times per week depending on cell-proliferation. In case of adhesive cell lines the medium
Patients, materials and methods 33
was removed and cells were then incubated with Trypsin/EDTA-solution (0.05%/0.02%
w/v; PAA) in the incubator at 37 ◦C for 2-5 min. These detached cells were diluted in
10ml medium and pelleted by centrifugation (666 xg, 5 min, RT). The pellet was dispensed
in new culture flasks in ratio from 1:3 to 1:10 (dependent on cell number).
2.14.2 Cryoconserving and thawing of cells
For cryoconservation cells were removed from flask, pelleted in 10ml medium (1400 rpm, 5
min, RT). Pellet was resuspended in 1.5ml FCS with 10% DMSO (Sigma). These cryocon-
served cells were stored in liquid nitrogen till usage. To defrost the cell lines, deeply frozen
cells were incubated for 2-5 min at 37 ◦C in water bath and resuspended in 15ml of R-10
medium. Cells were then washed by centrifugation (666 xg, 5 min, RT) and transfered into
culture flasks.
2.14.3 Stimulation of leukemia cells by CD40 cross-linking
Leukemia cells is difficult to culture because their high spontaneous death in vitro. The
number of dead cells may be increased in particular when using thawed cryoconserved or
not freshly isolated ALL cells. It is therefore important to isolate them carefuly, rapidly
and place them immediately in culture media and control the cell culture each day.
CD40L-expressing mouse fibroblasts and CD40L-negative mouse fibroblasts were treated
with mitomycin C (0.01 mg/ml) at 37 ◦C in 90 min and plated at concentration of 5 x
104 cells/well in 24-well plates in R-10 medium. Mitomycin C-treated fibroblasts were
incubated in plates at 37 ◦C in 5% CO2 for a minimum of 2 hours. Before use, plates
were washed twice with R-10 medium. the leukemia cells were placed in the plates on the
mitomycin C-treated fibroblasts at concentration of 1 x 10⁶/ml in R-10. On day 3-4, CD40-
stimulated leukemia cells and unstimulated leukeima cells were harvested, washed and used
for phenotypic and functional analysis. Cell-surface expression of different molecules was
determined by standard immunofluorencence staining with FITC/PE-conjugated mAbs
and by flow cytometry analysis with FACScan.
Patients, materials and methods 34
2.15 Primary Mixed Lymphocytes Reaction (MLR)
Mitomycin C-treated unstimulated or CD40-stimulated leukemia cells were used as stimu-
lator cells to induce the T-cell proliferation. Leukemia cells were placed at concentration
of 5 x 10⁴ cells/well in a final volume of 200µl with allogeneic T-cells, obtained from
buffy coat (1 x 10⁵ cells/well) in 96-well round-bottom plates. The cells were incubated
together for 5 days at 37 ◦C in 5% CO2. The culture medium used was R-10 medium.
All microculture were performed in triplicate. The blocking anti-CD80/ anti-CD86 and
anti-CD70 antibodies was added at the concentrations of 2 and 4µg/ml, respectively. Cells
were pulsed with 1µ Ci of [H3 - Thymidine (Amersham Bioscience) for the last 18 hours
of the culture period. Cells were harvested onto glass fiber filters (Dunn Labortechnik
GmbH) and the [H3]-incorporation (cpm) was measured by liquid scintillation spectropho-
tometry (Beckman). Stimulation index (SI) was calculated for each individual experiment
as follows:
SI =cpm(T− cells + ALL cells)
cpm(T− cells).
2.16 Generation of anti-leukemia-specific T-cell lines
The generation and expansion of autologous or allogeneic anti-leukemia-specific T-cell lines
was performed using methodology depicted in Fig. 2. As effector cells were used allo-
geneic or autologous PB cells or PB stem cells. The cells were first stimulated in presence
of IL-7 (10ng/ml) with CD40-stimulated or unstimulated leukemia cells in the absence
of IL-2. Cells were then cultured at a concentration of 2x10⁶/ml in 24-well plates in
RPMI supplemented with 5% human AB serum (further RPMI-HS5), glutamine, peni-
cillin/streptomycin at 37 ◦C. On day 3, fresh RPMI-HS5 media and IL-2 (50U/ml) were
added. On day 10 cells were harvested, washed and restimulated with CD40-stimulated or
unstimulated leukemia cells. The same sequence was repeated on day 20, as described in
Fig. 2.
Because the long-term culture always carries the risk of contamination, generation of CTLs
need more attention as short-term culture. Cells were placed in the middle on the plate,
and the other wells were filled with sterile medium. This have not only warned our culture
of contamination, but have also humidified the immediate area around the cells due to the
Patients, materials and methods 35
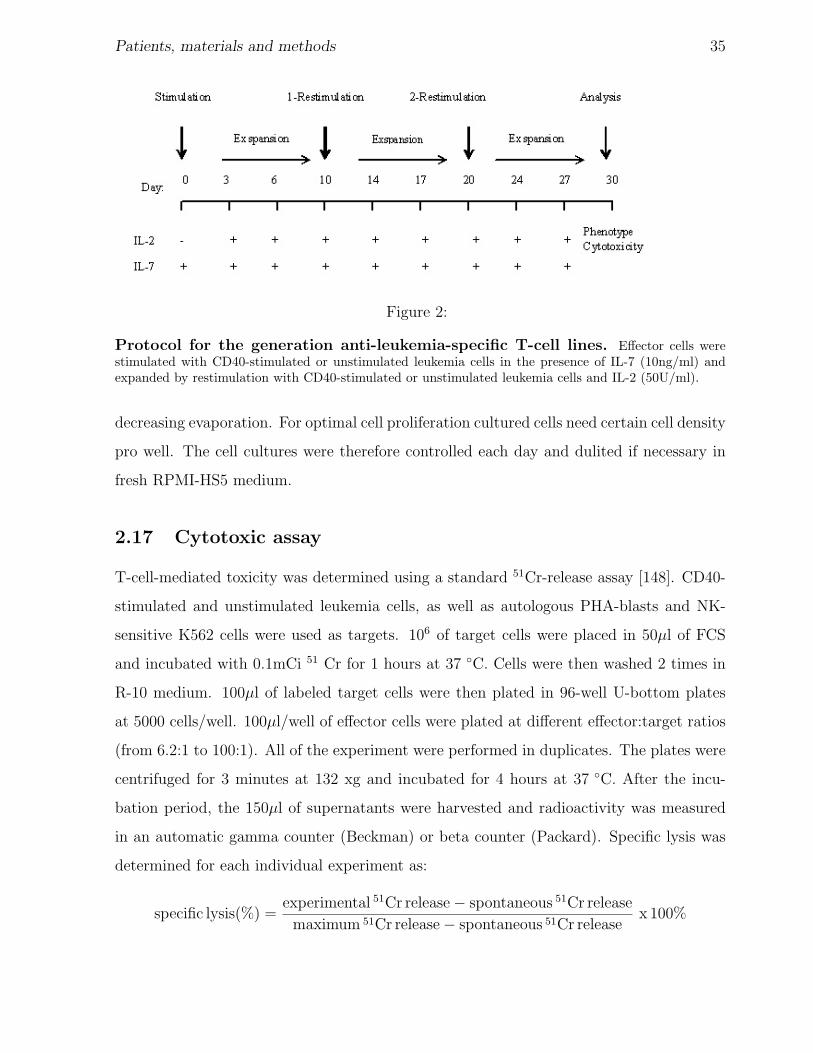
Figure 2:
Protocol for the generation anti-leukemia-specific T-cell lines. Effector cells werestimulated with CD40-stimulated or unstimulated leukemia cells in the presence of IL-7 (10ng/ml) andexpanded by restimulation with CD40-stimulated or unstimulated leukemia cells and IL-2 (50U/ml).
decreasing evaporation. For optimal cell proliferation cultured cells need certain cell density
pro well. The cell cultures were therefore controlled each day and dulited if necessary in
fresh RPMI-HS5 medium.
2.17 Cytotoxic assay
T-cell-mediated toxicity was determined using a standard 51Cr-release assay [148]. CD40-
stimulated and unstimulated leukemia cells, as well as autologous PHA-blasts and NK-
sensitive K562 cells were used as targets. 106 of target cells were placed in 50µl of FCS
and incubated with 0.1mCi 51 Cr for 1 hours at 37 ◦C. Cells were then washed 2 times in
R-10 medium. 100µl of labeled target cells were then plated in 96-well U-bottom plates
at 5000 cells/well. 100µl/well of effector cells were plated at different effector:target ratios
(from 6.2:1 to 100:1). All of the experiment were performed in duplicates. The plates were
centrifuged for 3 minutes at 132 xg and incubated for 4 hours at 37 ◦C. After the incu-
bation period, the 150µl of supernatants were harvested and radioactivity was measured
in an automatic gamma counter (Beckman) or beta counter (Packard). Specific lysis was
determined for each individual experiment as:
specific lysis(%) =experimental 51Cr release− spontaneous 51Cr release
maximum 51Cr release− spontaneous 51Cr releasex 100%
Patients, materials and methods 36
Maximum release was determined by the addition of 100µl of IPEGAL (Sigma, diluted
1:100 in Aqua dest) for the target cells. For detection of spontaneous release of 51 Cr from
target cells were incubated with 100µl of R-10 medium.
2.18 Apoptosis
2.18.1 Induction of apoptosis
Detection of apoptosis in culture of leukemia cells is particular difficult because of high
spontaneous death of leukemia cells in vitro. We have used only fresh isolated ALL cells
for apoptosis detection. After CD40-stimulation ALL blasts were very rapidly washed and
replaced in fresh medium for apoptosis induction.
Primary, CD40-stimulated or unstimulated ALL cells were harvested, washed, resuspended
in R-10 medium and plated in 96-well (flat-bottom, tissue non-treated) plates at concen-
tration 0.1x10⁶ cells per well. The cells were incubated for indicated times with 1 µg/ml
anti-CD95 (CH-11) antibodies in presence or absence of 0.1 µg/ml cycloheximide (CHX).
Anti-CD95 and CHX were added at the initiation of culture at 50µl/well to reach final
volume of 100µl per well.
2.18.2 Apoptosis detection
For detection of apoptosis, cells were collected in polypropylene tubes and washed with ice-
cold PBS (666 xg, 3 min, 4 ◦C). Supernatant was discarded, the cells were then resuspended
in ice-cold binding buffer (Immunotech) to 1x10⁶ cells/ml. 1µl of the annexin V-FITC
solution (Immunotech) and 5µl PI were added to the cells with subsequently incubation
for 10 minutes in the dark. The incubation with annexin V-FITC and PI has been carried
out on ice in order to arrest further apoptosis of the cells. The percentage of viable and
apoptotic cells was analysed by flow cytometry. One typical example of apoptosis detection
using flow cytometry is shown in Fig.3.
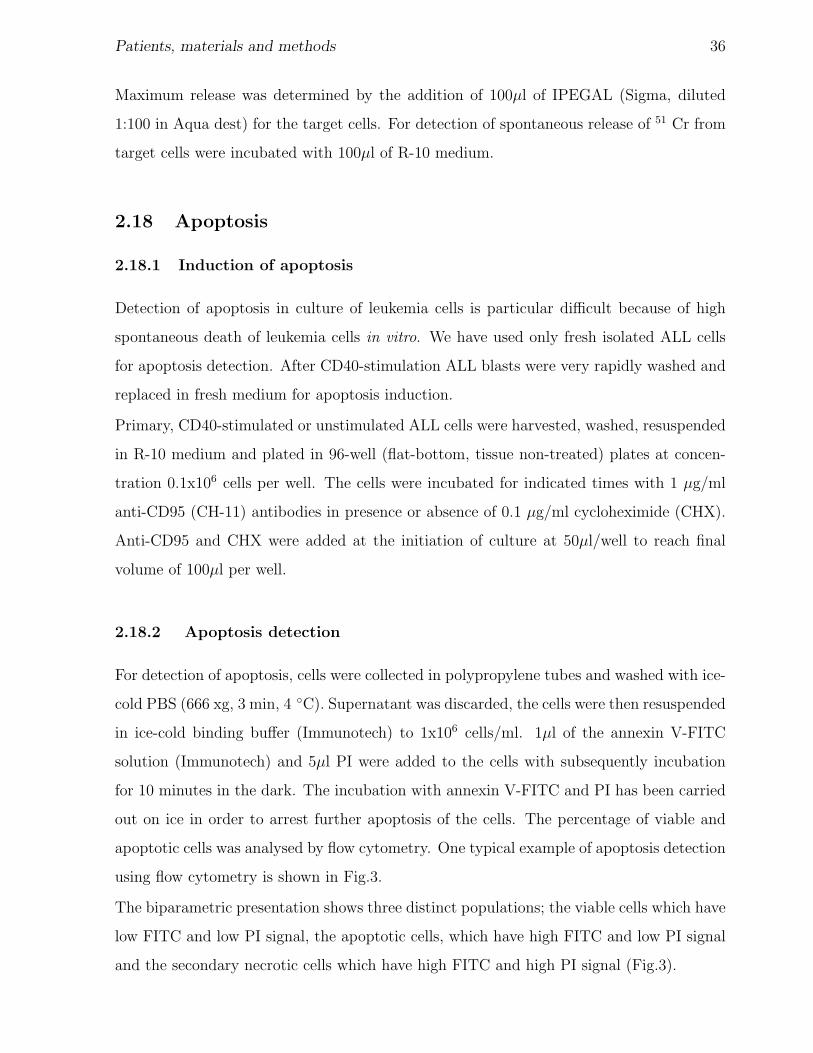
The biparametric presentation shows three distinct populations; the viable cells which have
low FITC and low PI signal, the apoptotic cells, which have high FITC and low PI signal
and the secondary necrotic cells which have high FITC and high PI signal (Fig.3).
Patients, materials and methods 37
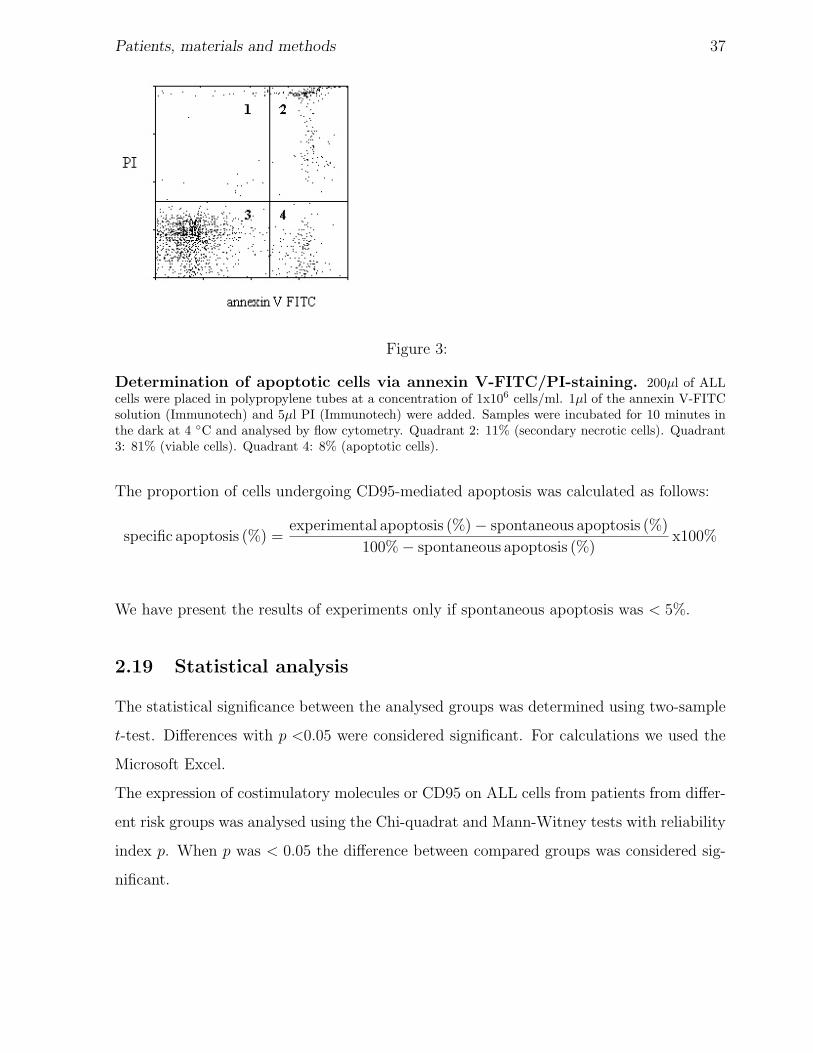
Figure 3:
Determination of apoptotic cells via annexin V-FITC/PI-staining. 200µl of ALLcells were placed in polypropylene tubes at a concentration of 1x10⁶ cells/ml. 1µl of the annexin V-FITCsolution (Immunotech) and 5µl PI (Immunotech) were added. Samples were incubated for 10 minutes inthe dark at 4 ◦C and analysed by flow cytometry. Quadrant 2: 11% (secondary necrotic cells). Quadrant3: 81% (viable cells). Quadrant 4: 8% (apoptotic cells).
The proportion of cells undergoing CD95-mediated apoptosis was calculated as follows:
specific apoptosis (%) =experimental apoptosis (%)− spontaneous apoptosis (%)
100%− spontaneous apoptosis (%)x100%
We have present the results of experiments only if spontaneous apoptosis was < 5%.
2.19 Statistical analysis
The statistical significance between the analysed groups was determined using two-sample
t-test. Differences with p <0.05 were considered significant. For calculations we used the
Microsoft Excel.
The expression of costimulatory molecules or CD95 on ALL cells from patients from differ-
ent risk groups was analysed using the Chi-quadrat and Mann-Witney tests with reliability
index p. When p was < 0.05 the difference between compared groups was considered sig-
nificant.
38
3 Results
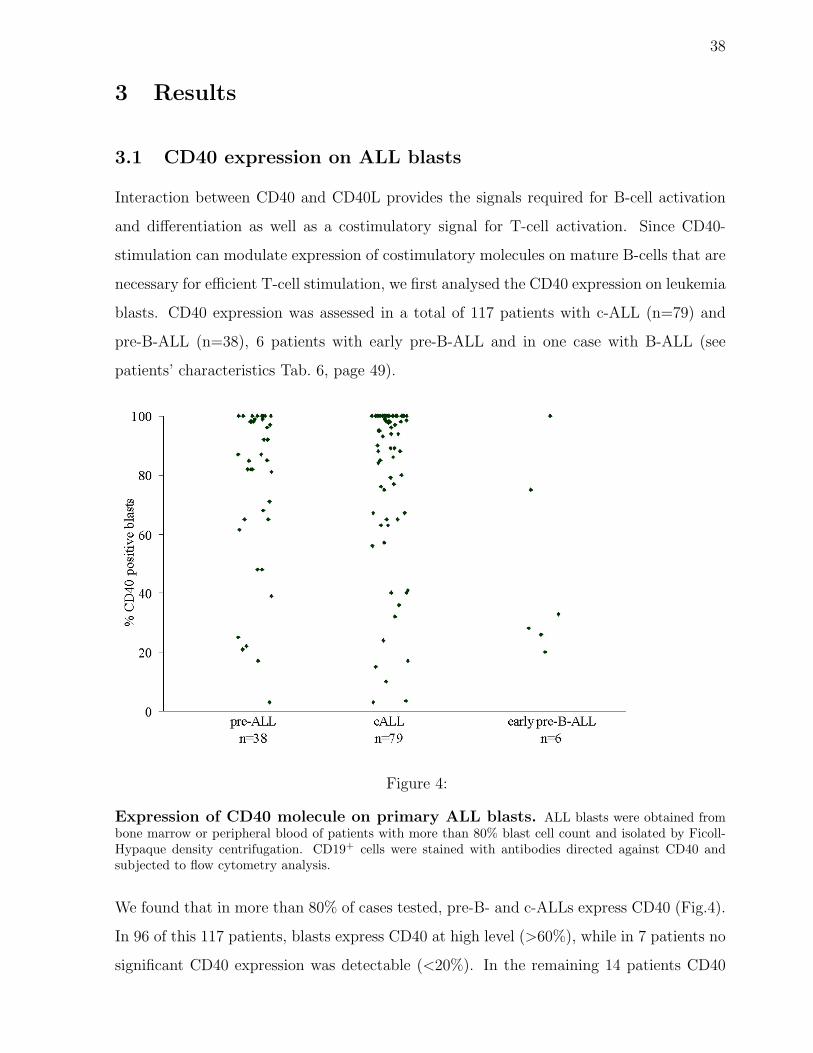
3.1 CD40 expression on ALL blasts
Interaction between CD40 and CD40L provides the signals required for B-cell activation
and differentiation as well as a costimulatory signal for T-cell activation. Since CD40-
stimulation can modulate expression of costimulatory molecules on mature B-cells that are
necessary for efficient T-cell stimulation, we first analysed the CD40 expression on leukemia
blasts. CD40 expression was assessed in a total of 117 patients with c-ALL (n=79) and
pre-B-ALL (n=38), 6 patients with early pre-B-ALL and in one case with B-ALL (see
patients’ characteristics Tab. 6, page 49).
Figure 4:
Expression of CD40 molecule on primary ALL blasts. ALL blasts were obtained frombone marrow or peripheral blood of patients with more than 80% blast cell count and isolated by Ficoll-Hypaque density centrifugation. CD19+ cells were stained with antibodies directed against CD40 andsubjected to flow cytometry analysis.
We found that in more than 80% of cases tested, pre-B- and c-ALLs express CD40 (Fig.4).
In 96 of this 117 patients, blasts express CD40 at high level (>60%), while in 7 patients no
significant CD40 expression was detectable (<20%). In the remaining 14 patients CD40
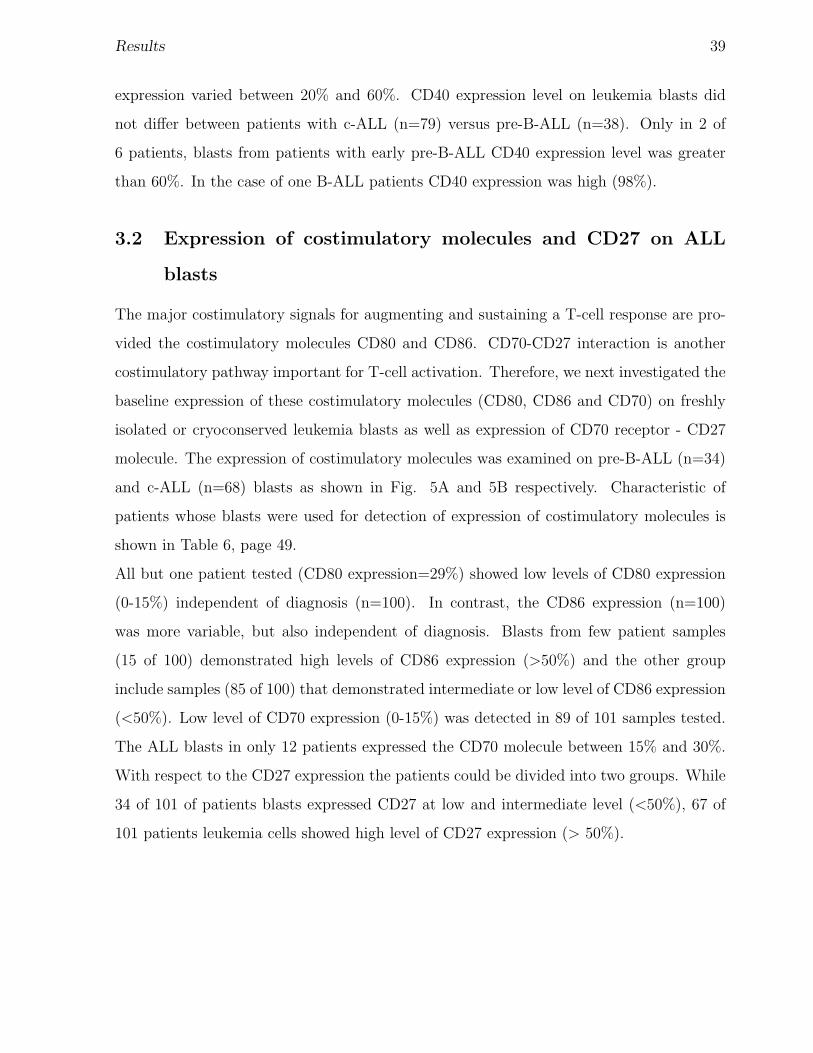
Results 39
expression varied between 20% and 60%. CD40 expression level on leukemia blasts did
not differ between patients with c-ALL (n=79) versus pre-B-ALL (n=38). Only in 2 of
6 patients, blasts from patients with early pre-B-ALL CD40 expression level was greater
than 60%. In the case of one B-ALL patients CD40 expression was high (98%).
3.2 Expression of costimulatory molecules and CD27 on ALL
blasts
The major costimulatory signals for augmenting and sustaining a T-cell response are pro-
vided the costimulatory molecules CD80 and CD86. CD70-CD27 interaction is another
costimulatory pathway important for T-cell activation. Therefore, we next investigated the
baseline expression of these costimulatory molecules (CD80, CD86 and CD70) on freshly
isolated or cryoconserved leukemia blasts as well as expression of CD70 receptor - CD27
molecule. The expression of costimulatory molecules was examined on pre-B-ALL (n=34)
and c-ALL (n=68) blasts as shown in Fig. 5A and 5B respectively. Characteristic of
patients whose blasts were used for detection of expression of costimulatory molecules is
shown in Table 6, page 49.
All but one patient tested (CD80 expression=29%) showed low levels of CD80 expression
(0-15%) independent of diagnosis (n=100). In contrast, the CD86 expression (n=100)
was more variable, but also independent of diagnosis. Blasts from few patient samples
(15 of 100) demonstrated high levels of CD86 expression (>50%) and the other group
include samples (85 of 100) that demonstrated intermediate or low level of CD86 expression
(<50%). Low level of CD70 expression (0-15%) was detected in 89 of 101 samples tested.
The ALL blasts in only 12 patients expressed the CD70 molecule between 15% and 30%.
With respect to the CD27 expression the patients could be divided into two groups. While
34 of 101 of patients blasts expressed CD27 at low and intermediate level (<50%), 67 of
101 patients leukemia cells showed high level of CD27 expression (> 50%).
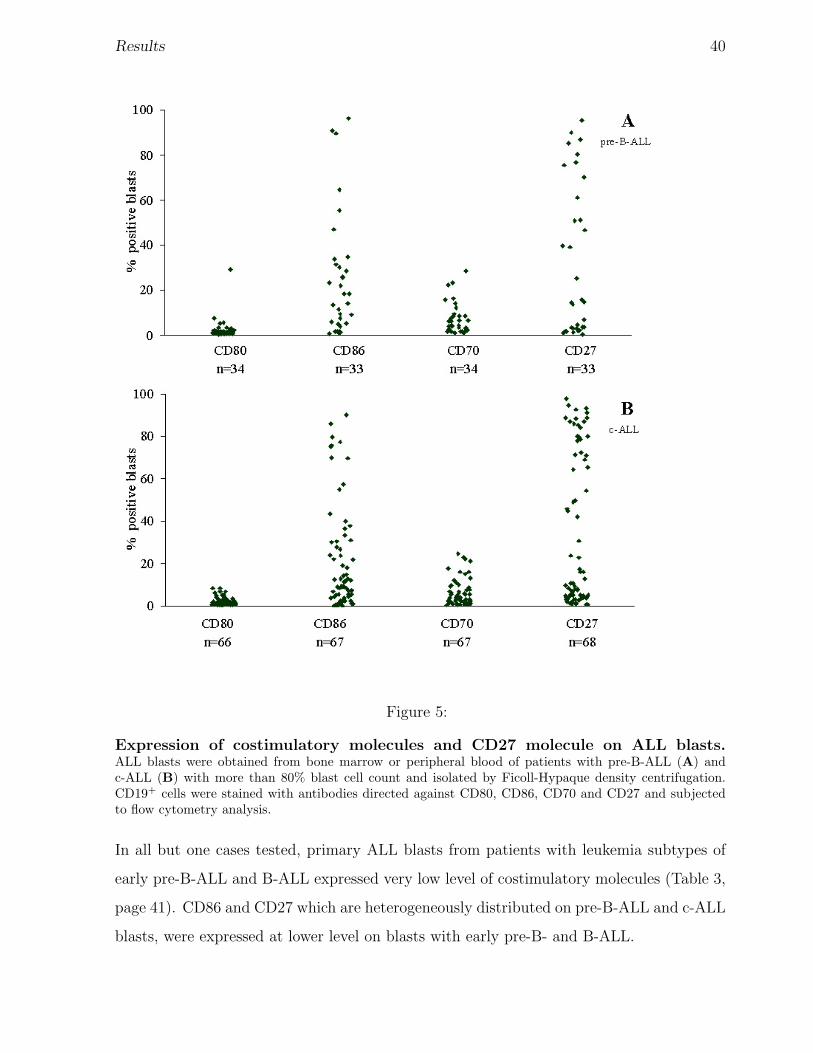
Results 40
Figure 5:
Expression of costimulatory molecules and CD27 molecule on ALL blasts.ALL blasts were obtained from bone marrow or peripheral blood of patients with pre-B-ALL (A) andc-ALL (B) with more than 80% blast cell count and isolated by Ficoll-Hypaque density centrifugation.CD19+ cells were stained with antibodies directed against CD80, CD86, CD70 and CD27 and subjectedto flow cytometry analysis.
In all but one cases tested, primary ALL blasts from patients with leukemia subtypes of
early pre-B-ALL and B-ALL expressed very low level of costimulatory molecules (Table 3,
page 41). CD86 and CD27 which are heterogeneously distributed on pre-B-ALL and c-ALL
blasts, were expressed at lower level on blasts with early pre-B- and B-ALL.
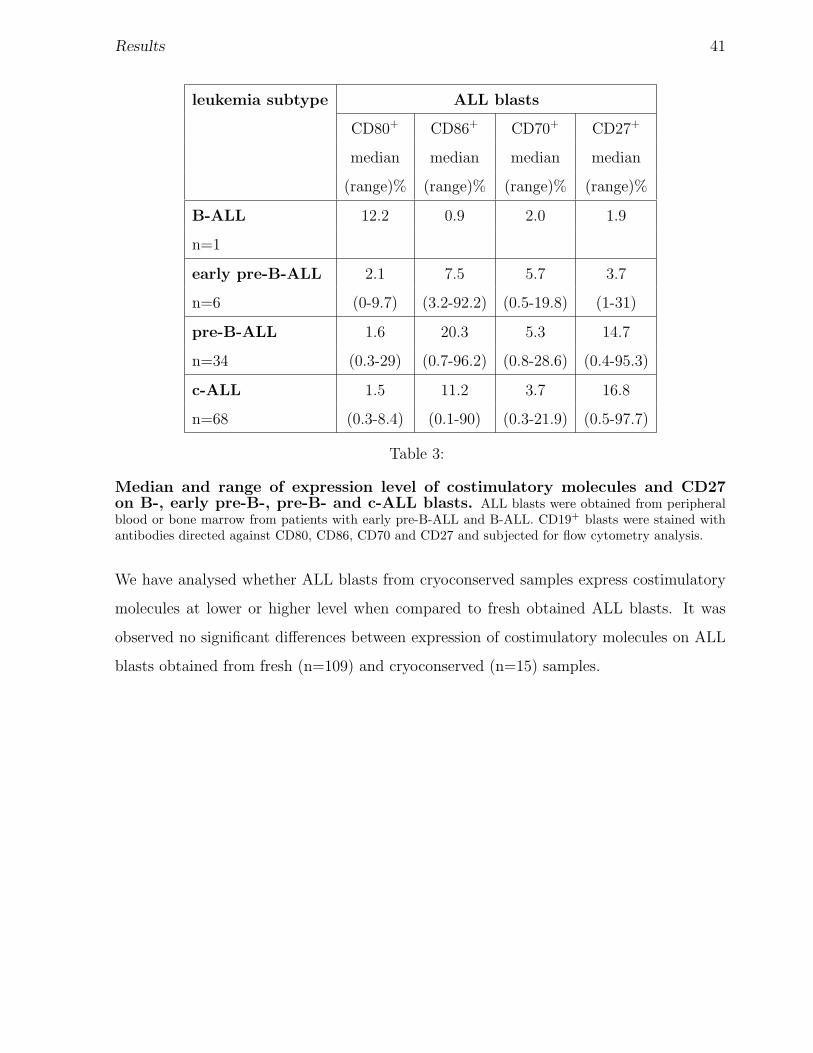
Results 41
leukemia subtype ALL blasts
CD80+ CD86+ CD70+ CD27+
median median median median
(range)% (range)% (range)% (range)%
B-ALL 12.2 0.9 2.0 1.9
n=1
early pre-B-ALL 2.1 7.5 5.7 3.7
n=6 (0-9.7) (3.2-92.2) (0.5-19.8) (1-31)
pre-B-ALL 1.6 20.3 5.3 14.7
n=34 (0.3-29) (0.7-96.2) (0.8-28.6) (0.4-95.3)
c-ALL 1.5 11.2 3.7 16.8
n=68 (0.3-8.4) (0.1-90) (0.3-21.9) (0.5-97.7)
Table 3:
Median and range of expression level of costimulatory molecules and CD27on B-, early pre-B-, pre-B- and c-ALL blasts. ALL blasts were obtained from peripheralblood or bone marrow from patients with early pre-B-ALL and B-ALL. CD19+ blasts were stained withantibodies directed against CD80, CD86, CD70 and CD27 and subjected for flow cytometry analysis.
We have analysed whether ALL blasts from cryoconserved samples express costimulatory
molecules at lower or higher level when compared to fresh obtained ALL blasts. It was
observed no significant differences between expression of costimulatory molecules on ALL
blasts obtained from fresh (n=109) and cryoconserved (n=15) samples.
Results 42
3.3 Stimulation of ALL blasts by CD40-cross-linking
Since most of the examined leukemia blasts express CD40 (Fig.4, page 38), we investigated
whether CD40-stimulation modulates the expression of the costimulatory molecules CD80,
CD86, CD70 and CD27. Due to low survival of leukemia cells cultured in the absence
of feeder cells, murine fibroblasts were used as feeder cells in our experimental system.
To investigate the modulation of costimulatory molecules, ALL blasts were cocultivated
with mitomycin C-treated CD40L-expressing mouse fibroblasts (CD40L+-fibroblasts) for
3-4 days. As a control, non-transfected CD40L-negative fibroblasts (CD40L−-fibroblasts)
were used for coculture. In subsequent experiments, ALL blasts cocultured in the presence
of CD40L+-fibroblasts are reffered as CD40-stimulated ALL blasts, ALL cells cocultured
in the presence of CD40L−-fibroblasts are designated as unstimulated ALL cells.
ALL blasts from 43 patients with pre-B-ALL (n=15) and c-ALL (n=29) and 4 patient with
early pre-B-ALL (see patients characteristic, Tab. 8, page 51) were included in the experi-
ments. Expression of costimulatory molecules was not assessed in cases when cell viability
was low (<20% of viable cells) after 3-4 days of culture. In few cases it was not possible
to assess the expression of each of the molecules tested (CD80, CD86, CD70 and CD27)
after CD40-stimulation due to a low initial cell number. Results were included for analysis
only in cases when determination of the tested molecules was available on primary blasts
and following CD40 stimulation. An assessment following culture on CD40L−-fibroblasts
was not possible in individual cases due to low viability under this culture condition.
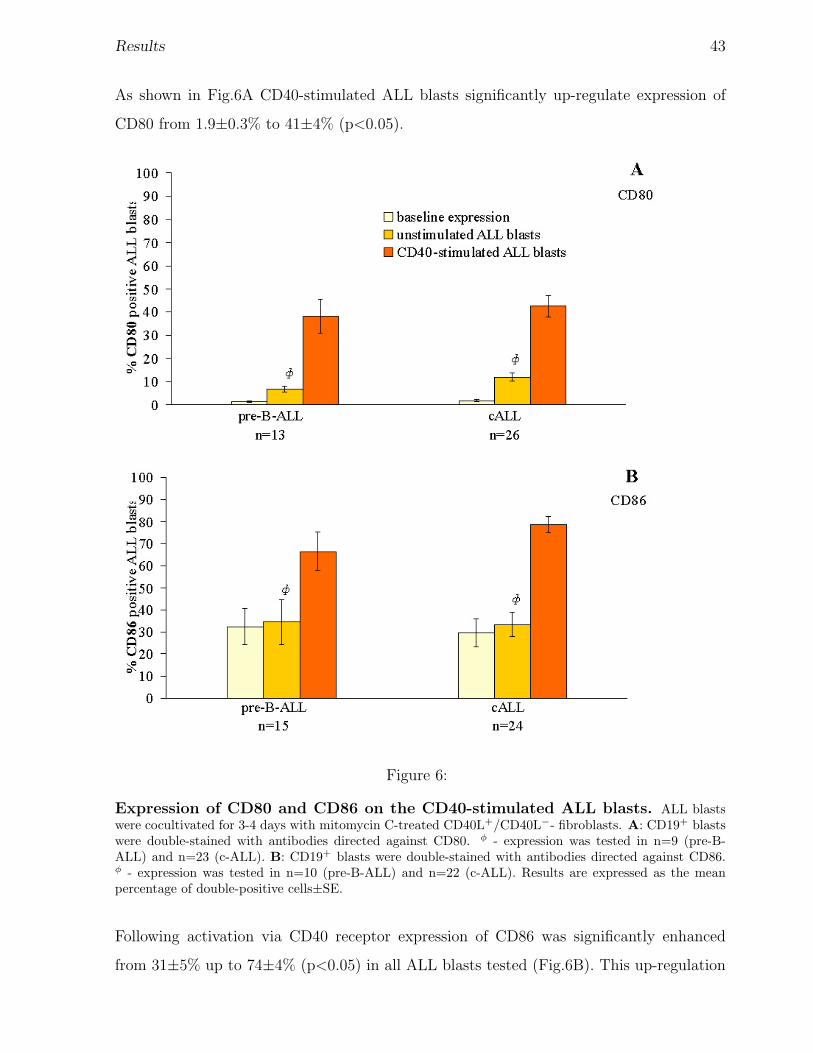
Results 43
As shown in Fig.6A CD40-stimulated ALL blasts significantly up-regulate expression of
CD80 from 1.9±0.3% to 41±4% (p<0.05).
Figure 6:
Expression of CD80 and CD86 on the CD40-stimulated ALL blasts. ALL blastswere cocultivated for 3-4 days with mitomycin C-treated CD40L+/CD40L−- fibroblasts. A: CD19+ blastswere double-stained with antibodies directed against CD80. φ - expression was tested in n=9 (pre-B-ALL) and n=23 (c-ALL). B: CD19+ blasts were double-stained with antibodies directed against CD86.φ - expression was tested in n=10 (pre-B-ALL) and n=22 (c-ALL). Results are expressed as the meanpercentage of double-positive cells±SE.
Following activation via CD40 receptor expression of CD86 was significantly enhanced
from 31±5% up to 74±4% (p<0.05) in all ALL blasts tested (Fig.6B). This up-regulation
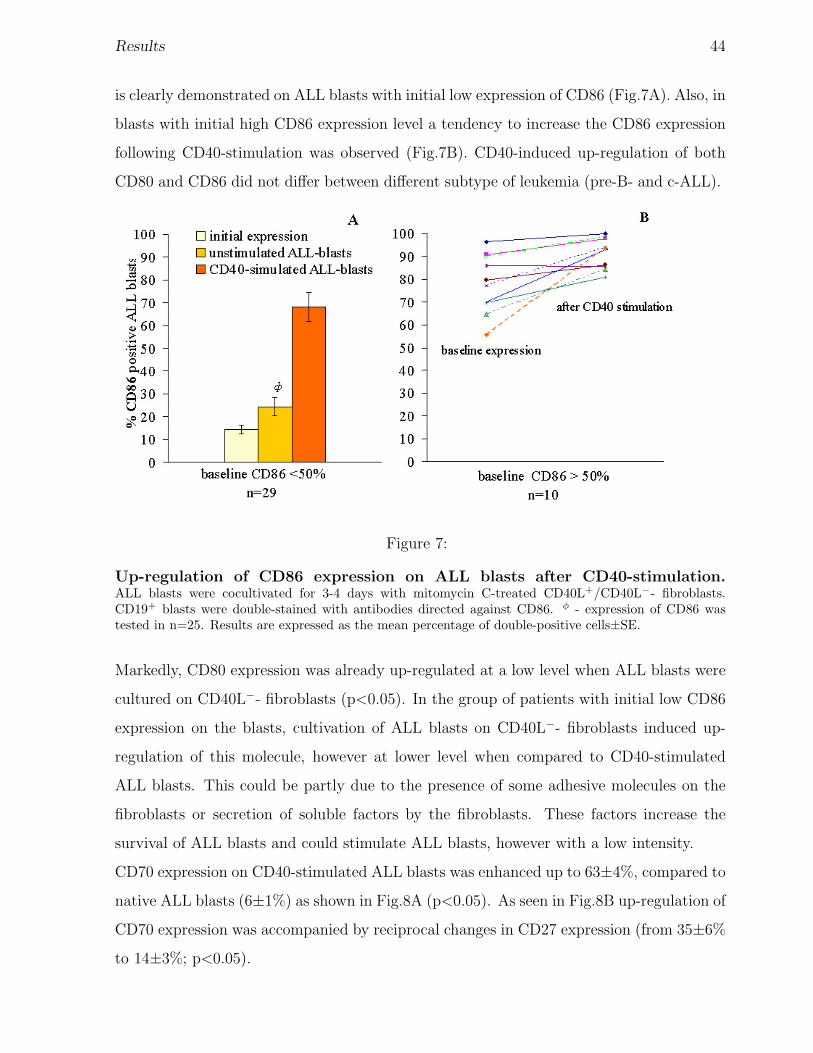
Results 44
is clearly demonstrated on ALL blasts with initial low expression of CD86 (Fig.7A). Also, in
blasts with initial high CD86 expression level a tendency to increase the CD86 expression
following CD40-stimulation was observed (Fig.7B). CD40-induced up-regulation of both
CD80 and CD86 did not differ between different subtype of leukemia (pre-B- and c-ALL).
Figure 7:
Up-regulation of CD86 expression on ALL blasts after CD40-stimulation.ALL blasts were cocultivated for 3-4 days with mitomycin C-treated CD40L+/CD40L−- fibroblasts.CD19+ blasts were double-stained with antibodies directed against CD86. φ - expression of CD86 wastested in n=25. Results are expressed as the mean percentage of double-positive cells±SE.
Markedly, CD80 expression was already up-regulated at a low level when ALL blasts were
cultured on CD40L−- fibroblasts (p<0.05). In the group of patients with initial low CD86
expression on the blasts, cultivation of ALL blasts on CD40L−- fibroblasts induced up-
regulation of this molecule, however at lower level when compared to CD40-stimulated
ALL blasts. This could be partly due to the presence of some adhesive molecules on the
fibroblasts or secretion of soluble factors by the fibroblasts. These factors increase the
survival of ALL blasts and could stimulate ALL blasts, however with a low intensity.
CD70 expression on CD40-stimulated ALL blasts was enhanced up to 63±4%, compared to
native ALL blasts (6±1%) as shown in Fig.8A (p<0.05). As seen in Fig.8B up-regulation of
CD70 expression was accompanied by reciprocal changes in CD27 expression (from 35±6%
to 14±3%; p<0.05).
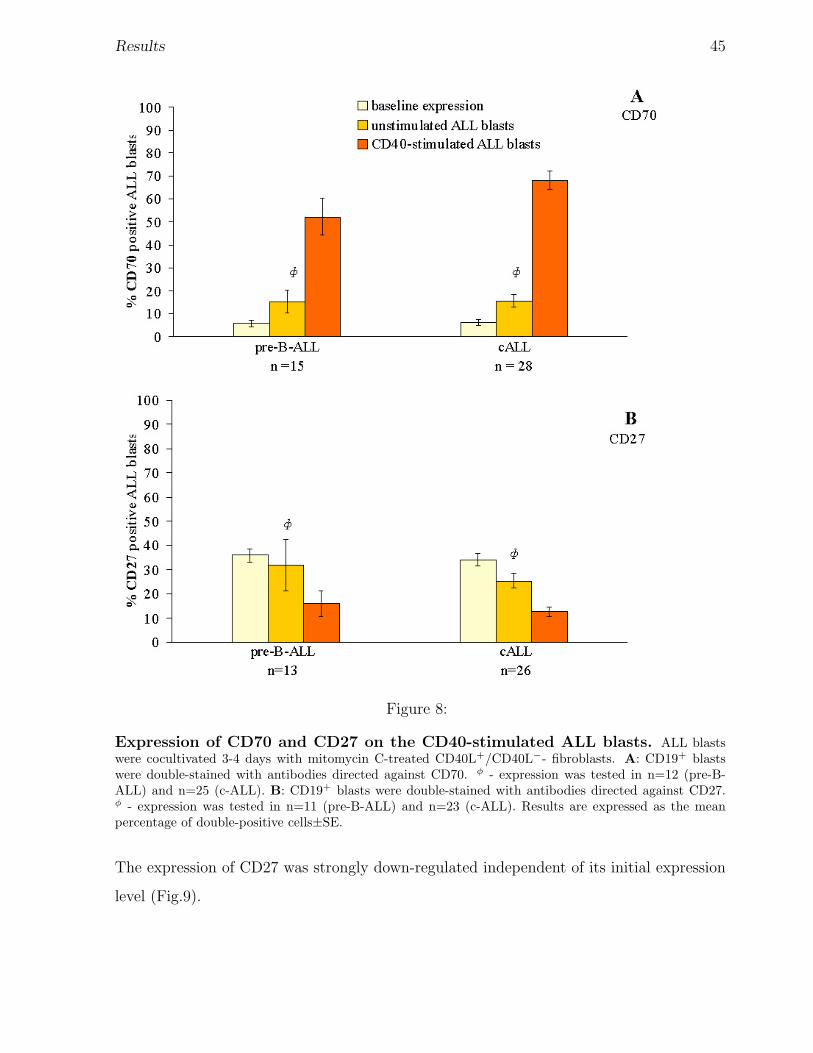
Results 45
Figure 8:
Expression of CD70 and CD27 on the CD40-stimulated ALL blasts. ALL blastswere cocultivated 3-4 days with mitomycin C-treated CD40L+/CD40L−- fibroblasts. A: CD19+ blastswere double-stained with antibodies directed against CD70. φ - expression was tested in n=12 (pre-B-ALL) and n=25 (c-ALL). B: CD19+ blasts were double-stained with antibodies directed against CD27.φ - expression was tested in n=11 (pre-B-ALL) and n=23 (c-ALL). Results are expressed as the meanpercentage of double-positive cells±SE.
The expression of CD27 was strongly down-regulated independent of its initial expression
level (Fig.9).
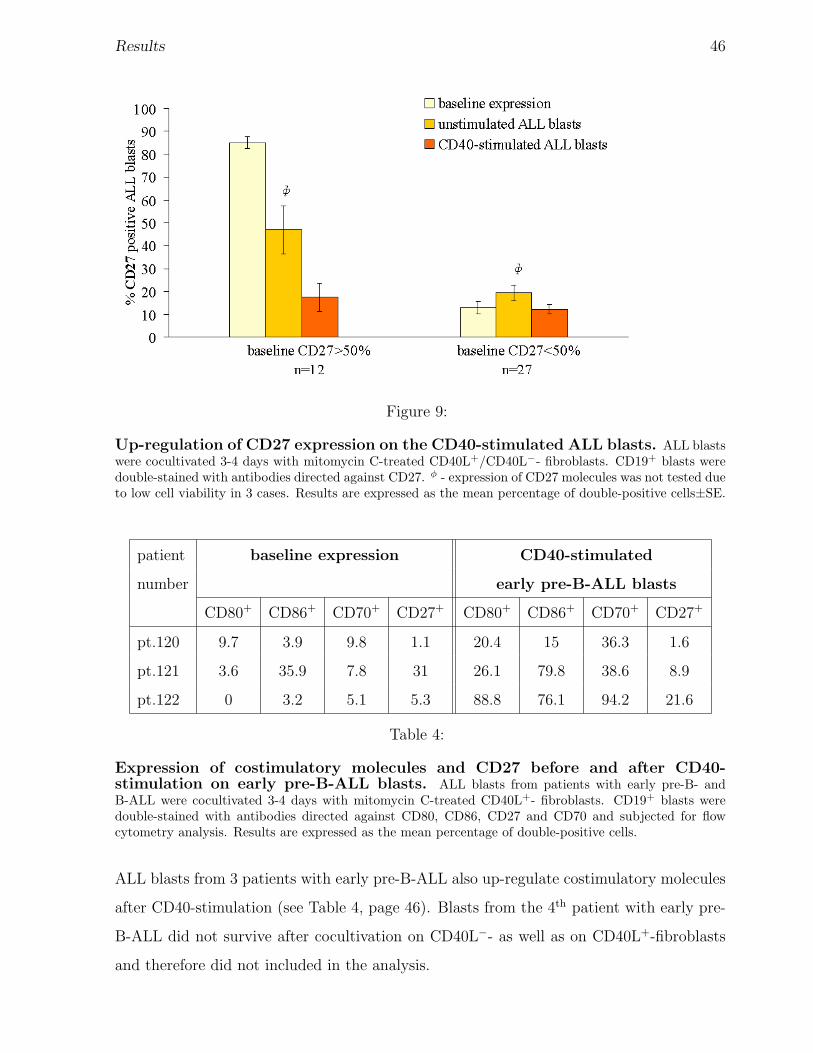
Results 46
Figure 9:
Up-regulation of CD27 expression on the CD40-stimulated ALL blasts. ALL blastswere cocultivated 3-4 days with mitomycin C-treated CD40L+/CD40L−- fibroblasts. CD19+ blasts weredouble-stained with antibodies directed against CD27. φ - expression of CD27 molecules was not tested dueto low cell viability in 3 cases. Results are expressed as the mean percentage of double-positive cells±SE.
patient baseline expression CD40-stimulated
number early pre-B-ALL blasts
CD80+ CD86+ CD70+ CD27+ CD80+ CD86+ CD70+ CD27+
pt.120 9.7 3.9 9.8 1.1 20.4 15 36.3 1.6
pt.121 3.6 35.9 7.8 31 26.1 79.8 38.6 8.9
pt.122 0 3.2 5.1 5.3 88.8 76.1 94.2 21.6
Table 4:
Expression of costimulatory molecules and CD27 before and after CD40-stimulation on early pre-B-ALL blasts. ALL blasts from patients with early pre-B- andB-ALL were cocultivated 3-4 days with mitomycin C-treated CD40L+- fibroblasts. CD19+ blasts weredouble-stained with antibodies directed against CD80, CD86, CD27 and CD70 and subjected for flowcytometry analysis. Results are expressed as the mean percentage of double-positive cells.
ALL blasts from 3 patients with early pre-B-ALL also up-regulate costimulatory molecules
after CD40-stimulation (see Table 4, page 46). Blasts from the 4th patient with early pre-
B-ALL did not survive after cocultivation on CD40L−- as well as on CD40L+-fibroblasts
and therefore did not included in the analysis.
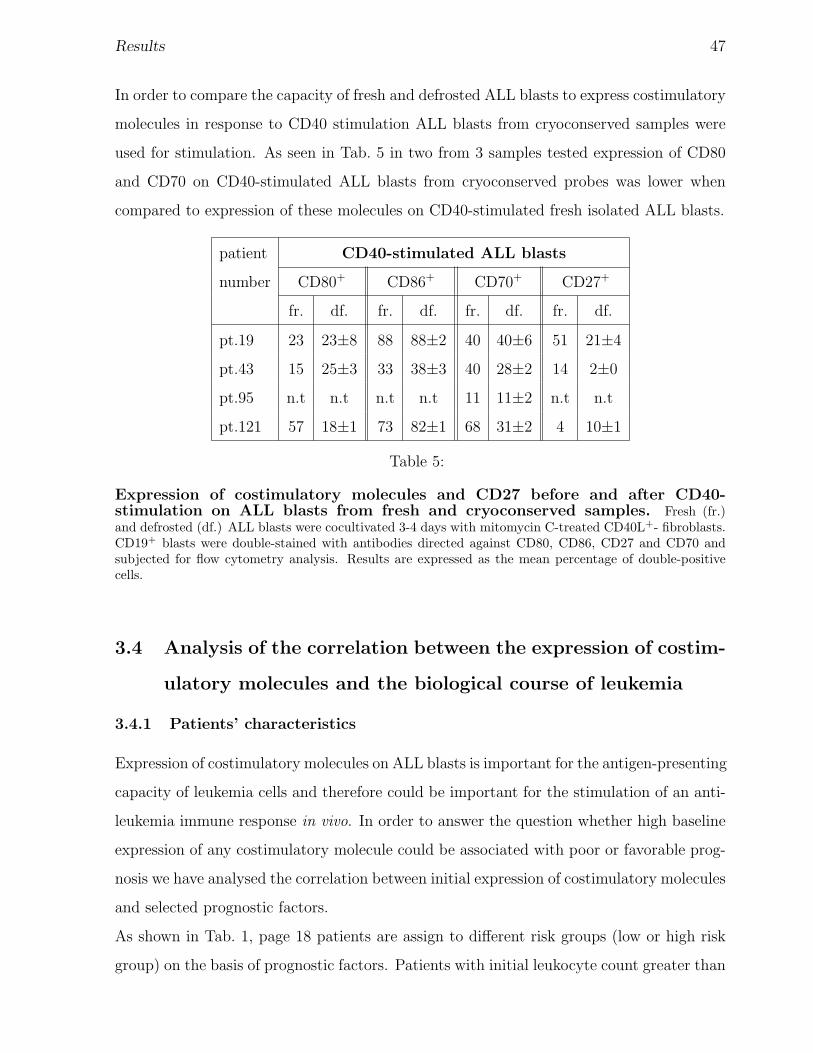
Results 47
In order to compare the capacity of fresh and defrosted ALL blasts to express costimulatory
molecules in response to CD40 stimulation ALL blasts from cryoconserved samples were
used for stimulation. As seen in Tab. 5 in two from 3 samples tested expression of CD80
and CD70 on CD40-stimulated ALL blasts from cryoconserved probes was lower when
compared to expression of these molecules on CD40-stimulated fresh isolated ALL blasts.
patient CD40-stimulated ALL blasts
number CD80+ CD86+ CD70+ CD27+
fr. df. fr. df. fr. df. fr. df.
pt.19 23 23±8 88 88±2 40 40±6 51 21±4
pt.43 15 25±3 33 38±3 40 28±2 14 2±0
pt.95 n.t n.t n.t n.t 11 11±2 n.t n.t
pt.121 57 18±1 73 82±1 68 31±2 4 10±1
Table 5:
Expression of costimulatory molecules and CD27 before and after CD40-stimulation on ALL blasts from fresh and cryoconserved samples. Fresh (fr.)and defrosted (df.) ALL blasts were cocultivated 3-4 days with mitomycin C-treated CD40L+- fibroblasts.CD19+ blasts were double-stained with antibodies directed against CD80, CD86, CD27 and CD70 andsubjected for flow cytometry analysis. Results are expressed as the mean percentage of double-positivecells.
3.4 Analysis of the correlation between the expression of costim-
ulatory molecules and the biological course of leukemia
3.4.1 Patients’ characteristics
Expression of costimulatory molecules on ALL blasts is important for the antigen-presenting
capacity of leukemia cells and therefore could be important for the stimulation of an anti-
leukemia immune response in vivo. In order to answer the question whether high baseline
expression of any costimulatory molecule could be associated with poor or favorable prog-
nosis we have analysed the correlation between initial expression of costimulatory molecules
and selected prognostic factors.
As shown in Tab. 1, page 18 patients are assign to different risk groups (low or high risk
group) on the basis of prognostic factors. Patients with initial leukocyte count greater than
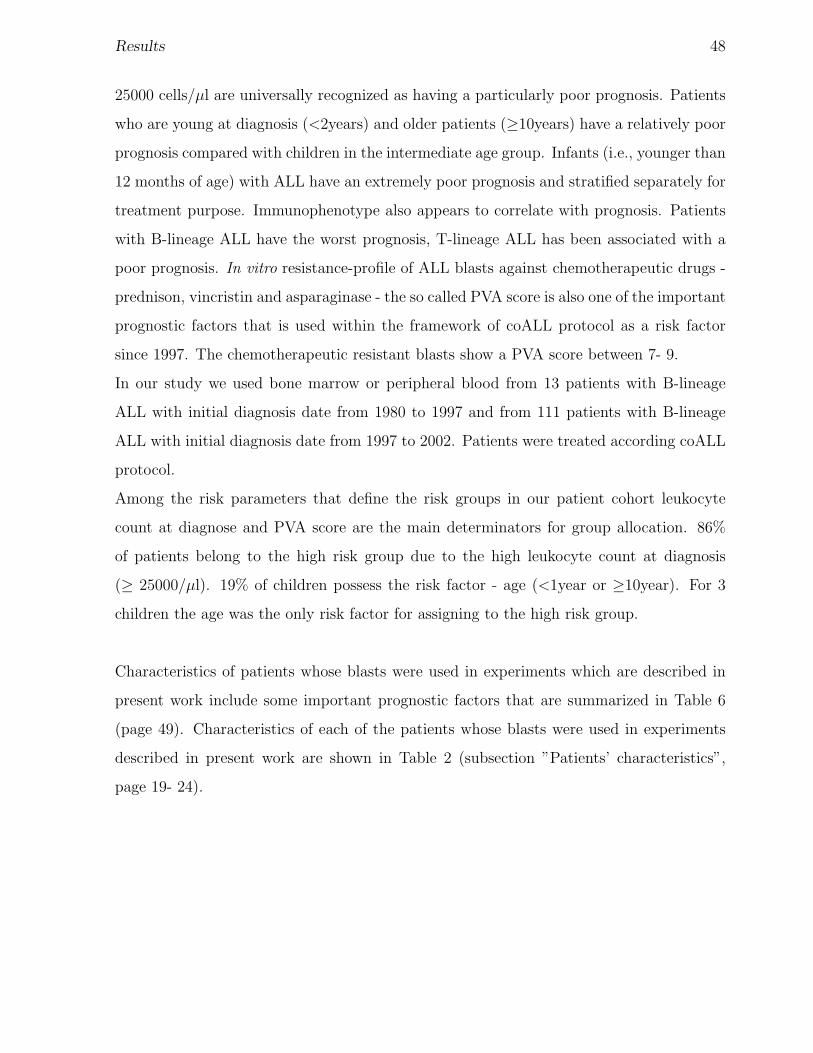
Results 48
25000 cells/µl are universally recognized as having a particularly poor prognosis. Patients
who are young at diagnosis (<2years) and older patients (≥10years) have a relatively poor
prognosis compared with children in the intermediate age group. Infants (i.e., younger than
12 months of age) with ALL have an extremely poor prognosis and stratified separately for
treatment purpose. Immunophenotype also appears to correlate with prognosis. Patients
with B-lineage ALL have the worst prognosis, T-lineage ALL has been associated with a
poor prognosis. In vitro resistance-profile of ALL blasts against chemotherapeutic drugs -
prednison, vincristin and asparaginase - the so called PVA score is also one of the important
prognostic factors that is used within the framework of coALL protocol as a risk factor
since 1997. The chemotherapeutic resistant blasts show a PVA score between 7- 9.
In our study we used bone marrow or peripheral blood from 13 patients with B-lineage
ALL with initial diagnosis date from 1980 to 1997 and from 111 patients with B-lineage
ALL with initial diagnosis date from 1997 to 2002. Patients were treated according coALL
protocol.
Among the risk parameters that define the risk groups in our patient cohort leukocyte
count at diagnose and PVA score are the main determinators for group allocation. 86%
of patients belong to the high risk group due to the high leukocyte count at diagnosis
(≥ 25000/µl). 19% of children possess the risk factor - age (<1year or ≥10year). For 3
children the age was the only risk factor for assigning to the high risk group.
Characteristics of patients whose blasts were used in experiments which are described in
present work include some important prognostic factors that are summarized in Table 6
(page 49). Characteristics of each of the patients whose blasts were used in experiments
described in present work are shown in Table 2 (subsection ”Patients’ characteristics”,
page 19- 24).
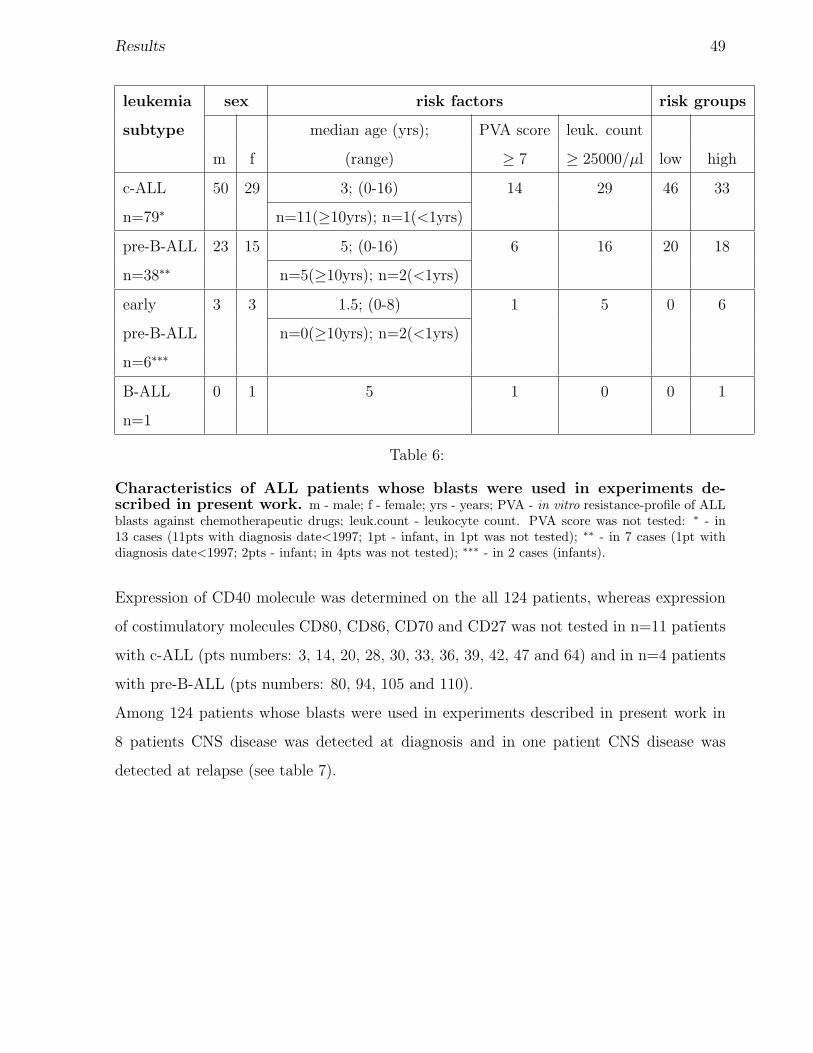
Results 49
leukemia sex risk factors risk groups
subtype median age (yrs); PVA score leuk. count
m f (range) ≥ 7 ≥ 25000/µl low high
c-ALL 50 29 3; (0-16) 14 29 46 33
n=79∗ n=11(≥10yrs); n=1(<1yrs)
pre-B-ALL 23 15 5; (0-16) 6 16 20 18
n=38∗∗ n=5(≥10yrs); n=2(<1yrs)
early 3 3 1.5; (0-8) 1 5 0 6
pre-B-ALL n=0(≥10yrs); n=2(<1yrs)
n=6∗∗∗
B-ALL 0 1 5 1 0 0 1
n=1
Table 6:
Characteristics of ALL patients whose blasts were used in experiments de-scribed in present work. m - male; f - female; yrs - years; PVA - in vitro resistance-profile of ALLblasts against chemotherapeutic drugs; leuk.count - leukocyte count. PVA score was not tested: ∗ - in13 cases (11pts with diagnosis date<1997; 1pt - infant, in 1pt was not tested); ∗∗ - in 7 cases (1pt withdiagnosis date<1997; 2pts - infant; in 4pts was not tested); ∗∗∗ - in 2 cases (infants).
Expression of CD40 molecule was determined on the all 124 patients, whereas expression
of costimulatory molecules CD80, CD86, CD70 and CD27 was not tested in n=11 patients
with c-ALL (pts numbers: 3, 14, 20, 28, 30, 33, 36, 39, 42, 47 and 64) and in n=4 patients
with pre-B-ALL (pts numbers: 80, 94, 105 and 110).
Among 124 patients whose blasts were used in experiments described in present work in
8 patients CNS disease was detected at diagnosis and in one patient CNS disease was
detected at relapse (see table 7).
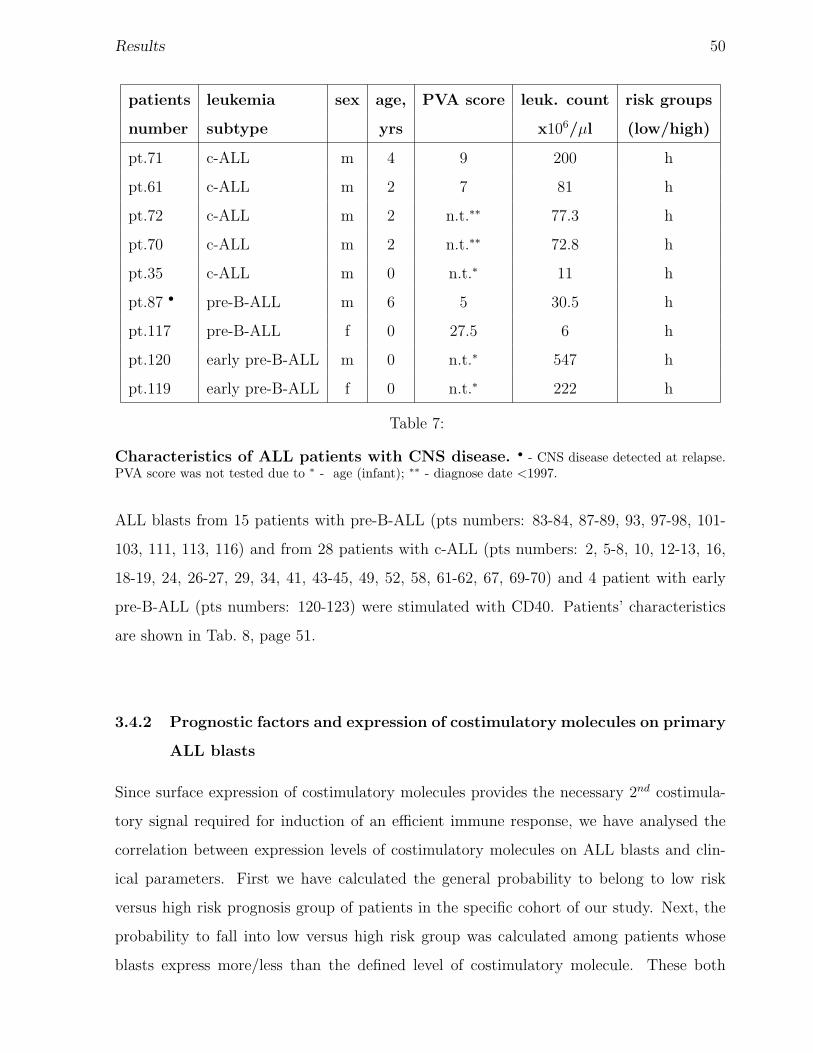
Results 50
patients leukemia sex age, PVA score leuk. count risk groups
number subtype yrs x106/µl (low/high)
pt.71 c-ALL m 4 9 200 h
pt.61 c-ALL m 2 7 81 h
pt.72 c-ALL m 2 n.t.∗∗ 77.3 h
pt.70 c-ALL m 2 n.t.∗∗ 72.8 h
pt.35 c-ALL m 0 n.t.∗ 11 h
pt.87 • pre-B-ALL m 6 5 30.5 h
pt.117 pre-B-ALL f 0 27.5 6 h
pt.120 early pre-B-ALL m 0 n.t.∗ 547 h
pt.119 early pre-B-ALL f 0 n.t.∗ 222 h
Table 7:
Characteristics of ALL patients with CNS disease. • - CNS disease detected at relapse.PVA score was not tested due to ∗ - age (infant); ∗∗ - diagnose date <1997.
ALL blasts from 15 patients with pre-B-ALL (pts numbers: 83-84, 87-89, 93, 97-98, 101-
103, 111, 113, 116) and from 28 patients with c-ALL (pts numbers: 2, 5-8, 10, 12-13, 16,
18-19, 24, 26-27, 29, 34, 41, 43-45, 49, 52, 58, 61-62, 67, 69-70) and 4 patient with early
pre-B-ALL (pts numbers: 120-123) were stimulated with CD40. Patients’ characteristics
are shown in Tab. 8, page 51.
3.4.2 Prognostic factors and expression of costimulatory molecules on primary
ALL blasts
Since surface expression of costimulatory molecules provides the necessary 2nd costimula-
tory signal required for induction of an efficient immune response, we have analysed the
correlation between expression levels of costimulatory molecules on ALL blasts and clin-
ical parameters. First we have calculated the general probability to belong to low risk
versus high risk prognosis group of patients in the specific cohort of our study. Next, the
probability to fall into low versus high risk group was calculated among patients whose
blasts express more/less than the defined level of costimulatory molecule. These both
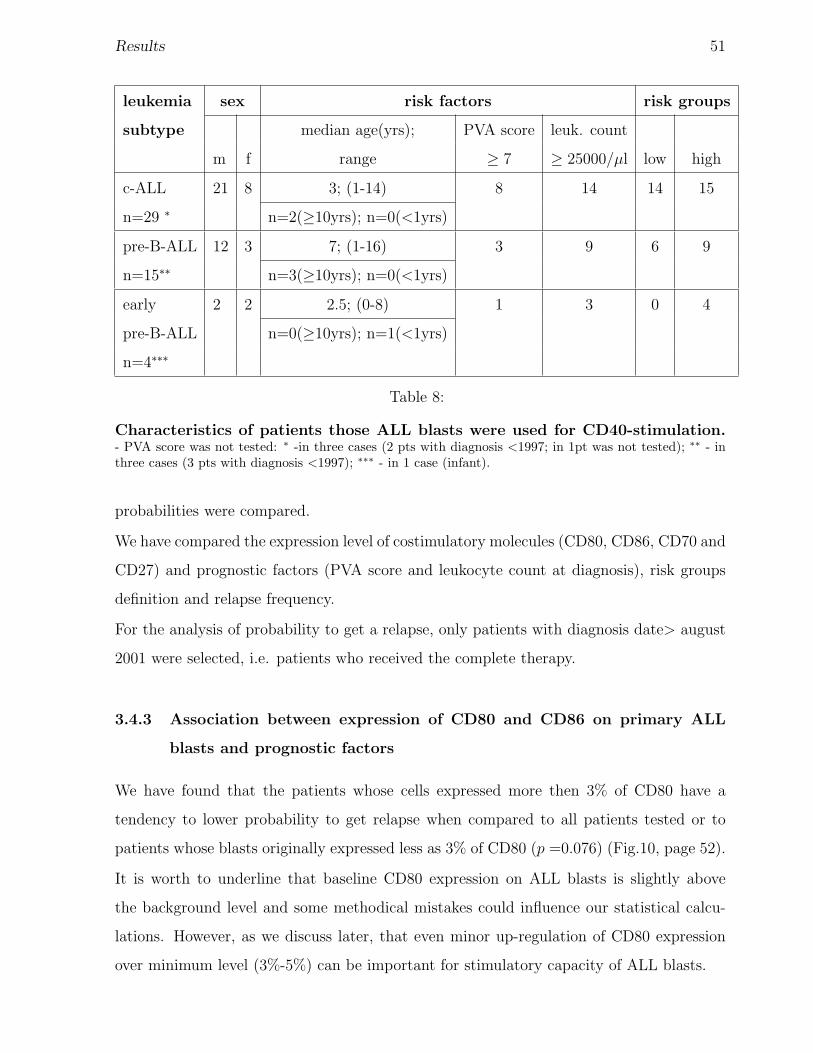
Results 51
leukemia sex risk factors risk groups
subtype median age(yrs); PVA score leuk. count
m f range ≥ 7 ≥ 25000/µl low high
c-ALL 21 8 3; (1-14) 8 14 14 15
n=29 ∗ n=2(≥10yrs); n=0(<1yrs)
pre-B-ALL 12 3 7; (1-16) 3 9 6 9
n=15∗∗ n=3(≥10yrs); n=0(<1yrs)
early 2 2 2.5; (0-8) 1 3 0 4
pre-B-ALL n=0(≥10yrs); n=1(<1yrs)
n=4∗∗∗
Table 8:
Characteristics of patients those ALL blasts were used for CD40-stimulation.- PVA score was not tested: ∗ -in three cases (2 pts with diagnosis <1997; in 1pt was not tested); ∗∗ - inthree cases (3 pts with diagnosis <1997); ∗∗∗ - in 1 case (infant).
probabilities were compared.
We have compared the expression level of costimulatory molecules (CD80, CD86, CD70 and
CD27) and prognostic factors (PVA score and leukocyte count at diagnosis), risk groups
definition and relapse frequency.
For the analysis of probability to get a relapse, only patients with diagnosis date> august
2001 were selected, i.e. patients who received the complete therapy.
3.4.3 Association between expression of CD80 and CD86 on primary ALL
blasts and prognostic factors
We have found that the patients whose cells expressed more then 3% of CD80 have a
tendency to lower probability to get relapse when compared to all patients tested or to
patients whose blasts originally expressed less as 3% of CD80 (p =0.076) (Fig.10, page 52).
It is worth to underline that baseline CD80 expression on ALL blasts is slightly above
the background level and some methodical mistakes could influence our statistical calcu-
lations. However, as we discuss later, that even minor up-regulation of CD80 expression
over minimum level (3%-5%) can be important for stimulatory capacity of ALL blasts.
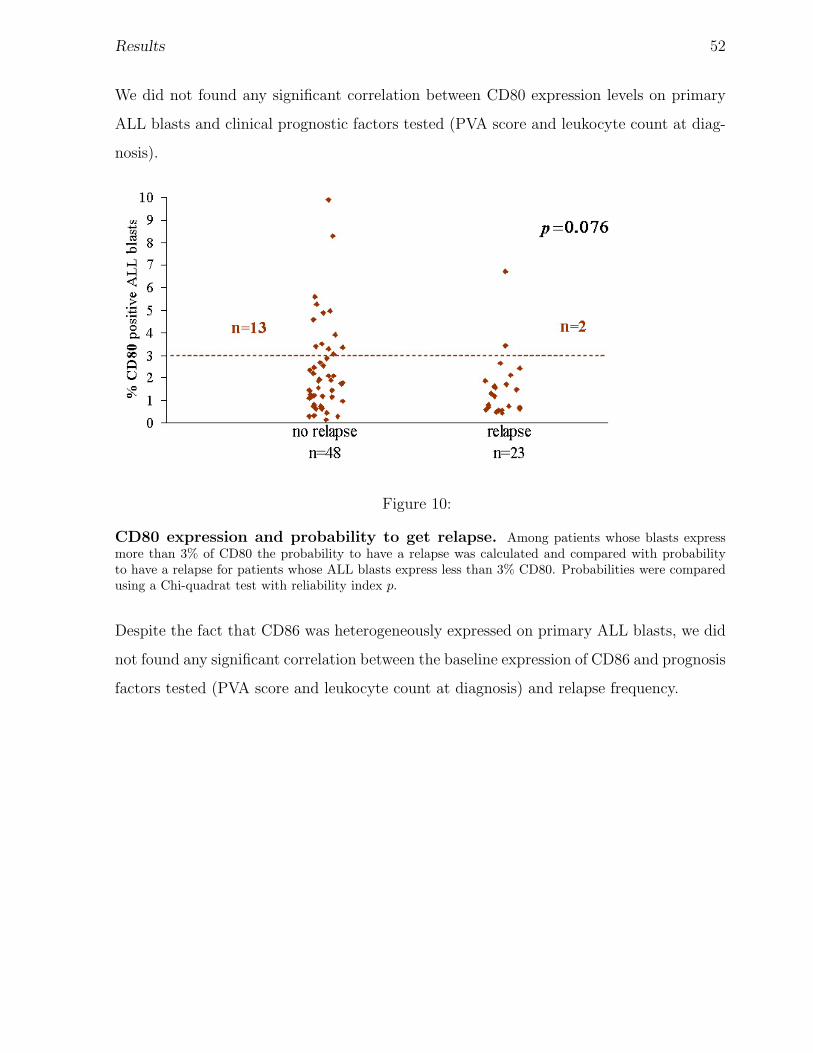
Results 52
We did not found any significant correlation between CD80 expression levels on primary
ALL blasts and clinical prognostic factors tested (PVA score and leukocyte count at diag-
nosis).
Figure 10:
CD80 expression and probability to get relapse. Among patients whose blasts expressmore than 3% of CD80 the probability to have a relapse was calculated and compared with probabilityto have a relapse for patients whose ALL blasts express less than 3% CD80. Probabilities were comparedusing a Chi-quadrat test with reliability index p.
Despite the fact that CD86 was heterogeneously expressed on primary ALL blasts, we did
not found any significant correlation between the baseline expression of CD86 and prognosis
factors tested (PVA score and leukocyte count at diagnosis) and relapse frequency.
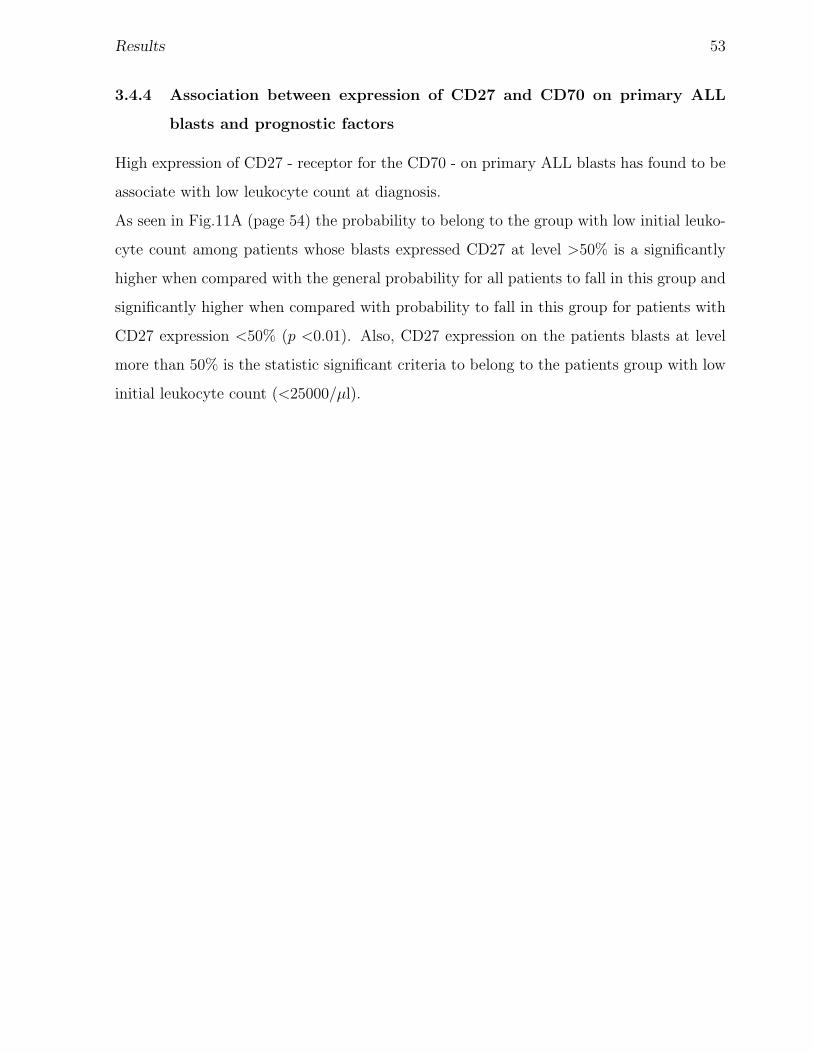
Results 53
3.4.4 Association between expression of CD27 and CD70 on primary ALL
blasts and prognostic factors
High expression of CD27 - receptor for the CD70 - on primary ALL blasts has found to be
associate with low leukocyte count at diagnosis.
As seen in Fig.11A (page 54) the probability to belong to the group with low initial leuko-
cyte count among patients whose blasts expressed CD27 at level >50% is a significantly
higher when compared with the general probability for all patients to fall in this group and
significantly higher when compared with probability to fall in this group for patients with
CD27 expression <50% (p <0.01). Also, CD27 expression on the patients blasts at level
more than 50% is the statistic significant criteria to belong to the patients group with low
initial leukocyte count (<25000/µl).
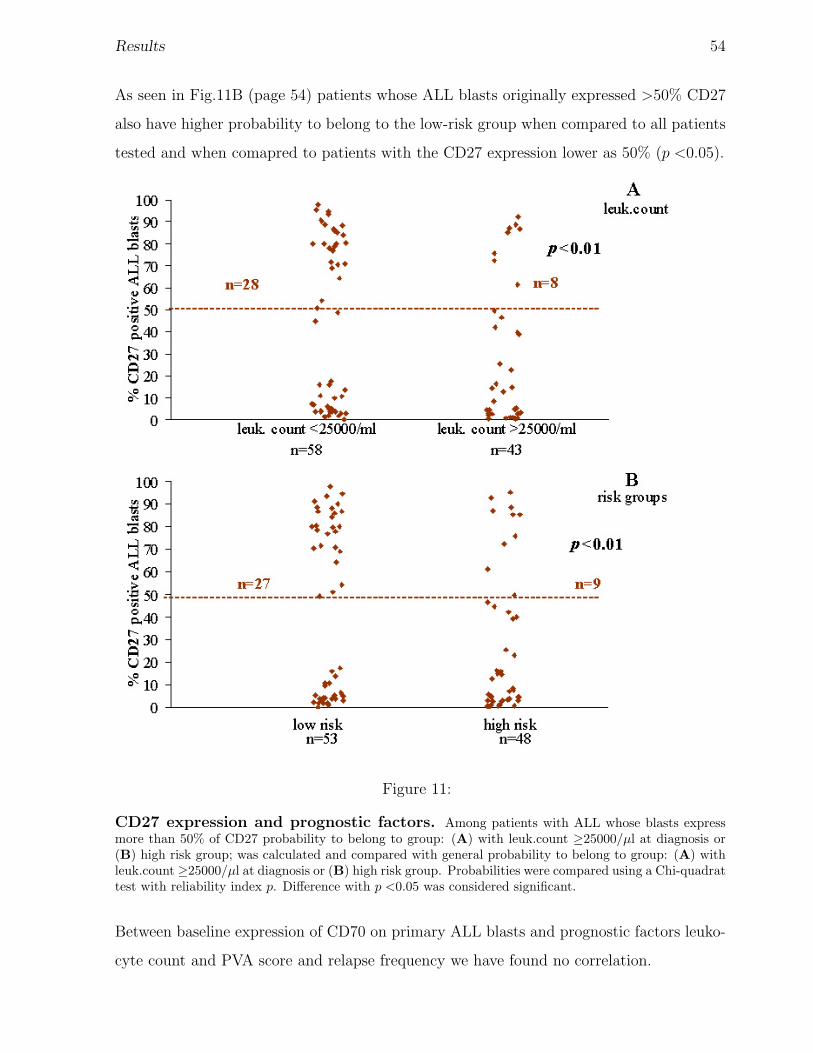
Results 54
As seen in Fig.11B (page 54) patients whose ALL blasts originally expressed >50% CD27
also have higher probability to belong to the low-risk group when compared to all patients
tested and when comapred to patients with the CD27 expression lower as 50% (p <0.05).
Figure 11:
CD27 expression and prognostic factors. Among patients with ALL whose blasts expressmore than 50% of CD27 probability to belong to group: (A) with leuk.count ≥25000/µl at diagnosis or(B) high risk group; was calculated and compared with general probability to belong to group: (A) withleuk.count ≥25000/µl at diagnosis or (B) high risk group. Probabilities were compared using a Chi-quadrattest with reliability index p. Difference with p <0.05 was considered significant.
Between baseline expression of CD70 on primary ALL blasts and prognostic factors leuko-
cyte count and PVA score and relapse frequency we have found no correlation.
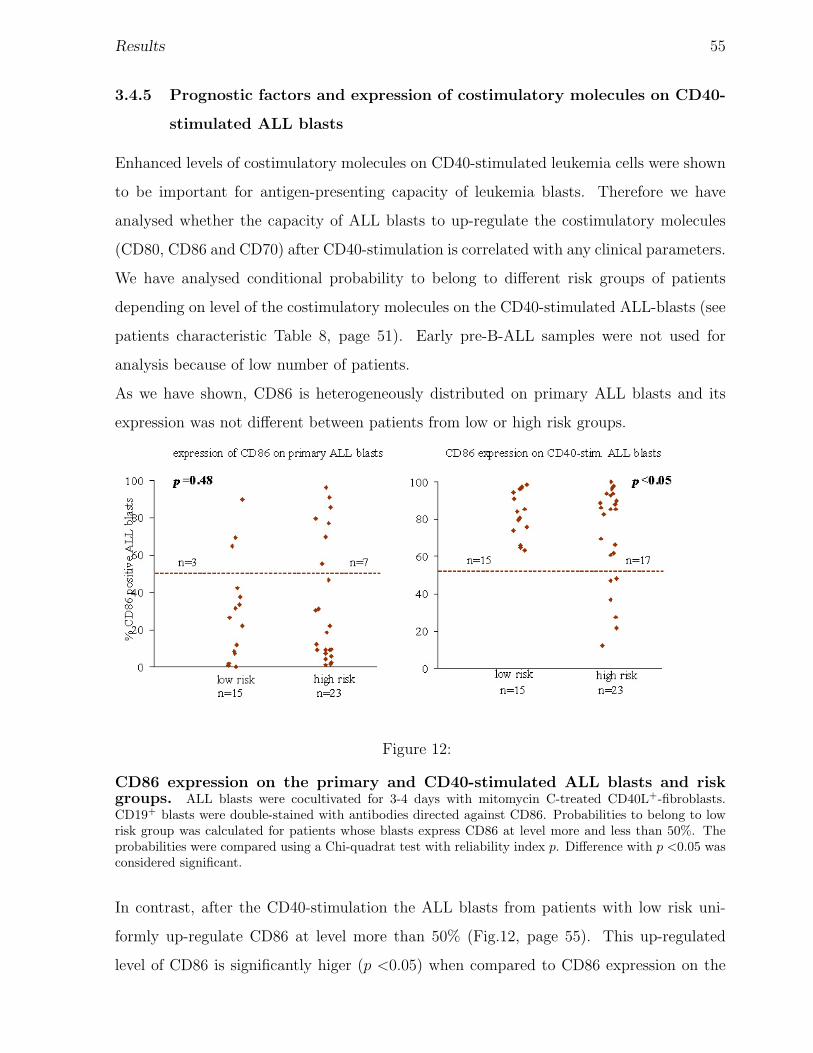
Results 55
3.4.5 Prognostic factors and expression of costimulatory molecules on CD40-
stimulated ALL blasts
Enhanced levels of costimulatory molecules on CD40-stimulated leukemia cells were shown
to be important for antigen-presenting capacity of leukemia blasts. Therefore we have
analysed whether the capacity of ALL blasts to up-regulate the costimulatory molecules
(CD80, CD86 and CD70) after CD40-stimulation is correlated with any clinical parameters.
We have analysed conditional probability to belong to different risk groups of patients
depending on level of the costimulatory molecules on the CD40-stimulated ALL-blasts (see
patients characteristic Table 8, page 51). Early pre-B-ALL samples were not used for
analysis because of low number of patients.
As we have shown, CD86 is heterogeneously distributed on primary ALL blasts and its
expression was not different between patients from low or high risk groups.
Figure 12:
CD86 expression on the primary and CD40-stimulated ALL blasts and riskgroups. ALL blasts were cocultivated for 3-4 days with mitomycin C-treated CD40L+-fibroblasts.CD19+ blasts were double-stained with antibodies directed against CD86. Probabilities to belong to lowrisk group was calculated for patients whose blasts express CD86 at level more and less than 50%. Theprobabilities were compared using a Chi-quadrat test with reliability index p. Difference with p <0.05 wasconsidered significant.
In contrast, after the CD40-stimulation the ALL blasts from patients with low risk uni-
formly up-regulate CD86 at level more than 50% (Fig.12, page 55). This up-regulated
level of CD86 is significantly higer (p <0.05) when compared to CD86 expression on the
Results 56
CD40-stimulated ALL blasts from high risk patients. Up-regulation of CD80 and CD70
have no correlation with any of prognostic factors or relapse probability.
3.4.6 Expression of costimulatory molecules and CD27 and CNS disease on
ALL patients
Since it was described that some patients with leukemia have elevated level of soluble
CD27 molecule (sCD27) in serum and cerebrospinal fluid, we have also analyse a possible
association between the expression of CD27 and costimulatory molecules on ALL blasts
and the probability to get CNS disease,
Among all patients studied in 8 patients CNS disease was detected at diagnosis and in one
patient CNS disease was detected at relapse (Tab. 7, page 50). As seen in Fig.13 (page 57)
the initial expression level of CD27, costimulatory molecules CD80, CD86 and CD70 was
not different between the patient groups with or without CNS disease. However, because
of the low number of patients with CNS disease (n=9) no significant correlation could be
found.
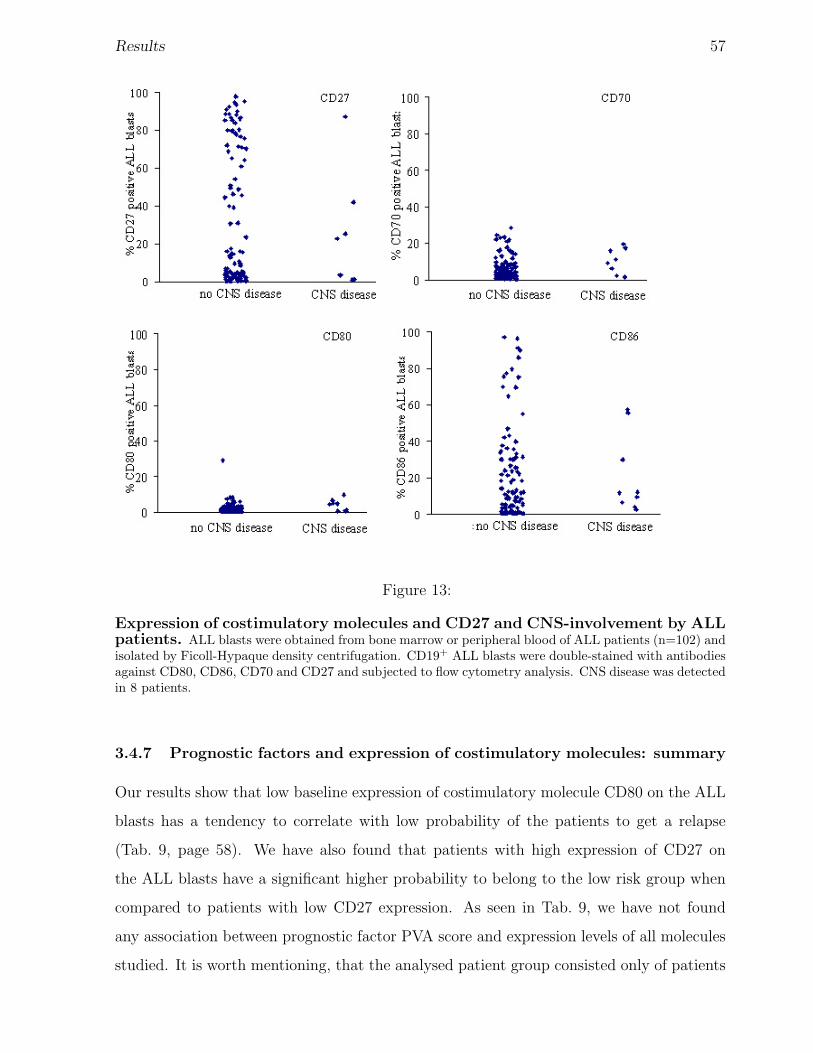
Results 57
Figure 13:
Expression of costimulatory molecules and CD27 and CNS-involvement by ALLpatients. ALL blasts were obtained from bone marrow or peripheral blood of ALL patients (n=102) andisolated by Ficoll-Hypaque density centrifugation. CD19+ ALL blasts were double-stained with antibodiesagainst CD80, CD86, CD70 and CD27 and subjected to flow cytometry analysis. CNS disease was detectedin 8 patients.
3.4.7 Prognostic factors and expression of costimulatory molecules: summary
Our results show that low baseline expression of costimulatory molecule CD80 on the ALL
blasts has a tendency to correlate with low probability of the patients to get a relapse
(Tab. 9, page 58). We have also found that patients with high expression of CD27 on
the ALL blasts have a significant higher probability to belong to the low risk group when
compared to patients with low CD27 expression. As seen in Tab. 9, we have not found
any association between prognostic factor PVA score and expression levels of all molecules
studied. It is worth mentioning, that the analysed patient group consisted only of patients
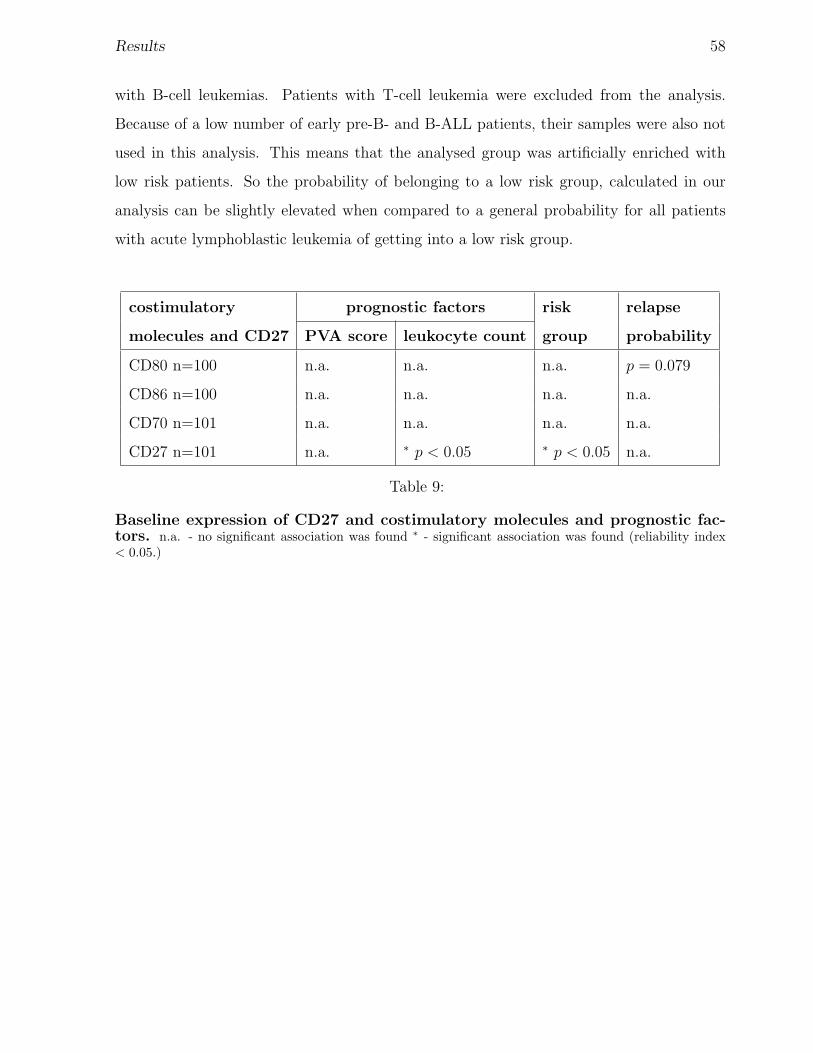
Results 58
with B-cell leukemias. Patients with T-cell leukemia were excluded from the analysis.
Because of a low number of early pre-B- and B-ALL patients, their samples were also not
used in this analysis. This means that the analysed group was artificially enriched with
low risk patients. So the probability of belonging to a low risk group, calculated in our
analysis can be slightly elevated when compared to a general probability for all patients
with acute lymphoblastic leukemia of getting into a low risk group.
costimulatory prognostic factors risk relapse
molecules and CD27 PVA score leukocyte count group probability
CD80 n=100 n.a. n.a. n.a. p = 0.079
CD86 n=100 n.a. n.a. n.a. n.a.
CD70 n=101 n.a. n.a. n.a. n.a.
CD27 n=101 n.a. ∗ p < 0.05 ∗ p < 0.05 n.a.
Table 9:
Baseline expression of CD27 and costimulatory molecules and prognostic fac-tors. n.a. - no significant association was found ∗ - significant association was found (reliability index< 0.05.)
Results 59
3.5 T-cell stimulatory capacity of CD40-stimulated ALL blasts
To investigate the stimulatory capacity of CD40-stimulated ALL blasts the primary mixed
lymphocytes reactions (MLRs) with allogeneic T-cells were performed. The CD40-stimulated
ALL blasts from 15 patients with c-ALL (pts numbers: 5-7, 10, 16, 19, 24, 26, 41-43, 61-62,
67 and 69), 3 patients with pre-B-ALL (pts numbers: 83, 97 and 101) and one patients
with early pre-B-ALL (pt. number: 121) were used in experiments described in patents’
characteristics in Tab. 2, pages 19-24.
Unstimulated and CD40-stimulated ALL blasts were cultured with allogeneic T-cells for
5 days. Maximal T-cell simulation was achieved with PHA (1µg/ml). H3-Thymidin was
added for last 18h of cultivation. Stimulation index (SI) was calculated for each individual
experiment as described above (Materials and Methods, subsection 2.15, page 34).
The CD40-stimulated ALL blasts from one patient (pt.6) have stimulated T-cell prolifer-
ation with a SI 10-fold greater than ALL-blasts from other patients, therefore SI obtained
in this sample was not used for analysis.
CD40-stimulated ALL blasts from all samples tested stimulated a 3-fold enhanced T-cell
proliferation (p<0.01) compared to unstimulated ALL blasts as shown in Fig.14A (page 60).
Maximal T-cell stimulation achieving with PHA-stimulation was SI=49±11.
In addition, increased production of IFN-γ by T-cells cultured with CD40-activated blasts
(1764 IU/ml) compared to unstimulated ALL blasts (464 IU/ml) was detected as demon-
strated in Fig.14B. IFN-γ production by T-cells cocultured with CD40-stimulated ALL
blasts was determined only in 4 experiments (pts 16, 42, 67 and 121). Due to the low
number of experiments the statistical analysis was not be performed.
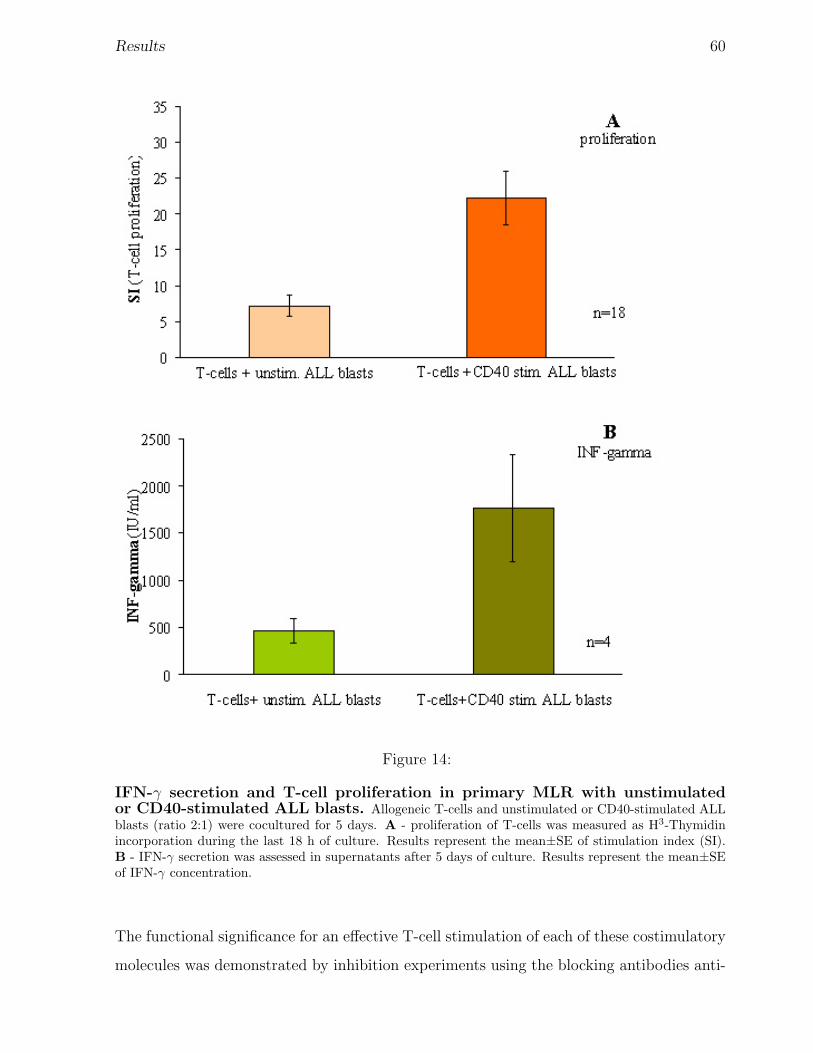
Results 60
Figure 14:
IFN-γ secretion and T-cell proliferation in primary MLR with unstimulatedor CD40-stimulated ALL blasts. Allogeneic T-cells and unstimulated or CD40-stimulated ALLblasts (ratio 2:1) were cocultured for 5 days. A - proliferation of T-cells was measured as H3-Thymidinincorporation during the last 18 h of culture. Results represent the mean±SE of stimulation index (SI).B - IFN-γ secretion was assessed in supernatants after 5 days of culture. Results represent the mean±SEof IFN-γ concentration.
The functional significance for an effective T-cell stimulation of each of these costimulatory
molecules was demonstrated by inhibition experiments using the blocking antibodies anti-
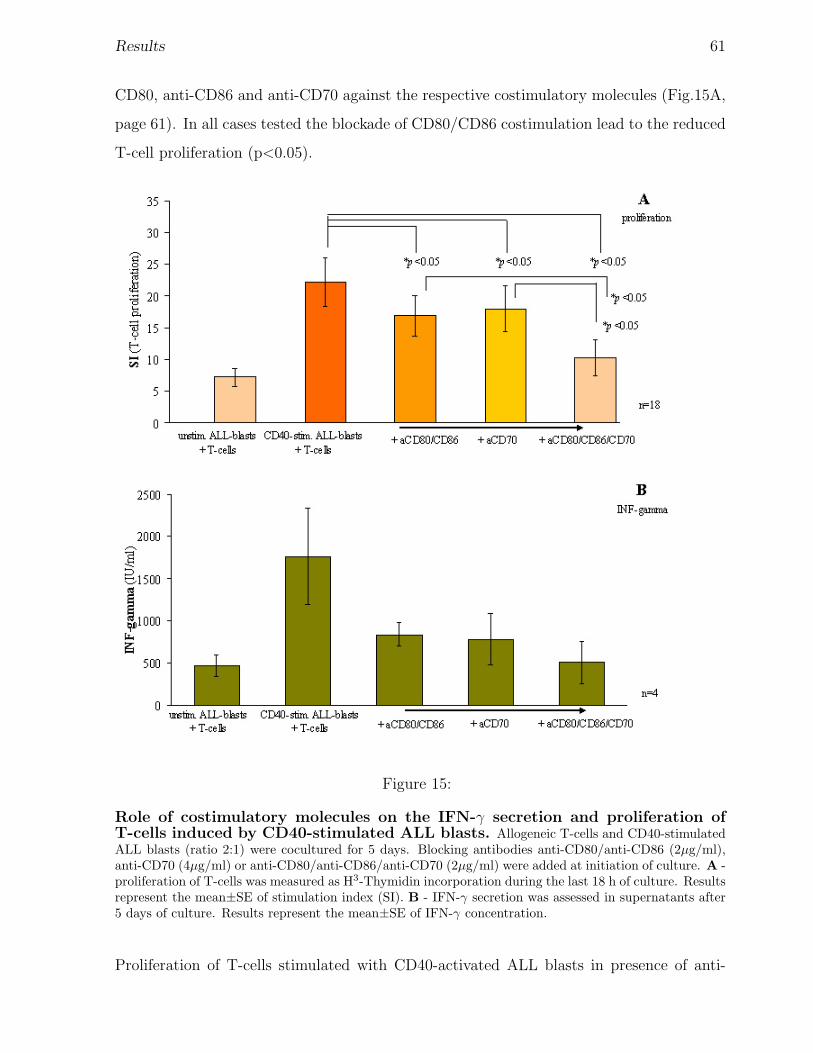
Results 61
CD80, anti-CD86 and anti-CD70 against the respective costimulatory molecules (Fig.15A,
page 61). In all cases tested the blockade of CD80/CD86 costimulation lead to the reduced
T-cell proliferation (p<0.05).
Figure 15:
Role of costimulatory molecules on the IFN-γ secretion and proliferation ofT-cells induced by CD40-stimulated ALL blasts. Allogeneic T-cells and CD40-stimulatedALL blasts (ratio 2:1) were cocultured for 5 days. Blocking antibodies anti-CD80/anti-CD86 (2µg/ml),anti-CD70 (4µg/ml) or anti-CD80/anti-CD86/anti-CD70 (2µg/ml) were added at initiation of culture. A -proliferation of T-cells was measured as H3-Thymidin incorporation during the last 18 h of culture. Resultsrepresent the mean±SE of stimulation index (SI). B - IFN-γ secretion was assessed in supernatants after5 days of culture. Results represent the mean±SE of IFN-γ concentration.
Proliferation of T-cells stimulated with CD40-activated ALL blasts in presence of anti-
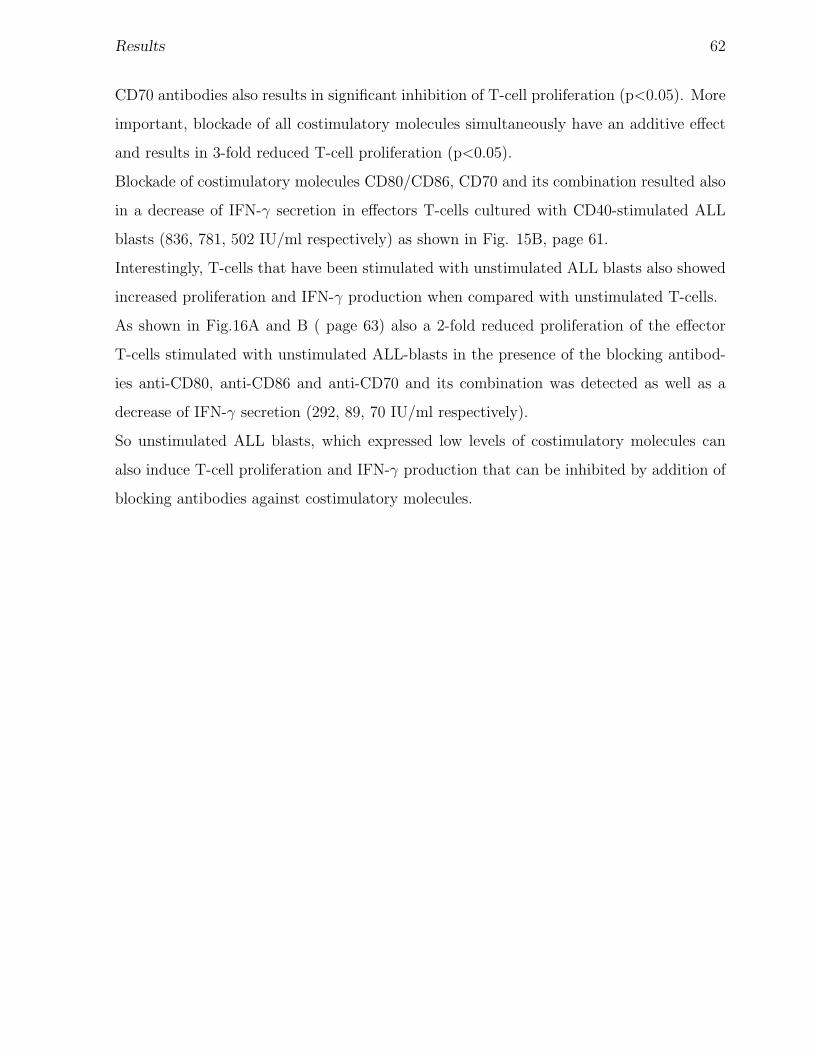
Results 62
CD70 antibodies also results in significant inhibition of T-cell proliferation (p<0.05). More
important, blockade of all costimulatory molecules simultaneously have an additive effect
and results in 3-fold reduced T-cell proliferation (p<0.05).
Blockade of costimulatory molecules CD80/CD86, CD70 and its combination resulted also
in a decrease of IFN-γ secretion in effectors T-cells cultured with CD40-stimulated ALL
blasts (836, 781, 502 IU/ml respectively) as shown in Fig. 15B, page 61.
Interestingly, T-cells that have been stimulated with unstimulated ALL blasts also showed
increased proliferation and IFN-γ production when compared with unstimulated T-cells.
As shown in Fig.16A and B ( page 63) also a 2-fold reduced proliferation of the effector
T-cells stimulated with unstimulated ALL-blasts in the presence of the blocking antibod-
ies anti-CD80, anti-CD86 and anti-CD70 and its combination was detected as well as a
decrease of IFN-γ secretion (292, 89, 70 IU/ml respectively).
So unstimulated ALL blasts, which expressed low levels of costimulatory molecules can
also induce T-cell proliferation and IFN-γ production that can be inhibited by addition of
blocking antibodies against costimulatory molecules.
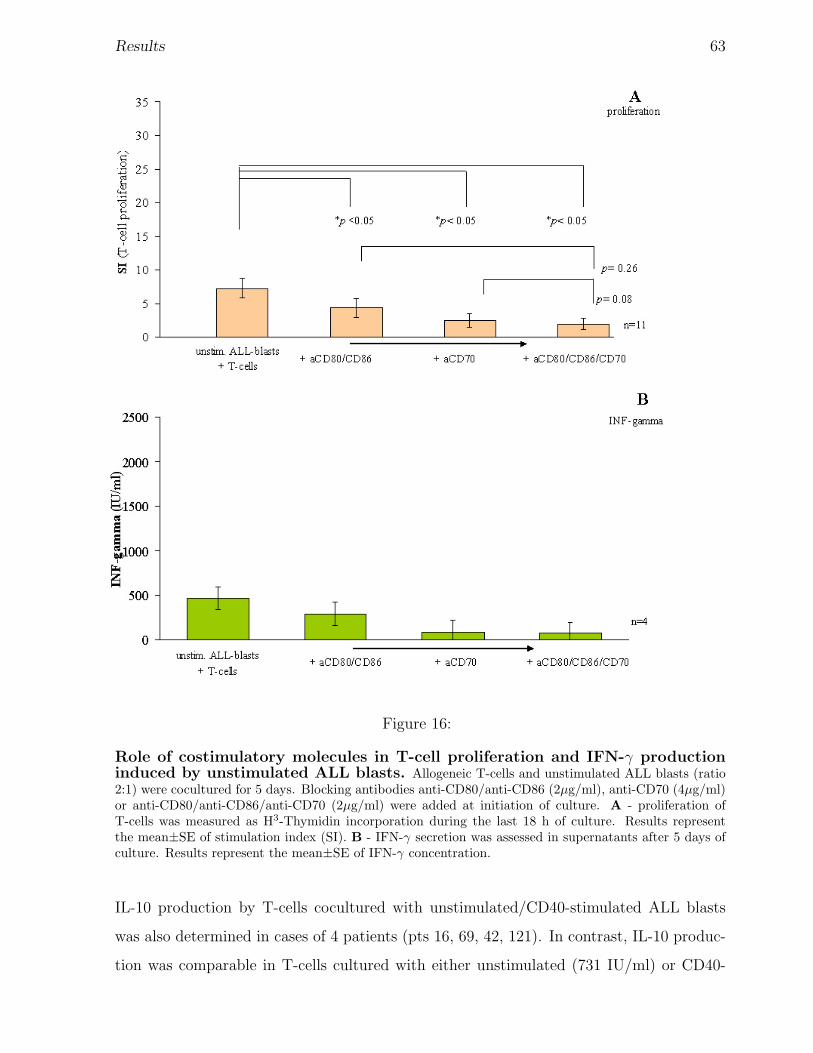
Results 63
Figure 16:
Role of costimulatory molecules in T-cell proliferation and IFN-γ productioninduced by unstimulated ALL blasts. Allogeneic T-cells and unstimulated ALL blasts (ratio2:1) were cocultured for 5 days. Blocking antibodies anti-CD80/anti-CD86 (2µg/ml), anti-CD70 (4µg/ml)or anti-CD80/anti-CD86/anti-CD70 (2µg/ml) were added at initiation of culture. A - proliferation ofT-cells was measured as H3-Thymidin incorporation during the last 18 h of culture. Results representthe mean±SE of stimulation index (SI). B - IFN-γ secretion was assessed in supernatants after 5 days ofculture. Results represent the mean±SE of IFN-γ concentration.
IL-10 production by T-cells cocultured with unstimulated/CD40-stimulated ALL blasts
was also determined in cases of 4 patients (pts 16, 69, 42, 121). In contrast, IL-10 produc-
tion was comparable in T-cells cultured with either unstimulated (731 IU/ml) or CD40-
Results 64
stimulated ALL blasts (927 IU/ml) and was not reduced in the settings with blocking
antibodies against costimulatory molecules.
As shown in Fig.16A and B ( page 63) also a 2-fold reduced proliferation of the effector
T-cells stimulated with unstimulated ALL-blasts in the presence of the blocking antibod-
ies anti-CD80, anti-CD86 and anti-CD70 and its combination was detected as well as a
decrease of IFN-γ secretion (292, 89, 70 IU/ml respectively).
So unstimulated ALL blasts, which expressed low levels of costimulatory molecules can
also induce T-cell proliferation and IFN-γ production that can be inhibited by addition of
blocking antibodies against costimulatory molecules.
IL-10 production by T-cells cocultured with unstimulated/CD40-stimulated ALL blasts
was also determined in cases of 4 patients (pts 16, 69, 42, 121). In contrast, IL-10 produc-
tion was comparable in T-cells cultured with either unstimulated (731 IU/ml) or CD40-
stimulated ALL blasts (927 IU/ml) and was not reduced in the settings with blocking
antibodies against costimulatory molecules.
Taken together our results evidenced, that participation of CD70 costimulation in the
process of T-cell activation is on the same level of importance as that provided by CD80 and
CD86 molecules. Moreover, the costimulation mediated through both CD28-CD80/CD86
and CD27-CD70 pathways are necessary for the sufficient T-cell stimulation.
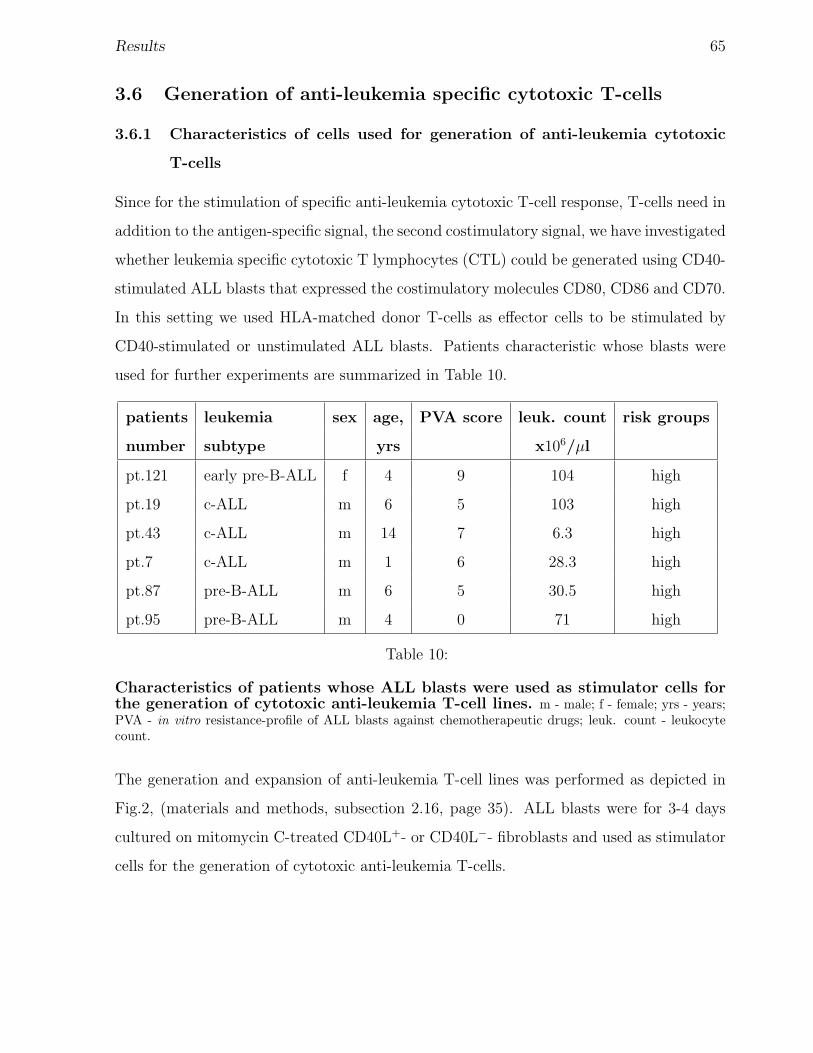
Results 65
3.6 Generation of anti-leukemia specific cytotoxic T-cells
3.6.1 Characteristics of cells used for generation of anti-leukemia cytotoxic
T-cells
Since for the stimulation of specific anti-leukemia cytotoxic T-cell response, T-cells need in
addition to the antigen-specific signal, the second costimulatory signal, we have investigated
whether leukemia specific cytotoxic T lymphocytes (CTL) could be generated using CD40-
stimulated ALL blasts that expressed the costimulatory molecules CD80, CD86 and CD70.
In this setting we used HLA-matched donor T-cells as effector cells to be stimulated by
CD40-stimulated or unstimulated ALL blasts. Patients characteristic whose blasts were
used for further experiments are summarized in Table 10.
patients leukemia sex age, PVA score leuk. count risk groups
number subtype yrs x106/µl
pt.121 early pre-B-ALL f 4 9 104 high
pt.19 c-ALL m 6 5 103 high
pt.43 c-ALL m 14 7 6.3 high
pt.7 c-ALL m 1 6 28.3 high
pt.87 pre-B-ALL m 6 5 30.5 high
pt.95 pre-B-ALL m 4 0 71 high
Table 10:
Characteristics of patients whose ALL blasts were used as stimulator cells forthe generation of cytotoxic anti-leukemia T-cell lines. m - male; f - female; yrs - years;PVA - in vitro resistance-profile of ALL blasts against chemotherapeutic drugs; leuk. count - leukocytecount.
The generation and expansion of anti-leukemia T-cell lines was performed as depicted in
Fig.2, (materials and methods, subsection 2.16, page 35). ALL blasts were for 3-4 days
cultured on mitomycin C-treated CD40L+- or CD40L−- fibroblasts and used as stimulator
cells for the generation of cytotoxic anti-leukemia T-cells.
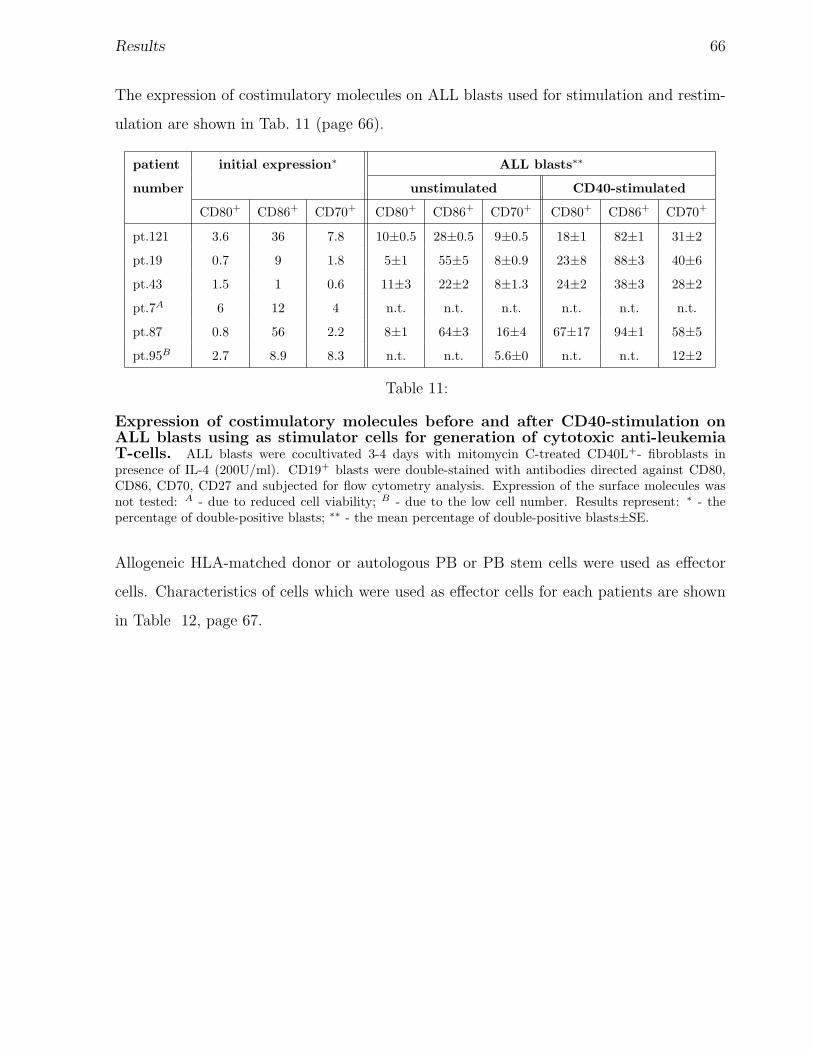
Results 66
The expression of costimulatory molecules on ALL blasts used for stimulation and restim-
ulation are shown in Tab. 11 (page 66).
patient initial expression∗ ALL blasts∗∗
number unstimulated CD40-stimulated
CD80+ CD86+ CD70+ CD80+ CD86+ CD70+ CD80+ CD86+ CD70+
pt.121 3.6 36 7.8 10±0.5 28±0.5 9±0.5 18±1 82±1 31±2
pt.19 0.7 9 1.8 5±1 55±5 8±0.9 23±8 88±3 40±6
pt.43 1.5 1 0.6 11±3 22±2 8±1.3 24±2 38±3 28±2
pt.7A 6 12 4 n.t. n.t. n.t. n.t. n.t. n.t.
pt.87 0.8 56 2.2 8±1 64±3 16±4 67±17 94±1 58±5
pt.95B 2.7 8.9 8.3 n.t. n.t. 5.6±0 n.t. n.t. 12±2
Table 11:
Expression of costimulatory molecules before and after CD40-stimulation onALL blasts using as stimulator cells for generation of cytotoxic anti-leukemiaT-cells. ALL blasts were cocultivated 3-4 days with mitomycin C-treated CD40L+- fibroblasts inpresence of IL-4 (200U/ml). CD19+ blasts were double-stained with antibodies directed against CD80,CD86, CD70, CD27 and subjected for flow cytometry analysis. Expression of the surface molecules wasnot tested: A - due to reduced cell viability; B - due to the low cell number. Results represent: ∗ - thepercentage of double-positive blasts; ∗∗ - the mean percentage of double-positive blasts±SE.
Allogeneic HLA-matched donor or autologous PB or PB stem cells were used as effector
cells. Characteristics of cells which were used as effector cells for each patients are shown
in Table 12, page 67.
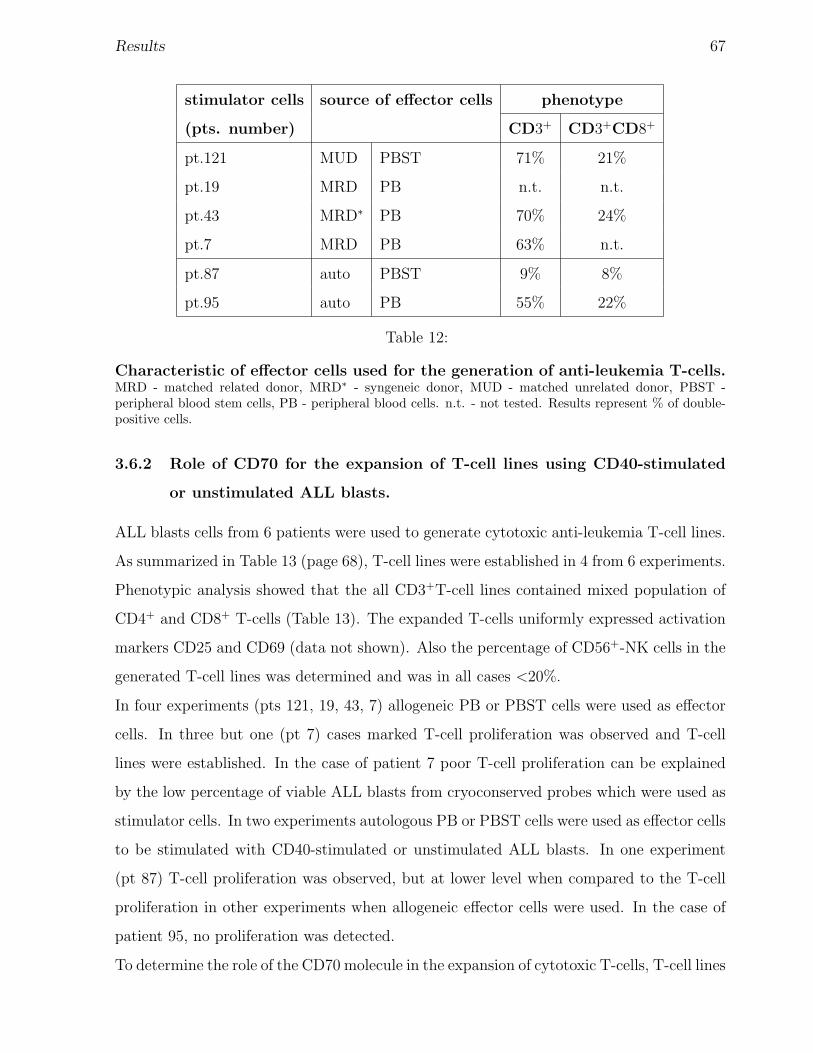
Results 67
stimulator cells source of effector cells phenotype
(pts. number) CD3+ CD3+CD8+
pt.121 MUD PBST 71% 21%
pt.19 MRD PB n.t. n.t.
pt.43 MRD∗ PB 70% 24%
pt.7 MRD PB 63% n.t.
pt.87 auto PBST 9% 8%
pt.95 auto PB 55% 22%
Table 12:
Characteristic of effector cells used for the generation of anti-leukemia T-cells.MRD - matched related donor, MRD∗ - syngeneic donor, MUD - matched unrelated donor, PBST -peripheral blood stem cells, PB - peripheral blood cells. n.t. - not tested. Results represent % of double-positive cells.
3.6.2 Role of CD70 for the expansion of T-cell lines using CD40-stimulated
or unstimulated ALL blasts.
ALL blasts cells from 6 patients were used to generate cytotoxic anti-leukemia T-cell lines.
As summarized in Table 13 (page 68), T-cell lines were established in 4 from 6 experiments.
Phenotypic analysis showed that the all CD3+T-cell lines contained mixed population of
CD4+ and CD8+ T-cells (Table 13). The expanded T-cells uniformly expressed activation
markers CD25 and CD69 (data not shown). Also the percentage of CD56+-NK cells in the
generated T-cell lines was determined and was in all cases <20%.
In four experiments (pts 121, 19, 43, 7) allogeneic PB or PBST cells were used as effector
cells. In three but one (pt 7) cases marked T-cell proliferation was observed and T-cell
lines were established. In the case of patient 7 poor T-cell proliferation can be explained
by the low percentage of viable ALL blasts from cryoconserved probes which were used as
stimulator cells. In two experiments autologous PB or PBST cells were used as effector cells
to be stimulated with CD40-stimulated or unstimulated ALL blasts. In one experiment
(pt 87) T-cell proliferation was observed, but at lower level when compared to the T-cell
proliferation in other experiments when allogeneic effector cells were used. In the case of
patient 95, no proliferation was detected.
To determine the role of the CD70 molecule in the expansion of cytotoxic T-cells, T-cell lines
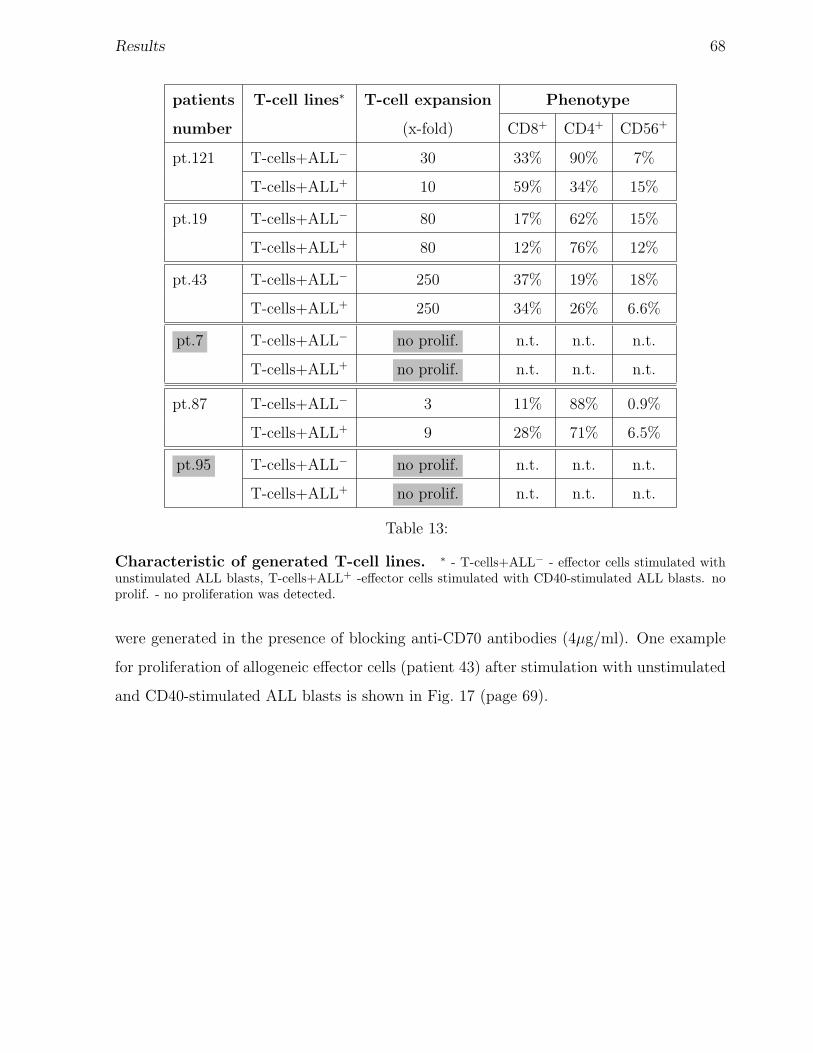
Results 68
patients T-cell lines∗ T-cell expansion Phenotype
number (x-fold) CD8+ CD4+ CD56+
pt.121 T-cells+ALL− 30 33% 90% 7%
T-cells+ALL+ 10 59% 34% 15%
pt.19 T-cells+ALL− 80 17% 62% 15%
T-cells+ALL+ 80 12% 76% 12%
pt.43 T-cells+ALL− 250 37% 19% 18%
T-cells+ALL+ 250 34% 26% 6.6%
pt.7 T-cells+ALL− no prolif. n.t. n.t. n.t.
T-cells+ALL+ no prolif. n.t. n.t. n.t.
pt.87 T-cells+ALL− 3 11% 88% 0.9%
T-cells+ALL+ 9 28% 71% 6.5%
pt.95 T-cells+ALL− no prolif. n.t. n.t. n.t.
T-cells+ALL+ no prolif. n.t. n.t. n.t.
Table 13:
Characteristic of generated T-cell lines. ∗ - T-cells+ALL− - effector cells stimulated withunstimulated ALL blasts, T-cells+ALL+ -effector cells stimulated with CD40-stimulated ALL blasts. noprolif. - no proliferation was detected.
were generated in the presence of blocking anti-CD70 antibodies (4µg/ml). One example
for proliferation of allogeneic effector cells (patient 43) after stimulation with unstimulated
and CD40-stimulated ALL blasts is shown in Fig. 17 (page 69).
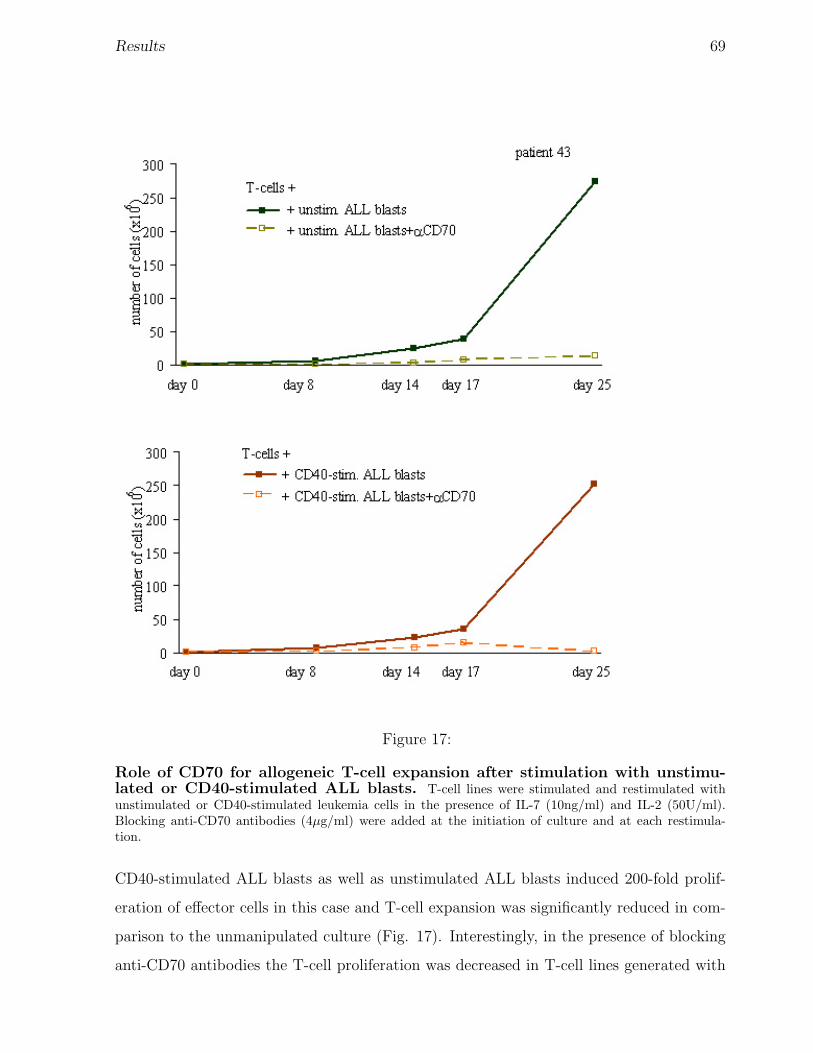
Results 69
Figure 17:
Role of CD70 for allogeneic T-cell expansion after stimulation with unstimu-lated or CD40-stimulated ALL blasts. T-cell lines were stimulated and restimulated withunstimulated or CD40-stimulated leukemia cells in the presence of IL-7 (10ng/ml) and IL-2 (50U/ml).Blocking anti-CD70 antibodies (4µg/ml) were added at the initiation of culture and at each restimula-tion.
CD40-stimulated ALL blasts as well as unstimulated ALL blasts induced 200-fold prolif-
eration of effector cells in this case and T-cell expansion was significantly reduced in com-
parison to the unmanipulated culture (Fig. 17). Interestingly, in the presence of blocking
anti-CD70 antibodies the T-cell proliferation was decreased in T-cell lines generated with
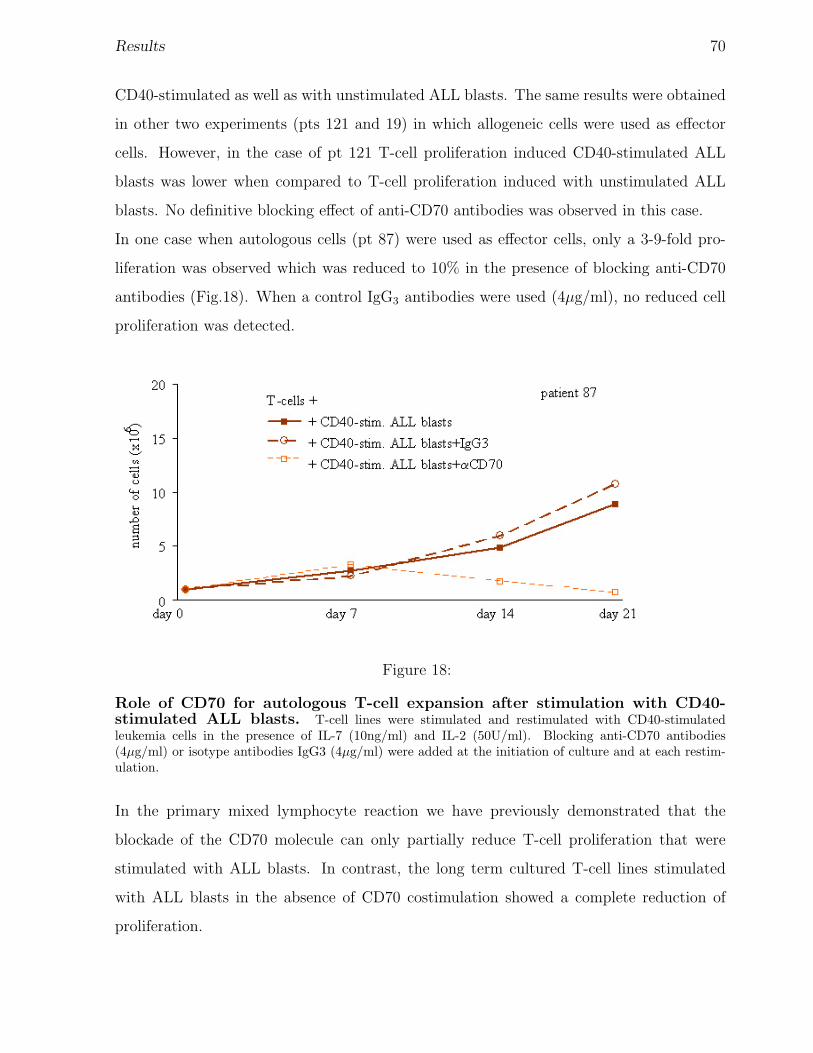
Results 70
CD40-stimulated as well as with unstimulated ALL blasts. The same results were obtained
in other two experiments (pts 121 and 19) in which allogeneic cells were used as effector
cells. However, in the case of pt 121 T-cell proliferation induced CD40-stimulated ALL
blasts was lower when compared to T-cell proliferation induced with unstimulated ALL
blasts. No definitive blocking effect of anti-CD70 antibodies was observed in this case.
In one case when autologous cells (pt 87) were used as effector cells, only a 3-9-fold pro-
liferation was observed which was reduced to 10% in the presence of blocking anti-CD70
antibodies (Fig.18). When a control IgG3 antibodies were used (4µg/ml), no reduced cell
proliferation was detected.
Figure 18:
Role of CD70 for autologous T-cell expansion after stimulation with CD40-stimulated ALL blasts. T-cell lines were stimulated and restimulated with CD40-stimulatedleukemia cells in the presence of IL-7 (10ng/ml) and IL-2 (50U/ml). Blocking anti-CD70 antibodies(4µg/ml) or isotype antibodies IgG3 (4µg/ml) were added at the initiation of culture and at each restim-ulation.
In the primary mixed lymphocyte reaction we have previously demonstrated that the
blockade of the CD70 molecule can only partially reduce T-cell proliferation that were
stimulated with ALL blasts. In contrast, the long term cultured T-cell lines stimulated
with ALL blasts in the absence of CD70 costimulation showed a complete reduction of
proliferation.
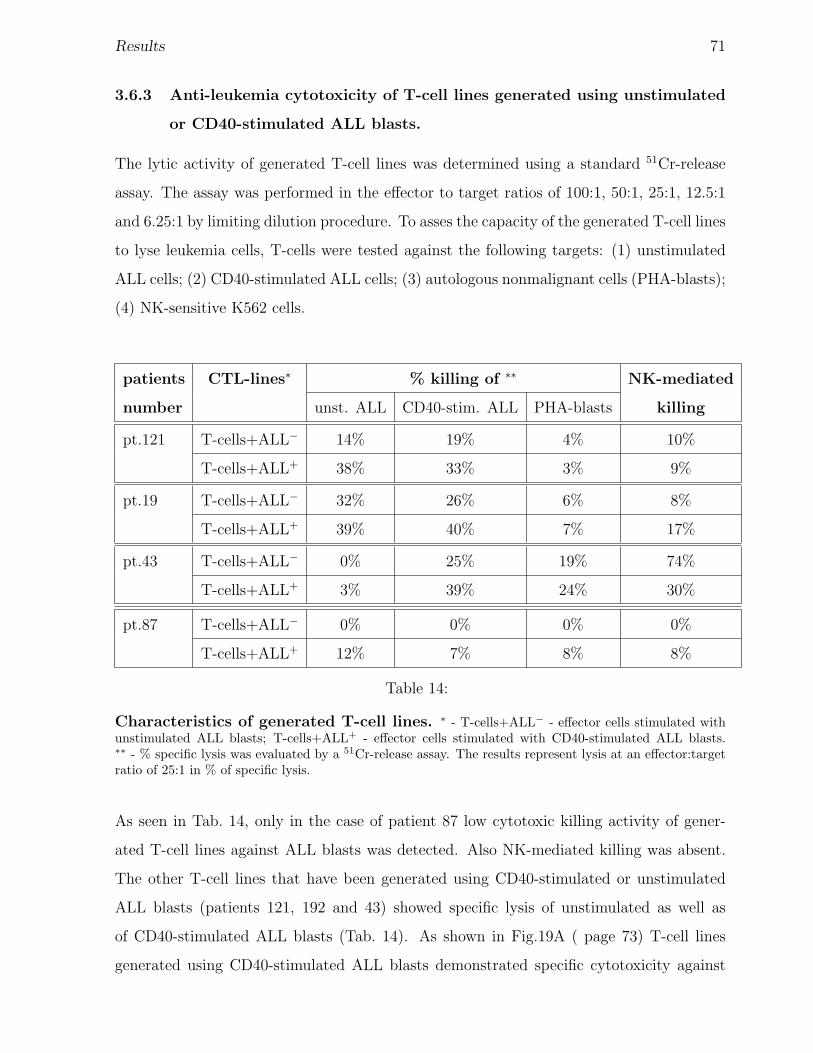
Results 71
3.6.3 Anti-leukemia cytotoxicity of T-cell lines generated using unstimulated
or CD40-stimulated ALL blasts.
The lytic activity of generated T-cell lines was determined using a standard 51Cr-release
assay. The assay was performed in the effector to target ratios of 100:1, 50:1, 25:1, 12.5:1
and 6.25:1 by limiting dilution procedure. To asses the capacity of the generated T-cell lines
to lyse leukemia cells, T-cells were tested against the following targets: (1) unstimulated
ALL cells; (2) CD40-stimulated ALL cells; (3) autologous nonmalignant cells (PHA-blasts);
(4) NK-sensitive K562 cells.
patients CTL-lines∗ % killing of ∗∗ NK-mediated
number unst. ALL CD40-stim. ALL PHA-blasts killing
pt.121 T-cells+ALL− 14% 19% 4% 10%
T-cells+ALL+ 38% 33% 3% 9%
pt.19 T-cells+ALL− 32% 26% 6% 8%
T-cells+ALL+ 39% 40% 7% 17%
pt.43 T-cells+ALL− 0% 25% 19% 74%
T-cells+ALL+ 3% 39% 24% 30%
pt.87 T-cells+ALL− 0% 0% 0% 0%
T-cells+ALL+ 12% 7% 8% 8%
Table 14:
Characteristics of generated T-cell lines. ∗ - T-cells+ALL− - effector cells stimulated withunstimulated ALL blasts; T-cells+ALL+ - effector cells stimulated with CD40-stimulated ALL blasts.∗∗ - % specific lysis was evaluated by a 51Cr-release assay. The results represent lysis at an effector:targetratio of 25:1 in % of specific lysis.
As seen in Tab. 14, only in the case of patient 87 low cytotoxic killing activity of gener-
ated T-cell lines against ALL blasts was detected. Also NK-mediated killing was absent.
The other T-cell lines that have been generated using CD40-stimulated or unstimulated
ALL blasts (patients 121, 192 and 43) showed specific lysis of unstimulated as well as
of CD40-stimulated ALL blasts (Tab. 14). As shown in Fig.19A ( page 73) T-cell lines
generated using CD40-stimulated ALL blasts demonstrated specific cytotoxicity against
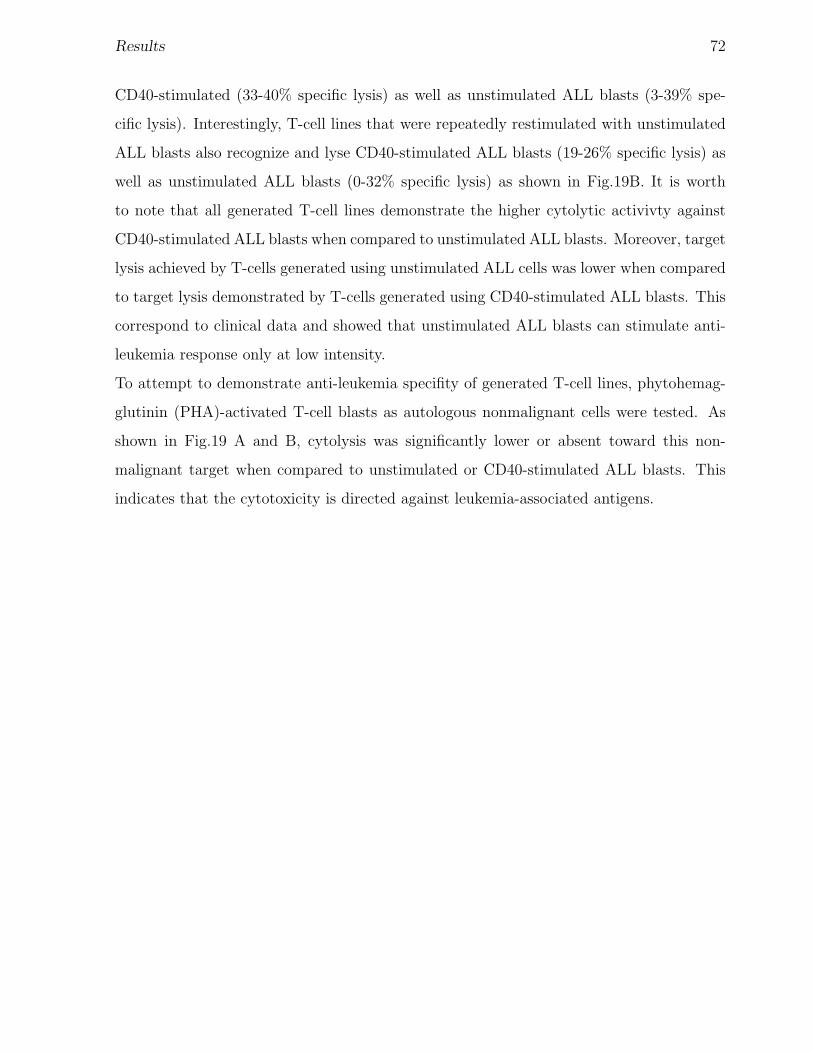
Results 72
CD40-stimulated (33-40% specific lysis) as well as unstimulated ALL blasts (3-39% spe-
cific lysis). Interestingly, T-cell lines that were repeatedly restimulated with unstimulated
ALL blasts also recognize and lyse CD40-stimulated ALL blasts (19-26% specific lysis) as
well as unstimulated ALL blasts (0-32% specific lysis) as shown in Fig.19B. It is worth
to note that all generated T-cell lines demonstrate the higher cytolytic activivty against
CD40-stimulated ALL blasts when compared to unstimulated ALL blasts. Moreover, target
lysis achieved by T-cells generated using unstimulated ALL cells was lower when compared
to target lysis demonstrated by T-cells generated using CD40-stimulated ALL blasts. This
correspond to clinical data and showed that unstimulated ALL blasts can stimulate anti-
leukemia response only at low intensity.
To attempt to demonstrate anti-leukemia specifity of generated T-cell lines, phytohemag-
glutinin (PHA)-activated T-cell blasts as autologous nonmalignant cells were tested. As
shown in Fig.19 A and B, cytolysis was significantly lower or absent toward this non-
malignant target when compared to unstimulated or CD40-stimulated ALL blasts. This
indicates that the cytotoxicity is directed against leukemia-associated antigens.
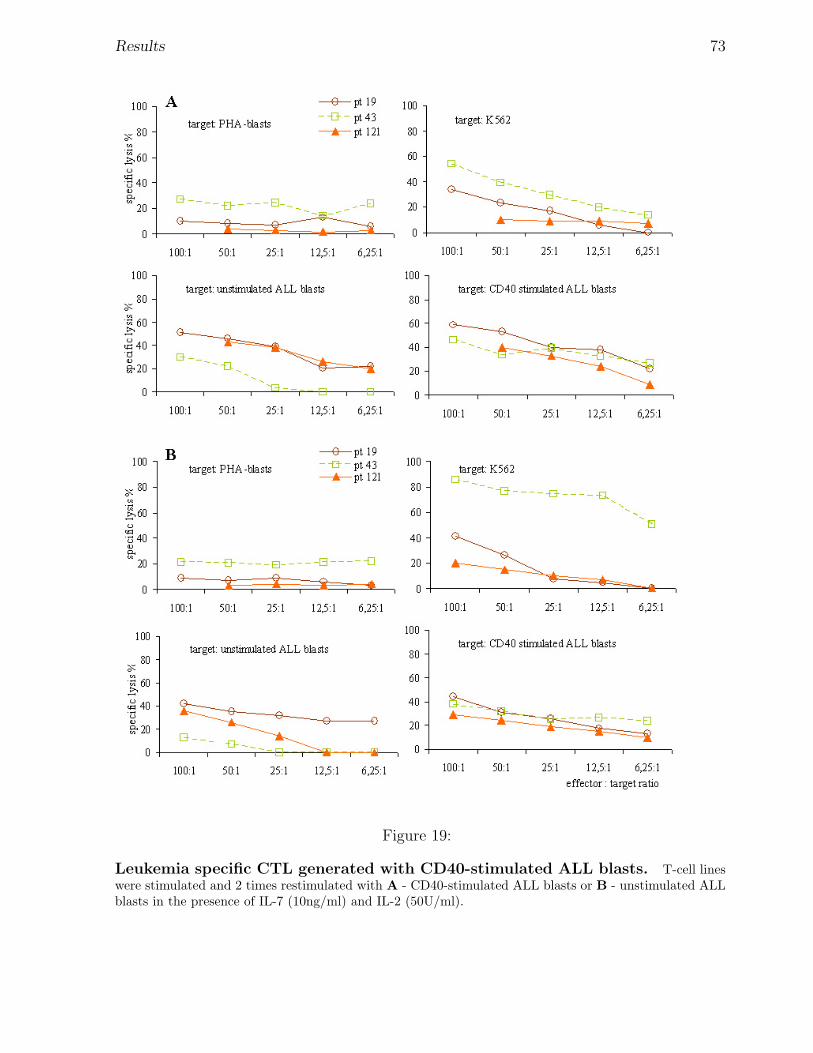
Results 73
Figure 19:
Leukemia specific CTL generated with CD40-stimulated ALL blasts. T-cell lineswere stimulated and 2 times restimulated with A - CD40-stimulated ALL blasts or B - unstimulated ALLblasts in the presence of IL-7 (10ng/ml) and IL-2 (50U/ml).
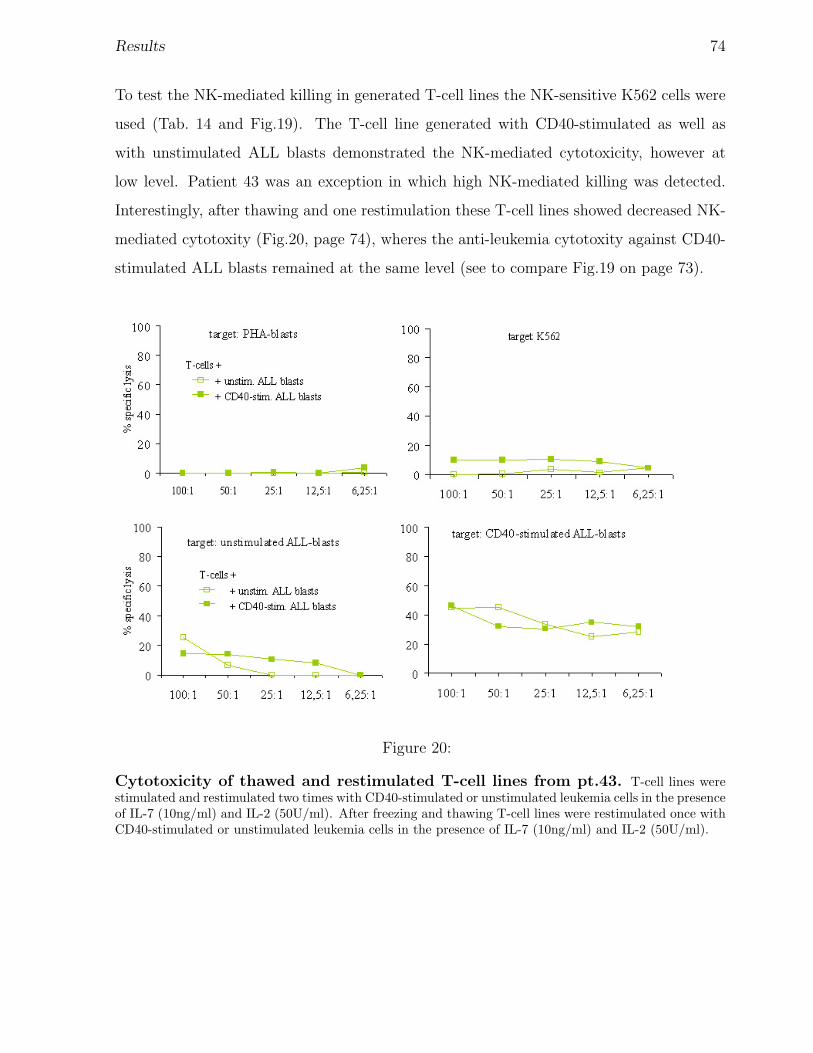
Results 74
To test the NK-mediated killing in generated T-cell lines the NK-sensitive K562 cells were
used (Tab. 14 and Fig.19). The T-cell line generated with CD40-stimulated as well as
with unstimulated ALL blasts demonstrated the NK-mediated cytotoxicity, however at
low level. Patient 43 was an exception in which high NK-mediated killing was detected.
Interestingly, after thawing and one restimulation these T-cell lines showed decreased NK-
mediated cytotoxity (Fig.20, page 74), wheres the anti-leukemia cytotoxity against CD40-
stimulated ALL blasts remained at the same level (see to compare Fig.19 on page 73).
Figure 20:
Cytotoxicity of thawed and restimulated T-cell lines from pt.43. T-cell lines werestimulated and restimulated two times with CD40-stimulated or unstimulated leukemia cells in the presenceof IL-7 (10ng/ml) and IL-2 (50U/ml). After freezing and thawing T-cell lines were restimulated once withCD40-stimulated or unstimulated leukemia cells in the presence of IL-7 (10ng/ml) and IL-2 (50U/ml).
Results 75
3.6.4 Role of CD70 for the anti-leukemia cytotoxic activity of T-cell lines
generated with unstimulated or CD40-stimulated ALL blasts.
We have previously shown (see 3.6.2, page 67), that blockade of CD70 costimulation led
to the reduced proliferation of T-cell lines stimulated either with unstimulated or CD40-
stimulated ALL blasts. Nevertheless, in two experiments (pts 43 and 19) the T-cell lines
generated in the presence of blocking anti-CD70 antibodies were established, however only
very low cell numbers were obtained. To determine the role of CD70 for cytotoxicity of T-
cell lines generated using unstimulated or CD40-stimulated ALL blasts, cytotoxic activity
of T-cell lines generated in the absence of CD70 costimulation was tested.
Figure 21:
Role of CD70 molecule for the anti-leukemia cytotoxity of T-cell lines generatedwith unstimulated ALL blasts. T-cells were stimulated and restimulated with unstimulatedALL blasts. Blocking anti-CD70 antibodies (4µg/ml) were added at the initiation of culture and at eachrestimulation. A - T-cell line generated using cells from patient 43. B - T-cell line generated using cells frompatient 19. Due to the low cell number the cytotoxicity was tested only against target CD40-stimulatedALL cells.
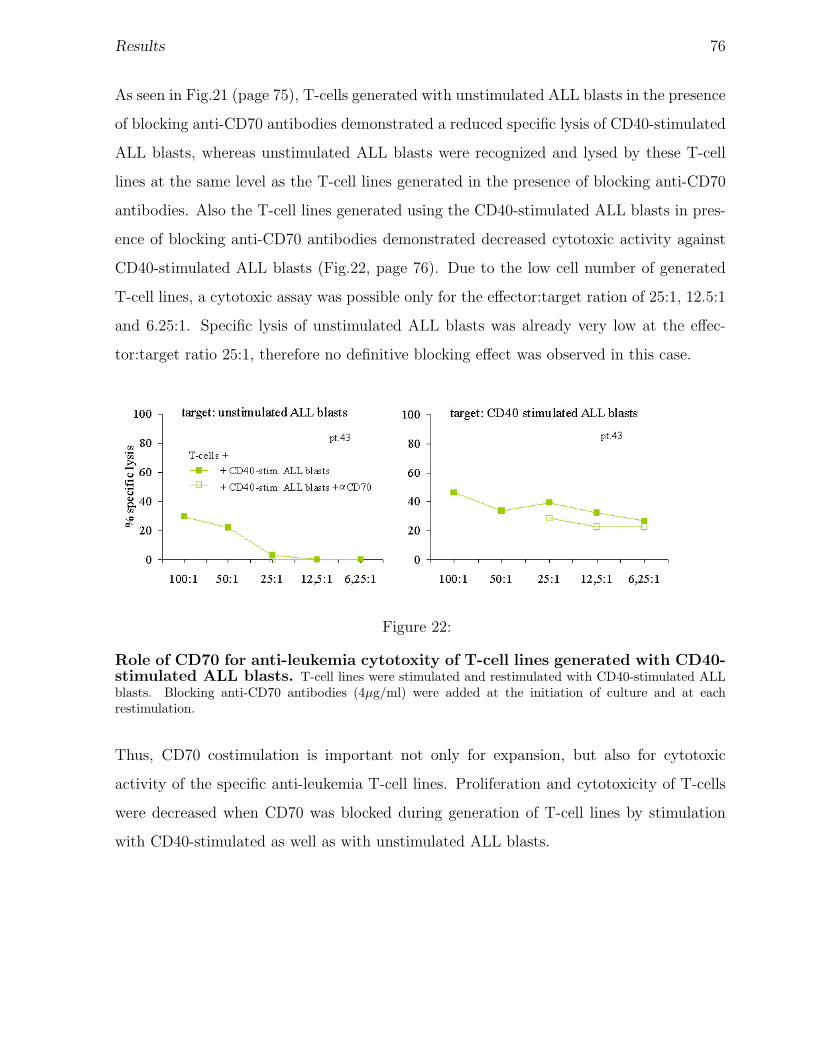
Results 76
As seen in Fig.21 (page 75), T-cells generated with unstimulated ALL blasts in the presence
of blocking anti-CD70 antibodies demonstrated a reduced specific lysis of CD40-stimulated
ALL blasts, whereas unstimulated ALL blasts were recognized and lysed by these T-cell
lines at the same level as the T-cell lines generated in the presence of blocking anti-CD70
antibodies. Also the T-cell lines generated using the CD40-stimulated ALL blasts in pres-
ence of blocking anti-CD70 antibodies demonstrated decreased cytotoxic activity against
CD40-stimulated ALL blasts (Fig.22, page 76). Due to the low cell number of generated
T-cell lines, a cytotoxic assay was possible only for the effector:target ration of 25:1, 12.5:1
and 6.25:1. Specific lysis of unstimulated ALL blasts was already very low at the effec-
tor:target ratio 25:1, therefore no definitive blocking effect was observed in this case.
Figure 22:
Role of CD70 for anti-leukemia cytotoxity of T-cell lines generated with CD40-stimulated ALL blasts. T-cell lines were stimulated and restimulated with CD40-stimulated ALLblasts. Blocking anti-CD70 antibodies (4µg/ml) were added at the initiation of culture and at eachrestimulation.
Thus, CD70 costimulation is important not only for expansion, but also for cytotoxic
activity of the specific anti-leukemia T-cell lines. Proliferation and cytotoxicity of T-cells
were decreased when CD70 was blocked during generation of T-cell lines by stimulation
with CD40-stimulated as well as with unstimulated ALL blasts.
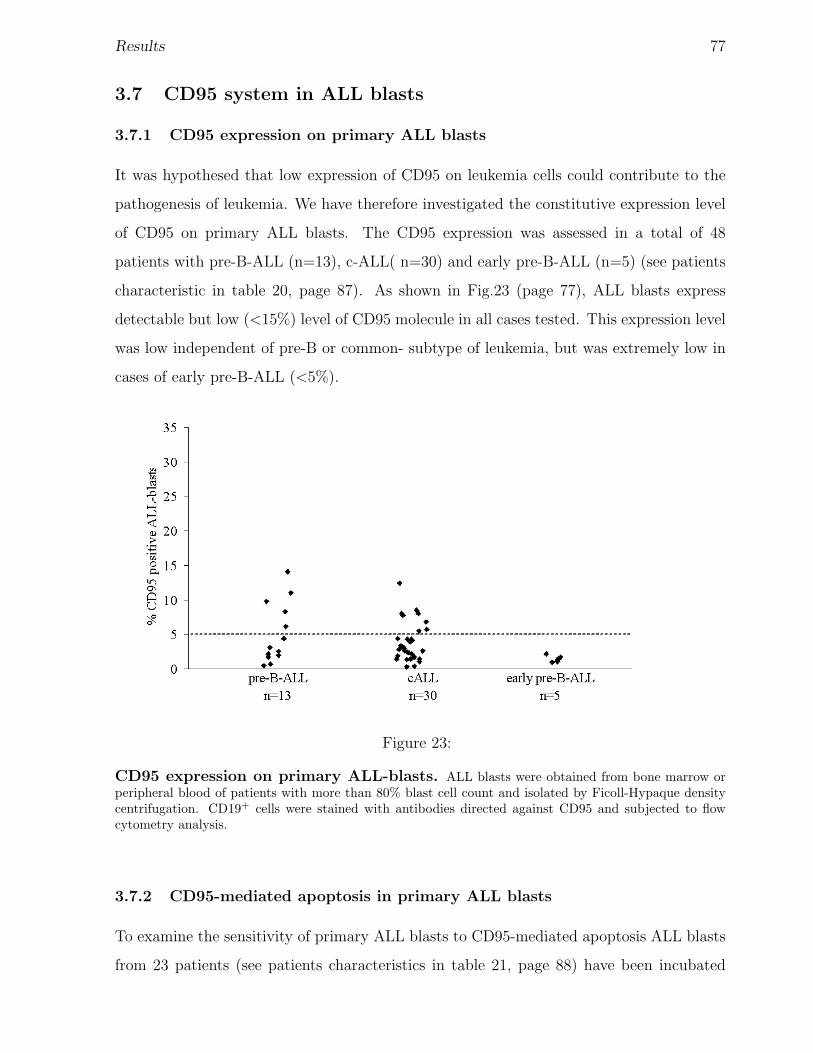
Results 77
3.7 CD95 system in ALL blasts
3.7.1 CD95 expression on primary ALL blasts
It was hypothesed that low expression of CD95 on leukemia cells could contribute to the
pathogenesis of leukemia. We have therefore investigated the constitutive expression level
of CD95 on primary ALL blasts. The CD95 expression was assessed in a total of 48
patients with pre-B-ALL (n=13), c-ALL( n=30) and early pre-B-ALL (n=5) (see patients
characteristic in table 20, page 87). As shown in Fig.23 (page 77), ALL blasts express
detectable but low (<15%) level of CD95 molecule in all cases tested. This expression level
was low independent of pre-B or common- subtype of leukemia, but was extremely low in
cases of early pre-B-ALL (<5%).
Figure 23:
CD95 expression on primary ALL-blasts. ALL blasts were obtained from bone marrow orperipheral blood of patients with more than 80% blast cell count and isolated by Ficoll-Hypaque densitycentrifugation. CD19+ cells were stained with antibodies directed against CD95 and subjected to flowcytometry analysis.
3.7.2 CD95-mediated apoptosis in primary ALL blasts
To examine the sensitivity of primary ALL blasts to CD95-mediated apoptosis ALL blasts
from 23 patients (see patients characteristics in table 21, page 88) have been incubated
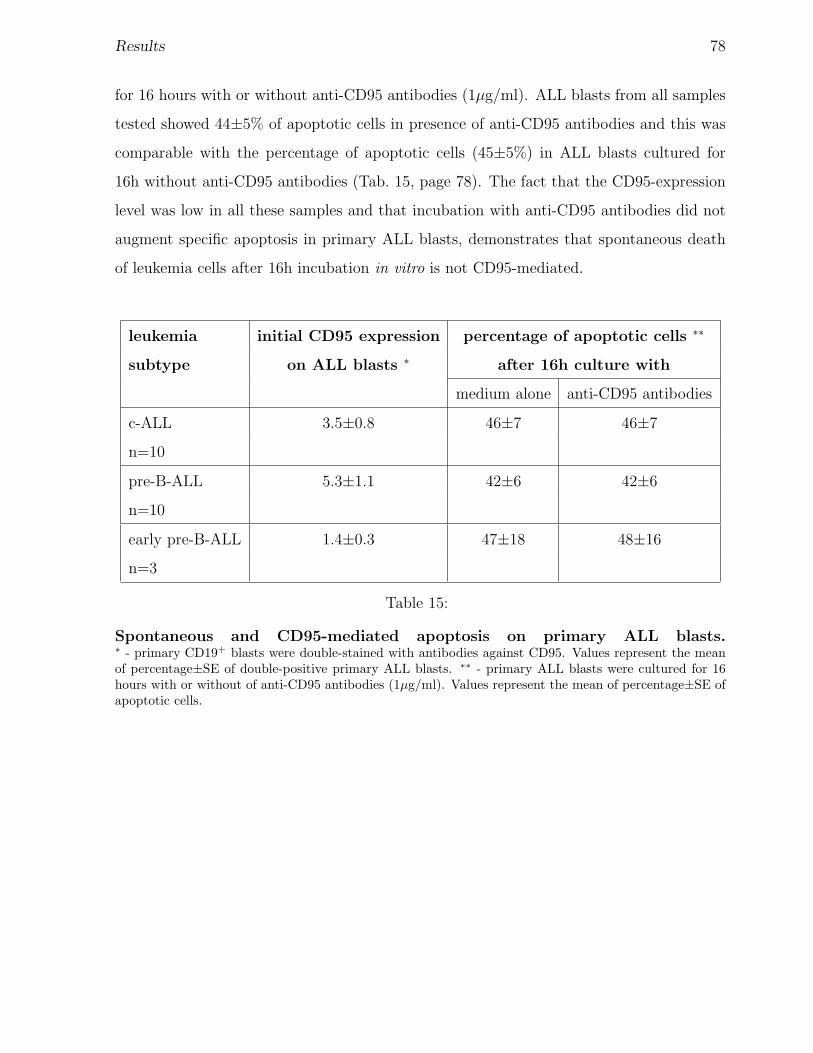
Results 78
for 16 hours with or without anti-CD95 antibodies (1µg/ml). ALL blasts from all samples
tested showed 44±5% of apoptotic cells in presence of anti-CD95 antibodies and this was
comparable with the percentage of apoptotic cells (45±5%) in ALL blasts cultured for
16h without anti-CD95 antibodies (Tab. 15, page 78). The fact that the CD95-expression
level was low in all these samples and that incubation with anti-CD95 antibodies did not
augment specific apoptosis in primary ALL blasts, demonstrates that spontaneous death
of leukemia cells after 16h incubation in vitro is not CD95-mediated.
leukemia initial CD95 expression percentage of apoptotic cells ∗∗
subtype on ALL blasts ∗ after 16h culture with
medium alone anti-CD95 antibodies
c-ALL 3.5±0.8 46±7 46±7
n=10
pre-B-ALL 5.3±1.1 42±6 42±6
n=10
early pre-B-ALL 1.4±0.3 47±18 48±16
n=3
Table 15:
Spontaneous and CD95-mediated apoptosis on primary ALL blasts.∗ - primary CD19+ blasts were double-stained with antibodies against CD95. Values represent the meanof percentage±SE of double-positive primary ALL blasts. ∗∗ - primary ALL blasts were cultured for 16hours with or without of anti-CD95 antibodies (1µg/ml). Values represent the mean of percentage±SE ofapoptotic cells.
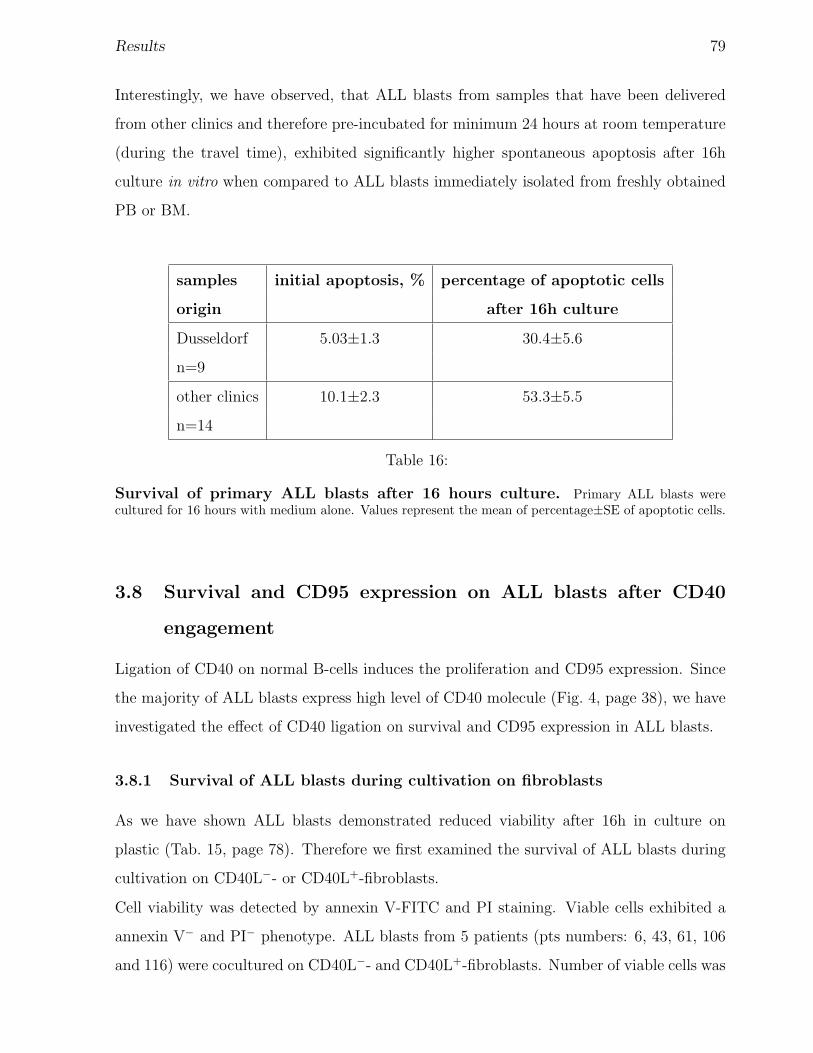
Results 79
Interestingly, we have observed, that ALL blasts from samples that have been delivered
from other clinics and therefore pre-incubated for minimum 24 hours at room temperature
(during the travel time), exhibited significantly higher spontaneous apoptosis after 16h
culture in vitro when compared to ALL blasts immediately isolated from freshly obtained
PB or BM.
samples initial apoptosis, % percentage of apoptotic cells
origin after 16h culture
Dusseldorf 5.03±1.3 30.4±5.6
n=9
other clinics 10.1±2.3 53.3±5.5
n=14
Table 16:
Survival of primary ALL blasts after 16 hours culture. Primary ALL blasts werecultured for 16 hours with medium alone. Values represent the mean of percentage±SE of apoptotic cells.
3.8 Survival and CD95 expression on ALL blasts after CD40
engagement
Ligation of CD40 on normal B-cells induces the proliferation and CD95 expression. Since
the majority of ALL blasts express high level of CD40 molecule (Fig. 4, page 38), we have
investigated the effect of CD40 ligation on survival and CD95 expression in ALL blasts.
3.8.1 Survival of ALL blasts during cultivation on fibroblasts
As we have shown ALL blasts demonstrated reduced viability after 16h in culture on
plastic (Tab. 15, page 78). Therefore we first examined the survival of ALL blasts during
cultivation on CD40L−- or CD40L+-fibroblasts.
Cell viability was detected by annexin V-FITC and PI staining. Viable cells exhibited a
annexin V− and PI− phenotype. ALL blasts from 5 patients (pts numbers: 6, 43, 61, 106
and 116) were cocultured on CD40L−- and CD40L+-fibroblasts. Number of viable cells was
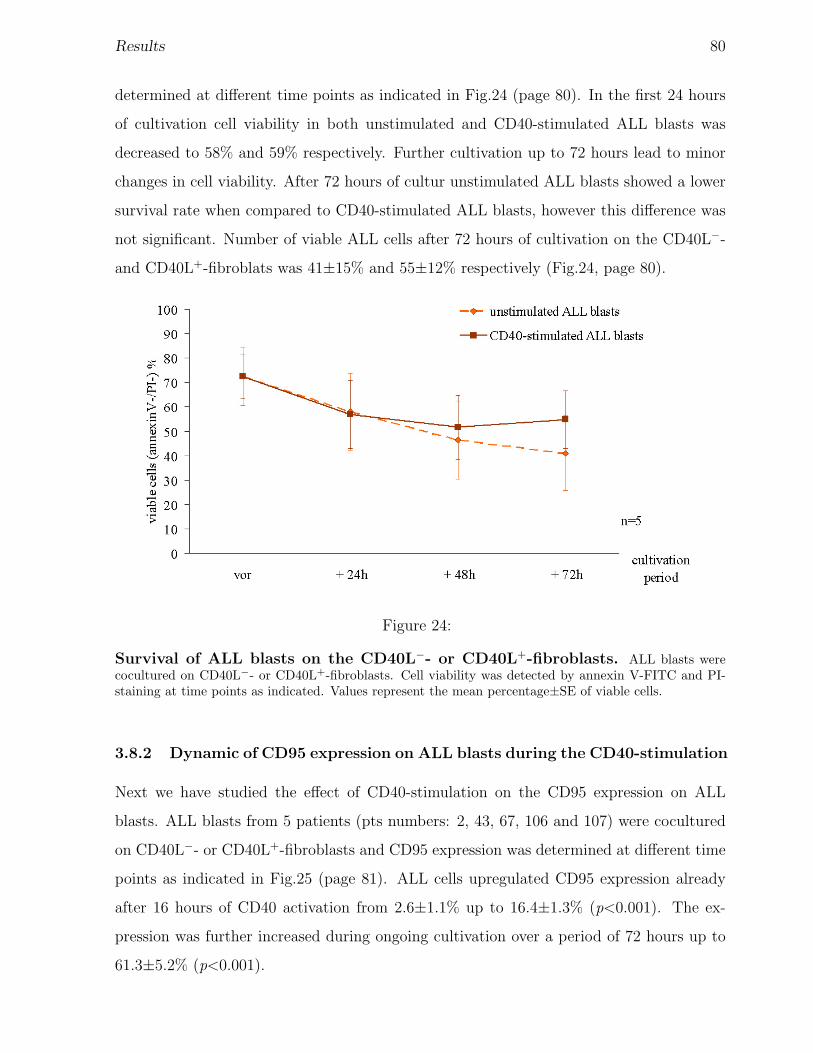
Results 80
determined at different time points as indicated in Fig.24 (page 80). In the first 24 hours
of cultivation cell viability in both unstimulated and CD40-stimulated ALL blasts was
decreased to 58% and 59% respectively. Further cultivation up to 72 hours lead to minor
changes in cell viability. After 72 hours of cultur unstimulated ALL blasts showed a lower
survival rate when compared to CD40-stimulated ALL blasts, however this difference was
not significant. Number of viable ALL cells after 72 hours of cultivation on the CD40L−-
and CD40L+-fibroblats was 41±15% and 55±12% respectively (Fig.24, page 80).
Figure 24:
Survival of ALL blasts on the CD40L−- or CD40L+-fibroblasts. ALL blasts werecocultured on CD40L−- or CD40L+-fibroblasts. Cell viability was detected by annexin V-FITC and PI-staining at time points as indicated. Values represent the mean percentage±SE of viable cells.
3.8.2 Dynamic of CD95 expression on ALL blasts during the CD40-stimulation
Next we have studied the effect of CD40-stimulation on the CD95 expression on ALL
blasts. ALL blasts from 5 patients (pts numbers: 2, 43, 67, 106 and 107) were cocultured
on CD40L−- or CD40L+-fibroblasts and CD95 expression was determined at different time
points as indicated in Fig.25 (page 81). ALL cells upregulated CD95 expression already
after 16 hours of CD40 activation from 2.6±1.1% up to 16.4±1.3% (p<0.001). The ex-
pression was further increased during ongoing cultivation over a period of 72 hours up to
61.3±5.2% (p<0.001).
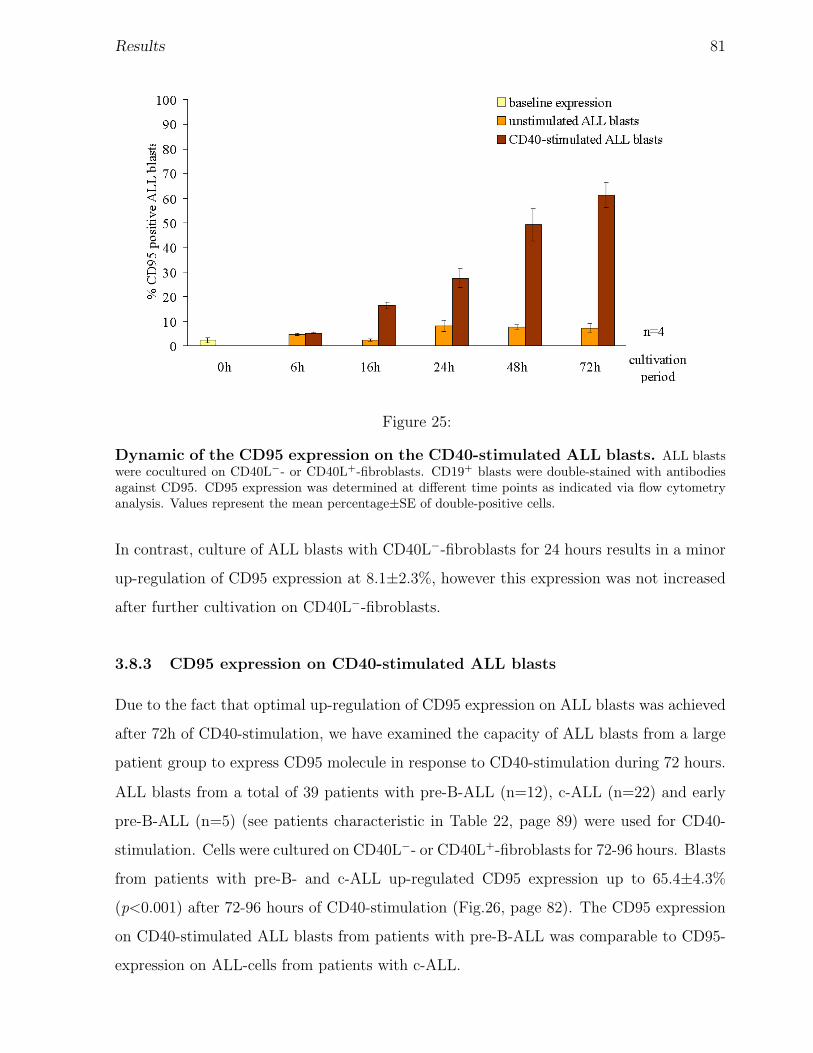
Results 81
Figure 25:
Dynamic of the CD95 expression on the CD40-stimulated ALL blasts. ALL blastswere cocultured on CD40L−- or CD40L+-fibroblasts. CD19+ blasts were double-stained with antibodiesagainst CD95. CD95 expression was determined at different time points as indicated via flow cytometryanalysis. Values represent the mean percentage±SE of double-positive cells.
In contrast, culture of ALL blasts with CD40L−-fibroblasts for 24 hours results in a minor
up-regulation of CD95 expression at 8.1±2.3%, however this expression was not increased
after further cultivation on CD40L−-fibroblasts.
3.8.3 CD95 expression on CD40-stimulated ALL blasts
Due to the fact that optimal up-regulation of CD95 expression on ALL blasts was achieved
after 72h of CD40-stimulation, we have examined the capacity of ALL blasts from a large
patient group to express CD95 molecule in response to CD40-stimulation during 72 hours.
ALL blasts from a total of 39 patients with pre-B-ALL (n=12), c-ALL (n=22) and early
pre-B-ALL (n=5) (see patients characteristic in Table 22, page 89) were used for CD40-
stimulation. Cells were cultured on CD40L−- or CD40L+-fibroblasts for 72-96 hours. Blasts
from patients with pre-B- and c-ALL up-regulated CD95 expression up to 65.4±4.3%
(p<0.001) after 72-96 hours of CD40-stimulation (Fig.26, page 82). The CD95 expression
on CD40-stimulated ALL blasts from patients with pre-B-ALL was comparable to CD95-
expression on ALL-cells from patients with c-ALL.
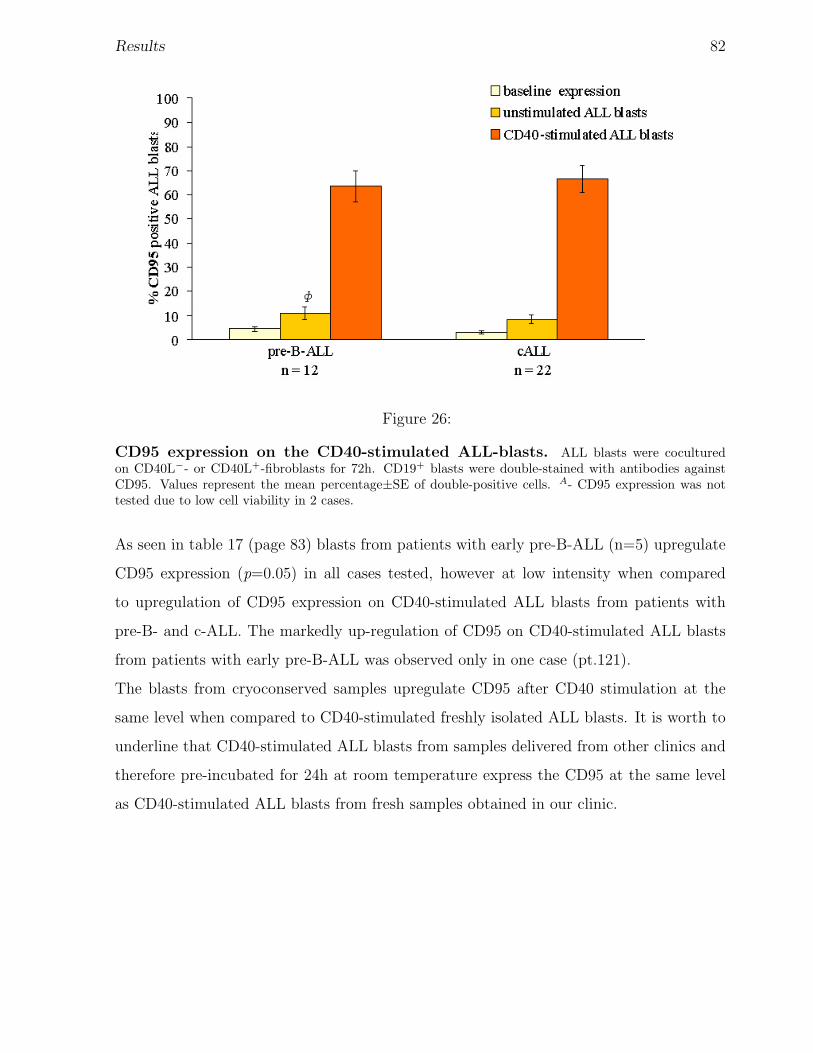
Results 82
Figure 26:
CD95 expression on the CD40-stimulated ALL-blasts. ALL blasts were coculturedon CD40L−- or CD40L+-fibroblasts for 72h. CD19+ blasts were double-stained with antibodies againstCD95. Values represent the mean percentage±SE of double-positive cells. A- CD95 expression was nottested due to low cell viability in 2 cases.
As seen in table 17 (page 83) blasts from patients with early pre-B-ALL (n=5) upregulate
CD95 expression (p=0.05) in all cases tested, however at low intensity when compared
to upregulation of CD95 expression on CD40-stimulated ALL blasts from patients with
pre-B- and c-ALL. The markedly up-regulation of CD95 on CD40-stimulated ALL blasts
from patients with early pre-B-ALL was observed only in one case (pt.121).
The blasts from cryoconserved samples upregulate CD95 after CD40 stimulation at the
same level when compared to CD40-stimulated freshly isolated ALL blasts. It is worth to
underline that CD40-stimulated ALL blasts from samples delivered from other clinics and
therefore pre-incubated for 24h at room temperature express the CD95 at the same level
as CD40-stimulated ALL blasts from fresh samples obtained in our clinic.
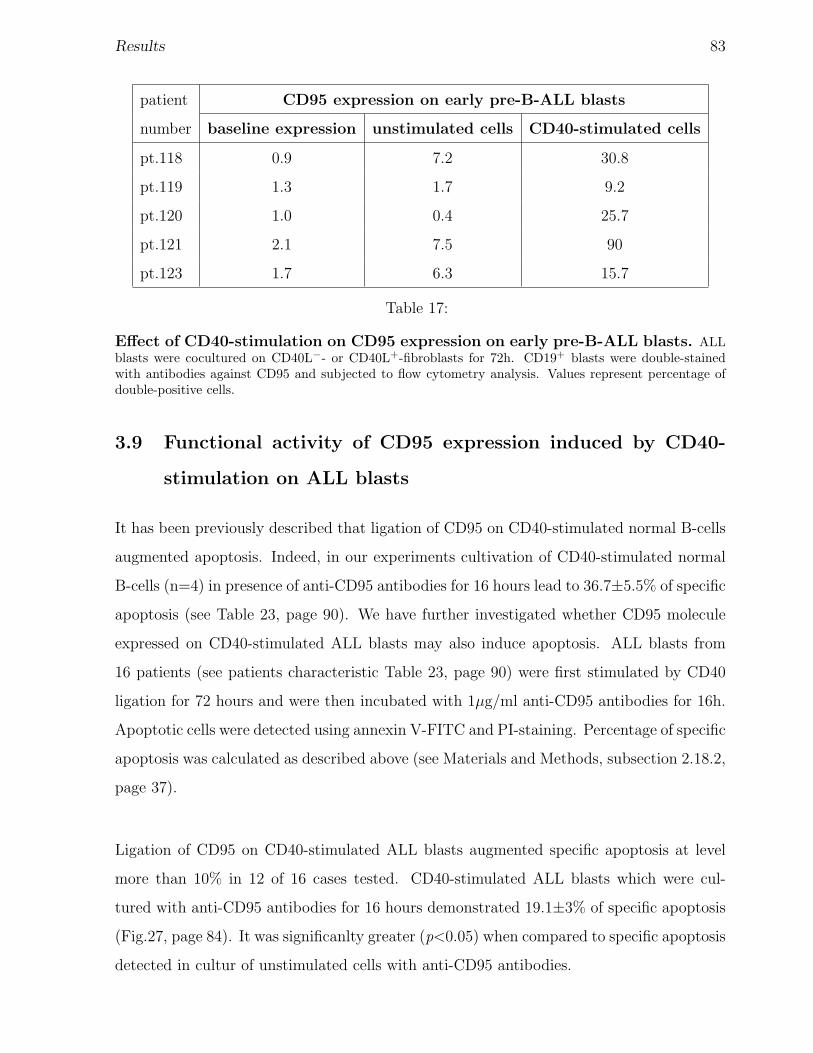
Results 83
patient CD95 expression on early pre-B-ALL blasts
number baseline expression unstimulated cells CD40-stimulated cells
pt.118 0.9 7.2 30.8
pt.119 1.3 1.7 9.2
pt.120 1.0 0.4 25.7
pt.121 2.1 7.5 90
pt.123 1.7 6.3 15.7
Table 17:
Effect of CD40-stimulation on CD95 expression on early pre-B-ALL blasts. ALLblasts were cocultured on CD40L−- or CD40L+-fibroblasts for 72h. CD19+ blasts were double-stainedwith antibodies against CD95 and subjected to flow cytometry analysis. Values represent percentage ofdouble-positive cells.
3.9 Functional activity of CD95 expression induced by CD40-
stimulation on ALL blasts
It has been previously described that ligation of CD95 on CD40-stimulated normal B-cells
augmented apoptosis. Indeed, in our experiments cultivation of CD40-stimulated normal
B-cells (n=4) in presence of anti-CD95 antibodies for 16 hours lead to 36.7±5.5% of specific
apoptosis (see Table 23, page 90). We have further investigated whether CD95 molecule
expressed on CD40-stimulated ALL blasts may also induce apoptosis. ALL blasts from
16 patients (see patients characteristic Table 23, page 90) were first stimulated by CD40
ligation for 72 hours and were then incubated with 1µg/ml anti-CD95 antibodies for 16h.
Apoptotic cells were detected using annexin V-FITC and PI-staining. Percentage of specific
apoptosis was calculated as described above (see Materials and Methods, subsection 2.18.2,
page 37).
Ligation of CD95 on CD40-stimulated ALL blasts augmented specific apoptosis at level
more than 10% in 12 of 16 cases tested. CD40-stimulated ALL blasts which were cul-
tured with anti-CD95 antibodies for 16 hours demonstrated 19.1±3% of specific apoptosis
(Fig.27, page 84). It was significanlty greater (p<0.05) when compared to specific apoptosis
detected in cultur of unstimulated cells with anti-CD95 antibodies.
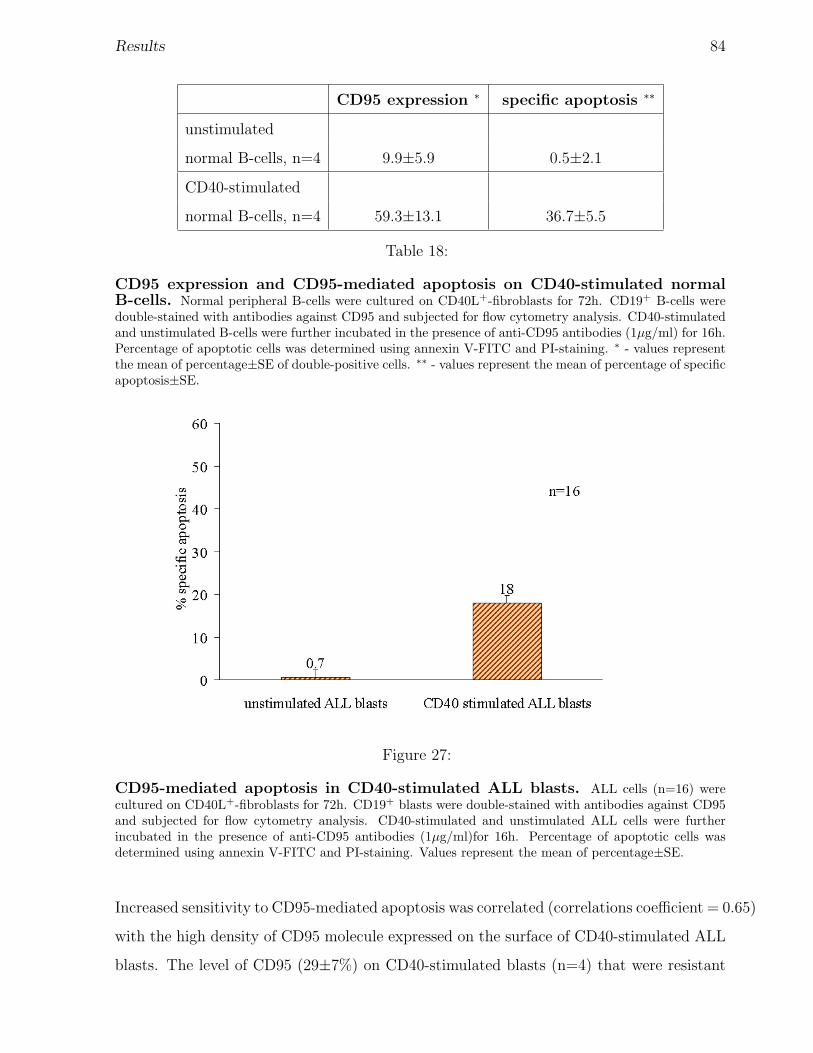
Results 84
CD95 expression ∗ specific apoptosis ∗∗
unstimulated
normal B-cells, n=4 9.9±5.9 0.5±2.1
CD40-stimulated
normal B-cells, n=4 59.3±13.1 36.7±5.5
Table 18:
CD95 expression and CD95-mediated apoptosis on CD40-stimulated normalB-cells. Normal peripheral B-cells were cultured on CD40L+-fibroblasts for 72h. CD19+ B-cells weredouble-stained with antibodies against CD95 and subjected for flow cytometry analysis. CD40-stimulatedand unstimulated B-cells were further incubated in the presence of anti-CD95 antibodies (1µg/ml) for 16h.Percentage of apoptotic cells was determined using annexin V-FITC and PI-staining. ∗ - values representthe mean of percentage±SE of double-positive cells. ∗∗ - values represent the mean of percentage of specificapoptosis±SE.
Figure 27:
CD95-mediated apoptosis in CD40-stimulated ALL blasts. ALL cells (n=16) werecultured on CD40L+-fibroblasts for 72h. CD19+ blasts were double-stained with antibodies against CD95and subjected for flow cytometry analysis. CD40-stimulated and unstimulated ALL cells were furtherincubated in the presence of anti-CD95 antibodies (1µg/ml)for 16h. Percentage of apoptotic cells wasdetermined using annexin V-FITC and PI-staining. Values represent the mean of percentage±SE.
Increased sensitivity to CD95-mediated apoptosis was correlated (correlations coefficient = 0.65)
with the high density of CD95 molecule expressed on the surface of CD40-stimulated ALL
blasts. The level of CD95 (29±7%) on CD40-stimulated blasts (n=4) that were resistant
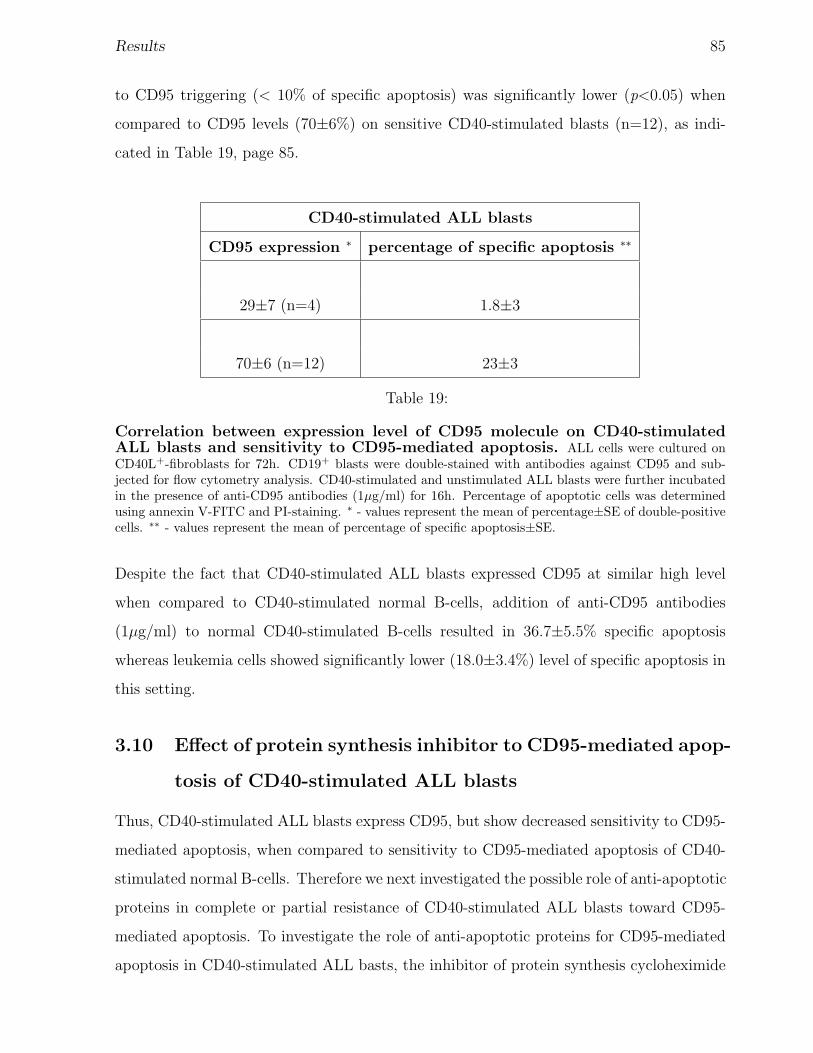
Results 85
to CD95 triggering (< 10% of specific apoptosis) was significantly lower (p<0.05) when
compared to CD95 levels (70±6%) on sensitive CD40-stimulated blasts (n=12), as indi-
cated in Table 19, page 85.
CD40-stimulated ALL blasts
CD95 expression ∗ percentage of specific apoptosis ∗∗
29±7 (n=4) 1.8±3
70±6 (n=12) 23±3
Table 19:
Correlation between expression level of CD95 molecule on CD40-stimulatedALL blasts and sensitivity to CD95-mediated apoptosis. ALL cells were cultured onCD40L+-fibroblasts for 72h. CD19+ blasts were double-stained with antibodies against CD95 and sub-jected for flow cytometry analysis. CD40-stimulated and unstimulated ALL blasts were further incubatedin the presence of anti-CD95 antibodies (1µg/ml) for 16h. Percentage of apoptotic cells was determinedusing annexin V-FITC and PI-staining. ∗ - values represent the mean of percentage±SE of double-positivecells. ∗∗ - values represent the mean of percentage of specific apoptosis±SE.
Despite the fact that CD40-stimulated ALL blasts expressed CD95 at similar high level
when compared to CD40-stimulated normal B-cells, addition of anti-CD95 antibodies
(1µg/ml) to normal CD40-stimulated B-cells resulted in 36.7±5.5% specific apoptosis
whereas leukemia cells showed significantly lower (18.0±3.4%) level of specific apoptosis in
this setting.
3.10 Effect of protein synthesis inhibitor to CD95-mediated apop-
tosis of CD40-stimulated ALL blasts
Thus, CD40-stimulated ALL blasts express CD95, but show decreased sensitivity to CD95-
mediated apoptosis, when compared to sensitivity to CD95-mediated apoptosis of CD40-
stimulated normal B-cells. Therefore we next investigated the possible role of anti-apoptotic
proteins in complete or partial resistance of CD40-stimulated ALL blasts toward CD95-
mediated apoptosis. To investigate the role of anti-apoptotic proteins for CD95-mediated
apoptosis in CD40-stimulated ALL basts, the inhibitor of protein synthesis cycloheximide
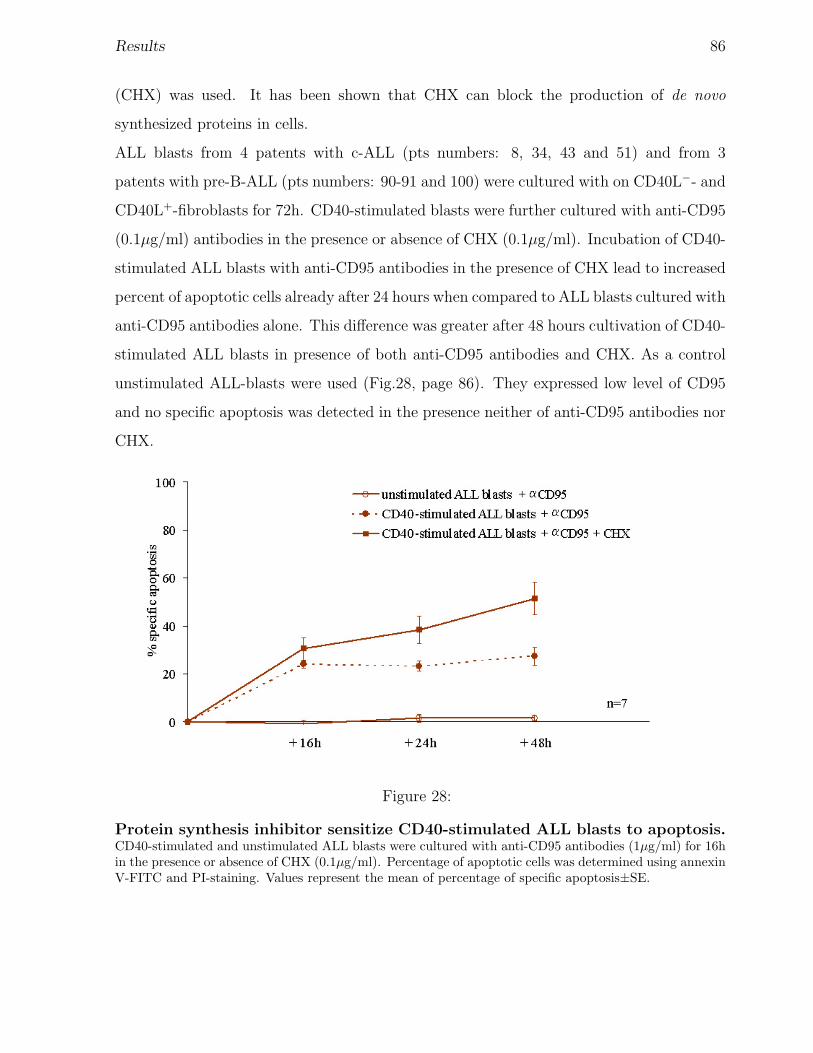
Results 86
(CHX) was used. It has been shown that CHX can block the production of de novo
synthesized proteins in cells.
ALL blasts from 4 patents with c-ALL (pts numbers: 8, 34, 43 and 51) and from 3
patents with pre-B-ALL (pts numbers: 90-91 and 100) were cultured with on CD40L−- and
CD40L+-fibroblasts for 72h. CD40-stimulated blasts were further cultured with anti-CD95
(0.1µg/ml) antibodies in the presence or absence of CHX (0.1µg/ml). Incubation of CD40-
stimulated ALL blasts with anti-CD95 antibodies in the presence of CHX lead to increased
percent of apoptotic cells already after 24 hours when compared to ALL blasts cultured with
anti-CD95 antibodies alone. This difference was greater after 48 hours cultivation of CD40-
stimulated ALL blasts in presence of both anti-CD95 antibodies and CHX. As a control
unstimulated ALL-blasts were used (Fig.28, page 86). They expressed low level of CD95
and no specific apoptosis was detected in the presence neither of anti-CD95 antibodies nor
CHX.
Figure 28:
Protein synthesis inhibitor sensitize CD40-stimulated ALL blasts to apoptosis.CD40-stimulated and unstimulated ALL blasts were cultured with anti-CD95 antibodies (1µg/ml) for 16hin the presence or absence of CHX (0.1µg/ml). Percentage of apoptotic cells was determined using annexinV-FITC and PI-staining. Values represent the mean of percentage of specific apoptosis±SE.
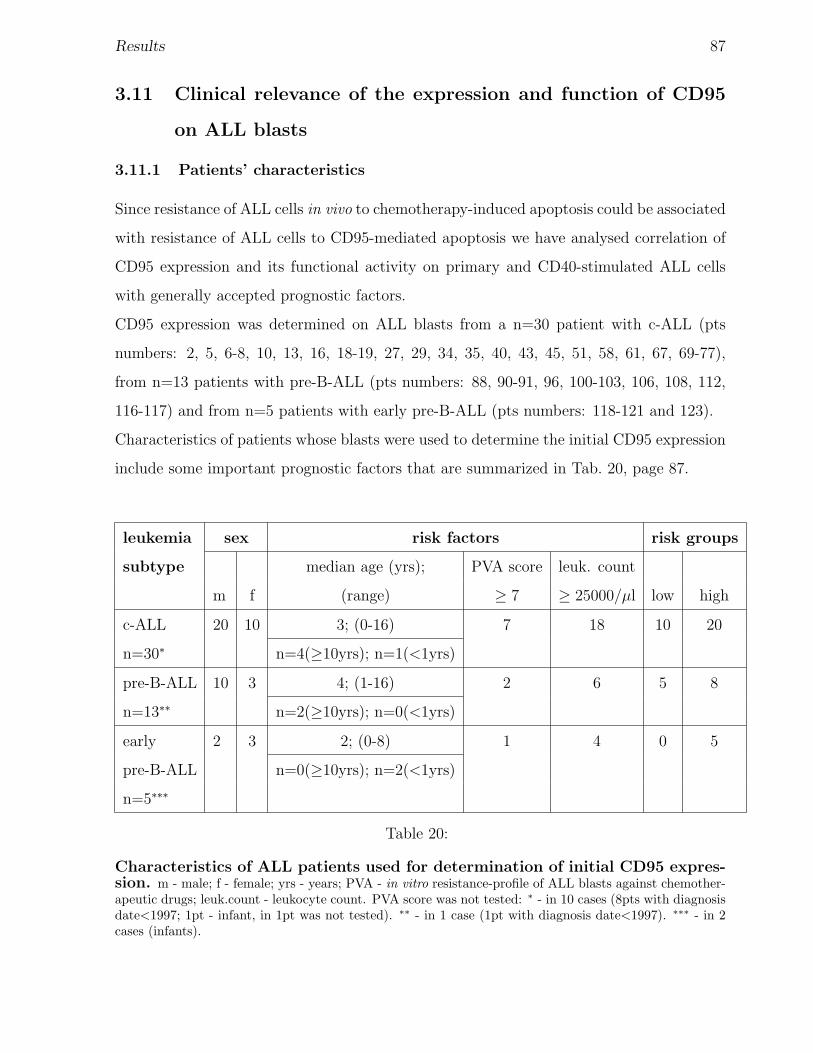
Results 87
3.11 Clinical relevance of the expression and function of CD95
on ALL blasts
3.11.1 Patients’ characteristics
Since resistance of ALL cells in vivo to chemotherapy-induced apoptosis could be associated
with resistance of ALL cells to CD95-mediated apoptosis we have analysed correlation of
CD95 expression and its functional activity on primary and CD40-stimulated ALL cells
with generally accepted prognostic factors.
CD95 expression was determined on ALL blasts from a n=30 patient with c-ALL (pts
numbers: 2, 5, 6-8, 10, 13, 16, 18-19, 27, 29, 34, 35, 40, 43, 45, 51, 58, 61, 67, 69-77),
from n=13 patients with pre-B-ALL (pts numbers: 88, 90-91, 96, 100-103, 106, 108, 112,
116-117) and from n=5 patients with early pre-B-ALL (pts numbers: 118-121 and 123).
Characteristics of patients whose blasts were used to determine the initial CD95 expression
include some important prognostic factors that are summarized in Tab. 20, page 87.
leukemia sex risk factors risk groups
subtype median age (yrs); PVA score leuk. count
m f (range) ≥ 7 ≥ 25000/µl low high
c-ALL 20 10 3; (0-16) 7 18 10 20
n=30∗ n=4(≥10yrs); n=1(<1yrs)
pre-B-ALL 10 3 4; (1-16) 2 6 5 8
n=13∗∗ n=2(≥10yrs); n=0(<1yrs)
early 2 3 2; (0-8) 1 4 0 5
pre-B-ALL n=0(≥10yrs); n=2(<1yrs)
n=5∗∗∗
Table 20:
Characteristics of ALL patients used for determination of initial CD95 expres-sion. m - male; f - female; yrs - years; PVA - in vitro resistance-profile of ALL blasts against chemother-apeutic drugs; leuk.count - leukocyte count. PVA score was not tested: ∗ - in 10 cases (8pts with diagnosisdate<1997; 1pt - infant, in 1pt was not tested). ∗∗ - in 1 case (1pt with diagnosis date<1997). ∗∗∗ - in 2cases (infants).
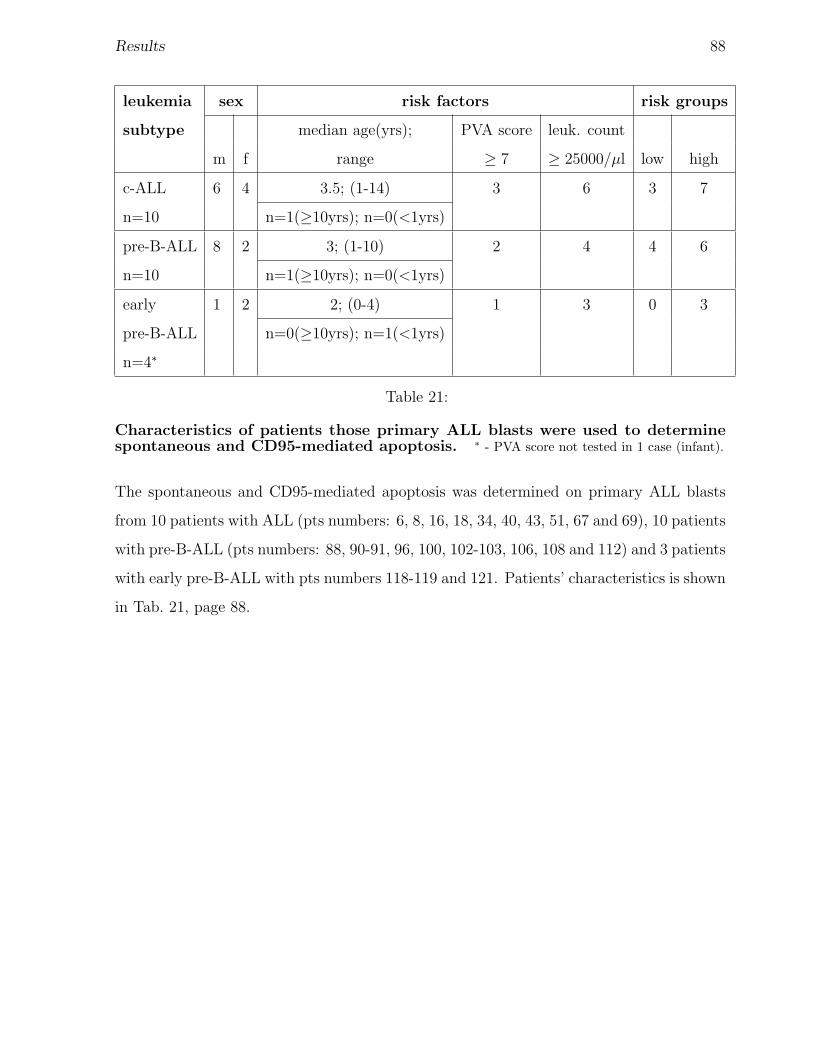
Results 88
leukemia sex risk factors risk groups
subtype median age(yrs); PVA score leuk. count
m f range ≥ 7 ≥ 25000/µl low high
c-ALL 6 4 3.5; (1-14) 3 6 3 7
n=10 n=1(≥10yrs); n=0(<1yrs)
pre-B-ALL 8 2 3; (1-10) 2 4 4 6
n=10 n=1(≥10yrs); n=0(<1yrs)
early 1 2 2; (0-4) 1 3 0 3
pre-B-ALL n=0(≥10yrs); n=1(<1yrs)
n=4∗
Table 21:
Characteristics of patients those primary ALL blasts were used to determinespontaneous and CD95-mediated apoptosis. ∗ - PVA score not tested in 1 case (infant).
The spontaneous and CD95-mediated apoptosis was determined on primary ALL blasts
from 10 patients with ALL (pts numbers: 6, 8, 16, 18, 34, 40, 43, 51, 67 and 69), 10 patients
with pre-B-ALL (pts numbers: 88, 90-91, 96, 100, 102-103, 106, 108 and 112) and 3 patients
with early pre-B-ALL with pts numbers 118-119 and 121. Patients’ characteristics is shown
in Tab. 21, page 88.
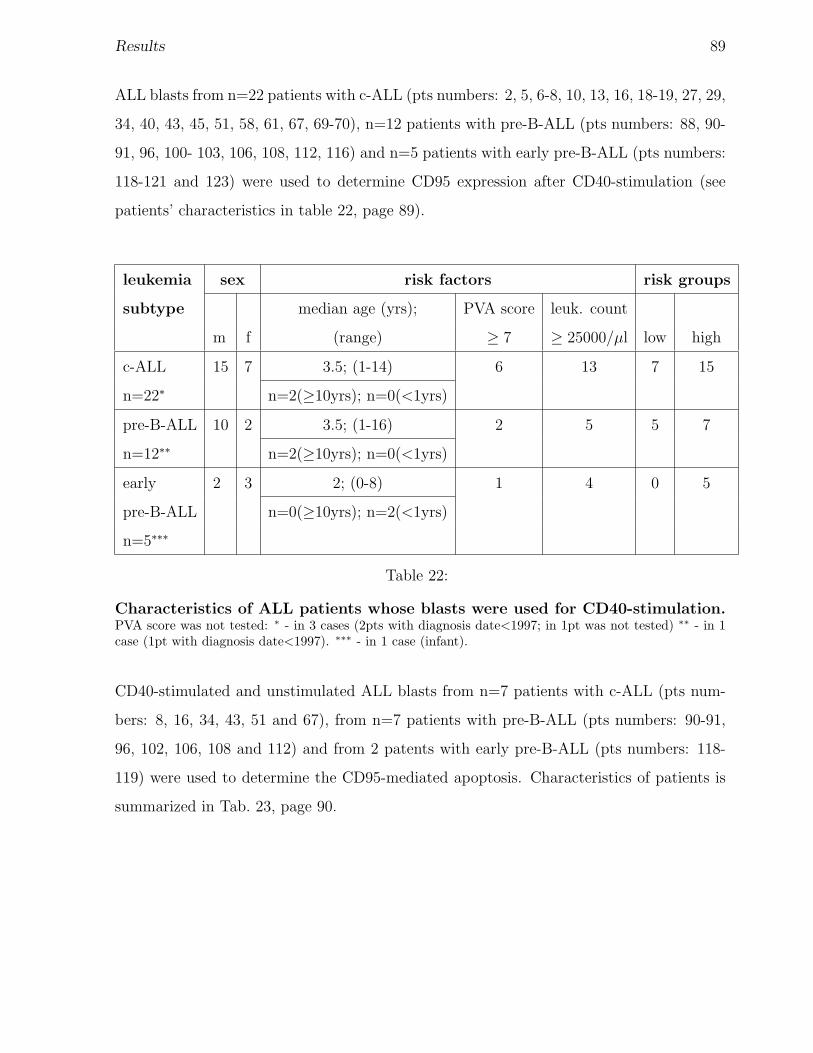
Results 89
ALL blasts from n=22 patients with c-ALL (pts numbers: 2, 5, 6-8, 10, 13, 16, 18-19, 27, 29,
34, 40, 43, 45, 51, 58, 61, 67, 69-70), n=12 patients with pre-B-ALL (pts numbers: 88, 90-
91, 96, 100- 103, 106, 108, 112, 116) and n=5 patients with early pre-B-ALL (pts numbers:
118-121 and 123) were used to determine CD95 expression after CD40-stimulation (see
patients’ characteristics in table 22, page 89).
leukemia sex risk factors risk groups
subtype median age (yrs); PVA score leuk. count
m f (range) ≥ 7 ≥ 25000/µl low high
c-ALL 15 7 3.5; (1-14) 6 13 7 15
n=22∗ n=2(≥10yrs); n=0(<1yrs)
pre-B-ALL 10 2 3.5; (1-16) 2 5 5 7
n=12∗∗ n=2(≥10yrs); n=0(<1yrs)
early 2 3 2; (0-8) 1 4 0 5
pre-B-ALL n=0(≥10yrs); n=2(<1yrs)
n=5∗∗∗
Table 22:
Characteristics of ALL patients whose blasts were used for CD40-stimulation.PVA score was not tested: ∗ - in 3 cases (2pts with diagnosis date<1997; in 1pt was not tested) ∗∗ - in 1case (1pt with diagnosis date<1997). ∗∗∗ - in 1 case (infant).
CD40-stimulated and unstimulated ALL blasts from n=7 patients with c-ALL (pts num-
bers: 8, 16, 34, 43, 51 and 67), from n=7 patients with pre-B-ALL (pts numbers: 90-91,
96, 102, 106, 108 and 112) and from 2 patents with early pre-B-ALL (pts numbers: 118-
119) were used to determine the CD95-mediated apoptosis. Characteristics of patients is
summarized in Tab. 23, page 90.
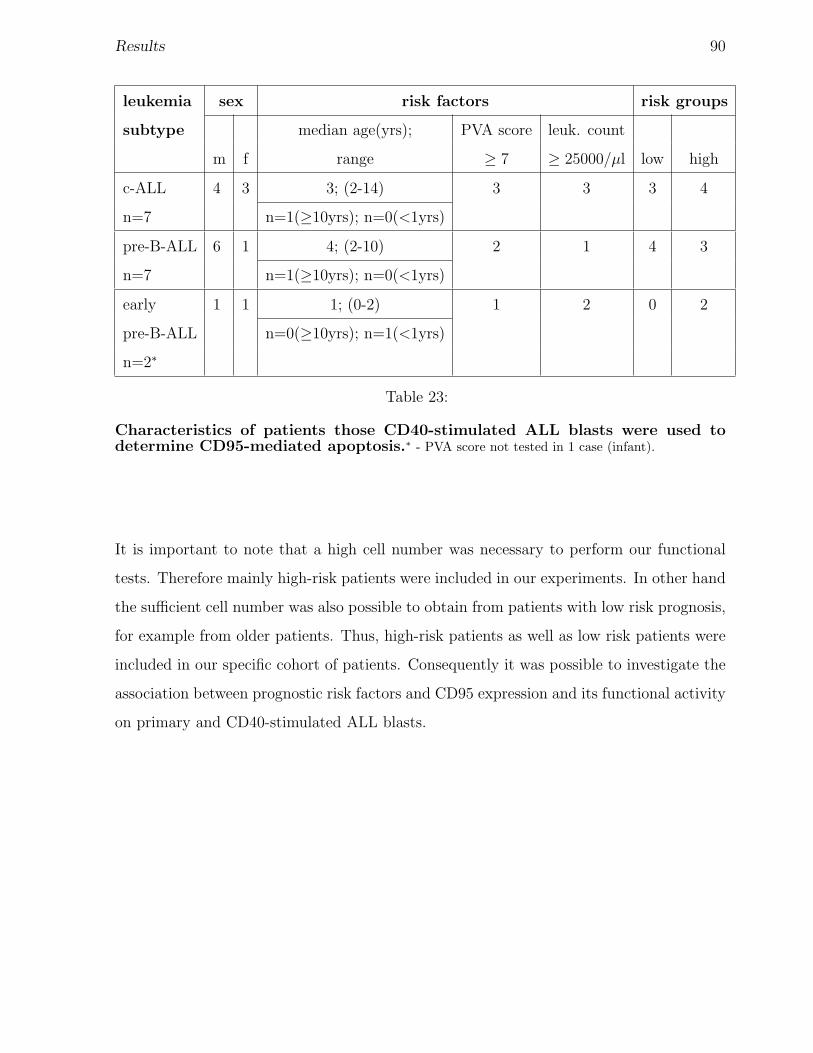
Results 90
leukemia sex risk factors risk groups
subtype median age(yrs); PVA score leuk. count
m f range ≥ 7 ≥ 25000/µl low high
c-ALL 4 3 3; (2-14) 3 3 3 4
n=7 n=1(≥10yrs); n=0(<1yrs)
pre-B-ALL 6 1 4; (2-10) 2 1 4 3
n=7 n=1(≥10yrs); n=0(<1yrs)
early 1 1 1; (0-2) 1 2 0 2
pre-B-ALL n=0(≥10yrs); n=1(<1yrs)
n=2∗
Table 23:
Characteristics of patients those CD40-stimulated ALL blasts were used todetermine CD95-mediated apoptosis.∗ - PVA score not tested in 1 case (infant).
It is important to note that a high cell number was necessary to perform our functional
tests. Therefore mainly high-risk patients were included in our experiments. In other hand
the sufficient cell number was also possible to obtain from patients with low risk prognosis,
for example from older patients. Thus, high-risk patients as well as low risk patients were
included in our specific cohort of patients. Consequently it was possible to investigate the
association between prognostic risk factors and CD95 expression and its functional activity
on primary and CD40-stimulated ALL blasts.
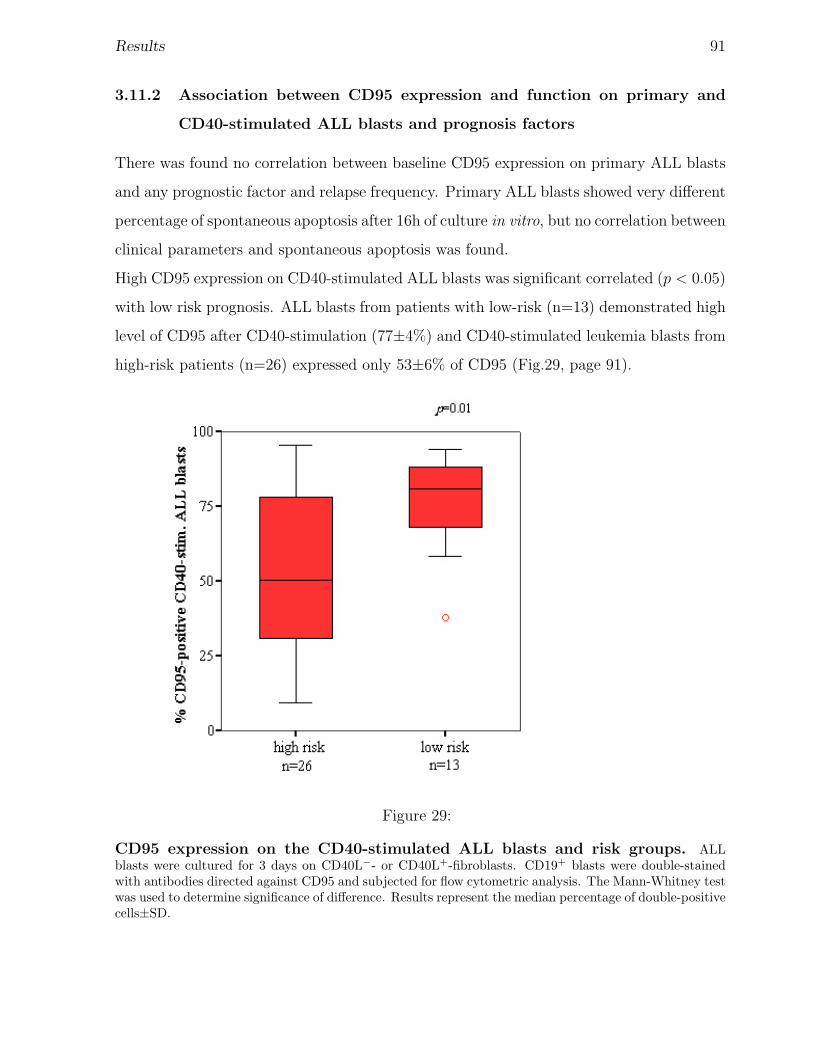
Results 91
3.11.2 Association between CD95 expression and function on primary and
CD40-stimulated ALL blasts and prognosis factors
There was found no correlation between baseline CD95 expression on primary ALL blasts
and any prognostic factor and relapse frequency. Primary ALL blasts showed very different
percentage of spontaneous apoptosis after 16h of culture in vitro, but no correlation between
clinical parameters and spontaneous apoptosis was found.
High CD95 expression on CD40-stimulated ALL blasts was significant correlated (p < 0.05)
with low risk prognosis. ALL blasts from patients with low-risk (n=13) demonstrated high
level of CD95 after CD40-stimulation (77±4%) and CD40-stimulated leukemia blasts from
high-risk patients (n=26) expressed only 53±6% of CD95 (Fig.29, page 91).
Figure 29:
CD95 expression on the CD40-stimulated ALL blasts and risk groups. ALLblasts were cultured for 3 days on CD40L−- or CD40L+-fibroblasts. CD19+ blasts were double-stainedwith antibodies directed against CD95 and subjected for flow cytometric analysis. The Mann-Whitney testwas used to determine significance of difference. Results represent the median percentage of double-positivecells±SD.
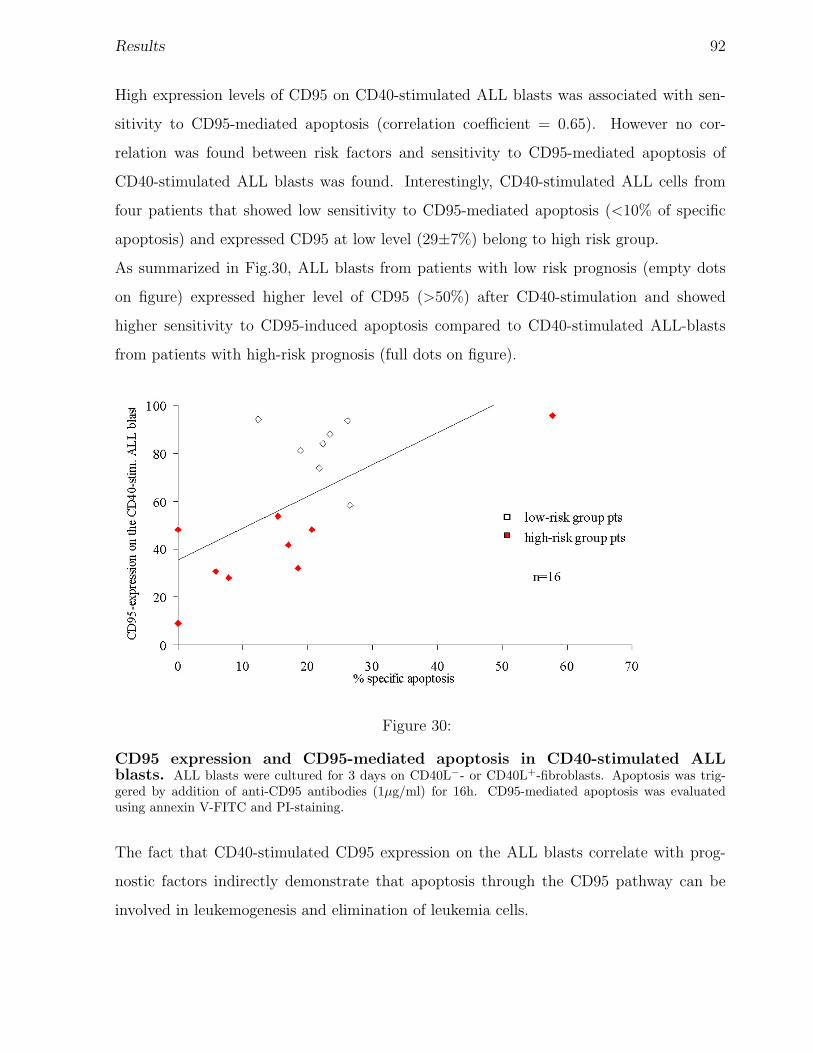
Results 92
High expression levels of CD95 on CD40-stimulated ALL blasts was associated with sen-
sitivity to CD95-mediated apoptosis (correlation coefficient = 0.65). However no cor-
relation was found between risk factors and sensitivity to CD95-mediated apoptosis of
CD40-stimulated ALL blasts was found. Interestingly, CD40-stimulated ALL cells from
four patients that showed low sensitivity to CD95-mediated apoptosis (<10% of specific
apoptosis) and expressed CD95 at low level (29±7%) belong to high risk group.
As summarized in Fig.30, ALL blasts from patients with low risk prognosis (empty dots
on figure) expressed higher level of CD95 (>50%) after CD40-stimulation and showed
higher sensitivity to CD95-induced apoptosis compared to CD40-stimulated ALL-blasts
from patients with high-risk prognosis (full dots on figure).
Figure 30:
CD95 expression and CD95-mediated apoptosis in CD40-stimulated ALLblasts. ALL blasts were cultured for 3 days on CD40L−- or CD40L+-fibroblasts. Apoptosis was trig-gered by addition of anti-CD95 antibodies (1µg/ml) for 16h. CD95-mediated apoptosis was evaluatedusing annexin V-FITC and PI-staining.
The fact that CD40-stimulated CD95 expression on the ALL blasts correlate with prog-
nostic factors indirectly demonstrate that apoptosis through the CD95 pathway can be
involved in leukemogenesis and elimination of leukemia cells.
93
4 Discussion
In most leukemia patients the intensified radio/chemotherapy can reach a remission. How-
ever, for patients with refractory and relapsed disease the development of novel immunother-
apy is necessary. Despite the facts that immunological effector mechanisms have been
shown to be involved in eradicating leukemia diseases and that leukemia cells usually
express specific antigens that can serve as target structures for anti-leukemia immune re-
sponses [7, 8, 9, 10, 11], acute leukemias tend to escape immune surveillance in the clinical
setting. The lack of costimulatory molecules expression is one of the postulated mechanisms
by which leukemia cells escape the immune surveillance. In addition to CD28-CD80/CD86
interaction that provide necessary second costimulatory signal for the efficient T-cell acti-
vation [26, 27], the CD27-CD70 costimulatory pathway now is also of particular interest.
4.1 Expression of CD70 and CD27 on ALL cells can be modified
via in vitro cocultivation of primary ALL cells with CD40L-
expressing fibroblasts
In consonance with the other findings [50, 51] we also detected the low expression levels of
CD80 and heterogeneous expression levels of CD86 on primary ALL cells (Fig. 5, page 40).
Moreover, we have for the first time examine the CD70 expression on the blasts from great
number (n=101) of ALL patients. The CD70 molecule was barely detectable on the surface
of freshly isolated ALL cells (Fig. 5, page 40). Expression of CD27 was in contrast very
heterogeneously with 40% of ALL patients expressing CD27 at a level of >20% (Fig. 5,
page 40). Low expression of CD70 has also been detected on other malignant B-cells such
as follicular lymphoma cells and chronic lymphocytic leukemia cells [79, 89], but till now
was not reported for ALL cells.
It is well documented that the lack of CD80 and CD86 expression on ALL cells explains
their poor antigen-presenting capacity [50, 51]. Since CD70 is an important costimulatory
molecule involved in antigen-dependent T-cell activation, our observation of low CD70
expression may also contribute to the reduced immunogenicity of ALL cells.
The findings that B-cell-lineage acute lymphoblastic leukemias express CD40 [105] offers
Discussion 94
the possibility to modify the leukemia cells by cocultivation with CD40L-expressing feeder-
cells or with the CD40L-trimer. Since CD40-stimulation of leukemia cells was reported to
upregulate expression of costimulatory molecules [48, 108, 109, 110, 111], we have analysed
the CD40 expression in our specific cohort of patients with ALL and found that more
than 80% cases from ALL patients express CD40 (Fig. 4, page 38). In accordance with
other studies we found that ALL blasts increased CD80 and CD86 expression following
CD40-stimulation (Fig. 6, page 43). Moreover, we demonstrated that CD40-stimulation
upregulated the expression of CD70 in ALL blasts from 43 patients with a concomitant
down-regulation of the CD27 expression (Fig. 8, page 45). Upregulation of CD70 has been
also reported for CLL and FL cells [82, 89], however only in small patients groups.
Interestingly, we observed that also unstimulated ALL blasts cultured on non-transfected
CD40L−-fibroblasts, showed minor upregulation of costimulatory molecules CD80, CD86
and CD70 (Fig. 6 and 8). This could be partly due to the presence of some adhesive
molecules on the fibroblasts or secretion of soluble factors by fibroblasts. These factors
seem to increase the survival of ALL blasts and could stimulate expression of costimulatory
molecules, however, with a much low intensity.
4.2 The CD70-CD27 pathway synergistically enhances the CD80
and CD86-CD28 pathway of antigen presentation by ALL
cells
In many studies it was demonstrated that enhanced through CD40-activation immuno-
genicity of leukemia B-cells can be explained by up-regulation of the expression of CD80
and CD86 costimulatory molecules on their surface [113, 114, 115]. We have investigated
whether increased CD70 expression on the CD40-stimulated ALL blasts is also participated
in the improved antigen-presenting capacity of ALL cells.
In order to dissect the role of the costimulatory molecules CD80/CD86 and CD70 for
the antigen-presenting capacity of CD40-stimulated ALL cells, we examined the effect of
the respective specific blocking antibodies on allogeneic T-cell proliferation and cytokine
production. Our results confirm the previous finding [48, 109, 107] that CD40-stimulated
ALL blasts induce the allogeneic T-cell proliferation that can be reduced by the blocking of
Discussion 95
CD80/CD86 costimulation (Fig. 15, page 61). Moreover, we have shown that blocking of
the CD27-CD70 interaction alone also inhibited T-cell proliferation and IFN-γ secretion,
however only partially (Fig. 15). The blocking of both CD28-CD80/CD86 and CD27-CD70
costimulatory pathways consistently had additive effect on the antigen presenting capacity
of CD40-stimulated ALL cells, confirming that both CD80/CD86 and CD70 molecules
were involved (Fig. 15). The similar results has been obtained on CD40-stimulated FL
cells cultured with allogeneic T-cells [89]. It was demonstrated that blockade of CD70-
CD27 interaction led only to a 25% reduced T-cell proliferation. An additive effect was
observed when CD70-CD27 and CD80/CD86-CD28 were blocked toghether, resulting in
more than 70% inhibition of T-cell proliferation [89].
Also T-cells that have been stimulated with unstimulated ALL blasts showed reduced
proliferation in presence of combination of blocking CD80/CD86/CD70 antibodies (Fig. 16,
page 63). This can be explained by the fact that unstimulated ALL blasts also express
CD80, CD70 and CD86 molecules however at low level. Thus, presence of costimulatory
molecules also at low levels can partially improve the T-cell stimulatory capacity of ALL
blasts.
Thus, our observation demonstrate that expression of both CD70 and CD80/CD86 on ALL
cells seems to be essential for an efficient T-cell stimulation. Our results, together with
other studies [83, 89] confirm that in the induction of T-cell proliferation CD80/CD86 and
CD70 act synergistic, that suggest that cooperation of two signals - through CD28 and
CD27 pathways may be essential for optimal T-cell stimulation.
4.3 The CD70-CD27 pathway is necessary for the generation of
anti-leukemia cytotoxic T-cells
In the next part of our study we have examined the potential of CD40-stimulated ALL
blasts to activate cytotoxic anti-leukemia specific T-cells (CTLs). We have investigated
the requirement of the T-cell costimulation through CD27 by CD70 on ALL cells for the
expansion and cytolytic activity of anti-leukemia CTLs.
By priming with CD40-stimulated ALL blasts and repetitive restimulation and cytokine-
driven expansion, T-cell lines have been established in 4 from 6 cases studied (Tab. 13,
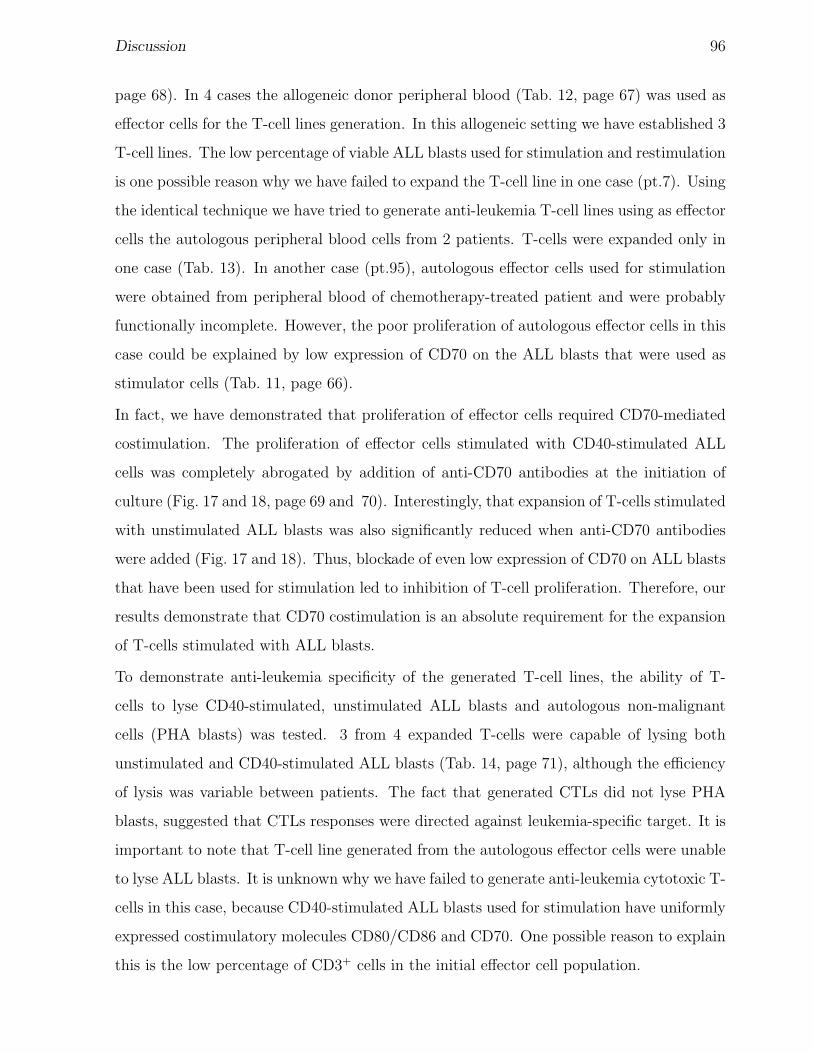
Discussion 96
page 68). In 4 cases the allogeneic donor peripheral blood (Tab. 12, page 67) was used as
effector cells for the T-cell lines generation. In this allogeneic setting we have established 3
T-cell lines. The low percentage of viable ALL blasts used for stimulation and restimulation
is one possible reason why we have failed to expand the T-cell line in one case (pt.7). Using
the identical technique we have tried to generate anti-leukemia T-cell lines using as effector
cells the autologous peripheral blood cells from 2 patients. T-cells were expanded only in
one case (Tab. 13). In another case (pt.95), autologous effector cells used for stimulation
were obtained from peripheral blood of chemotherapy-treated patient and were probably
functionally incomplete. However, the poor proliferation of autologous effector cells in this
case could be explained by low expression of CD70 on the ALL blasts that were used as
stimulator cells (Tab. 11, page 66).
In fact, we have demonstrated that proliferation of effector cells required CD70-mediated
costimulation. The proliferation of effector cells stimulated with CD40-stimulated ALL
cells was completely abrogated by addition of anti-CD70 antibodies at the initiation of
culture (Fig. 17 and 18, page 69 and 70). Interestingly, that expansion of T-cells stimulated
with unstimulated ALL blasts was also significantly reduced when anti-CD70 antibodies
were added (Fig. 17 and 18). Thus, blockade of even low expression of CD70 on ALL blasts
that have been used for stimulation led to inhibition of T-cell proliferation. Therefore, our
results demonstrate that CD70 costimulation is an absolute requirement for the expansion
of T-cells stimulated with ALL blasts.
To demonstrate anti-leukemia specificity of the generated T-cell lines, the ability of T-
cells to lyse CD40-stimulated, unstimulated ALL blasts and autologous non-malignant
cells (PHA blasts) was tested. 3 from 4 expanded T-cells were capable of lysing both
unstimulated and CD40-stimulated ALL blasts (Tab. 14, page 71), although the efficiency
of lysis was variable between patients. The fact that generated CTLs did not lyse PHA
blasts, suggested that CTLs responses were directed against leukemia-specific target. It is
important to note that T-cell line generated from the autologous effector cells were unable
to lyse ALL blasts. It is unknown why we have failed to generate anti-leukemia cytotoxic T-
cells in this case, because CD40-stimulated ALL blasts used for stimulation have uniformly
expressed costimulatory molecules CD80/CD86 and CD70. One possible reason to explain
this is the low percentage of CD3+ cells in the initial effector cell population.
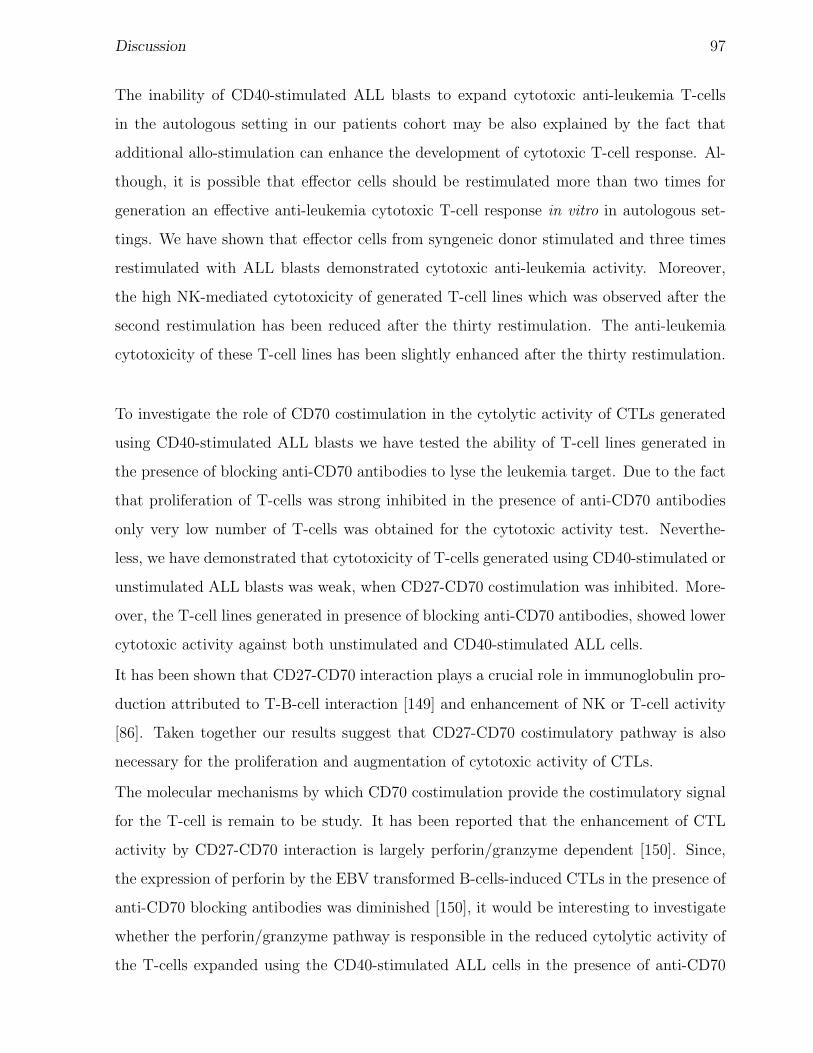
Discussion 97
The inability of CD40-stimulated ALL blasts to expand cytotoxic anti-leukemia T-cells
in the autologous setting in our patients cohort may be also explained by the fact that
additional allo-stimulation can enhance the development of cytotoxic T-cell response. Al-
though, it is possible that effector cells should be restimulated more than two times for
generation an effective anti-leukemia cytotoxic T-cell response in vitro in autologous set-
tings. We have shown that effector cells from syngeneic donor stimulated and three times
restimulated with ALL blasts demonstrated cytotoxic anti-leukemia activity. Moreover,
the high NK-mediated cytotoxicity of generated T-cell lines which was observed after the
second restimulation has been reduced after the thirty restimulation. The anti-leukemia
cytotoxicity of these T-cell lines has been slightly enhanced after the thirty restimulation.
To investigate the role of CD70 costimulation in the cytolytic activity of CTLs generated
using CD40-stimulated ALL blasts we have tested the ability of T-cell lines generated in
the presence of blocking anti-CD70 antibodies to lyse the leukemia target. Due to the fact
that proliferation of T-cells was strong inhibited in the presence of anti-CD70 antibodies
only very low number of T-cells was obtained for the cytotoxic activity test. Neverthe-
less, we have demonstrated that cytotoxicity of T-cells generated using CD40-stimulated or
unstimulated ALL blasts was weak, when CD27-CD70 costimulation was inhibited. More-
over, the T-cell lines generated in presence of blocking anti-CD70 antibodies, showed lower
cytotoxic activity against both unstimulated and CD40-stimulated ALL cells.
It has been shown that CD27-CD70 interaction plays a crucial role in immunoglobulin pro-
duction attributed to T-B-cell interaction [149] and enhancement of NK or T-cell activity
[86]. Taken together our results suggest that CD27-CD70 costimulatory pathway is also
necessary for the proliferation and augmentation of cytotoxic activity of CTLs.
The molecular mechanisms by which CD70 costimulation provide the costimulatory signal
for the T-cell is remain to be study. It has been reported that the enhancement of CTL
activity by CD27-CD70 interaction is largely perforin/granzyme dependent [150]. Since,
the expression of perforin by the EBV transformed B-cells-induced CTLs in the presence of
anti-CD70 blocking antibodies was diminished [150], it would be interesting to investigate
whether the perforin/granzyme pathway is responsible in the reduced cytolytic activity of
the T-cells expanded using the CD40-stimulated ALL cells in the presence of anti-CD70
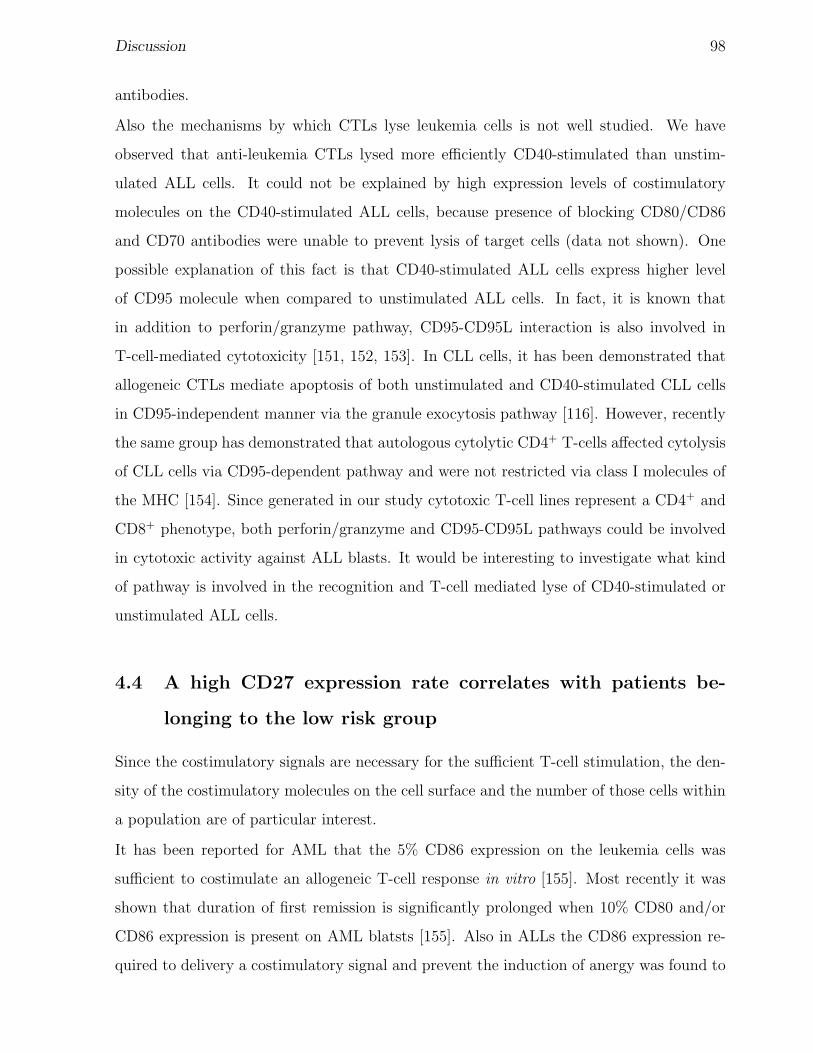
Discussion 98
antibodies.
Also the mechanisms by which CTLs lyse leukemia cells is not well studied. We have
observed that anti-leukemia CTLs lysed more efficiently CD40-stimulated than unstim-
ulated ALL cells. It could not be explained by high expression levels of costimulatory
molecules on the CD40-stimulated ALL cells, because presence of blocking CD80/CD86
and CD70 antibodies were unable to prevent lysis of target cells (data not shown). One
possible explanation of this fact is that CD40-stimulated ALL cells express higher level
of CD95 molecule when compared to unstimulated ALL cells. In fact, it is known that
in addition to perforin/granzyme pathway, CD95-CD95L interaction is also involved in
T-cell-mediated cytotoxicity [151, 152, 153]. In CLL cells, it has been demonstrated that
allogeneic CTLs mediate apoptosis of both unstimulated and CD40-stimulated CLL cells
in CD95-independent manner via the granule exocytosis pathway [116]. However, recently
the same group has demonstrated that autologous cytolytic CD4+ T-cells affected cytolysis
of CLL cells via CD95-dependent pathway and were not restricted via class I molecules of
the MHC [154]. Since generated in our study cytotoxic T-cell lines represent a CD4+ and
CD8+ phenotype, both perforin/granzyme and CD95-CD95L pathways could be involved
in cytotoxic activity against ALL blasts. It would be interesting to investigate what kind
of pathway is involved in the recognition and T-cell mediated lyse of CD40-stimulated or
unstimulated ALL cells.
4.4 A high CD27 expression rate correlates with patients be-
longing to the low risk group
Since the costimulatory signals are necessary for the sufficient T-cell stimulation, the den-
sity of the costimulatory molecules on the cell surface and the number of those cells within
a population are of particular interest.
It has been reported for AML that the 5% CD86 expression on the leukemia cells was
sufficient to costimulate an allogeneic T-cell response in vitro [155]. Most recently it was
shown that duration of first remission is significantly prolonged when 10% CD80 and/or
CD86 expression is present on AML blatsts [155]. Also in ALLs the CD86 expression re-
quired to delivery a costimulatory signal and prevent the induction of anergy was found to
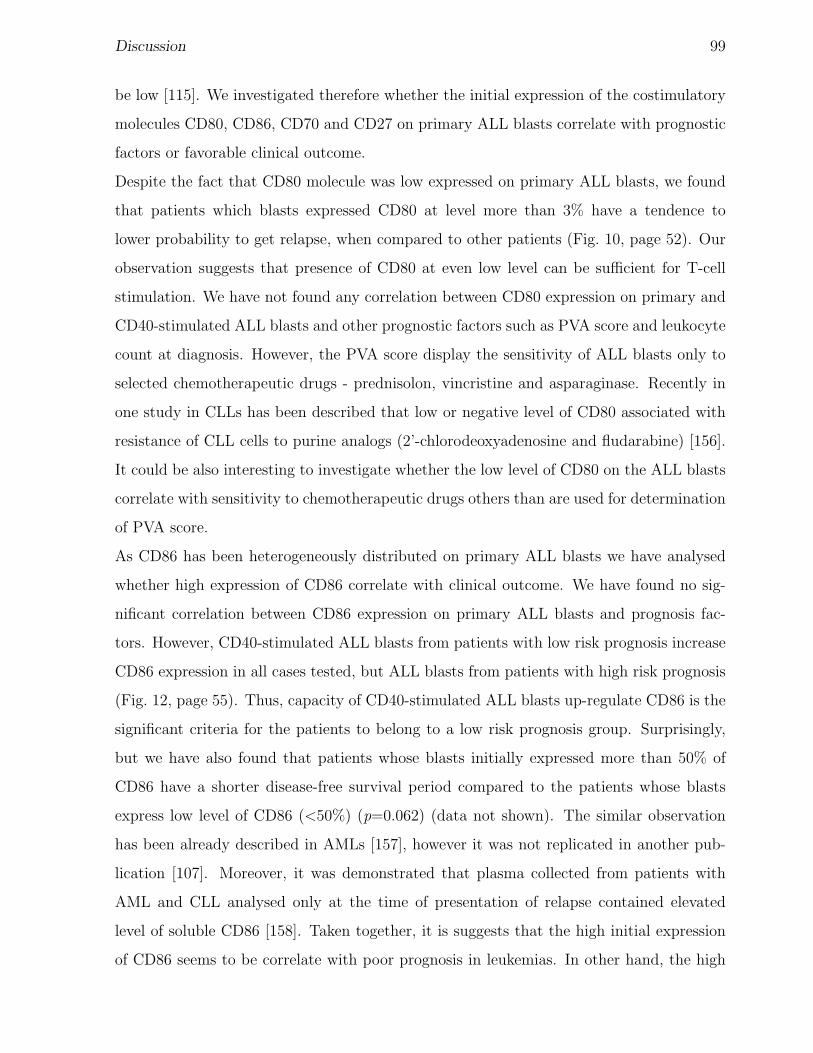
Discussion 99
be low [115]. We investigated therefore whether the initial expression of the costimulatory
molecules CD80, CD86, CD70 and CD27 on primary ALL blasts correlate with prognostic
factors or favorable clinical outcome.
Despite the fact that CD80 molecule was low expressed on primary ALL blasts, we found
that patients which blasts expressed CD80 at level more than 3% have a tendence to
lower probability to get relapse, when compared to other patients (Fig. 10, page 52). Our
observation suggests that presence of CD80 at even low level can be sufficient for T-cell
stimulation. We have not found any correlation between CD80 expression on primary and
CD40-stimulated ALL blasts and other prognostic factors such as PVA score and leukocyte
count at diagnosis. However, the PVA score display the sensitivity of ALL blasts only to
selected chemotherapeutic drugs - prednisolon, vincristine and asparaginase. Recently in
one study in CLLs has been described that low or negative level of CD80 associated with
resistance of CLL cells to purine analogs (2’-chlorodeoxyadenosine and fludarabine) [156].
It could be also interesting to investigate whether the low level of CD80 on the ALL blasts
correlate with sensitivity to chemotherapeutic drugs others than are used for determination
of PVA score.
As CD86 has been heterogeneously distributed on primary ALL blasts we have analysed
whether high expression of CD86 correlate with clinical outcome. We have found no sig-
nificant correlation between CD86 expression on primary ALL blasts and prognosis fac-
tors. However, CD40-stimulated ALL blasts from patients with low risk prognosis increase
CD86 expression in all cases tested, but ALL blasts from patients with high risk prognosis
(Fig. 12, page 55). Thus, capacity of CD40-stimulated ALL blasts up-regulate CD86 is the
significant criteria for the patients to belong to a low risk prognosis group. Surprisingly,
but we have also found that patients whose blasts initially expressed more than 50% of
CD86 have a shorter disease-free survival period compared to the patients whose blasts
express low level of CD86 (<50%) (p=0.062) (data not shown). The similar observation
has been already described in AMLs [157], however it was not replicated in another pub-
lication [107]. Moreover, it was demonstrated that plasma collected from patients with
AML and CLL analysed only at the time of presentation of relapse contained elevated
level of soluble CD86 [158]. Taken together, it is suggests that the high initial expression
of CD86 seems to be correlate with poor prognosis in leukemias. In other hand, the high
Discussion 100
expression of CD86 induced by activation correlate with low risk prognosis. The further
investigations are needed to clear the clinical relevance of CD86 expression on ALL cells
and its the biological role in the progression of leukemia.
With respect to CD70 expression, we have not found significant correlation between CD70
expression levels on primary and CD40-stimulated ALL blasts and any prognostic factors
and probability to get a relapse. However, we have demonstrated that high levels of
CD27 which is heterogeneously expressed on primary ALL blasts significant correlate with
probability of patients to belong to low prognosis group (Fig. 11), page 54.
The correlation of high expression levels of CD27 with low risk prognosis has been described
for multiple myeloma (MM) patients [159]. It was shown that malignant plasma cells from
MM patients in the situation of complete clinical remission display a significantly higher
CD27 expression compared to those obtained from newly diagnosed, relapsed and refractory
MM patients [159]. In CLLs a strong correlation was found between soluble CD27 level in
serum and tumor load [80, 160]. Taken together these data support the hypothesis that
loss of CD27 is associated with more aggressive disease. Further study of the regulation of
surface and soluble CD27 and its association with the clinical outcome could provide new
insights into the role of CD27 in the biological and clinical aspects of ALL. Its potential
prognostic value should be tested in prospectives studies.
4.5 Induction of CD95 expression does not completely sensitize
ALL cells for CD95-mediated apoptosis
The understanding of mechanisms are involved in the resistance of leukemia cells to apop-
tosis can facilitate the development of novel therapeutic strategies for ALL treatment. We
have examined in our study the expression of CD95 and its functional activity on ALL
blasts.
Our results show that freshly isolated ALL blasts expressed detectable, but low levels of
CD95 (Fig. 23, page 77), that consider with other reports [143, 138, 130, 124, 133]. Similar
to observations on lymphoma and chronic leukemia cells, initially showed low level of CD95
and resistance to CD95-mediated apoptosis [130, 143], we have not detected significantly in-
creased apoptosis of primary ALL blasts after CD95 ligation (Tab. 15, page 78). In contrast,
Discussion 101
primary leukemia cells from patients with T-ALL and AML exhibit heterogeneous CD95
expression pattern and are quite sensitive to CD95-mediated apoptosis [134, 132, 135].
Taken together, the low expression on primary leukemia cells seems to be associate with
low expression levels of CD95. However, we have not found quantitative correlation be-
tween initial CD95 expression on primary ALL blasts and sensitivity to CD95. In addition,
no significant correlation was found between initial CD95 expression on primary ALL blasts
and selected risk parameters (PVA score and leukocyte count at diagnosis).
As it has been shown for CLL and NHL cells [143], CD40-stimulation of ALL blasts lead
to CD95 up-regulation (Fig. 25, page 81). We have found that, CD40-stimulation of ALL
blasts for 16 and 24 hours results in CD95 expression, which although is not sufficient
for CD95-mediated apoptosis (data not shown). It was already described many reports
that CD40-stimulation for 48 hours of CLL cells induce CD95 expression, but did not
sensitize the cells to CD95-mediated apoptosis [116, 143]. In contrast, it was recently
shown that only prolonged (72 hours) CD40 ligation is sufficient to render CLL cells to be
sensitive against CD95-mediated apoptosis [154]. Thus, although CD95-expression occurs
early after CD40 activation of leukemia cells, susceptibility to CD95-mediated apoptosis
develops slowly.
We have found, that the maximal CD95 expression on ALL blasts could be reached after
72-96 hours of CD40 activation (Fig 26, page 82). At that time CD40-stimulated ALL
blasts showed enhanced sensitivity toward CD95-mediated apoptosis (Fig 27, page 84). It
is worth to note that the enhanced susceptibility in CD95-mediated apoptosis was found to
be associated with increased density of CD95 expression on CD40-stimulated ALL blasts
(Tab. 19, page 85). Most importantly, capacity of ALL blasts to express CD95 in response
to CD40-stimulation and sensitivity to CD95-mediated apoptosis both correlate with a
favorable prognosis (Fig 29 and 30, page 91 and 92). Blasts from patients with high risk
prognosis express CD95 only at low levels after CD40-stimulation and demonstrate low
sensitivity to CD95-mediated apoptosis. It is worth to underline that among four patients
whose CD40-stimulated ALL cells exhibited very low level of CD95 and shown resistance
toward CD95-mediated apoptosis, two patients have diagnosis early pre-B-ALL. It suggests
together with our early observations, that ALL blasts from patients with early pre-B-ALL
are not quite sensitive for the CD40-stimulation.
Discussion 102
4.6 Anti-apoptotic proteins are involved in low sensitivity of
ALL cells to CD95-mediated apoptosis
Despite CD40 activated ALL blasts express high level of CD95 they demonstrate decreased
sensitivity to CD95-mediated apoptosis also after long time incubation with anti-CD95
antibodies, when compared to CD40-stimulated normal mature B-cells (Tab. 18 and Fig 27,
page 84).
It appears that three elements are essential for CD95-mediated apoptosis: 1) expression of
CD95 molecule at sufficient densities, 2) cross-linking of CD95 molecule and 3) a permissive
cellular background which allows CD95 ligation to generate signals resulting in apoptosis.
As CD40-stimulated ALL blasts express high level of CD95 and no mutation in CD95
receptor gene hes been detected [161], their partially resistance is largely attributed to
anti-apoptotic intracellular factors affecting the CD95 signaling pathway. In T-ALLs it
was demonstrated that additional treatment with protein synthesis inhibitor resulted in
enhanced sensitivity to CD95-mediated apoptosis [134]. In our experiments, incubation of
partially resistant ALL cells with the protein synthesis inhibitor cycloheximide reversed
resistance and induced sensitivity to anti-CD95 antibodies (Fig 28, page 86). Our data
suggested that resistance to anti-CD95 mediated apoptosis in ALL is maintained by an
active cellular program and could be overcome by blockade of anti-apoptotic proteins. In
fact, there is accumulating evidence that, after signaling by extracellular factors, the death-
survival decision depends on the balance between pro- and anti-apoptotic intracellular
proteins, especially the members of Bcl-2 gene family. The anti-apoptotic bcl-2 protein was
increased in AML, T- and B-ALL, and its expression was found to be increased in AML
and ALL cells, when compared with that of normal progenitor counterparts [136, 131, 132,
143]. The absence of a quantitative correlation between bcl-2 expression in ALL cells and
sensitivity to CD95 triggering apoptosis [132, 143] suggests that the expression and the
complex interaction of other anti-apoptotic proteins may being involved in the intracellular
apoptotic signaling process. The expression of anti-apoptotic proteins, such as the recently
described survivin molecule [162, 19], in ALL is presently under investigation.
Since the expression of CD95 ligand on T-cells is another pathway in addition to the per-
forin/granzyme pathway, by which cytotoxic T-cells kill target cells, CD40-stimulated ALL
Discussion 103
blasts may also be more sensitive to cytotoxic killing than resting leukemia cells. Encour-
aging results were reported in a phase I clinical trial of gene therapy for patients with
CLL [118]. It was purposed that the sensitivity of CD40-stimulated CLL cells to CD95-
mediated apoptosis may account in part for the noted reduction in leukemia cell counts
and lymph node size in CLL patients treated with CD40L-transduced CLL cells. We have
demonstrated that CD40-stimulated ALL blasts exhibit sensitivity toward CD95-mediated
apoptosis and this can be enhanced by blocking of protein synthesis cycloheximide. There-
fore, further investigation of agents that can modify the expression of factors associated
with the partial resistance of CD40-stimulated ALL blasts to CD95-mediated apoptosis
are necessary.
104
5 Summary
The characterization of important molecules expressed on leukemias cells has allowed a fur-
ther understanding of basic biologic mechanisms including apoptosis pathways or immune
responses directed against individual malignant cell. For generation of leukemia cell vac-
cines the manipulation of the expression-level of costimulatory molecules for achieving the
most efficient T-cell stimulation, or of CD95 expression for enhanced apoptosis of leukemia
cells seem to be promising targets.
In this work, the importance of the CD70-CD27 costimulatory pathway involved in antigen-
presentation and CD95-mediated apoptosis was investigated in primary ALL cells that have
been stimulated in vitro by CD40L expressing feeder cells. By flow-cytometry analysis it
was found that expression of CD70 could be significantly enhanced after CD40-stimulation.
The importance of the CD70-CD27 pathway for ALL cells was characterized here for the
first time to synergistically enhance the CD80/CD86-CD28 mediated antigen presentation.
In addition, using a protocol for in vitro generation of T-cell lines it was demonstrated that
the CD70-CD27 pathway is a prerequisite for generation of cytotoxic T cells (CTL). For
the first time the expression of costimulatory molecules and their clinical relevance were
investigated on the large number of primary blasts from newly diagnosed patients with
ALL. It was found that high CD27 expression rate correlates with patients belonging to
the low risk group.
It has been shown, that ALL cells up-regulated CD95 at high level after CD40-stimulation
and demonstrated sensitivity toward CD95-mediated apoptosis. Moreover, the CD95-
mediated apoptosis in CD40-stimulated ALL blasts can be enhanced by cycloheximide-
treatment most likely due to blockade of anti-apoptotic proteins. More important, it was
found that high level of CD95 on CD40-stimulated ALL blasts and their sensitivity to
CD95-mediated apoptosis are associated with low risk prognosis.
The data observed here for ALL are encouraging for up-coming clinical trials of leukemia
vaccines.

6 REFERENCES 105
6 References
105
References
[1] Pui CH. Childhood leukemias. N Engl J Med, 332:1618–1630, (1995).
[2] Zola H, Swart B, Boumsell L, and Mason DY. Human Leucocyte Differentiation
Antigen nomenclature: update on CD nomenclature. Report of IUIS/WHO Subcom-
mittee. J Immunol Methods, 275:1–8, (2003).
[3] Greaves MF and Chan LC. Is spontaneous mutation the major ’cause’ of childhood
acute lymphoblastic leukaemia? Br J Haematol, 64:1–13, (1986).
[4] Greaves MF. Speculations on the cause of childhood acute lymphoblastic leukemia.
Leukemia, 2:120–125, (1988).
[5] Butturini A and Gale RP. Oncogenes and leukemia. Leukemia, 4:138–160, (1990).
[6] Miller DM, Blume S, Borst M, Gee J, Polansky D, Ray R, Rodu B, Shrestha K,
Snyder R, Thomas S, and et al. Oncogenes, malignant transformation, and modern
medicine. Am J Med Sci, 300:59–69, (1990).
[7] Baron F and Beguin Y. Adoptive immunotherapy with donor lymphocyte infusions
after allogeneic HPC transplantation. Transfusion, 40:468–476, (2000).
[8] Barrett AJ. Mechanisms of the graft-versus-leukemia reaction. Stem Cells, 15:248–
258, (1997).
[9] Horowitz MM, Gale RP, Sondel PM, Goldman JM, Kersey J, Kolb HJ, Rimm AA,
Ringden O, Rozman C, Speck B, and et al. Graft-versus-leukemia reactions after
bone marrow transplantation. Blood, 75:555–562, (1990).
[10] Slavin S, Ackerstein A, Naparstek E, Or R, and Weiss L. The graft-versus-leukemia
(GVL) phenomenon: is GVL separable from GVHD? Bone Marrow Transplant,
6:155–161, (1990).
[11] Sullivan KM, Storb R, Buckner CD, Fefer A, Fisher L, Weiden PL, Witherspoon
RP, Appelbaum FR, Banaji M, Hansen J, and et al. Graft-versus-host disease as
References 106
adoptive immunotherapy in patients with advanced hematologic neoplasms. N Engl J
Med, 320:828–834, (1989).
[12] Yasukawa M, Ohminami H, Kaneko S, Yakushijin Y, Nishimura Y, Inokuchi K,
Miyakuni T, Nakao S, Kishi K, Kubonishi I, Dan K, and Fujita S. CD4(+) cytotoxic
T-cell clones specific for bcr-abl b3a2 fusion peptide augment colony formation by
chronic myelogenous leukemia cells in a b3a2-specific and HLA-DR-restricted man-
ner. Blood, 92:3355–3361, (1998).
[13] Yotnda P, Garcia F, Peuchmaur M, Grandchamp B, Duval M, Lemonnier F, Vilmer
E, and Langlade-Demoyen P. Cytotoxic T cell response against the chimeric ETV6-
AML1 protein in childhood acute lymphoblastic leukemia. J Clin Invest, 102:455–462,
(1998).
[14] Osman Y, Takahashi M, Zheng Z, Toba K, Liu A, Furukawa T, Narita M, Aizawa Y,
Koike T, and Shibata A. Dendritic cells stimulate the expansion of PML-RAR alpha
specific cytotoxic T-lymphocytes: its applicability for antileukemia immunotherapy. J
Exp Clin Cancer Res, 18:485–492, (1999).
[15] Ohminami H, Yasukawa M, Kaneko S, Yakushijin Y, Abe Y, Kasahara Y, Ishida
Y, and Fujita S. Fas-independent and nonapoptotic cytotoxicity mediated by a hu-
man CD4(+) T-cell clone directed against an acute myelogenous leukemia-associated
DEK-CAN fusion peptide. Blood, 93:925–935, (1999).
[16] Molldrem JJ, Lee PP, Wang C, Champlin RE, and Davis MM. A PR1-human leuko-
cyte antigen-A2 tetramer can be used to isolate low-frequency cytotoxic T lymphocytes
from healthy donors that selectively lyse chronic myelogenous leukemia. Cancer Res,
59:2675–2681, (1999).
[17] Minev B, Hipp J, Firat H, Schmidt JD, Langlade-Demoyen P, and Zanetti M. Cyto-
toxic T cell immunity against telomerase reverse transcriptase in humans. Proc Natl
Acad Sci U S A, 97:4796–4801, (2000).
References 107
[18] Arai J, Yasukawa M, Ohminami H, Kakimoto M, Hasegawa A, and Fujita S. Identifi-
cation of human telomerase reverse transcriptase-derived peptides that induce HLA-
A24-restricted antileukemia cytotoxic T lymphocytes. Blood, 97:2903–2907, (2001).
[19] Ambrosini G, Adida C, and Altieri DC. A novel anti-apoptosis gene, survivin, ex-
pressed in cancer and lymphoma. Nat Med, 3:917–921, (1997).
[20] Marijt WA, Veenhof WF, Brand A, Goulmy E, Fibbe WE, Willemze R, van Rood JJ,
and Falkenburg JH. Minor histocompatibility antigen-specific cytotoxic T cell lines,
capable of lysing human hematopoietic progenitor cells, can be generated in vitro by
stimulation with HLA-identical bone marrow cells. J Exp Med, 173:101–109, (1991).
[21] Faber LM, van Luxemburg-Heijs SA, Willemze R, and Falkenburg JH. Generation of
leukemia-reactive cytotoxic T lymphocyte clones from the HLA-identical bone marrow
donor of a patient with leukemia. J Exp Med, 176:1283–1289, (1992).
[22] Dolstra H, Fredrix H, Maas F, Coulie PG, Brasseur F, Mensink E, Adema GJ,
de Witte TM, Figdor CG, and van de Wiel-van Kemenade E. A human minor
histocompatibility antigen specific for B cell acute lymphoblastic leukemia. J Exp
Med, 189:301–308, (1999).
[23] Mutis T, Blokland E, Kester M, Schrama E, and Goulmy E. Generation of minor
histocompatibility antigen HA-1-specific cytotoxic T cells restricted by nonself HLA
molecules: a potential strategy to treat relapsed leukemia after HLA-mismatched stem
cell transplantation. Blood, 100:547–552, (2002).
[24] Schwartz RH, Mueller DL, Jenkins MK, and Quill H. T-cell clonal anergy. Cold
Spring Harb Symp Quant Biol, 54 Pt 2:605–610, (1989).
[25] Bernard A, Lamy, and Alberti I. The two-signal model of T-cell activation after 30
years. Transplantation, 73:S31–35, (2002).
[26] Harding FA, McArthur JG, Gross JA, Raulet DH, and Allison JP. CD28-mediated
signalling co-stimulates murine T cells and prevents induction of anergy in T-cell
clones. Nature, 356:607–609, (1992).
References 108
[27] Pardigon N, Bercovici N, Calbo S, Santos-Lima EC, Liblau R, Kourilsky P, and
Abastado JP. Role of co-stimulation in CD8+ T cell activation. Int Immunol, 10:619–
630, (1998).
[28] Thompson CB and Allison JP. The emerging role of CTLA-4 as an immune atten-
uator. Immunity, 7:445–450, (1997).
[29] Slavik JM, Hutchcroft JE, and Bierer BE. CD28/CTLA-4 and CD80/CD86 families:
signaling and function. Immunol Res, 19:1–24, (1999).
[30] Linsley PS and Ledbetter JA. The role of the CD28 receptor during T cell responses
to antigen. Annu Rev Immunol, 11:191–212, (1993).
[31] Goodwin RG, Alderson MR, Smith CA, Armitage RJ, VandenBos T, Jerzy R, Tough
TW, Schoenborn MA, Davis-Smith T, Hennen K, and et al. Molecular and biological
characterization of a ligand for CD27 defines a new family of cytokines with homology
to tumor necrosis factor. Cell, 73:447–456, (1993).
[32] Van Lier RA, Borst J, Vroom TM, Klein H, Van Mourik P, Zeijlemaker WP, and
Melief CJ. Tissue distribution and biochemical and functional properties of Tp55
(CD27), a novel T cell differentiation antigen. J Immunol, 139:1589–1596, (1987).
[33] Van Lier RA, Pool MO, Kabel P, Mous S, Terpstra F, De Rie MA, Melief CJ,
and Miedema F. Anti-CD27 monoclonal antibodies identify two functionally distinct
subpopulations within the CD4+ T cell subset. Eur J Immunol, 18:811–816, (1988).
[34] Lenschow DJ, Walunas TL, and Bluestone JA. CD28/B7 system of T cell costimu-
lation. Annu Rev Immunol, 14:233–258, (1996).
[35] Jeannin P, Delneste Y, Lecoanet-Henchoz S, Gauchat JF, Ellis J, and Bonnefoy
JY. CD86 (B7-2) on human B cells; A functional role in proliferation and selective
differentiation into IgE- and IgG4-producing cells. J Biol Chem, 272:15613–15619,
(1997).
References 109
[36] Linsley PS, Greene JL, Tan P, Bradshaw J, Ledbetter JA, Anasetti C, and Damle
NK. Coexpression and functional cooperation of CTLA-4 and CD28 on activated T
lymphocytes. J Exp Med, 176:1595–1604, (1992).
[37] Allison JP and Krummel MF. The Yin and Yang of T cell costimulation. Science,
270:932–933, (1995).
[38] Gimmi CD, Freeman GJ, Gribben JG, Sugita K, Freedman AS, Morimoto C, and
Nadler LM. B-cell surface antigen B7 provides a costimulatory signal that induces T
cells to proliferate and secrete interleukin 2. Proc Natl Acad Sci U S A, 88:6575–6579,
(1991).
[39] Freeman GJ, Gribben JG, Boussiotis VA, Ng JW, Restivo VA, Jr., Lombard LA, Gray
GS, and Nadler LM. Cloning of B7-2: a CTLA-4 counter-receptor that costimulates
human T cell proliferation. Science, 262:909–911, (1993).
[40] Yokochi T, Holly RD, and Clark EA. B lymphoblast antigen (BB-1) expressed on
Epstein-Barr virus-activated B cell blasts, B lymphoblastoid cell lines, and Burkitt’s
lymphomas. J Immunol, 128:823–827, (1982).
[41] Freeman GJ, Gray GS, Gimmi CD, Lombard DB, Zhou LJ, White M, Fingeroth JD,
Gribben JG, and Nadler LM. Structure, expression, and T cell costimulatory activity
of the murine homologue of the human B lymphocyte activation antigen B7. J Exp
Med, 174:625–631, (1991).
[42] Linsley PS, Brady W, Urnes M, Grosmaire LS, Damle NK, and Ledbetter JA. CTLA-
4 is a second receptor for the B cell activation antigen B7. J Exp Med, 174:561–569,
(1991).
[43] Azuma M, Ito D, Yagita H, Okumura K, Phillips JH, Lanier LL, and Somoza C. B70
antigen is a second ligand for CTLA-4 and CD28. Nature, 366:76–79, (1993).
[44] Hathcock KS, Laszlo G, Pucillo C, Linsley P, and Hodes RJ. Comparative analysis of
B7-1 and B7-2 costimulatory ligands: expression and function. J Exp Med, 180:631–
640, (1994).
References 110
[45] Lenschow DJ, Sperling AI, Cooke MP, Freeman G, Rhee L, Decker DC, Gray G,
Nadler LM, Goodnow CC, and Bluestone JA. Differential up-regulation of the B7-1
and B7-2 costimulatory molecules after Ig receptor engagement by antigen. J Im-
munol, 153:1990–1997, (1994).
[46] Chen C and Nabavi N. In vitro induction of T cell anergy by blocking B7 and early
T cell costimulatory molecule ETC-1/B7-2. Immunity, 1:147–154, (1994).
[47] Lenschow DJ, Zeng Y, Hathcock KS, Zuckerman LA, Freeman G, Thistlethwaite JR,
Gray GS, Hodes RJ, and Bluestone JA. Inhibition of transplant rejection following
treatment with anti-B7-2 and anti-B7-1 antibodies. Transplantation, 60:1171–1178,
(1995).
[48] Ranheim EA and Kipps TJ. Activated T cells induce expression of B7/BB1 on
normal or leukemic B cells through a CD40-dependent signal. J Exp Med, 177:925–
935, (1993).
[49] Valle A, Aubry JP, Durand I, and Banchereau J. IL-4 and IL-2 upregulate the
expression of antigen B7, the B cell counterstructure to T cell CD28: an amplification
mechanism for T-B cell interactions. Int Immunol, 3:229–235, (1991).
[50] Zheng Z, Takahashi M, Aoki S, Toba K, Liu A, Osman Y, Takahashi H, Tsukada N,
Suzuki N, Nikkuni K, Furukawa T, Koike T, and Aizawa Y. Expression patterns of
costimulatory molecules on cells derived from human hematological malignancies. J
Exp Clin Cancer Res, 17:251–258, (1998).
[51] Tsukada N, Aoki S, Maruyama S, Kishi K, Takahashi M, and Aizawa Y. The hetero-
geneous expression of CD80, CD86 and other adhesion molecules on leukemia and
lymphoma cells and their induction by interferon. J Exp Clin Cancer Res, 16:171–176,
(1997).
[52] Matulonis UA, Dosiou C, Lamont C, Freeman GJ, Mauch P, Nadler LM, and Griffin
JD. Role of B7-1 in mediating an immune response to myeloid leukemia cells. Blood,
85:2507–2515, (1995).
References 111
[53] Dunussi-Joannopoulos K, Weinstein HJ, Nickerson PW, Strom TB, Burakoff SJ,
Croop JM, and Arceci RJ. Irradiated B7-1 transduced primary acute myelogenous
leukemia (AML) cells can be used as therapeutic vaccines in murine AML. Blood,
87:2938–2946, (1996).
[54] Matulonis U, Dosiou C, Freeman G, Lamont C, Mauch P, Nadler LM, and Griffin
JD. B7-1 is superior to B7-2 costimulation in the induction and maintenance of
T cell-mediated antileukemia immunity; Further evidence that B7-1 and B7-2 are
functionally distinct. J Immunol, 156:1126–1131, (1996).
[55] Boyer MW, Vallera DA, Taylor PA, Gray GS, Katsanis E, Gorden K, Orchard PJ,
and Blazar BR. The role of B7 costimulation by murine acute myeloid leukemia in
the generation and function of a CD8+ T-cell line with potent in vivo graft-versus-
leukemia properties. Blood, 89:3477–3485, (1997).
[56] Hirst WJ, Buggins A, Darling D, Gaken J, Farzaneh F, and Mufti GJ. En-
hanced immune costimulatory activity of primary acute myeloid leukaemia blasts after
retrovirus-mediated gene transfer of B7,1. Gene Ther, 4:691–699, (1997).
[57] Stripecke R, Skelton DC, Gruber T, Afar D, Pattengale PK, Witte ON, and Kohn
DB. Immune response to Philadelphia chromosome-positive acute lymphoblastic
leukemia induced by expression of CD80, interleukin 2, and granulocyte-macrophage
colony-stimulating factor. Hum Gene Ther, 9:2049–2062, (1998).
[58] Dunussi-Joannopoulos K, Dranoff G, Weinstein HJ, Ferrara JL, Bierer BE, and
Croop JM. Gene immunotherapy in murine acute myeloid leukemia: granulocyte-
macrophage colony-stimulating factor tumor cell vaccines elicit more potent antitu-
mor immunity compared with B7 family and other cytokine vaccines. Blood, 91:222–
230, (1998).
[59] Takahashi T, Hirano N, Chiba S, Yazaki Y, and Hirai H. Immunogene therapy against
mouse leukemia using B7 molecules. Cancer Gene Ther, 7:144–150, (2000).
References 112
[60] Townsend SE, Su FW, Atherton JM, and Allison JP. Specificity and longevity of
antitumor immune responses induced by B7-transfected tumors. Cancer Res, 54:6477–
6483, (1994).
[61] Yang G, Hellstrom KE, Hellstrom I, and Chen L. Antitumor immunity elicited by
tumor cells transfected with B7-2, a second ligand for CD28/CTLA-4 costimulatory
molecules. J Immunol, 154:2794–2800, (1995).
[62] Gruss HJ and Dower SK. Tumor necrosis factor ligand superfamily: involvement in
the pathology of malignant lymphomas. Blood, 85:3378–3404, (1995).
[63] Bowman MR, Crimmins MA, Yetz-Aldape J, Kriz R, Kelleher K, and Herrmann
S. The cloning of CD70 and its identification as the ligand for CD27. J Immunol,
152:1756–1761, (1994).
[64] Hintzen RQ, Lens SM, Beckmann MP, Goodwin RG, Lynch D, and van Lier RA.
Characterization of the human CD27 ligand, a novel member of the TNF gene family.
J Immunol, 152:1762–1773, (1994).
[65] Maurer D, Holter W, Majdic O, Fischer GF, and Knapp W. CD27 expression by
a distinct subpopulation of human B lymphocytes. Eur J Immunol, 20:2679–2684,
(1990).
[66] Durkop H, Anagnostopoulos I, Bulfone-Paus S, and Stein H. Expression of several
members of the TNF-ligand and receptor family on tonsillar lymphoid B cells. Br J
Haematol, 98:863–868, (1997).
[67] Agematsu K, Kobata T, Sugita K, Freeman GJ, Beckmann MP, Schlossman SF, and
Morimoto C. Role of CD27 in T cell immune response; Analysis by recombinant
soluble CD27. J Immunol, 153:1421–1429, (1994).
[68] Agematsu K, Kobata T, Yang FC, Nakazawa T, Fukushima K, Kitahara M, Mori T,
Sugita K, Morimoto C, and Komiyama A. CD27/CD70 interaction directly drives B
cell IgG and IgM synthesis. Eur J Immunol, 25:2825–2829, (1995).
References 113
[69] Kobata T, Jacquot S, Kozlowski S, Agematsu K, Schlossman SF, and Morimoto C.
CD27-CD70 interactions regulate B-cell activation by T cells. Proc Natl Acad Sci U
S A, 92:11249–11253, (1995).
[70] Lens SM, de Jong R, Hooibrink B, Koopman G, Pals ST, van Oers MH, and van
Lier RA. Phenotype and function of human B cells expressing CD70 (CD27 ligand).
Eur J Immunol, 26:2964–2971, (1996).
[71] Jacquot S, Kobata T, Iwata S, Morimoto C, and Schlossman SF. CD154/CD40 and
CD70/CD27 interactions have different and sequential functions in T cell-dependent
B cell responses: enhancement of plasma cell differentiation by CD27 signaling. J
Immunol, 159:2652–2657, (1997).
[72] Jung J, Choe J, Li L, and Choi YS. Regulation of CD27 expression in the course
of germinal center B cell differentiation: the pivotal role of IL-10. Eur J Immunol,
30:2437–2443, (2000).
[73] Nagumo H and Agematsu K. Synergistic augmentative effect of interleukin-10 and
CD27/CD70 interactions on B-cell immunoglobulin synthesis. Immunology, 94:388–
394, (1998).
[74] Raman VS, Bal V, Rath S, and George A. Ligation of CD27 on murine B cells re-
sponding to T-dependent and T-independent stimuli inhibits the generation of plasma
cells. J Immunol, 165:6809–6815, (2000).
[75] Agematsu K, Nagumo H, Oguchi Y, Nakazawa T, Fukushima K, Yasui K, Ito S,
Kobata T, Morimoto C, and Komiyama A. Generation of plasma cells from pe-
ripheral blood memory B cells: synergistic effect of interleukin-10 and CD27/CD70
interaction. Blood, 91:173–180, (1998).
[76] Hintzen RQ, de Jong R, Hack CE, Chamuleau M, de Vries EF, ten Berge IJ, Borst J,
and van Lier RA. A soluble form of the human T cell differentiation antigen CD27
is released after triggering of the TCR/CD3 complex. J Immunol, 147:29–35, (1991).
References 114
[77] Hummel M, Tamaru J, Kalvelage B, and Stein H. Mantle cell (previously centro-
cytic) lymphomas express VH genes with no or very little somatic mutations like the
physiologic cells of the follicle mantle. Blood, 84:403–407, (1994).
[78] Lens SM, Drillenburg P, den Drijver BF, van Schijndel G, Pals ST, van Lier RA, and
van Oers MH. Aberrant expression and reverse signalling of CD70 on malignant B
cells. Br J Haematol, 106:491–503, (1999).
[79] Trentin L, Zambello R, Sancetta R, Facco M, Cerutti A, Perin A, Siviero M, Basso
U, Bortolin M, Adami F, Agostini C, and Semenzato G. B lymphocytes from patients
with chronic lymphoproliferative disorders are equipped with different costimulatory
molecules. Cancer Res, 57:4940–4947, (1997).
[80] Van Oers MH, Pals ST, Evers LM, van der Schoot CE, Koopman G, Bonfrer JM,
Hintzen RQ, von dem Borne AE, and van Lier RA. Expression and release of CD27
in human B-cell malignancies. Blood, 82:3430–3436, (1993).
[81] Kersten MJ, Evers LM, Dellemijn PL, van den Berg H, Portegies P, Hintzen RQ,
van Lier RA, von dem Borne AE, and van Oers RH. Elevation of cerebrospinal fluid
soluble CD27 levels in patients with meningeal localization of lymphoid malignancies.
Blood, 87:1985–1989, (1996).
[82] Ranheim EA, Cantwell MJ, and Kipps TJ. Expression of CD27 and its ligand, CD70,
on chronic lymphocytic leukemia B cells. Blood, 85:3556–3565, (1995).
[83] Hintzen RQ, Lens SM, Lammers K, Kuiper H, Beckmann MP, and van Lier RA. En-
gagement of CD27 with its ligand CD70 provides a second signal for T cell activation.
J Immunol, 154:2612–2623, (1995).
[84] Orengo AM, Cantoni C, Neglia F, Biassoni R, and Ferrini S. Reciprocal expression of
CD70 and of its receptor, CD27, in human long term-activated T and natural killer
(NK) cells: inverse regulation by cytokines and role in induction of cytotoxicity. Clin
Exp Immunol, 107:608–613, (1997).
References 115
[85] Takeda K, Oshima H, Hayakawa Y, Akiba H, Atsuta M, Kobata T, Kobayashi K,
Ito M, Yagita H, and Okumura K. CD27-mediated activation of murine NK cells. J
Immunol, 164:1741–1745, (2000).
[86] Yang FC, Agematsu K, Nakazawa T, Mori T, Ito S, Kobata T, Morimoto C, and
Komiyama A. CD27/CD70 interaction directly induces natural killer cell killing ac-
tivity. Immunology, 88:289–293, (1996).
[87] Brown GR, Meek K, Nishioka Y, and Thiele DL. CD27-CD27 ligand/CD70 inter-
actions enhance alloantigen-induced proliferation and cytolytic activity in CD8+ T
lymphocytes. J Immunol, 154:3686–3695, (1995).
[88] Stein H, Schwarting R, Dallenbach F, and Dienemann D. Immunology of Hodgkin
and Reed-Sternberg cells. Recent Results Cancer Res, 117:14–26, (1989).
[89] Schmitter D, Bolliger U, Hallek M, and Pichert G. Involvement of the CD27-CD70
co-stimulatory pathway in allogeneic T-cell response to follicular lymphoma cells. Br
J Haematol, 106:64–70, (1999).
[90] Nieland JD, Graus YF, Dortmans YE, Kremers BL, and Kruisbeek AM. CD40
and CD70 co-stimulate a potent in vivo antitumor T cell response. J Immunother,
21:225–236, (1998).
[91] Couderc B, Zitvogel L, Douin-Echinard V, Djennane L, Tahara H, Favre G, Lotze
MT, and Robbins PD. Enhancement of antitumor immunity by expression of CD70
(CD27 ligand) or CD154 (CD40 ligand) costimulatory molecules in tumor cells. Can-
cer Gene Ther, 5:163–175, (1998).
[92] Braun-Falco M and Hallek M. Recombinant adeno-associated virus (rAAV) vector-
mediated cotransduction of CD70 and CD80 into human malignant melanoma cells
results in an additive T-cell response. Arch Dermatol Res, 293:12–17, (2001).
[93] Douin-Echinard V, Bornes S, Rochaix P, Tilkin AF, Peron JM, Bonnet J, Favre G,
and Couderc B. The expression of CD70 and CD80 by gene-modified tumor cells
induces an antitumor response depending on the MHC status. Cancer Gene Ther,
7:1543–1556, (2000).
References 116
[94] Douin-Echinard V, Peron JM, Lauwers-Cances V, Favre G, and Couderc B. In-
volvement of CD70 and CD80 intracytoplasmic domains in the co-stimulatory signal
required to provide an antitumor immune response. Int Immunol, 15:359–372, (2003).
[95] Van Kooten C and Banchereau J. Functions of CD40 on B cells, dendritic cells and
other cells. Curr Opin Immunol, 9:330–337, (1997).
[96] Banchereau J, Dubois B, Fayette J, Burdin N, Briere F, Miossec P, Rissoan MC,
van Kooten C, and Caux C. Functional CD40 antigen on B cells, dendritic cells and
fibroblasts. Adv Exp Med Biol, 378:79–83, (1995).
[97] Banchereau J, Bazan F, Blanchard D, Briere F, Galizzi JP, van Kooten C, Liu YJ,
Rousset F, and Saeland S. The CD40 antigen and its ligand. Annu Rev Immunol,
12:881–922, (1994).
[98] Van Kooten C and Banchereau J. CD40-CD40 ligand. J Leukoc Biol, 67:2–17, (2000).
[99] Faassen AE, Dalke DP, Berton MT, Warren WD, and Pierce SK. CD40-CD40 lig-
and interactions stimulate B cell antigen processing. Eur J Immunol, 25:3249–3255,
(1995).
[100] Gordon J. CD40 and its ligand: central players in B lymphocyte survival, growth,
and differentiation. Blood Rev, 9:53–56, (1995).
[101] Splawski JB, Fu SM, and Lipsky PE. Immunoregulatory role of CD40 in human B
cell differentiation. J Immunol, 150:1276–1285, (1993).
[102] Schultze JL, Michalak S, Seamon MJ, Dranoff G, Jung K, Daley J, Delgado JC,
Gribben JG, and Nadler LM. CD40-activated human B cells: an alternative source
of highly efficient antigen presenting cells to generate autologous antigen-specific T
cells for adoptive immunotherapy. J Clin Invest, 100:2757–2765, (1997).
[103] Evans DE, Munks MW, Purkerson JM, and Parker DC. Resting B lymphocytes
as APC for naive T lymphocytes: dependence on CD40 ligand/CD40. J Immunol,
164:688–697, (2000).
References 117
[104] Kennedy MK, Mohler KM, Shanebeck KD, Baum PR, Picha KS, Otten-Evans CA,
Janeway CA, Jr., and Grabstein KH. Induction of B cell costimulatory function by
recombinant murine CD40 ligand. Eur J Immunol, 24:116–123, (1994).
[105] Law CL, Wormann B, and LeBien TW. Analysis of expression and function of CD40
on normal and leukemic human B cell precursors. Leukemia, 4:732–738, (1990).
[106] Uckun FM, Gajl-Peczalska K, Myers DE, Jaszcz W, Haissig S, and Ledbetter JA.
Temporal association of CD40 antigen expression with discrete stages of human B-cell
ontogeny and the efficacy of anti-CD40 immunotoxins against clonogenic B-lineage
acute lymphoblastic leukemia as well as B-lineage non-Hodgkin’s lymphoma cells.
Blood, 76:2449–2456, (1990).
[107] Costello RT, Mallet F, Sainty D, Maraninchi D, Gastaut JA, and Olive D. Regulation
of CD80/B7-1 and CD86/B7-2 molecule expression in human primary acute myeloid
leukemia and their role in allogenic immune recognition. Eur J Immunol, 28:90–103,
(1998).
[108] Yellin MJ, Sinning J, Covey LR, Sherman W, Lee JJ, Glickman-Nir E, Sippel KC,
Rogers J, Cleary AM, Parker M, and et al. T lymphocyte T cell-B cell-activating
molecule/CD40-L molecules induce normal B cells or chronic lymphocytic leukemia
B cells to express CD80 (B7/BB-1) and enhance their costimulatory activity. J
Immunol, 153:666–674, (1994).
[109] Van den Hove LE, Van Gool SW, Vandenberghe P, Bakkus M, Thielemans K,
Boogaerts MA, and Ceuppens JL. CD40 triggering of chronic lymphocytic leukemia
B cells results in efficient alloantigen presentation and cytotoxic T lymphocyte in-
duction by up-regulation of CD80 and CD86 costimulatory molecules. Leukemia,
11:572–580, (1997).
[110] Renard N, Ribeiro P, Warzocha K, Rouviere R, Charlot C, Coiffier B, and Salles
G. Modulation of costimulatory molecules on follicular lymphoma cells by TNF and
CD40. Leuk Lymphoma, 33:331–341, (1999).
References 118
[111] Buhmann R, Nolte A, Westhaus D, Emmerich B, and Hallek M. CD40-activated
B-cell chronic lymphocytic leukemia cells for tumor immunotherapy: stimulation of
allogeneic versus autologous T cells generates different types of effector cells. Blood,
93:1992–2002, (1999).
[112] Trentin L, Perin A, Siviero M, Piazza F, Facco M, Gurrieri C, Galvan S, Adami F,
Agostini C, Pizzolo G, Zambello R, and Semenzato G. B7 costimulatory molecules
from malignant cells in patients with b-cell chronic lymphoproliferative disorders trig-
ger t-cell proliferation. Cancer, 89:1259–1268, (2000).
[113] Renard N, Lafage-Pochitaloff M, Durand I, Duvert V, Coignet L, Banchereau J,
and Saeland S. Demonstration of functional CD40 in B-lineage acute lymphoblastic
leukemia cells in response to T-cell CD40 ligand. Blood, 87:5162–5170, (1996).
[114] Planken EV, Dijkstra NH, Willemze R, and Kluin-Nelemans JC. Proliferation of
B cell malignancies in all stages of differentiation upon stimulation in the ’CD40
system’. Leukemia, 10:488–493, (1996).
[115] Cardoso AA, Schultze JL, Boussiotis VA, Freeman GJ, Seamon MJ, Laszlo S, Billet
A, Sallan SE, Gribben JG, and Nadler LM. Pre-B acute lymphoblastic leukemia cells
may induce T-cell anergy to alloantigen. Blood, 88:41–48, (1996).
[116] Chu P, Wierda WG, and Kipps TJ. CD40 activation does not protect chronic lym-
phocytic leukemia B cells from apoptosis induced by cytotoxic T lymphocytes. Blood,
95:3853–3858, (2000).
[117] Schultze JL, Seamon MJ, Michalak S, Gribben JG, and Nadler LM. Autologous
tumor infiltrating T cells cytotoxic for follicular lymphoma cells can be expanded in
vitro. Blood, 89:3806–3816, (1997).
[118] Wierda WG, Cantwell MJ, Woods SJ, Rassenti LZ, Prussak CE, and Kipps
TJ. CD40-ligand (CD154) gene therapy for chronic lymphocytic leukemia. Blood,
96:2917–2924, (2000).
References 119
[119] Cardoso AA, Seamon MJ, Afonso HM, Ghia P, Boussiotis VA, Freeman GJ, Gribben
JG, Sallan SE, and Nadler LM. Ex vivo generation of human anti-pre-B leukemia-
specific autologous cytolytic T cells. Blood, 90:549–561, (1997).
[120] Yonehara S, Ishii A, and Yonehara M. A cell-killing monoclonal antibody (anti-Fas)
to a cell surface antigen co-downregulated with the receptor of tumor necrosis factor.
J Exp Med, 169:1747–1756, (1989).
[121] Nagata S. Apoptosis by death factor. Cell, 88:355–365, (1997).
[122] Nagata S and Golstein P. The Fas death factor. Science, 267:1449–1456, (1995).
[123] Leithauser F, Dhein J, Mechtersheimer G, Koretz K, Bruderlein S, Henne C, Schmidt
A, Debatin KM, Krammer PH, and Moller P. Constitutive and induced expression
of APO-1, a new member of the nerve growth factor/tumor necrosis factor receptor
superfamily, in normal and neoplastic cells. Lab Invest, 69:415–429, (1993).
[124] Robertson MJ, Manley TJ, Pichert G, Cameron C, Cochran KJ, Levine H, and Ritz
J. Functional consequences of APO-1/Fas (CD95) antigen expression by normal and
neoplastic hematopoietic cells. Leuk Lymphoma, 17:51–61, (1995).
[125] Akagi T, Yoshino T, and Kondo E. The Fas antigen and Fas-mediated apoptosis in
B-cell differentiation. Leuk Lymphoma, 28:483–489, (1998).
[126] Hahne M, Renno T, Schroeter M, Irmler M, French L, Bornard T, MacDonald HR,
and Tschopp J. Activated B cells express functional Fas ligand. Eur J Immunol,
26:721–724, (1996).
[127] Van L, Ibraghimov A, and Abbas AK. The roles of costimulation and Fas in T cell
apoptosis and peripheral tolerance. Immunity, 4:321–328, (1996).
[128] Rathmell JC, Townsend SE, Xu JC, Flavell RA, and Goodnow CC. Expansion or
elimination of B cells in vivo: dual roles for CD40- and Fas (CD95)-ligands modulated
by the B cell antigen receptor. Cell, 87:319–329, (1996).
References 120
[129] Garrone P, Neidhardt EM, Garcia E, Galibert L, van Kooten C, and Banchereau J.
Fas ligation induces apoptosis of CD40-activated human B lymphocytes. J Exp Med,
182:1265–1273, (1995).
[130] Panayiotidis P, Ganeshaguru K, Foroni L, and Hoffbrand AV. Expression and func-
tion of the FAS antigen in B chronic lymphocytic leukemia and hairy cell leukemia.
Leukemia, 9:1227–1232, (1995).
[131] DiGiuseppe JA, LeBeau P, Augenbraun J, and Borowitz MJ. Multiparameter
flow-cytometric analysis of bcl-2 and Fas expression in normal and neoplastic
hematopoiesis. Am J Clin Pathol, 106:345–351, (1996).
[132] Karawajew L, Wuchter C, Ruppert V, Drexler H, Gruss HJ, Dorken B, and Ludwig
WD. Differential CD95 expression and function in T and B lineage acute lymphoblas-
tic leukemia cells. Leukemia, 11:1245–1252, (1997).
[133] Tsuruda K, Yamada Y, Hirakata Y, Sugahara K, Maeda T, Atogami S, Tomonaga M,
and Kamihira S. Qualitative and quantitative characterization of Fas (APO-1/CD95)
on leukemic cells derived from patients with B-cell neoplasms. Leuk Res, 23:159–166,
(1999).
[134] Debatin KM and Krammer PH. Resistance to APO-1 (CD95) induced apoptosis in
T-ALL is determined by a BCL-2 independent anti-apoptotic program. Leukemia,
9:815–820, (1995).
[135] Komada Y and Sakurai M. Fas receptor (CD95)-mediated apoptosis in leukemic cells.
Leuk Lymphoma, 25:9–21, (1997).
[136] Zhou J, Chen Y, Li C, and Liu W. The protein expression of Bcl-2, Bax, Fas/Apo-1
in acute myeloid leukemia. J Tongji Med Univ, 18:42–45, (1998).
[137] Min YH, Lee S, Lee JW, Chong SY, Hahn JS, and Ko YW. Expression of Fas antigen
in acute myeloid leukaemia is associated with therapeutic response to chemotherapy.
Br J Haematol, 93:928–930, (1996).
References 121
[138] Nguyen PL, Harris NL, Ritz J, and Robertson MJ. Expression of CD95 antigen
and Bcl-2 protein in non-Hodgkin’s lymphomas and Hodgkin’s disease. Am J Pathol,
148:847–853, (1996).
[139] Baryshnikov A, Polosukhina ER, Tupitsin NN, Gavrikova NV, Andreeva L, Zabotina
TN, Mayakova SA, Kurmashov VI, Syrkin AB, Kadagidze ZG, Blochin D, and
Shishkin Yu V. CD95 (FAS/APO-1) antigen is a new prognostic marker of blast
cells of acute lymphoblastic leukaemia patients. Adv Exp Med Biol, 457:251–258,
(1999).
[140] Wuchter C, Karawajew L, Ruppert V, Buchner T, Schoch C, Haferlach T, Ratei R,
Dorken B, and Ludwig WD. Clinical significance of CD95, Bcl-2 and Bax expres-
sion and CD95 function in adult de novo acute myeloid leukemia in context of P-
glycoprotein function, maturation stage, and cytogenetics. Leukemia, 13:1943–1953,
(1999).
[141] Posovszky C, Friesen C, Herr I, and Debatin KM. Chemotherapeutic drugs sen-
sitize pre-B ALL cells for CD95- and cytotoxic T-lymphocyte-mediated apoptosis.
Leukemia, 13:400–409, (1999).
[142] Fulda S, Strauss G, Meyer E, and Debatin KM. Functional CD95 ligand and CD95
death-inducing signaling complex in activation-induced cell death and doxorubicin-
induced apoptosis in leukemic T cells. Blood, 95:301–308, (2000).
[143] Wang D, Freeman GJ, Levine H, Ritz J, and Robertson MJ. Role of the CD40 and
CD95 (APO-1/Fas) antigens in the apoptosis of human B-cell malignancies. Br J
Haematol, 97:409–417, (1997).
[144] Beltinger C, Kurz E, Bohler T, Schrappe M, Ludwig WD, and Debatin KM. CD95
(APO-1/Fas) mutations in childhood T-lineage acute lymphoblastic leukemia. Blood,
91:3943–3951, (1998).
[145] Alam MK, Davison S, Siddiqui N, Norton JD, and Murphy JJ. Ectopic expression
of Bcl-2, but not Bcl-xL rescues Ramos B cells from Fas-mediated apoptosis. Eur J
Immunol, 27:3485–3491, (1997).
References 122
[146] Laytragoon-Lewin N, Duhony E, Bai XF, and Mellstedt H. Downregulation of the
CD95 receptor and defect CD40-mediated signal transduction in B-chronic lympho-
cytic leukemia cells. Eur J Haematol, 61:266–271, (1998).
[147] Kitada S, Zapata JM, Andreeff M, and Reed JC. Bryostatin and CD40-ligand
enhance apoptosis resistance and induce expression of cell survival genes in B-cell
chronic lymphocytic leukaemia. Br J Haematol, 106:995–1004, (1999).
[148] Brunner KT, Mauel J, Cerottini JC, and Chapuis B. Quantitative assay of the lytic
action of immune lymphoid cells on 51-Cr-labelled allogeneic target cells in vitro;
inhibition by isoantibody and by drugs. Immunology, 14:181–196, (1968).
[149] Agematsu K, Hokibara S, Nagumo H, and Komiyama A. CD27: a memory B-cell
marker. Immunol Today, 21:204–206, (2000).
[150] Yamada S, Shinozaki K, and Agematsu K. Involvement of CD27/CD70 interac-
tions in antigen-specific cytotoxic T-lymphocyte (CTL) activity by perforin-mediated
cytotoxicity. Clin Exp Immunol, 130:424–430, (2002).
[151] Schroter M, Lowin B, Borner C, and Tschopp J. Regulation of Fas(Apo-1/CD95)-
and perforin-mediated lytic pathways of primary cytotoxic T lymphocytes by the pro-
tooncogene bcl-2. Eur J Immunol, 25:3509–3513, (1995).
[152] Lowin B, Hahne M, Mattmann C, and Tschopp J. Cytolytic T-cell cytotoxicity is
mediated through perforin and Fas lytic pathways. Nature, 370:650–652, (1994).
[153] Kagi D, Seiler P, Pavlovic J, Ledermann B, Burki K, Zinkernagel RM, and Hengart-
ner H. The roles of perforin- and Fas-dependent cytotoxicity in protection against
cytopathic and noncytopathic viruses. Eur J Immunol, 25:3256–3262, (1995).
[154] Chu P, Deforce D, Pedersen IM, Kim Y, Kitada S, Reed JC, and Kipps TJ. La-
tent sensitivity to Fas-mediated apoptosis after CD40 ligation may explain activity
of CD154 gene therapy in chronic lymphocytic leukemia. Proc Natl Acad Sci U S A,
99:3854–3859, (2002).
References 123
[155] Whiteway A, Corbett T, Anderson R, Macdonald I, and Prentice HG. Expression
of co-stimulatory molecules on acute myeloid leukaemia blasts may effect duration of
first remission. Br J Haematol, 120:442–451, (2003).
[156] Kivekas I, Hulkkonen J, Hurme M, Vilpo L, and Vilpo J. CD80 antigen expression
as a predictor of ex vivo chemosensitivity in chronic lymphocytic leukemia. Leuk Res,
26:443–446, (2002).
[157] Maeda A, Yamamoto K, Yamashita K, Asagoe K, Nohgawa M, Kita K, Iwasaki H,
Ueda T, Takahashi A, and Sasada M. The expression of co-stimulatory molecules and
their relationship to the prognosis of human acute myeloid leukaemia: poor prognosis
of B7-2-positive leukaemia. Br J Haematol, 102:1257–1262, (1998).
[158] Hock BD, Patton WN, Budhia S, Mannari D, Roberts P, and McKenzie JL. Human
plasma contains a soluble form of CD86 which is present at elevated levels in some
leukaemia patients. Leukemia, 16:865–873, (2002).
[159] Guikema JE, Hovenga S, Vellenga E, Conradie JJ, Abdulahad WH, Bekkema R, Smit
JW, Zhan F, Shaughnessy J, Jr., and Bos NA. CD27 is heterogeneously expressed
in multiple myeloma: low CD27 expression in patients with high-risk disease. Br J
Haematol, 121:36–43, (2003).
[160] Molica S, Vitelli G, Levato D, Crispino G, Dell’Olio M, Dattilo A, Matera R, Gandolfo
GM, and Musto P. CD27 in B-cell chronic lymphocytic leukemia. Cellular expression,
serum release and correlation with other soluble molecules belonging to nerve growth
factor receptors (NGFr) superfamily. Haematologica, 83:398–402, (1998).
[161] Beltinger C, Bohler T, Karawajew L, Ludwig WD, Schrappe M, and Debatin KM.
Mutation analysis of CD95 (APO-1/Fas) in childhood B-lineage acute lymphoblastic
leukaemia. Br J Haematol, 102:722–728, (1998).
[162] Kamihira S, Yamada Y, Hirakata Y, Tomonaga M, Sugahara K, Hayashi T, Dateki
N, Harasawa H, and Nakayama K. Aberrant expression of caspase cascade regulatory
genes in adult T-cell leukaemia: survivin is an important determinant for prognosis.
Br J Haematol, 114:63–69, (2001).
Danksagung Mein besonderer Dank gilt: Frau Dr. Dagmar Dilloo für das Thema, für die Möglichkeit zur Promotion in Ihrer Arbeitsgruppe, für die ausgezeichnete wissenschaftliche Betreuung and Unterstützung in dieser Arbeit. Herrn Prof. Dr. Ulrich Göbel für die Möglichkeit zur Durchführung dieser Arbeit im Knochenmarktransplantationslabor der Abteilung für Pädiatrische Hämatologie, Onkologie und Immunologie und für die Betreuung. Herrn Prof. Dr. Heinz Mehlhorn für die Bereitschaft die vorliegende Arbeit mitzubetreuen und zu begutachten. Mein herzlichen Dank gilt Fr. Dr. Birgit Ackermann und Herrn Dr. Andree Zibert für die Einweisung in zahlreiche Techniken, für die intensive Betreuung und für die moralische Unterstützung. Den Mitarbeiter des KMT-Labors gilt der Dank für ihre stets hilfsbereite, kollegiale und freundschaftliche Unterstützung und angenehme Arbeitsklima. Cпасибо моим родителям за поддержку и понимание. Oсобенное cпасибо моему мужу Денису за то что он всегда был рядoм со мною на этoм долгом и нелегком пути.
L e b e n s l a u f Name: Ludmila Glouchkova Anschrift: Stephanienstr, 19 40211 Düsseldorf
Geburtstag und Geburtsort 31. Mai 1974 in Podolsk Staatsangehörigkeit: Rus Familienstand: verheiratet 1981-1991 Schulbesuch in Podolsk Juni 1991 Abitur 1991-1997 Studium der Biochemie an der Russischen Staatlichen Medizinischen Universität (RSMU), Moskau 1996 –1997 Diplomarbeit Institut für Immunologie, RMSU Moskau 23. Juni 1997 Diplomprüfung
Thema: „Untersuchungen zum Phänotyp von Lymphozyten im peripheren Blut bei Patienten, die an chronischen diffusen Erkrankungen der Leber leiden und mit extrakorporalen Methoden behandelt wurden“,
Qualifikation „Ärztin – Biochemikerin“ Juli 1997 – August 1998 Wissenschaftlicher Mitarbeiter im Onkologischen Forschungszentrum RMFA, Moskau
Mitarbeit im Projekt „CD95(Fas/Apo-1)-vermittelte Apoptose in der B-Zell-Differenzierung“
Oktober 1998 – April 1999 Mitarbeit im Projekt „Costimulatorische Molekülen und Zytokineproduktion bei T Zell Aktivierung“, Leitung PD Dr. Körholz, Dilloo an Klinik für Pädiatrische Hämatologie und Onkologie im Labor für Stammzelltransplantation und Experimentell Hämatologie
Ab Mai 1999 Promotionsarbeit in der Arbeitsgruppe von Fr. PD Dr. Dilloo an Klinik für Pädiatrische Hämatologie und Onkologie im Labor für Stammzelltransplantation und Experimentell Hämatologie

Erklärung Hiermit erkläre ich, dass ich die vorliegende Arbeit selbstständig verfasst und keine anderen als die angegebenen Quellen und Hilfsmittel benutzt habe. Sie wurde weder für die andere Prüfungen verwendet noch an anderen Fakultäten eingereicht, auch nicht auszugsweise. Düsseldorf, Januar 2004.