Embed Size (px)
Citation preview

BIOLOGICAL SURVEY AND ANALYSISOE FLORIDA'S ARTIFICIAL REEFS
by
Stephen A. Bortone
and
Doyal Van Orman
FLORIDA MA GRAN!T COLLfGf

BIOLOG!CAL SURVEY AND ANALYSIS
OF FLORIDA'S ARTIFICIAL REEFS
Stephen A. Bortoneand
Doyal Van Orman
Project No. IR-83-12
Bi ol ogy Depa rtme ntUniversity of West FloridaPensacol a, Fl orida 32514
Technical Papers are duplicated in limited quantities for specialized audi-ences requiring rapid access to information and may receive only limited edit-ing. The text of this paper is retyped exactly fran copy provided by thesenior author. This paper is provided by the Florida Sea Grant College withsupport fran NOAA Office of Sea Grant, U.S. Department of Commerce, grant num-ber NA80AA-D-00038. It was published by the Sea Grant Extension Program whichfunctions as a component of the Florida Cooperative Extension Service, John T.Woeste, Dean, in conducting Cooperative Extension work in Agriculture, HcmeEconmics, and Narine Sciences, State of Florida, U.S. Department of Agricul-ture U.S. Department of Canmerce, and Boards of County Canmissioners, cooper-ating. Printed and distributed in furtherance of the Acts of Congress of May8 and June 14, 1914. The Florida Sea Grant College is an Equal EmploymentOpportunity-Affirmative Action employer authorized to provide research, educa-tional information and other services only to individuals and institutionsthat function without regard to race, color, sex, or national origin.
TECHNICAL PAPER NO. 34July 1985

EDITOR'S NOTE: A companion study, "Data Base Formation and Assessmentof Biotic and Abiotic Parameters Associated withArtificial Reefs," by Stephen A. Bortone and DoyalVan Orman is published as Technical Paper No. 35, July 1985.

INTRODUCTION
In recent years throughout the United States there has been active inter-est in artificial reefs as a means of expanding the recreational and cmmer-cial fi sheries for midwater and bottom fishes. Numerous studies have beenconducted as a result of this growing interest by State and Federal agencies,universities, and the private sector. Ample information is available concern-ing different materials and how to construct artificial reef structures Buck-ley, 1982; Hilbertz, 1981; Kilma and Nickham, 1969; Parker et al., 1974; Shee-hey, 1981; Stone, 1975; Stone et al ., 1974; Tur ner et al ., 1969; Noodhead etal ., 1982! . Several excel l e nt studies have addressed r ee f col oni zati on,standing crop, and other aspects of artificial reef development Fast, 1974;Hastings, 1979; Hastings et al., 1976; Lukens, 1981; Randall, 1963; Stone etal., 1979; Turner et al., 1969!, but sufficient evidence is lacking whichwould serve as a guideline to increase or enhance the productivity features ofan artificial reef.
Recent efforts were made to determine which physical variables influencedcol oni zati on of a rti fi ci al reefs by assessing the avail able publ i shed andunpublished literature, and constructing a data matrix of physical and biolo-gical parameters. These data could have provided a basis for a statisticalprediction of the standing crop of fishes under certain environmental condi-tions. Of the many studies available only 17 directly addressed the rel ation-ship between the physical features of a reef and the fish production Bortone,1976; Crozier et al., 1977; Fast, 1974; Hastings, 1979; Hastings et al ~, 1976;Hueckel and Stayton, 1982; Kilma and Wickham, 1969; Lukens, 1981; Parker etal., 1979; Randall, 1963; Smith et al., 1979; Sonnier et al., 1976; Steimleand Ogren, 1982; Stone et al., 1979; Turner et al., 1969; Nalton, 1982; Nick-ham et al., 1973!. In addition to the unequal methods, recording proceduresand quantity of data presented made it impossible to accuratety predict whichphysical parameters are related to population density or diversity.
The overall objective of our investigation was to conduct visual assess-ments of fish populations on a series of artificial reefs constructed of dif-ferent types of materials existing under varied envirormental conditions. Onceobtained the information would be analyzed and the results used to establish adata base of physical and biological parameters which influence fish producti-vity and production. These data could then serve as basic guidelines to per-mit identification of factors which would require further investigation, andto construct testable hypothesis regarding future artificial reef research.
METHODS AND MATERIALS
During October and November of 1983 we made a series of SCUBA dives on 30artificial reefs representing ten primary areas along Fl orida's coastline.The areas of investigation were selected based on zoogeographic zones, proxi-mity to passes, protected harborages, and high recreational activities. Ateach major area specific reefs were selected to encompass the different typesof materials used in artificial reef construction, reef profiles high andlow!, depths at which reefs are placed, the distances fran inshore and off-shore topographical influences, and substrates upon which the reefs arepl aced.
1
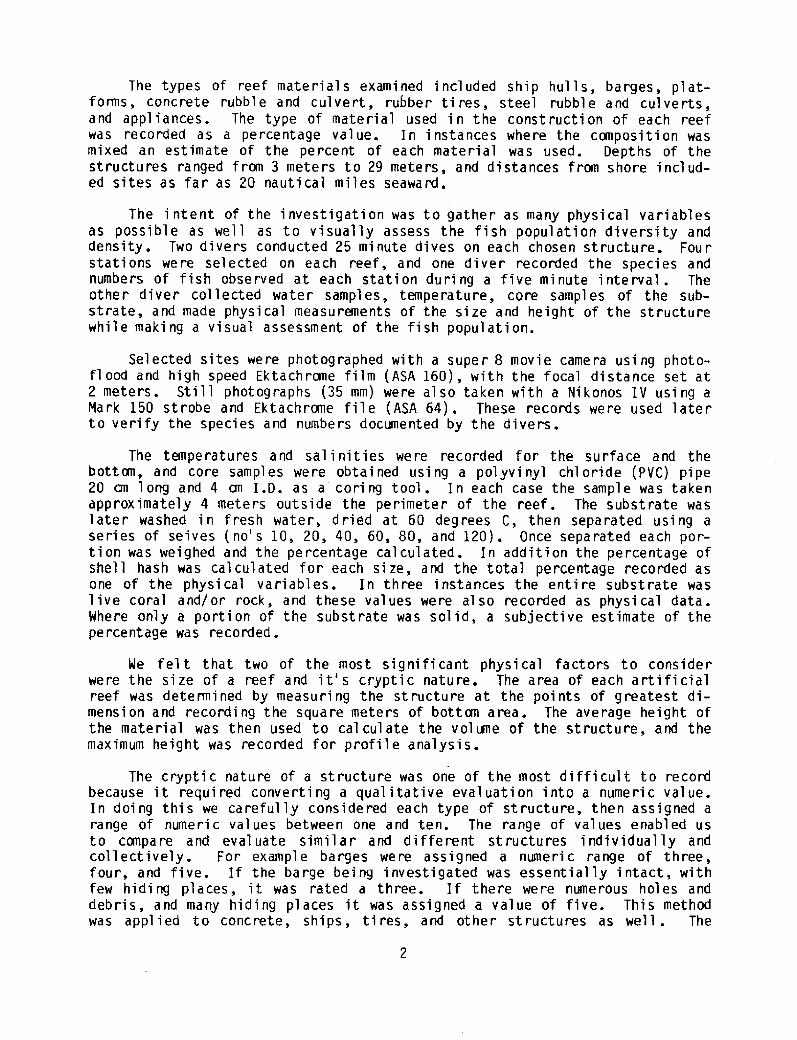
The types of reef materials examined included ship hulls, barges, plat-forms, concrete rubble and culvert, rubber tires, steel rubble and culverts,and appliances. The type of material used in the construction of each reefwas recorded as a percentage value. In instances where the composition wasmixed an estimate of the percent of each material was used. Depths of thestructures ranged from 3 meters to 29 meters, and distances from shore includ-ed sites as far as 20 nautical miles seaward.
The intent of the investigation was to gather as many physical variablesas possible as well as to visually assess the fish population diversity anddensity. Two divers conducted 25 minute dives on each chosen structure. Fourstations were selected on each reef, and one diver recorded the species andnumbers of fish observed at each station during a five minute interval. Theothe r di ver col 1 ected wate r sampl es, tempe rature, core sampl es of the sub-strate, and made physical measurements of the size and height of the structurewhile making a visual assessment of the fish population.
Selected sites were photographed with a super 8 movie camera using photo-f1 ood and high speed Ektachrane film ASA 160!, with the focal distance set at2 meters. Still photographs �5 mm! were also taken with a Nikonos IV using aMark 150 strobe and Ektachrome file ASA 64!. These records were used laterto verify the species and numbers documented by the divers.
The temperatures and salinities were recorded for the surface and thebottan, and core samples were obtained using a polyvinyl chloride PVC! pipe20 cm long and 4 cm I.D. as a coring tool. In each case the sample was takenapproximately 4 meters outside the perimeter of the reef. The substrate waslater washed in fresh water, dried at 60 degrees C, then separated using aseries of seives no's 10, 20, 40, 60, 80, and 120!. Once separated each por-tion was weighed and the percentage calculated. In addition the percentage ofshell hash was calculated for each size, and the total percentage recorded asone of the physical variables. In three instances the entire substrate waslive coral and/or rock, and these values were also recorded as physical data.Where only a portion of the substrate was solid, a subjective estimate of thepercentage was recorded.
We felt that two of the most significant physical factors to considerwere the size of a reef and it's cryptic nature. The area of each artificialreef was determined by measuring the structure at the points of greatest di-mension and recording the square meters of bottcm area. The average height ofthe material was then used to calculate the volume of the structure, and themaximum height was recorded for profile analysis.
The cryptic nature of a structure was one of the most difficult to recordbecause it required converting a qualitative evaluation into a numeric value.In doing this we carefully considered each type of structure, then assigned arange of numeric values between one and ten. The range of values enabled usto compare and evaluate similar and different structures individually andcollectively. For exampl e barges were assigned a numeri c range of three,four, and five. If the barge being investigated was essentially intact, withfew hiding places, it was rated a three. If there were numerous holes anddebris, and many hiding places it was assigned a value of five. This methodwas appl i ed to concrete, shi ps, t i res, and other st ructur es as wel 1 . The

Japanese artificial reef was rated highest at ten, and block-like solid struc-tures were rated the lowest with a one.
Species I i sts and numbers of fishes recorded by divers were canpared forcanpleteness and accuracy. The species were arranged taxonmically accordingto Robins et al. �980!. Each family was listed chronologically fran 1 to193, and the species within each family were entered sequentially beginningwith one through the last species. The total number of each species was re-corded by reef which enabled us to canpare families, selected portions of thereef conmunity, of the total population with the recorded physical variables.For initial analysis the biological data were reduced to six families whichrepresented the primary reef groups sought by recreati onal fishermen. Theyare described by the following codes;
109 = Serranidae
124 = Lutjanidae
129 = Spa ri dae
120 = Carangidae
127 = Haemulidae
142 = Labrida
A data matrix was constructed listing reefs on the vertical axis and thephysical and biological variables on the horizontal axis. Reef identificationnumbers consist of a three digit code which foll ows the identification processin the Atlas of Artificial Reefs Aska and Pybas, 1983!. The following arethe numbers and descriptions whi ch can be used to identify non-permittedsites.
Reef F, 4.4 beauti cal miles west of Caxambas Pass,Marco Island, Florida.
349
Reef E, 4.4 nautical miles west of Caxambus Pass,Na rco I sl a nd, F 1 ori da.
350
Shrimp boat, approximately 6 nautical miles north ofKey West, Florida.
351
Steel vessel, approximately 10.3 nautical mil- north-west of Key West, Florida.
352
353 Steel vessel, approximately 10.4 nautical miles north-west of Key West, Florida.
Rock jetties, approximately 6 nautical miles north ofKey West, Florida.
354
Japanese artificial reef, 10 nautical miles west ofClearwater Pass, Clearwater, Fl orida.
3
433
Vi sibil ity was determined with a 20 cm Sechi disc by measuring horizon-tally fran the disc to the point at which the shape of' the disc was no longerclearly discernible. When visibility was less than two meters the dive wasaborted.

434
600
650
Physical variablesbel ow.
VOL SHD:WIND DI R:
WIND VEL:
CURR DIR:
CURR VEL:
VISIBILITY:
LONGITUDE:
TIDE TYPE:
W STMP L:
W STMP H:
W STMP A:S STMP L:
S STMP H:
REEF
YR BLT:
MAT S:
MAT C:
MAT R:
MAT W:
COMP 1:
COMP 2:
COMP 3:COMP 4:COMP 5:
COMP 6:COMP 7:
COMP 8:LATITUDE:
Crypti c:AREA M2:
AREA M3
MAX HGHT:
DEPTH:
DST SHRE:
DST 100F:DST PASS:
Cement culverts, 10 nautical miles west of ClearwaterPass, Clearwater, Florida.
Stage II platform, 2.2 nautical miles southwest of St.Andrews Pass, Panama City, Florida.
Eight washing machines, 4.5 nautical miles southeastof Pensacola Pass, pensacola, Florida.
recorded and used in the ccmputer analysis are listed
Reef i denti f i cati on numbe r.Year reef placed on site.Percent steel in the composition.Percent cement.Percent rubber ~Percent wood.Pe rce nt s ol i d sub st rate.Percent substrate larger than 2.0 mm.Percent .850 - 2.0 mm.Percent .425 - .850 mn.Percent .250 - .425 mm.Percent .180 - .250 en.Percent ~ 125 - .180 mm.Percent less than .125 rao.Latitude of the site.Potential hiding places provided by the structure.Bottom area in space meters.Estimate of the volume of material in cubic meters.Highest point of the structure. Recorded in meters ~Recorded in meters.Distance fr e shore in nautical miles.Distance from 100 fathom in nautical miles.Distance to pass or entrance of the closest drainage.Recorded in nautical miles.Mean volume of discharge of the nearest drainage.Predominant direction in degrees from which the windblows.Mean wind velocity recorded in nautical miles per hour.Resul tant water current entered in degrees. Recordedas the direction the current sets.Mean current vel ocity recorded in nautical miles perhour.
Vi si bi l i ty recorded i n mete rs.Longitude of the site.S = semidiurnal; D = diurnal; M = mixed Fernald,1981! .Lowest winter surface temperature in Farenheit.Highest winter surface temperature.Average winter surface temperature.Lowest summer surface temperature.Highest summer surface temperature.
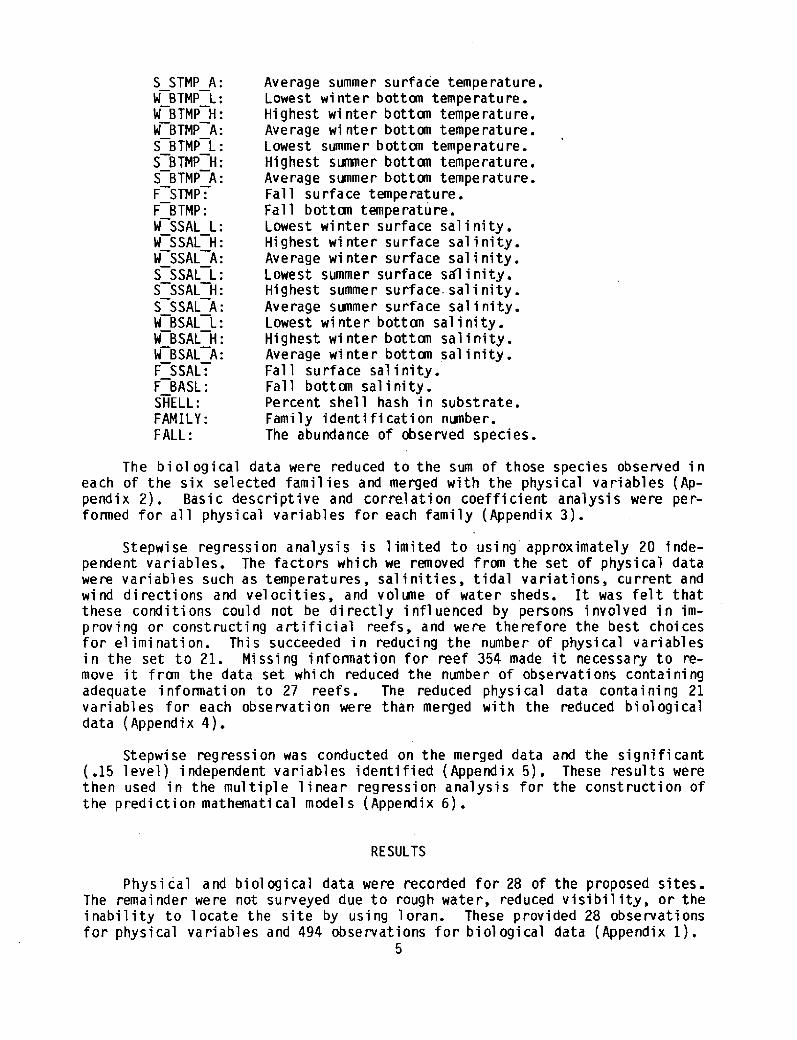
The bi ol ogical data were reduced to the sum of those species observed ineach of the six selected families and merged with the physical variables Ap-pendix 2!. Basic descriptive and correlation coefficient analysis were per-formed for all physical variables for each family Appendix 3!.
Stepwise regression analysis is limited to using approximately 20 inde-pendent variables. The factors which we removed from the set of physical datawere variables such as temperatures, salinities, tidal variations, current andwind directions and velocities, and volte of water sheds. It was felt thatthese conditions could not be directly influenced by persons involved in im-proving or constructing artificial reefs, and were therefore the best choicesfor elimination. This succeeded in reducing the number of physical variablesin the set to 21. Missing information for reef 354 made it necessary to re-move it frcm the data set which reduced the number of observations containingadequate information to 27 reefs. The reduced physical data containing 21variables for each observation were than merged with the reduced biologicaldata Appendix 4!.
Stepwise regression was conducted on the merged data and the significant .15 level! independent variables identified Appendix 5!. These results werethen used in the mul ti pl e 1 i nea r reg ress i on anal ysi s f or the const ructi on ofthe prediction mathematical model s Appendix 6! .
RESULTS
Physi cal and biological data were recorded for 28 of the proposed sites ~The remainder were not surveyed due to rough water, reduced visibility, or theinability to 'Iocate the site by using loran. These provided 28 observationsfor physica'I variables and 494 observations for biological data Appendix 1!.
5
S STMP A:
W BTMP L:
W BTMP H:W BTMP A.
S BTMP L:S BTMP H:
S BTMP A:F STMP:
F BTMP:
W SSAL L:
W SSAL H:
W SSAL A:S SSAL L:
S SSAL H:
S SSAI A:
W BSAL L:
W BSAL H:
W BSAL A:F SSAL:
F BASL:
SHELL:
FAMII Y:
FAlL:
Average summer surface temperature ~Lowest winter bott' temperature.Highest winter bott' temperature.Average winter bottom temperature.Lowest summer bottan temperature.Highest surtnier bottaii temperature.Average summer bottom temperature.Fall surface temperature.Fall bottcm temperature.I owest winter surface salinity.Highest winter surface salinity.Average winter surface salinity.Lowest summer surface sa1inity.Highest summer surface. salinity.Average summer surface salinity.Lowest wi nte r bottcm sal i ni ty.Highest winter bott' salinity.Average winter bottom salinity.Fal I surface sal inity.Fall bottcm salinity.Percent shell hash in substrate.Family identi fi cation number.The abundance of observed species.
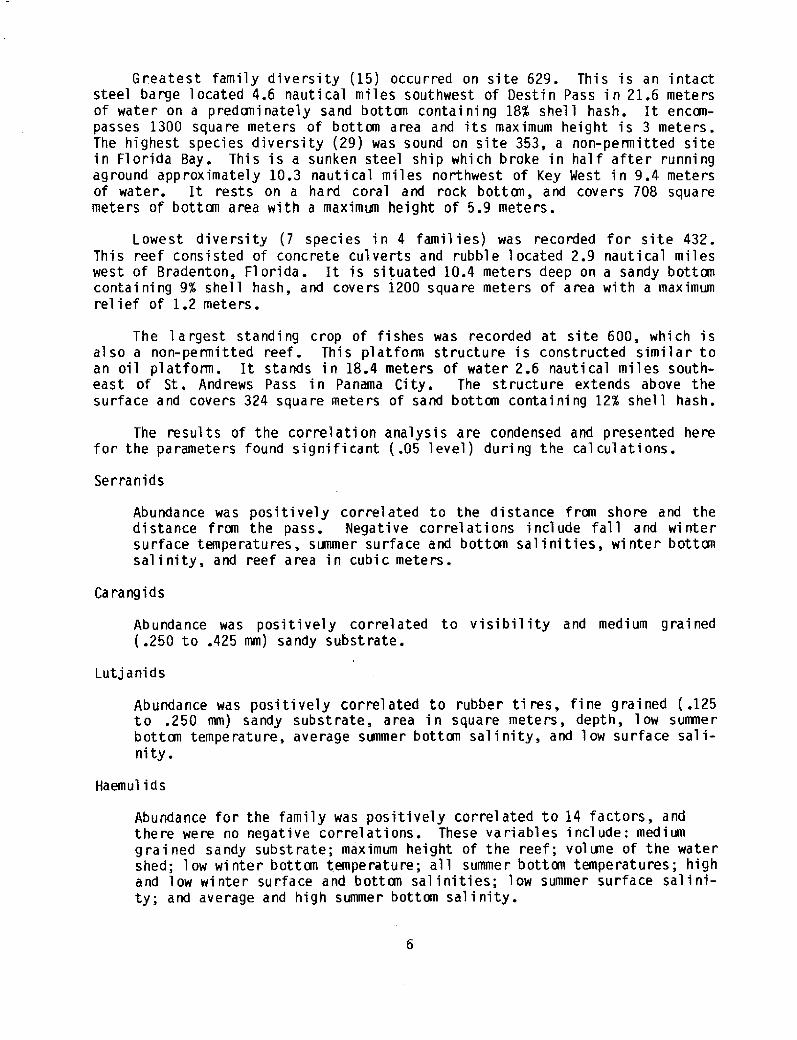
Breatest family diversity �5! occurred on site 629. This is an intactsteel barge located 4.6 nautical miles southwest of Destin Pass in 21.6 metersof water on a predcminately sand bottcm containing 18$ shell hash. It enc<m-passes 1300 square meters of bottom area and its maximum height is 3 meters.The highest species diversity �9! was sound on site 353, a non-permitted sitein Florida Bay. This is a sunken steel ship which broke in hal f after runningaground approximately 10.3 nautical miles northwest of Key West in 9.4 metersof water. It rests on a hard coral and rock bottcm, and covers 708 squaremeters of bottom area with a maximum height of 5.9 meters.
Lowest diversity � species in 4 families! was recorded for site 432.This reef consisted of concrete culverts and rubble located 2.9 nautical mileswest of Bradenton, Florida. It is situated 10.4 meters deep on a sandy bottomcontaining 9$ shell hash, and covers 1200 square meters of area with a maximumrelief of 1.2 meters.
The largest standing crop of fishes was recorded at site 600, which isalso a non-permitted reef. This platform structure is constructed similar toan oil platform. It stands in 18.4 meters of water 2.6 nautical miles south-east of St. Andrews Pass in Panama City. The structure extends above thesurface and covers 324 square meters of sand bottom containing 12$ shell hash.
The results of the correlation analysis are condensed and presented herefor the parameters found significant .05 level! during the cal culations.
Serr anids
Abundance was positively correlated to the distance from shore and thedistance from the pass. Negative correlations include fall and wintersurface temperatures, summer surface and bottom salinities, winter bottcmsalinity, and reef area in cubic meters.
Ca r angids
Abundance was positively correl ated to vi sibil ity and medium grained .250 to .425 mm! sandy substrate ~
Lutj anids
Abundance was positively correlated to rubber tires, fine grained .125to .250 mm! sandy substrate, area in square meters, depth, low summerbott' temperature, average summer bottan salinity, and low surface sali-nityy.
Haemul i d s
Abundance for the family was positively correlated to 14 factors, andthere were no negative correlations. These variables include: mediumgrained sandy substrate; maximum height of the reef; volane of the watershed; low winter bottom temperature; all summer bottom temperatures; highand low winter surface and bottom salinities; low summer surface salini-ty; and average and high summer bottoxn salinity.
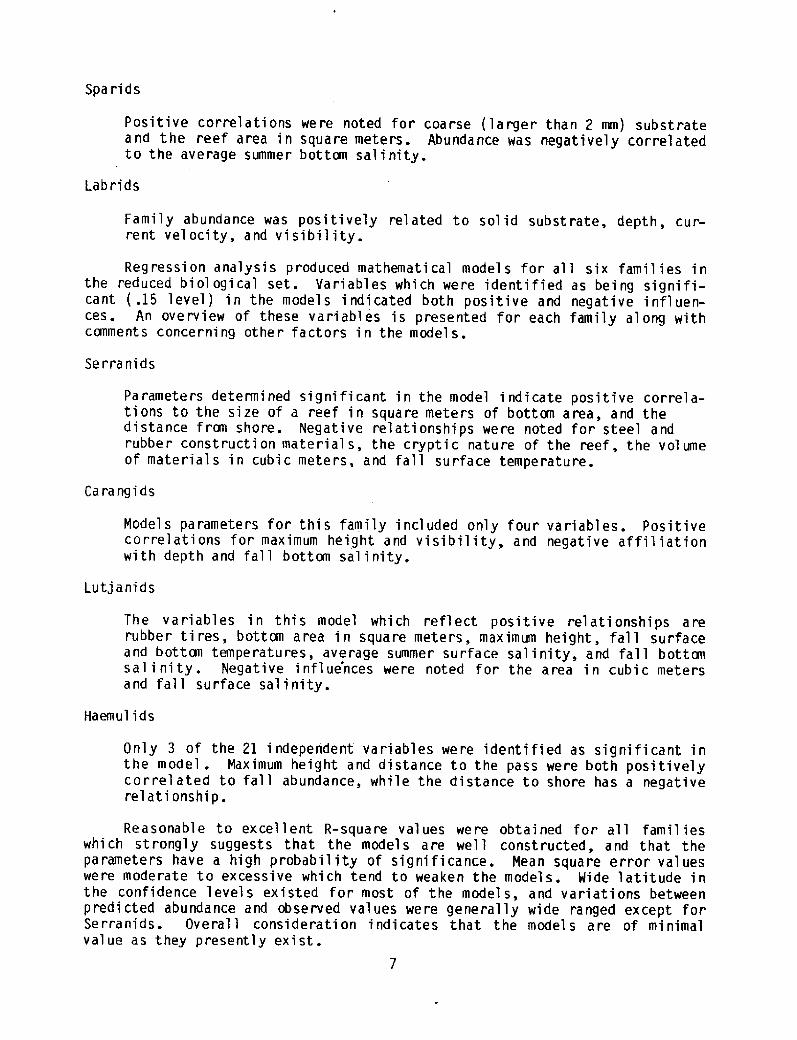
Spa rids
Positive correlations were noted for coarse larger than 2 mm! substrateand the reef area in square meters. Abundance was negatively correlatedto the average summer bottom salinity.
Lab rids
Family abundance was positively related to solid substrate, depth, cur-re nt v el oci ty, a nd v i s i b i 1 i ty.
Regression analysis produced mathematical models for all six families inthe reduced biological set. Variables which were identified as being signifi-cant .15 level! in the models indicated both positive and negative influen-ces. An overview of these variables is presented for each family along withcomments concerning other factors in the models.
Ser ranids
Parameters determined significant in the model indicate positive correla-tions to the size of a reef in square meters of bottan area, and thedistance frcm shore. Negative relationships were noted for steel andrubber construction material s, the cryptic nature of the reef, the volumeof materials in cubic meters, and fall surface temperature.
Carangids
Models parameters for this family included only four variables. Positivecorrelations for maximum height and visibility, and negative affiliationwith depth and fall bottom salinity.
Lutjanids
The vari abl es in this model which reflect positive rel ationships arerubber tires, bottom area in square meters, maximum height, fall surfaceand bottom temperatures, average summer surface salinity, and fall bottomsalinity. Negative influences were noted for the area in cubic metersand fall surface salinity.
Haemul i d s
Only 3 of the 21 independent variables were identified as significant inthe model . Maximum height and distance to the pass were both positivelycorrel ated to fall abundance, while the distance to shore has a negativerelationship .
Reasonable to excellent R-square values were obtained for all famil ieswhi ch strongly suggests that the model s are wel 1 constructed, and that theparameters have a high probabiIity of significance. Mean square error valueswere moderate to excessive which tend to weaken the models. Wide latitude inthe confidence levels existed for most of the models, and variations betweenpredicted abundance and observed values were generally wide ranged except forSerranids. Overall consideration indicates that the models are of minimalvalue as they presently exist.
DISCUSSION
The prel iminary resul ts of stepwi se and linear regression analysi s re-flect high R-square values which leave little doubt that the models are ofvalue. The other less positive aspects of the analysis requires further ex-planationn.
Successful construction of a mathematical model for predicting fish popu-lations on a given reef requires several things: I! an adequate volume of thedata must be gathered; 2! the samples must be representative of the entirepopulation; 3! the data must be properly manipulated and analyzed to accountfor variations in the samples. Each of these conditions was examined and thefol towing ccranents are extended.
We feel that the number of investigations was smaller than required forthe task. High R-square values can be obtained with limited assessments, buta low mean square error { reported high in our models! is needed, and is ad-versely influenced by a small number of observations.
In addressing the representative sampling factor and how it effects outresults several points are important. Our investigations were conducted at atime when seasonal faunal changes normally occur. Some members may have al-ready migrated to deeper, more stable water. Samples were taken shortly afterthe end of the heaviest seasonal fishing period. It's possible that signifi-cant numbers of key families were harvested during that time. On three of thesites we assessed spearfi shermen were actively engaged in taking fish fran thereef. On another site divers were harvesting stone crab claws, and concurrentfishing occurred on one other structure. These activities may have caused keyspecies to move out of the area thereby altering the results of the sample. Ared tide bloom occurred two weeks before we assessed the area between TarponSprings and Sarasota. Local biologists reported dead grouper and snapper aswell as small reef fish. All of these conditions can cause variations in theabundance of fish recorded for the different sites. If there were significantvariations in the observed values they would have an adverse effect on themodel, and especially on the predicted values and confidence levels obtainedfor each observation.
Two things which minimize these effects and strengthen the models are toobtain more information through additional observations, and to manipulate theraw data. The effects of wide variations in data can be reduced by transform-ing the values to a logarithm scale. This wasn't done initially because goodresults obtained with raw data are more powerful statistically than those ob-tained frcm transformed data. Other actions such as transforming percentagevalues recorded in raw terms '90$, 45'L, etc.! to values such as .90 and .45 orto a logarithm scale would reduce excessive variations and enhance the processof analysis.
Grouping entire families into one abundance value may cause undesirableresults in analysis. In this instance we are trying to construct a predictivemodel for catchable fish, but we are including the population of their non-catchable relatives in analysis. Selection of specific members of key fami-1 ies would reduce the adverse effect and align the models to our specificneeds.
The important point is that although the models are, at present, looselyconstructed they appear reliable enough to warrant transfotming the data, andif significant improvements are noted efforts should be made to field test theresults.
CONCLUSION
Additional analysis is needed on the existing data to eliminate s me ofthe excessive latitude noted in the models. To do this several steps shouldbe taken.
I! A recently modified program which enables us to include abundance dataof selected families as part of the set of independent variables shouldbe used in the analysis.
2! Recorded percent values, raw abundance data, and other factors shouldbe transformed in scme manner to minimize excessive variance.
3! The biological data set should be reduced to specific groups withineach key family .
The existing data are inadequate and suspected of being non-representa-tive of the annual population. Therefore this type of study should be repeat-ed to:
I ! P rovi de more data through i ncr eased obse rvati ons.
2! Expand the results to include all seasons.
3! Account for variations due to seasonal changes and other influencingfactors.
4! Field test the improved models.
LIST OF APPENDICES
1. Raw physical and biological data �4 pages!
2. Merged physical and reduced biological data �6 pages!
3. Descriptive statistics and correlation coefficient analysis �9pages!
4. Merged reduced physical and reduced biological data 8 pages!
5. Stepwise regression �0 pages!
6. General linear model �8 pages!
*Editorial Note: Due to the number of pages and format of the computer printout, the appendices are not reproduced in this report. Interested read-ers may request this highly technical information from the senior authorat the address noted on the title page.
LITERATURE CITED
Aska, D.Y., and D.W. Pybas. 1983. Atlas of artificial reefs in Fl orida.Fl orida Sea Grant College. 15 p.
Bortone, S.A. 1976. Effects of a hurricane on the fish fauna at Destine,Fl orida. Fl ori da Sci . 39 �!:245-248.
Buckley, R... 1982. Marine habitat enhancement and urban recreational fish-ing in Washington. Mar. Fish. Rev. 44�-7!:28-37.
Crozier, G.F., R.L. Shipp, T. McIlwain, N.J. Doorenbos, D.L. Daniels, L. E.Brown, D. Dean, E.E. Jones, D. Clarke, J. Uebelacker, R. Lukens, and J.Booker. 1977. Development of gul f coast artificial reefs. In FinalReport: NOAA/Sea Grant 04-5-158-54-07 �!. 33 p.
Fast, D.E. 1974. Comparative studies of fish species and their populationson artificial and natural reefs off southwestern Puerto Rico. M.S. The-sis, Univ. Puerto Rico, Rio Piedras. 90 p.
Hastings, R.S. 1979. The origin and seasonality of the fish and fauna on anew jetty in the northeastern Gul f of Mexico. Bull. Florida State Mus.,Biol. Sci. 24�!:1-122.
Hastings, R ~ S., L.H. Ogren, and M.T. Mabry. 1976. Observations on the fishfauna associated with offshore platforms in the northeastern Gul f ofMex i co. Fi sh. Bull . 74� !: 387-402.
Hilbertz, W.H. 1981. The electrodeposition of minerals in sea water for theconstruction and maintenance of artificial reefs: Conference proceedingsSept. 13-15, 1979. Daytona Beach, Fl orida. D.Y. Aska, Ed. Florida SeaGrant, Gainesvil le, Fl orida. p. 123-148,
Hueckel, G.J., and R.L. Stayton. 1982. Fish foraging on an artificial reefin Puget Sound, Washington. Mar. Fish. Rev. 44�-7!: 38-44.
Kilma, E.F., and D.A. Wickham. 1969. Attraction of coastal pelagic fisheswith artificial structures. Trans ~ Amer. Fish. Soc. 100�!: 86-99.
Lukens, R.R. 1981. Ichthyofaunal colonization of a new artificial reef inthe northwestern Gul f of Mexico. Gulf Research Report 7�!: 41-46.
Parker, R.O., Jr., R ~ B. Stone, C.C. Buchanan, and F ~ W. Steimle, Jr. 1974.How to build marine artificial reefs. U.S. Dept. of Canmer., NOAA, Natl.Mar. Fish Serv., Fish Facts 10. 47 p.
Randall, J.E. 1963. An analysis of the fish populations of artificial andnatural reefs in the Virgin Islands. Crib. J. Sci. 3�!: 31-47.
Robins, C.R., R.M. Bailey, C.E. Bon, J.R. Brooker, E.A. Lachner, R.N. Lea, andW.B. Scott. 1980. A list of conmon and scientific names of fishes frcmthe United States and Canada. Amer. Fish. Soc. Special Pub. No. 12.174 p.
10
Sheehey, D.J. 1981. Artificial reef programs in Japan and Taiwan ~ In arti-ficial reef: Conference proceedings Sept. 13-15, 1979. Daytona Beach,Fl orida. D.Y. Aska, Ed. Fl orida Sea Grant, Gainesville, Florida ~ p.185-198.
Smith, G.B., D.A. Hensley, and H.H. Mathews. 1979. Comparative efficacy ofartificial and natural Gul f of Mexico reefs as fish attractants. FloridaNar. Research Pub., No. 35, p. 7.
Smith, L. 1972. Construction and studies of an artificial reef off Brunswick,Georgia. Proceedings of sport fishing seminar, Coastal Plains Center forMarine Development Services, Seminar Series 1: 5-6.
Sonnier, F., J. Tierling, and H.D. Hoese. 1976. Observations on the offshorereef and platform fish fauna of Louisiana. Copeia 1: 105-111.
State University System of Fl orida Institute of Oceanography. 1973. A sum-mary of knowledge of the eastern Gul f of Mexico.
Steiml e, F.W., Jr., and L. Og ren. 1982. Food fi sh col 1 ected on arti fi ci alreefs in the New York bight and off Charleston, South Carolina. Nar.Fish. Bull. 44�-7!: 49-52,
Stone, R.B. 1975. Scrap tires and fishery resources. In F.A. Ayers compi-lerr!, Environmental aspects of chemical use in revver processing opera-tions. p. 381-387. Office of Toxic Substances, E.P.A., Washington, D.C.
Stone, R.B., C.C. Buchanan, and F.W. Steimle, Jr. 1974. Scrap tires as arti-ficial reefs. Envirorrnentai Protection Agency, Summ. Rep. SW-119, 33 p.
Stone, R,B,, H.L. Pratt, R.O. Parker, Jr., and G.E. Davis. 1979. A compari-son of fish populations on an artificial and natural reef in the FloridaKeys. Mar. Fish. Rev. 41 9!: 1-11 ~
Turner, C.H ~, E.E. Ebert, and R.R. Givens. 1969. Man-made reef ecol ogy.Calif. Dept. Fish Game, Fish. Bull. 146, 221 p.
U.S. Department of Commerce. 1980. Eastern U.S. coastal and ocean zones dataatlas. Office of Coastal Zone Management, U.S. Dept. of Comm., Washing-ton, D.C.
U.S. Department of Interior. 1975. Bureau of Land Management. Compilationof historical and existing physical oceanographic data from the easternGul f of Mexico. Bureau of Land Management Contract No. 08550-C14-16. 97po
Walton, J.W. 1982. The effects of an artificial reef on resident flatfishpopul at i ons . Ma r. Fi s h. Rev. 44 �-7 !: 45-48.
Wi ckham, D.A., J.W. Watson, Jr., and L.H. Og ren. 1973. The efficacy of mid-water artificial structures for attracting pelagic sport fish. Trans.Am. Fi sh. Soc. 102 � !: 563-572.
Woodhead, P.N.J., J.H. Parker, and I.W. Duedall. 1982. The coal-waste arti-ficial reef program C-WARP!: A new resource potential for fishing reefconstruction. Mar. Fish. Rev ~ 44�-7!: 16-23.