Embed Size (px)
Citation preview
For Examiner’s Use
General Certifi cate of Secondary EducationJune 2009
BIOLOGY BLY3HUnit Biology B3
Higher Tier
Wednesday 20 May 2009 1.30 pm to 2.15 pm
For this paper you must have: a ruler.
You may use a calculator.
Time allowed: 45 minutes
Instructions Use black ink or black ball-point pen. Fill in the boxes at the top of this page. Answer all questions. You must answer the questions in the spaces provided. Answers
written in margins or on blank pages will not be marked. Do all rough work in this book. Cross through any work you do not
want to be marked.
Information The maximum mark for this paper is 45. The marks for questions are shown in brackets. You are expected to use a calculator where appropriate. You are reminded of the need for good English and clear presentation
in your answers.
Advice In all calculations, show clearly how you work out your answer.
BLY3H
H
Surname Other Names
Centre Number Candidate Number
Candidate Signature
(JUN09BLY3H01)G/J42086 6/6/6/6/3
For Examiner’s Use
Question Mark Question Mark
1 3
2 4
5
6
7
Total (Column 1)
Total (Column 2)
TOTAL
Examiner’s Initials
2 Areas outside the box will
not be scanned for marking
(02)G/J42086/Jun09/BLY3H
Answer all questions in the spaces provided.
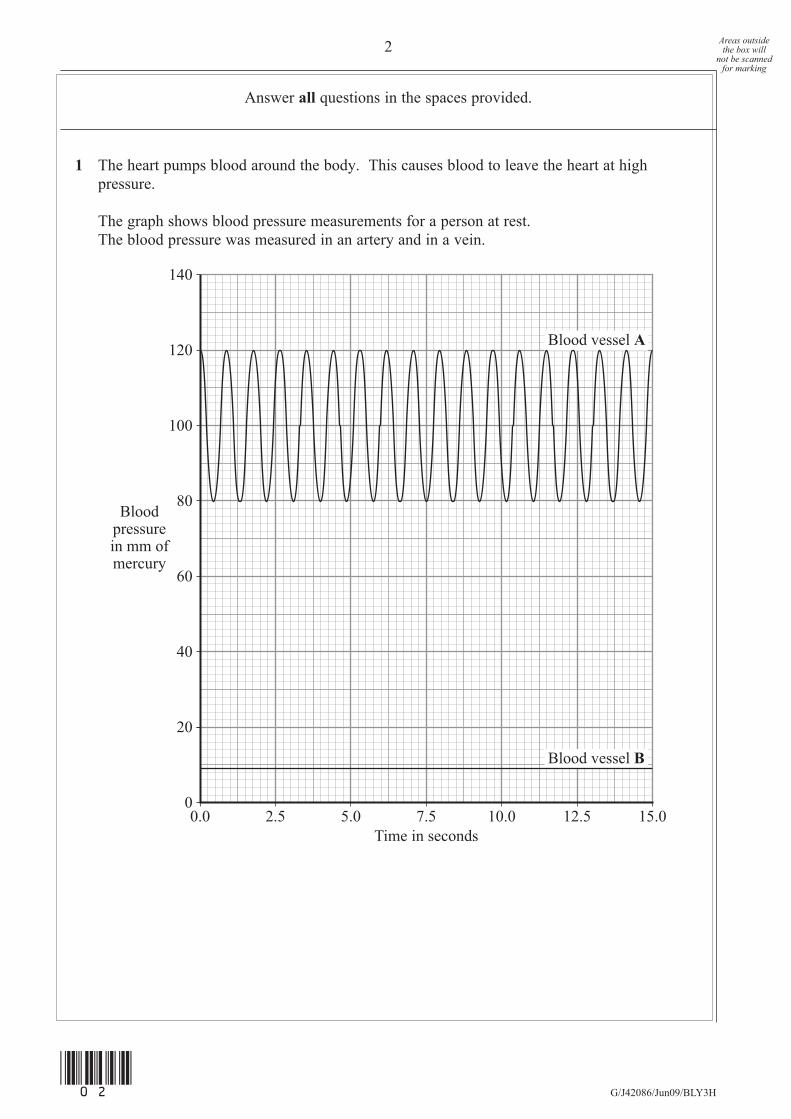
1 The heart pumps blood around the body. This causes blood to leave the heart at high pressure.
The graph shows blood pressure measurements for a person at rest. The blood pressure was measured in an artery and in a vein.
5.0 7.5 10.00.00
20
40
60
80
100
120
140
2.5Time in seconds
Bloodpressurein mm ofmercury
12.5 15.0
Blood vessel B
Blood vessel A
3
Turn over
(03)G/J42086/Jun09/BLY3H
Areas outside the box will
not be scanned for marking
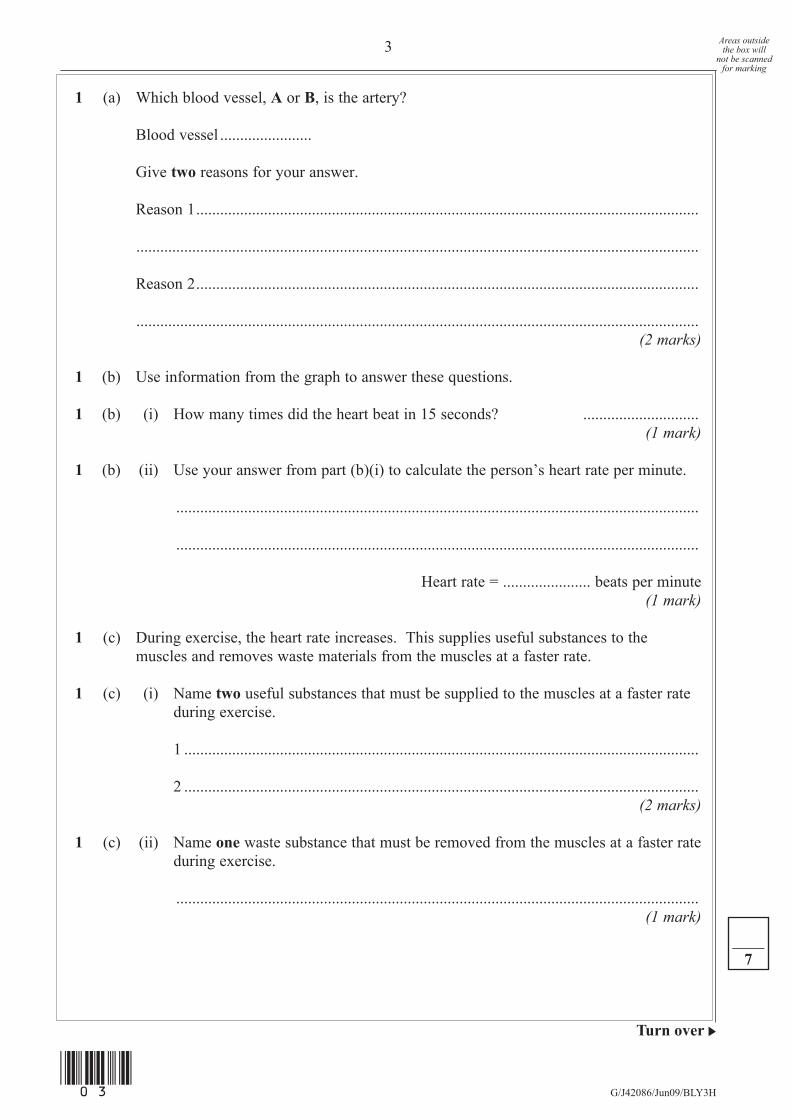
1 (a) Which blood vessel, A or B, is the artery?
Blood vessel .......................
Give two reasons for your answer.
Reason 1 ..............................................................................................................................
.............................................................................................................................................
Reason 2 ..............................................................................................................................
............................................................................................................................................. (2 marks)
1 (b) Use information from the graph to answer these questions.
1 (b) (i) How many times did the heart beat in 15 seconds? ............................. (1 mark)
1 (b) (ii) Use your answer from part (b)(i) to calculate the person’s heart rate per minute.
...................................................................................................................................
...................................................................................................................................
Heart rate = ...................... beats per minute(1 mark)
1 (c) During exercise, the heart rate increases. This supplies useful substances to the muscles and removes waste materials from the muscles at a faster rate.
1 (c) (i) Name two useful substances that must be supplied to the muscles at a faster rate during exercise.
1 .................................................................................................................................
2 .................................................................................................................................(2 marks)
1 (c) (ii) Name one waste substance that must be removed from the muscles at a faster rate during exercise.
...................................................................................................................................(1 mark)
____7
4 Areas outside the box will
not be scanned for marking
(04)G/J42086/Jun09/BLY3H
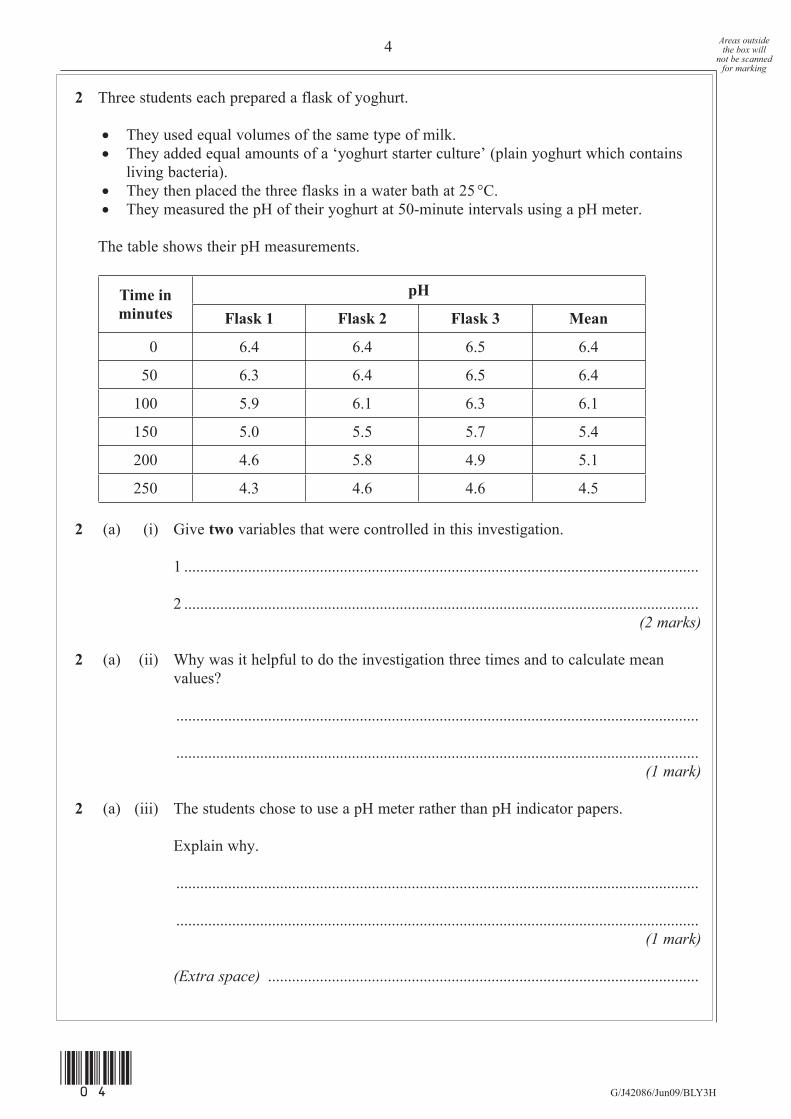
2 Three students each prepared a flask of yoghurt.
• They used equal volumes of the same type of milk. • They added equal amounts of a ‘yoghurt starter culture’ (plain yoghurt which contains
living bacteria). • They then placed the three flasks in a water bath at 25 °C. • They measured the pH of their yoghurt at 50-minute intervals using a pH meter.
The table shows their pH measurements.
Time in minutes
pH
Flask 1 Flask 2 Flask 3 Mean
0 6.4 6.4 6.5 6.4
50 6.3 6.4 6.5 6.4
100 5.9 6.1 6.3 6.1
150 5.0 5.5 5.7 5.4
200 4.6 5.8 4.9 5.1
250 4.3 4.6 4.6 4.5
2 (a) (i) Give two variables that were controlled in this investigation.
1 .................................................................................................................................
2 .................................................................................................................................(2 marks)
2 (a) (ii) Why was it helpful to do the investigation three times and to calculate mean values?
...................................................................................................................................
................................................................................................................................... (1 mark)
2 (a) (iii) The students chose to use a pH meter rather than pH indicator papers.
Explain why.
...................................................................................................................................
...................................................................................................................................(1 mark)
(Extra space) ............................................................................................................

5
(05)G/J42086/Jun09/BLY3H
Areas outside the box will
not be scanned for marking
2 (b) One of the results in the table appears to be anomalous.
Which result is this?
.............................................................................................................................................
.............................................................................................................................................(1 mark)
2 (c) The students noticed that, after 200 minutes, their yoghurts began to thicken.
What caused this?
.............................................................................................................................................
.............................................................................................................................................
.............................................................................................................................................
............................................................................................................................................. (2 marks)
(Extra space) ......................................................................................................................____
7
Turn over for the next question
Turn over
6 Areas outside the box will
not be scanned for marking
(06)G/J42086/Jun09/BLY3H
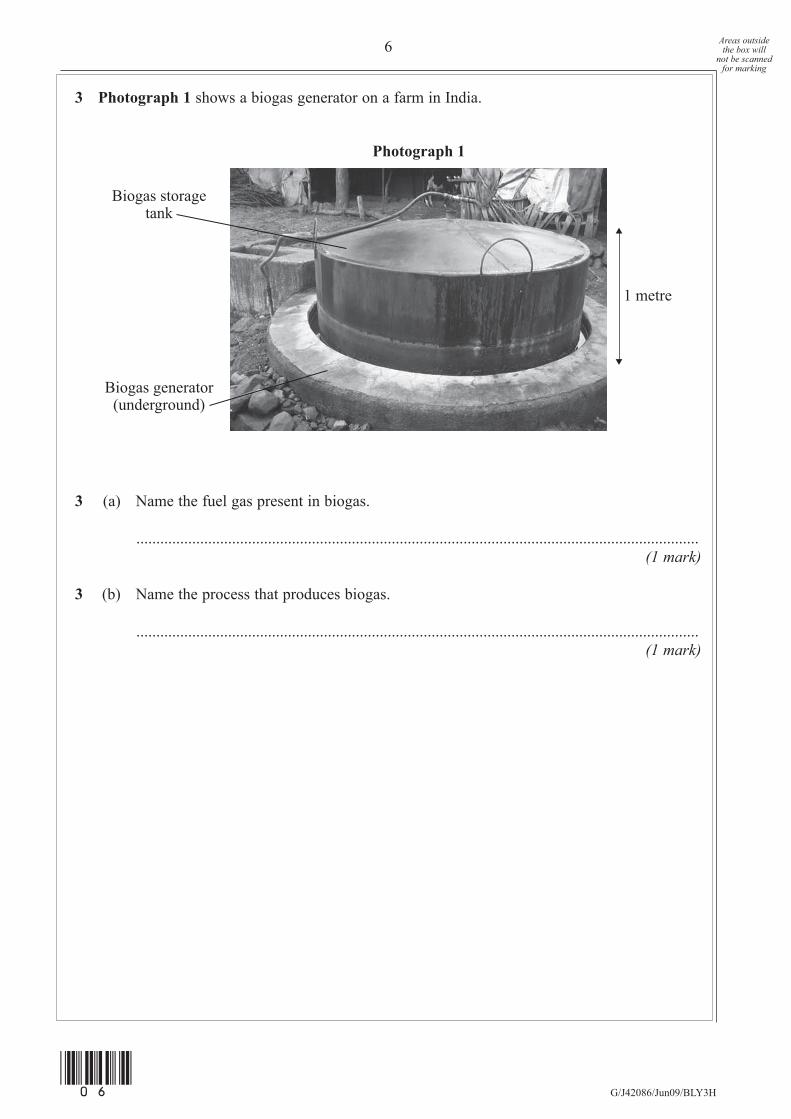
3 Photograph 1 shows a biogas generator on a farm in India.
1 metre
Photograph 1
Biogas generator(underground)
Biogas storagetank
3 (a) Name the fuel gas present in biogas.
.............................................................................................................................................(1 mark)
3 (b) Name the process that produces biogas.
.............................................................................................................................................(1 mark)
7
(07)G/J42086/Jun09/BLY3H
Areas outside the box will
not be scanned for marking
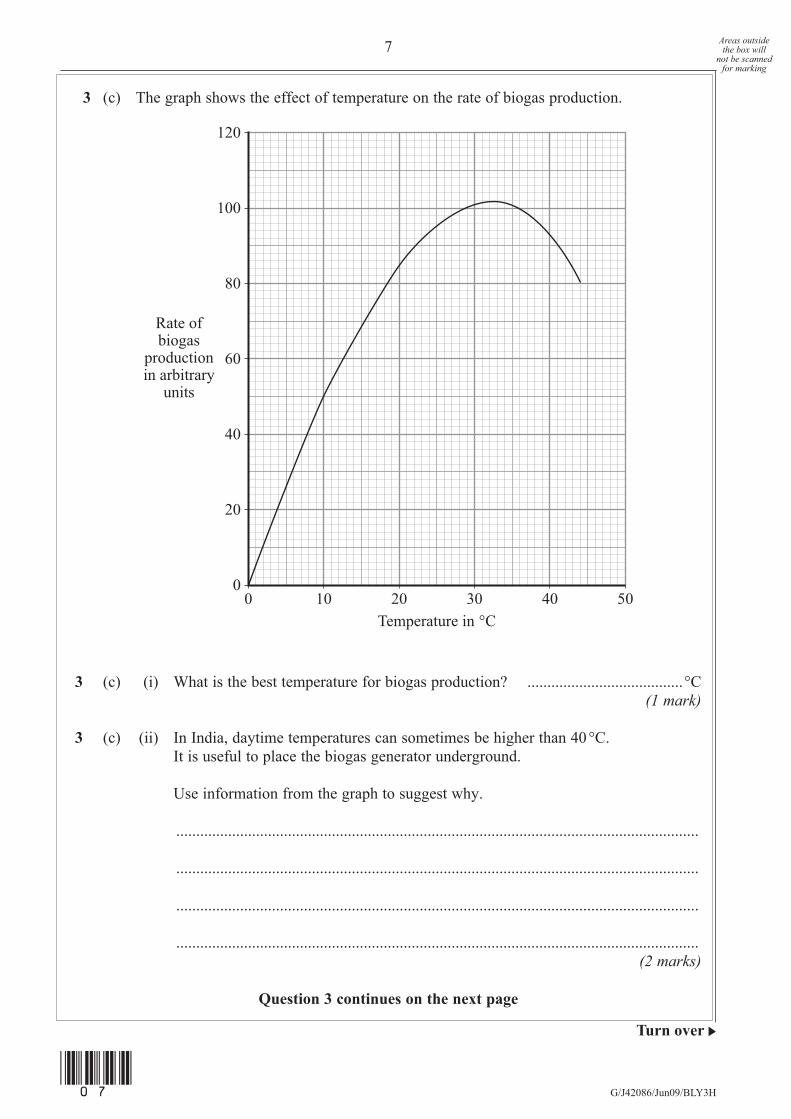
3 (c) The graph shows the effect of temperature on the rate of biogas production.
20 30 4000
20
40
60
80
100
120
10Temperature in °C
Rate ofbiogas
productionin arbitrary
units
50
3 (c) (i) What is the best temperature for biogas production? .......................................°C(1 mark)
3 (c) (ii) In India, daytime temperatures can sometimes be higher than 40 °C. It is useful to place the biogas generator underground.
Use information from the graph to suggest why.
...................................................................................................................................
...................................................................................................................................
...................................................................................................................................
...................................................................................................................................(2 marks)
Question 3 continues on the next page
Turn over
8 Areas outside the box will
not be scanned for marking
(08)G/J42086/Jun09/BLY3H
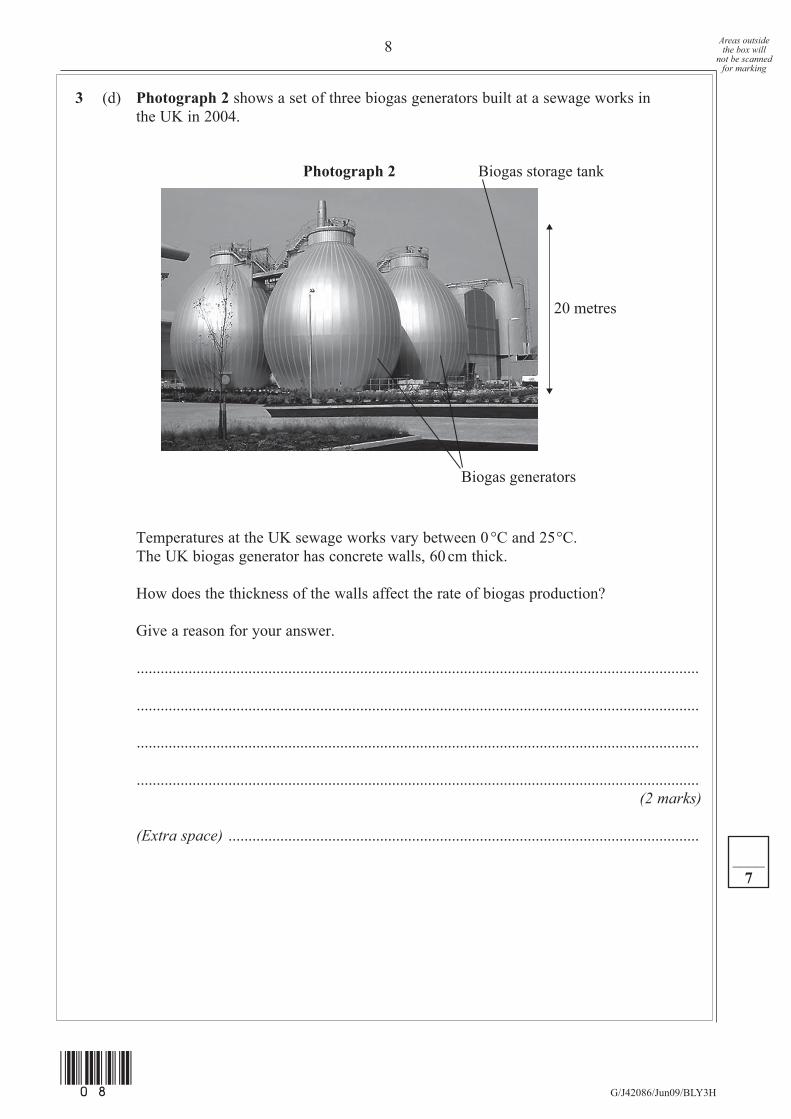
3 (d) Photograph 2 shows a set of three biogas generators built at a sewage works in the UK in 2004.
20 metres
Photograph 2
Biogas generators
Biogas storage tank
Temperatures at the UK sewage works vary between 0 °C and 25 °C. The UK biogas generator has concrete walls, 60 cm thick.
How does the thickness of the walls affect the rate of biogas production?
Give a reason for your answer.
.............................................................................................................................................
.............................................................................................................................................
.............................................................................................................................................
.............................................................................................................................................(2 marks)
(Extra space) ......................................................................................................................____
7

9
Turn over
(09)G/J42086/Jun09/BLY3H
Turn over for the next question
DO NOT WRITE ON THIS PAGEANSWER IN THE SPACES PROVIDED
10 Areas outside the box will
not be scanned for marking
G/J42086/Jun09/BLY3H
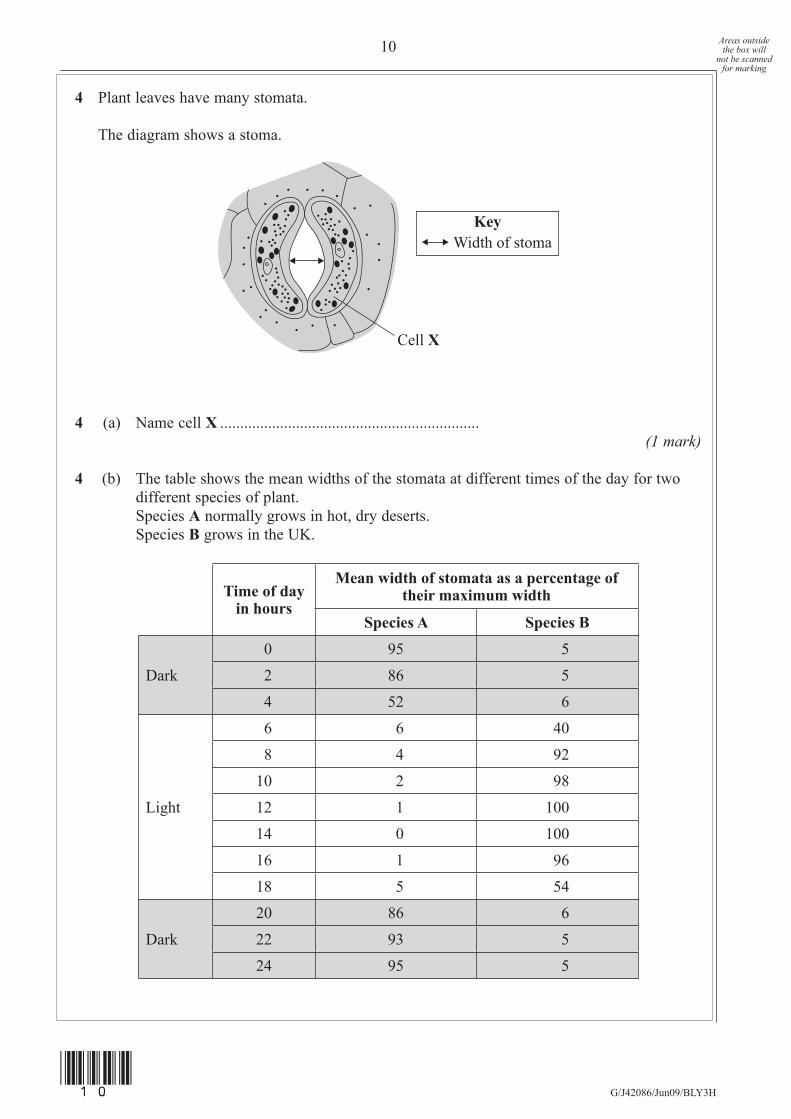
4 Plant leaves have many stomata.
The diagram shows a stoma.
Cell X
Width of stomaKey
4 (a) Name cell X .................................................................(1 mark)
4 (b) The table shows the mean widths of the stomata at different times of the day for two different species of plant.
Species A normally grows in hot, dry deserts. Species B grows in the UK.
Time of day in hours
Mean width of stomata as a percentage of their maximum width
Species A Species B
Dark
0 95 5
2 86 5
4 52 6
Light
6 6 40
8 4 92
10 2 98
12 1 100
14 0 100
16 1 96
18 5 54
Dark
20 86 6
22 93 5
24 95 5
(10)

11
Turn over
G/J42086/Jun09/BLY3H
Areas outside the box will
not be scanned for marking
The data in the table show that species A is better adapted than species B to living in hot, dry deserts.
Explain how.
.............................................................................................................................................
.............................................................................................................................................
.............................................................................................................................................
.............................................................................................................................................
.............................................................................................................................................
.............................................................................................................................................
.............................................................................................................................................
.............................................................................................................................................(4 marks)
(Extra space) ......................................................................................................................
.............................................................................................................................................
.............................................................................................................................................____
5
Turn over for the next question
(11)
12 Areas outside the box will
not be scanned for marking
G/J42086/Jun09/BLY3H
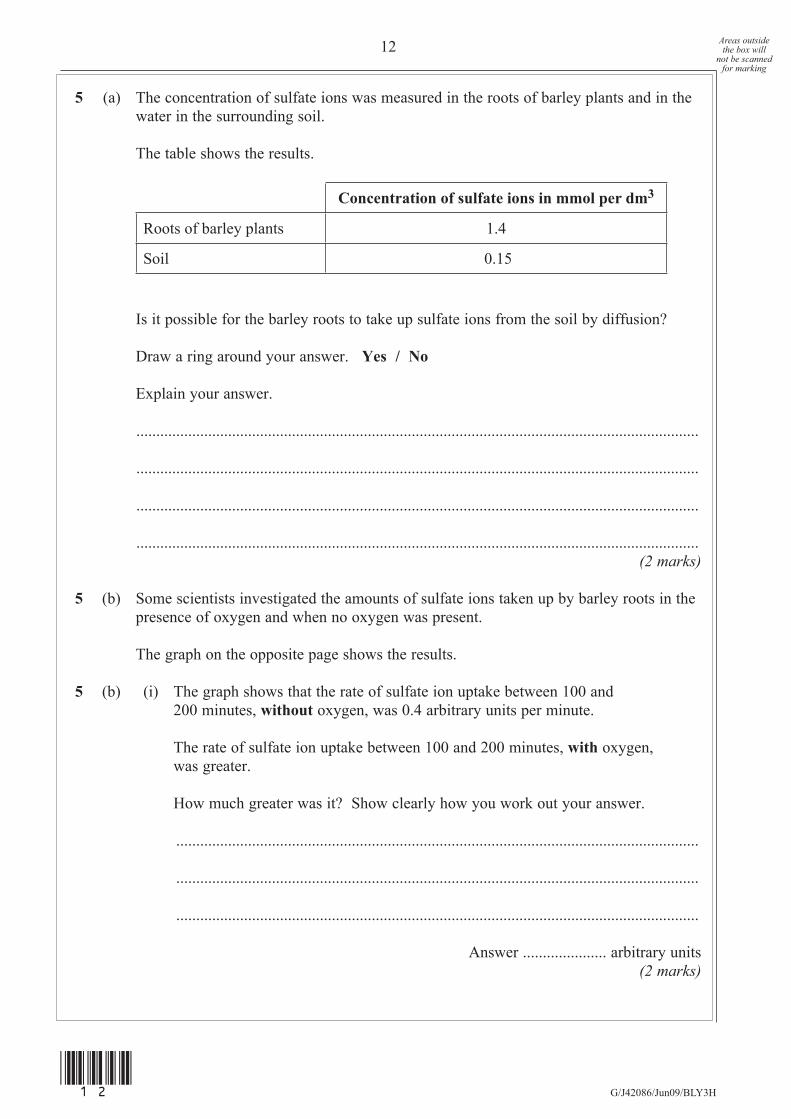
5 (a) The concentration of sulfate ions was measured in the roots of barley plants and in the water in the surrounding soil.
The table shows the results.
Concentration of sulfate ions in mmol per dm3
Roots of barley plants 1.4
Soil 0.15
Is it possible for the barley roots to take up sulfate ions from the soil by diffusion?
Draw a ring around your answer. Yes / No
Explain your answer.
.............................................................................................................................................
.............................................................................................................................................
.............................................................................................................................................
.............................................................................................................................................(2 marks)
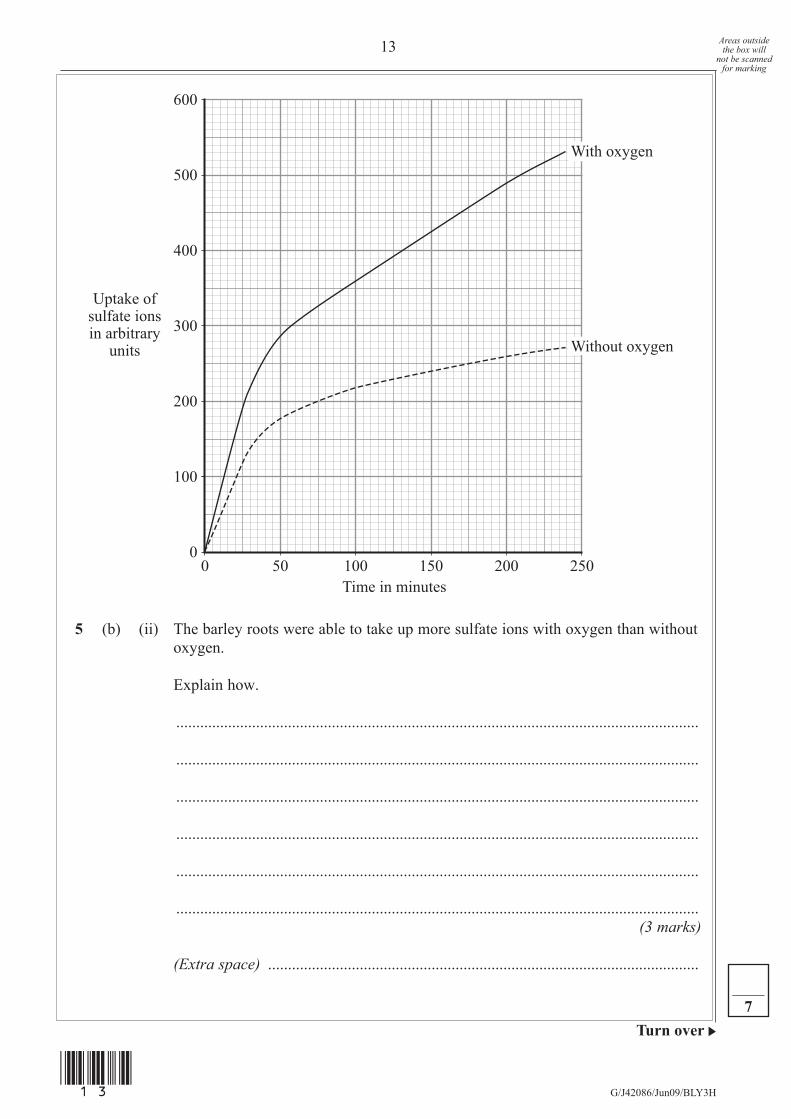
5 (b) Some scientists investigated the amounts of sulfate ions taken up by barley roots in the presence of oxygen and when no oxygen was present.
The graph on the opposite page shows the results.
5 (b) (i) The graph shows that the rate of sulfate ion uptake between 100 and 200 minutes, without oxygen, was 0.4 arbitrary units per minute.
The rate of sulfate ion uptake between 100 and 200 minutes, with oxygen, was greater.
How much greater was it? Show clearly how you work out your answer.
...................................................................................................................................
...................................................................................................................................
...................................................................................................................................
Answer ..................... arbitrary units(2 marks)
(12)
13
Turn over
G/J42086/Jun09/BLY3H
Areas outside the box will
not be scanned for marking
100 150 20000
100
200
300
400
500
600
50Time in minutes
Uptake ofsulfate ionsin arbitrary
units
250
With oxygen
Without oxygen
5 (b) (ii) The barley roots were able to take up more sulfate ions with oxygen than without oxygen.
Explain how.
...................................................................................................................................
...................................................................................................................................
...................................................................................................................................
...................................................................................................................................
...................................................................................................................................
...................................................................................................................................(3 marks)
(Extra space) ............................................................................................................____
7
(13)
14 Areas outside the box will
not be scanned for marking
G/J42086/Jun09/BLY3H
6 Microorganisms are often used in the industrial production of useful substances.
The fungus, Penicillium chrysogenum, can be used to make an enzyme that digests the sugar sucrose. When it is growing in a medium containing sucrose, the fungus releases
this enzyme into the surrounding solution.
6 (a) Explain why it is useful to the fungus to release the enzyme into the surrounding solution.
.............................................................................................................................................
.............................................................................................................................................
.............................................................................................................................................
.............................................................................................................................................
.............................................................................................................................................(2 marks)
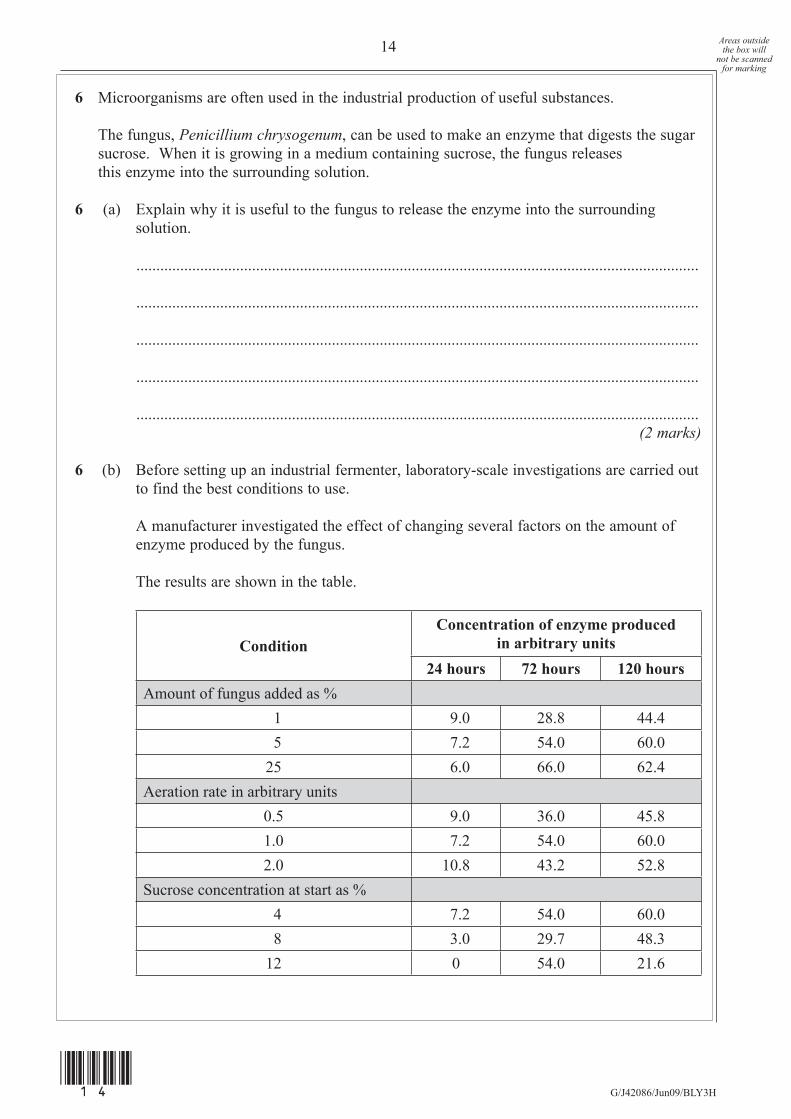
6 (b) Before setting up an industrial fermenter, laboratory-scale investigations are carried out to find the best conditions to use.
A manufacturer investigated the effect of changing several factors on the amount of enzyme produced by the fungus.
The results are shown in the table.
ConditionConcentration of enzyme produced
in arbitrary units24 hours 72 hours 120 hours
Amount of fungus added as % 1 9.0 28.8 44.4 5 7.2 54.0 60.025 6.0 66.0 62.4
Aeration rate in arbitrary units0.5 9.0 36.0 45.81.0 7.2 54.0 60.02.0 10.8 43.2 52.8
Sucrose concentration at start as % 4 7.2 54.0 60.0 8 3.0 29.7 48.312 0 54.0 21.6
(14)
15
Turn over
G/J42086/Jun09/BLY3H
Areas outside the box will
not be scanned for marking
The manufacturer decided to use the following conditions:
• amount of fungus = 5% • aeration rate = 1.0 arbitrary units • time = 72 hours.
Suggest an explanation for each of the following.
6 (b) (i) The manufacturer decided to add 5% fungus rather than 25%.
...................................................................................................................................
...................................................................................................................................
...................................................................................................................................
...................................................................................................................................(2 marks)
(Extra space) ............................................................................................................
6 (b) (ii) The concentration of enzyme produced at an aeration rate of 2.0 arbitrary units was less than the concentration at an aeration rate of 1.0 arbitrary units.
...................................................................................................................................
...................................................................................................................................
...................................................................................................................................
...................................................................................................................................(2 marks)
(Extra space) ............................................................................................................____
6
Turn over for the next question
(15)
16 Areas outside the box will
not be scanned for marking
G/J42086/Jun09/BLY3H
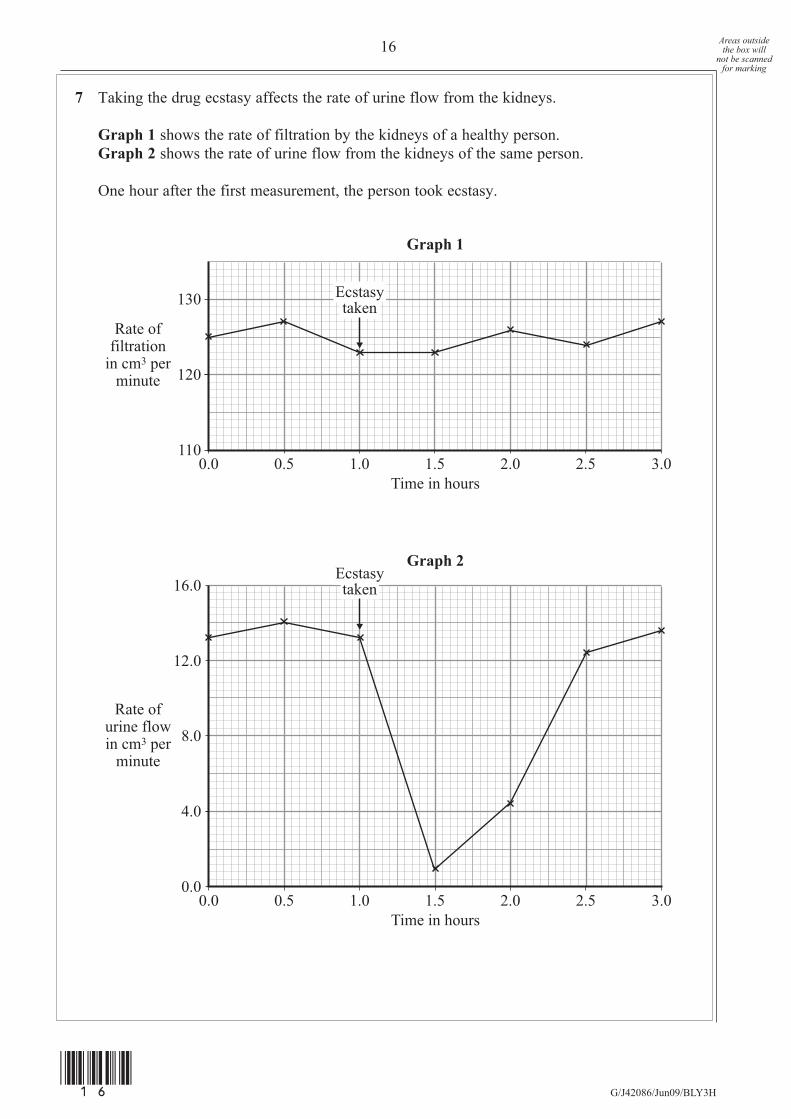
7 Taking the drug ecstasy affects the rate of urine flow from the kidneys.
Graph 1 shows the rate of filtration by the kidneys of a healthy person. Graph 2 shows the rate of urine flow from the kidneys of the same person.
One hour after the first measurement, the person took ecstasy.
1.0 1.5 2.00.0110
120
130
0.5Time in hours
Graph 1
Rate offiltration
in cm3 perminute
2.5 3.0
Ecstasytaken
1.0 1.5 2.00.00.0
4.0
8.0
12.0
16.0
0.5Time in hours
Graph 2
Rate ofurine flowin cm3 per
minute
2.5 3.0
Ecstasytaken
(16)
17
G/J42086/Jun09/BLY3H
Areas outside the box will
not be scanned for marking
7 (a) Describe the effect of taking ecstasy on
7 (a) (i) the rate of filtration
...................................................................................................................................
...................................................................................................................................(1 mark)
7 (a) (ii) the rate of urine flow.
...................................................................................................................................
...................................................................................................................................(1 mark)
7 (b) Use information from the graphs and your understanding of how the kidney works to answer the following questions.
7 (b) (i) Suggest an explanation for the change in the rate of urine flow after the person took ecstasy.
...................................................................................................................................
...................................................................................................................................
...................................................................................................................................
...................................................................................................................................(2 marks)
(Extra space) ............................................................................................................
7 (b) (ii) After a person has taken ecstasy, the concentration of ions in the blood changes.
Suggest an explanation for this.
...................................................................................................................................
...................................................................................................................................
...................................................................................................................................
...................................................................................................................................(2 marks)
(Extra space) ............................................................................................................____
6
END OF QUESTIONS
(17)

18
G/J42086/Jun09/BLY3H
There are no questions printed on this page
DO NOT WRITE ON THIS PAGEANSWER IN THE SPACES PROVIDED
(18)

19
G/J42086/Jun09/BLY3H
There are no questions printed on this page
DO NOT WRITE ON THIS PAGEANSWER IN THE SPACES PROVIDED
(19)

20
G/J42086/Jun09/BLY3H
Copyright © 2009 AQA and its licensors. All rights reserved.
(20)
There are no questions printed on this page
DO NOT WRITE ON THIS PAGEANSWER IN THE SPACES PROVIDED
ACKNOWLEDGEMENT OF COPYRIGHT-HOLDERS AND PUBLISHERS
Question 3 Indian biogas generator, © engINdia, http://home2.btconnect.com/engindia, 2005
Question 3(d) Reading biogas generators, image courtesy of Black and Veatch Ltd