Embed Size (px)
Citation preview
Teacher’s Guide
Biology 1/Applied Biology 2 Examination
Issued by the Office of Assessment
South Carolina Department of Education
December 2011
ii
Contents Overview of the EOCEP Examination ............................................................................................. 1 Part 1: The Biology EOCEP Examination ......................................................................................... 3 Part 2: Sample Test Questions........................................................................................................ 6 Part 3: Preparing Your Students for the Examination .................................................................. 23 Part 4: Raising Student Achievement Levels ................................................................................ 24 Appendix A. South Carolina Academic Standards for Biology ................................................... 25
Appendix B. A Taxonomy of Cognitive Domains for Biology ...................................................... 30
1
Overview of the EOCEP Examination
The South Carolina Education Accountability Act (EAA) of 1998 (Chapter 18, Title 59 of the 1976 Code), as amended in 2008, requires that end-of-course examinations be administered to students in gateway courses awarded units of credit in English language arts, mathematics, science and social studies. To fulfill this EAA mandate, the South Carolina Department of Education (SCDE) developed and administers the South Carolina End-of-Course Examination Program (EOCEP). Beginning with the graduating class of 2010, students were required to pass a high school credit course in science and a course in United States history in which end-of-course examinations were administered to receive a state high school diploma. The purposes and uses of the EOCEP tests are as follows:
A. The tests promote instruction in specific academic standards for the particular courses, encourage higher levels of student achievement, and document the level of students’ mastery of the academic standards.
B. The tests serve as indicators of program, school, and district effectiveness in the manner prescribed by the Education Oversight Committee in accordance with the provisions of the EAA.
C. The tests are weighted 20 percent in the determination of students’ final grades in the gateway courses.
The South Carolina end-of-course examinations are multiple-choice tests based on specific, measurable course standards that are drawn directly from the South Carolina academic standards for the particular subject area: algebra, biology, English, and U.S. History and the Constitution. All public school students (middle school, high school, adult education, alternative school), and district-approved, home-schooled student enrolled in the following courses—or any other courses that address these particular standards—must take the corresponding EOCEP exams: Algebra 1 and Mathematics for the Technologies 2, English 1, Biology 1 and Applied Biology 2, and U.S. History and the Constitution. The EOCEP examination is a requirement, regardless of whether the course is unit bearing. All test questions are carefully reviewed by content experts, language and testing experts, and the members of a South Carolina content review committee to ensure that each question properly measures the intended standard and that test-wise students cannot find unintended clues to the correct answer. In addition, a South Carolina sensitivity review committee scrutinizes the test to ensure that each question is free from bias with respect to race, gender, ethnicity, socioeconomic status, culture, and geographic region as well as content that would be offensive to any cultural, religious, or ethnic group. The items are then field-tested to further ensure item validity.
2
Care is taken in the creation of possible responses so that each question has one best answer and three other options that represent common errors in reasoning. The test questions are not meant to be tricky; rather, they are designed to distinguish between those students who understand the concept or skill being tested and can apply their understanding and those students who have an incomplete understanding of the concept. Students who understand the concept will likely choose the correct option, while those with an incomplete understanding are more likely to choose an incorrect, but plausible, option that may be based on a common misconception. This teacher’s guide has been developed to provide educators with important information about the EOCEP and to explain how the examination can be used effectively to strengthen teaching and learning in South Carolina. The guide provides a description of the test that encompasses its purpose and structure, its role in the EOCEP, and the course standards that guided its development. In addition, the guide provides sample questions and practical suggestions about how to prepare students for the examination.
The science standards for the end-of-course examinations as well as the State Board of Education regulation about the EOCEP (R 43-262.4, “End-of-Course Tests”) are accessible through links on the EOCEP Web page at: http://ed.sc.gov/agency/programs-services/41/documents/BiologyStandards.pdf and http://ed.sc.gov/agency/programs-services/41/documents/262-4.pdf.
3
PART 1
The Biology EOCEP Examination The test questions on the Biology 1/Applied Biology 2 examination are aligned with the South Carolina science academic standards for Biology and are designed to assess students’ mastery of these standards. South Carolina’s Biology standards are provided in Appendix A. The Biology 1/Applied Biology 2 end-of-course examination is comprised of sixty multiple-choice items. Students are given sufficient time in the testing session to attempt every question on the test.
Basic Questions Teachers Have
Who decided what the EOCEP examination covers?
The examination is based on the Biology 1 academic standards that are set forth in the South Carolina Science Academic Standards 2005. A committee of South Carolina educators and leaders developed these standards; questions to measure students’ mastery of these standards were developed specifically for this examination. When do students take the test?
Students take the test at the completion of the course. Each district determines its own testing schedule within parameters set by the state. How are home school students tested?
The end-of-course tests are part of the statewide testing program, and home school students in programs approved by the district are required to participate. Students take the test during the first scheduled administration following their completion of the course. Why do students have to take end-of-course examinations?
The EAA mandates that students are required to pass a high school credit course in science in which an end-of-course exam is administered to receive a state high school diploma. The EOCEP examinations serve as indicators of program, school, and district effectiveness; promote instruction focused on specific academic standards; and encourage higher levels of student achievement. They may be used as final examinations for these courses. The student’s score on the end-of-course examination must comprise 20 percent of his or her final grade in the course.
4
What accommodations are offered for students with disabilities?
Accommodations and customized materials are available for the EOCEP examinations for students with documented disabilities. For South Carolina assessment programs, the term “accommodation” is defined as a change in the testing environment, procedures, or presentation that does not alter in any significant way what the test measures and does not affect the comparability of scores. The purpose of accommodations is to enable students to participate in testing in a way that allows their knowledge and skills rather than their disabilities to be assessed. The following are examples of accommodations allowed on the test:
• small-group or individual administration,
• extended time, afternoon administration, frequent breaks during testing, administration of the test over several sessions or several days,
• highlighting, cueing, the student’s reading aloud to him- or herself, the administrator’s repeating or signing the directions,
• oral or signed administrations,
• special lighting or furniture, supplemental materials and devices,
• alternate response modes such as the student’s responding in the test booklets, using bold-line paper, typing his or her responses, or giving nonverbal responses, and
• alternate presentation modes using customized materials such as loose-leaf, large-print, and braille test booklets; sign-language videotapes; or oral-administration audiotapes. NOTE: None of the customized materials are available for field-test administrations of the end-of-course examinations; they are available for operational administrations only.
Is a calculator allowed during testing?
There are no items on the Biology 1/Applied Biology 2 examination that require the use of a calculator; therefore, calculators are not allowed. Is the test timed?
The test is not timed. It is administered in a test session of approximately ninety minutes, which should be sufficient time for most students to have the opportunity to attempt every question on the test. Test administrators should make every effort to give students sufficient time to complete the test.
5
How is the EOCEP examination score factored into a student’s final grade?
As required by law, the EOCEP examination score is used as 20 percent of a student’s final grade in the course. When reporting EOCEP results, students receive a scale score which is compatible with the South Carolina uniform grading scale. Percentages of correct responses or percentile ranks are not provided for this standards-based test. As a teacher, what are my responsibilities with regard to the EOCEP?
On the first day of class, all students taking a course assessed by the EOCEP must receive a copy of the state academic standards for that course. Teachers should incorporate these standards and the appropriate course content into their classroom activities and lessons. Part 2 of this guide contains sample examination questions intended to help teachers and their students become familiar with the format of the questions on the test. The primary responsibility of teachers with regard to the EOCEP is preparing their students for the examination by ensuring that they acquire the knowledge and skills addressed in the academic standards. Conducting hands-on investigations that involve identifying questions; hypothesizing; and collecting, displaying, and analyzing data will positively and significantly impact student learning. Additionally, including ongoing daily teaching strategies such as asking probing questions, requiring written explanations, and initiating student-teacher and student-student dialogue—will contribute to the students’ acquisition of the targeted concepts, principles and procedures. Drilling with practice quizzes and tests is not recommended. For students taking Applied Biology 2, it is critical that teachers reinforce the material covered in Applied Biology 1 since the examination assesses skills and content from both courses. What documents are available to help me prepare my students for the Biology 1/Applied Biology 2 examination? • The South Carolina biology course standards are provided in this guide in Appendix A. • In this guide in Appendix B is a taxonomy of the three science cognitive domains—factual
knowledge, conceptual understanding, and reasoning and analysis—that were used as a basis for the construction of the items on the Biology 1/Applied Biology 2 EOCEP test.
• The “Blueprint for South Carolina End-of-Course Examination Program (EOCEP): Biology
1/Applied Biology 2,” which discusses the construction of the test and gives the approximate number of items in each of the domains and subdomains, is accessible on the EOCEP link http://ed.sc.gov/agency/programs-services/41/documents/Biologywebblueprint11_13_09.pdf.
• The state science academic standards for kindergarten through grade eight—which indicate
what students should know and be able to do prior to entering high school—are online at http://ed.sc.gov/agency/pr/standards-and-curriculum/Science.cfm.
6
PART 2
Sample Test Questions This section contains sample test items that are representative of the questions used on the Biology 1/Applied Biology 2 end-of-course examination. These questions are only a sample of what students should expect to encounter on the actual examination. The items illustrate the format, type, and approximate level of difficulty of the examination questions. For each sample question, the relevant standard and indicator are identified. The text describes what content the item is testing and what the student must know to be able to answer the item correctly. It is important to remember that different forms of the examination will contain different items that assess the same standard. In addition, different forms will contain items within each domain and subdomain that assess different standards. The complete listing of the Biology 1/Applied Biology2 standards is provided in Appendix A.
7
Sample Question 1 Standard: B-1 The student will demonstrate an understanding of how scientific inquiry
and technological design, including mathematical analysis, can be used appropriately to pose questions, seek answers, and develop solutions.
Indicator: B-1.1 Generate hypotheses on the basis of credible, accurate, and relevant
sources of scientific information
Which source would a scientist consider the most reliable to use when developing a hypothesis for an investigation? A. peer-reviewed journal article
B. class laboratory reports
C. an Internet website
D. a scientific blog
Key: A
This item requires students to know that when developing a hypothesis for a scientific investigation, the resources used for obtaining background information must be credible, accurate and relevant. The most reliable resource would be a peer-reviewed journal article in which only carefully scrutinized research articles are published. Therefore, Option A is the correct answer.
• Option B is not correct because class laboratory reports are based on classroom experiments that may or may not be accurately performed. Therefore, lab reports may contain unreliable data or conclusions and should not be used for developing hypotheses which serve as the basis for future experiments.
• Option C is not correct because of the lack of “quality control” on internet websites. There often is no careful and thorough review process for published articles and, therefore, the information may not be credible or reliable.
• Option D is not correct because while a blog may be interesting to read, there also is no “quality control” over what is written and information may be inaccurate and unreliable. There is no way to assess the credibility of the authors or their writings.
8
Sample Question 2
Standard: B-1 The student will demonstrate an understanding of how scientific inquiry and technological design, including mathematical analysis, can be used appropriately to pose questions, seek answers, and develop solutions.
Indicator: B-1.6 Evaluate the results of a controlled scientific investigation in terms of
whether they refute or verify the hypothesis.
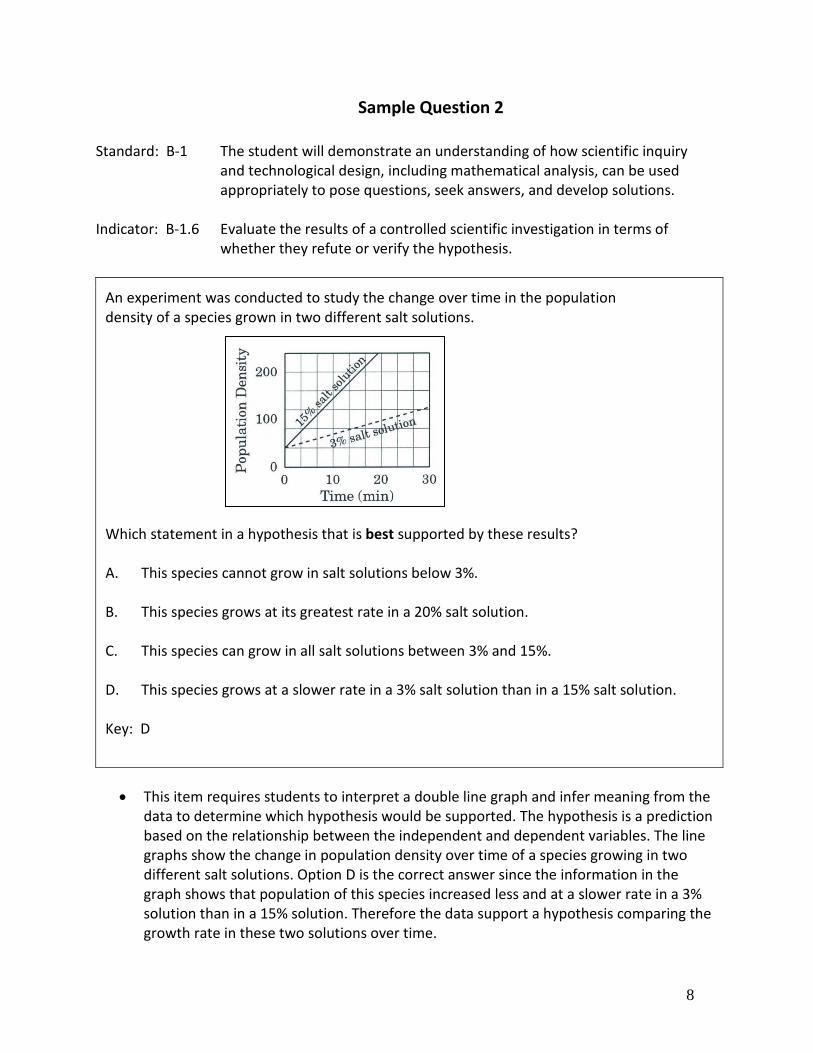
An experiment was conducted to study the change over time in the population density of a species grown in two different salt solutions. Which statement in a hypothesis that is best supported by these results?
A. This species cannot grow in salt solutions below 3%.
B. This species grows at its greatest rate in a 20% salt solution.
C. This species can grow in all salt solutions between 3% and 15%.
D. This species grows at a slower rate in a 3% salt solution than in a 15% salt solution.
Key: D
• This item requires students to interpret a double line graph and infer meaning from the
data to determine which hypothesis would be supported. The hypothesis is a prediction based on the relationship between the independent and dependent variables. The line graphs show the change in population density over time of a species growing in two different salt solutions. Option D is the correct answer since the information in the graph shows that population of this species increased less and at a slower rate in a 3% solution than in a 15% solution. Therefore the data support a hypothesis comparing the growth rate in these two solutions over time.
9
• Option A is not correct because there is no data on the graph to support this hypothesis. The only data are the population increases at the two salt solutions (3% and 15%). Students should not make any assumptions if there is no data to support them.
• Option B is not correct because there is no data to support the hypothesis. There is
no way to tell whether the species would grow best in a 20% solution.
• Option C is not correct because the data are specific for a 3% and 15% solution and not for salt solutions at differing concentrations. Students should not assume that this species could grow in any other solution concentration without data to support the hypothesis or conclusion.
10
Sample Question 3 Standard: B-2 The student will demonstrate an understanding of the structure and
function of cells and their organelles. Indicator: B-2.3 Compare the structures and organelles of prokaryotic and eukaryotic cells.
This item requires students to compare the characteristics of prokaryotic and eukaryotic cells to recognize the similarities and differences between them. Option A is correct because a major difference between the two types of cells is that prokaryotic cells do not have a true nucleus. The DNA in prokaryotic cells is not separated from the rest of the cell by a nuclear membrane and the DNA is not arranged in strands of chromosomes. The eukaryotic cells have a true nucleus with a nuclear membrane enclosing chromosomal DNA strands. One other major difference is that only eukaryotic cells have mitochondria, the site of cellular respiration, and prokaryotic cells use chemicals from their environment or the sun as an energy source.
• Option B is not correct because cytoplasm is found in both types of cells.
• Option C is not correct because prokaryotic cells do have ribosomes, the site
of protein synthesis, similar to eukaryotic cells.
• Option D is not correct because both types of cells have a cell membrane which surrounds the cell.
Which of the following characteristics is unique to eukaryotic cells? A. contain DNA arranged into chromosomes
B. filled with semi-transparent cytoplasm
C. contain ribosomes for protein synthesis
D. surrounded by a cell membrane
Key: A
11
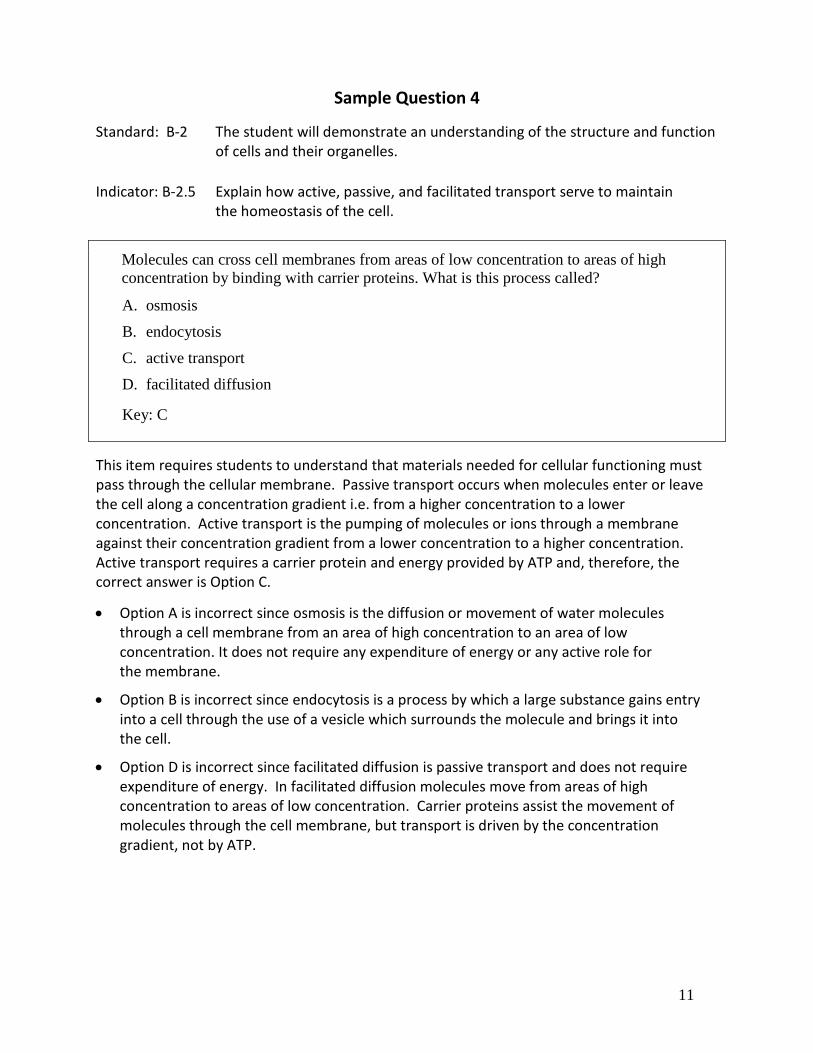
Sample Question 4
Standard: B-2 The student will demonstrate an understanding of the structure and function of cells and their organelles.
Indicator: B-2.5 Explain how active, passive, and facilitated transport serve to maintain the homeostasis of the cell.
Molecules can cross cell membranes from areas of low concentration to areas of high concentration by binding with carrier proteins. What is this process called?
A. osmosis
B. endocytosis
C. active transport
D. facilitated diffusion
Key: C
This item requires students to understand that materials needed for cellular functioning must pass through the cellular membrane. Passive transport occurs when molecules enter or leave the cell along a concentration gradient i.e. from a higher concentration to a lower concentration. Active transport is the pumping of molecules or ions through a membrane against their concentration gradient from a lower concentration to a higher concentration. Active transport requires a carrier protein and energy provided by ATP and, therefore, the correct answer is Option C.
• Option A is incorrect since osmosis is the diffusion or movement of water molecules through a cell membrane from an area of high concentration to an area of low concentration. It does not require any expenditure of energy or any active role for the membrane.
• Option B is incorrect since endocytosis is a process by which a large substance gains entry into a cell through the use of a vesicle which surrounds the molecule and brings it into the cell.
• Option D is incorrect since facilitated diffusion is passive transport and does not require expenditure of energy. In facilitated diffusion molecules move from areas of high concentration to areas of low concentration. Carrier proteins assist the movement of molecules through the cell membrane, but transport is driven by the concentration gradient, not by ATP.
12
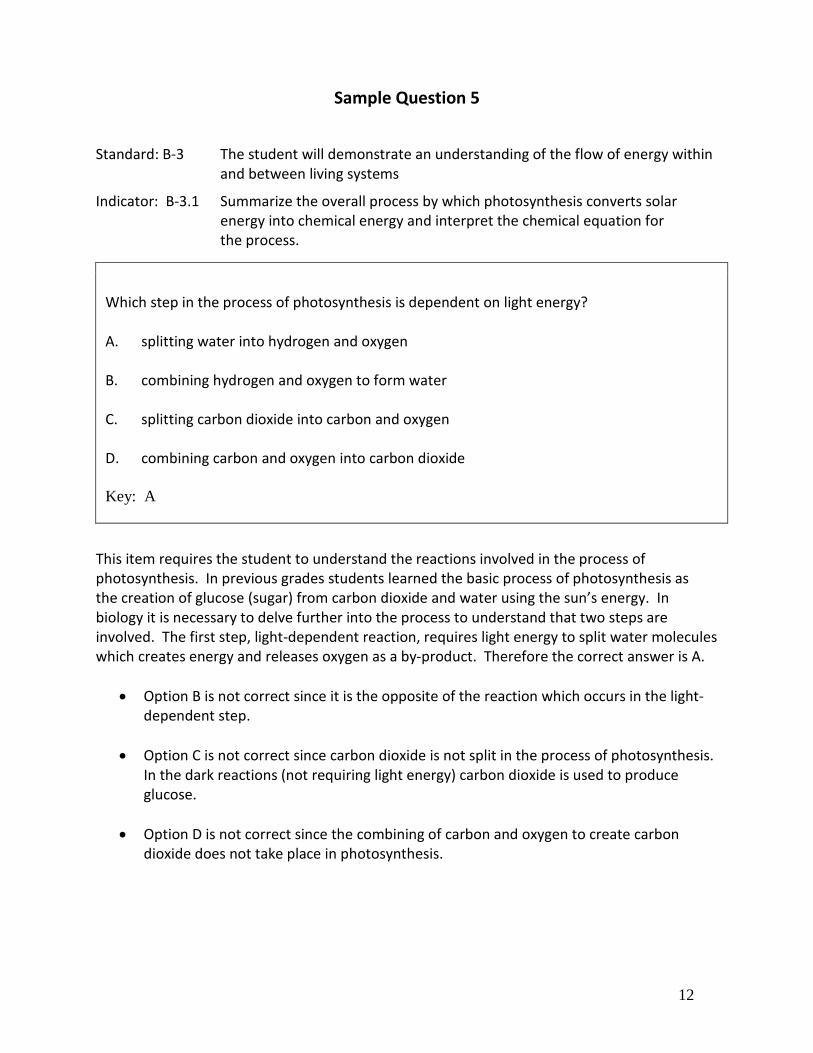
Sample Question 5
Standard: B-3 The student will demonstrate an understanding of the flow of energy within and between living systems
Indicator: B-3.1 Summarize the overall process by which photosynthesis converts solar energy into chemical energy and interpret the chemical equation for the process.
Which step in the process of photosynthesis is dependent on light energy? A. splitting water into hydrogen and oxygen
B. combining hydrogen and oxygen to form water
C. splitting carbon dioxide into carbon and oxygen
D. combining carbon and oxygen into carbon dioxide
Key: A
This item requires the student to understand the reactions involved in the process of photosynthesis. In previous grades students learned the basic process of photosynthesis as the creation of glucose (sugar) from carbon dioxide and water using the sun’s energy. In biology it is necessary to delve further into the process to understand that two steps are involved. The first step, light-dependent reaction, requires light energy to split water molecules which creates energy and releases oxygen as a by-product. Therefore the correct answer is A.
• Option B is not correct since it is the opposite of the reaction which occurs in the light-dependent step.
• Option C is not correct since carbon dioxide is not split in the process of photosynthesis.
In the dark reactions (not requiring light energy) carbon dioxide is used to produce glucose.
• Option D is not correct since the combining of carbon and oxygen to create carbon dioxide does not take place in photosynthesis.
13
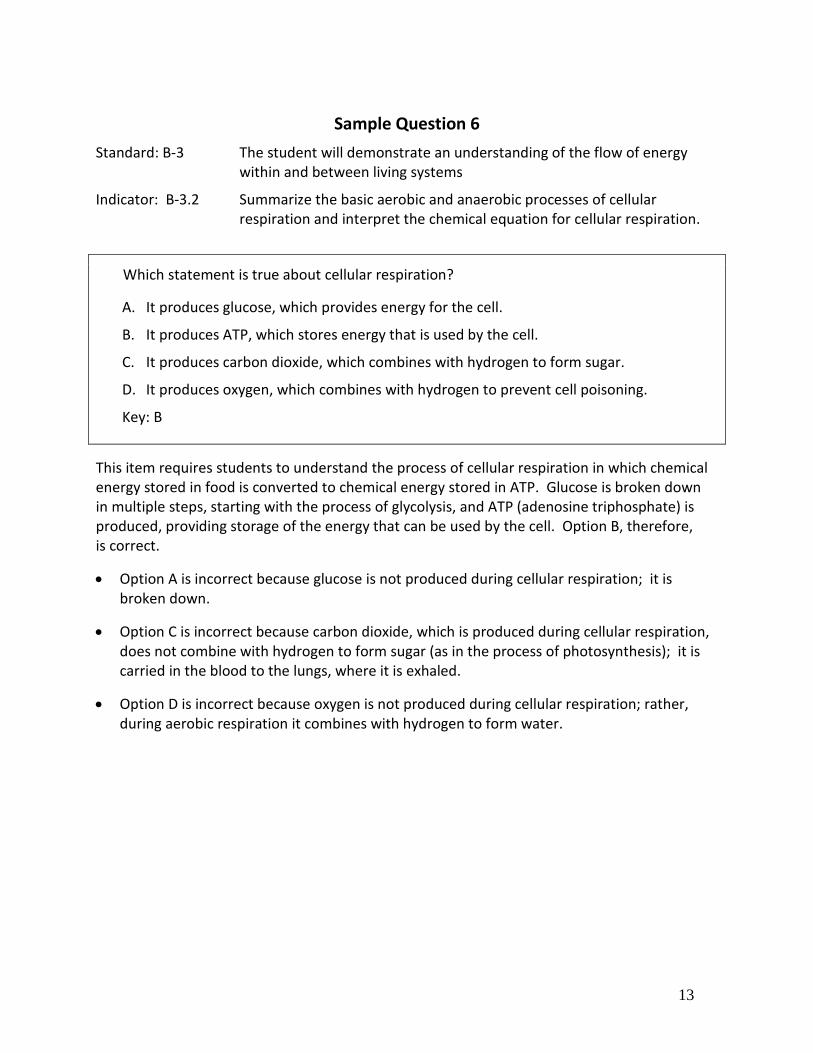
Sample Question 6
Standard: B-3 The student will demonstrate an understanding of the flow of energy within and between living systems
Indicator: B-3.2 Summarize the basic aerobic and anaerobic processes of cellular respiration and interpret the chemical equation for cellular respiration.
Which statement is true about cellular respiration?
A. It produces glucose, which provides energy for the cell.
B. It produces ATP, which stores energy that is used by the cell.
C. It produces carbon dioxide, which combines with hydrogen to form sugar.
D. It produces oxygen, which combines with hydrogen to prevent cell poisoning.
Key: B
This item requires students to understand the process of cellular respiration in which chemical energy stored in food is converted to chemical energy stored in ATP. Glucose is broken down in multiple steps, starting with the process of glycolysis, and ATP (adenosine triphosphate) is produced, providing storage of the energy that can be used by the cell. Option B, therefore, is correct.
• Option A is incorrect because glucose is not produced during cellular respiration; it is broken down.
• Option C is incorrect because carbon dioxide, which is produced during cellular respiration, does not combine with hydrogen to form sugar (as in the process of photosynthesis); it is carried in the blood to the lungs, where it is exhaled.
• Option D is incorrect because oxygen is not produced during cellular respiration; rather, during aerobic respiration it combines with hydrogen to form water.
14
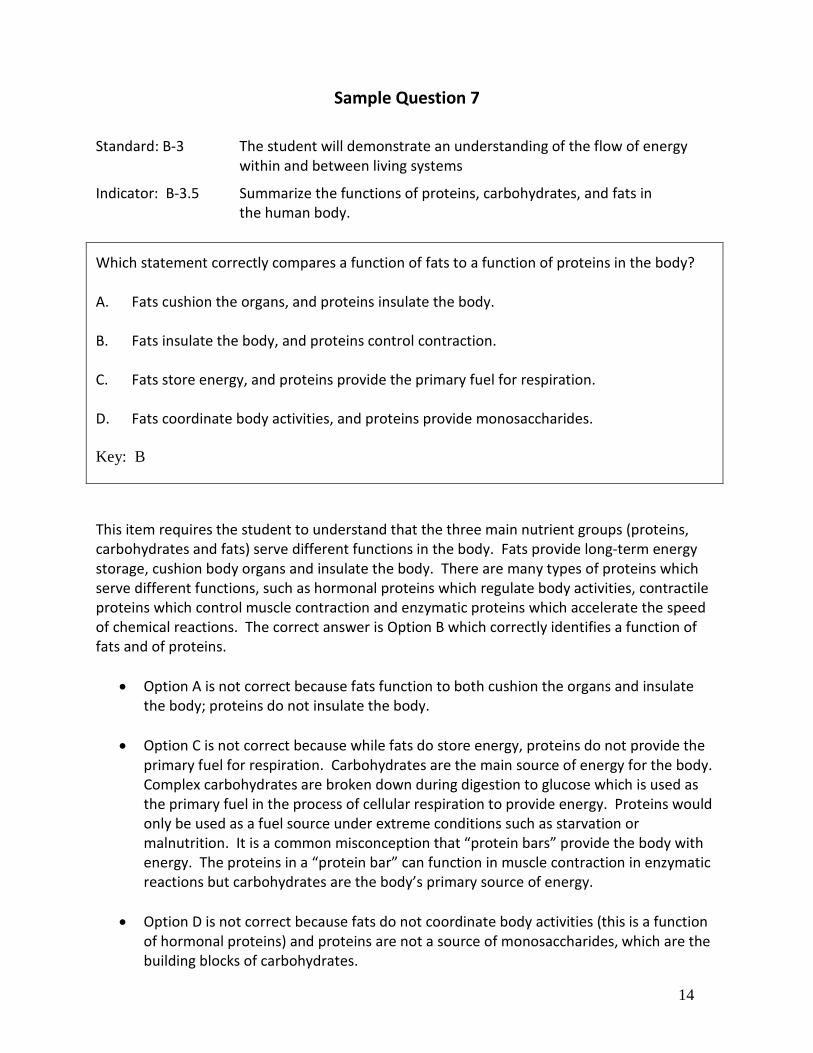
Sample Question 7
Standard: B-3 The student will demonstrate an understanding of the flow of energy within and between living systems
Indicator: B-3.5 Summarize the functions of proteins, carbohydrates, and fats in the human body.
This item requires the student to understand that the three main nutrient groups (proteins, carbohydrates and fats) serve different functions in the body. Fats provide long-term energy storage, cushion body organs and insulate the body. There are many types of proteins which serve different functions, such as hormonal proteins which regulate body activities, contractile proteins which control muscle contraction and enzymatic proteins which accelerate the speed of chemical reactions. The correct answer is Option B which correctly identifies a function of fats and of proteins.
• Option A is not correct because fats function to both cushion the organs and insulate the body; proteins do not insulate the body.
• Option C is not correct because while fats do store energy, proteins do not provide the
primary fuel for respiration. Carbohydrates are the main source of energy for the body. Complex carbohydrates are broken down during digestion to glucose which is used as the primary fuel in the process of cellular respiration to provide energy. Proteins would only be used as a fuel source under extreme conditions such as starvation or malnutrition. It is a common misconception that “protein bars” provide the body with energy. The proteins in a “protein bar” can function in muscle contraction in enzymatic reactions but carbohydrates are the body’s primary source of energy.
• Option D is not correct because fats do not coordinate body activities (this is a function of hormonal proteins) and proteins are not a source of monosaccharides, which are the building blocks of carbohydrates.
Which statement correctly compares a function of fats to a function of proteins in the body? A. Fats cushion the organs, and proteins insulate the body.
B. Fats insulate the body, and proteins control contraction.
C. Fats store energy, and proteins provide the primary fuel for respiration.
D. Fats coordinate body activities, and proteins provide monosaccharides.
Key: B
15
Sample Question 8
Standard: B-4 The student will demonstrate an understanding of the molecular basis of heredity.
Indicator: B-4.4 Summarize the basic processes involved in protein synthesis (including transcription and translation).
If translation is inhibited in a cell, which type of molecule will no longer be synthesized? A. simple sugar
B. fatty acid
C. protein
D. DNA
Key: C
This item requires the student to understand the processes of transcription and translation in protein synthesis. Transcription is the process by which mRNA is created from DNA in the nucleus. Translation is the formation of amino acid chains (the basic structure of protein) from the template provided by the mRNA in the ribosome. Option C, therefore is the correct answer.
• Options A (simple sugar), B (fatty acid) are not the products of translation, which is only involved in protein synthesis.
• Option D is incorrect because DNA is only involved in the process of transcription, which occurs in the nucleus and not translation, which occurs in the cytoplasm at the site of the ribosomes.
16
Sample Question 9 Standard: B-4 The student will demonstrate an understanding of the molecular basis
of heredity.
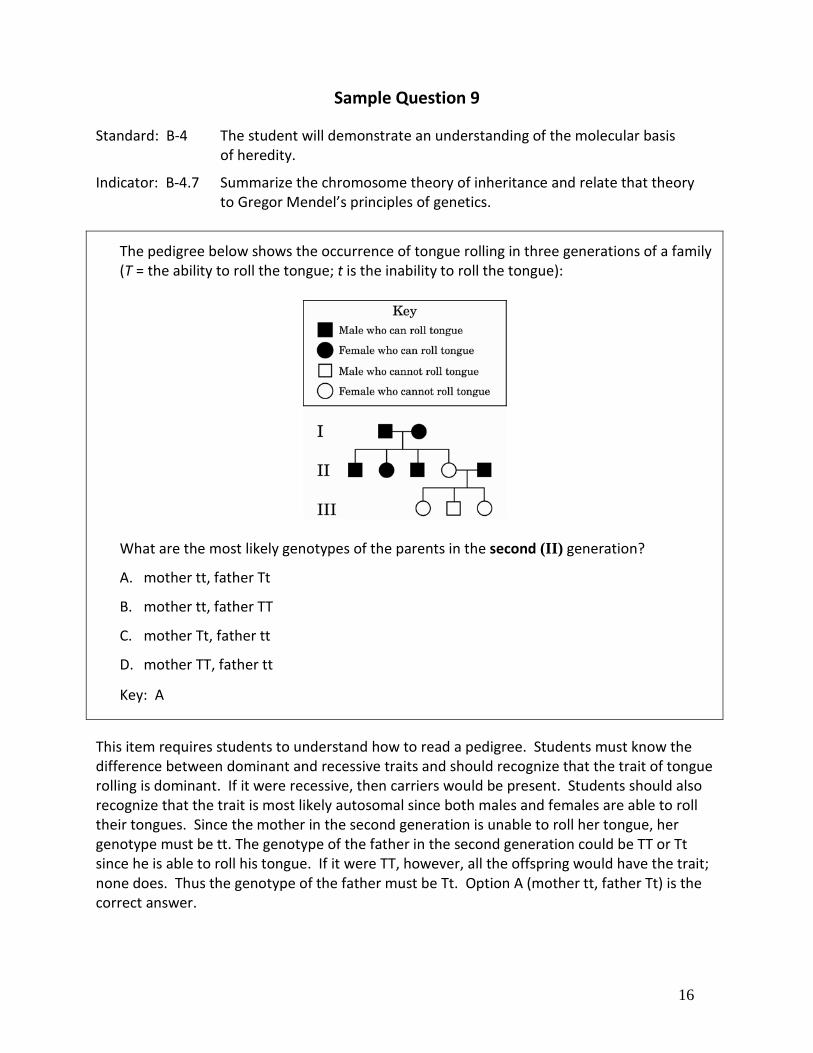
Indicator: B-4.7 Summarize the chromosome theory of inheritance and relate that theory to Gregor Mendel’s principles of genetics.
The pedigree below shows the occurrence of tongue rolling in three generations of a family (T = the ability to roll the tongue; t is the inability to roll the tongue):
What are the most likely genotypes of the parents in the second (II) generation?
A. mother tt, father Tt
B. mother tt, father TT
C. mother Tt, father tt
D. mother TT, father tt
Key: A
This item requires students to understand how to read a pedigree. Students must know the difference between dominant and recessive traits and should recognize that the trait of tongue rolling is dominant. If it were recessive, then carriers would be present. Students should also recognize that the trait is most likely autosomal since both males and females are able to roll their tongues. Since the mother in the second generation is unable to roll her tongue, her genotype must be tt. The genotype of the father in the second generation could be TT or Tt since he is able to roll his tongue. If it were TT, however, all the offspring would have the trait; none does. Thus the genotype of the father must be Tt. Option A (mother tt, father Tt) is the correct answer.

17
• Option B is incorrect: if the genotype of the male parent were TT, all offspring would have the tongue-rolling trait.
• Option C is incorrect since the mother does not have the tongue-rolling trait, which is dominant, and must have the genotype tt.
• Option D is incorrect since the mother is unable to roll her tongue and her genotype must be tt.

18
Sample Question 10 Standard: B-5 The student will demonstrate an understanding of biological evolution
and the diversity of life.
Indicator: B-5.4 Explain how genetic variability and environmental factors lead to biological evolution.
Genetic equilibrium exists in a population that is stable. Which conditions would support genetic equilibrium within a species? A. frequent mutations
B. random mating
C. small number of individuals
D. migration into the population
Key: B
This item requires students to understand the principle of genetic equilibrium (the Hardy-Weinberg principle) which describes the conditions that contribute to a genetically stabilized population in which there is no significant change in the genetic frequencies within a species. One of the conditions contributing to genetic equilibrium is random mating which would ensure that allelic frequencies remain constant in the population and, therefore, Option B is the correct answer.
• Option A is not correct because frequent mutations would results in changes in genotype within the population.
• Option C is not correct because within small populations a particular allele may increase
in frequency just by chance resulting in a decrease in genetic stability.
• Option D is not correct because migration into the population results in the introduction of new alleles which would promote new genotypes and not support genetic equilibrium.
19
Sample Question 11
Standard: B-5 The student will demonstrate an understanding of biological evolution and the diversity of life.
Indicator: B-5.5 Exemplify scientific evidence in the fields of anatomy, embryology, biochemistry, and paleontology that underlies the theory of biological evolution.
Species evolve over time. Their success depends on factors such as genetic variability and environmental constraints. Modern land plants and green algae have many characteristics in common, and both are very successful.
One current theory suggests that modern land plants evolved from green algae. Which piece of evidence supports this theory?
A. Land plants and green algae carry out cellular respiration. B. Land plants and green algae carry out asexual and sexual reproduction. C. Land plants and green algae are made up of cells containing similar cell structures. D. Land plants and green algae contain chlorophyll made up of similar sequences of
amino acids.
Key: D
This item requires students to recognize evolutionary relationships from comparative biochemistry. Students must be able to evaluate pieces of evidence to determine which piece supports the theory that modern land plants could have evolved from green algae. There are a number of different photosynthetic pigments, and the fact that a chlorophyll found in modern green plants and green algae is made up of similar sequences of amino acids suggests that one could have evolved from the other. Thus, option D is the correct answer.
The evidence contained in options A, B, and C is common to many organisms.
• Option A is incorrect since the cells of almost all living organisms carry out cellular respiration.
• Option B is incorrect since many organisms reproduce sexually and asexually and this has no relevancy to evolution.
• Option C is incorrect since most eukaryotes contain similar cell structures.
20
Sample Question 12 Standard: B-6 The student will demonstrate an understanding of the interrelationships
among organisms and the biotic and abiotic components of their environments.
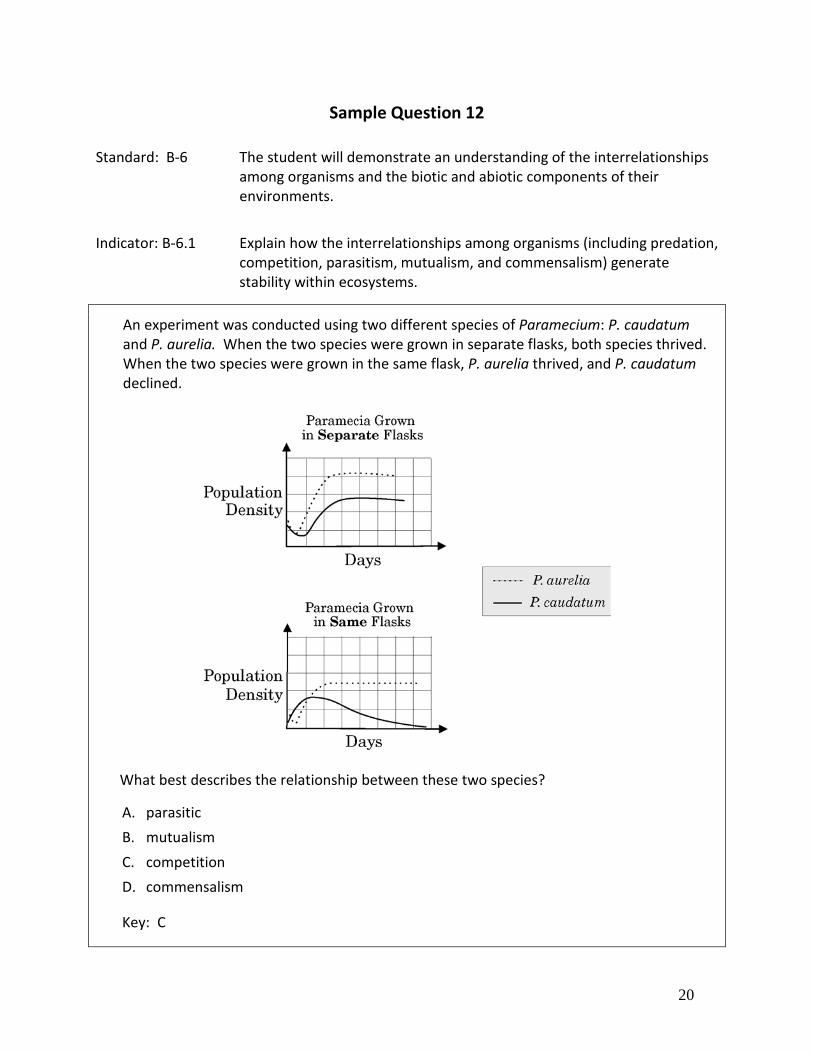
Indicator: B-6.1 Explain how the interrelationships among organisms (including predation,
competition, parasitism, mutualism, and commensalism) generate stability within ecosystems.
An experiment was conducted using two different species of Paramecium: P. caudatum and P. aurelia. When the two species were grown in separate flasks, both species thrived. When the two species were grown in the same flask, P. aurelia thrived, and P. caudatum declined.
What best describes the relationship between these two species?
A. parasitic B. mutualism C. competition D. commensalism
Key: C
21
This item requires students to be cognizant of the terms commensalism, parasitic, mutualism, and competition and to apply this knowledge to analyze graphs that show the relationship between two species of Paramecium. Students must recognize that when the two organisms are grown separately, each thrives. However, when they are grown together, P. aurelia is a better competitor for food sources and eventually eliminates P. caudatum. Thus, option C is the correct answer.
• Option A is incorrect because a parasitic relationship would require one Paramecium species to act as a host to the other. Since the population of P. aurelia remains constant as the population of P. caudatum decreases, one cannot be feeding on the other because both would probably show a reduction in population size as the food source decreased.
• Option B is incorrect because with a symbiotic relationship such as mutualism both Paramecium species would benefit. This is clearly not the case since the population of one of them (P. caudatum) is drastically reduced.
• Option D is incorrect because commensalism would require one Paramecium species to benefit while the other species would not be affected. This is not the case since the P.caudatum population has drastically decreased while the P. aurelia population is stable.
22
Sample Question 13 Standard: B-6 The student will demonstrate an understanding of the interrelationships
among organisms and the biotic and abiotic components of their environments.
Indicator: B-6.2 Explain how populations are affected by limiting factors (including density-dependent, density-independent, abiotic, and biotic factors).
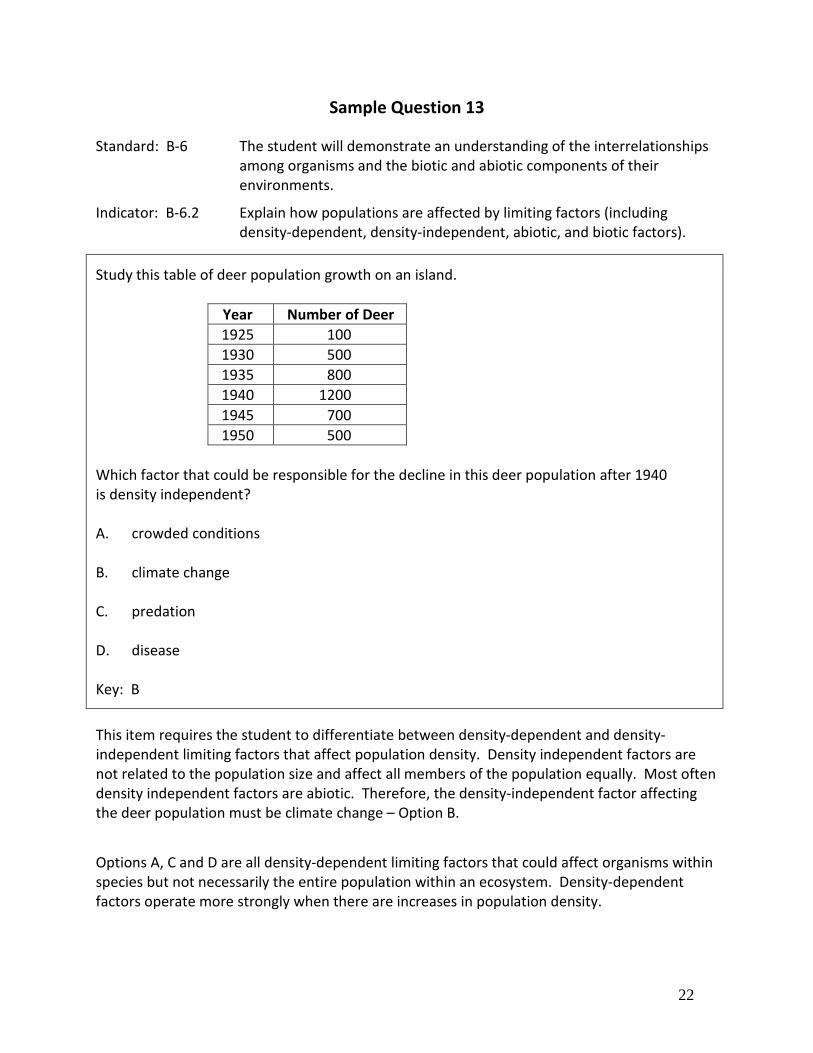
Study this table of deer population growth on an island.
Year Number of Deer 1925 100 1930 500 1935 800 1940 1200 1945 700 1950 500
Which factor that could be responsible for the decline in this deer population after 1940 is density independent? A. crowded conditions
B. climate change
C. predation
D. disease
Key: B
This item requires the student to differentiate between density-dependent and density-independent limiting factors that affect population density. Density independent factors are not related to the population size and affect all members of the population equally. Most often density independent factors are abiotic. Therefore, the density-independent factor affecting the deer population must be climate change – Option B.
Options A, C and D are all density-dependent limiting factors that could affect organisms within species but not necessarily the entire population within an ecosystem. Density-dependent factors operate more strongly when there are increases in population density.
23
PART 3
Preparing Your Students for the Examination Here are some classroom strategies you can employ to help prepare your students for the Biology 1/Applied Biology 2 end-of-course examination. A. Ensure that your instructional practices are aligned with the examination by
• using inquiry-based instruction; • incorporating investigations throughout instruction; • incorporating ongoing cumulative review on a regular basis; • using realistic problems, real-world contexts, and current issues to launch instruction
and apply the inquiry skills and concepts you are teaching; and • asking such questions as “Why?” “How do you know?” “Can you explain?”
B. Ensure that your course outline is aligned with the examination by
• placing appropriate emphasis on the concepts and skills outlined in the standards and the course guide; and
• supplementing the standard textbook with other instructional materials, particularly if specific standards are not adequately covered in the textbook.
C. Incorporate classroom formative and summative assessments that probe students’
understanding by
• focusing on standards-based instruction that incorporates hands-on inquiry and higher-level thinking strategies rather than on practicing for the EOCEP test, as the key to your students’ doing well on that test;
• using meaningful classroom assessments that reflect the standards you teach in your classes; and
• adjusting your instruction in response to classroom assessment results. D. Ensure that your students are sufficiently familiar with the format of the examination by
• incorporating into your instruction various questions, exercises, and problems that are similar in format and content to the sample questions in this guide.
E. Ensure that your students are sufficiently motivated to take the examination by
• sharing with them specific information about the purpose and importance of the examination; and
• sending notes home to enlist parental support for student preparation.
24
PART 4
Raising Student Achievement Levels You can use these teaching strategies to help raise your students’ achievement level on the Biology 1/Applied Biology 2 examination. A. Correlate your course outline with the Biology 1 state standards. Become thoroughly
familiar with these standards and their relationship to the course outlines for Biology 1 and Applied Biology 1 and 2. If certain standards are not included in your course outline but are assessed on the examination, you should incorporate those standards into your outline. Course emphasis should be placed on the Biology 1 state standards. Recommended course guides for Biology 1 and Applied Biology 1 and 2 are available on the SCDE link at: http://ed.sc.gov/agency/pr/standards-and-curriculum/documents/BioInquiryGuide-ko.pdf and http://ed.sc.gov/agency/pr/standards-and-curriculum/Science.cfm.
B. Collaborate with other teachers in your school. Discussions with science colleagues that systematically review any inconsistencies between what is being taught and which standards are being assessed are critical for aligning curriculum and assessment. After having such discussions, teachers generally are better able to make adjustments in what they emphasize and de-emphasize, what terms they use, and how and when they present specific aspects of the course content.
C. Incorporate multiple-choice questions and constructed-response questions into your unit
tests and quizzes. Since students are already tested and quizzed on an ongoing basis, one of the more straightforward strategies for raising achievement is to ensure that tests and quizzes include questions that are similar to those that students will face on the end-of-course examination. Generally, well-written multiple-choice items contain as the alternative options the mistakes that students most commonly make. Instead of simply giving your students the correct answers, take time after any test or quiz to explain why they may have selected the incorrect options. Although constructed-response questions are not on the end-of-course assessment, they are useful tools for good conceptual development.
D. Develop action plans for your department. Every school and every department is different.
Strategies that are needed in one place may not be needed in another. Some schools may have already implemented and institutionalized some strategies, and therefore need to focus on others. For these reasons, departments are encouraged to develop their own action plans that reflect existing conditions and needs. Written action plans with objectives, activities, timelines, and assigned responsibilities are effective ways to move forward. Study the results of reports to improve instruction and achievement.
25
APPENDIX A
South Carolina Academic Standards for Biology
Course Description The biology standards provide students with a basic knowledge of living organisms and the interaction of these organisms with the natural world. The standards establish the scientific inquiry skills and core content for all biology courses in South Carolina schools. Biology courses should serve as the foundation for higher-level science courses and should give students the science skills necessary for life science–related technical careers. Teachers, schools, and districts should use these standards to make decisions concerning the structure and content of Biology 1 and Applied Biology 1 and 2. Educators must also determine how all biology courses in their schools, as well as individual classes, may go beyond the standards. These decisions will involve choices regarding additional content, activities, and learning strategies and will depend on the objectives of the particular courses. All biology courses must include inquiry-based instruction, allowing students to engage in problem solving, decision making, critical thinking, and applied learning. All biology courses are laboratory courses (minimum of 30 percent hands-on investigation). Biology laboratories will need to be stocked with all of the materials and apparatuses necessary to complete investigations. The standards in the biology core area will be the basis for the development of the items on the state-required end-of-course examination for Biology 1 and Applied Biology 2. The skills and tools listed in the scientific inquiry sections will be assessed independently from the content knowledge in the respective grade or high school core area under which they are listed. Moreover, scientific inquiry standards and indicators will be assessed cumulatively. Therefore, as students progress through the grade levels, they are responsible for the scientific inquiry indicators—including a knowledge of the use of tools—in all their earlier grades. A table of the scientific inquiry standards and indicators for kindergarten through grade twelve is provided in appendix A, which teachers are urged to print out and keep as a ready reference.
26
BIOLOGY
Scientific Inquiry
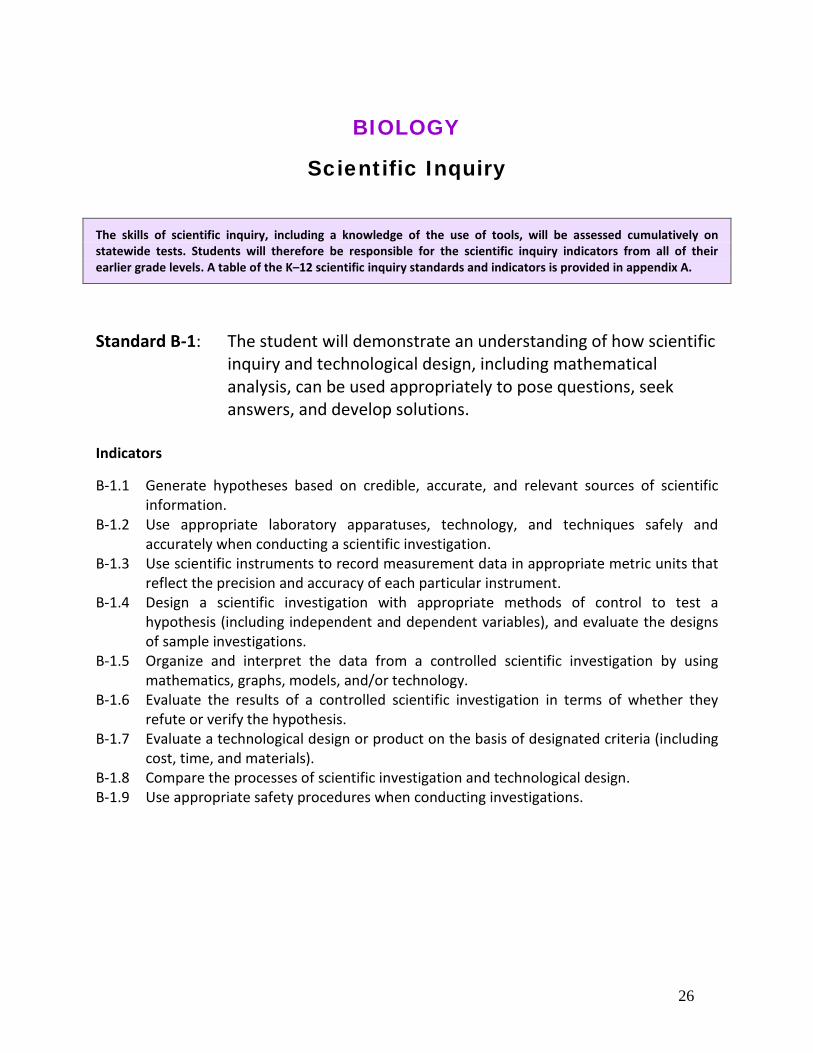
The skills of scientific inquiry, including a knowledge of the use of tools, will be assessed cumulatively on statewide tests. Students will therefore be responsible for the scientific inquiry indicators from all of their earlier grade levels. A table of the K–12 scientific inquiry standards and indicators is provided in appendix A.
Standard B-1: The student will demonstrate an understanding of how scientific
inquiry and technological design, including mathematical analysis, can be used appropriately to pose questions, seek answers, and develop solutions.
Indicators
B-1.1 Generate hypotheses based on credible, accurate, and relevant sources of scientific information.
B-1.2 Use appropriate laboratory apparatuses, technology, and techniques safely and accurately when conducting a scientific investigation.
B-1.3 Use scientific instruments to record measurement data in appropriate metric units that reflect the precision and accuracy of each particular instrument.
B-1.4 Design a scientific investigation with appropriate methods of control to test a hypothesis (including independent and dependent variables), and evaluate the designs of sample investigations.
B-1.5 Organize and interpret the data from a controlled scientific investigation by using mathematics, graphs, models, and/or technology.
B-1.6 Evaluate the results of a controlled scientific investigation in terms of whether they refute or verify the hypothesis.
B-1.7 Evaluate a technological design or product on the basis of designated criteria (including cost, time, and materials).
B-1.8 Compare the processes of scientific investigation and technological design. B-1.9 Use appropriate safety procedures when conducting investigations.
27
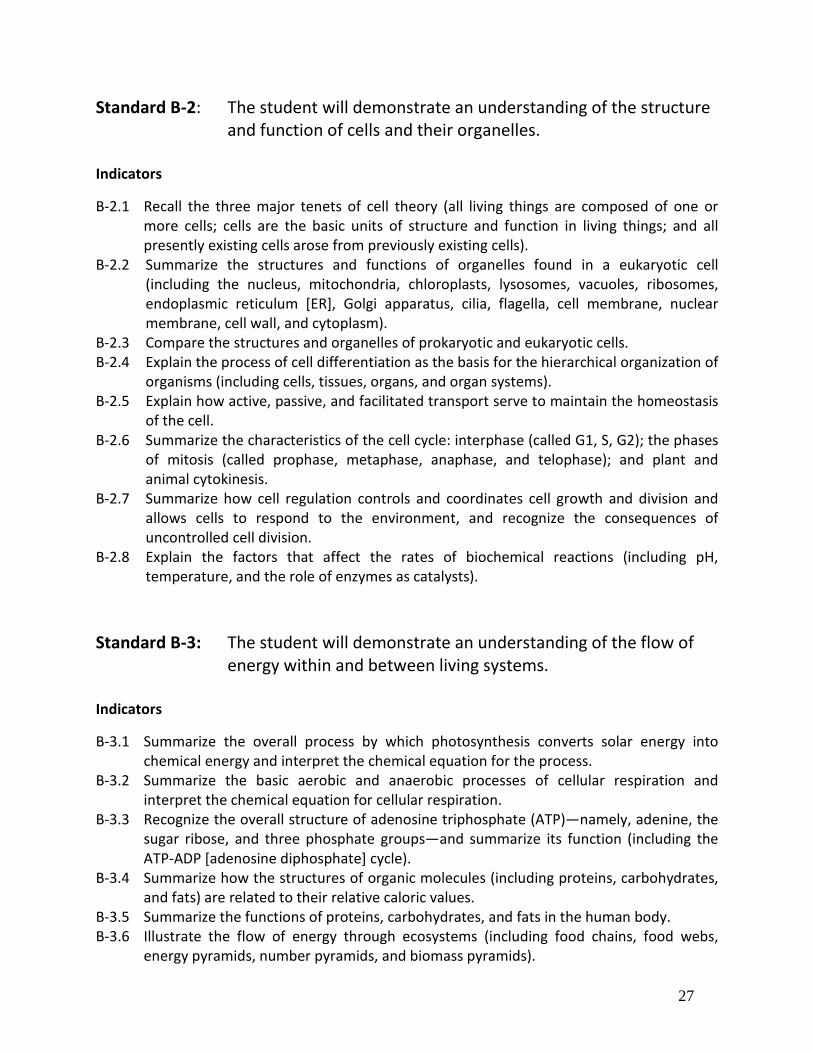
Standard B-2: The student will demonstrate an understanding of the structure and function of cells and their organelles.
Indicators
B-2.1 Recall the three major tenets of cell theory (all living things are composed of one or more cells; cells are the basic units of structure and function in living things; and all presently existing cells arose from previously existing cells).
B-2.2 Summarize the structures and functions of organelles found in a eukaryotic cell (including the nucleus, mitochondria, chloroplasts, lysosomes, vacuoles, ribosomes, endoplasmic reticulum [ER], Golgi apparatus, cilia, flagella, cell membrane, nuclear membrane, cell wall, and cytoplasm).
B-2.3 Compare the structures and organelles of prokaryotic and eukaryotic cells. B-2.4 Explain the process of cell differentiation as the basis for the hierarchical organization of
organisms (including cells, tissues, organs, and organ systems). B-2.5 Explain how active, passive, and facilitated transport serve to maintain the homeostasis
of the cell. B-2.6 Summarize the characteristics of the cell cycle: interphase (called G1, S, G2); the phases
of mitosis (called prophase, metaphase, anaphase, and telophase); and plant and animal cytokinesis.
B-2.7 Summarize how cell regulation controls and coordinates cell growth and division and allows cells to respond to the environment, and recognize the consequences of uncontrolled cell division.
B-2.8 Explain the factors that affect the rates of biochemical reactions (including pH, temperature, and the role of enzymes as catalysts).
Standard B-3: The student will demonstrate an understanding of the flow of
energy within and between living systems. Indicators
B-3.1 Summarize the overall process by which photosynthesis converts solar energy into chemical energy and interpret the chemical equation for the process.
B-3.2 Summarize the basic aerobic and anaerobic processes of cellular respiration and interpret the chemical equation for cellular respiration.
B-3.3 Recognize the overall structure of adenosine triphosphate (ATP)—namely, adenine, the sugar ribose, and three phosphate groups—and summarize its function (including the ATP-ADP [adenosine diphosphate] cycle).
B-3.4 Summarize how the structures of organic molecules (including proteins, carbohydrates, and fats) are related to their relative caloric values.
B-3.5 Summarize the functions of proteins, carbohydrates, and fats in the human body. B-3.6 Illustrate the flow of energy through ecosystems (including food chains, food webs,
energy pyramids, number pyramids, and biomass pyramids).
28
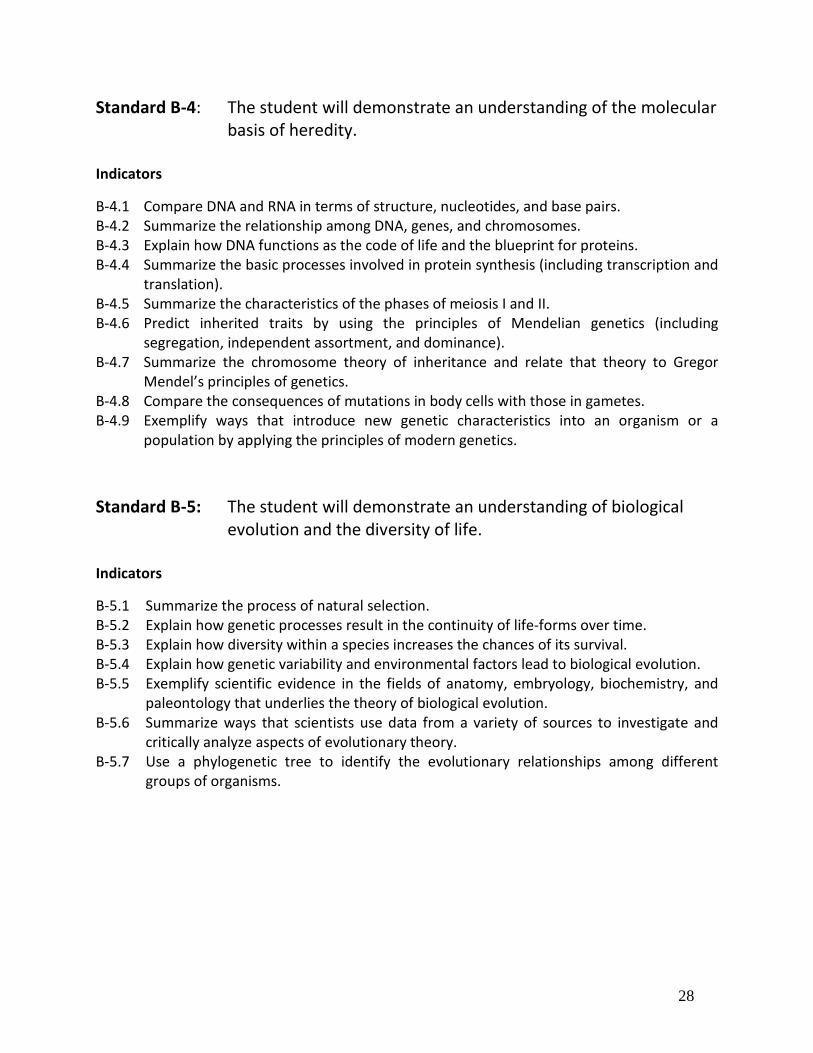
Standard B-4: The student will demonstrate an understanding of the molecular basis of heredity.
Indicators
B-4.1 Compare DNA and RNA in terms of structure, nucleotides, and base pairs. B-4.2 Summarize the relationship among DNA, genes, and chromosomes. B-4.3 Explain how DNA functions as the code of life and the blueprint for proteins. B-4.4 Summarize the basic processes involved in protein synthesis (including transcription and
translation). B-4.5 Summarize the characteristics of the phases of meiosis I and II. B-4.6 Predict inherited traits by using the principles of Mendelian genetics (including
segregation, independent assortment, and dominance). B-4.7 Summarize the chromosome theory of inheritance and relate that theory to Gregor
Mendel’s principles of genetics. B-4.8 Compare the consequences of mutations in body cells with those in gametes. B-4.9 Exemplify ways that introduce new genetic characteristics into an organism or a
population by applying the principles of modern genetics. Standard B-5: The student will demonstrate an understanding of biological
evolution and the diversity of life. Indicators
B-5.1 Summarize the process of natural selection. B-5.2 Explain how genetic processes result in the continuity of life-forms over time. B-5.3 Explain how diversity within a species increases the chances of its survival. B-5.4 Explain how genetic variability and environmental factors lead to biological evolution. B-5.5 Exemplify scientific evidence in the fields of anatomy, embryology, biochemistry, and
paleontology that underlies the theory of biological evolution. B-5.6 Summarize ways that scientists use data from a variety of sources to investigate and
critically analyze aspects of evolutionary theory. B-5.7 Use a phylogenetic tree to identify the evolutionary relationships among different
groups of organisms.
29
Standard B-6: The student will demonstrate an understanding of the
interrelationships among organisms and the biotic and abiotic components of their environments.
Indicators
B-6.1 Explain how the interrelationships among organisms (including predation, competition, parasitism, mutualism, and commensalism) generate stability within ecosystems.
B-6.2 Explain how populations are affected by limiting factors (including density-dependent, density-independent, abiotic, and biotic factors).
B-6.3 Illustrate the processes of succession in ecosystems. B-6.4 Exemplify the role of organisms in the geochemical cycles (including the cycles of
carbon, nitrogen, and water). B-6.5 Explain how ecosystems maintain themselves through naturally occurring processes
(including maintaining the quality of the atmosphere, generating soils, controlling the hydrologic cycle, disposing of wastes, and recycling nutrients).
B-6.6 Explain how human activities (including population growth, technology, and consumption of resources) affect the physical and chemical cycles and processes of Earth.
30
APPENDIX B
A Taxonomy of Cognitive Domains for Biology
Revised Bloom’s Taxonomy
In 1956, Benjamin Bloom and his colleagues published the Taxonomy of Educational Objectives: The Classification of Educational Goals, a groundbreaking book that classified educational goals according to the cognitive processes that learners must use in order to attain those goals. The work, which was enthusiastically received, was utilized by teachers to analyze learning in the classroom for nearly fifty years. However, research during that time span generated new ideas and information about how learners learn and how teachers teach. Education practice is very different today. Even the measurement of achievement has changed; teachers now live in a standards-based world defined by state accountability systems. In order to reflect the new data and insights about teaching and learning that the past forty-five years of research have yielded—and to refocus educators’ attention on the value of the original Bloom’s taxonomy—Lorin Anderson and David Krathwohl led a team of colleagues in revising and enhancing that system to make it more usable for aligning standards, instruction, and assessment in today’s schools. The results of their work were published in 2001 as A Taxonomy for Learning, Teaching, and Assessing: A Revision of Bloom’s Taxonomy of Educational Objectives (New York: Allyn and Bacon)—a book that is important to educators because it provides the common understanding of expectations that is critical for improving student achievement in all subjects. The revised taxonomy is two-dimensional, identifying both the kind of knowledge to be learned (knowledge dimension) and the kind of learning expected from students (cognitive processes) to help teachers and administrators improve alignment and rigor in the classroom. This taxonomy will assist educators to improve instruction, to ensure that their lessons and assessments are aligned with one another and with the state standards, that their lessons are cognitively rich, and that instructional opportunities are not missed.
Science goes well beyond simple recognition and the memorization of facts that many people mistake for scientific literacy. Therefore, many of the main verbs in the indicators of the South Carolina science standards reflect the cognitive processes described in the revised Bloom’s taxonomy under the category understand. This category requires interpreting, exemplifying, classifying, summarizing, inferring, comparing, and explaining from students—understanding rather than rote memorization of materials. Students might have to compare two organisms or explain how variations in habitats affect the survival of an organism. Several indicators require students to demonstrate two even higher categories of cognitive processes—analyze and evaluate—by organizing and critiquing data and/or the results of scientific investigation, for example.
31
Tables 1 and 2 on pp 109-111 are the Taxonomy for Learning, Teaching, and Assessing, Table 3, “A Taxonomy for Teaching, Learning, and Assessing,” describes both dimensions of the taxonomy: types and subtypes of knowledge described in table 1 and the cognitive categories and processes described in table 2. This matrix is provided as a template for teachers to use in analyzing their instruction as they seek to align standards, units/lessons/activities, and assessments. Examples and more information about specific uses of the matrix can be found in the Taxonomy for Learning: http://ed.sc.gov/agency/pr/standards-and-curriculum/documents/sciencestandardsnov182005_001.pdf
The South Carolina Department of Education does not discriminate on the basis of race, color, national origin, sex, or disability in admission to, treatment in, or employment in its programs and activities. Inquiries regarding the nondiscrimination policies should be made to the director of the Office of Human Resources, 1429 Senate Street, Columbia, South Carolina 29201, 803-734-8505.