Embed Size (px)
Citation preview
Bioluminescent Cell-Based NAD(P)/NAD(P)HAssays for Rapid DinucleotideMeasurement and Inhibitor Screening
Jolanta Vidugiriene,1 Donna Leippe,1 Mary Sobol,1
Gediminas Vidugiris,1 Wenhui Zhou,2 Poncho Meisenheimer,2
Prson Gautam,3 Krister Wennerberg,3 and James J. Cali1
1Research and Development, Promega Corporation, Madison,Wisconsin.2Promega Biosciences, LLC, San Luis Obispo, California.3Institute for Molecular Medicine Finland, University of Helsinki,Helsinki, Finland.
ABSTRACTThe central role of nicotinamide adenine dinucleotides in cellular
energy metabolism and signaling makes them important nodes that
link the metabolic state of cells with energy homeostasis and gene
regulation. In this study, we describe the implementation of cell-
based bioluminescence assays for rapid and sensitive measurement
of those important redox cofactors. We show that the sensitivity of
the assays (limit of detection *0.5 nM) enables the selective de-
tection of total amounts of nonphosphorylated or phosphorylated
dinucleotides directly in cell lysates. The total amount of NAD+NADH
or NADP+NADPH levels can be detected in as low as 300 or 600 cells/
well, respectively. The signal remains linear up to 5,000 cells/well
with the maximum signal-to-background ratios ranging from 100 to
200 for NAD+NADH and from 50 to 100 for NADP+NADPH detection.
The assays are robust (Z0 value > 0.7) and the inhibitor response
curves generated using a known NAD biosynthetic pathway inhibitor
FK866 correlate well with the reported data. More importantly, by
multiplexing the dinucleotide detection assays with a fluorescent
nonmetabolic cell viability assay, we show that dinucleotide levels
can be decreased dramatically (>80%) by FK866 treatment before
changes in cell viability are detected. The utility of the assays to
identify modulators of intracellular nicotinamide adenine dinucleo-
tide levels was further confirmed using an oncology active compound
library, where novel dinucleotide regulating compounds were iden-
tified. For example, the histone deacetylase inhibitor entinostat was
a potent inhibitor of cellular nicotinamide adenine dinucleotides,
whereas the selective estrogen receptor modulator raloxifene un-
expectedly caused a twofold increase in cellular nicotinamide ade-
nine dinucleotide levels.
INTRODUCTION
Nicotinamide adenine dinucleotides are abundant soluble
cofactors that undergo reversible oxidation and reduction
in major metabolic pathways.1–5 In cells, they are present as
oxidized and reduced dinucleotides in nonphosphorylated
(NAD and NADH) and phosphorylated (NADP and NADPH) forms.
These dinucleotides work in pairs with distinct functions.
NADPH is produced by the pentose phosphate pathway and
functions as a cofactor in many enzymatic reactions that are essential
for macromolecular biosynthesis. The NADP/NADPH pair provides
the redox equivalents for anabolic reactions, and it has a key role in
altered cancer cell metabolism.6,7 NADPH is also part of the defense
mechanism against reactive oxygen species.8
The NAD/NADH pair is involved in both energy metabolism and
signal transduction.9–13 In normal cells, the pair is primarily used for
catabolic reactions and the NAD to NADH ratio favors the oxidized
form. In addition to its vital role in energy transduction, NAD is a key
component in signaling pathways. NAD is required for mono- and
poly-ADP ribosylation, NAD-dependent protein deacetylation, and
the generation of Ca2 + mobilizing molecules. In metabolic redox
reactions, there is reversible oxidation and reduction of NAD/NADH
without changing total amounts. In contrast, NAD-dependent sig-
naling pathways constantly consume NAD, and it must be re-
plenished by NAD biosynthesis to maintain balanced cell regulation.
Given the important role of nicotinamide adenine dinucleotides as
redox factors in cellular metabolism and substrates in various sig-
naling pathways, NAD(P)/NAD(P)H metabolism is a therapeutic tar-
get for novel drug development.14,15 However, the lack of widely
accepted high-throughput screening (HTS) assays for monitoring
changes in NAD(P)/NAD(P)H levels directly in cell lysates makes drug
discovery efforts more challenging.
There are a few methods for assaying nicotinamide adenine di-
nucleotides in vitro. Reduced forms, both phosphorylated (NADPH)
and nonphosphorylated (NADH), absorb light at 340 nm and have
intrinsic fluorescence. Direct monitoring of absorbance or fluores-
cence can be used to study the activity of NAD(P)H producing or
consuming enzymes.16–18 Although direct detection is valuable for
biochemical enzyme characterization, it is limited to reduced forms
and does not provide sufficient sensitivity and/or specificity for cell/
tissue applications.
514 ASSAY and Drug Development Technologies NOVEMBER/DECEMBER 2014 DOI: 10.1089/adt.2014.605
Instrument-based single-photon or dual-photon excitation has
been utilized to measure weak intracellular NAD(P)H fluorescence
in cells and tissues.19,20 Genetically encoded fluorescent sensors
have been developed for monitoring the dynamic changes of the
NADH:NAD ratio in different subcellular organelles.21,22
NAD(P)/NAD(P)H levels in cell and tissue lysates also can be
measured by using high-performance liquid chromatography cou-
pled to mass spectrometry analysis or by using conventional cycling
assays coupled to absorbance or fluorescence detection methods.23–27
In these reactions, reduction of the oxidized forms (NAD or NADP)
by selective cycling enzymes is linked to NADH/NADPH oxidization
by a diaphorase, which is coupled to the reduction of various dyes.
The choice of cycling enzymes provides selectivity for the phos-
phorylated or nonphosphorylated dinucleotides and allows mea-
surement of the total amount of NAD + NADH and NADP + NADPH
present in the samples. These absorbance or fluorescence detection
methods are not highly sensitive, require a large number of cells,
involve extensive sample preparation, and are not readily amenable
to HTS applications.
Here, we describe the implementation of bioluminescent nicotin-
amide adenine dinucleotide detection assays for rapid and sensitive
detection of those dinucleotides directly in cell lysates. We show
that the high sensitivity and large signal window of these assays
enable rapid in-well measurement of cellular dinucleotides. The total
amount of nonphosphorylated NAD/NADH and phosphorylated
NADP/NADPH forms are detected selectively by the simple addition
of an appropriate detection reagent. The assays are robust, applicable
to many cell types, and are well suited for HTS. Applicability of those
assays to HTS will provide a valuable approach for compound
evaluation and screening as more efforts are undertaken to look for
modulators of NAD(P)/NAD(P)H-dependent pathways.
MATERIALS AND METHODSMaterials
All cell lines were from ATCC. A549 lung carcinoma cells and
HepG2 hepatocarcinoma cells were cultured in F-12K and EMEM
media, respectively (ATCC). Jurkat cells, derived from T-cell lym-
phocytes, and MDA-MB-231 breast adenocarcinoma cells were cul-
tured in RPMI and DMEM media, respectively (Gibco). All media were
supplemented with 10% fetal bovine serum (HyClone). The dinucle-
otides NAD, NADP, NADH, NADPH, and FK866 and raloxifene hy-
drochloride were purchased from Sigma. NAD/NADH-Glo�, NADP/
NADPH-Glo�, CellTiter-Glo�, and CellTiter-Fluor� were from Pro-
mega Corporation. White 384-well assay plates were from Corning, Inc.
Dinucleotide Detection Assay ConditionsThe linearity, sensitivity, and specificity of bioluminescent nico-
tinamide adenine detection assays were determined using NAD,
NADH, NADP, and NADPH standards. NAD and NADP standards were
premade as 2 mM stocks in water, aliquoted, and stored at - 20�C.
NADH and NADPH standards were prepared fresh from powder as
250mM stock solutions in 50mM Tris, pH 7.5 buffer at the time of the
experiment. All assay characterization experiments were performed in
384-well plates. Twofold serial dilutions of dinucleotide standards
were prepared in phosphate-buffered saline (PBS) or medium (without
serum). Twenty-five microliters of dinucleotide standards were trans-
ferred into white 384-well plates. To start the reactions, 25mL of di-
nucleotide detection reagent was added. The plates were incubated at
room temperature, and at indicated time points, luminescence output
was recorded using a Tecan Infinite M1000 Pro reader. The data pre-
sented in the figure are shown as relative light units (RLU), and each
point represents average luminescence of quadruplicate reactions.
Assay linearity with respect to dinucleotide concentration was
determined based on the initial reaction rate at each concentration.
The dinucleotide detection reactions were initiated, and lumines-
cence readings were taken every 10 min. At each time point, the
background (sample in the absence of dinucleotides) was subtracted
and a linear regression line was plotted at each NAD or NADP con-
centration. The rates of luminescence increase were calculated as the
slopes of the linear regression lines (DRLU/min) and were plotted
against dinucleotide concentrations.
Signal-to-noise (S/N) and signal-to-background (S/B) were cal-
culated as a function of nucleotide concentration in 60min reactions.
The S/N was calculated using the equation: S/N = (mean signal - mean
background)/standard deviation of background. The S/B was calcu-
lated as the ratio between RLU at defined dinucleotide concentration
(sample) and background (negative) control.28
Dinucleotide Detection in CellsTo test the assay performance with different cell lines, A549,
HepG2, Jurkat, and MDA-MB-231 cells grown in flasks were collected,
spun down, and resuspended at 2 · 105 cells/mL in fresh F-12K, EMEM,
RPMI, and DMEM complete media, respectively. Twofold serial dilu-
tions of cells were prepared in the same media, and 25mL was trans-
ferred into white 384-well assay plates. For NAD + NADH detection,
25mL of NAD/NADH detection reagent was added to the cells. For
NADP + NADPH detection, 25mL of NADP/NADPH detection reagent
was added to the cells. The detection reagent contains detergent for
cell lysis making an additional lysis step unnecessary. The plates were
incubated at room temperature, and luminescence was read after
60 min incubation.
Recovery of Externally Added DinucleotidesTo determine the effectiveness of the assays at preserving the di-
nucleotide levels in cells at the time of lysis, the recovery of exter-
nally added (spiked) dinucleotides was determined. Known amounts
of dinucleotides were added to Jurkat cells plated in complete RPMI
media at 40,000 cells/mL. To validate quantitative and specific re-
covery of spiked dinucleotides, the experiments were setup with all
four dinucleotides (NAD, NADH, NADP, and NADPH) at increasing
dinucleotide concentrations. Since dinucleotides are rapidly de-
graded in serum containing media, twofold serial dilutions of NAD,
NADH, NADP, and NADPH standards were prepared in PBS at
10· final concentration starting from 2.5mM and were added to the
samples immediately after addition of dinucleotide detection reagents.
Briefly, 25mL of Jurkat cells or complete media was transferred in
BIOLUMINESCENT NAD(P)/NAD(P)H ASSAYS
ª MARY ANN LIEBERT, INC. � VOL. 12 NO. 9/10 � NOVEMBER/DECEMBER 2014 ASSAY and Drug Development Technologies 515
96-well plates. Twenty-five microliters of dinucleotide detection re-
agent was added to the samples followed by immediate addition of
2.5mL of dinucleotide standards prepared as described above. The
plates were incubated for 45 min at room temperature and lumines-
cence was read. The percent recovery of spiked dinucleotide was cal-
culated using the equation: % Recovery = ((RLU spike in cells - RLUcells)/
RLUspike in media) · 100.
Inhibitor IC50 DeterminationFK866 and raloxifene inhibitor titrations were performed with
A549 cells in 384-well plates. For an FK866 titration, 25 mL of A549
cells was plated and 10 mL of FK866 prepared in the same medium at
1:3 serial dilutions starting at 1.5 mM concentration was added to the
cells. For a raloxifene titration, 20 mL of A549 cells was plated and
5mL of raloxifene hydrochloride prepared at 1:2 serial dilutions
starting at 125 mM concentration was added to the cells. Viability,
ATP, total NAD + NADH, and total NADP + NADPH were determined
at different time points. The cell viability was determined using
CellTiter-Fluor. Total NAD + NADH and total NADP + NADPH levels
were measured using NAD/NADH and NADP/NADPH biolumines-
cence assays.
Briefly, 6mL of 5 · CellTiter-Fluor Reagent (15 mL GF-AFC Sub-
strate + 3 mL Assay Buffer) was added to each well. After a brief
shake, the plate was returned to 37�C for 30 min. Fluorescence was
measured using a Tecan Infinite M1000 Pro at 380 nmEX/505 nmEM.
After the fluorescence was read, 36 mL/well of either NAD/NADH or
NADP/NADPH detection reagents was added directly to the wells. The
luminescence was read after 45 min incubation at room temperature.
CellTiter-Glo Reagent was used in a separate set of wells for
measuring changes in ATP. An equal volume of CellTiter-Glo Re-
agent was added to each well. After a brief shake and 10 min at room
temperature, luminescence was measured.
The percent inhibition was calculated relative to control cells
without inhibitor. Data were plotted using a sigmoidal dose–response,
variable slope model supplied with SigmaPlot 12.0 software.
Evaluation for HTSThe robustness of bioluminescence nicotinamide adenine di-
nucleotide detection assays for HTS screening was evaluated by
determining Z0 value and performing plate uniformity and signal
variability assessment as recommended by HTS assay validation
guidance.29
Z0 was determined at three different cell densities using A549 and
Jurkat cells. The cells or media were dispensed at 25 mL/well into 384-
well plates. An equal volume of NAD/NADH or NADP/NADPH de-
tection reagent was added to the wells. The plates were incubated at
room temperature for 60 min and luminescence was read.
Plate uniformity test was performed with A549 cells plated at
2,000 cells/well in 25 mL and treated with FK866 inhibitor. The ex-
periments were set up on 2 different days with three 384-well plates
following the recommended plate layout.29 Forty-eight hours after the
treatment, 25mL of appropriate dinucleotide detection reagent was
added. Plates were incubated for 60 min and luminescence was read.
HI signal corresponds to control untreated cells. MID and LO signals
were generated with cells treated with FK866 inhibitor at high (200 nM)
or close to IC50 concentrations (2nM for NAD + NADH detection and
4 nM for NADP + NADPH detection). The Excel templates provided
with the HTS assay validation guidance were used for data analysis.29
FIMM Compound CollectionThe FIMM internal oncology compound collection consists of 304
active compounds, including 136 FDA/EMA approved anticancer
drugs and 170 emerging investigational and preclinical compounds,
covering a wide range of molecular targets (Supplementary Table S1;
Supplementary Data are available online at www.liebertpub.com/
adt). The compounds were obtained from the National Cancer In-
stitute Drug Testing Program (NCI DTP) and commercial chemical
vendors: Active Biochem, Axon Medchem, Cayman Chemical Com-
pany, ChemieTek, Enzo Life Sciences, LC Laboratories, Merck,
Santa Cruz Biotechnology, Selleck, Sequoia Research Products, SGC,
Sigma-Aldrich, and Tocris Biosciences.
Drug Sensitivity and Resistance TestingDepending on the compounds, they were either dissolved in 100%
dimethyl sulfoxide (DMSO) or Milli-Q water and dispensed in tissue
culture-treated 384-well plates (Corning) using an acoustic liquid
handling device, Echo 550 (Labcyte, Inc.). The compounds were
plated at five different concentrations in 10-fold dilutions covering a
10,000-fold concentration range (e.g., 1–10,000 nM). The com-
pounds were dispensed in 2.5 or 25 nL volume per well to keep the
final DMSO concentration no higher than 0.1% in the cell culture
medium. As the negative and positive control, 100% DMSO and
100 mM benzethonium chloride (BzCl), respectively, were added to
the wells to give final concentrations of 0.1% DMSO and 100 mM
benzethonium chloride. The presence of DMSO in the samples up to
1% has no effect on the performance of NAD(P)/NAD(P)H detection
assays (data not shown). In addition, to confirm no effect of DMSO on
cell culture or readout assay chemistries, no DMSO control samples
with or without cells were tested and showed no significant differ-
ence compared to negative and positive controls used in the screen.
The library was screened with A549 cells using the protocol de-
scribed in Table 1. Two separate sets of the library were used for total
NAD + NADH or NADP + NADPH detection. Two independent screens
were performed with each assay.
All the reagents were dispensed using MultidropCombi� (Thermo
Scientific). Fluorescence readings were taken using a Safire2 mi-
croplate reader. Luminescence measurements were done using a
Tecan Infinite M1000 PRO plate reader.
Data Analysis, Scoring, and Clustering of DrugSensitivity and Resistance Testing Data
The data obtained from plate reader were uploaded and analyzed
in Dotmatics Browser/Studies software (Dotmatics Ltd.), as described
previously.30,31
For data analysis, we have employed a methodology that has been
described elsewhere and is freely available.31 The method integrates
VIDUGIRIENE ET AL.
516 ASSAY and Drug Development Technologies NOVEMBER/DECEMBER 2014
the multiparameter analysis (potency [EC50], slope of dose–response
curve, the area under the curve, and the maximum effect) of dose–
response relationships into a quantitative scoring approach, drug
sensitivity score (DSS). Selected examples of dose–response curves
representing different types of variation in dose–response relation-
ships and corresponding DSS are illustrated in Supplementary Figure
S1. The figure visually illustrates how the model-based drug
sensitivity quantitation captures and integrates information from
dose–response curves (EC50, slope, maximum response, and other
parameters) into a single metric. Based on their DSS, compounds can
be divided into five groups: inactive (DSS = 0), low active (DSS > 0 up
to 5), semi-active (DSS > 5 up to 10), active (DSS > 10 up to 20), and
very active (DSS > 20).
To evaluate the effect of library compounds on cell viability,
NAD + NADH and NADP + NADPH levels, DSSs were calculated for
each compound for each individual assay for two independent
screens. Data from one representative screen of cell viability/NAD +NADH detection (Supplementary Table S2) and cell viability/
NADP + NADPH detection (Supplementary Table S3) of dose–
response curves, EC50 values, and calculated DSS are included in
Supplementary Data. Compounds with DSS < 5 had no or very slight
effect on measured responses and are not included in the tables.
A single metric approach can be particular useful for determining
selective response for different readouts or the same readout in different
samples. The data between two experimental sets, for example, cell
viability readouts for screen 1 in comparison to screen 2, can be
compared by calculating selective DSS (sDSS) to evaluate reproduc-
ibility of two screens. Theoretically, the sDSS score should equal 0 when
the same readout is compared. But more
importantly, it is valuable tool for iden-
tifying compounds with selective effect
on one readout, for example, drug-
induced decrease in dinucleotide levels,
compared to another readout, for ex-
ample, drug-induced decrease in cell
viability.
To determine reproducibility of each
assay and to validate DSS scoring ap-
proach, we calculated sDSS for each
assay (cell viability, NAD + NADH, and
NADP + NADPH assays) using two in-
dependent screens. sDSS were calcu-
lated for each compound in each assay
by subtracting DSS values of run 1 from
run 2. The average sDSS varied from
- 0.4 to 0.1 depending on the assay
with standard deviation equal to 1 for
all three assays, indicating good repro-
ducibility of the assays and DSS scoring
approach.
To identify selective drug response
effects on changes in dinucleotide levels
(NAD + NADH or NADP + NADPH) in
comparison to cell viability response, the sDSS was calculated. sDSS
was calculated by subtracting average viability readout (CellTiter-
Fluor) DSS from the average of dinucleotide DSS values from
NAD(P)/NAD(P)H detection assays obtained from two independent
screens. To identify compounds with selective effect on dinucleotide
levels, we used a cutoff of - 5 ‡ sDSS ‡ 5. The cutoff was determined
as two standard deviations above the average sDSS of all compounds.
Positive sDSS values indicate selective drug effect on dinucleotide
levels in live cells, whereas the impact of the drugs with negative
sDSS is likely influenced by cell death. One compound tosedostat had
sDSS = - 21.25. Tosedostat is aminopeptidase inhibitor and was
confirmed to have a direct effect on the cell viability detection sys-
tem, which is based on protease activity measurement.
RESULTSAssay Principle and Formats
Bioluminescent NAD(P)/NAD(P)H detection assays are based on a
proluciferin substrate.32 In the presence of NADH or NADPH, the
proluciferin is converted to luciferin by a reductase enzyme and
the luciferin is used by luciferase to produce light in proportion to the
amount of NADH or NADPH. To measure an oxidized dinucleotide, or
total dinucleotide in a mixed pool of reduced and oxidized forms, the
oxidized form is first reduced by a dehydrogenase enzyme/substrate
pair with selectivity for either NAD or NADP (Fig. 1). The dehydro-
genase serves as a cycling enzyme that amplifies assay sensitivity. In
this mode, the alternating activities of reductase and dehydrogenase
drive a dinucleotide-dependent proluciferin conversion rate that
produces luciferin for as long as the proluciferin reductase substrate
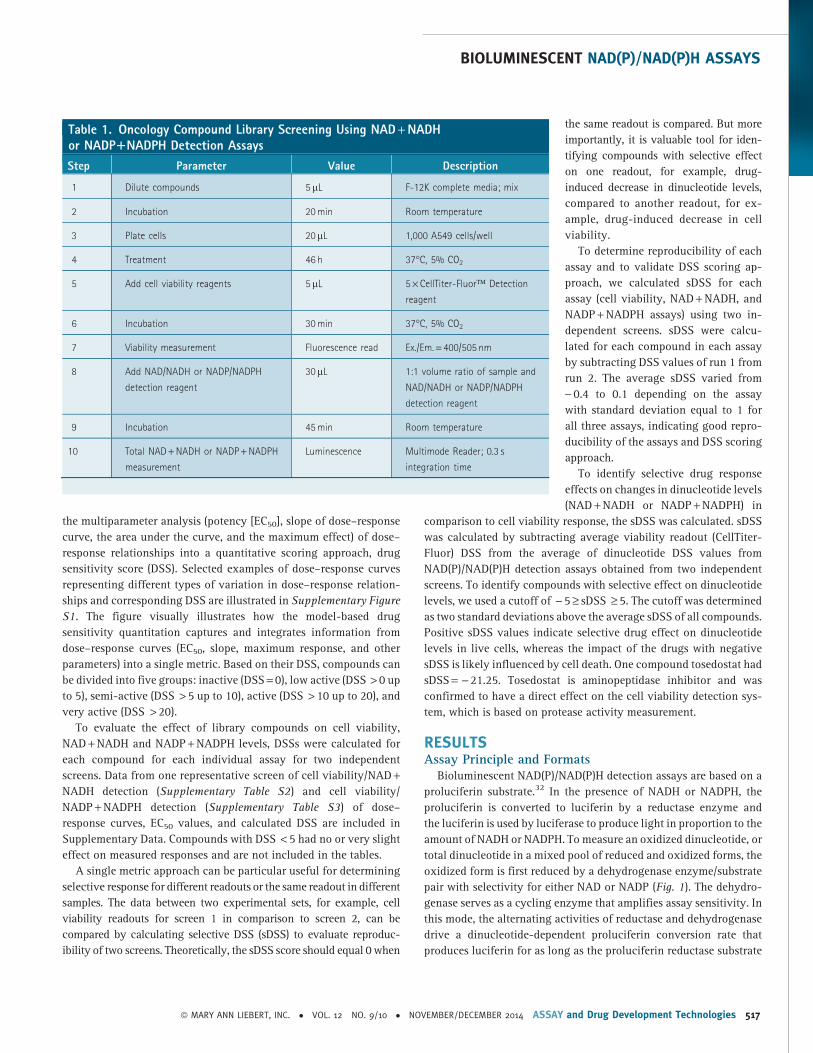
Table 1. Oncology Compound Library Screening Using NAD + NADHor NADP1NADPH Detection Assays
Step Parameter Value Description
1 Dilute compounds 5mL F-12K complete media; mix
2 Incubation 20 min Room temperature
3 Plate cells 20mL 1,000 A549 cells/well
4 Treatment 46 h 37�C, 5% CO2
5 Add cell viability reagents 5mL 5 · CellTiter-Fluor� Detection
reagent
6 Incubation 30 min 37�C, 5% CO2
7 Viability measurement Fluorescence read Ex./Em. = 400/505 nm
8 Add NAD/NADH or NADP/NADPH
detection reagent
30mL 1:1 volume ratio of sample and
NAD/NADH or NADP/NADPH
detection reagent
9 Incubation 45 min Room temperature
10 Total NAD + NADH or NADP + NADPH
measurement
Luminescence Multimode Reader; 0.3 s
integration time
BIOLUMINESCENT NAD(P)/NAD(P)H ASSAYS
ª MARY ANN LIEBERT, INC. � VOL. 12 NO. 9/10 � NOVEMBER/DECEMBER 2014 ASSAY and Drug Development Technologies 517
remains nonlimiting. Consequently, the sensitivity of the detection
system increases with time and an optimal assay window is deter-
mined by taking multiple reads at different time points. The assays
are adaptable to different plate formats and are performed simply by
adding the detection reagents directly to cells in medium at 1:1
volume ratios.
Linearity, Sensitivity, and Specificityof Cycling Reactions
The linearity and sensitivity of nicotinamide adenine dinucleotide
detection assays were determined using purified dinucleotide stan-
dards. NAD and NADP titration curves were set up in 384-well plates
in PBS and different media. The luminescence readings were taken
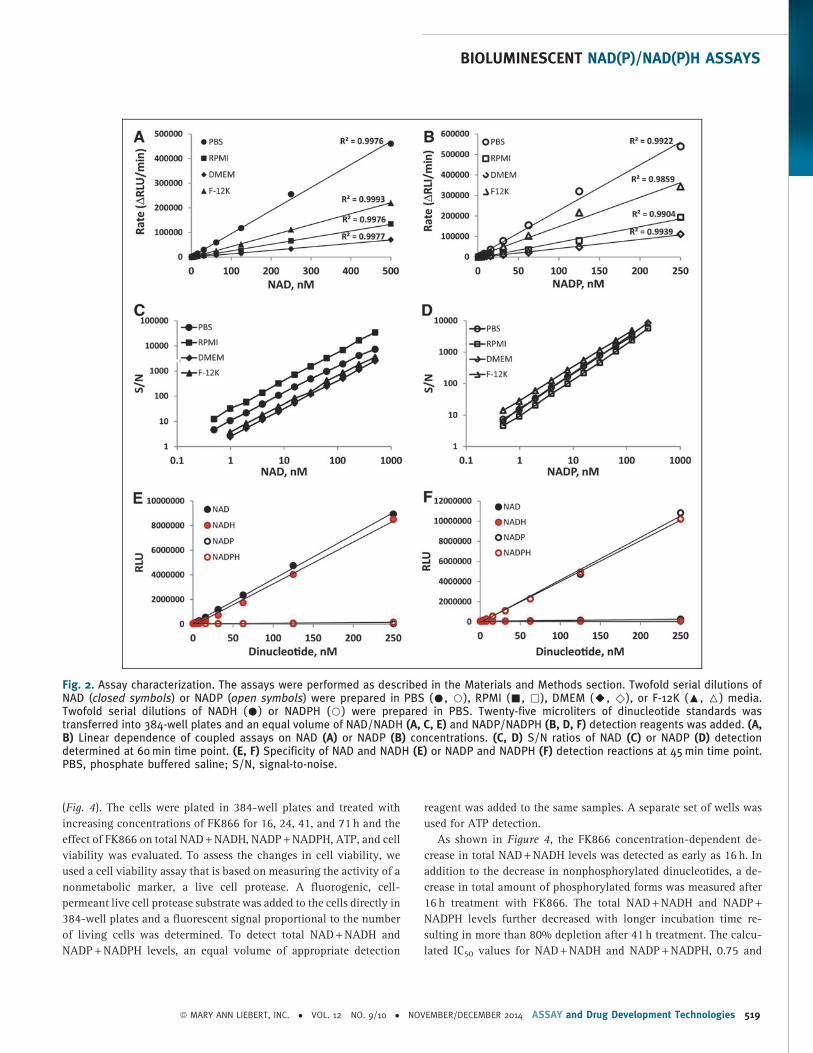
every 10 min for up to 1 h. Figure 2 shows initial velocities of NAD
(Fig. 2A) and NADP (Fig. 2B) cycling reactions that were calculated
from the slopes of the linear regression lines at each NAD and NADP
concentration. In both cases, the rates of cycling reactions varied in
different media (without serum). However, under all tested condi-
tions, a linear increase in reaction rate was measured with increasing
NAD and NADP concentrations. Similar data were obtained with
reduced forms of NADH and NADPH (data not shown). The reaction
rates remained linear (R2 values > 0.99) for up to 1 h with starting
NAD concentrations ranging from 1 to 500 nM and NADP from 1 to
250 nM.
The assay sensitivities and assay window were determined by
calculating S/N and S/B ratios (data not shown). The sensitivity of the
assays increased with time and under all tested conditions reached
the low nM range (limit of detection *0.5 nM or below) after 60 min
incubation (Fig. 2C, D). Both assays showed wide assay windows with
maximum S/B ratios above 250-fold making them well suited for
high-throughput applications.
To determine the specificity of cycling reactions within the linear
range of the assays, we compared the performance of both assays
with NAD, NADH, NADP, and NADPH dinucleotide standards. As
shown in Figure 2E and F, both cycling enzymes showed high
specificity for appropriate dinucleotides. No significant increase in
light output above background was detected with oxidized forms of
nonspecific dinucleotides. With reduced forms, due to the direct re-
ductase activity, a slight increase in nonspecific signal was detected
at higher dinucleotide concentrations ( > 50 nM). However, even
under those conditions, more than 50-fold higher signals were
generated with specific dinucleotides.
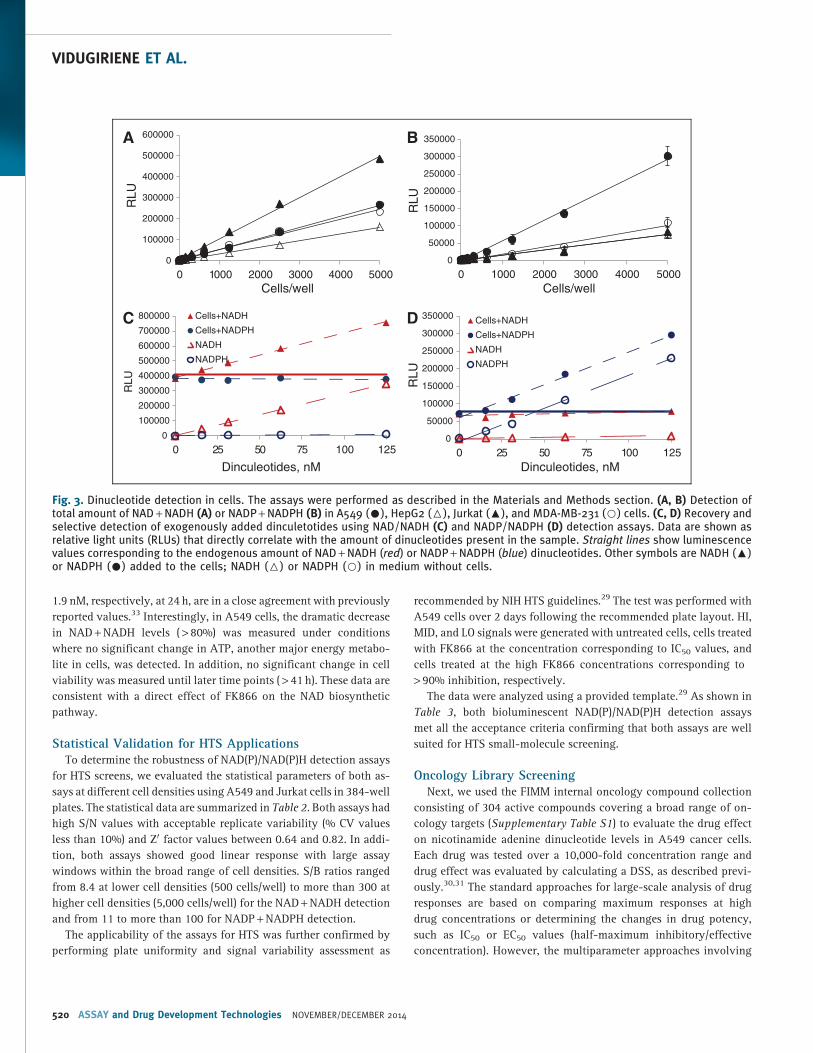
Dinucleotide Detection in CellsTo test the performance of bioluminescent NAD(P)/NAD(P)H de-
tection assays in cell lysates, we set up cell titration experiments in
384-well plates. As shown in Figure 3A and B, a linear increase in
light output was measured with increasing amount of cells. The
sensitivity of the assays allowed robust detection (S/B > 3 with
coefficient of variation (CV) values ranging from 2% to 7.5%) of total
amounts of NAD + NADH and NADP + NADPH in as low as 300 or
600 cells/well, respectively. The signal remained linear up to 5,000
cells/well with the maximum S/B ratios ranging from 100 to 200 for
NAD + NADH and from 50 to 100 for NADP + NADPH detection.
To confirm the ability of assays to provide quantitative and spe-
cific detection of cellular dinucleotides, we set up a ‘‘spike’’ recovery
experiment. Increasing concentrations of NADH and NADPH dinu-
cleotides ranging from 0 to 125 nM were added to the cells or medium
alone. As shown in Figure 3C and D, no increase in light output was
measured with increasing concentrations of nonspecific dinucleo-
tides added to the medium or cells. In contrast, specific dinucleotides
added to the cells caused concentration-dependent increases in lu-
minescence. Using the NAD/NADH detection assay, the increase in
signal was measured when NADH but not NADPH was added to the
cells, while using the NADP/NADPH assay, the increase in light
correlated with NADPH addition. More importantly, the increase in
signal directly corresponded to the signal obtained at the same di-
nucleotide concentrations in medium without cells indicating
quantitative recovery of exogenously added dinucleotides. The cal-
culated recovery was > 95% with both assays.
Inhibitor IC50 DeterminationTo validate bioluminescent NAD(P)/NAD(P)H detection assays for
small-molecule inhibitor screening and profiling, the performance of
the assays was tested with a known NAD biosynthetic pathway in-
hibitor, FK866.
FK866 is a highly specific noncompetitive inhibitor of nicotin-
amide phosphoribosyltransferase (NAPRT or NAMPT), a key enzyme
in the regulation of NAD biosynthesis. Initial studies in cancer cell
lines indicated that exposure to FK866 with an IC50 of *1 nM leads
to slow depletion of intracellular NAD pools followed by cell
death.33 It has also been suggested that the inhibition of NAMPT
by FK866 can affect other pathways deregulated in cancer cells,
such as glycolysis, the pentose phosphate pathway, serine biosyn-
thesis, and the TCA cycle.34,35
To confirm the ability of the assays to detect changes in nicotin-
amide adenine dinucleotide levels directly in cell lysates in 384-well
plates, we set up a time course study using A549 lung carcinoma cells
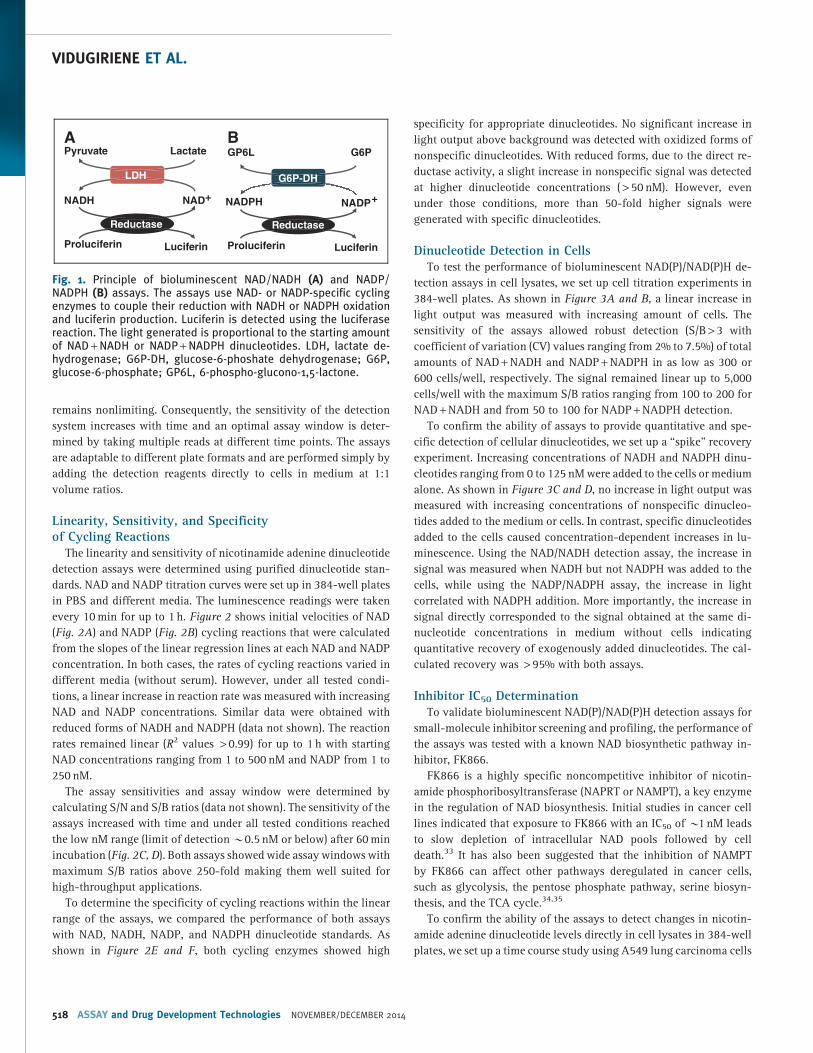
Reductase
NADH NAD+ +
Proluciferin Luciferin
Pyruvate Lactate
LDH
Reductase
NADPH NADP
Proluciferin Luciferin
GP6L G6P
G6P-DH
A B
Fig. 1. Principle of bioluminescent NAD/NADH (A) and NADP/NADPH (B) assays. The assays use NAD- or NADP-specific cyclingenzymes to couple their reduction with NADH or NADPH oxidationand luciferin production. Luciferin is detected using the luciferasereaction. The light generated is proportional to the starting amountof NAD + NADH or NADP + NADPH dinucleotides. LDH, lactate de-hydrogenase; G6P-DH, glucose-6-phoshate dehydrogenase; G6P,glucose-6-phosphate; GP6L, 6-phospho-glucono-1,5-lactone.
VIDUGIRIENE ET AL.
518 ASSAY and Drug Development Technologies NOVEMBER/DECEMBER 2014
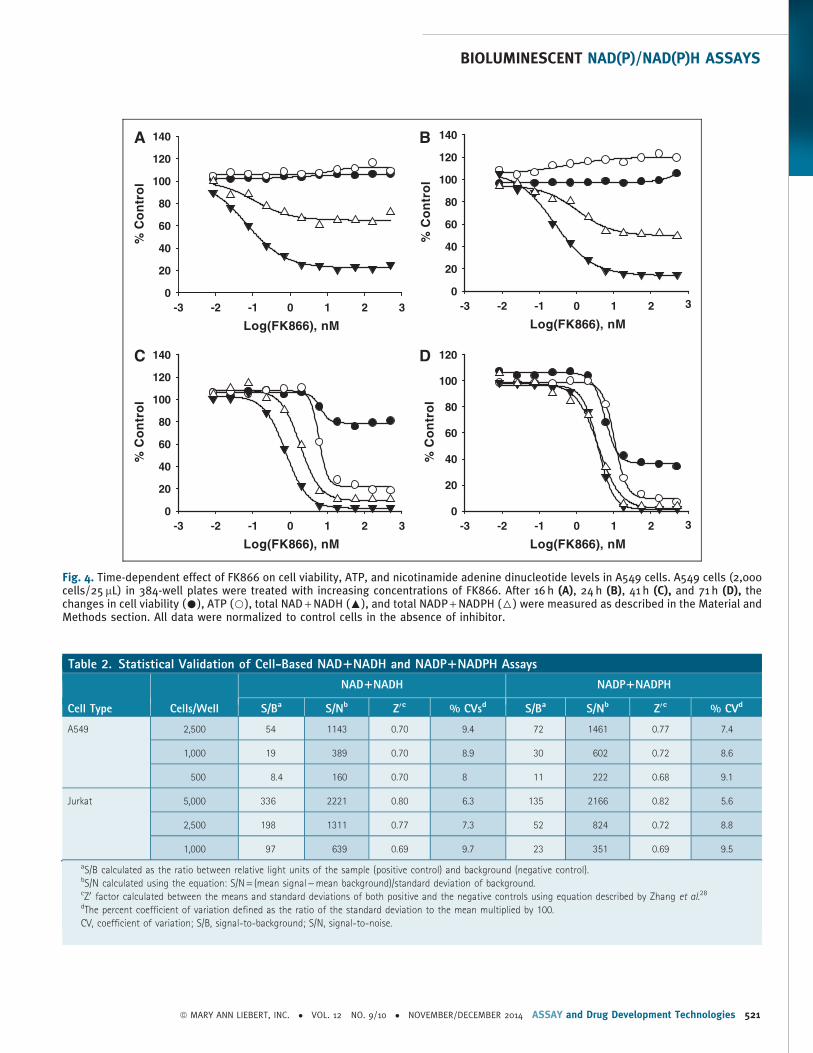
(Fig. 4). The cells were plated in 384-well plates and treated with
increasing concentrations of FK866 for 16, 24, 41, and 71 h and the
effect of FK866 on total NAD + NADH, NADP + NADPH, ATP, and cell
viability was evaluated. To assess the changes in cell viability, we
used a cell viability assay that is based on measuring the activity of a
nonmetabolic marker, a live cell protease. A fluorogenic, cell-
permeant live cell protease substrate was added to the cells directly in
384-well plates and a fluorescent signal proportional to the number
of living cells was determined. To detect total NAD + NADH and
NADP + NADPH levels, an equal volume of appropriate detection
reagent was added to the same samples. A separate set of wells was
used for ATP detection.
As shown in Figure 4, the FK866 concentration-dependent de-
crease in total NAD + NADH levels was detected as early as 16 h. In
addition to the decrease in nonphosphorylated dinucleotides, a de-
crease in total amount of phosphorylated forms was measured after
16 h treatment with FK866. The total NAD + NADH and NADP +NADPH levels further decreased with longer incubation time re-
sulting in more than 80% depletion after 41 h treatment. The calcu-
lated IC50 values for NAD + NADH and NADP + NADPH, 0.75 and
Fig. 2. Assay characterization. The assays were performed as described in the Materials and Methods section. Twofold serial dilutions ofNAD (closed symbols) or NADP (open symbols) were prepared in PBS (C, B), RPMI (-, ,), DMEM (A, )), or F-12K (:, 6) media.Twofold serial dilutions of NADH (C) or NADPH (B) were prepared in PBS. Twenty-five microliters of dinucleotide standards wastransferred into 384-well plates and an equal volume of NAD/NADH (A, C, E) and NADP/NADPH (B, D, F) detection reagents was added. (A,B) Linear dependence of coupled assays on NAD (A) or NADP (B) concentrations. (C, D) S/N ratios of NAD (C) or NADP (D) detectiondetermined at 60 min time point. (E, F) Specificity of NAD and NADH (E) or NADP and NADPH (F) detection reactions at 45 min time point.PBS, phosphate buffered saline; S/N, signal-to-noise.
BIOLUMINESCENT NAD(P)/NAD(P)H ASSAYS
ª MARY ANN LIEBERT, INC. � VOL. 12 NO. 9/10 � NOVEMBER/DECEMBER 2014 ASSAY and Drug Development Technologies 519
1.9 nM, respectively, at 24 h, are in a close agreement with previously
reported values.33 Interestingly, in A549 cells, the dramatic decrease
in NAD + NADH levels ( > 80%) was measured under conditions
where no significant change in ATP, another major energy metabo-
lite in cells, was detected. In addition, no significant change in cell
viability was measured until later time points ( > 41 h). These data are
consistent with a direct effect of FK866 on the NAD biosynthetic
pathway.
Statistical Validation for HTS ApplicationsTo determine the robustness of NAD(P)/NAD(P)H detection assays
for HTS screens, we evaluated the statistical parameters of both as-
says at different cell densities using A549 and Jurkat cells in 384-well
plates. The statistical data are summarized in Table 2. Both assays had
high S/N values with acceptable replicate variability (% CV values
less than 10%) and Z0 factor values between 0.64 and 0.82. In addi-
tion, both assays showed good linear response with large assay
windows within the broad range of cell densities. S/B ratios ranged
from 8.4 at lower cell densities (500 cells/well) to more than 300 at
higher cell densities (5,000 cells/well) for the NAD + NADH detection
and from 11 to more than 100 for NADP + NADPH detection.
The applicability of the assays for HTS was further confirmed by
performing plate uniformity and signal variability assessment as
recommended by NIH HTS guidelines.29 The test was performed with
A549 cells over 2 days following the recommended plate layout. HI,
MID, and LO signals were generated with untreated cells, cells treated
with FK866 at the concentration corresponding to IC50 values, and
cells treated at the high FK866 concentrations corresponding to
> 90% inhibition, respectively.
The data were analyzed using a provided template.29 As shown in
Table 3, both bioluminescent NAD(P)/NAD(P)H detection assays
met all the acceptance criteria confirming that both assays are well
suited for HTS small-molecule screening.
Oncology Library ScreeningNext, we used the FIMM internal oncology compound collection
consisting of 304 active compounds covering a broad range of on-
cology targets (Supplementary Table S1) to evaluate the drug effect
on nicotinamide adenine dinucleotide levels in A549 cancer cells.
Each drug was tested over a 10,000-fold concentration range and
drug effect was evaluated by calculating a DSS, as described previ-
ously.30,31 The standard approaches for large-scale analysis of drug
responses are based on comparing maximum responses at high
drug concentrations or determining the changes in drug potency,
such as IC50 or EC50 values (half-maximum inhibitory/effective
concentration). However, the multiparameter approaches involving
0
100000
200000
300000
400000
500000
600000
0 1000 2000 3000 4000 5000
RLU
Cells/well
Dinculeotides,
0
50000
100000
150000
200000
250000
300000
350000
0 1000 2000 3000 4000 5000
RLU
Cells/well
0
100000
200000
300000
400000
500000
600000
700000
800000
0 25 50 75 100 125
RLU
nM Dinculeotides, nM
Cells+NADH
Cells+NADPH
NADH
NADPH
0
50000
100000
150000
200000
250000
300000
350000
0 25 50 75 100 125
RLU
Cells+NADH
Cells+NADPH
NADH
NADPH
A B
DC
Fig. 3. Dinucleotide detection in cells. The assays were performed as described in the Materials and Methods section. (A, B) Detection oftotal amount of NAD + NADH (A) or NADP + NADPH (B) in A549 (C), HepG2 (6), Jurkat (:), and MDA-MB-231 (B) cells. (C, D) Recovery andselective detection of exogenously added dinculetotides using NAD/NADH (C) and NADP/NADPH (D) detection assays. Data are shown asrelative light units (RLUs) that directly correlate with the amount of dinucleotides present in the sample. Straight lines show luminescencevalues corresponding to the endogenous amount of NAD + NADH (red) or NADP + NADPH (blue) dinucleotides. Other symbols are NADH (:)or NADPH (C) added to the cells; NADH (6) or NADPH (B) in medium without cells.
VIDUGIRIENE ET AL.
520 ASSAY and Drug Development Technologies NOVEMBER/DECEMBER 2014
Log(FK866), nM
-3 -2 -1 0 1 2 3
% C
on
tro
l
0
20
40
60
80
100
120
140
Log(FK866), nM
-3 -2 -1 0 1 2
% C
on
tro
l
0
20
40
60
80
100
120
140
Log(FK866), nM
-3 3
3
-2 -1 0 1 2 3
% C
on
tro
l
0
20
40
60
80
100
120
140
Log(FK866), nM
-3 -2 -1 0 1 2
% C
on
tro
l
0
20
40
60
80
100
120
A B
DC
Fig. 4. Time-dependent effect of FK866 on cell viability, ATP, and nicotinamide adenine dinucleotide levels in A549 cells. A549 cells (2,000cells/25 mL) in 384-well plates were treated with increasing concentrations of FK866. After 16 h (A), 24 h (B), 41 h (C), and 71 h (D), thechanges in cell viability (C), ATP (B), total NAD + NADH (:), and total NADP + NADPH (6) were measured as described in the Material andMethods section. All data were normalized to control cells in the absence of inhibitor.
Table 2. Statistical Validation of Cell-Based NAD1NADH and NADP1NADPH Assays
NAD1NADH NADP1NADPH
Cell Type Cells/Well S/Ba S/Nb Z0c % CVsd S/Ba S/Nb Z0c % CVd
A549 2,500 54 1143 0.70 9.4 72 1461 0.77 7.4
1,000 19 389 0.70 8.9 30 602 0.72 8.6
500 8.4 160 0.70 8 11 222 0.68 9.1
Jurkat 5,000 336 2221 0.80 6.3 135 2166 0.82 5.6
2,500 198 1311 0.77 7.3 52 824 0.72 8.8
1,000 97 639 0.69 9.7 23 351 0.69 9.5
aS/B calculated as the ratio between relative light units of the sample (positive control) and background (negative control).bS/N calculated using the equation: S/N = (mean signal - mean background)/standard deviation of background.cZ0 factor calculated between the means and standard deviations of both positive and the negative controls using equation described by Zhang et al.28
dThe percent coefficient of variation defined as the ratio of the standard deviation to the mean multiplied by 100.
CV, coefficient of variation; S/B, signal-to-background; S/N, signal-to-noise.
BIOLUMINESCENT NAD(P)/NAD(P)H ASSAYS
ª MARY ANN LIEBERT, INC. � VOL. 12 NO. 9/10 � NOVEMBER/DECEMBER 2014 ASSAY and Drug Development Technologies 521
analysis of the slope of the dose–response curves, the area under the
curve, and the maximum effect have been shown to be powerful
methods of describing and quantifying dose responses within dif-
ferent data sets.31,36
Here, we applied the multiparameter-based DSS scoring approach
to compare drug-induced changes in cell viability, total NAD +NADH, and total NADP + NADPH levels.
A549 cells were plated into 384-well plates containing the pre-
dispensed compound library. Each set of experiments consisted of
five plates with 304 compounds in each plate starting with the highest
compound concentration in plate 1 and going to the lowest com-
pound concentration in plate 5. After 46 h of treatment, cell viability
reagent was added to the plates to determine compound-induced
changes in cell viability. Following viability measurement, NAD/
NADH detection reagent was added to one set of plates to determine
the changes in NAD + NADH levels and NADP/NADPH detection
reagent was added to another set of plates to determine the changes
in NADP + NADPH levels. Each of the screens was repeated twice.
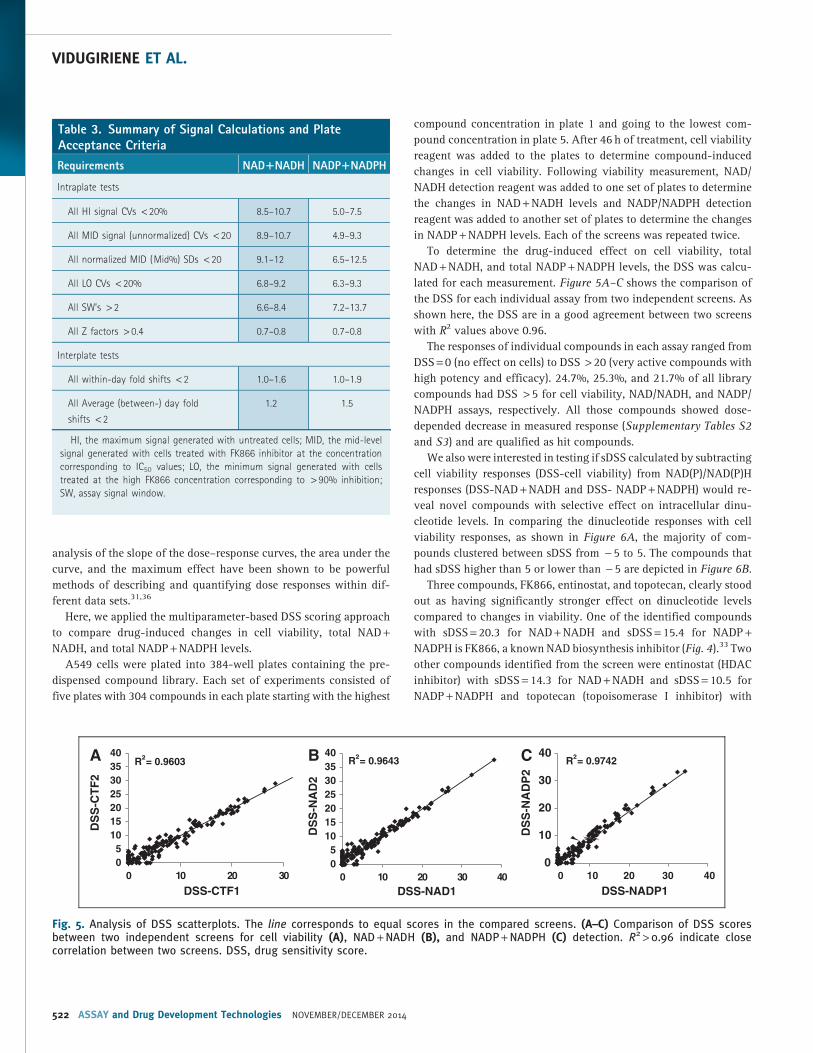
To determine the drug-induced effect on cell viability, total
NAD + NADH, and total NADP + NADPH levels, the DSS was calcu-
lated for each measurement. Figure 5A–C shows the comparison of
the DSS for each individual assay from two independent screens. As
shown here, the DSS are in a good agreement between two screens
with R2 values above 0.96.
The responses of individual compounds in each assay ranged from
DSS = 0 (no effect on cells) to DSS > 20 (very active compounds with
high potency and efficacy). 24.7%, 25.3%, and 21.7% of all library
compounds had DSS > 5 for cell viability, NAD/NADH, and NADP/
NADPH assays, respectively. All those compounds showed dose-
depended decrease in measured response (Supplementary Tables S2
and S3) and are qualified as hit compounds.
We also were interested in testing if sDSS calculated by subtracting
cell viability responses (DSS-cell viability) from NAD(P)/NAD(P)H
responses (DSS-NAD + NADH and DSS- NADP + NADPH) would re-
veal novel compounds with selective effect on intracellular dinu-
cleotide levels. In comparing the dinucleotide responses with cell
viability responses, as shown in Figure 6A, the majority of com-
pounds clustered between sDSS from - 5 to 5. The compounds that
had sDSS higher than 5 or lower than - 5 are depicted in Figure 6B.
Three compounds, FK866, entinostat, and topotecan, clearly stood
out as having significantly stronger effect on dinucleotide levels
compared to changes in viability. One of the identified compounds
with sDSS = 20.3 for NAD + NADH and sDSS = 15.4 for NADP +NADPH is FK866, a known NAD biosynthesis inhibitor (Fig. 4).33 Two
other compounds identified from the screen were entinostat (HDAC
inhibitor) with sDSS = 14.3 for NAD + NADH and sDSS = 10.5 for
NADP + NADPH and topotecan (topoisomerase I inhibitor) with
Table 3. Summary of Signal Calculations and PlateAcceptance Criteria
Requirements NAD1NADH NADP1NADPH
Intraplate tests
All HI signal CVs < 20% 8.5–10.7 5.0–7.5
All MID signal (unnormalized) CVs < 20 8.9–10.7 4.9–9.3
All normalized MID (Mid%) SDs < 20 9.1–12 6.5–12.5
All LO CVs < 20% 6.8–9.2 6.3–9.3
All SW’s > 2 6.6–8.4 7.2–13.7
All Z factors > 0.4 0.7–0.8 0.7–0.8
Interplate tests
All within-day fold shifts < 2 1.0–1.6 1.0–1.9
All Average (between-) day fold
shifts < 2
1.2 1.5
HI, the maximum signal generated with untreated cells; MID, the mid-level
signal generated with cells treated with FK866 inhibitor at the concentration
corresponding to IC50 values; LO, the minimum signal generated with cells
treated at the high FK866 concentration corresponding to > 90% inhibition;
SW, assay signal window.
R² = 0.9603
05
10152025303540
0 10 20 30
DS
S-C
TF
2
DSS-CTF1
R² = 0.9643
05
10152025303540
0 10 20 30 40
DS
S-N
AD
2
DSS-NAD1
R² = 0.9742
0
10
20
30
40
400 10 20 30
DS
S-N
AD
P2
DSS-NADP1
A B C
Fig. 5. Analysis of DSS scatterplots. The line corresponds to equal scores in the compared screens. (A–C) Comparison of DSS scoresbetween two independent screens for cell viability (A), NAD + NADH (B), and NADP + NADPH (C) detection. R2 > 0.96 indicate closecorrelation between two screens. DSS, drug sensitivity score.
VIDUGIRIENE ET AL.
522 ASSAY and Drug Development Technologies NOVEMBER/DECEMBER 2014
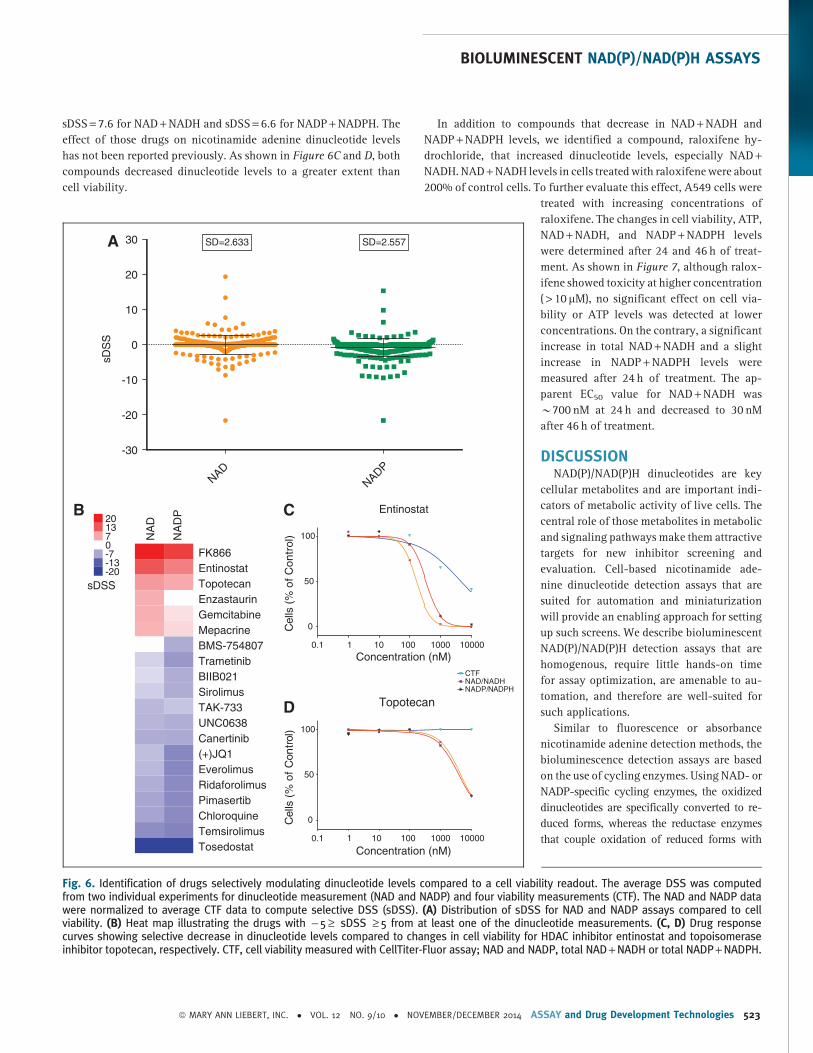
sDSS = 7.6 for NAD + NADH and sDSS = 6.6 for NADP + NADPH. The
effect of those drugs on nicotinamide adenine dinucleotide levels
has not been reported previously. As shown in Figure 6C and D, both
compounds decreased dinucleotide levels to a greater extent than
cell viability.
In addition to compounds that decrease in NAD + NADH and
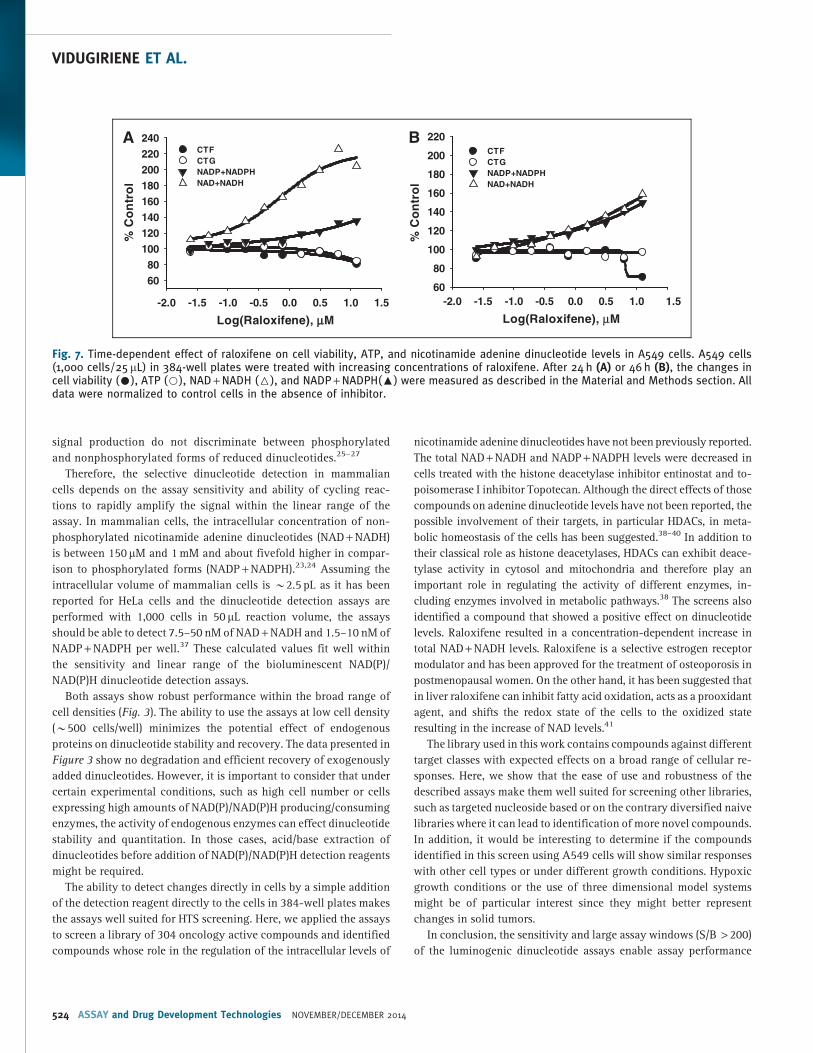
NADP + NADPH levels, we identified a compound, raloxifene hy-
drochloride, that increased dinucleotide levels, especially NAD +NADH. NAD + NADH levels in cells treated with raloxifene were about
200% of control cells. To further evaluate this effect, A549 cells were
treated with increasing concentrations of
raloxifene. The changes in cell viability, ATP,
NAD + NADH, and NADP + NADPH levels
were determined after 24 and 46 h of treat-
ment. As shown in Figure 7, although ralox-
ifene showed toxicity at higher concentration
( > 10 mM), no significant effect on cell via-
bility or ATP levels was detected at lower
concentrations. On the contrary, a significant
increase in total NAD + NADH and a slight
increase in NADP + NADPH levels were
measured after 24 h of treatment. The ap-
parent EC50 value for NAD + NADH was
*700 nM at 24 h and decreased to 30 nM
after 46 h of treatment.
DISCUSSIONNAD(P)/NAD(P)H dinucleotides are key
cellular metabolites and are important indi-
cators of metabolic activity of live cells. The
central role of those metabolites in metabolic
and signaling pathways make them attractive
targets for new inhibitor screening and
evaluation. Cell-based nicotinamide ade-
nine dinucleotide detection assays that are
suited for automation and miniaturization
will provide an enabling approach for setting
up such screens. We describe bioluminescent
NAD(P)/NAD(P)H detection assays that are
homogenous, require little hands-on time
for assay optimization, are amenable to au-
tomation, and therefore are well-suited for
such applications.
Similar to fluorescence or absorbance
nicotinamide adenine detection methods, the
bioluminescence detection assays are based
on the use of cycling enzymes. Using NAD- or
NADP-specific cycling enzymes, the oxidized
dinucleotides are specifically converted to re-
duced forms, whereas the reductase enzymes
that couple oxidation of reduced forms with
NA
D
NA
DP
FK866 Entinostat Topotecan Enzastaurin Gemcitabine Mepacrine BMS-754807 Trametinib BIIB021 Sirolimus TAK-733 UNC0638 Canertinib (+)JQ1 Everolimus Ridaforolimus Pimasertib Chloroquine Temsirolimus Tosedostat
-20 -13 -7 0 7 13 20
sDSS
0.1 101 100 1000 10000
0
50
100
Concentration (nM)
Cel
ls (
% o
f C
ontr
ol)
Topotecan
NAD/NADHNADP/NADPH
CTF
Concentration (nM)
Cel
ls (
% o
f C
ontr
ol)
Entinostat
0
50
100
0.1 101 100 1000 10000
NADNADP
-30
-20
-10
0
10
20
30
sDS
S
SD=2.633 SD=2.557A
B C
D
Fig. 6. Identification of drugs selectively modulating dinucleotide levels compared to a cell viability readout. The average DSS was computedfrom two individual experiments for dinucleotide measurement (NAD and NADP) and four viability measurements (CTF). The NAD and NADP datawere normalized to average CTF data to compute selective DSS (sDSS). (A) Distribution of sDSS for NAD and NADP assays compared to cellviability. (B) Heat map illustrating the drugs with - 5 ‡ sDSS ‡ 5 from at least one of the dinucleotide measurements. (C, D) Drug responsecurves showing selective decrease in dinucleotide levels compared to changes in cell viability for HDAC inhibitor entinostat and topoisomeraseinhibitor topotecan, respectively. CTF, cell viability measured with CellTiter-Fluor assay; NAD and NADP, total NAD + NADH or total NADP + NADPH.
BIOLUMINESCENT NAD(P)/NAD(P)H ASSAYS
ª MARY ANN LIEBERT, INC. � VOL. 12 NO. 9/10 � NOVEMBER/DECEMBER 2014 ASSAY and Drug Development Technologies 523
signal production do not discriminate between phosphorylated
and nonphosphorylated forms of reduced dinucleotides.25–27
Therefore, the selective dinucleotide detection in mammalian
cells depends on the assay sensitivity and ability of cycling reac-
tions to rapidly amplify the signal within the linear range of the
assay. In mammalian cells, the intracellular concentration of non-
phosphorylated nicotinamide adenine dinucleotides (NAD + NADH)
is between 150 mM and 1 mM and about fivefold higher in compar-
ison to phosphorylated forms (NADP + NADPH).23,24 Assuming the
intracellular volume of mammalian cells is *2.5 pL as it has been
reported for HeLa cells and the dinucleotide detection assays are
performed with 1,000 cells in 50 mL reaction volume, the assays
should be able to detect 7.5–50 nM of NAD + NADH and 1.5–10 nM of
NADP + NADPH per well.37 These calculated values fit well within
the sensitivity and linear range of the bioluminescent NAD(P)/
NAD(P)H dinucleotide detection assays.
Both assays show robust performance within the broad range of
cell densities (Fig. 3). The ability to use the assays at low cell density
(*500 cells/well) minimizes the potential effect of endogenous
proteins on dinucleotide stability and recovery. The data presented in
Figure 3 show no degradation and efficient recovery of exogenously
added dinucleotides. However, it is important to consider that under
certain experimental conditions, such as high cell number or cells
expressing high amounts of NAD(P)/NAD(P)H producing/consuming
enzymes, the activity of endogenous enzymes can effect dinucleotide
stability and quantitation. In those cases, acid/base extraction of
dinucleotides before addition of NAD(P)/NAD(P)H detection reagents
might be required.
The ability to detect changes directly in cells by a simple addition
of the detection reagent directly to the cells in 384-well plates makes
the assays well suited for HTS screening. Here, we applied the assays
to screen a library of 304 oncology active compounds and identified
compounds whose role in the regulation of the intracellular levels of
nicotinamide adenine dinucleotides have not been previously reported.
The total NAD + NADH and NADP + NADPH levels were decreased in
cells treated with the histone deacetylase inhibitor entinostat and to-
poisomerase I inhibitor Topotecan. Although the direct effects of those
compounds on adenine dinucleotide levels have not been reported, the
possible involvement of their targets, in particular HDACs, in meta-
bolic homeostasis of the cells has been suggested.38–40 In addition to
their classical role as histone deacetylases, HDACs can exhibit deace-
tylase activity in cytosol and mitochondria and therefore play an
important role in regulating the activity of different enzymes, in-
cluding enzymes involved in metabolic pathways.38 The screens also
identified a compound that showed a positive effect on dinucleotide
levels. Raloxifene resulted in a concentration-dependent increase in
total NAD + NADH levels. Raloxifene is a selective estrogen receptor
modulator and has been approved for the treatment of osteoporosis in
postmenopausal women. On the other hand, it has been suggested that
in liver raloxifene can inhibit fatty acid oxidation, acts as a prooxidant
agent, and shifts the redox state of the cells to the oxidized state
resulting in the increase of NAD levels.41
The library used in this work contains compounds against different
target classes with expected effects on a broad range of cellular re-
sponses. Here, we show that the ease of use and robustness of the
described assays make them well suited for screening other libraries,
such as targeted nucleoside based or on the contrary diversified naive
libraries where it can lead to identification of more novel compounds.
In addition, it would be interesting to determine if the compounds
identified in this screen using A549 cells will show similar responses
with other cell types or under different growth conditions. Hypoxic
growth conditions or the use of three dimensional model systems
might be of particular interest since they might better represent
changes in solid tumors.
In conclusion, the sensitivity and large assay windows (S/B > 200)
of the luminogenic dinucleotide assays enable assay performance
Log(Raloxifene), mmM
-2.0 -1.5 -1.0 -0.5 0.0 0.5 1.0 1.5
% C
on
tro
l
6080
100120140160180200220240
CTFCTGNADP+NADPHNAD+NADH
Log(Raloxifene), mM
-2.0 -1.5 -1.0 -0.5 0.0 0.5 1.0 1.5
% C
on
tro
l
60
80
100
120
140
160
180
200
220CTFCTGNADP+NADPHNAD+NADH
A B
Fig. 7. Time-dependent effect of raloxifene on cell viability, ATP, and nicotinamide adenine dinucleotide levels in A549 cells. A549 cells(1,000 cells/25 mL) in 384-well plates were treated with increasing concentrations of raloxifene. After 24 h (A) or 46 h (B), the changes incell viability (C), ATP (B), NAD + NADH (6), and NADP + NADPH(:) were measured as described in the Material and Methods section. Alldata were normalized to control cells in the absence of inhibitor.
VIDUGIRIENE ET AL.
524 ASSAY and Drug Development Technologies NOVEMBER/DECEMBER 2014
with low cell numbers directly in 384-well plates, providing ad-
vantages over currently available colorimetric and fluorescent de-
tection methods. One-step reagent addition and robust performance
(Z0 value > 0.7) makes the assays well suited for HTS application. The
drug effects on NAD + NADH and NADP + NADPH levels can be de-
tected rapidly with the correct pharmacology, facilitating the study of
metabolic pathways and the development of therapeutics that target
cancer cell metabolism.
ACKNOWLEDGMENTSThe work was supported by the Jane and Aatos Erkko Foundation
(to K.W.). The authors thank the FIMM High Throughput Biomedicine
Unit and members of the Promega NAD(P)/NAD(P)H project team for
technical support.
DISCLOSURE STATEMENTJ.V., D.L., M.S., G.V., W.Z., P.M., and J.J.C. are employees of
Promega Corporation.
REFERENCES
1. Nakamura M, Bhatnagar A, Sadoshima J: Overview of pyridine nucleotides
review series. Circ Res 2012;111:604–610.
2. Oka S, Hsu C, Sadoshima J: Regulation of cell survival and death by pyridine
nucleotides. Circ Res 2012;111:611–627.
3. Ussher J, Jaswal J, Lopaschuk G: Pyridine nucleotide regulation of cardiac
intermediary metabolism. Circ Res 2012;111:628–641.
4. Ying W: NAD + /NADH and NADP + /NADPH in cellular functions and cell death:
regulation and biological consequences. Atioxid Redox Signal 2008;10:179–
206.
5. Pollak N, Dolle C, Ziegler M: The power to reduce: pyridine nucleotides–small
molecules with a multitude of functions. Biochem J 2007;402:205–218.
6. Cairns R, Harris I, Mak T: Regulation of cancer cell metabolism. Nat Rev Cancer2011;11:85–95.
7. Xia W, Wang Z, Wang Q, et al.: Roles of NAD/NADH and NADP/NADPH in cell
death. Curr Pharm Des 2009;15:12–19.
8. Jiang F, Zhang Y, Dusting G: NADPH oxidase-mediated redox signaling: roles in
cellular stress response, stress tolerance, and tissue repair. Pharmacol Rev2011;63:218–242.
9. Chiarugi A, Dolle C, Felici R, Ziegler M: The NAD metabolome-a key determinant
of cancer cell biology. Nat Rev Cancer 2012;12:741–752.
10. Houtkooper R, Canto C, Wander J, Auwerx J: The secret life of NAD + : an old
metabolite controlling new metabolic signaling pathways. Endocr Rev 2010;
3:194–223.
11. Berger F, Ramirez-Hernandez MH, Ziegler M: The new life of a centenarian:
signaling functions of nad(p). Trends Biochem Sci 2004;29:111–118.
12. Stein L, Imai S: The dynamic regulation of NAD metabolism in mitochondria.
Trends Endocrinol Metab 2012;23:420–428.
13. Grahnert A, Grahnert A, Klein C, Schilling E, Wehrhahn J, Hauschildt S:
Review: NAD + : a modulator of immune functions. Innate Immun 2011;17:
212–233.
14. Mouchiroud L, Houtkooper R, Auwerx J: NAD + metabolism: A therapeutic
target for age-related metabolic disease. Crit Rev Biochem Mol Biol 2013;48:
397–408.
15. Billard J, Dennison J, Briand J, et al.: Quinoline 3-sulfonamides inhibit lactate
dehydrogenase A and reverse aerobic glycolysis in cancer cells. Cancer Metab2013;1:19.
16. VanderPorten E, Frick L, Turincio R, Thana P, LaMarr W, Liu Y: Label-free high-
throughput assays to screen and characterize novel lactate dehydrogenase
inhibitors. Anal Biochem 2013;441:115–122.
17. Jones A, Hirst J: A spectrophotometric coupled enzyme assay to measure the
activity of succinate dehydrogenase. Anal Biochem 2013;442:19–23.
18. Smith B, Hallows W, Denu J: A continuous microplate assay for sirtuins and
nicotinamide producing enzymes. Anal Biochem 2009;394:101–109.
19. Bird D, Yan L, Vrotsos K, et al.: Metabolic mapping of MCF10A human breast
cells via multiphoton fluorescence lifetime imaging of the coenzyme NADH.
Cancer Res 2005;65:8766–8773.
20. Vergen J, Hecht C, Zholudeva L, et al.: Metabolic imaging using two-photon
excited NADH intensity and fluorescence lifetime imaging. Microsc Micoranal2012;18:761–770.
21. Zhao Y, Jin J, Hu Q, et al.: Genetically encoded fluorescent sensors for
intracellular NADH detection. Cell Metab 2011;14:555–566.
22. Hung Y, Albeck J, Tantama M, Yellen G: Imaging cytosolic NADH-NAD redox
state with a genetically encoded fluorescent biosensor. Cell Metab 2011;14:
545–554.
23. Lorenz M, El Azzouny M, Kennedy R, Burant C: Metabolome response to glucose
in the b-cell line INS-1 832/13. J Biol Chem 2013;288:10923–10935.
24. Trammell S, Brenner C: Targeted, LCMS-based metabolomics for quantitative
measurement of NAD metabolites. Comput Struct Biotechnol J 2013;
4:1–28.
25. Lowry O, Rock M, Schultz D, Passonneau J: Measurement of pyridine
nucleotides by enzymatic cycling. J Biol Chem 1961;236:2746–2755.
26. Graeff R, Lee H: A novel cycling assay for cellular cADP-ribose with nanomolar
sensitivity. Biochem J 2002;361:379–384.
27. Umemura K, Kimura H: Determination of oxidized and reduced nicotinamide
adenine dinucleotide in cell monolayers using a single extraction procedure and
a spectrophotometric assay. Anal Biochem 2005;338:131–135.
28. Zhang J, Chung T, Oldenburg K: A simple statistical parameter for use in
evaluation and validation of high throughput screening assays. J Biomol Screen1999;4:67–73.
29. Iversen PW, Beck B, Chen YF, et al.: HTS Assay Validation. 2012 May 1 [Updated
2012 Oct 1]. In: Sittampalam GS, Gal-Edd N, Arkin M, et al. (eds). Assay
Guidance Manual [Internet]. Bethesda, MD: Eli Lilly & Company and the
National Center for Advancing Translational Sciences; 2004. Available from:
http://www.ncbi.nlm.nih.gov/books/NBK8378326.
30. Pemovska T, Kontro M, Yadav B, et al.: Individualized Systems Medicine (ISM)
strategy to tailor treatments for patients with chemorefractory acute myeloid
leukemia. Cancer Discov 2013;3:1416–1429.
31. Yadav B, Pemovska T, Szwajda A, et al.: Quantitative scoring of differential
drug sensitivity for individually optimized anticancer therapies. Sci Rep 2014;4:
5193.
32. Zhou W, Leippe D, Duellman S, et al.: Self-Immolative bioluminogenic quinone
luciferins for NAD(P)H assays and reducing capacity-based cell viability assays.
Chembiochem 2014;15:670–675.
33. Hasmann M, Schemainda I: FK866, a highly specific noncompetitive inhibitor of
nicotinamide phosphoribosyltransferase, represents a novel mechanism for
induction of tumor cell apoptosis. Cancer Res 2003;63:7436–7442.
34. Garten A, Petzold S, Korner A, Imai S, Kiess W: Nampt: linking NAD biology,
metabolism and cancer. Trends Endocrinol Metab 2008; 20:130–138.
35. Tan B, Young A, Lu Z, et al.: Pharmacological inhibition of nicotinamide
phosphoribosyltransferase (NAMPT), an enzyme essential for NAD biosynthesis,
in human cancer cells: metabolic basis and potential clinical implications. JBC2013;288:3500–3511.
36. Fallah-Sichani M, Honarnejad S, Heiser LM, et al.: Metrics other than potency
reveal systematic variation in responses to cancer drugs. Nat Chem Biol 2013;
9:708–714.
37. Zhao L, Kroenke C, Song J, et al.: Intracellular water-specific MR of microbead-
adherent cells: the Hela cell intracellular water exchange lifetime. NMR Biomed2008;21:159–164.
BIOLUMINESCENT NAD(P)/NAD(P)H ASSAYS
ª MARY ANN LIEBERT, INC. � VOL. 12 NO. 9/10 � NOVEMBER/DECEMBER 2014 ASSAY and Drug Development Technologies 525
38. Karpac J, Jasper H: Metabolic homeostasis: HDACs take center stage. Cell2011;145:497–499.
39. Ye J: Improving insulin sensitivity with HDAC inhibitor. Diabetes 2013;62:685–687.
40. Park S, Leung C, Cheng Y: ATP modulates poly(ADP-ribose) polymerase-1-
facilitated topoisomerase I-linked DNA replication in the presence of
camptothecin. Mol Pharmacol 2008;73:1829–1837.
41. Martins-Maciel ER, Campos LB, Salgueiro-Pagadigorria CL, et al.: Raloxifene
affects fatty acid oxidation in livers from ovariectomized rats by acting as pro-
oxidant agent. Toxicol Lett 2013;217:82–89.
Address correspondence to:
Jolanta Vidugiriene, PhD
Research and Development
Promega Corporation
2800 Woods Hollow Road
Madison, WI 53711
E-mail: [email protected]
Abbreviations Used
CV¼ coefficient of variation
DMSO¼ dimethyl sulfoxide
DSRT¼ drug sensitivity and resistance testing
DSS¼ drug sensitivity score
HTS¼ high-throughput screening
NAD(P)/NAD(P)H¼ used here to denote oxidized and reduced forms
of each redox couple
NAD¼ oxidized form of nicotinamide adenine dinucleotide
NADH¼ reduced form of nicotinamide adenine dinucleotide
NADP¼ oxidized form of nicotinamide adenine dinucleotide
phosphate
NADPH¼ reduced form of nicotinamide adenine dinucleotide
phosphate
PBS¼ phosphate-buffered saline
RLU¼ relative light unit
S/B¼ signal-to-background
S/N¼ signal-to-noise
sDSS¼ selective DSS
VIDUGIRIENE ET AL.
526 ASSAY and Drug Development Technologies NOVEMBER/DECEMBER 2014