Embed Size (px)
Citation preview

Biomarker and Pharmacogenomic Modeling in
Upper GI Cancer: Fantasy or Becoming Reality
Heinz-Josef Lenz
Professor of Medicine and Preventive Medicine
Associate Director, Clinical Research
Kathryn Balakrishnan Chair for Cancer Research
Co-Director, USC Center for Molecular Pathways and Drug Discovery
Co-Leader GI Oncology Program
USC/Norris Comprehensive Cancer Center

Discussion • Pancreas Cancer (4016, 4017,4022)
– SPARC for real and where do we look? (Sinn et al) – PG modeling: The Future is Here (Yu et al)– Early diagnosis using Vit D levels? Let the Sun Shine (Van Loon et al)
• Gastric Cancer (4019, 4020,4021)– Predict the site of recurrence TOP2, CGH, PECAM1: How Important is this
? (Terashima et al) – MAGIC: Will Gene Profiling give us the answer? We need your help
(Smyth et al) – Expand: HER2ve better outcome? Is this true? (Lordick et al)
• Biliary Cancers (4018)– Cetuximab in mutant kras biliary cancers? Need more patients! (Chen et al)


What is SPARC

SPARC in pancreas cancer
Infante et al JCO 2007, vol 25, 319.

Sparc in the Stroma was associated with increased Median overall survival
Von Hoff D D et al. JCO 2011;29:4548-4554©2011 by American Society of Clinical Oncology

Stromal and cytoplasmatic SPARC only in gemcitabine group not Obs

CONKO SPARC
• Sparc is prognostic……predictive? Gemcitabine effect?
• Sparc in the tumor and/or stroma?
• IHC (tissue handling/AB specificity and sensitivity/subjective reading)

Pharmacogenomic Modeling in Pancreatic Cancer, Yu KH, et al.
Pharmacogenomics Modeling
3. Gene expression
profiling
4. PGXAnalysi
s
Drug(s)Gene expression
1. PGx Model
Sensitive to A, not B
Sensitive to B, not A
Resistant to A and B
2. Patients with pancreatic
cancer

Circulating tumor/invasive cells
• Surprisingly, PGx profiling of circulating invasive cell population mirrors tumor tissue
Wilms Tumor
Pharmacogenomic Modeling in Pancreatic Cancer, Yu KH, et al.

Liquid biopsies
CirculatingTumor
Cells (CTC)
http://www.inostics.com/
Tumor specific change (e.g. Mutation)
Tumor
Tumor cellrelease DNA Circulating
tumor DNA
Normal DNA
CTC

Different therapyDifferent therapy
Studies show emergence of KRAS mutations during treatment with EGFR inhibitors
Misale S, et al. Nature 2012;486:532‒536Diaz LA, et al. Nature 2012;486;537‒540
Vilar E, Tabernero J. Nature 2012;486:482‒483
Anti-EGFR therapyAnti-EGFR therapy
KRAS-mutant ctDNA
Other mutant ctDNA
0 4 8 12 16 20 24Weeks of treatment
ctD
NA
leve
ls
Stable disease(by imaging)
Stable disease(by imaging)
Progressive disease(by imaging)
Progressive disease(by imaging)
Blood biopsy
Tumor
Metastatictumor
0 4 8 12 16 20 24

Results
Patients receiving treatment predicted by our model to be effective had longer PFS.
Pharmacogenomic Modeling in Pancreatic Cancer, Yu KH, et al.
n = 24p-value = 0.0073
PPV = 0.87NPV = 0.67
Sensitivity = 0.81Specificity = 0.75
> 6 months < 6 months
13
23
6
Performance of PGx Test
PFS

• Increased sonic hedgehog pathway disruption associated with shorter TTP
• Multiple pathways became more disrupted with progression:
– PI3K pathway– E2F pathway– CREB pathway– PLC E pathway
Pharmacogenomic Modeling in Pancreatic Cancer, Yu KH, et al.
Pathway Analysis

Discussion
• Liquid Biopsies and Genomic Characterization will impact future trials and drug development
• Complete TCGA data need to be analyzed• Dynamic Changes critical for novel Drug
Development • Explant Models but not possible in real time
but CTC are• Prospective Studies needed


Vit D and Pancreas Cancer Vitamin D deficiency (<20 ng/mL) was highly prevalent among patients with a new diagnosis of APC (44.5%).
Black patients had significantly lower 25(OH)D levels than white patients (median 10.7 vs. 22.4 ng/mL). 82.6% of blacks were deficient vs. 40.9% of whites.

Discussion
1.Vit D associated with cancer incidence
2.Vit D key regulators in many pathways (wnt etc)
3.Levels may be important prognostic markers (population based cohorts)
4.Larger Studies needed (ethnicity differences)

Gastric Cancer DISEASE HETEROGENEITY
• Gastric Cancer is not one disease
– Histology (Intestinal vs Diffuse)– Location (Cardia/GEJ vs Antrum)– Biology (MET, CDH1, FGFR others?)– Etiology (H. pylori related, others?)

Deep SequencingKRAS, ERBB2, EGFR, MET, PIK3CA, FGFR2 and AURKA genes in gastric cancer and suggests some of the targeted therapies approved or in clinical development would be of benefit to 11 of the 50 patients studied. The data, also suggests that agents targeting the wnt and hedgehog pathways would be of benefit to a majority of patients. The previously undocumented DNA mutations discovered are likely to affect clinical response to marked therapeutics
and may be good drug targets.Holbroook et al Journal of Translational Medicine 2011

(A) Focal regions exhibiting mutually exclusive patterns of genome amplification. (B) Focal regions exhibiting
patterns of genomic co-amplification
Deng et al 2012 BMJ


Presented by:
Identifying Biomarkers for local recurrence: Overlap of first recurrence site of 829 patients (from 1059 pts in the ACTS-GC trial)
Lymph-node recurrence
Peritoneal recurrenceHematogenous recurrence
45
8
118 76
16
10
3
*) Local (L) & Peritoneal(P); n=3, L & Lymph(Ly); n=3, L & H; n=3, L & Ly & H; n=1, L alone; n= 15

Presented by:
Results (RT-PCR candidates and low density array, DISH (her2), IHC and Kras status)
1) TOP2A significantly correlated with hematogenous recurrence. Hematogenous RFS was significantly worse in TOP2A-high patients than in TOP2A-low patients (HR, 2.35; 95% CI, 1.55-3.57).
2) GGH significantly correlated with lymph-node recurrence. Lymph-node RFS was significantly worse in GGH-high patients than in GGH-low patients (HR, 1.87; 95% CI,1.13-3.08).
3) PECAM1 significantly correlated with peritoneal recurrence. Peritoneal RFS was significantly worse in PECAM1-high patients than in PECAM1-low patients (HR, 2.37: 95% CI, 1.65-3.41).

GGH expression in breast cancer associated with OS
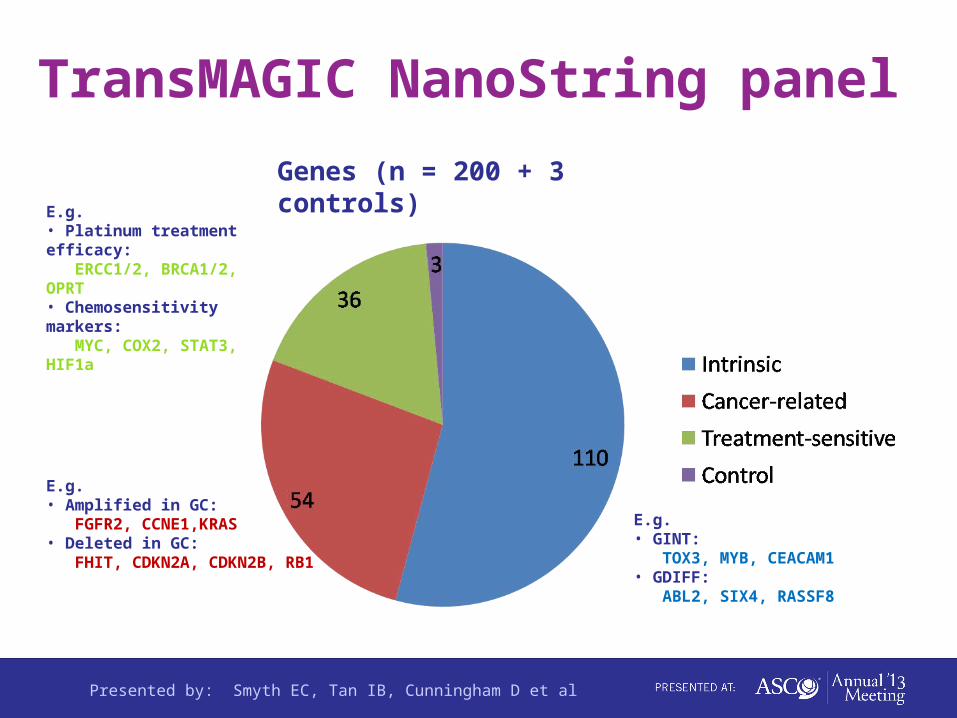
TransMAGIC NanoString panel
E.g. • Platinum treatment efficacy: ERCC1/2, BRCA1/2, OPRT• Chemosensitivity markers: MYC, COX2, STAT3, HIF1a
E.g. • Amplified in GC: FGFR2, CCNE1,KRAS• Deleted in GC: FHIT, CDKN2A, CDKN2B, RB1
E.g. • GINT: TOX3, MYB, CEACAM1• GDIFF: ABL2, SIX4, RASSF8
Genes (n = 200 + 3 controls)
Presented by: Smyth EC, Tan IB, Cunningham D et al

Overall survival from time of surgery in years Chemotherapy Surgery alone Overall
ERBB2 normal ERBB2 high ERBB2 normal ERBB2 high ERBB2 normal ERBB2 highPatients 80 9 104 16 184 25Events 55 2 74 12 129 14
Median survival 1.45 Not reached 1.57 1.59 1.56 2.32Logrank p-value 0.0197 0.5761 0.2317
Hazard ratio 1 (REF) 0.22 1 (REF) 1.19 1 (REF) 0.72HR p-value 0.034 0.577 0.234
TransMAGIC NanoString RTK survival analysis: ERBB2
There is some evidence of an interaction between treatment arm and ERBB2 (p=0.027); reflecting very high survival rates amongst the small group of patients on the chemotherapy arm with ERBB2 overexpression.
Presented by: Smyth EC, Tan IB, Cunningham D et al
0.00
0.25
0.50
0.75
1.00
Pro
port
ion
surv
ivin
g
0 2 4 6 8Years from surgery
erbb2 = 1 erbb2 = 2
Survival by erbb2 (chemo pats)
0.00
0.25
0.50
0.75
1.00
Pro
port
ion
surv
ivin
g
0 2 4 6 8Years from surgery
erbb2 = 1 erbb2 = 2
Survival by erbb2 (surgery pats)
0.00
0.25
0.50
0.75
1.00
Pro
port
ion
surv
ivin
g
0 2 4 6 8Years from surgery
erbb2 = 1 erbb2 = 2
Survival by erbb2 (all pats)Survival by ERBB2 (chemo pts) Survival by ERBB2 (surgery pts) Survival by ERBB2 (all pts)

EXPAND Study Her2ve- has significant shorter OS (HR 1.55)Her2ve- response was significantly lower (OR 0.48)
Cet, cetuximab; CT, chemotherapy
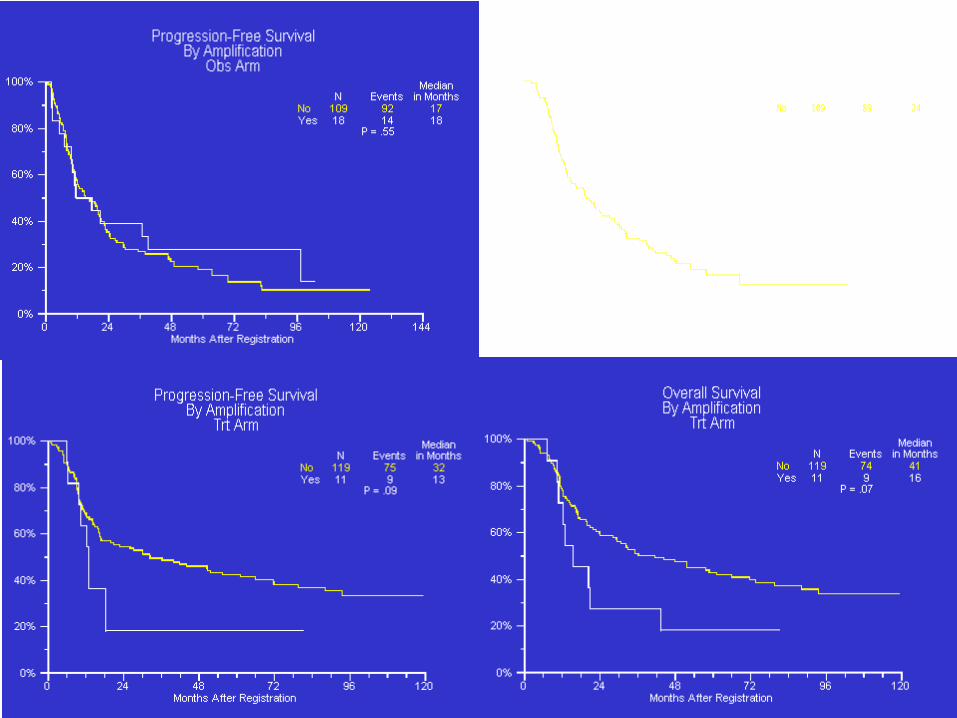
Overall SurvivalBy Amplification
Obs Arm
0%
20%
40%
60%
80%
100%
0 24 48 72 96 120 144Months After Registration
NoYes
N10918
Events8914
Medianin Months
2424
P = .71

0.00
0.25
0.50
0.75
1.00
Pro
port
ion
surv
ivin
g
0 2 4 6 8Years from surgery
egfr = 1 egfr = 2
Survival by egfr (chemo pats)
0.00
0.25
0.50
0.75
1.00
Pro
port
ion
surv
ivin
g
0 2 4 6 8Years from surgery
egfr = 1 egfr = 2
Survival by egfr (surgery pats)
0.00
0.25
0.50
0.75
1.00
Pro
port
ion
surv
ivin
g
0 2 4 6 8Years from surgery
egfr = 1 egfr = 2
Survival by egfr (all pats)Survival by EGFR (chemo pts) Survival by EGFR (surgery pts) Survival by EGFR (all pts)
Overall survival from time of surgery in years Chemotherapy Surgery alone Overall
EGFR normal EGFR high EGFR normal EGFR high EGFR normal EGFR highPatients 83 6 115 5 198 11Events 52 5 83 3 135 8
Median survival 1.83 0.53 1.59 0.59 1.63 0.59Logrank p-value 0.0650 0.4403 0.0772
Hazard ratio 1 (REF) 2.33 1 (REF) 1.57 1 (REF) 1.89HR p-value 0.073 0.444 0.082
TransMAGIC NanoString RTK survival analysis: EGFR
EGFR normal = EGFR high =
EGFR was overexpressed in 11 patients; their prognosis was poorer in both treatment arms, there is no evidence of an interactionbetween treatment arm and EGFR (p=0.601).
Presented by: Smyth EC, Tan IB, Cunningham D et al

Discussion • Her family needs to be evaluated her1-4
(IHC+/- FISH)
• TOP2A co amplified with her2
• Unknown if prognostic (treatment effect)

Clinical Trials in Biliary Cancer using EGFR/VEGF/MEK inhibitors

Presented by: Chen et al.
Unresectable, locally advanced or metastatic BTC
Stratification:ECOG PS: 0 versus 1
KRAS: wt versus mutantIntra- versus extra-hepatic
Gemcitabine 800 mg/m2
Oxaliplatin 85 mg/m2
Q 2 weeks
Cetuximab 500 mg/m2
Gemcitabine 800 mg/m2
Oxaliplatin 85 mg/m2
Q 2 weeks
N=60 N=62
Primary EP: ORR,C-GEMOX 30% vs GEMOX 20%, (=0.2/=0.5)Secondary EP: DCR≥16 weeks, PFS, OS, Safety & Biomarker
R
Randomized, Phase II GEMOX ± Cetuximab in Advanced BTC: TCOG T1210 - Schema
35

Presented by: Chen et al.
Randomized, Phase II GEMOX ± Cetuximab in Advanced BTC: comparing therapeutic outcome of treatment arms in KRAS mutation status-stratified subpopulations
36

Discussion• Too small to draw any conclusions (RR, PFS
and OS consistent with previous studies) • Kras spectrum may be critical • Braf mutations are important for biliary cancer • No detremental effect of Cetuximab in these
patients • Previous trial negative for Cetuximab
combinations

We have a Future There is Light on the end of
the Tunnel • Completion of TCGA for Gastric, Pancreas and
Hepatobiliary Cancers
• Liquid Biopsies CTC/tumor DNA reflect pathway changes under therapy
• Biomarker/PG Modeling Driven Trials (based on mutation and gene expression data e.g. SPARC, FGFR….)
• International Collaborations to move science forward