Embed Size (px)
Citation preview
1
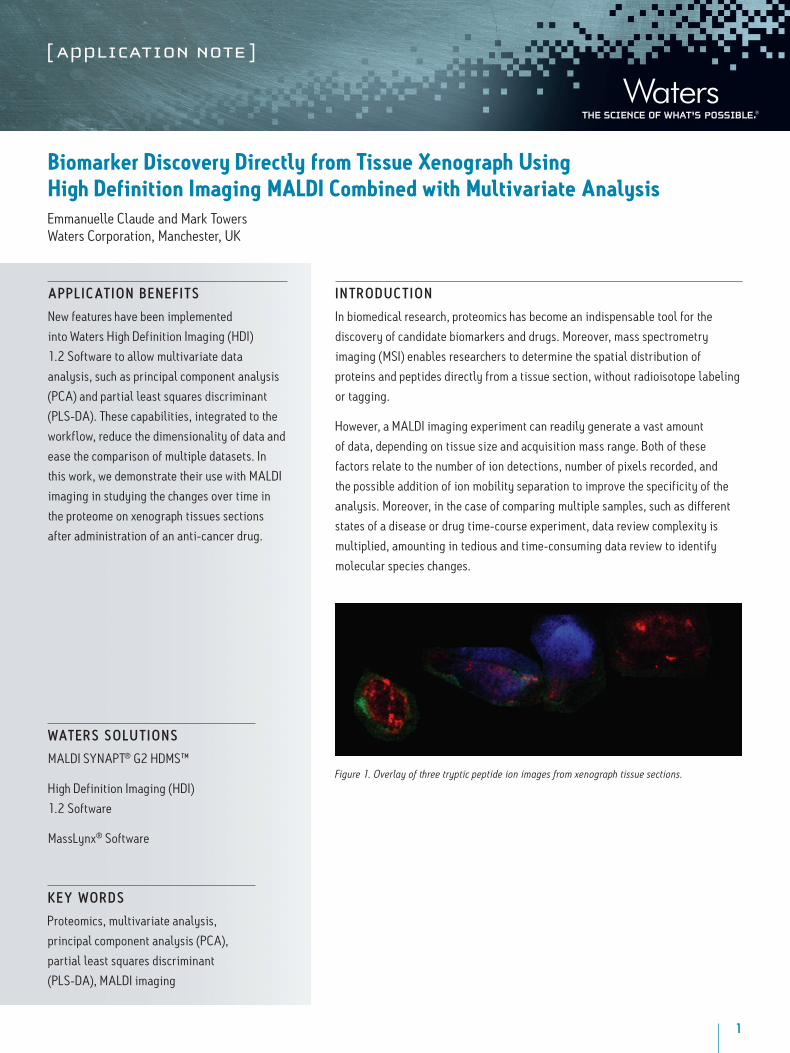
Biomarker Discovery Directly from Tissue Xenograph Using High Definition Imaging MALDI Combined with Multivariate AnalysisEmmanuelle Claude and Mark TowersWaters Corporation, Manchester, UK
IN T RO DU C T IO N
In biomedical research, proteomics has become an indispensable tool for the
discovery of candidate biomarkers and drugs. Moreover, mass spectrometry
imaging (MSI) enables researchers to determine the spatial distribution of
proteins and peptides directly from a tissue section, without radioisotope labeling
or tagging.
However, a MALDI imaging experiment can readily generate a vast amount
of data, depending on tissue size and acquisition mass range. Both of these
factors relate to the number of ion detections, number of pixels recorded, and
the possible addition of ion mobility separation to improve the specificity of the
analysis. Moreover, in the case of comparing multiple samples, such as different
states of a disease or drug time-course experiment, data review complexity is
multiplied, amounting in tedious and time-consuming data review to identify
molecular species changes.
WAT E R S SO LU T IO NS
MALDI SYNAPT® G2 HDMS™
High Definition Imaging (HDI)
1.2 Software
MassLynx® Software
K E Y W O R D S
Proteomics, multivariate analysis,
principal component analysis (PCA),
partial least squares discriminant
(PLS-DA), MALDI imaging
A P P L I C AT IO N B E N E F I T S
New features have been implemented
into Waters High Definition Imaging (HDI)
1.2 Software to allow multivariate data
analysis, such as principal component analysis
(PCA) and partial least squares discriminant
(PLS-DA). These capabilities, integrated to the
workflow, reduce the dimensionality of data and
ease the comparison of multiple datasets. In
this work, we demonstrate their use with MALDI
imaging in studying the changes over time in
the proteome on xenograph tissues sections
after administration of an anti-cancer drug.
Figure 1. Overlay of three tryptic peptide ion images from xenograph tissue sections.
2Biomarker Discovery Directly from Tissue Xenograph Using High Definition Imaging MALDI Combined with Multivariate Analysis
E X P E R IM E N TA L
Conditions
Data acquisition
System: MALDI SYNAPT G2
HDMS, positive mode
Mass range: 600-3,000 Da
Laser: 1 KHz solid state
Nd:YAG laser
(λ = 355 nm)
Spatial resolution: 150 µm (lateral)
Data management
The obtained data were processed and
visualised using HDI MALDI 1.2 Software.
Regions of interest (ROIs) information were
analysed using EZInfo (Umetrics Software).
MassLynx Software was also utilized.
Sample description
Four rats were injected subcutaneously with a cancer cell line to allow the growth
of tumor mass, called a xenograph. The animals were administrated with the anti-
cancer drug Dasanitib at a concentration of 30 mg/kg and scarified at different
time points (control, 1, 3, and 6 hours). After tumour excision, frozen tissue
sections from each animal were thaw-mounted onto a single glass slide. Tissue
samples were washed with different baths of cold ethanol and chloroform. In situ
trypsin digestion was performed by spraying a solution of trypsin directly onto
the tissue and incubating overnight in a humidity chamber at 37 °C.
Post-digestion, several layers of matrix, α-cyano-4-hydroxicinnamic acid (CHCA)
containing aniline in acetonitrile/water/TFA (1:1:0,1), were also sprayed directly
onto the tissue samples. A single jpeg image of the four tissue sections mounted
on the glass slide was taken using a flatbed scanner. Using High Definition
Imaging (HDI) MALDI software, the visual image was co-registered, and areas to
be imaged by MSI were defined. This allowed the overlay of the MS information
and the visual image later in the analysis (Figure 2A).
3Biomarker Discovery Directly from Tissue Xenograph Using High Definition Imaging MALDI Combined with Multivariate Analysis
R E SU LT S A N D D IS C U S S IO N
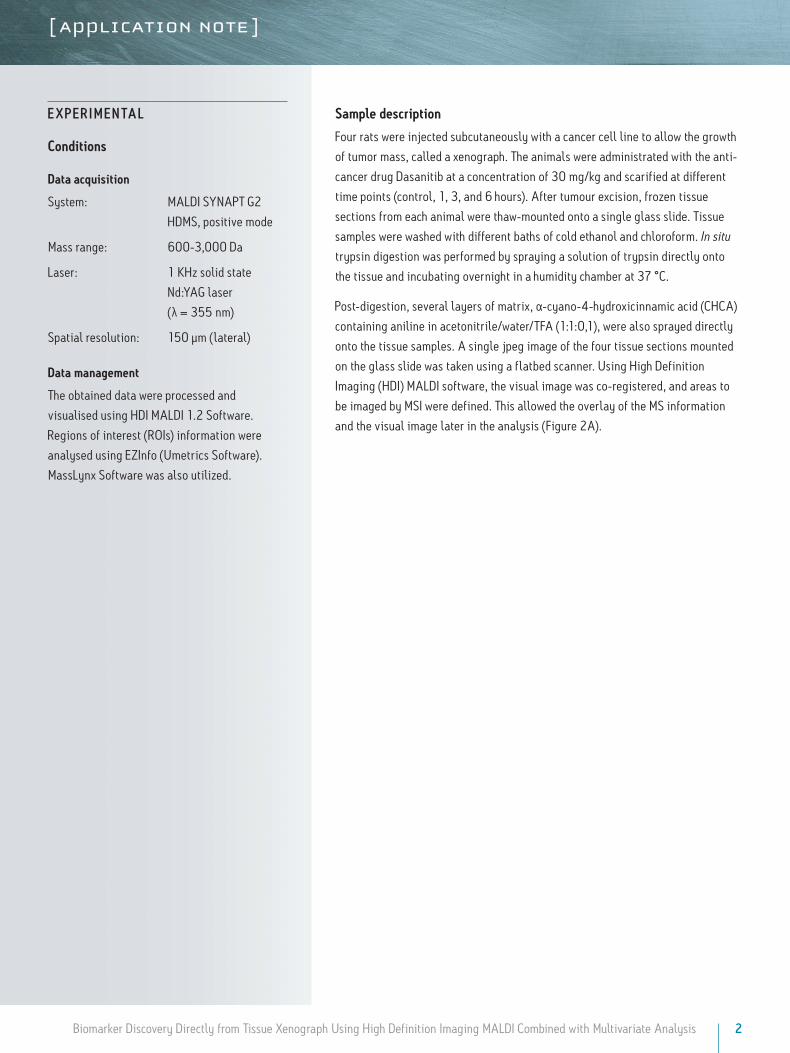
Figure 2A represents the processed data loaded in the Analysis tab of HDI Software. It is possible to define one
or several regions of interest (ROIs) on the four tissue sections as shown in Figure 2B. The ROIs can be drawn
using the free draw tool, eclipse (or round), and rectangle (square) options.
By clicking on the Umetrics icon as shown in Figure 2B, the intensities for each entry (m/z, dt) present in the
processed data are averaged and TIC normalized across the pixels present within each defined ROI. The output
is reported in a csv file (Figure 2C). EZInfo can be launched directly from MassLynx Software by clicking on the
Extended Statistics icon (Figure 2D). The output txt file is loaded in EZinfo where the different groups can be
specified, as seen in Figure 2D).
A) B)
C)D)
Figure 2. Workflow with A) MALDI imaging processed data loaded in HDI; B) Multiple ROIs drawn for each tissue section; C) Average normalized intensities calculated; D) View of the csv matrix where intensities are reported for each entry (m/z, dt) and ROI - EZinfo is launched directly from MassLynx Software.
4Biomarker Discovery Directly from Tissue Xenograph Using High Definition Imaging MALDI Combined with Multivariate Analysis
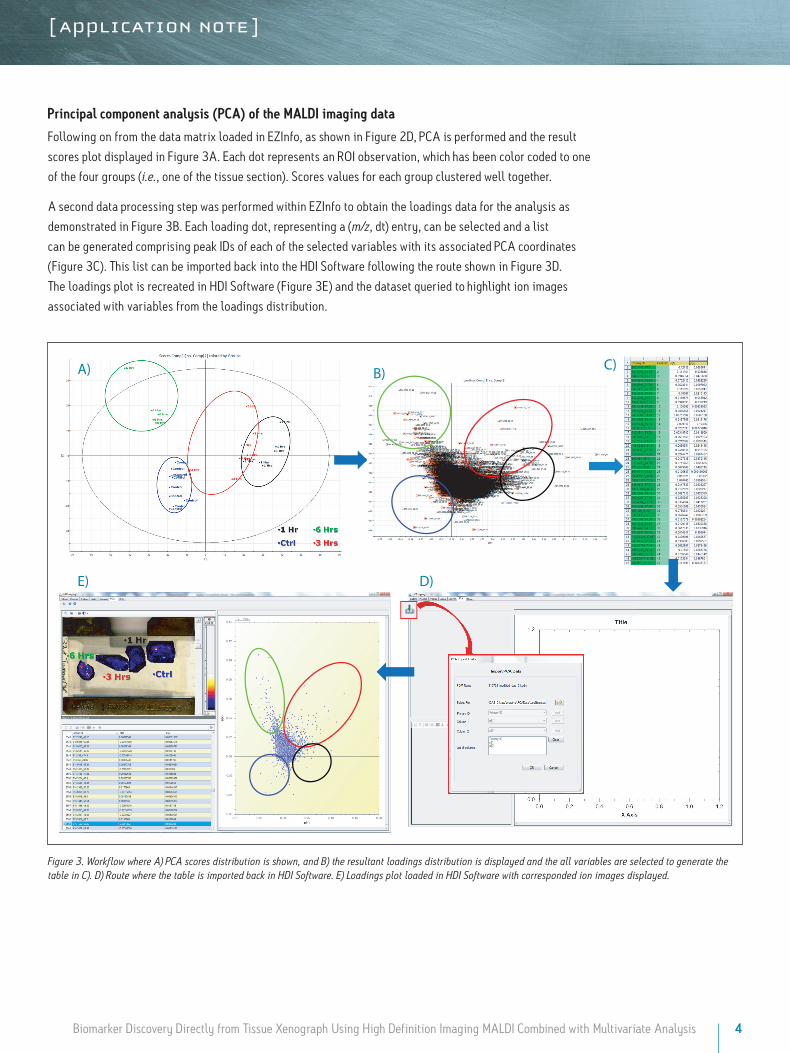
Principal component analysis (PCA) of the MALDI imaging data
Following on from the data matrix loaded in EZInfo, as shown in Figure 2D, PCA is performed and the result
scores plot displayed in Figure 3A. Each dot represents an ROI observation, which has been color coded to one
of the four groups (i.e., one of the tissue section). Scores values for each group clustered well together.
A second data processing step was performed within EZInfo to obtain the loadings data for the analysis as
demonstrated in Figure 3B. Each loading dot, representing a (m/z, dt) entry, can be selected and a list
can be generated comprising peak IDs of each of the selected variables with its associated PCA coordinates
(Figure 3C). This list can be imported back into the HDI Software following the route shown in Figure 3D.
The loadings plot is recreated in HDI Software (Figure 3E) and the dataset queried to highlight ion images
associated with variables from the loadings distribution.
A) B) C)
D)E)
Figure 3. Workflow where A) PCA scores distribution is shown, and B) the resultant loadings distribution is displayed and the all variables are selected to generate the table in C). D) Route where the table is imported back in HDI Software. E) Loadings plot loaded in HDI Software with corresponded ion images displayed.
5Biomarker Discovery Directly from Tissue Xenograph Using High Definition Imaging MALDI Combined with Multivariate Analysis
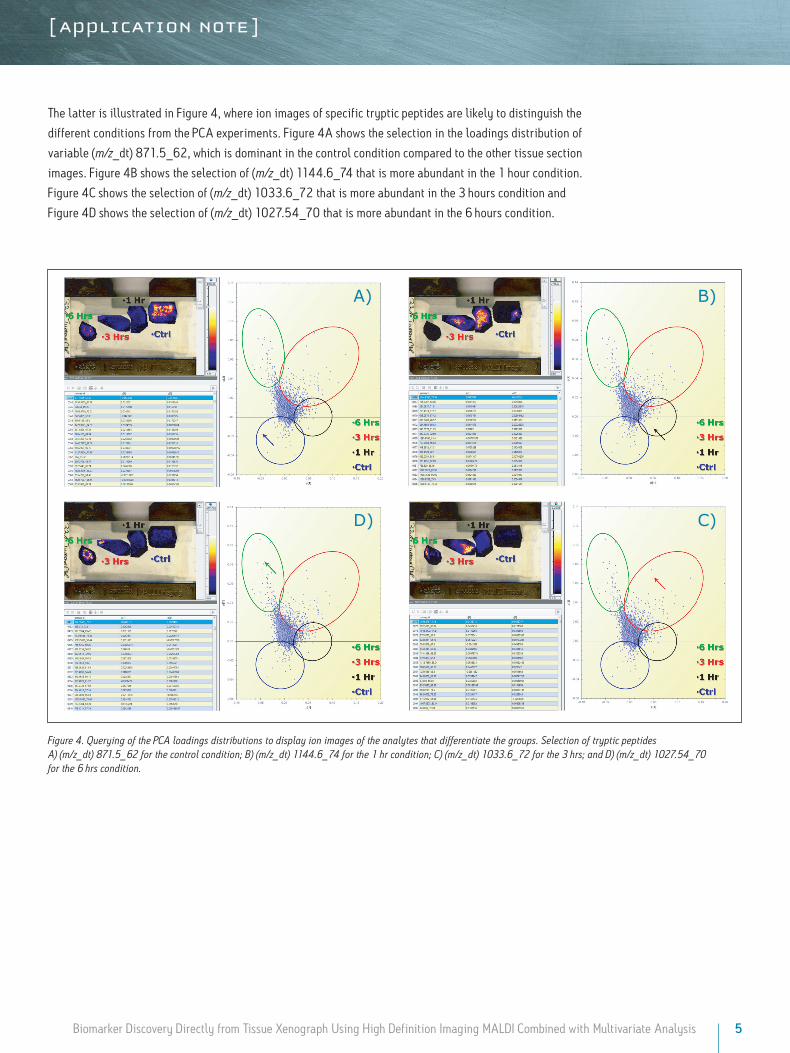
The latter is illustrated in Figure 4, where ion images of specific tryptic peptides are likely to distinguish the
different conditions from the PCA experiments. Figure 4A shows the selection in the loadings distribution of
variable (m/z_dt) 871.5_62, which is dominant in the control condition compared to the other tissue section
images. Figure 4B shows the selection of (m/z_dt) 1144.6_74 that is more abundant in the 1 hour condition.
Figure 4C shows the selection of (m/z_dt) 1033.6_72 that is more abundant in the 3 hours condition and
Figure 4D shows the selection of (m/z_dt) 1027.54_70 that is more abundant in the 6 hours condition.
A) B)
C)D)
Figure 4. Querying of the PCA loadings distributions to display ion images of the analytes that differentiate the groups. Selection of tryptic peptides A) (m/z_dt) 871.5_62 for the control condition; B) (m/z_dt) 1144.6_74 for the 1 hr condition; C) (m/z_dt) 1033.6_72 for the 3 hrs; and D) (m/z_dt) 1027.54_70 for the 6 hrs condition.
6Biomarker Discovery Directly from Tissue Xenograph Using High Definition Imaging MALDI Combined with Multivariate Analysis
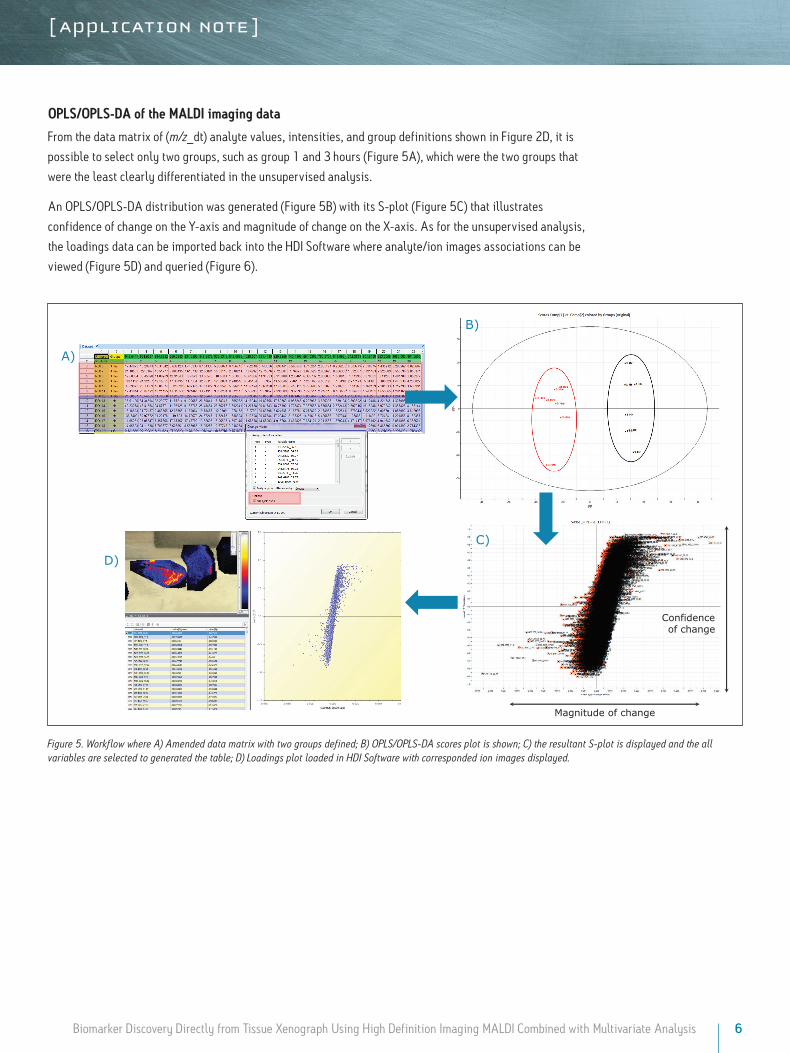
OPLS/OPLS-DA of the MALDI imaging data
From the data matrix of (m/z_dt) analyte values, intensities, and group definitions shown in Figure 2D, it is
possible to select only two groups, such as group 1 and 3 hours (Figure 5A), which were the two groups that
were the least clearly differentiated in the unsupervised analysis.
An OPLS/OPLS-DA distribution was generated (Figure 5B) with its S-plot (Figure 5C) that illustrates
confidence of change on the Y-axis and magnitude of change on the X-axis. As for the unsupervised analysis,
the loadings data can be imported back into the HDI Software where analyte/ion images associations can be
viewed (Figure 5D) and queried (Figure 6).
A)
B)
C)
D)
Magnitude of change
Confidence of change
Figure 5. Workflow where A) Amended data matrix with two groups defined; B) OPLS/OPLS-DA scores plot is shown; C) the resultant S-plot is displayed and the all variables are selected to generated the table; D) Loadings plot loaded in HDI Software with corresponded ion images displayed.
7Biomarker Discovery Directly from Tissue Xenograph Using High Definition Imaging MALDI Combined with Multivariate Analysis
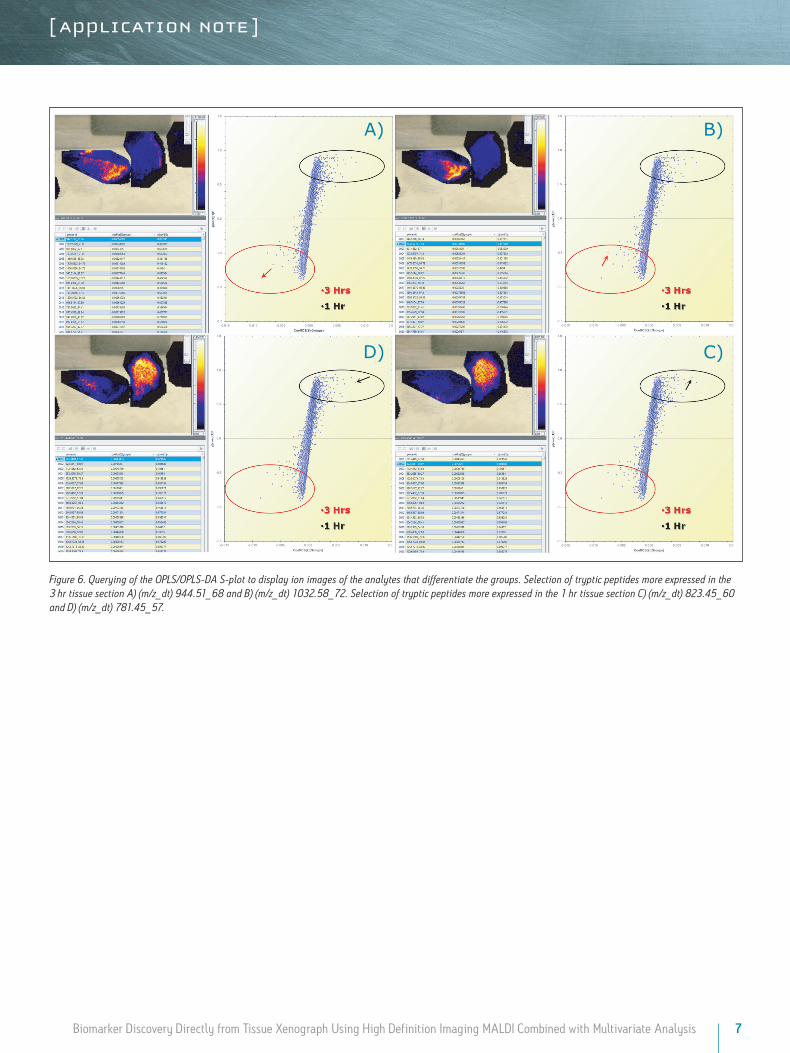
Figure 6. Querying of the OPLS/OPLS-DA S-plot to display ion images of the analytes that differentiate the groups. Selection of tryptic peptides more expressed in the 3 hr tissue section A) (m/z_dt) 944.51_68 and B) (m/z_dt) 1032.58_72. Selection of tryptic peptides more expressed in the 1 hr tissue section C) (m/z_dt) 823.45_60 and D) (m/z_dt) 781.45_57.
A) B)
C)D)
Waters Corporation 34 Maple Street Milford, MA 01757 U.S.A. T: 1 508 478 2000 F: 1 508 872 1990 www.waters.com
CO N C LU S IO NS ■■ High Definition Imaging (HDI) Software allows supervised
and unsupervised multivarariant analysis on complex
multidimensional imaging datasets.
■■ Multiple statistical analyses can be carried out on the same
dataset, including PCA, PLS-DA, and OPLS/OPLS-DA.
■■ Full integration of the multivarariant analysis results in the
HDI Software linked to ions images.
■■ The interrogation of the data is therefore greatly speeded up
and simplified compared to manual mining of the data.
Waters, T he Science of What’s Possible, SYNAPT, and MassLynx are registered trademarks of Waters Corporation. HDMS is a trademark of Waters Corporation. All other trademarks are the property of their respective owners.
©2013 Waters Corporation. Produced in the U.S.A.November 2013 720004873EN AG-PDF