Embed Size (px)
Citation preview
BIOMARKERS FOR THE PREDICTION OF INCIDENT
CORONARY HEART DISEASE IN THE MESA COHORT
by
Zada Charissa Marie Mohammed
A thesis submitted to Johns Hopkins University in conformity with the requirements for the
degree of Master of Health Science.
Baltimore, Maryland
May, 2015
All Rights Reserved
ii
Abstract
Introduction
Heart disease is the leading cause of death in the United States. Biomarkers have been integral to
the advancement of preventive cardiology. They have been used to understand the mechanisms
of heart disease, and have gone from merely being used in the diagnosis of disease to being
important in predicting risk.
This study examined the association between biomarkers and cardiovascular events, and sought
to identify which biomarkers would be best improve predictions of such events. Heterogeneity
by sex and race on these associations were also examined.
Methods
In a prospective multi-ethnic study of men and women ages 45 to 84 years old without baseline
clinical cardiovascular disease, the associations between eight biomarkers and incident coronary
heart disease (CHD) were determined by Cox Regression. Tests for heterogeneity by race and by
sex were performed. Models containing traditional risk factors were compared to those
containing biomarkers to assess the discriminatory and predictive powers of adding biomarkers to
the model.
Results
Among 5914 participants, the incident rate of CHD was 7.0 cases per 1000 person-years. After
adjustment for the traditional risk factors of heart disease, three biomarkers were found to have
significant associations with incident CHD –mean Agatston calcium score (adjusted hazard ratio
= 1.0009 per one Agatston unit increase, 95% C.I.: 1.0006 - 1.001), urinary albumin (adjusted
hazard ratio = 1.0025 per 1 mg/dL urinary albumin increase, 95% C.I: 1.0003 - 1.0048), and
fibrinogen (adjusted hazard ratio = 1.003 per 1mg/dL fibrinogen increase, 95% C.I.: 1.001 –
iii
1.004). Generally, the addition of biomarkers to traditional risk factor models improved model fit
and the predictive power of the models, with the inclusion of mean Agatston calcium score and
fibrinogen antigen showing the greatest improvement in model prediction.
Conclusions
In a cohort characterized by ethnic diversity, increasing coronary calcium, fibrinogen, and urinary
albumin were found to be significantly associated with incident CHD. Prognostic models for
CHD containing biomarkers had better predictive power than models containing only traditional
risk factors. Therefore, when developing models for predicting heart disease, researchers may
want to consider including biomarkers as they improve the discrimination afforded by current
heart disease risk factors.
Readers: Dr. Moyses Szklo (advisor) and Dr. Wendy Post
iv
Acknowledgements
I would like to thank my readers, Dr. Moyses Szklo and Dr. Wendy Post, for their time, guidance,
and support. I would also like to thank the Coordinating Center of the Multi-Ethnic Study of
Atherosclerosis (MESA) for granting me permission to use MESA data for my thesis, and I
would like to thank the investigators, the staff, and the participants of MESA for their valuable
contributions.
Finally, I would like to express my deepest gratitude to my family, for the love and
encouragement they provided me through my entire life.
v
Table of Contents
Abstract ............................................................................................................................................ ii
Acknowledgements ......................................................................................................................... iv
Table of Contents ............................................................................................................................. v
List of Tables .................................................................................................................................. vi
List of Figures ................................................................................................................................ vii
Introduction ...................................................................................................................................... 1
Background and Significance ...................................................................................................... 1
Objective ...................................................................................................................................... 2
Methods ........................................................................................................................................... 3
Study Design and Participants ..................................................................................................... 3
Variables ...................................................................................................................................... 4
Primary Outcome and Outcome Ascertainment .......................................................................... 7
Statistical Analysis ....................................................................................................................... 8
Results ............................................................................................................................................ 10
Baseline Characteristics ............................................................................................................. 10
Survival and Regression Analyses ............................................................................................. 12
Discussion ...................................................................................................................................... 21
Strengths .................................................................................................................................... 25
Limitations ................................................................................................................................. 25
Public Health Impact.................................................................................................................. 26
References ...................................................................................................................................... 27
Appendices ................................................................................................................................. 27
Bibliography .............................................................................................................................. 35
Curriculum Vitae ........................................................................................................................... 38
vi
List of Tables
Table 1: Demographic Characteristics at baseline, Multi-Ethnic Study of Atherosclerosis, 2000-
2002. .............................................................................................................................................. 11
Table 2: Biomarker Concentrations at baseline, Multi-Ethnic Study of Atherosclerosis, 2000-
2002. .............................................................................................................................................. 12
Table 3: Incidence Rates by Age, Sex, and Race/ Ethnicity, Multi-Ethnic Study of
Atherosclerosis. .............................................................................................................................. 13
Table 4: Hazard Ratios from Univariate Cox Regression, Multi-Ethnic Study of Atherosclerosis
....................................................................................................................................................... 14
Table 5: P-values for Tests for Heterogeneity, Multi-Ethnic Study of Atherosclerosis ................ 15
Table 6: Hazard Ratios from Multivariable Cox Regression, Multi-Ethnic Study of
Atherosclerosis ............................................................................................................................... 16
Table 7: Hazard Ratios Stratified by Sex, Multi-Ethnic Study of Atherosclerosis ........................ 17
Table 8: Hazard Ratios Stratified by Race/Ethnicity, Multi-Ethnic Study of Atherosclerosis ...... 19
Table 9: Comparison of Model Fit and Predictive Power between Traditional Risk Factor and
Biomarker Models ......................................................................................................................... 20
Table 10: Correlation Coefficients ................................................................................................. 29
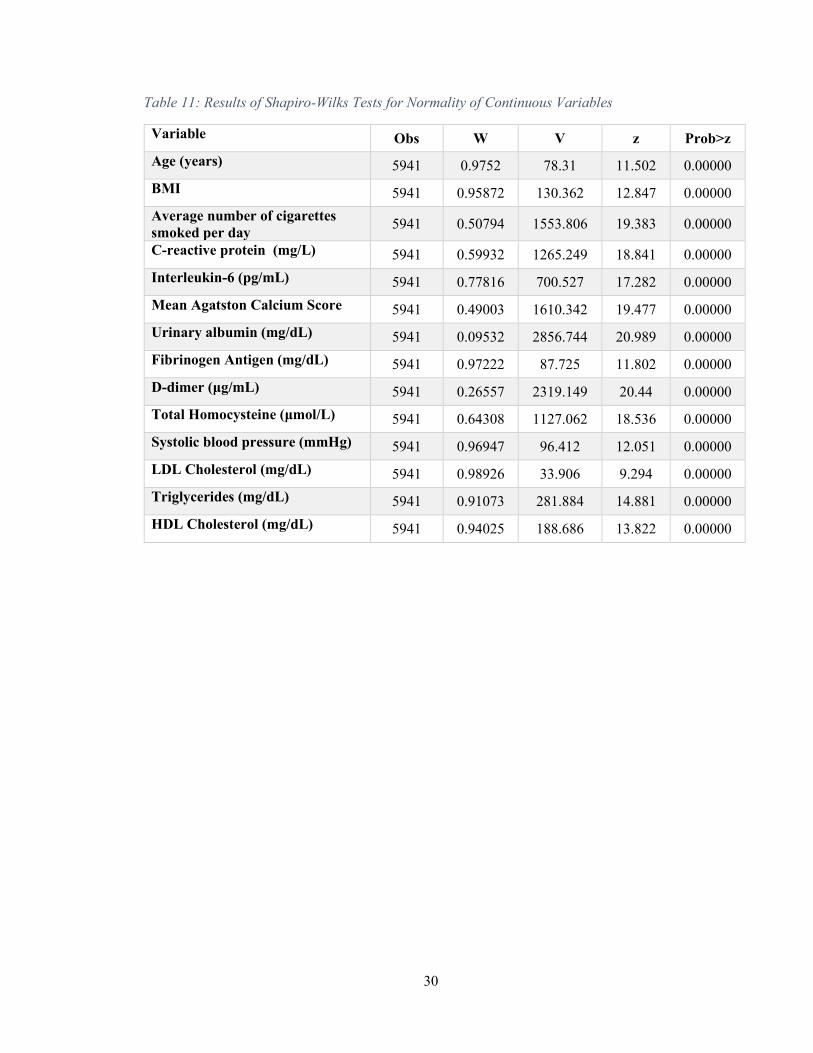
Table 11: Results of Shapiro-Wilks Tests for Normality of Continuous Variables ....................... 30
vii
List of Figures
Figure 1: Boxplots of Age, Urinary Albumin, BMI, CRP, Mean Agatston Calcium Score, and D-
dimer by Incident CHD. ................................................................................................................. 27
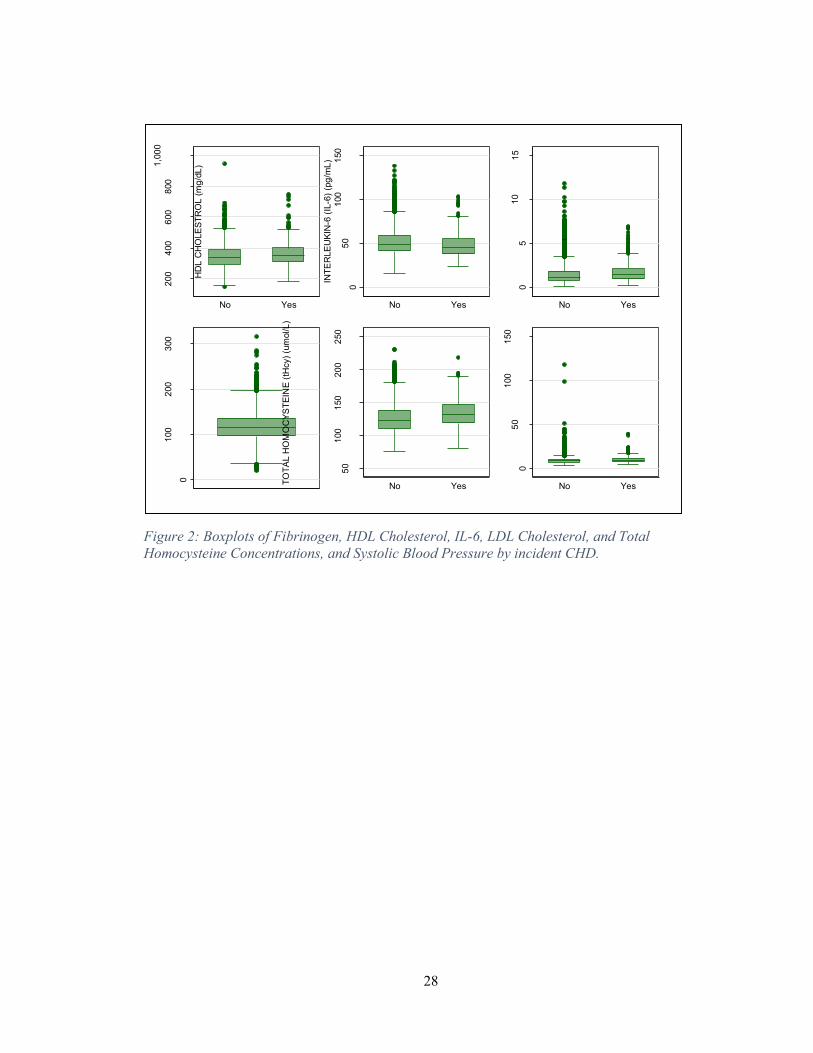
Figure 2: Boxplots of Fibrinogen, HDL Cholesterol, IL-6, LDL Cholesterol, and Total
Homocysteine Concentrations, and Systolic Blood Pressure by incident CHD. ........................... 28
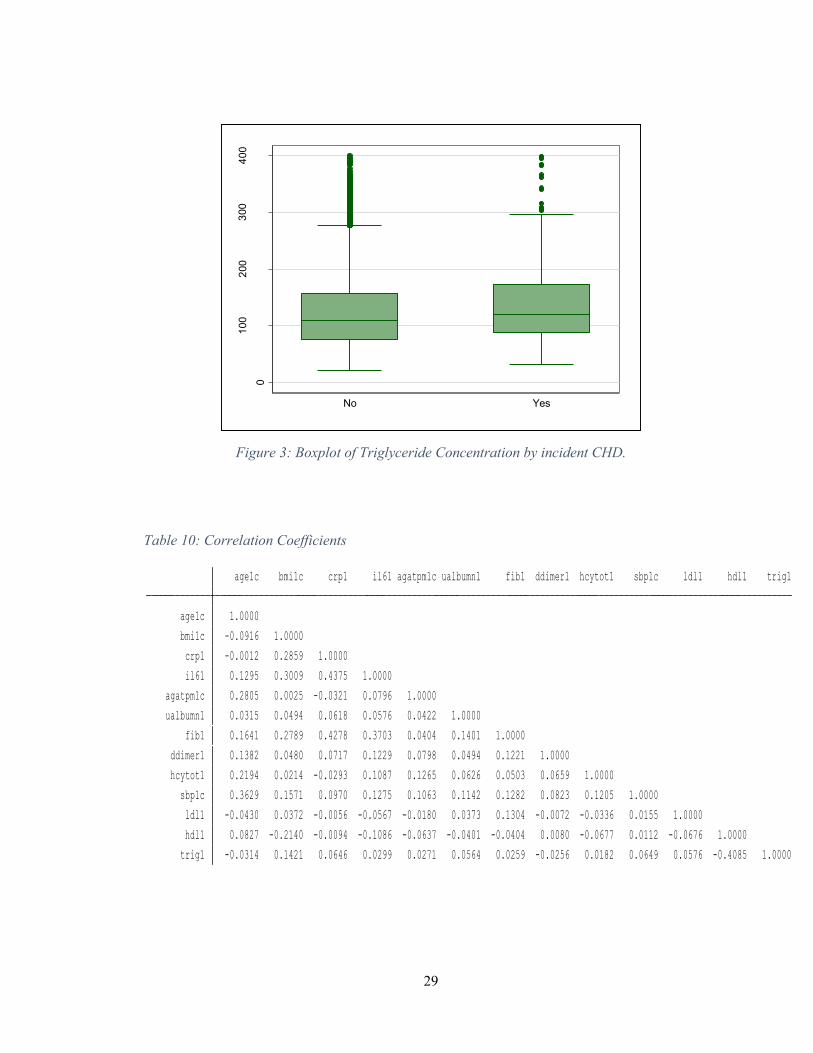
Figure 3: Boxplot of Triglyceride Concentration by incident CHD. ............................................. 29
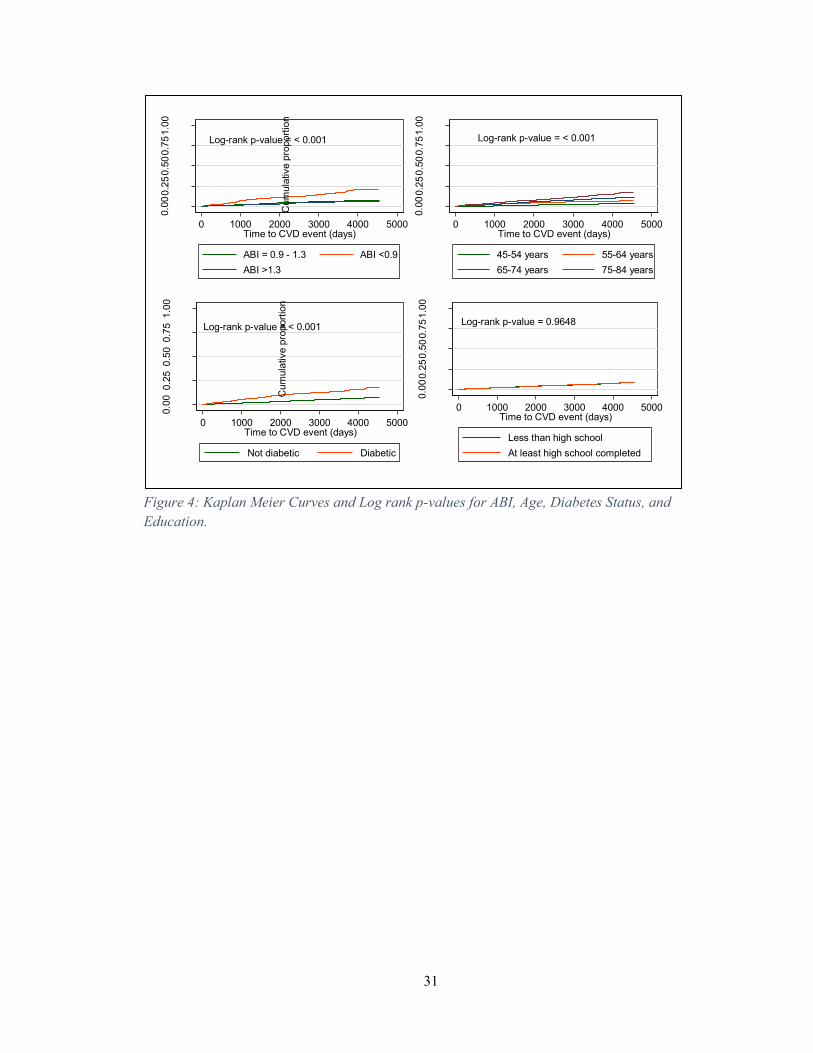
Figure 4: Kaplan Meier Curves and Log rank p-values for ABI, Age, Diabetes Status, and
Education. ...................................................................................................................................... 31
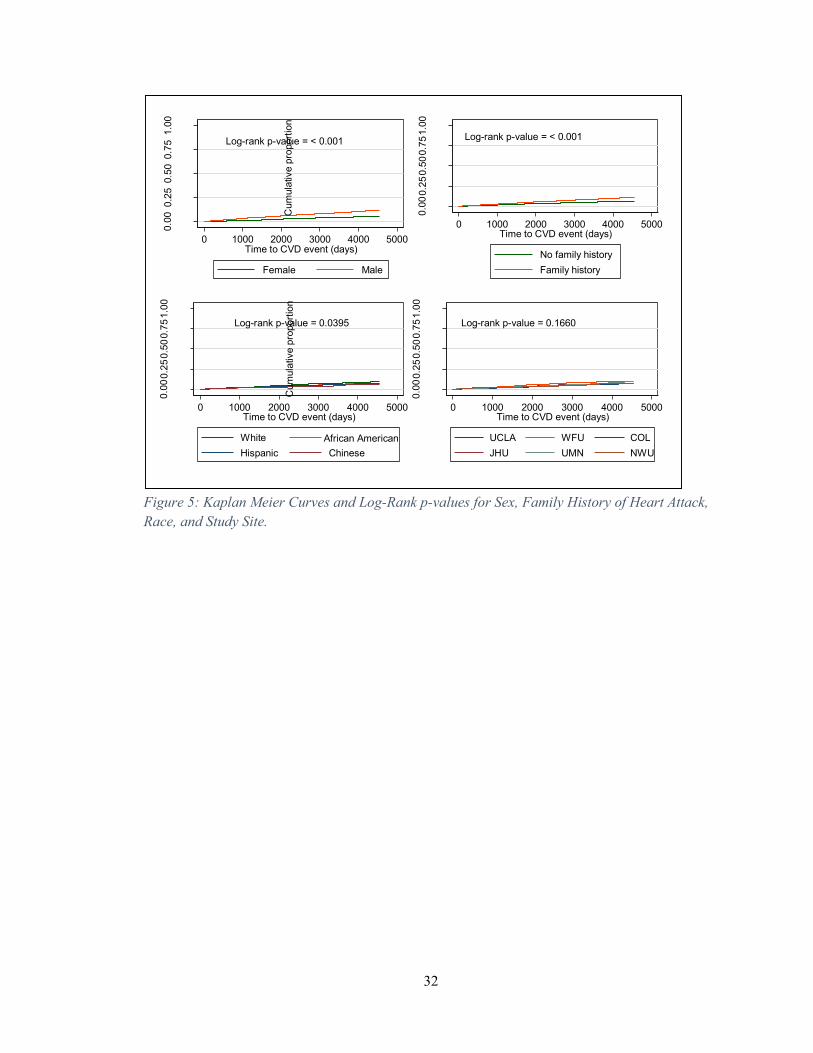
Figure 5: Kaplan Meier Curves and Log-Rank p-values for Sex, Family History of Heart Attack,
Race, and Study Site. ..................................................................................................................... 32
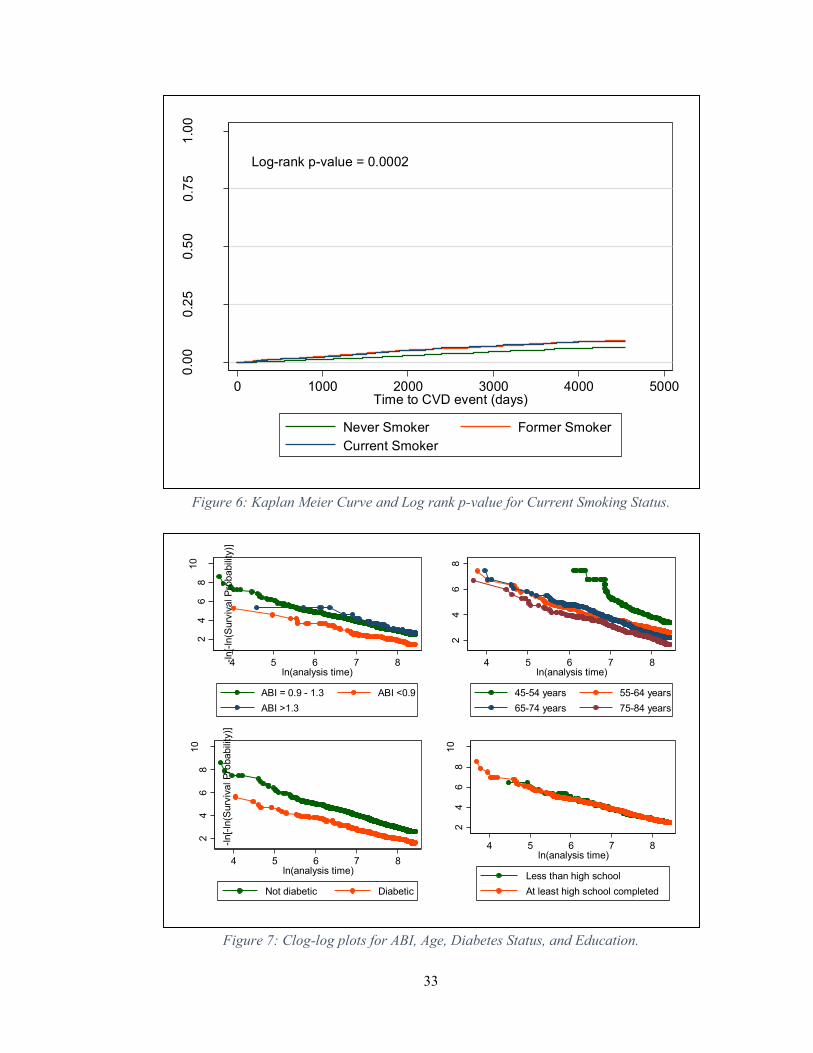
Figure 6: Kaplan Meier Curve and Log rank p-value for Current Smoking Status. ...................... 33
Figure 7: Clog-log plots for ABI, Age, Diabetes Status, and Education. ...................................... 33
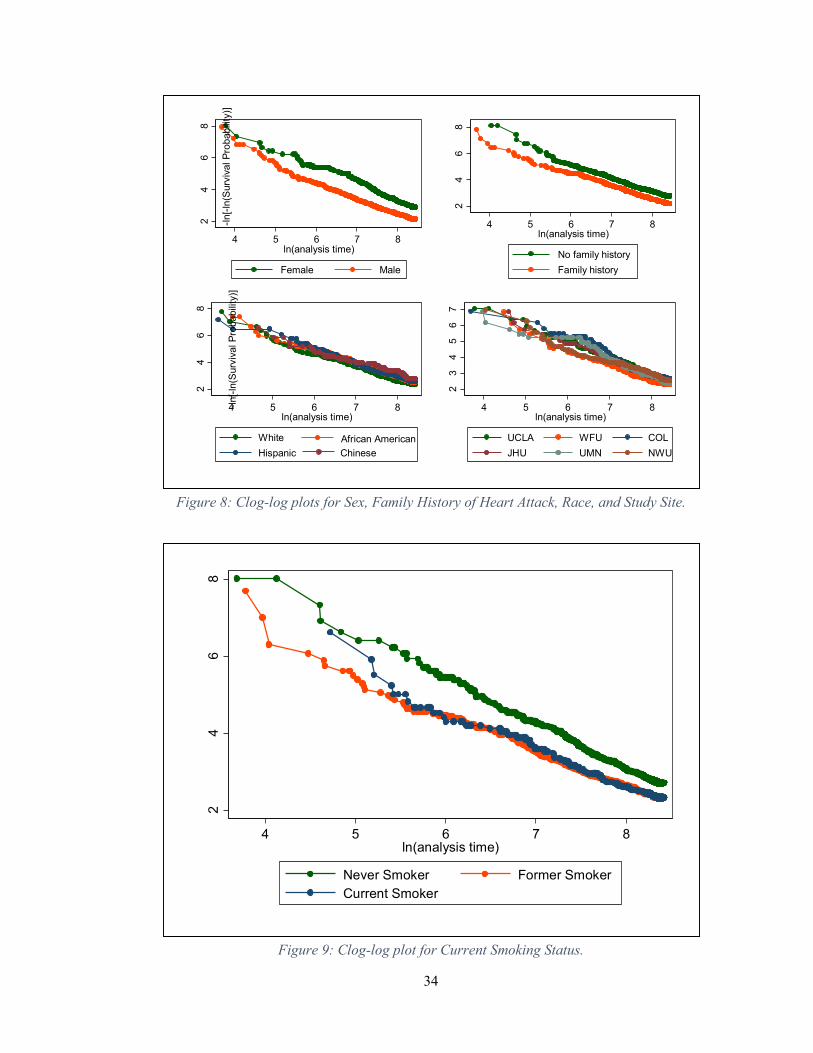
Figure 8: Clog-log plots for Sex, Family History of Heart Attack, Race, and Study Site. ............ 34
Figure 9: Clog-log plot for Current Smoking Status. ..................................................................... 34

1
Introduction
Background and Significance
Heart disease is the leading cause of death in the United States. In fact, cardiovascular disease
causes more deaths than cancer, chronic lower respiratory diseases, and accidents combined.
Each year, about 610 000 people die from heart disease in the United States. Coronary heart
disease (CHD) is the most common type of heart disease, killing over 370 000 people annually.
Heart disease, with its high morbidity and costs, is a tremendous burden on the healthcare system.
Cardiovascular disease and stroke have estimated direct and indirect costs of about $315 billion,
and this figure increases every year (Centers for Disease Control and Prevention, 2015) (Ahmad,
et al., 2014) (Johns Hopkins Medicine, n.d.).
Biomarkers have served as tools for diagnosing and estimating the prognosis of heart failure in
patients with cardiovascular disease, and have also been used to predict cardiovascular risk in
patients without cardiovascular disease. A biomarker is a characteristic that can be objectively
measured and evaluated as an indicator of a biological, pathogenic, or pharmacological processes
or responses. To be useful clinically, biomarkers need to be accurate, reproducible, and
standardised. They have to be of reasonable costs, and have high sensitivities, specificities, and
short turnaround times (Vasan, 2006) (Vondrakova, Malek, Ost'adal, Kruger, & Neuzil, 2013).
Several biomarkers are now considered standard predictors, and new ones continue to be
developed, but evidence about new markers has not been substantial (Bayes - Genis, Zhang, &
Ky, 2015). New markers, however, could provide more information about cardiovascular
disease development and treatment, and reduce the burden on the health care system (Rollins,
2012) (Vasan, 2006).
A review published by Ahmad et al discusses the clinical importance of novel biomarkers
(Ahmad, Fiuzat, Felker, & O'Connor, 2012). Several novel biomarkers have been identified,

2
which allow for the measurement of various molecular processes involved in the
pathophysiology of chronic heart failure. Ahmad et al suggest that using biomarkers in clinical
practice could result in improved diagnosis, risk assessment, and treatment of patients with
chronic heart failure. Using a multi-marker strategy for parallel evaluation of traditional and
novel biomarkers would help in better classifying heart failure on a molecular basis, and allow
for therapies to be tailored accordingly (Ahmad, Fiuzat, Felker, & O'Connor, 2012).
Heart disease has been considered to be a male disease. However, heart disease is the leading
cause of death in both men and women (Centers for Disease Control and Prevention, 2015). Yet,
most of the existing clinical standards for heart disease are based on male pathophysiology and
outcomes (Regitz-Zagrosek, 2011) (Taylor, Vallejo-Giraldo, Schaible, Zakeri, & Miller, 2011).
In their 2007 update of their previously published Evidence-Based Guidelines for Cardiovascular
Disease Prevention in Women, the American Heart Association suggested that the role of female
sex in modifying the predictive value of new biomarkers and measures of subclinical
cardiovascular disease be addressed in future research (Banka, et al., 2007).
Objective
To determine the association of traditional and emerging biomarkers with incident CHD, assess
how well these biomarkers predict CHD and to identify which biomarkers are the strongest
predictors of CHD. The effect of sex and race on these associations will also be examined.
3
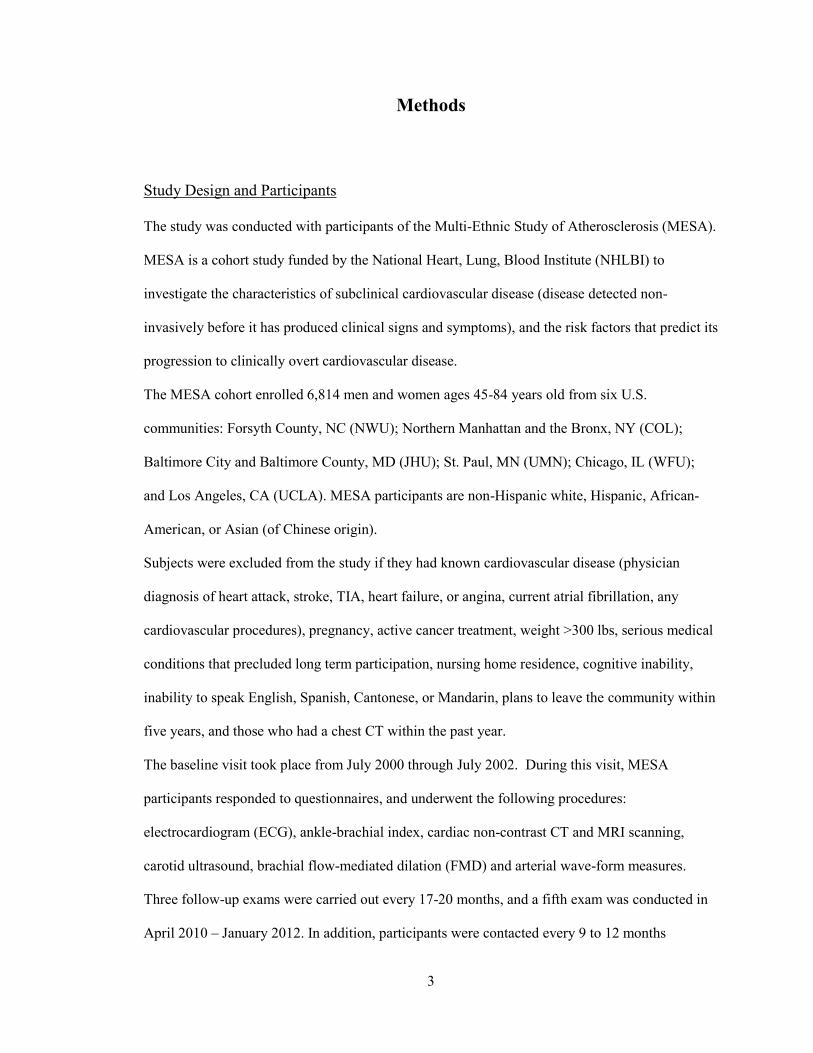
Methods
Study Design and Participants
The study was conducted with participants of the Multi-Ethnic Study of Atherosclerosis (MESA).
MESA is a cohort study funded by the National Heart, Lung, Blood Institute (NHLBI) to
investigate the characteristics of subclinical cardiovascular disease (disease detected non-
invasively before it has produced clinical signs and symptoms), and the risk factors that predict its
progression to clinically overt cardiovascular disease.
The MESA cohort enrolled 6,814 men and women ages 45-84 years old from six U.S.
communities: Forsyth County, NC (NWU); Northern Manhattan and the Bronx, NY (COL);
Baltimore City and Baltimore County, MD (JHU); St. Paul, MN (UMN); Chicago, IL (WFU);
and Los Angeles, CA (UCLA). MESA participants are non-Hispanic white, Hispanic, African-
American, or Asian (of Chinese origin).
Subjects were excluded from the study if they had known cardiovascular disease (physician
diagnosis of heart attack, stroke, TIA, heart failure, or angina, current atrial fibrillation, any
cardiovascular procedures), pregnancy, active cancer treatment, weight >300 lbs, serious medical
conditions that precluded long term participation, nursing home residence, cognitive inability,
inability to speak English, Spanish, Cantonese, or Mandarin, plans to leave the community within
five years, and those who had a chest CT within the past year.
The baseline visit took place from July 2000 through July 2002. During this visit, MESA
participants responded to questionnaires, and underwent the following procedures:
electrocardiogram (ECG), ankle-brachial index, cardiac non-contrast CT and MRI scanning,
carotid ultrasound, brachial flow-mediated dilation (FMD) and arterial wave-form measures.
Three follow-up exams were carried out every 17-20 months, and a fifth exam was conducted in
April 2010 – January 2012. In addition, participants were contacted every 9 to 12 months
4
throughout the study to assess clinical morbidity and mortality. Additional details and protocols
are available on the MESA website, www.mesa-nhlbi.org, and in Bild et al (MESA Coordinating
Center, University of Washington, Seattle, 2015) (Bild, et al., 2002).
Variables
Biomarkers were identified by first reviewing the literature for biomarkers that have been shown,
or could be used to predict future cardiovascular events. Vasan presented a detailed review of
heart disease biomarkers (circulating, structural, functional, and genomic) that had been
previously analyzed, and also described the weight of evidence linking these biomarkers to heart
disease based on whether they were evaluated prospectively, whether they added predictive
power to the Framingham Study Risk Score, and how well they tracked with disease treatment
(Vasan, 2006). Liquori et al also reviewed established and candidate biomarkers, and described
the use of these markers in clinical practice in terms of whether they were diagnostic or
prognostic of heart failure, and whether they were used to guide therapy in heart failure (Liquori,
Christenson, Collinson, & deFilippi, 2014).
The biomarkers chosen for analysis were the ones that were measured in MESA, and had been
identified in these reviews. These biomarkers were C-reactive protein (CRP), tumour necrosis
factor (TNF) α, matrix metalloproteinases (MMP) 3 and 9, low-density lipoprotein (LDL) particle
number, soluble intercellular adhesion molecule (sICAM-1), interleukins (IL) 2 and 6, oxidised
LDL, homocysteine, mean Agatston calcium score (as a measure of coronary calcium), ankle-
brachial index (ABI), urine albumin, fibrinogen, D-dimer, plasminogen activator inhibitor 1
(PAI-1), and von Willebrand Factor (vWF), and Cystatin-C.
Cystatin-C was not used in this analysis as the MESA Data Committee advised that the data for
this biomarker should not be used for longitudinal analysis as calibration efforts are still in
progress. TNF α, MMP 3, MMP 9, LDL particle number, oxidised LDL, sICAM-1, IL-2, PAI-1,
and vWF were only measured in a subset of 1,000 participants randomly selected from the first
5
5,030 participants enrolled (MESA 1000) (Keller, Katz, Cushman, Fried, & Shilpak, 2008).
There was missing data for these biomarkers (50% - 80%), and thus, they were not used in the
analysis to prevent loss of power.
The biomarkers used in the analysis were ABI, CRP, IL-6, mean Agatston calcium score, urine
albumin, D-dimer, fibrinogen, and total homocysteine. The traditional CVD risk factors included
age, race/ethnicity, sex, study site location, body mass index, smoking status (never, former,
current), the average number of cigarettes smoked per day, systolic blood pressure (SBP),
diabetes, family history of heart attacks (parents, siblings, or children), education (less than or
completed high school), and high levels of LDL cholesterol, high-density lipoprotein (HDL)
cholesterol, and triglyceride levels. These were not studied as main predictors, but included in
the models as they are known risk factors of CHD which should be adjusted for when
determining the associations for the biomarkers.
Current smoking was defined as having smoked a cigarette in the last 30 days. Diabetes was
defined as use of diabetes medications or fasting glucose equal to or greater than 126 mg/dL.
Ankle-brachial index was categorized as follows - <0.9, 0.9 – 1.3, and >1.3. These cut-offs were
chosen because ABI values of <0.9 and >1.3 have been identified in the literature as abnormal
(Tison, et al., 2011). To measure systolic blood pressure, subjects were allowed to rest for 5
minutes in a seated position, after which blood pressure was measured 3 times at 2-minute
intervals. An appropriate-size cuff and an automated oscillometric device (Dinamap Monitor Pro
100, GE Healthcare, Milwaukee, WI) were used. The average of the second and third
measurements were used to determine SBP (MESA Coordinating Center, University of
Washington., 2001) (Carson, et al., 2011).
Biomarker concentrations were determined by blood tests (HDL-cholesterol, triglycerides,
fibrinogen, CRP, IL-6, total homocysteine, and D-dimer), urine tests (urinary albumin), and
computed topography (coronary calcium).
6
Laboratory assays were measured using venous blood obtained after a 12- hour fast. HDL-
cholesterol was measured in EDTA plasma using the cholesterol oxidase cholesterol method after
precipitation of non-HDL-cholesterol with magnesium/dextran (Roche Diagnostics, Indianapolis,
IN). Triglyceride was measured in EDTA plasma using Triglyceride GB reagent on the Roche
COBAS FARA centrifugal analyser (Roche Diagnostics). LDL cholesterol was estimated by the
Friedewald equation in individuals with triglyceride values <400 mg/dL (Yeboah, et al., 2009).
Fibrinogen and CRP was measured using the BNII nephelometer (N High Sensitivity CRP; Dade
Behring Inc., Deerfield, IL). IL-6 was measured by ultrasensitive enzyme-linked immunosorbent
assay (ELISA) (Quantikine HS Human IL-6 Immunoassay; R&D Systems, Minneapolis, MN).
Urinary albumin was determined using the Array 360 CE Protein Analyzer (Beckman
Instruments, Inc., Drea, CA). Total homocysteine was measured by a fluorescence polarization
immunoassay (IMx Homocysteine Assay, Oslo, Norway) using the IMx Analyzer (Abbott
Diagnostics, Abbott Park, IL). Fibrin fragment D-dimer was measured using an immuno-
turbidimetric assay (Liatest D-DI; Parsippany, NJ). Average analytical coefficients of variation
across several control samples for these analytes ranged from 2.0% to 13.0% (MESA
Coordinating Center, University of Washington, 2014).
Computed tomography (CT) scanning of the chest was performed using either ECG-triggered
electron-beam computed tomography scanner (WFU, UCLA, COL) (Imatron C-150, Imatron,
San Francisco) or using prospectively ECG- triggered scan acquisition with a multi-detector
computed tomography system acquiring four simultaneous 2.5 mm slices for each cardiac cycle
in a sequential or axial scan mode (JHU, NWU, UMN) (Lightspeed, General Electric, Waukesha,
WI or Siemens, Volume Zoom, Erlangen, Germany). Each participant was scanned twice, and
calcium scores among scanning centres and between participants were adjusted using a standard
calcium phantom scanned simultaneously with the participant. The average of the two Agatston
scores was used in all analyses. Additional details and protocols on the CT scanning are available
in Takasu et al (Takasu, et al., 2009).
7
For the ABI, systolic blood pressure was measured in both the left and right brachial, dorsalis
pedis, and posterior tibial arteries using a hand-held Doppler instrument with a 5-mHz probe. The
ABI was calculated for both the left and right sides as maximum systolic blood pressure in the
posterior tibial artery and dorsalis pedis, divided by the average of the left and right brachial
pressures (Yeboah, et al, 2009). Additional information can be found on the MESA website,
www.mesa-nhlbi.org.
Primary Outcome and Outcome Ascertainment
The primary outcome was all cause CHD, which was a composite outcome of either myocardial
infarction (MI), resuscitated cardiac arrest, definite angina, probable angina (if followed by
revascularisation), or CHD death.
At intervals of 9 – 12 months, a telephone interviewer inquired about interim hospital admissions,
cardiovascular diagnoses, and deaths. Copies of death certificates and medical records for
hospitalization and outpatient cardiovascular diagnoses were sent to an adjudication committee.
The adjudication committee also conducted next of kin interviews for out-of-hospital
cardiovascular deaths for verification. Records were obtained for 98% of reported hospitalized
CVD events. Two physicians independently classified and assigned incidence dates. For
disagreements, a full mortality and morbidity review committee made the final classification
(Malik, et al., 2011).
Angina required documentation of chest pain or angina equivalent, and evidence of reversible
myocardial ischemia, obstructive coronary artery disease, or a positive stress test. Myocardial
infarction required information about chest pain, cardiac enzymes, and electrocardiograms.
Resuscitated cardiac arrest was defined as full arrest (asystole or ventricular fibrillation and
pulseless) and subsequent successful cardio-pulmonary resuscitation (including cardioversion) in
persons in whom there we no clear-cut non-cardiac cause, and who lived 24 hours after
resuscitation.
8
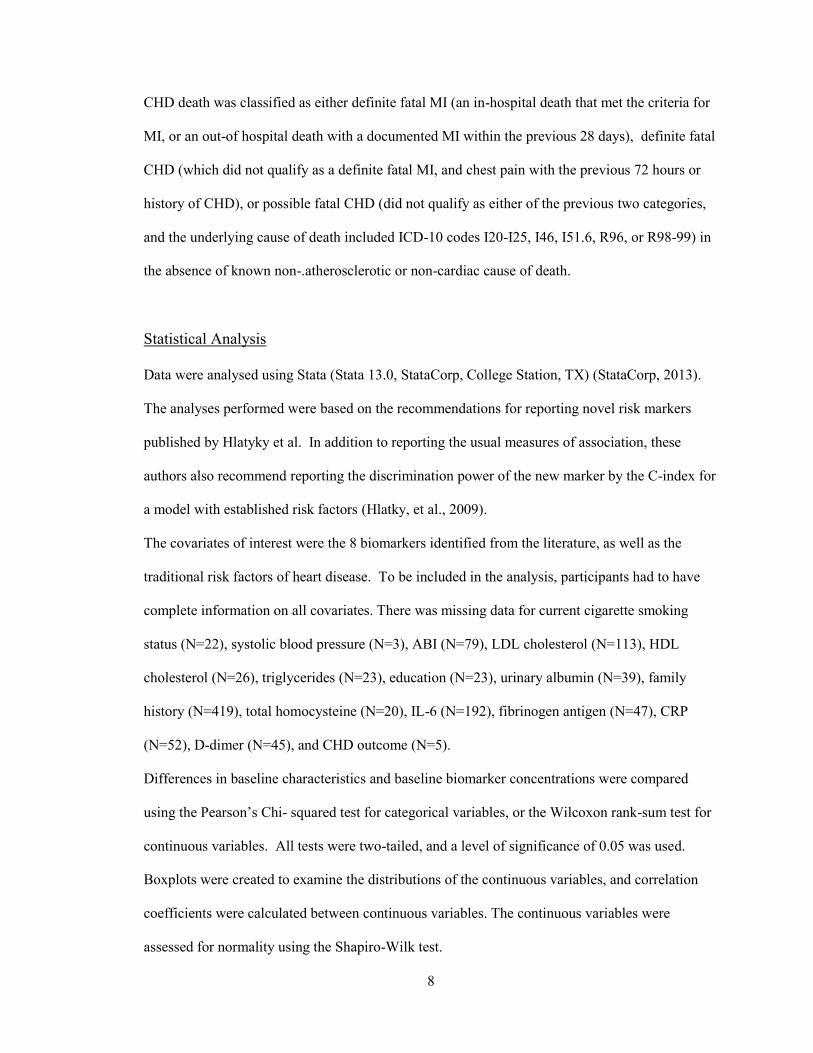
CHD death was classified as either definite fatal MI (an in-hospital death that met the criteria for
MI, or an out-of hospital death with a documented MI within the previous 28 days), definite fatal
CHD (which did not qualify as a definite fatal MI, and chest pain with the previous 72 hours or
history of CHD), or possible fatal CHD (did not qualify as either of the previous two categories,
and the underlying cause of death included ICD-10 codes I20-I25, I46, I51.6, R96, or R98-99) in
the absence of known non-.atherosclerotic or non-cardiac cause of death.
Statistical Analysis
Data were analysed using Stata (Stata 13.0, StataCorp, College Station, TX) (StataCorp, 2013).
The analyses performed were based on the recommendations for reporting novel risk markers
published by Hlatyky et al. In addition to reporting the usual measures of association, these
authors also recommend reporting the discrimination power of the new marker by the C-index for
a model with established risk factors (Hlatky, et al., 2009).
The covariates of interest were the 8 biomarkers identified from the literature, as well as the
traditional risk factors of heart disease. To be included in the analysis, participants had to have
complete information on all covariates. There was missing data for current cigarette smoking
status (N=22), systolic blood pressure (N=3), ABI (N=79), LDL cholesterol (N=113), HDL
cholesterol (N=26), triglycerides (N=23), education (N=23), urinary albumin (N=39), family
history (N=419), total homocysteine (N=20), IL-6 (N=192), fibrinogen antigen (N=47), CRP
(N=52), D-dimer (N=45), and CHD outcome (N=5).
Differences in baseline characteristics and baseline biomarker concentrations were compared
using the Pearson’s Chi- squared test for categorical variables, or the Wilcoxon rank-sum test for
continuous variables. All tests were two-tailed, and a level of significance of 0.05 was used.
Boxplots were created to examine the distributions of the continuous variables, and correlation
coefficients were calculated between continuous variables. The continuous variables were
assessed for normality using the Shapiro-Wilk test.
9
Survival analysis techniques were used to analyse the data. Censored events were those where the
participants did not have incident CHD during follow-up, so that their last observed follow-up
time is less than their time to CHD (right censoring). Censored events included losses to follow-
up, end of follow-up (administrative censoring) and deaths other than those defined above.
Kaplan-Meier curves were created to compare the cumulative survival of CHD for the categorical
variables. Log rank tests were used to test for statistical significance between cumulative survival
proportions. The Cox Proportional Hazards Regression model was used to calculate hazard ratios
and determine if any of the covariates were significant predictors of cardiovascular events. To
test for heterogeneity of the covariates by race and sex, multiplicative interaction terms between
the covariates and sex, and race, were generated. The statistically significant interaction terms
were included in the multivariable models. Hazard ratios stratified by sex and by race were also
presented. The Mantel-Haenszel log-rank test was used to determine whether the stratified
estimates differed significantly. Clog-log plots were used to test the proportional hazard
assumption among the categorical variables. Assumption of proportionality for all of the models
was tested using Schoenfeld residuals, which was found to be statistically nonsignificant.
To look at predictive power of adding biomarkers, the Akaike Information Criterion (AIC),
Somer’s D, and Harrell’s C statistics of a model containing only traditional risk factors were
compared to those of models which included the traditional risk factors as well as the biomarkers
(Newson, 2010).
10
Results
Baseline Characteristics
Table 1 compares the baseline demographic characteristics between those who had incident CHD,
and those who did not, while Table 2 compares the biomarker levels between both groups. Both
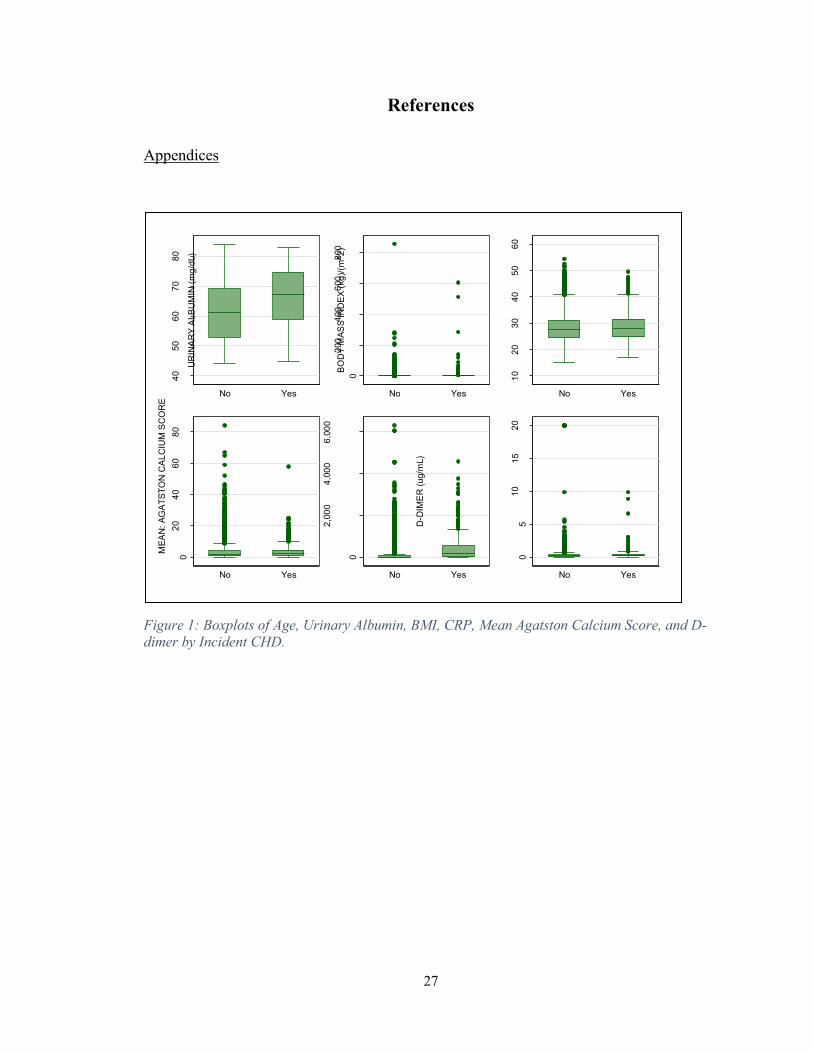
tables also show the p-values for the t-test of differences in the mean. Both boxplots (Figures 1,
2, and 3 in the appendix) and Shapiro-Wilks tests for normality (Table 12) showed that none of
the continuous covariates were normally distributed. As such, the medians and interquartile
ranges (IQR) were reported in Tables 1 and 2.
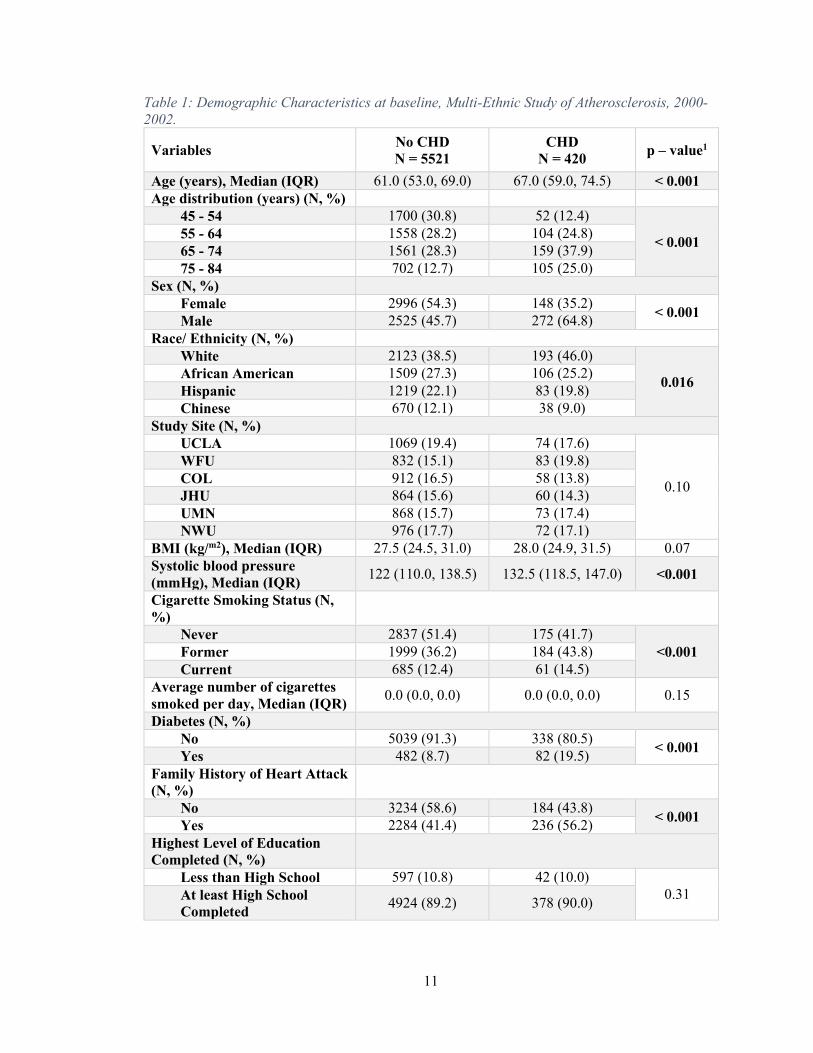
Table 1 shows that persons who had incident CHD differed significantly from those who
did not by all covariates except BMI, study site, average number of cigarettes smoked per day,
and education. Generally, persons who had incident CHD were older white males with higher
systolic blood pressure, were either former or current smokers, and had diabetes and a family
history of heart attacks compared to persons who did not have incident CHD.
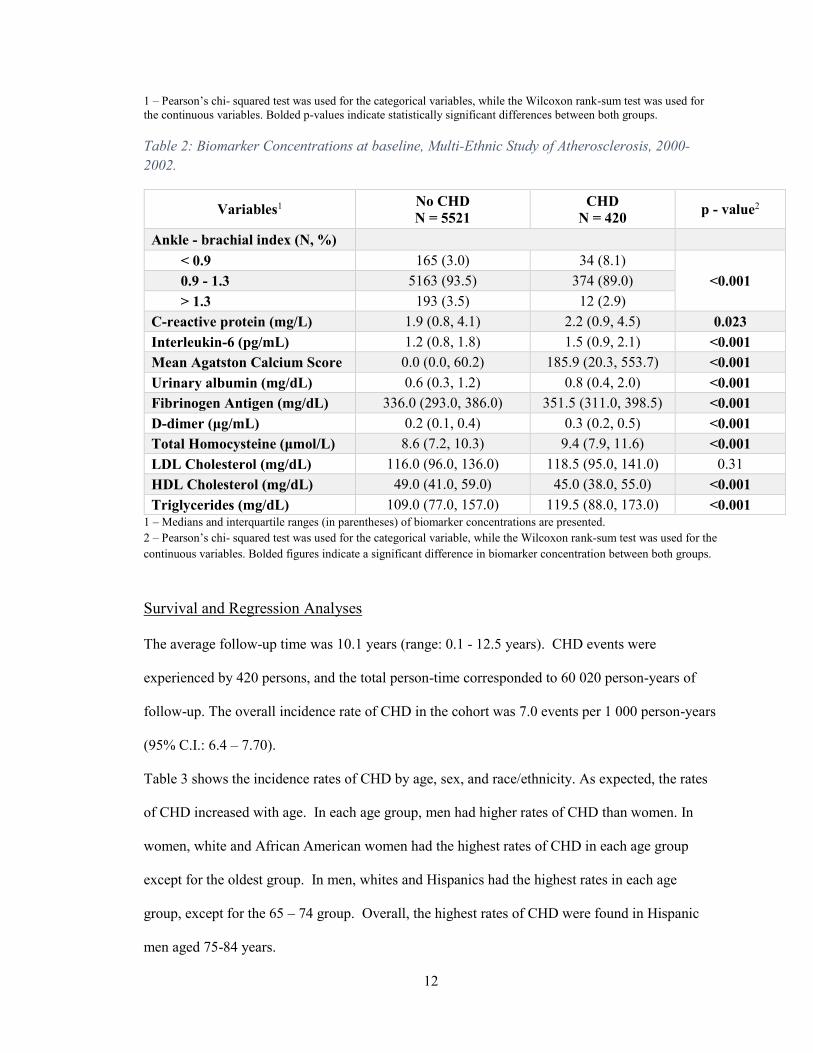
Table 2 shows that persons who had incident CHD had significantly different levels of all
the biomarkers except for LDL cholesterol, which was higher in the incident CHD group, but not
significantly so. Generally, those who had incident CHD had ABIs less than 0.9, significantly
higher CRP, IL-2, mean Agatston calcium score, urinary albumin, fibrinogen antigen, D-dimer,
total homocysteine, and triglycerides, and significantly lower HDL cholesterol.
11
Table 1: Demographic Characteristics at baseline, Multi-Ethnic Study of Atherosclerosis, 2000-
2002.
Variables No CHD
N = 5521
CHD
N = 420 p – value1
Age (years), Median (IQR) 61.0 (53.0, 69.0) 67.0 (59.0, 74.5) < 0.001
Age distribution (years) (N, %)
45 - 54 1700 (30.8) 52 (12.4)
< 0.001 55 - 64 1558 (28.2) 104 (24.8)
65 - 74 1561 (28.3) 159 (37.9)
75 - 84 702 (12.7) 105 (25.0)
Sex (N, %)
Female 2996 (54.3) 148 (35.2) < 0.001
Male 2525 (45.7) 272 (64.8)
Race/ Ethnicity (N, %)
White 2123 (38.5) 193 (46.0)
0.016 African American 1509 (27.3) 106 (25.2)
Hispanic 1219 (22.1) 83 (19.8)
Chinese 670 (12.1) 38 (9.0)
Study Site (N, %)
UCLA 1069 (19.4) 74 (17.6)
0.10
WFU 832 (15.1) 83 (19.8)
COL 912 (16.5) 58 (13.8)
JHU 864 (15.6) 60 (14.3)
UMN 868 (15.7) 73 (17.4)
NWU 976 (17.7) 72 (17.1)
BMI (kg/m2), Median (IQR) 27.5 (24.5, 31.0) 28.0 (24.9, 31.5) 0.07
Systolic blood pressure
(mmHg), Median (IQR) 122 (110.0, 138.5) 132.5 (118.5, 147.0) <0.001
Cigarette Smoking Status (N,
%)
Never 2837 (51.4) 175 (41.7)
<0.001 Former 1999 (36.2) 184 (43.8)
Current 685 (12.4) 61 (14.5)
Average number of cigarettes
smoked per day, Median (IQR) 0.0 (0.0, 0.0) 0.0 (0.0, 0.0) 0.15
Diabetes (N, %)
No 5039 (91.3) 338 (80.5) < 0.001
Yes 482 (8.7) 82 (19.5)
Family History of Heart Attack
(N, %)
No 3234 (58.6) 184 (43.8) < 0.001
Yes 2284 (41.4) 236 (56.2)
Highest Level of Education
Completed (N, %)
Less than High School 597 (10.8) 42 (10.0)
0.31 At least High School
Completed 4924 (89.2) 378 (90.0)
12
1 – Pearson’s chi- squared test was used for the categorical variables, while the Wilcoxon rank-sum test was used for
the continuous variables. Bolded p-values indicate statistically significant differences between both groups.
Table 2: Biomarker Concentrations at baseline, Multi-Ethnic Study of Atherosclerosis, 2000-
2002.
Variables1 No CHD
N = 5521
CHD
N = 420 p - value2
Ankle - brachial index (N, %)
< 0.9 165 (3.0) 34 (8.1)
<0.001 0.9 - 1.3 5163 (93.5) 374 (89.0)
> 1.3 193 (3.5) 12 (2.9)
C-reactive protein (mg/L) 1.9 (0.8, 4.1) 2.2 (0.9, 4.5) 0.023
Interleukin-6 (pg/mL) 1.2 (0.8, 1.8) 1.5 (0.9, 2.1) <0.001
Mean Agatston Calcium Score 0.0 (0.0, 60.2) 185.9 (20.3, 553.7) <0.001
Urinary albumin (mg/dL) 0.6 (0.3, 1.2) 0.8 (0.4, 2.0) <0.001
Fibrinogen Antigen (mg/dL) 336.0 (293.0, 386.0) 351.5 (311.0, 398.5) <0.001
D-dimer (μg/mL) 0.2 (0.1, 0.4) 0.3 (0.2, 0.5) <0.001
Total Homocysteine (μmol/L) 8.6 (7.2, 10.3) 9.4 (7.9, 11.6) <0.001
LDL Cholesterol (mg/dL) 116.0 (96.0, 136.0) 118.5 (95.0, 141.0) 0.31
HDL Cholesterol (mg/dL) 49.0 (41.0, 59.0) 45.0 (38.0, 55.0) <0.001
Triglycerides (mg/dL) 109.0 (77.0, 157.0) 119.5 (88.0, 173.0) <0.001 1 – Medians and interquartile ranges (in parentheses) of biomarker concentrations are presented.
2 – Pearson’s chi- squared test was used for the categorical variable, while the Wilcoxon rank-sum test was used for the
continuous variables. Bolded figures indicate a significant difference in biomarker concentration between both groups.
Survival and Regression Analyses
The average follow-up time was 10.1 years (range: 0.1 - 12.5 years). CHD events were
experienced by 420 persons, and the total person-time corresponded to 60 020 person-years of
follow-up. The overall incidence rate of CHD in the cohort was 7.0 events per 1 000 person-years
(95% C.I.: 6.4 – 7.70).
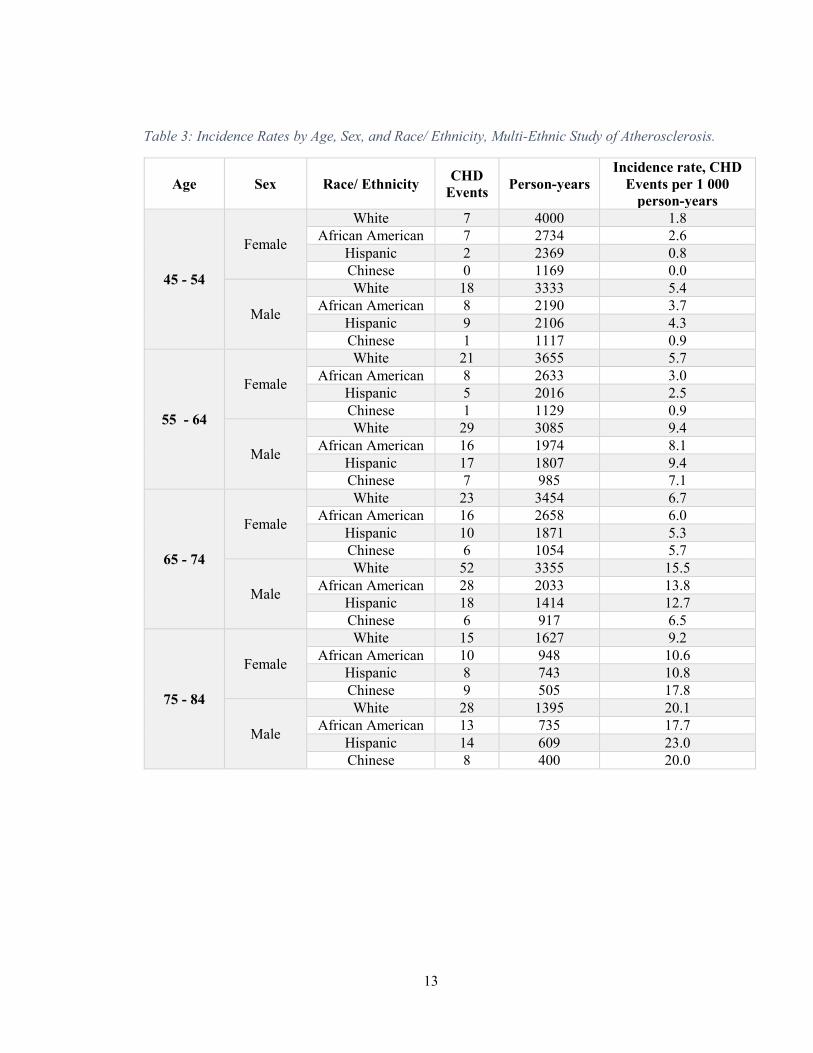
Table 3 shows the incidence rates of CHD by age, sex, and race/ethnicity. As expected, the rates
of CHD increased with age. In each age group, men had higher rates of CHD than women. In
women, white and African American women had the highest rates of CHD in each age group
except for the oldest group. In men, whites and Hispanics had the highest rates in each age
group, except for the 65 – 74 group. Overall, the highest rates of CHD were found in Hispanic
men aged 75-84 years.
13
Table 3: Incidence Rates by Age, Sex, and Race/ Ethnicity, Multi-Ethnic Study of Atherosclerosis.
Age Sex Race/ Ethnicity CHD
Events Person-years
Incidence rate, CHD
Events per 1 000
person-years
45 - 54
Female
White 7 4000 1.8
African American 7 2734 2.6
Hispanic 2 2369 0.8
Chinese 0 1169 0.0
Male
White 18 3333 5.4
African American 8 2190 3.7
Hispanic 9 2106 4.3
Chinese 1 1117 0.9
55 - 64
Female
White 21 3655 5.7
African American 8 2633 3.0
Hispanic 5 2016 2.5
Chinese 1 1129 0.9
Male
White 29 3085 9.4
African American 16 1974 8.1
Hispanic 17 1807 9.4
Chinese 7 985 7.1
65 - 74
Female
White 23 3454 6.7
African American 16 2658 6.0
Hispanic 10 1871 5.3
Chinese 6 1054 5.7
Male
White 52 3355 15.5
African American 28 2033 13.8
Hispanic 18 1414 12.7
Chinese 6 917 6.5
75 - 84
Female
White 15 1627 9.2
African American 10 948 10.6
Hispanic 8 743 10.8
Chinese 9 505 17.8
Male
White 28 1395 20.1
African American 13 735 17.7
Hispanic 14 609 23.0
Chinese 8 400 20.0
14
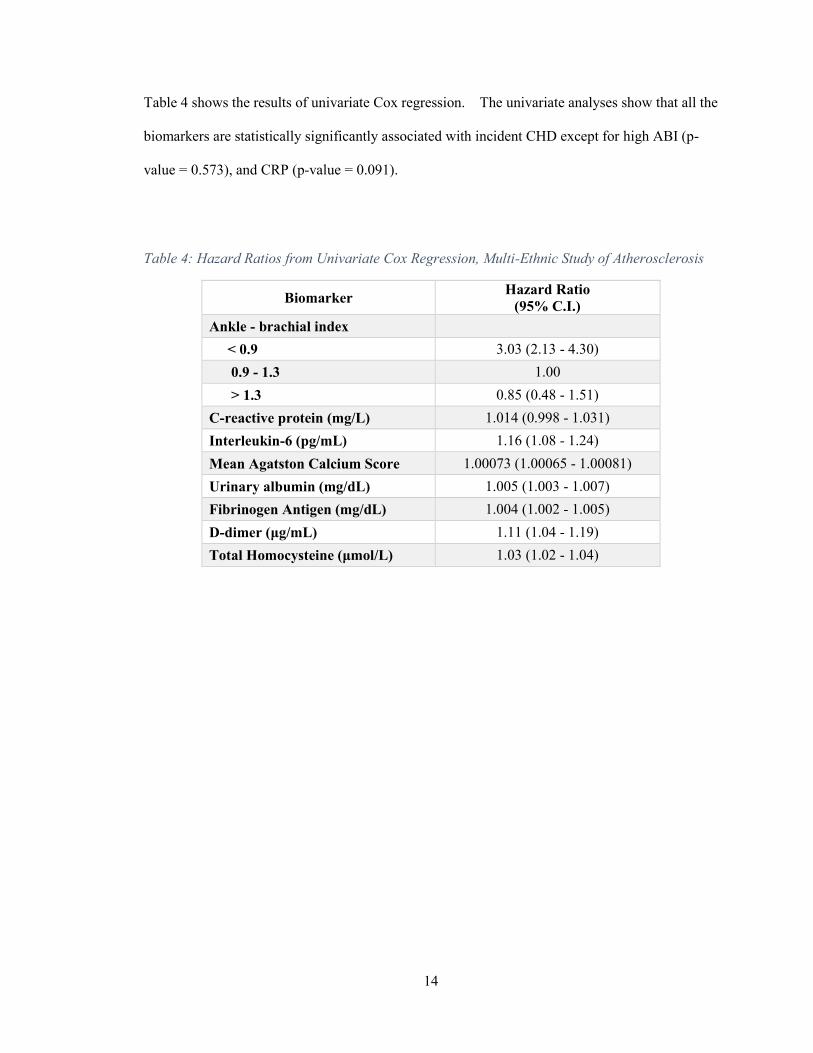
Table 4 shows the results of univariate Cox regression. The univariate analyses show that all the
biomarkers are statistically significantly associated with incident CHD except for high ABI (p-
value = 0.573), and CRP (p-value = 0.091).
Table 4: Hazard Ratios from Univariate Cox Regression, Multi-Ethnic Study of Atherosclerosis
Biomarker Hazard Ratio
(95% C.I.)
Ankle - brachial index
< 0.9 3.03 (2.13 - 4.30)
0.9 - 1.3 1.00
> 1.3 0.85 (0.48 - 1.51)
C-reactive protein (mg/L) 1.014 (0.998 - 1.031)
Interleukin-6 (pg/mL) 1.16 (1.08 - 1.24)
Mean Agatston Calcium Score 1.00073 (1.00065 - 1.00081)
Urinary albumin (mg/dL) 1.005 (1.003 - 1.007)
Fibrinogen Antigen (mg/dL) 1.004 (1.002 - 1.005)
D-dimer (μg/mL) 1.11 (1.04 - 1.19)
Total Homocysteine (μmol/L) 1.03 (1.02 - 1.04)
15
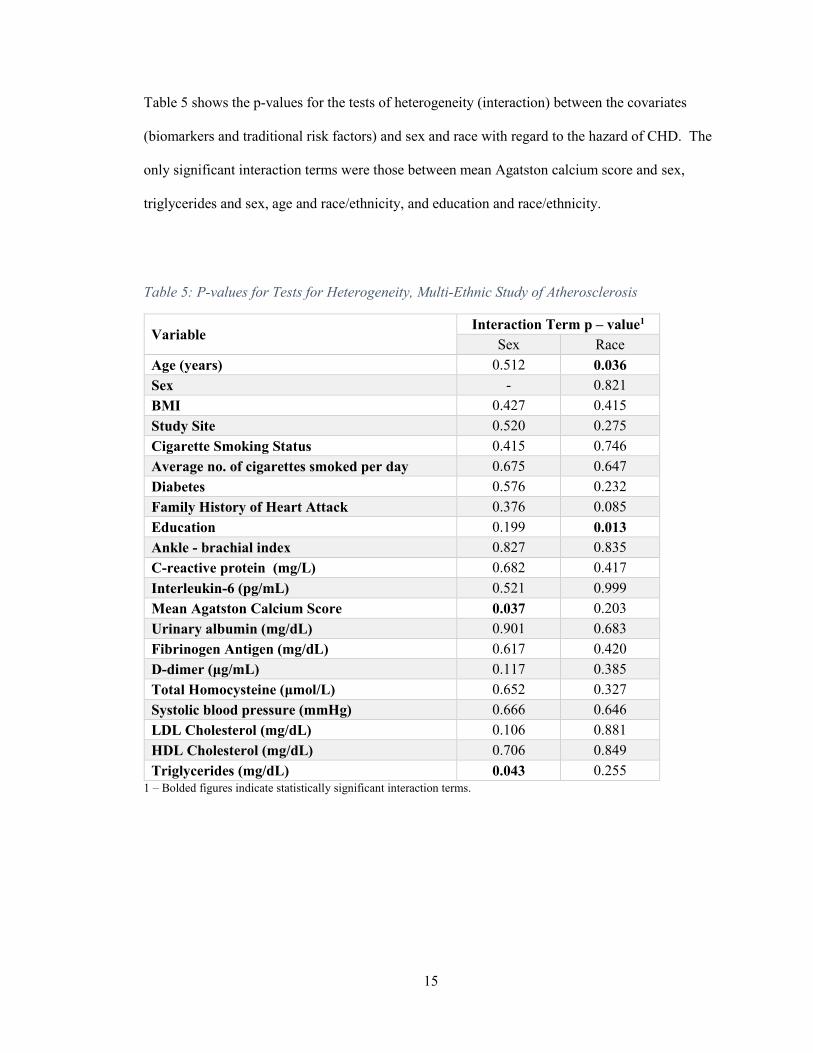
Table 5 shows the p-values for the tests of heterogeneity (interaction) between the covariates
(biomarkers and traditional risk factors) and sex and race with regard to the hazard of CHD. The
only significant interaction terms were those between mean Agatston calcium score and sex,
triglycerides and sex, age and race/ethnicity, and education and race/ethnicity.
Table 5: P-values for Tests for Heterogeneity, Multi-Ethnic Study of Atherosclerosis
Variable Interaction Term p – value1
Sex Race
Age (years) 0.512 0.036
Sex - 0.821
BMI 0.427 0.415
Study Site 0.520 0.275
Cigarette Smoking Status 0.415 0.746
Average no. of cigarettes smoked per day 0.675 0.647
Diabetes 0.576 0.232
Family History of Heart Attack 0.376 0.085
Education 0.199 0.013
Ankle - brachial index 0.827 0.835
C-reactive protein (mg/L) 0.682 0.417
Interleukin-6 (pg/mL) 0.521 0.999
Mean Agatston Calcium Score 0.037 0.203
Urinary albumin (mg/dL) 0.901 0.683
Fibrinogen Antigen (mg/dL) 0.617 0.420
D-dimer (μg/mL) 0.117 0.385
Total Homocysteine (μmol/L) 0.652 0.327
Systolic blood pressure (mmHg) 0.666 0.646
LDL Cholesterol (mg/dL) 0.106 0.881
HDL Cholesterol (mg/dL) 0.706 0.849
Triglycerides (mg/dL) 0.043 0.255 1 – Bolded figures indicate statistically significant interaction terms.
16
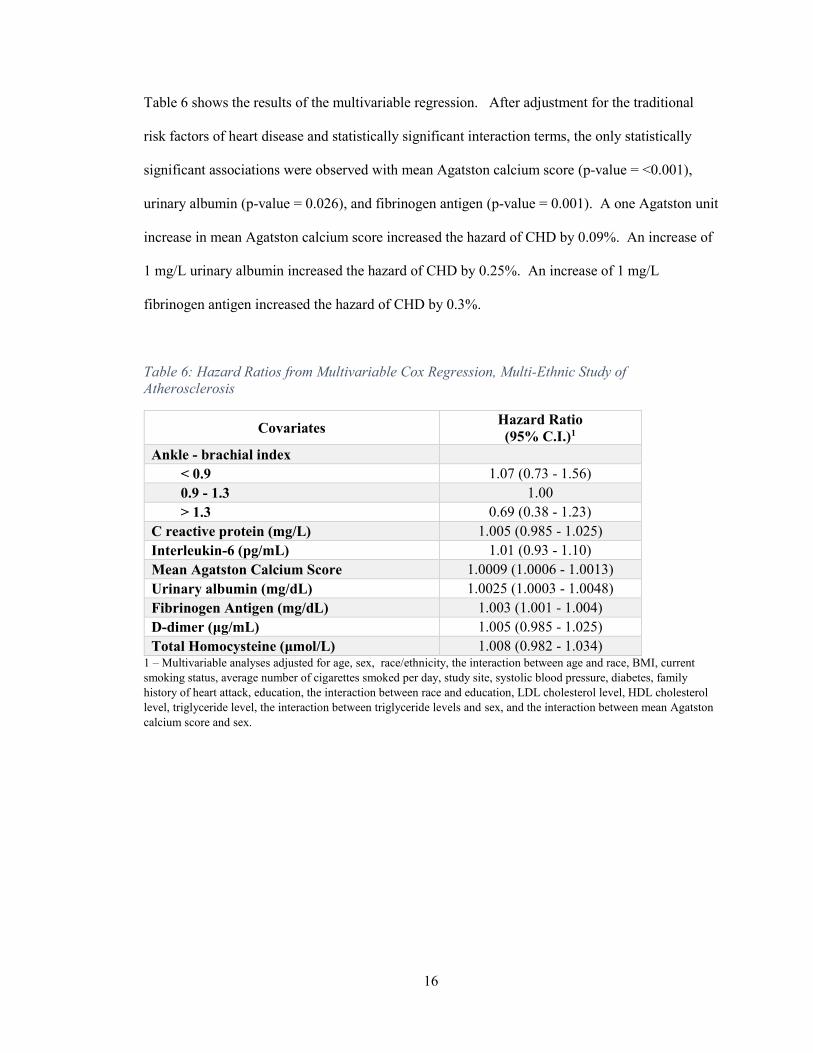
Table 6 shows the results of the multivariable regression. After adjustment for the traditional
risk factors of heart disease and statistically significant interaction terms, the only statistically
significant associations were observed with mean Agatston calcium score (p-value = <0.001),
urinary albumin (p-value = 0.026), and fibrinogen antigen (p-value = 0.001). A one Agatston unit
increase in mean Agatston calcium score increased the hazard of CHD by 0.09%. An increase of
1 mg/L urinary albumin increased the hazard of CHD by 0.25%. An increase of 1 mg/L
fibrinogen antigen increased the hazard of CHD by 0.3%.
Table 6: Hazard Ratios from Multivariable Cox Regression, Multi-Ethnic Study of
Atherosclerosis
Covariates Hazard Ratio
(95% C.I.)1
Ankle - brachial index
< 0.9 1.07 (0.73 - 1.56)
0.9 - 1.3 1.00
> 1.3 0.69 (0.38 - 1.23)
C reactive protein (mg/L) 1.005 (0.985 - 1.025)
Interleukin-6 (pg/mL) 1.01 (0.93 - 1.10)
Mean Agatston Calcium Score 1.0009 (1.0006 - 1.0013)
Urinary albumin (mg/dL) 1.0025 (1.0003 - 1.0048)
Fibrinogen Antigen (mg/dL) 1.003 (1.001 - 1.004)
D-dimer (μg/mL) 1.005 (0.985 - 1.025)
Total Homocysteine (μmol/L) 1.008 (0.982 - 1.034) 1 – Multivariable analyses adjusted for age, sex, race/ethnicity, the interaction between age and race, BMI, current
smoking status, average number of cigarettes smoked per day, study site, systolic blood pressure, diabetes, family
history of heart attack, education, the interaction between race and education, LDL cholesterol level, HDL cholesterol
level, triglyceride level, the interaction between triglyceride levels and sex, and the interaction between mean Agatston
calcium score and sex.
17
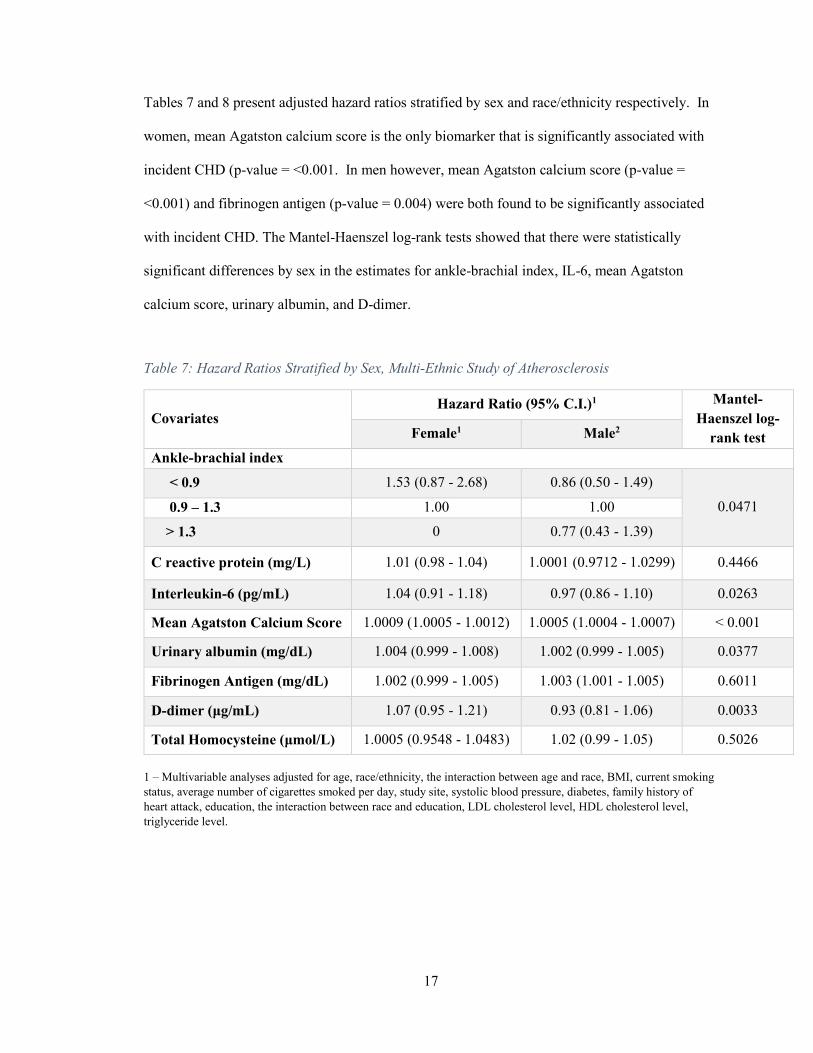
Tables 7 and 8 present adjusted hazard ratios stratified by sex and race/ethnicity respectively. In
women, mean Agatston calcium score is the only biomarker that is significantly associated with
incident CHD (p-value = <0.001. In men however, mean Agatston calcium score (p-value =
<0.001) and fibrinogen antigen (p-value = 0.004) were both found to be significantly associated
with incident CHD. The Mantel-Haenszel log-rank tests showed that there were statistically
significant differences by sex in the estimates for ankle-brachial index, IL-6, mean Agatston
calcium score, urinary albumin, and D-dimer.
Table 7: Hazard Ratios Stratified by Sex, Multi-Ethnic Study of Atherosclerosis
Covariates Hazard Ratio (95% C.I.)1 Mantel-
Haenszel log-
rank test Female1 Male2
Ankle-brachial index
< 0.9 1.53 (0.87 - 2.68) 0.86 (0.50 - 1.49)
0.0471 0.9 – 1.3 1.00 1.00
> 1.3 0 0.77 (0.43 - 1.39)
C reactive protein (mg/L) 1.01 (0.98 - 1.04) 1.0001 (0.9712 - 1.0299) 0.4466
Interleukin-6 (pg/mL) 1.04 (0.91 - 1.18) 0.97 (0.86 - 1.10) 0.0263
Mean Agatston Calcium Score 1.0009 (1.0005 - 1.0012) 1.0005 (1.0004 - 1.0007) < 0.001
Urinary albumin (mg/dL) 1.004 (0.999 - 1.008) 1.002 (0.999 - 1.005) 0.0377
Fibrinogen Antigen (mg/dL) 1.002 (0.999 - 1.005) 1.003 (1.001 - 1.005) 0.6011
D-dimer (μg/mL) 1.07 (0.95 - 1.21) 0.93 (0.81 - 1.06) 0.0033
Total Homocysteine (μmol/L) 1.0005 (0.9548 - 1.0483) 1.02 (0.99 - 1.05) 0.5026
1 – Multivariable analyses adjusted for age, race/ethnicity, the interaction between age and race, BMI, current smoking
status, average number of cigarettes smoked per day, study site, systolic blood pressure, diabetes, family history of
heart attack, education, the interaction between race and education, LDL cholesterol level, HDL cholesterol level,
triglyceride level.
18
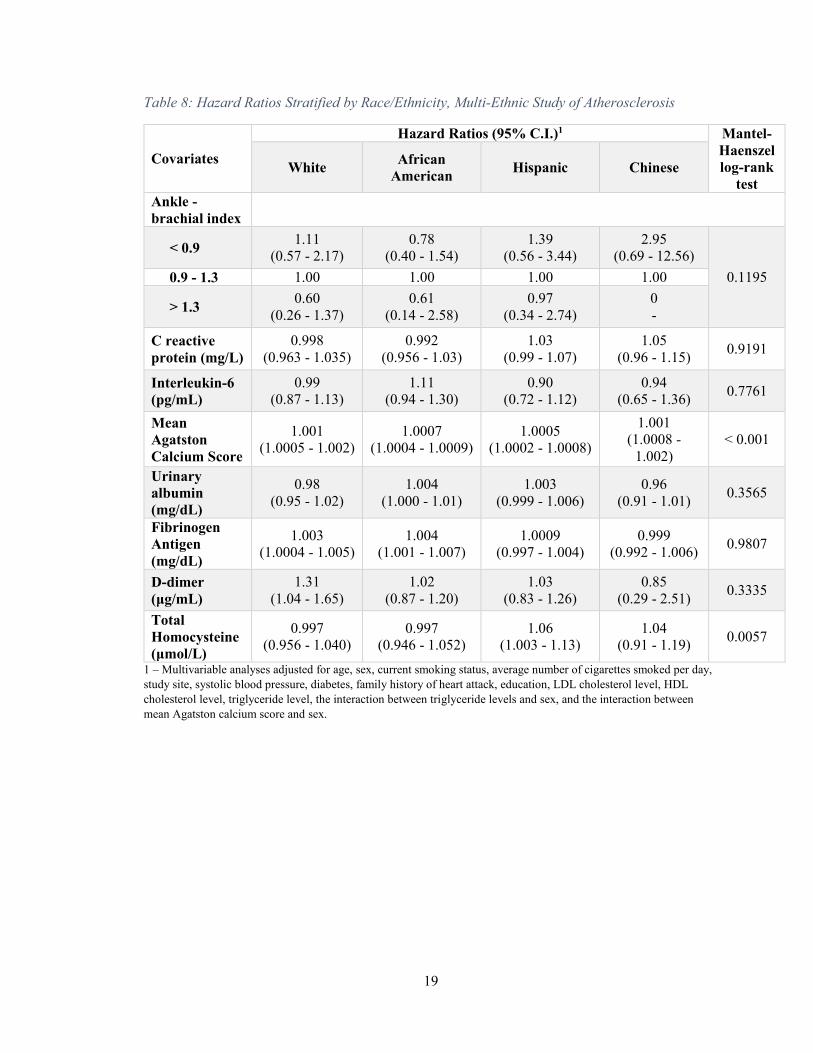
Table 8 shows that Mean Agatston calcium score was a statistically significant predictor of
incident CHD in all four racial/ethnic groups. Stratification by race/ethnicity also revealed that
some biomarkers were statistically significant in some groups, and not in others.
In whites, mean Agatston calcium score (p-value = <0.001), fibrinogen antigen (p-value = 0.023),
and D-dimer (p-value = 0.020) were significantly associated with incident CHD. In African
Americans, mean Agatston calcium score (p-value = <0.001) and fibrinogen antigen (p-value =
0.014) were significantly associated with incident CHD. In Hispanics, mean Agatston calcium
score (p-value = <0.001) and total homocysteine (p-value = 0.041) were significantly associated
with incident CHD. In the Chinese, only mean Agatston calcium score (p-value = <0.001) was
significantly associated with incident CHD. The Mantel-Haenszel log-rank tests showed that
there were statistically significant differences by race/ethnicity in the estimates mean Agatston
calcium score and total homocysteine.
19
Table 8: Hazard Ratios Stratified by Race/Ethnicity, Multi-Ethnic Study of Atherosclerosis
Covariates
Hazard Ratios (95% C.I.)1 Mantel-
Haenszel
log-rank
test
White African
American Hispanic Chinese
Ankle -
brachial index
< 0.9 1.11
(0.57 - 2.17)
0.78
(0.40 - 1.54)
1.39
(0.56 - 3.44)
2.95
(0.69 - 12.56)
0.1195 0.9 - 1.3 1.00 1.00 1.00 1.00
> 1.3 0.60
(0.26 - 1.37)
0.61
(0.14 - 2.58)
0.97
(0.34 - 2.74)
0
-
C reactive
protein (mg/L)
0.998
(0.963 - 1.035)
0.992
(0.956 - 1.03)
1.03
(0.99 - 1.07)
1.05
(0.96 - 1.15) 0.9191
Interleukin-6
(pg/mL)
0.99
(0.87 - 1.13)
1.11
(0.94 - 1.30)
0.90
(0.72 - 1.12)
0.94
(0.65 - 1.36) 0.7761
Mean
Agatston
Calcium Score
1.001
(1.0005 - 1.002)
1.0007
(1.0004 - 1.0009)
1.0005
(1.0002 - 1.0008)
1.001
(1.0008 -
1.002)
< 0.001
Urinary
albumin
(mg/dL)
0.98
(0.95 - 1.02)
1.004
(1.000 - 1.01)
1.003
(0.999 - 1.006)
0.96
(0.91 - 1.01) 0.3565
Fibrinogen
Antigen
(mg/dL)
1.003
(1.0004 - 1.005)
1.004
(1.001 - 1.007)
1.0009
(0.997 - 1.004)
0.999
(0.992 - 1.006) 0.9807
D-dimer
(μg/mL)
1.31
(1.04 - 1.65)
1.02
(0.87 - 1.20)
1.03
(0.83 - 1.26)
0.85
(0.29 - 2.51) 0.3335
Total
Homocysteine
(μmol/L)
0.997
(0.956 - 1.040)
0.997
(0.946 - 1.052)
1.06
(1.003 - 1.13)
1.04
(0.91 - 1.19) 0.0057
1 – Multivariable analyses adjusted for age, sex, current smoking status, average number of cigarettes smoked per day,
study site, systolic blood pressure, diabetes, family history of heart attack, education, LDL cholesterol level, HDL
cholesterol level, triglyceride level, the interaction between triglyceride levels and sex, and the interaction between
mean Agatston calcium score and sex.
20
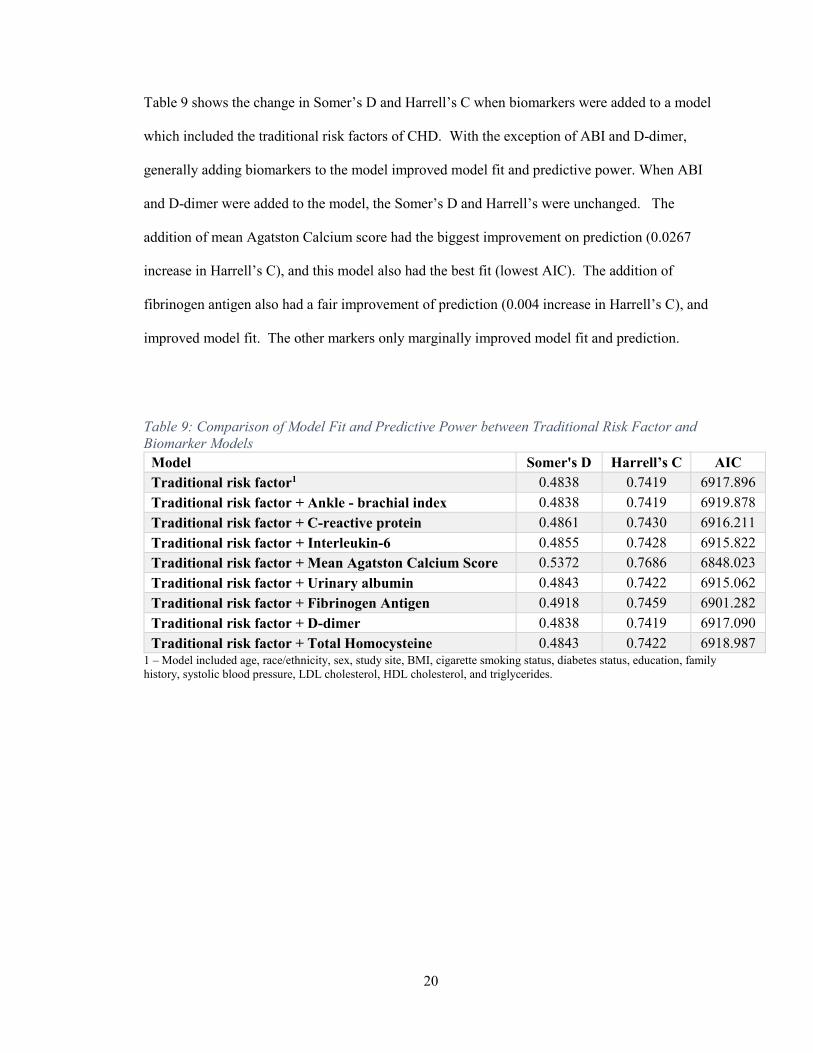
Table 9 shows the change in Somer’s D and Harrell’s C when biomarkers were added to a model
which included the traditional risk factors of CHD. With the exception of ABI and D-dimer,
generally adding biomarkers to the model improved model fit and predictive power. When ABI
and D-dimer were added to the model, the Somer’s D and Harrell’s were unchanged. The
addition of mean Agatston Calcium score had the biggest improvement on prediction (0.0267
increase in Harrell’s C), and this model also had the best fit (lowest AIC). The addition of
fibrinogen antigen also had a fair improvement of prediction (0.004 increase in Harrell’s C), and
improved model fit. The other markers only marginally improved model fit and prediction.
Table 9: Comparison of Model Fit and Predictive Power between Traditional Risk Factor and
Biomarker Models
Model Somer's D Harrell’s C AIC
Traditional risk factor1 0.4838 0.7419 6917.896
Traditional risk factor + Ankle - brachial index 0.4838 0.7419 6919.878
Traditional risk factor + C-reactive protein 0.4861 0.7430 6916.211
Traditional risk factor + Interleukin-6 0.4855 0.7428 6915.822
Traditional risk factor + Mean Agatston Calcium Score 0.5372 0.7686 6848.023
Traditional risk factor + Urinary albumin 0.4843 0.7422 6915.062
Traditional risk factor + Fibrinogen Antigen 0.4918 0.7459 6901.282
Traditional risk factor + D-dimer 0.4838 0.7419 6917.090
Traditional risk factor + Total Homocysteine 0.4843 0.7422 6918.987 1 – Model included age, race/ethnicity, sex, study site, BMI, cigarette smoking status, diabetes status, education, family
history, systolic blood pressure, LDL cholesterol, HDL cholesterol, and triglycerides.
21
Discussion
Among a multi-ethnic asymptomatic population without clinical cardiovascular disease, the
associations between consolidated and emerging biomarkers of heart disease and incident CHD
were examined by both univariate and multivariable analyses. The effect of including these
biomarkers in models containing the traditional risk factors of heart disease was also examined to
assess whether the biomarkers improved the predictive power of these models.
The results reported show that mean Agatston calcium score, urinary albumin, and fibrinogen
antigen were significantly associated with increased hazard of incident CHD after adjustment for
traditional cardiovascular risk factors. The Mantel-Haenszel log-rank tests showed that there
were statistically significant differences by sex in the estimates for ankle-brachial index, IL-6,
mean Agatston calcium score, urinary albumin, and D-dimer. There were also statistically
significant differences by race/ethnicity in the estimates mean Agatston calcium score and total
homocysteine. The addition of biomarkers to a model containing traditional risk was found to
improve model fit and prediction.
Coronary calcium has been shown to be a sensitive marker of early stages of atherosclerosis in
large prospective studies, and is a strong predictor of incident coronary heart disease. Increased
deposition of calcium in the coronary arteries cause the vessels to harden and narrow over time,
thus limiting the blood supply (and oxygen) to the heart (Detrano, et al., 2008) (Grossman,
Ehrlich, Shemesh, Koren-Morag, & Grossman, 2015). An analysis by Polonsky et al found that
adding coronary calcium scores to a prediction model based on traditional risk factors
significantly improved the classification of risk (Polonksy, et al., 2010). In this study, the addition
of mean Agatston calcium score had the biggest impact on prediction, and therefore, the results of
this study support these findings.
22
Urinary albumin has been shown to be associated with atherogenic changes in the cardiovascular
risk profile, and has been used to predict cardiovascular disease risk in patients with diabetes
(Weir, 2004). The mechanism linking elevated urinary albumin (microalbuminuria) to increased
cardiovascular risk is still unknown, but microalbuminuria has been suggested as a marker of
endothelial dysfunction and hyperpermeability to macromolecules, which occurs early in
atherogenesis (de Zeeuw, Parving, & Henning, 2006). In this study, while urinary albumin was
found to be significantly associated with incident CHD, its inclusion in the risk factor model only
marginally improved prediction. Therefore, the use of urinary albumin in predicting heart disease
needs to be examined further.
Fibrinogen is a marker of inflammation, which is produced when proinflammatory cytokines
from the vascular endothelium and from macrophages are secreted. Chronic inflammation has
been linked to heart disease as it is involved in all stages of atherosclerosis. Fibrinogen may
increase cardiovascular risk in several ways. It plays an important role in platelet aggregation,
plasma viscosity, and fibrin formation. Fibrinogen is an acute-phase reactant that is increased in
inflammatory states, and is involved in the formation of atherosclerotic plaque during the first
stages of coronary artery disease (CAD) (Libby, 2006).
Several studies have reported strong associations between fibrinogen levels and cardiovascular
outcomes. The Gothenburg study found that plasma fibrinogen levels were an independent risk
factor for MI and stroke in univariate analyses. The Framingham study also reported that the risk
of MI and stroke increased progressively with fibrinogen levels (Papageorgiou, Tousoulis, Siasos,
& Stefanadis, 2010). A meta-analysis by the Emerging Risk Factors Collaboration group also
found that including inflammatory biomarkers, namely CRP and fibrinogen, in prognostic models
improved model prediction. They concluded that including inflammatory markers in models
could prevent one additional cardiovascular event over a period of 10 years for every 400 to 500
persons at intermediate risk for a cardiovascular event who were screened (The Emerging Risk
23
Factors Collaboration, 2013). The analyses presented showed that fibrinogen was associated with
incident CHD, and also improved the model prediction, and thus support these findings.
Previous studies have found associations between other inflammatory markers like CRP and IL-6
and CHD. As such, it was expected that similar findings would have been observed in this
analysis. One possible explanation could be that there could be interaction between fibrinogen
and CRP, and IL-6, as all three markers are part of the inflammatory cascade that initiates plaque
formation.
D-dimer was significantly higher individuals with incident CHD, and was significantly associated
with CHD in the univariate analyses. However, when adjusted, the only association with CHD
was found in whites. D-dimer is an end product of fibrinolysis and may promote the
inflammatory cascade by activating neutrophils and monocytes, thus inducing the secretion of
inflammatory cytokines (e.g. IL-6) (McDermott, et al., 2007). A study by Pieper et al found that
African Americans had D-dimer levels 40% higher than those of whites, however in this analysis,
there was no statistically significant interaction between race/ethnicity and D-dimer levels
(Pieper, Rao, Currie, Harris, & Cohen, 2000). A meta-analysis performed by Danesh et al found
that there was a significant association between D-dimer and CHD after adjustment for smoking,
other classic risk factors for CHD, and indicators of socioeconomic status (Danesh, et al., 2001).
While including D-dimer in the prediction model did not improve model prediction, its
interaction with race/ethnicity should be examined further when evaluating its ability to predict
cardiovascular risk.
Homocysteine was also found to be significantly higher in individuals CHD, and was
significantly associated with CHD in the univariate analyses. However, when adjusted, the only
significant association with CHD was observed in Hispanics. Studies by Selhub et al and
Estrada et al have found that whites had the highest levels of homocysteine, followed by African
Americans, and Hispanics (Estrada & Billett, 2001). In this analysis, there was no significant
interaction between homocysteine and race/ethnicity, but there was a significant difference in the
24
hazard ratios for homocysteine by race. Homocysteine is an amino acid, and elevated levels of
homocysteine in the blood are thought to make a person more prone to endothelial cell injury,
leading to inflammation in the blood vessels which can in turn lead to atherogenesis. A meta-
analysis performed by Boushey et al in 1995 showed that a 5μmol/L increase in homocysteine
level increased the relative risk of CAD by the same amount as an increase of 20 mg/dL of total
cholesterol. However, most of the studies were cross-sectional and case-control (Marinou, et al.,
2005). A causal link between homocysteine and CHD has yet to be established (American Heart
Association, 2014). The relationships between race/ethnicity and homocysteine should be
considered further when evaluating homocysteine as a risk factor for CHD.
A secondary goal of this analysis was to assess the role of sex in the association between the
biomarkers and CHD. Only one biomarker, mean Agatston calcium score, had a statistically
significant interaction by sex. The sex stratified hazard ratios for mean Agatston calcium score
were also significantly different; and women had a slightly higher hazard ratio as compared to
men. Coronary calcium scanning was shown to have a significant contribution in accurately
detecting CHD in asymptomatic women, in addition to traditional cardiovascular risk (Youssef &
Budoff, 2012). The results of this study therefore support the role of Agatston score as a risk
stratification tool for women.
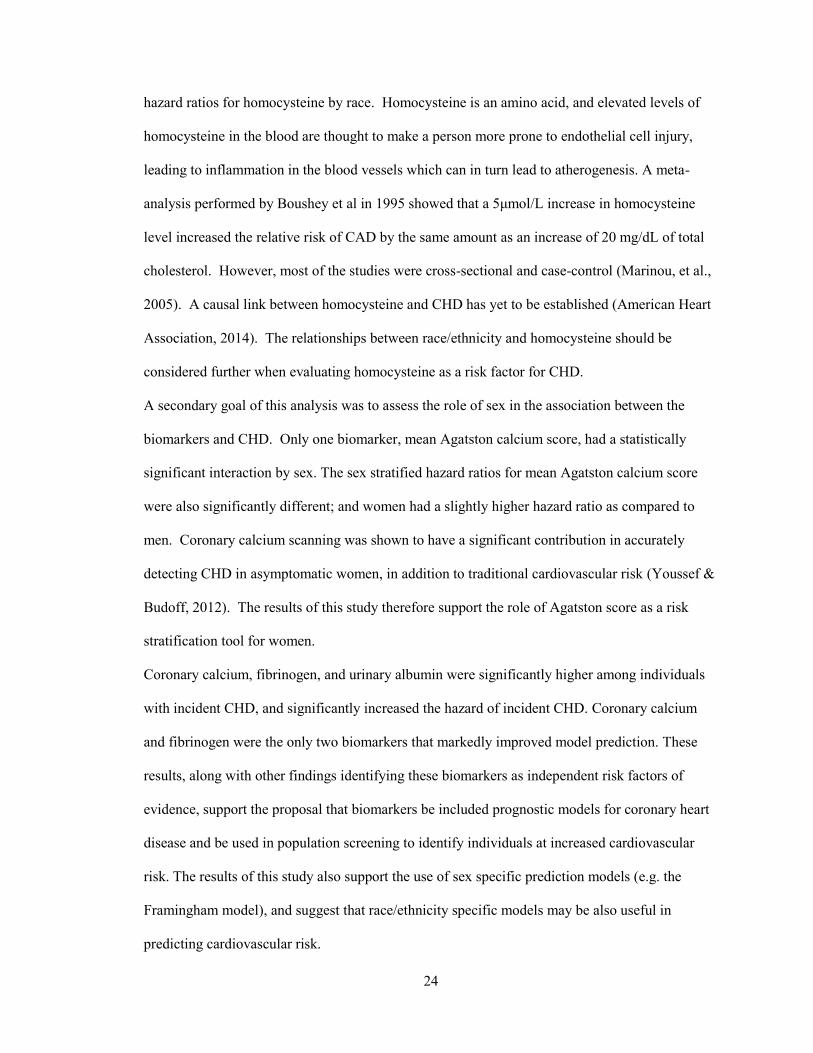
Coronary calcium, fibrinogen, and urinary albumin were significantly higher among individuals
with incident CHD, and significantly increased the hazard of incident CHD. Coronary calcium
and fibrinogen were the only two biomarkers that markedly improved model prediction. These
results, along with other findings identifying these biomarkers as independent risk factors of
evidence, support the proposal that biomarkers be included prognostic models for coronary heart
disease and be used in population screening to identify individuals at increased cardiovascular
risk. The results of this study also support the use of sex specific prediction models (e.g. the
Framingham model), and suggest that race/ethnicity specific models may be also useful in
predicting cardiovascular risk.
25
Strengths
This study has many strengths. The cohort was large, providing adequate power, and multi-
ethnic. MESA participants were also carefully characterised with respect to cardiovascular risk
factors. All blood samples were analysed centrally at one laboratory. Most cohorts used in
cardiovascular disease research have study populations that are predominantly male, but the
MESA cohort was sex-balanced (52.8% female). Therefore, the results of the study are likely
more externally valid. Because the MESA cohort includes persons of different ages and
ethnicities from across the United States, the results of the study may be generalizable to urban
middle aged and older Americans at risk for cardiovascular disease.
Limitations
There are several limitations to this study. There could be residual confounding present because
of unknown or unmeasured confounders. The correlation coefficients (Table 11 in the appendix)
indicate that there are weak to moderately positive relationships between some of the biomarkers.
However, the interactions between biomarkers, and between biomarkers and the traditional risk
factors of cardiovascular disease were not assessed.
There could also be selection bias in this analysis as participants were only included in the
analysis if they had information on all covariates of interest. Persons with missing data could
have been different to those with complete information. Furthermore, in some of the regression
models, the average number of cigarettes smoked per day was found to be significantly associated
with incident CHD. However, this was a self-reported variable and therefore was subject to
information bias.
Another limitation is that some of the associations observed could be due to chance because of
multiple comparison testing, which would have decreased the level of significance (α = 0.05).
26
Public Health Impact
Coronary calcium, fibrinogen, and urinary albumin were found to be significantly associated with
incident CHD. Coronary calcium is already used to detect CAD. However, more attention
should be placed on the inflammatory markers, and their role in predicting CHD should be
examined further.
Addition of biomarkers to regression models improved model fit and discrimination. Only 8
biomarkers were used in this study. However, newer research has identified over 60 biomarkers
of interest (Rollins, 2012). Therefore, further research needs to be done. Existing cardiovascular
cohort studies should add measurement of novel biomarkers to their study protocols, and new
cohort studies should also be developed to look at these biomarkers.
While more research is needed to improve the body of evidence, when developing models for
predicting heart disease, researchers may want to consider including biomarkers as they improve
the discrimination afforded by current heart disease risk factors, and may have the potential to
prevent additional cardiovascular events.
27
References
Appendices
Figure 1: Boxplots of Age, Urinary Albumin, BMI, CRP, Mean Agatston Calcium Score, and D-
dimer by Incident CHD.
40
50
60
70
80
AG
E A
T E
XA
M 1
No Yes
0
200
400
600
800
UR
INA
RY
ALB
UM
IN (
mg
/dL)
No Yes
10
20
30
40
50
60
BO
DY
MA
SS
IN
DE
X (
kg
)/(m
^2)
No Yes
02
04
06
08
0
C-R
EA
CT
IVE
PR
OT
EIN
(C
RP
) (m
g/L
)
No Yes
0
2,0
00
4,0
00
6,0
00
ME
AN
: A
GA
TS
TO
N C
AL
CIU
M S
CO
RE
No Yes
05
10
15
20
D-D
IME
R (
ug/m
L)
No Yes
28
Figure 2: Boxplots of Fibrinogen, HDL Cholesterol, IL-6, LDL Cholesterol, and Total
Homocysteine Concentrations, and Systolic Blood Pressure by incident CHD.
200
400
600
800
1,0
00
FIB
RIN
OG
EN
AN
TIG
EN
(m
g/d
L)
No Yes
05
01
00
150
HD
L C
HO
LE
ST
RO
L (
mg
/dL
)
No Yes
05
10
15
INT
ER
LE
UK
IN-6
(IL
-6)
(pg
/mL
)
No Yes
0
100
200
300
LD
L C
HO
LE
ST
ER
OL
(m
g/d
L)
50
100
150
200
250
SE
AT
ED
SY
ST
OLIC
BLO
OD
PR
ES
SU
RE
(m
mH
g)
No Yes
05
01
00
150
TO
TA
L H
OM
OC
YS
TE
INE
(tH
cy)
(um
ol/L
)
No Yes
29
Figure 3: Boxplot of Triglyceride Concentration by incident CHD.
Table 10: Correlation Coefficients
0
100
200
300
400
TR
IGL
YC
ER
IDE
S (
mg/d
L)
No Yes
trig1 -0.0314 0.1421 0.0646 0.0299 0.0271 0.0564 0.0259 -0.0256 0.0182 0.0649 0.0576 -0.4085 1.0000
hdl1 0.0827 -0.2140 -0.0094 -0.1086 -0.0637 -0.0401 -0.0404 0.0080 -0.0677 0.0112 -0.0676 1.0000
ldl1 -0.0430 0.0372 -0.0056 -0.0567 -0.0180 0.0373 0.1304 -0.0072 -0.0336 0.0155 1.0000
sbp1c 0.3629 0.1571 0.0970 0.1275 0.1063 0.1142 0.1282 0.0823 0.1205 1.0000
hcytot1 0.2194 0.0214 -0.0293 0.1087 0.1265 0.0626 0.0503 0.0659 1.0000
ddimer1 0.1382 0.0480 0.0717 0.1229 0.0798 0.0494 0.1221 1.0000
fib1 0.1641 0.2789 0.4278 0.3703 0.0404 0.1401 1.0000
ualbumn1 0.0315 0.0494 0.0618 0.0576 0.0422 1.0000
agatpm1c 0.2805 0.0025 -0.0321 0.0796 1.0000
il61 0.1295 0.3009 0.4375 1.0000
crp1 -0.0012 0.2859 1.0000
bmi1c -0.0916 1.0000
age1c 1.0000
age1c bmi1c crp1 il61 agatpm1c ualbumn1 fib1 ddimer1 hcytot1 sbp1c ldl1 hdl1 trig1
30
Table 11: Results of Shapiro-Wilks Tests for Normality of Continuous Variables
Variable Obs W V z Prob>z
Age (years) 5941 0.9752 78.31 11.502 0.00000
BMI 5941 0.95872 130.362 12.847 0.00000
Average number of cigarettes
smoked per day 5941 0.50794 1553.806 19.383 0.00000
C-reactive protein (mg/L) 5941 0.59932 1265.249 18.841 0.00000
Interleukin-6 (pg/mL) 5941 0.77816 700.527 17.282 0.00000
Mean Agatston Calcium Score 5941 0.49003 1610.342 19.477 0.00000
Urinary albumin (mg/dL) 5941 0.09532 2856.744 20.989 0.00000
Fibrinogen Antigen (mg/dL) 5941 0.97222 87.725 11.802 0.00000
D-dimer (μg/mL) 5941 0.26557 2319.149 20.44 0.00000
Total Homocysteine (μmol/L) 5941 0.64308 1127.062 18.536 0.00000
Systolic blood pressure (mmHg) 5941 0.96947 96.412 12.051 0.00000
LDL Cholesterol (mg/dL) 5941 0.98926 33.906 9.294 0.00000
Triglycerides (mg/dL) 5941 0.91073 281.884 14.881 0.00000
HDL Cholesterol (mg/dL) 5941 0.94025 188.686 13.822 0.00000
31
Figure 4: Kaplan Meier Curves and Log rank p-values for ABI, Age, Diabetes Status, and
Education.
Log-rank p-value = < 0.001
0.0
00.2
50.5
00.7
51.0
0
Cum
ula
tive p
roport
ion
0 1000 2000 3000 4000 5000Time to CVD event (days)
ABI = 0.9 - 1.3 ABI <0.9
ABI >1.3
Log-rank p-value = < 0.001
0.0
00.2
50.5
00.7
51.0
0
Cum
ula
tive p
roport
ion
0 1000 2000 3000 4000 5000Time to CVD event (days)
45-54 years 55-64 years
65-74 years 75-84 years
Log-rank p-value = < 0.001
0.0
00.2
50.5
00.7
51.0
0
Cum
ula
tive p
roport
ion
0 1000 2000 3000 4000 5000Time to CVD event (days)
Not diabetic Diabetic
Log-rank p-value = 0.9648
0.0
00.2
50.5
00.7
51.0
0
Cum
ula
tive p
roport
ion
0 1000 2000 3000 4000 5000Time to CVD event (days)
Less than high school
At least high school completed
32
Figure 5: Kaplan Meier Curves and Log-Rank p-values for Sex, Family History of Heart Attack,
Race, and Study Site.
Log-rank p-value = < 0.001
0.0
00.2
50.5
00.7
51.0
0
Cum
ula
tive p
roport
ion
0 1000 2000 3000 4000 5000Time to CVD event (days)
Female Male
Log-rank p-value = < 0.001
0.0
00.2
50.5
00.7
51.0
0
Cum
ula
tive p
roport
ion
0 1000 2000 3000 4000 5000Time to CVD event (days)
No family history
Family history
Log-rank p-value = 0.0395
0.0
00.2
50.5
00.7
51.0
0
Cum
ula
tive p
roport
ion
0 1000 2000 3000 4000 5000Time to CVD event (days)
White African American
Hispanic Chinese
Log-rank p-value = 0.1660
0.0
00.2
50.5
00.7
51.0
0
Cum
ula
tive p
roport
ion
0 1000 2000 3000 4000 5000Time to CVD event (days)
UCLA WFU COL
JHU UMN NWU
33
Figure 6: Kaplan Meier Curve and Log rank p-value for Current Smoking Status.
Figure 7: Clog-log plots for ABI, Age, Diabetes Status, and Education.
Log-rank p-value = 0.0002
0.0
00
.25
0.5
00
.75
1.0
0
Cum
ula
tive p
rop
ort
ion
0 1000 2000 3000 4000 5000Time to CVD event (days)
Never Smoker Former Smoker
Current Smoker
24
68
10
-ln[-
ln(S
urv
ival P
robabili
ty)]
4 5 6 7 8ln(analysis time)
ABI = 0.9 - 1.3 ABI <0.9
ABI >1.3
24
68
-ln[-
ln(S
urv
ival P
robabili
ty)]
4 5 6 7 8ln(analysis time)
45-54 years 55-64 years
65-74 years 75-84 years
24
68
10
-ln[-
ln(S
urv
ival P
robabili
ty)]
4 5 6 7 8ln(analysis time)
Not diabetic Diabetic
24
68
10
-ln[-
ln(S
urv
ival P
robabili
ty)]
4 5 6 7 8ln(analysis time)
Less than high school
At least high school completed
34
Figure 8: Clog-log plots for Sex, Family History of Heart Attack, Race, and Study Site.
Figure 9: Clog-log plot for Current Smoking Status.
24
68
-ln[-
ln(S
urv
ival P
robabili
ty)]
4 5 6 7 8ln(analysis time)
Female Male
24
68
-ln[-
ln(S
urv
ival P
robabili
ty)]
4 5 6 7 8ln(analysis time)
No family history
Family history
24
68
-ln[-
ln(S
urv
ival P
robabili
ty)]
4 5 6 7 8ln(analysis time)
White African American
Hispanic Chinese2
34
56
7
-ln[-
ln(S
urv
ival P
robabili
ty)]
4 5 6 7 8ln(analysis time)
UCLA WFU COL
JHU UMN NWU
24
68
-ln[-
ln(S
urv
ival P
rob
ab
ility
)]
4 5 6 7 8ln(analysis time)
Never Smoker Former Smoker
Current Smoker
35
Bibliography
Ahmad, T., Fiuzat, M., Felker, G. M., & O'Connor, C. (2012). Novel biomarkers in chronic heart
failure. Nature Reviews Cardiology, 9, 347-359.
Ahmad, T., Fiuzat, M., Neely, B., Neely, M., Pencina, M. J., Kraus, W. E., . . . Felker, G. M.
(2014). Biomarkers of Myocardial Stress and Fibrosis as Predictors of Mode of Death in
Patients with Chronic Heart Failure. JACC Heart Failure, 2(3), 260-268.
American Heart Association. (2014, March 18). Homocysteine, Folic Acid and Cardiovascular
Disease. Retrieved from American Heart Association: American Heart Association
Banka, C. L., Mosca, L., Benjamin, E. J., Berra, K., Bushnell, C., Dolor, R. J., . . . Wenger, N. K.
(2007). Evidence-Based Guidelines for Cardiovascular Disease Prevention in Women:
2007 Update. Journal of the American College of Cardiology, 49(11), 1230-1250.
Bayes - Genis, A., Zhang, Y., & Ky, B. (2015). ST2 and Patient Prognosis in Chronic Heart
Failure. American Journal of Cardiology, 115(7), 64B-69B.
Bild, D. E., Bluemke, D. A., Burke, G. L., Detrano, R., Diez Roux, A. V., Folsom, A. R., . . .
Tracy, R. P. (2002). Multi-ethnic study of atherosclerosis: objectives and design.
American Journal of Epidemiology, 156(9), 871-81.
Carson, A. P., Howard, G., Burke, G. L., Shea, S., Levitan, E. B., & Muntner, P. (2011). Ethnic
Differences in Hypertension Incidence Among Middle-Aged and Older Adults: The
Multi-Ethnic Study of Atherosclerosis. Hypertension, 57, 1101-1107.
Centers for Disease Control and Prevention. (2015, February 19). Heart Disease Facts. Retrieved
from Centers for Disease Control and Prevention:
http://www.cdc.gov/heartdisease/facts.htm
Danesh, J., Whincup, P., Walker, M., Lennon, L., Thomson, A., Appleby, P., . . . Lowe, G. D.
(2001). Fibrin D-Dimer and Coronary Heart Disease: Prospective Study and Meta-
Analysis. Circulation, 103, 2323-2327.
de Zeeuw, D., Parving, H.-H., & Henning, R. H. (2006). Microalbuminuria as an Early Marker
for Cardiovascular Disease. J Am Soc Nephrol, 17, 2100-2005.
Detrano, R., Guerci, A. D., Carr, J. J., Bild, D. E., Burke, G., Folsom, A. R., . . . Kronmal, R. A.
(2008). Coronary calcium as a predictor of coronary events in four racial or ethnic
groups. New England Journal of Medicine, 358(13), 1336-45.
Estrada, D. A., & Billett, H. H. (2001). Racial Variation in Fasting and Random Homocysteine
Levels. American Journal of Hematology, 66, 252-256.
Grossman, C., Ehrlich, S., Shemesh, J., Koren-Morag, N., & Grossman, E. (2015). Coronary
Artery Calcium and Exercise Electrocardiogram as Predictors of Coronary Events in
Asymptomatic Adults. American Journal of Cardiology, 115, 745-750.
Hlatky, M. A., Greenland, P., Arnett, D. K., Ballantyne, C. M., Criqui, M. H., Elkind, M. S., . . .
AHA Expert Panel on Subclinical Atherosclerotic . (2009). Criteria for evaluation of
novel markers of cardiovascular risk: a scientific statement from the American Heart
Association. Circulation, 119(17), 2408-16.
36
Johns Hopkins Medicine. (n.d.). Cardiovascular Disease Statistics. Retrieved from Johns
Hopkins Medicine:
http://www.hopkinsmedicine.org/healthlibrary/conditions/cardiovascular_diseases/cardio
vascular_disease_statistics_85,P00243/
Keller, C., Katz, R., Cushman, M., Fried, L. F., & Shilpak, M. (2008). Association of kidney
function with inflammatory and procoagulant markers in a diverse cohort: A cross-
sectional analysis from the Multi-Ethnic Study of Atherosclerosis (MESA). BMC
Nephrology, 9(9).
Libby, P. (2006). Inflammation and cardiovascular disease mechanisms. American Journal of
Clinical Nutrition, 83, 4565-60S.
Liquori, M. E., Christenson, R. H., Collinson, P. O., & deFilippi, C. R. (2014). Cardiac
biomarkers in heart failure. Clinical Biochemistry, 47, 327-337.
Malik, S., Budoff, M. J., Katz, R., Blumenthal, R. S., Bertoni, A. G., Nasir, K., . . . Wong, N. D.
(2011). Impact of Subclinical Atherosclerosis on Cardiovascular Disease Events in
Individuals With Metabolic Syndrome and Diabetes: The Multi-Ethnic Study of
Atherosclerosis. Diabetes Care, 34, 2285-2290.
Marinou, K., Antoniades, C., Tousoulis, D., Pitsavos, C., Goumas, G., & Stefanadis, C. (2005).
Homocysteine: A Risk Factor for Coronary Artery Disease? Hellenic Journal of
Cardiology, 46, 59-67.
McDermott, M. M., Ferrucci, L., Guralnik, J. M., Tian, L., Green, D., Liu, K., . . . Criqui, M. H.
(2007). Elevated Levels of Inflammation, D-Dimer, and Homocysteine Are Associated
With Adverse Calf Muscle Characteristics and Reduced Calf Strength in Peripheral
Arterial Disease. J Am Coll Cardiol, 50(9), 897-905.
MESA Coordinating Center, University of Washington, Seattle. (2015). MESA Overview and
Protocol. Retrieved from MESA: http://www.mesa-
nhlbi.org/aboutMESAOverviewProtocol.aspx
MESA Coordinating Center, University of Washington. (2001). MESA Field Center Manual of
Operations [Exam 1]. Retrieved from MESA: http://mesa-
nhlbi.org/MesaInternal/Manuals.aspx
MESA Coordinating Center, University of Washington. (2014, August 4). MESA Baseline and
Exam 2 Methods | MESA Exam 1 Datasets. Retrieved from MESA: http://mesa-
nhlbi.org/MesaInternal/MesaData1.aspx
Newson, R. B. (2010). Comparing the predictive power of survival models using Harrell's c or
Somers' D. The Stata Journal, 10(3), 339-358.
Papageorgiou, N., Tousoulis, D., Siasos, G., & Stefanadis, C. (2010). Is Fibrinogen a Marker of
Inflammation in Coronary Artery Disease? Hellenic Journal of Cardiology, 51, 1-9.
Pieper, C. F., Rao, K. M., Currie, M. S., Harris, T. B., & Cohen, H. J. (2000). Age, functional
status, and racial differences in plasma D-dimer levels in community-dwelling elderly
persons. J Gerontol A Biol Sci Med Sci, 55(11), M649-57.
37
Polonksy, T. S., McClelland, R. L., Jorgensen, N. W., Bild, D. E., Burke, G., Guerci, A. D., &
Greenland, P. (2010). Coronary Artery Calcium Score and Risk Classification for
Coronary Heart Disease Prediction. Journal of the American Medical Association, 1610-
1616.
Regitz-Zagrosek, V. (2011). Sex and Sex Differences in Cardiovascular Disease. In S. Prigione,
& V. Regitz-Zagrosek, Sex and Sex Aspects in Clinical Management (pp. 17-45).
London: Springer Verlag.
Rollins, G. (2012, January 1). A Look at Emerging Cardiac Biomarkers: What Type of Analyte
will be the Most Informative? Retrieved from American Association for Clinical
Chemistry: https://www.aacc.org/publications/cln/articles/2012/january/cardio-
biomarkers
StataCorp. (2013). Stata Statistical Software: Release 13. College Station, Texas: StataCorp LP.
Takasu, J., Budoff, M. J., O'Brien, K. D., Shavelle, D. M., Probstfield, J. L., Carr, J. J., & Katz,
R. (2009). Relationship between coronary artery and descending thoracic aortic
calcification as detected by computed tomography: the Multi-Ethnic Study of
Atherosclerosis. Atherosclerosis, 204(2), 440-6.
Taylor, K., Vallejo-Giraldo, C., Schaible, N., Zakeri, R., & Miller, V. (2011). Reporting of Sex as
a Variable in Cardiovascular Studies using Cultured Cells. Biology of Sex Difference,
2(11), 1-7.
The Emerging Risk Factors Collaboration. (2013). C-Reactive Protein, Fibrinogen, and
Cardiovascular Disease Prediction. New England Journal of Medicine, 367(14), 1310-
1320.
Tison, G. H., Ndumele, C. E., Gerstenblith, G., Allison, M. A., Polak, J. F., & Szklo, M. (2011).
Usefulness of Baseline Obesity to Predict Development of a High Ankle Brachial Index
(From the Multi-Ethnic Study of Atherosclerosis). American Journal of Cardiology,
107(9), 1386-1391.
Vasan, R. S. (2006). Biomarkers of Cardiovascular Disease Molecular Basis and Practical
Considerations. Circulation, 113, 2335-2362.
Vondrakova, D., Malek, F., Ost'adal, P., Kruger, A., & Neuzil, P. (2013). New biomarkers and
heart failure. Cor et Vasa, 55, e345-e354.
Weir, M. R. (2004). Microalbuminiuria in type 2 diabetes: An important, overlooked
cardiovascular risk factor. Journal of Clinical HypeRtension, 6, 134-143.
Yeboah, J., Folsom, A. R., Burker, G. L., Johnson, C., Polak, J. F., Post, W., . . . Herrington, D.
M. (2009). Predictive Value of Brachial Flow-Mediated Dilation for Incident
Cardiovascular Events in a Population-Based Study: The Multi Ethnic Study of
Atherosclerosis. Circulation, 120(6), 502-509.
Youssef, G., & Budoff, M. J. (2012). Coronary artery calcium scoring, what is answered and
what questions remain. Cardiovascular DIagnosis and Therapy, 2(2), 94-105.

38
Curriculum Vitae
Zada Mohammed 929 N. Wolfe St., Apt #419
Baltimore, MD 21205
703-507-4001 • [email protected]
DATE AND PLACE OF BIRTH
7th March 1991
San Fernando, Trinidad, West Indies
EDUCATION
Master of Health Science (MHS) in Epidemiology Expected May 2015
Concentration: General Epidemiology and Methodology
Johns Hopkins Bloomberg School of Public Health, Baltimore, MD
Thesis: Biomarkers for the Prediction of Incident Coronary Heart Disease
Risk Science and Public Policy Certificate Expected May 2015
Johns Hopkins Bloomberg School of Public Health, Baltimore, MD
Bachelor of Science (BS) in Molecular Bioscience and Biotechnology November 2012
Minor: Statistics
Concentration: Spanish Language and Culture
Rochester Institute of Technology, Rochester, NY
WORK EXPERIENCE
Graduate Trainee March 2013 – August 2013
Caribbean Industrial Research Institute (CARIRI), Trinidad, West Indies
Analysed potable water samples by membrane filtration in the Food and General
Microbiology Laboratory.
Collected samples.
Prepared media and reagents. Maintained stock.
Trained new employees in potable water sample analysis.
TEACHING EXPERIENCE
Teaching Assistant March 2011 – May 2011
Rochester Institute of Technology, Rochester, NY
Assisted in leading the Introduction to Biology III laboratory.
Tutored students.
Graded student work.

39
PROFESSIONAL DEVELOPMENT
Language Skills: Conversational Spanish
Computer Skills: Proficient in STATA (biostatistics computing software); ArcMap (mapping
software); Crystal Ball (risk assessment software); Microsoft Office (Word, Excel, and
PowerPoint); research search engines including PubMed
Training: ISO 17025, PLEA Pass Programme
Memberships: American Public Health Association
HONOURS AND AWARDS
Postgraduate Scholarship
Government of the Republic of Trinidad and Tobago September 2013
Dean’s List
Rochester Institute of Technology September 2009 – November 2012
RIT Honours Programme
Rochester Institute of Technology September 2009 – May 2012
Best Design of Experiments Project
School of Mathematical Sciences, Rochester Institute of Technology May 2011
National Additional Scholarship in Mathematics
Government of the Republic of Trinidad and Tobago September 2009
RIT International Scholarship
Rochester Institute of Technology May 2009
RIT Honours Scholarship
Rochester Institute of Technology May 2009
UWI Open Scholarship
Faculty of Engineering, University of the West Indies, St. Augustine February 2009