Embed Size (px)
Citation preview

1
Biomarkers of environmental exposure:
genetic and epigenetic approaches
Chiara Scoccianti Imperial College London
Epidemiology and Public Health Department Thesis submitted for PhD degree
October 2011
2
Contents
List of abbreviations.............................. .............................................................5
Figures............................................ .....................................................................7
Tables ............................................. .....................................................................9
List of publications arising from this thesis...... .............................................11
Abstract ........................................... ..................................................................12
Chapter I: Introduction ............................ .........................................................13
Biomarkers in the molecular epidemiology of cancer..........................................13
Biomarkers for clinical use ..........................................................................14
Biomarker families ......................................................................................17
Challenges in applying biomarkers to epidemiological studies: pre-analytical
variations in large cohorts ...........................................................................22
Challenges in applying biomarkers to epidemiological studies: biomarker
validation.....................................................................................................26
Large scale biomarker analysis using “-omics” technologies: state of
validation.....................................................................................................29
Lung cancer: a paradigm to discover and validate biomarkers associated with
environmental exposures. ...................................................................................34
Epidemiology of lung cancer worldwide ......................................................36
Genetic and epigenetic modifications in tobacco-induced carcinogenesis of
the lung .......................................................................................................40
Protective effect of diet against cancer development..........................................52
Protective mechanisms of polyphenols and isothiocyanates: epigenetic
modulation ..................................................................................................55
Biomarkers of environmental exposure: genetic and epigenetic approaches .....63
Chapter II: Research Objectives .................... ..................................................65
Chapter III:Methylation patterns in sentinel genes in peripheral blood cells
of heavy smokers: influence of cruciferous vegetabl es in an intervention
study .............................................. ....................................................................67
Working Hypothesis ............................................................................................67
Materials and Methods........................................................................................69

3
Study design ...............................................................................................69
Statistical analysis.......................................................................................70
Laboratory Methods ....................................................................................71
DNA methylation analysis ........................................................................71
Bisulfite treatment of genomic DNA .........................................................71
PCR amplification.....................................................................................72
Purification and preparation .....................................................................73
Pyrosequencing reaction..........................................................................75
Results ................................................................................................................79
Life-style profiles in the different dietary groups .......................................79
Methylation patterns in individual markers ...............................................82
Influence of a 4-week dietary intervention ................................................83
Discussion ..........................................................................................................87
Chapter IV: Prevalence and prognostic value of TP53 KRAS and EGFR
mutations in NSCLC: the EUELC cohort............... ..........................................91
Working Hypothesis ............................................................................................91
Materials and Methods........................................................................................95
Study Design ..............................................................................................95
The EBTB and EUELC databases ...........................................................95
Selection of patients .................................................................................95
Life-style questionnaire ............................................................................97
Selection of tumour samples ....................................................................97
Statistical analysis.......................................................................................99
Laboratory Methods ..................................................................................101
Analysis of somatic mutations ................................................................101
Detection of TP53 mutations by dHPLC and sequencing ......................103
Detection of EGFR mutations by bidirectional sequencing.....................107
Detection of KRAS mutations by ME-PCR.............................................108
Detection of TP53 polymorphisms .........................................................109
Detection of TP53 haplotypes (PIN2-PIN3-PEX4) .................................109
Results ..............................................................................................................111

4
Mutation prevalence..................................................................................111
TP53 mutations.........................................................................................112
Patterns and distribution ...........................................................................112
Association with clinical/individual parameters .........................................116
TP53 mutations and p53 immunodetection...............................................124
TP53 polymorphisms ................................................................................124
TP53 haplotypes .......................................................................................129
EGFR mutations .......................................................................................133
KRAS mutations and Reproducibility of KRAS mutational analysis ..........133
Mutation prevalence and distribution in association with individual and
pathological parameters............................................................................135
Update of follow-up status for EUELC patients.........................................139
Prognostic significance of somatic mutations ...........................................142
Discussion ........................................................................................................149
Chapter V: General Discussion and Future Perspectiv es...........................154
References......................................... ..............................................................159

5
List of abbreviations
ADC Adenocarcinoma
ATP Adenosine triphosphate
CDKN2A Cyclin-dependent kinase inhibitor 2A
CI Confidence Interval
CpG Cytosine-phosphate-guanine
DF Disease free
dHPLC Denaturing high performance liquid chromatography
DNA Deoxyribonucleic acid
DNMT DNA methyltransferase
dNTP deoxyribonucleotidephosphates
EDTA Ethylenediaminetetraacetic acid
EGFR Epidermal Growth Factor Receptor gene
EPIC European Prospective Investigation into Cancer and Nutrition
EUELC European early lung cancer project
FDA Food and drug administration
FFQ Food frequency questionnaire
HDAC Histone deacetylase
HR Hazard ratio
IARC International agency for research on cancer
IQR Interquartile Range
ITC Isothiocyanate
KRAS Kirsten ras gene
LC Large cell carcinoma
LINE-1 Long interspersed nuclear element 1
ME-PCR Mutant enrichment PCR
MLH1 MutL homolog 1
MTHFR Methylenetetrahydrofolate reductase
NF-kB Nuclear factor-kappa B
NMR Nuclear magnetic resonance

6
Nrf2 Nuclear factor E2-related factor 2
NSCLC Non-small-cell lung cancer
PAH Polycyclic aromatic hydrocarbon
PCR Polymerase chain reaction
PD Progressive disease
RASSF1A Ras association domain-containing protein 1 isoform A
RFLP Restriction fragment length polymorphism
SAH S-adenosylhomocysteine
SCC Squamous cell carcinoma
SCLC Small cell lung cancer
SD Standard Deviation
SFN-Lys Sulforaphane lysine
SNP Single nucleotide polymorphism
TEAA Triethylammonium acetate
TKI Tyrosine Kinase Inhibitor
TNM International classification of malignant tumours
• T: size of the tumour and presence of invasion to nearby tissue
• N: presence of regional lymph nodes
• M: presence of distant metastasis
TP53 Tumour protein 53 gene

7
Figures
Figure 1: Medline publications and number of FDA-approved markers per year 17
Figure 2: Examples of biomarkers of exposure, of effect and of susceptibility....19
Figure 3: Theoretical correlation among the main biomarkers families ...............21
Figure 4: Estimated age-standardised lung cancer incidence rate per 100,000
individuals by country..........................................................................35
Figure 5: Four stages of the tobacco epidemic ...................................................37
Figure 6: Scheme linking tobacco-smoke carcinogens and lung cancer.............42
Figure 7: In vivo oxidative metabolic pathway of benzo(a)pyrene via hydrophilic
intermediates and formation of DNA adducts with guanine base........44
Figure 8: Codon distribution of TP53 mutations ..................................................47
Figure 9: Comparison between colon cancer incidence and red meat
consumption .......................................................................................53
Figure 10: Methyldonor through one-carbon metabolism....................................57
Figure 11: The basic structure of flavonoids and the chemical structure of
selected polyphenols ..........................................................................59
Figure 12: Interaction of EGCG with DNMT1......................................................60
Figure 13: Hydrolysis of glucosinolates...............................................................61
Figure 14: Schema representing the dietary recordings during the project.........70
Figure 15: Bisulfite treatment and example of DNA sequencing product ............72
Figure 16: The principle of pyrosequencing and the output pyrogram ................76
Figure 17: RASSF1A pyrogram of promoter methylation in sample 1 at the end of
the trial (T4 of supplemented diet)....................................................77
Figure 18: Plots of % methylation distribution in the selected genes and LINE1
sequences, by three dietary regimes ...............................................83
Figure 19: % methylation of LINE-1 and MTHFR by diet ....................................84
Figure 20: % methylation of INK4A, ARF, RASSF1A and MLH1 by diet.............85
Figure 21: LINE-1 and MTHFR % methylation at T0 and T4 for each diet..........86
Figure 22: Selection of patients from the EUELC database................................96
Figure 23: Selection of samples for mutational analysis .....................................98

8
Figure 24: Flow chart illustrating the main steps of the procedure for TP53 and
KRAS analysis ...............................................................................102
Figure 25: Negative and positive dHPLC controls.............................................105
Figure 26: Schematic representation of primers location on TP53 gene...........110
Figure 27: Panel A: Chromatogram of internal standards for TP53 exons 8-9;
Panel B: example of positive sample (id: 04-053-00-TfD) ..............113
Figure 28: Patterns of TP53 mutations broken down by type of base substitution:
Panel A: EUELC; Panel B: TP53 database ....................................114
Figure 29a-b: TP53 mutations distribution at exons 4 to 9................................115
Figure 30: CDA haplotype sample charged on a 3% gel. .................................129
Figure 31: Patterns of TP53 genotype distribution in the EUELC population and in
a Brazilian population.....................................................................132
Figure 32: EGFR mutation: exon 21, codon 836, CGC>CGT, Arg>Arg ............133
Figure 33: Panel A: wild type and mutant KRAS samples charged on a 3% gel;
Panel B: sequence of the mutant sample.......................................134
Figure 34: Cumulative incidence plots of the Progressive Disease risk for TP53,
KRAS and EGFR mutation.............................................................148

9
Tables
Table 1: Examples of storage recommendations for biomarkers ........................25
Table 2: Epigenetic study: list of genes and their putative biomarker function. ...68
Table 3: PCR mixtures........................................................................................73
Table 4: List of primers used in the pyrosequencing assay ................................74
Table 5: SFN-Lys and cruciferous vegetable intake by trial arm at T0 and T4....79
Table 6: Mean (g/day averaged on the 4-weeks intervention) and standard
deviation (SD) of selected food items for each dietary group ................80
Table 7: Age, selected lifestyle and dietary habits by dietary group on the 4-week
intervention; mean (SD).........................................................................81
Table 8: Median and Inter Quartile Range (IQR) of percentage methylation levels,
by gene, dietary group and time point (T0 and T4)................................84
Table 9: Genetic study: list of genes and their putative biomarker function ........94
Table 10: Characteristics of patients included in the analysis.............................98
Table 11: Detection limit of percent mutant DNA by dHPLC.............................103
Table 12: dHPLC conditions used for TP53 screening .....................................104
Table 13: PCR conditions for TP53 exons 4 to 9 ..............................................106
Table 14: Mutation prevalence in EUELC patients............................................111
Table 15: Prevalence of cases with mutations in more than one gene .............111
Table 16: TP53 mutation distribution by effect and type grouped into categories
for predicted effect on the protein ........................................................118
Table 17a-d: TP53 mutations classified into categories in relation to smoking 119
Table 18: TP53 smoking-related mutations in relation to smoking....................123
Table 19: p53 expression in association with TP53 status................................124
Table 20: TP53 status and polymorphisms.......................................................125
Table 21a-c: TP53 polymorphisms and clinical variables .................................126
Table 22: TP53 status among haplotypes.........................................................130
Table 23: TP53 haplotypes and clinical variables .............................................130
Table 24: KRAS status in the two centres.........................................................135
Table 25a-c: Biomarker status and clinical and smoking variables ...................136

10
Table 26: Percentage of missing values in clinical variables by participating
centre in 2007 ...................................................................................140
Table 27: Clinical status of EUELC patients before and after update of the
database ...........................................................................................141
Table 28: Clinical risk factors of disease progression .......................................142
Table 29: Associations between biomarkers and disease progression.............143
Table 30: Number of patients with available TP53 mutation status, by country 145
Table 31: Association between biomarkers and disease progression in the
French subgroup...............................................................................146

11
List of publications arising from this thesis
Scoccianti C, Ricceri F, Ferrari P, Cuenin C, Sacerdote C, Polidoro S, Jenab M,
Hainaut P, Vineis P, Herceg Z. Methylation patterns in sentinel genes in
peripheral blood cells of heavy smokers: Influence of cruciferous
vegetables in an intervention study. Epigenetics 2011; 1: 6(9).
Scoccianti C, Vesin A, Martel G, Olivier M, Brambilla E, Timsit JF, the EUELC
Collaborators, Brambilla C, Field JK, Hainaut P. Prevalence and prognostic
value of TP53, KRAS and EGFR mutations in the EUELC cohort. European
Respiratory Journal. Peer-reviewed.
I have performed all laboratory analyses, participated in managing collaboration
and produced data interpretation. Prof. Vineis, Dr. Hainaut, Dr. Herceg and Prof.
Field have designed the studies presented in this Thesis. I acknowledge strong
contribution in producing statistical data by Dr. Ricceri and Mr. Vesin. I express
my gratitude to Miss Martel and Mr Cuenin who taught me the techniques used in
this Thesis. I wish to sincerely thank my supervisors Prof. Paolo Vineis and Dr.
Pierre Hainaut for all the support and guidance received during my studies at
Imperial College and at the International Agency for Research on Cancer.
I dedicate this work to the endless love and enthusiasm of my family and
children.

12
Abstract
Exposure assessment in cancer epidemiological studies relies on measurable
intermediate molecular biomarkers with high sensitivity and specificity in order to
prevent common problems due to misclassification of exposure. Studies on the
early stages of carcinogenesis have helped to identify molecular changes that
are detectable in pre-cancerous lesions and that are thought to occur as the
result of specific exposures such as tobacco smoking. More recently, in vitro
evidence started to support the potential cancer-protective role of various micro-
nutrients acting through epigenetic and genetic mechanisms. Somatic mutations
in “master” cancer genes and modifications of epigenetic patterns in the promoter
region of specific genes involved in cell cycle, apoptosis or DNA repair may prove
good candidates of carcinogenic and dietary exposure even if the evidence that
these changes may be present and detectable in “normal” tissue are still scarce
(due in part to the practical and ethical difficulty to conduct experimental
prospective studies in healthy individuals).
In this thesis, I have developed two projects exploring the application of TP53,
KRAS, EGFR mutations and of DNA methylation changes as biomarkers of
exposure to tobacco smoking, in experimental and observational study designs.
Somatic mutations were analysed by dHPLC, ME-PCR, RFLP and sequencing
and DNA-methylation analysis was performed by pyrosequencing. Moreover,
somatic mutations were analysed in a prospective context of lung cancer
recurrence; also the capacity of dietary polyphenols and isothiocyanates to
modify methylation patterns in smokers was assessed in an intervention trial.
The results show that somatic mutations are good markers of different forms of
tobacco-related lung cancers but have limited short-term prognostic value, with
the exception of KRAS mutations in adenocarcinoma. Methylation data
suggested that a specific short-term dietary intervention may stabilize global
epigenetic (LINE1 DNA methylation) patterns in peripheral white blood cells.

13
Chapter I: Introduction
Biomarkers in the molecular epidemiology of cancer
The most important incentive for physicians and research scientists in the field of
cancer research is to detect cancer at an early stage, before it spreads and
becomes incurable. One of the most effective ways to achieve this goal is to
identify environmental and lifestyle factors that increase or reduce cancer risk, as
these factors will be the milestones on which prevention strategies can be built.
The field of molecular epidemiology integrates molecular biology techniques into
epidemiologic studies, with the aim of providing new insights into the distribution,
causes and mechanisms of diseases across human populations. The term was
first popularized in the context of infectious diseases, and was applied to cancer
research in the early 1980s, thus giving birth to the field of molecular cancer
epidemiology. Molecular cancer epidemiology aims to incorporate molecular
biomarkers into epidemiology in order to reveal mechanisms and pathways that
occur between initial exposure and the development of a characterized disease
(Perera and Weinstein 1982). The discovery of biomarkers that reflect exposure
to a carcinogen and/or its effect is of key interest, since cancer takes many years
to develop (a latency of 10–40 years between first exposure and clinical
diagnosis is commonly observed), thus offering a long temporal window for
preventive intervention. The biological interactions between different types of
carcinogens, e.g. initiators or promoters, as well as their interactions over time
have been well characterised in vitro and in animal models and there is now the
need to translate these findings into the clinic.
Biomarkers are commonly defined as biological measures of cellular, biochemical
or molecular alteration in a biological sample (such as human tissue, cell or fluid),
with the ability to predict the risk of human disease (Shulte and Perera 1993;
Rothman et al. 1995). A classic example of biomarkers study is that from

14
MacMahon and colleagues on the geographical correlation between urinary
estrogens concentration and breast cancer (MacMahon et al. 1982). This study
provided support for the hypothesis that estrogens are important in breast cancer
aetiology. Another essential contribution to the field of molecular cancer
epidemiology was to uncover the link between aflatoxin and initiation/progression
of hepatocellular carcinoma, in particular in the presence of hepatitis B virus
infection (Wild et al. 1993). This important discovery allowed the establishment of
prevention strategies for aflatoxin exposure in low resource countries where the
toxin was ingested daily through the diet. The validation of urinary adducts as
biomarker of exposure to aflatoxin (IARC 2002) was made possible by several
considerations: (i) the strong potency of aflatoxin as human carcinogen, (ii) the
availability of a relatively specific and sensitive biomarker highly correlated with
biologically effective dose and (iii) the availability in several populations of
individuals with very different exposure levels and patterns.
Biomarkers for clinical use
In many instances, a single biomarker lacks the sensitivity and/or specificity to
support unambiguous detection or monitoring of a cancer disease. Exceptions
include α-fetoprotein (AFP) levels that can be used for diagnosis, staging and risk
assessment of testicular teratoma (Diamandis et al. 2002). This serum marker is
also used for the detection and diagnosis of liver cancer, although high specificity
is only achieved at high levels of plasma AFP that are detected in only a fraction
of cancer patients (Luo et al. 2010).
Cancer biomarkers may also be useful to distinguish patients with respect to
clinical outcome ahead of a drug treatment. This capacity characterizes the
predictive value of a biomarker. The introduction into clinical practice of screening
breast cancer for oestrogen receptor positive status has represented a major
achievement, since those patients (which represent around 70% of breast cancer
patients) have a favourable prognosis, and more importantly, may better benefit

15
from endocrine treatment (McGuire et al., 1997; Harris et al. 2007). Nowadays,
virtually all clinical trials have introduced oestrogen and progesterone receptors
testing to distinguish between groups of breast cancer patients with different
responses to therapy and outcomes. Furthermore, rapid developments in the
identification of biomarkers distinguishing between different molecular
phenotypes of breast cancer provide valuable tools for assigning patients to
specific treatment protocols.
One of the most spectacular developments in using molecular cancer biomarkers
in clinical practice is the identification of specific oncogene mutations that
generate constitutively activated enzymes, which can be blocked by specific
pharmaceutical drugs. After the seminal example of Imatinib (Gleevec), which
blocks the activated c-KIT tyrosine kinase oncogene in some forms of leukaemia
and in gastro-intestinal stromal tumours, the “mutation biomarker/small drug”
paradigm is now applied with success to the treatment of lung adenocarcinomas,
in which activating mutations in the EGFR gene encoding the epidermal growth
factor receptor are common (in particular in never-smoking women). Patients with
this mutation have been shown to have excellent clinical response to treatment
by tyrosine kinase inhibitors Gefitinib (Iressa) or Erlotinib (Tarceva). In the past 5
years, a number of other “-inibs” (enzyme inhibitors) have been phased into
clinical trials to target specific molecular end-points in many different types of
cancers.
There exist many forms of tumour markers, such as hormones, enzymes,
receptors, genetic mutations, amplifications or translocation, to evaluate “normal
biologic processes, pathogenic processes, or pharmacologic responses to a
therapeutic intervention” (Biomarkers Working Group 2001). The main difficulty in
using biomarkers is to set up the conditions for their objective measure and
evaluation. In order to measure them both easily and reliably, assays must
provide high analytical and diagnostic sensitivity and specificity (Kulasingam and
Diamandis 2008).

16
This promise is offered by recent analytical technologies (e.g. gene-expression
profiling or protein arrays), which have significantly increased the number of
candidate DNA, RNA and protein biomarkers. Despite the advances in molecular
biology, there is still a considerable gap in translating these bench results into
bedside applications. Paraphrasing Taylor Coleridge, “there is water everywhere
but still little to drink”; in fact, even if the emerging biomarkers proposed are
countless, very few of them have been taken through the extensive validation
pipe-line required for their routine usage in clinical cancer care or in prevention.
Few biomarkers have been clinically approved by the US Food and Drug
Administration (FDA) and even less have been integrated into the clinical
practice. Figure 1 compares Medline publications under the keyword “cancer
biomarker” with the number of FDA-approved plasma protein markers per year
from 1994 up to 2003 (Ludwig and Weinstein 2005). While the number of
publications on biomarkers (and hence the number of candidate biomarkers) has
steadily increased, the number of biomarkers that went through full validation has
decreased. This comparison shows a gap between biomarker research and
clinical application. The main reason for this gap is the extensive workload and
costs associated with validation, which can sometimes discourage investment at
the level needed to fully evaluate a biomarker. Yet, in laboratory practice,
researchers are continuously confronted with the common drawback of lack of
appropriate biomarker validation. Lack of validation often appears when trying to
reproduce data from a published study; this could be either due to a lack of
robust validation in the original study, or to poor sensitivity and specificity of the
biomarkers identified, or, in the worst case, to over-optimistic presentation and
interpretation of initial data. As a result, it is often extremely difficult to validate
data and to repeat a study. Robust biomarkers and a low inter-operator and inter-
institution variability are eventually attained by setting, whenever possible, large
collaborative studies, since they enable the creation of laboratory standards and
the screening of a larger panel of samples (thus also increasing statistical
power).

17
Figure 1: Medline publications (with “biomarker” as heading, red squares; as text word, red circles) and number of FDA-approved markers per year (green triangles)
From Ludwig et al. 2005
Biomarker families
There are many different ways of classifying biomarkers. In molecular
epidemiology, the most accepted way is to distinguish between three broad
families of biomarkers (i.e. biomarkers of exposure, of effect and of
susceptibility), according to their contribution to the suspected chain of causality
linking environmental exposure to a disease end-point.
For IARC to classify an agent as carcinogenic to humans both exposures in vivo
(assessed on the basis of animal and human studies) and biological mechanistic
evidences are combined (IARC 2006). In fact, if the same biological response
occurs across species, there is higher probability that we are observing an
appropriate biomarker. Common examples of carcinogenic exposure that are
validated with reliable biomarkers are dietary toxins (e.g. aflatoxin B1), chemical
and physical carcinogens (e.g. UV), tobacco smoking, and alcohol beverages.

18
The carcinogenesis from exposure to cancer is a complicated picture where
multiple molecular and cellular events take place over a long period of time,
influencing each other and ultimately transforming a normal cell into a malignant,
neoplastic one. During this process, the cellular interaction with chemical or
physical carcinogens commonly leads to “initiation”, i.e. the acquisition of diverse
genetic and epigenetic alterations which somehow “prime” a target cell to
become cancerous. Further to initiation, a phase of “promotion” is required for the
clonal expansion of initiated cells; promotion is often defined as a reversible
and/or preventable event. Promotion then leads to irreversible “progression”,
which characterizes the evolution from benign to fully malignant, invasive lesions.
This general model, although largely questioned by many recent developments in
molecular cancer biology, still provides an elegant framework for identifying
biomarkers associated with different stages of carcinogenesis.
At least theoretically, at each step of the process it would be possible to define a
biomarker; either to assess exposure to potential environmental hazards, to gain
insight into disease mechanisms by describing early changes, to express
epiphenomena of preclinical disease or to understand acquired or inherited
susceptibility (Perera and Weinstein 2000; Vineis and Perera 2007). During
initiation, promotion or progression, different molecules or events may
accumulate in tissues or in biological fluids. Their effect may simply reflect
exposure or ongoing physiopathological changes without providing direct
evidence of detriment to survival and good health, or may prove to be associated
to the future or current, sub-clinical development of a disease. In the latter case,
biomarkers may provide a pre-clinical application and link a genotype to a
phenotype.
Biomarkers are commonly measured in easily accessible surrogate tissues, e.g.
urine or blood samples, and are broadly divided into three classes or “families”
(Figure 2). The classification is temporal and assumes that the carcinogenic
process is a continuum where one step leads to the following one. In reality

19
sometimes the classification overlaps, e.g., DNA adducts that are used as
biomarkers of exposure may also imply a biological effect since failure to repair
DNA adducts may lead to mutations in genes that “drive” carcinogenesis.
Figure 2 : Examples of biomarkers of exposure, of effect and o f susceptibility
In general, biomarkers of exposure are those biomarkers that can inform on the
nature of the process by which environmental factors have influenced or caused
carcinogenesis. In many instances, biomarkers of exposures are those that can
be detected in the early stages of the process. These biomarkers are preferably
specific to a particular chemical of exposure. Examples are biomarkers of internal
dose and of biologically effective dose of the exposure compound.
Biomarkers of effect reflect the biological effect that follows the initial exposure.
Examples are biomarkers of early biological effect, such as alterations in liver
enzyme levels and activity in subjects at high risk of chronic liver disease and
liver cancer. They also include anatomo-pathological markers of precursor
diseases such as metaplastic, hyperplastic or other atypical tissue lesions.
Environmental exposure
Internal doseBiologically
effective doseClinical disease
Biological effect
Chemicals,metabolites in blood, urine, tissues
DNA adducts,protein adducts
Gene mutation,Oncogene and TSG activation,Microsatellite instability
Biomarkers of exposure Biomarkers of effect
Biomarkers of susceptibilityGenetic/metabolic/DNA repair,Nutritional status,Immunological status

20
Biomarkers of effect may be non-specific to the carcinogenic agent but,
compared to biomarkers of exposure, they may better reflect complex exposures
and cumulative exposures over time.
Biomarkers of susceptibility indicate the often constitutive ability of an individual
to respond to a given exposure. Biomarkers of susceptibility may include gene
loci associated to risk for a particular type of cancer such as lung cancer
(Brennan et al. 2011), as well as polymorphisms of specific genes associated
with the metabolism of a compound that eventually alter the risk of cancer
(Boccia et al. 2009). Inherited genetic differences in metabolism are generally
small at the individual level, due to the sequential involvement of many different
enzymes in any metabolic pathway and to their redundancy. However, they may
become very significant at population level, and may result in different effects for
the same exposure across entire groups or populations. Many single nucleotide
polymorphisms (SNPs) may alter the expression or activity of a gene product and
may modulate the body response to a toxicant. Examples of biomarkers of
susceptibility are enzymes responsible for the metabolism of xenobiotics and for
DNA repair.
As in the case of biomarkers of exposure, the use of biomarkers of effect to
measure a disease outcome (typically cancer) in an epidemiological study may
increase the specificity and the sensitivity in defining the outcome. For example,
microarray-based techniques, used to measure the expression of a large number
of genes, have led to the discovery that breast cancers may show profoundly
different patterns of genetic expression, allowing their classification into up to six
sub-groups not easily distinguished on the basis of histopathological features.
These sub-classifications are now proving to be extremely helpful when
assigning patients to specific treatment regimens.
The proposed concept of “biomarkers families” suggests that if a member of a
family (i.e. category of biomarkers) is established as measurement of risk, then

21
other members too, as well as “relatives”, could be candidates as reliable
biomarkers, as suggested in Figure 3.
Figure 3: Theoretical correlation among the main bi omarkers families
Biomarkers of exposure, of effect and of susceptibility are all intermediate
biomarkers whose aim is to describe the endo-phenotype that develops during
the pathogenesis of environment-related diseases.
In particular, markers of internal dose measure the amount of compound (or its
metabolites) that the individual receives during exposure (Wild et al. 1990). Such
markers may give additional information on the compound itself, such as
revealing metabolites of other sources of exposure (including endogenous
exposure), or genetic polymorphisms for metabolic enzymes. The product of
interaction of a compound (or a class of compounds, such as polycyclic aromatic
hydrocarbons) with its site of toxicological action, e.g. DNA adducts or protein
adducts, is a marker of the compound’s biologically effective dose (sometimes
called tissue dose) (Denissenko et al. 1996; Jarabek et al. 2009). These
markers include types of DNA damage that directly reflect exposure to genotoxic
carcinogens. In the carcinogenesis process they immediately precede the
development of biomarkers of altered structure/function such as somatic
Adverse outcomeExposure sourceTarget site interaction
Biomarkers of susceptibility
Biomarkers of exposure Biomarkers of effects
Adverse outcomeExposure sourceTarget site interaction
Biomarkers of susceptibility
Biomarkers of exposure Biomarkers of effects

22
mutations, gene-promoter methylation and modifications of chromatin structure
(Downs 2007).
Biomarkers of effect may be extremely useful in understanding pathways and
mechanisms of carcinogenicity in relation to exposure. A common example is the
analysis of TP53 mutations in lung cancer in relation to smoking status (Hainaut
and Pfeifer 2001) since the pattern of mutations in lung cancers of non-smokers
is very different from that in smokers. The link between biological and
epidemiological findings was provided by studies on carcinogens present in
tobacco, and specifically on polycyclic aromatic hydrocarbons such as
benzo(a)pyrene, which induces G to T transversions at characteristic hotspots of
the tumour suppressor TP53.
In other cases, biomarkers of effect still encounter many challenges to provide
additional evidence for risk of an etiologically defined cancer. A highly promising
field is DNA methylation profiling in cancer cases. Recently methylation of the
CDKN2A promoter has been associated with tobacco smoking (Vaissière et al.
2009) and recurrence of early lung cancer stages (Brock et al. 2008).
Challenges in applying biomarkers to epidemiologica l studies: pre-
analytical variations in large cohorts
Analytical variations observed during biomarker validation can be due to both
biological inter- and intra-individual variations and to laboratory variation. The
degree of variability relates to the biomarker accuracy in measuring the relevant
exposure. Not only can the biomarker levels vary due to genetic and disease
states, but there are also important issues concerning sample collection, storage
conditions and quality controls of laboratory methods, statistics and reporting of
data. The reproducibility among laboratories reflects the measure of accuracy,
i.e. the measurement error of the biomarker which stay in between the
biomarker’s true value (or gold standard) and the measured biomarker.

23
Pre-analytical variation usually reflects accuracy in sample collection, storage
conditions and quality controls; analytical variation refers to laboratory methods,
statistics and reporting of data. These variations can be minimized by relying on
standard operating procedures during all phases of the analysis. Techniques
have to be reproducible, both intra and inter-laboratories, measurements have to
prove sensitive, accurate and precise, and references have to be available to
make results comparable over a period of time.
Well validated laboratory techniques are fundamental when studying the
causality of a certain biomarkers expression upon environmental exposure,
especially when the environmental exposure triggers very subtle changes in the
biomarker expression (as in the case of gene promoter methylation upon dietary
exposure). The validity of a laboratory assay is reflected in its reliability, i.e. how
often the same results are obtained from multiple retesting, ideally in different
laboratory contexts and using different instrument platforms, and it is correlated
to the measurement error and the stability of the biological sample.
Measurement error, to which laboratory analyses are prone, is also called
laboratory drift and can be due to a batch effect, to a storage effect or to repeated
freeze-thaw cycles (Rundle et al. 2005).
Batches are created whenever it is unfeasible to process all of the samples
together. Batch effects can create random noise or bias and are due to
technological issues (e.g. the number of wells in a PCR plate), to logistic issues
(e.g. transport and shipping limitations) or more simply to different availability of
laboratory staff. This effect may lead to a misclassification of the exposure
(Schulte and Perera 1993). In the ideal case of an even distribution of the
measurement error among cases and controls (non-differential error) it may lead
to an underestimation of the biomarker’s association with the disease; in case the
bias is unevenly distributed (differential error) it would be important to have the
same proportion of cases and controls in each batch, and in general all
measurements should be compared with a standard. In the present report, all

24
measurements have been conducted at least in duplicate with appropriate
controls in each batch and following validated laboratory procedures.
Storage effect may arise whenever samples are not analysed immediately after
collection; in fact, the level of some biomarkers can be easily influenced by both
storage conditions (Table 1) and duration. Since it may take many years for a
large multicenter study to assemble all samples and since biomarker levels can
decline over time, samples must be stored in a consistent manner that does not
vary by recruitment site and time, thus minimizing the storage effect on biomarker
levels.
A variant of the storage effect arises when the volume of sample used for a
particular test is smaller than the stored aliquots. Consequently, the remaining
portion of the aliquot is stored again and thus may undergo several freeze-thaw
cycles. Freeze-thaw cycles may alter chemical as well other properties of a
biological sample through several physical and chemical mechanisms (Brey et al.
1994); they can degrade DNA (Lahiri and Schnabel 1993) and the situation is
even more delicate for proteins, RNAs or metabolites. During freezing, the higher
concentration of solutes in the liquid phase increases ionic strength, as well as it
changes pH, and it may cause protein precipitation and denaturation (Van den
Berg and Rose 1959). Thus, since biomarker levels could be influenced by the
sequence in which the hypotheses are tested, the freeze-thaw cycles necessitate
careful planning.

25
Table 1: Examples of storage recommendations for bi omarkers
From Caboux et al. 2008

26
Challenges in applying biomarkers to epidemiologica l studies: biomarker
validation
During the past few decades, great efforts have been invested in the
identification of biomarkers of carcinogen exposure and early effects, and the
development of analytical methods for their detection and quantification. The
sensitivity of these assays may enable the measurement of the concentrations of
metabolites, or adducts with macromolecules, of many environmentally relevant
carcinogens at very low levels of exposure, or the detection and quantification of
early genetic effects (ECNIS 2006). Biomarkers must always undergo the critical
process of validation to ascertain their biological relevance to both exposure and
disease in order to assess the “accuracy, precision, and effectiveness of results”
(ECNIS 2007). The validity of an exposure biomarker might be compared with
that of other exposure assessment methods, such as questionnaires and
environmental monitoring. The main criteria to be met remain the relevance of
the biomarker to the exposure of interest, its specificity (e.g. chemicals often
share common metabolites) and the characteristics of the assay, including
sensitivity, source of variability and effect modifiers.
Validation is required for any new method to ensure that it is capable of giving
reproducible and reliable results, when it is used by different operators employing
the same equipment in the same or different laboratories. The type of validation
programme required depends entirely on the particular method and its proposed
applications.
Technical validity may be defined as the lack of systematic error in measuring the
biomarker in comparison to a standard. The degree of reproducibility is tested on
results obtained by analysing the same sample under a variety of normal test
conditions such as different analysts, laboratories, instruments, reagents and
different days (for dHPLC also matter assay temperatures and small variations in
mobile phase). Systematic errors may result from the methodology, the

27
instrument or the operator, and can affect both the accuracy and the precision of
the measurement.
The components of analytical validity are mainly sensitivity, specificity and test
reliability and they should apply to all kinds of biomarkers, including intermediate
biomarkers of exposure and early response. Sensitivity and specificity evaluate
how well the test detects the marker when it is present and when it is absent,
respectively. Sensitivity has two meanings: i) the proportion of true positive
results that the test will report as positive (i.e. absence of false negatives) and ii)
the ability to detect a small proportion of positive material in a large amount of
normal tissue (e.g. tumour DNA in a background of wild-type DNA). It is the first
meaning that we shall usually refer to when describing the performance of a
mutation detection assay, and of course it is desirable that the sensitivity is as
close to 100% as possible, although it is not easy to establish this other than by
empirical studies. Specificity is the absence of false positive results; only true
positives are scored in a 100% specific assay. In mutation detection, this can be
made more demanding by asking to report only pathogenic mutations and not
normal sequence variants. When detecting somatic mutations by
chromatography or DNA methylation levels by pyrosequencing for example, it is
important to define a limit of detection. This is the lowest concentration in a
sample that can be detected, but not necessarily quantified, under the stated
experimental conditions and once the background noise of the technique has
been reduced as much as possible. In particular, for somatic mutations that are
detected in a background of wild-type DNA, but in general for any screening
assay, the minimum percentage of biomarker should be inspected in comparison
to internal controls (both positives and negatives).
When a technique yields high sensitivity, we may have stronger confidence in
interpreting the correspondence of the measurement with a conceptual entity.
Example of a sensitive technique is immunohistochemistry for detecting the
stress-induced nuclear accumulation of p53 protein. Under stress conditions wild-
type p53 protein accumulates in the nucleus to block DNA synthesis and hence

28
cell division (Martinez et al. 1991); but it has a half-life of less than 20 minutes
and does not normally accumulate at levels that are high enough to be detectable
by immunohistochemical methods. In contrast, the mutated TP53 gene codes for
a protein that has a considerably prolonged half-life and that can be detected by
immunohistology. Accumulation of proliferating-cell nuclear p53 detected by
immunohistology is a sensitive method for assessing p53 abundance and status
in cancerous samples and is simple to perform (Melhem et al. 1995). However,
interpreting the results may sometimes be tricky since the absence of a
detectable protein may occur when TP53 gene contains a nonsense or frameshift
mutation. Therefore, when this technique is followed by a validated one for TP53
mutation detection (e.g. dHPLC and/or bidirectional sequencing), we obtain a
robust laboratory method for screening somatic mutations in lung cancer.
Biomarker validation requires the choice of the appropriate target sample for
measurement. Biomarkers can be measured in exhaled air, blood, urine and in
tissue samples. Often the actual target organ or cell is not readily available for
measurements and biomarkers of exposure are thus often surrogate measures of
doses or effects at the target. The ideal biomarker has been described as
chemical-specific, detectable at low levels, inexpensive to analyse and
quantitatively related to prior exposures (Kulasingam and Diamandis 2008). The
ideal biomarker should also be available using non-invasive techniques, meaning
that biological materials should be easily accessible in sufficient amounts under
routine conditions and without unacceptable discomfort or health risk for the
patient. For these reasons blood and urine are most commonly used as source of
biomarkers, since cells in blood may provide surrogate endpoints for the effects
in internal organs. Hair, teeth, nails and exfoliated buccal cells have also been
used for biomonitoring, but knowledge of these media requires further
improvement and validation (Esteban and Castano 2009). The choice of target
material may also influence the exposure time that a marker will reflect. Levels of
chemicals in blood usually reflect a short time period of exposure (a few hours or
days) whereas adduct levels in urine may reflect a much longer time of exposure.

29
After data collection, one can evaluate the ability of the marker to describe
exposure and its specificity and selectivity. The relationship of the biomarker to
the observed effects may be then investigated by evaluating a dose-response
pattern. Possible shortcomings arising at this stage could be a lack of
pharmacokinetic models describing a certain compound’s metabolism or a
substantial endogenous production of the studied biomarker. For example, in the
case of formaldehyde, the normal endogenous metabolism in humans is higher
that the recorded occupational exposure limits, suggesting the need to look for
alternative biological sources of the biomarker. In other words, it is important in
this case both to establish practical thresholds for the exogenous compound and
to improve the sensitivity of the assays.
Large scale biomarker analysis using “-omics” techn ologies: state of
validation
In recent years, the field of biomarkers has considerably expanded and gained in
complexity through the emergence of technologies collectively identified as
“omics”, allowing the simultaneous analysis of multiple markers in a single
specimen. The use of the suffix “-omics” entails extensive coverage of a
particular type of molecule and analysis of the whole set of this particular
molecule in a given specimen target. Thus, genomics, proteomics and
metabonomics encompass the analysis of, respectively, the whole genome,
proteome and metabonome. From a methodological viewpoint, -omics
techniques often consist in the multiplexing of the same techniques as those
used for detection of a single biomarker, within a miniaturized matrix (micro-
array). Thus, all the problems and difficulties in biomarker discovery, assessment
and validation are the same for -omics as for single-biomarker approaches.
There are however two major differences. First, with “omics”, a new type of
biomarker can be defined, arising from the identification of a pattern of changes

30
simultaneously affecting a wide range of molecules (thus defining a “signature”).
Second, the analysis of data from “omics” and, significantly, the identification of
“signatures” critically depend upon heavy computing capacity (bioinformatics).
Therefore, with “omics”, the problem of biomarker validation is compounded by
adding to logistic and laboratory issues, a whole range of issues including
bioinformatic methods, biostatistics and availability of extensive databases
serving as resources for the correct identification of biomarkers.
-Omics technologies offer means for characterizing exposures to several
important classes of environmental and life-style factors with a multi-targets
approach. The integration of complementary –omics technologies open the path
towards a more complete systems biology model which highlights novel
responses to exposure within particular biological pathways. The concept is
particularly appealing when studying intermediate biomarkers and when
investigating the carcinogenic fingerprints of environmental exposure ahead of
disease onset.
Typical -omics fields are genomics, proteomics, metabolomics, as well as
transcriptomics and epigenomics. Genomics based biomarkers are found through
DNA chip-arrays, quantitative real time PCR, reverse transcriptase polymerase
chain reaction, DNA sequencing, fluorescent in situ hybridization etc. Gene
expression profiling of two to several thousand genes may provide diagnostic,
prognostic, or predictive information about tumours. Genomic microarrays
represent a powerful technology for gene-expression studies, arrays are high
resolution “lenses” which allow the analysis of a massive amount of data per
experiment, comprehensive of thousands of individual genes. Results from high-
density arrays have for instance enabled to classify breast cancer types into
prognostic categories based on the expression of certain genes (Weigelt et al.
2005). Unfortunately, despite these encouraging results, the use of gene-arrays
is still not recommended for widespread clinical use (Diamandis et al. 2006) since
validation studies often do not report high reliability of the original data.

31
The expression of proteins is often studied by proteomics. This type of “omics”
encompasses highly sophisticated pipe-line for the purification of a large variety
of proteins over several orders of magnitude of abundance, their fractionation into
small peptide units and the complete characterization of the mass and amino-
acid sequence of these peptides by mass spectrometry. The multiple individual
mass fragments are then automatically compared against databases to identify
and “reconstruct” the proteins from which they derive. Data from such proteomic
approaches can be used to discover new protein markers that can be further
assessed and validated using simpler, routine technologies such as
immunodetection (e.g. enzyme-linked immunosorbent assays). Alternatively,
complex peptidic patterns can be used to generate specific “signatures”, although
in this case it is often extremely difficult to ensure the reproducibility of analyses
across laboratories and instrument platforms (Chan et al. 2006).
The past few years have seen the advent of metabonomics (or metabolomics).
This methodology aims at providing an extensive identification of the set of
metabolites present in a given sample. It employs two complementary
technologies, mass spectrometry-based and 1H Nuclear Magnetic Resonance, to
process a variety of biological specimens. Analysis of metabolic fingerprints leads
to a list of metabolites that can be interpreted for mechanisms of toxicity as well
as for eventual biomarkers of exposure.
One of the most daunting challenges risen by the “-omics” is to summarize and to
purge the huge amount of data from spurious results. Bioinformatics has the
possibility to model the heterogeneity of pathways and to reveal shared biological
patterns (Abu-Asab et al. 2011) within the data. In the case of cancer, and after
clearing inconsistencies caused by logistical and technical problems, most of the
heterogeneity is due to the fact that clonal, driver and most likely irreversible
aberrations on one side and non-expanded, passenger or reversible aberrations
on the other side, are both potentially taking place during the carcinogenesis

32
process (Loeb et al. 2008). In cancer, clonal and mostly irreversible alterations
are hypothesized to drive the carcinogenic process by the selective pressure
given by a proliferative advantage. These alterations could act as potential
clinical biomarkers since they are the most common among individuals with the
same disease. Bioinformatics could map both “random” alterations occurring in a
subset of individuals and “common” alterations, and create models where shared
clonal alterations would be considered as the “baseline” reference. In this way it
would be possible to biologically describe the identity of diseased against normal
non-diseased specimens. Ideally, the resulting molecular pathway could be
translated into the clinical setting for early detection, diagnosis, prognosis and
treatment assessment.
As underlined in this introduction, the current approach of biomarker studies does
not entirely fulfil its immediate, explicit objective of finding new markers for
screening, detection or prognosis. Several methodological problems have been
identified including the lack of reproducibility of analytic methods or of data
analysis among different laboratories. Moreover, there is a lack of harmonization
on protocols for sample collection, processing and storage. In the case of
Genome-Wide Association Studies replication of findings is built into the study,
this is not common in molecular epidemiology studies. The ‘Strengthening the
Reporting of Observational Studies in Epidemiology’ (STROBE) initiative was
established aiming at providing guidance on how to report observational research
in order to improve the quality of reporting observational studies and studies
investigating associations between exposures and health outcomes (Gallo et al.
2011). These guidelines and recommendations have been recently
complemented by the BRISQ recommendations (Biospecimen Reporting for
Improved Study Quality, (Moore et al. 2011) which specifically address data
collection and annotation for specimen biobanks.
Although seen as «translational research», cancer biomarker research is actually
a new approach for understanding the mechanisms of carcinogenesis and the
33
power and flexibility of -omics technologies address molecular carcinogenesis on
a wider scale. Biomarkers could be successful in identifying similarities among
patient subgroup, by focusing on specific pathways to molecularly define a
subset of tumours categorized at diagnosis. A big achievement would be
represented by discovering biomarkers that provide the best stratification of
clinical outcome, in order to reliably target patients who are most likely to benefit
from a particular agent. Consequently, biomarkers should demonstrate evidence-
based clinical validity and utility in prospective, well-designed clinical studies
across multiple institutions, with well-established standards for laboratory
analyses and assessment of exposures. Once the validation of a personalized
medicine based on the discovered biomarkers occurs, it remains to evaluate if
the commercial incentives to develop these complex assays are in place for a
broader clinical use. In fact, the financial aspect of the overall process should
also be carefully considered, since the biomarker must be identified, an assay to
measure it reliably in clinical samples (ideally in a non-invasive manner) must be
developed and the usefulness of the biomarker to make a clinical distinction must
be demonstrated.
In conclusion, the concept of “personalized medicine” must be addressed with
caution since implementing biomarkers requires clinical trials and robust,
reproducible evidence through systematic technical and epidemiological
validation studies.

34
Lung cancer: a paradigm to discover and validate b iomarkers associated
with environmental exposures
Lung cancer is the most common cancer in the world today (12.7% of all new
cancers, 18.2% of cancer deaths with a ratio of mortality to incidence of 0.86).
There were an estimated 1.61 million new cases and 1.38 million deaths in 2008.
In Figure 4, from Globocan 2008, the age-standardized prevalence rates for men
and women are combined to generate total prevalence. It has to be taken into
account that there are important gender differences in incidence, where lung
cancer is the most common cancer in men worldwide (1.1 million cases, 16.5% of
all cancers) and the fourth most frequent cancer in women (516000 cases, 8.5%
of all cancers).
In industrialized countries, the past century has witnessed a lung cancer
epidemic due to tobacco smoking. Despite progress in smoking prevention in
many developed countries, this tobacco-related lung cancer epidemic is
spreading at an unabated rate in many emerging and low-resources countries.
Given the demonstrated role of tobacco carcinogens as causal agents for lung
cancer, this cancer represents a paradigm for research on biomarkers associated
with lifestyle habits and environmental exposures. Tobacco smoke is a complex
mixture that contains many carcinogens. Yet, despite its complexity and the wide
diversity of the patterns of exposure to tobacco, this exposure is measurable,
quantifiable and the risk associated with it has been well defined by numerous
large-scale epidemiological studies.
Therefore, studies in smokers and in patients with lung cancer associated with
smoking offer a perfect opportunity to discover, assess and validate biomarkers
of this particular form of environmental exposure. In this Thesis, I have used this
epidemiological context as focal point for developing different approaches on
biomarkers of exposures.

35
Figure 4: Estimated age-standardised lung cancer in cidence rate per 100,000 individuals by country
From Globocan (2008)

36
Epidemiology of lung cancer worldwide
The overwhelming majority of cancer cases are associated with environmental
factors. Only a fraction of lung cancer cases (5% to 10%) are caused by genetic
susceptibility and inheritance, although there is accumulating evidence that
genetic susceptibility plays an important role in modulating how an exposed
person responds to environmental lung carcinogens (Brennan et al. 2011). Lung
cancer is extremely strongly associated with smoking in developed/industrialized
countries and differences in geographical incidence are strongly linked to the
evolution of smoking-habits, particularly among women and in developing
countries. Industrialized countries in Northern and Western Europe, North
America, and the Western Pacific region are generally at approaching this stage.
Nearly 80% of the more than one billion smokers worldwide live in low- and
medium-income countries, where the burden of tobacco-related illness and death
is heaviest even if a proportion of lung cancer cases are attributable to causes
other than smoking (Youlden et al. 2008). Incidence lung cancer rates are high
but decreasing in Europe and Northern America, while low but increasing in
Middle and Western Africa. If trends continue, eight million people a year will die
from tobacco-related causes by 2030 and 80% of these deaths will occur in low-
and middle-income countries (WHO 2011).
The conceptual framework that links the various stages of the tobacco epidemic
into a continuum, rather than a series of isolated events is the WHO model of the
four stages of the evolving epidemic (Figure 5). The power of this model,
originally proposed by Lopez et al. (Lopez et la. 1994) is that it allows virtually
every country to find itself in relation to the larger pandemic.

37
Figure 5: Four stages of the tobacco epidemic
From Lopez et al. 1994
Almost all lung cancers are carcinomas, with other histologies counting for much
less than 1%. The disease is clinically divided into two subtypes: non-small-cell
lung cancer (NSCLC), representing almost 80% of all lung cancers, and small
cell lung cancer (SCLC) that comprise about 10-15% of cases (IARC 2007).
These two types of lung cancer are two different diseases, each with its own
recommended therapies.
NSCLC, which originates from bronchial or alveolar epithelial cells, is further
subdivided into three histological subtypes: adenocarcinoma (ADC; derived from
bronchioalveolar epithelial cells), squamous cell carcinoma (SCC; that arises
from bronchial epithelial cells through a squamous metaplasia/dysplasia process)
and large cell carcinoma (LC). SCLC, in contrast, originates from cells with
neuroendocrine differentiation that are present within the normal lung mucosa.
SCLC is composed of several different pathological entities distinguished by their
proliferative potential as well as histological characteristics. Both NSCLC and

38
SCLC, are strongly associated with tobacco smoking, although the magnitude of
this association differs between histological types.
In recent decades, the number of squamous cell carcinomas has decreased
while an increase of adenocarcinomas has been recorded. SCC represents 44%
of lung cancers in men and 25% in women worldwide except for certain Asian
populations (Chinese, Japanese) and North American (USA, Canada) where
ADC incidence exceed that of SCC in men. ADC represents 28% of lung cancer
cases in men and 42% in women worldwide. ADC is the most frequent histology
in women, particularly in Asian women, with the exception of Poland and England
where SCC predominates. Classically, tobacco smoking was considered to be
more strongly associated with SCC than with ADC but the incidence trends do
not correlate with the smoking prevalence. Changes in the manufacture and
composition of cigarettes (e.g. filters), and the corresponding changes in smoke
composition along with nicotine-compensating smoking patterns are suggested to
contribute to the observed epidemiologic profiles (Khuder 2001). Another
hypothesis is that the changes in cigarette composition have reduced the yield of
polycyclic aromatic hydrocarbons, inducers of SCC, while increasing the yields of
carcinogenic tobacco-specific N-nitrosamines, inducers of ADC (Hoffmann et al.
1997). These factors, along with advances in histological classification and
detection methods for tumours in the distal airways, have contributed to the
emerging predominance of ADC in lung cancers.
Lung cancer is one of the most insidious and aggressive neoplasms since it
usually causes clinical symptoms only at a stage when the tumour has already
invaded the lung parenchyma at least locally. Many patients who report with
symptoms – coughing, respiratory distress – already have advanced forms of
cancer. Furthermore, the perception of symptoms is often delayed because it is
blurred by the underlying background of chronic bronchitis that occurs in many
lifelong smokers. Resection remains the basis of therapy. However, fewer than
20 to 30% of lung cancer patients have lesions that are sufficiently localized to
allow local (lobular) tumour resection. The survival rate is 48% for completely

39
resected cases detected when the disease is still localized, but only 15% of lung
cancers are diagnosed at this early stage. As a result, the five-year overall lung
cancer survival rate is still very low at around 15% (Jemal et al. 2010) and
decreases by increasing stage of cancer at diagnosis. Combined modality
treatments including surgery, radiotherapy and chemotherapy, have greatly
progressed in the past 30 years. Still, a critical issue remains the frequency of
unnecessary treatments, thus indicating the need for biomarkers of early
diagnosis and appropriate therapy.
Lung cancer risk associated with tobacco smoking is strongly related to smoking
duration and declines with increasing duration of cessation (more rapidly for SCC
than ADC). Nevertheless, the estimated cumulative risk of lung cancer death
among former smokers remains high, ranging from approximately 6% in smokers
who quit smoking at the age of 50, to 10% for smokers who quit at age 60 and
started in early adulthood (around 18 years old), while that for lifetime smokers in
the United Kingdom was estimated between 9% and 16% (Doll et al. 2004).
The well established risk factor of tobacco smoking makes it a good model for
studying exposure to risk as well as to protective factors (e.g. dietary factors).
Screening for early lung cancer is being evaluated in a number of randomized
trials and it is possible that screening high-risk individuals might be of great
importance to public health intervention. Incorporating biomarkers of exposure
and early effect into studies will further clarify the effects of cumulative exposure,
smoking intensity and duration in relation to lung cancer risk and to subgroup
susceptibility.

40
Genetic and epigenetic modifications in tobacco-ind uced carcinogenesis of
the lung
The causal role of tobacco smoking in lung cancer incidence has been
recognized by public health and regulatory authorities since the mid-1960s and
first evaluated by the IARC Monographs in 1986 (IARC 1986) as a guide to
regulatory and public health agencies in their decision making. The strong dose–
response relationship between tobacco smoking and lung cancer previously
reported (Medical Research Council 1957) was again confirmed in both
questionnaire-based and biomarker-based studies (IARC 2004a).
Polycyclic aromatic hydrocarbons (PAHs), are formed as complex mixtures
during many combustion processes and are implicated in the causation of lung
cancer. The biomarker of exposure to PAHs that has been used in many studies
is the excretion of 1-hydroxypyrene in urine (Aquilina et al. 2010). Many PAHs
have been shown to be carcinogenic in animals via a genotoxic mode of action.
Benzo(a)pyrene is the best studied PAH and was recently classified as a human
carcinogen by IARC (IARC 2010). The strong dose–response relationship
between tobacco smoking and lung cancer (Medical Research Council 1957;
IARC 1986, 2004a and 2010) is confirmed by both questionnaire-based and
biomarker-based studies. However, not all smokers develop lung cancer,
indicating an inter-individual variation in susceptibility to tobacco smoke.
Accordingly, it is reasonable to assume that tobacco-related lung cancer is
caused by the interplay between tobacco smoke and other factors, including
environmental factors and individual (genetic or acquired) susceptibility.
Unravelling the molecular basis of tobacco carcinogenesis continues to inspire
epidemiological studies incorporating genetic, molecular markers and refined
statistical modelling techniques.
Molecular genetic studies have shown that lung cancer cells acquire a number of
genetic lesions, including activation of dominant oncogenes and inactivation of

41
tumour suppressor genes or recessive oncogenes (Hanahan and Weinberg 2000
and 2011). Several acquired characteristics of tumours can be caused by specific
point mutations. In smokers, the most common mutated genes are TP53 and
KRAS, the latter being primarily found in adenocarcinomas (ADC). In ADC in
never-smokers, after the identification of EGFR mutations in 2005, a wide panel
of oncogenes has been detected as recurrent target of mutations, including ALK,
PI3K, MET or BRAF (Sharma et al. 2010). This specificity in mutational targets
according to tobacco smoking status further supports the notion that tobacco
smoking causes lung cancer by inducing mutations in specific genes that directly
contribute to the cancer phenotype.
The role of TP53 as the ‘‘guardian of the genome’’ is central in forcing genetically
damaged cells into growth arrest, senescence or apoptosis. The p53 protein is a
transcription factor that regulates the expression of a large panel of genes
involved in multiple aspects of growth suppression and genetic stability. The
protein functions can be lost during the course of tumour progression, either
through inactivating mutations or via other mechanisms such as complex binding
of p53 to specific viral or cellular proteins. By switching off p53 functions, these
mutations facilitate the acquisition of the large number of genetic alterations
required for developing a fully invasive/metastatic phenotype. The accumulation
of such genetic changes is triggered by the numerous carcinogens as well as
inflammatory agents contained in cigarette smoke.
The scheme below shows the carcinogenic process leading to lung cancer
development (Figure 6).

42
Figure 6: Scheme linking tobacco-smoke carcinogens and lung cancer
From Hecht et al. 2003
Although many of these genetic changes may occur independently of histological
type, their frequency and timing of occurrence with respect to cancer progression
are different between SCLC and NSCLC. Furthermore, as described above, a
number of genetic and epigenetic differences have been identified between the
two main histological types of NSCLC, i.e. SCC and ADC, as well as between
smoking and non-smoking related cancers.
In a simplified view of the multistep carcinogenic process, three main stages can
be described for all cancers: initiation, promotion and progression. The initiation
stage is a rapid phase of interaction between the carcinogenic agent and the
target cell DNA. Most carcinogens in tobacco products require metabolic
activation before they can react with DNA, although some, such as ethylene
oxide, formaldehyde and acetaldehyde, can react directly. The response of the
organism to carcinogens is similar to that for any other foreign compound or drug.
Many carcinogens are lipophilic compounds that readily cross plasma
membranes to accumulate in the cytoplasm and the nucleus.

43
The metabolism involves phase I reactions, mainly mediated by microsomal
oxidases encoded by the cytochrome P450 gene superfamily, however, other
enzymes such as epoxide hydrolase 1 are involved as well. Cytochrome P450
enzymes, which are part of the mammalian systems designed to respond to
foreign compounds, catalyze the addition of an oxygen atom to the carcinogen,
increasing its water solubility and converting it to a metabolite that is more readily
excretable (Guengerich 2003). This “metabolic detoxification” process is further
assisted by phase II enzymes to convert the oxygenated carcinogen to a form
that is highly soluble in water. As far as this process is efficient, the organism will
be protected. However, some of the intermediates formed by the interaction of
cytochrome P450 enzymes with carcinogens are in fact quite reactive. Such
intermediates or metabolites generally possess an electrophilic center and can
react with nucleophilic guanines in DNA, resulting in the formation of DNA
adducts (Figure 7). The overall process is known as metabolic activation and
converts an un-reactive chemical (benzo(a)pyrene) into an intermediate (diol
epoxide) that covalently binds to DNA.
The equilibrium between metabolic activation and detoxification varies between
individuals; detoxification constitutes the most effective way of preventing cancer,
by blocking the genotoxic damage at the early stages of carcinogenesis. If DNA
adducts are bypassed by a DNA polymerase during the process of detoxification,
the resulting G:A and G:G mismatches cause G>T and G>C transversion
mutations. This phase is relatively long and marked by the establishment and
replication of mutated cells. Somatic mutations derived from DNA adducts can
contribute to cancer promotion and represent more specific endpoints than DNA
damage. Mutations can occur in reporter genes, such as HPRT (hypoxanthine-
guanine phosphoribosyltransferase) i.e., in genes not related to cancer
development but used as surrogates because they are relatively easily
evaluated, or can occur more specifically, e.g. in oncogenes or tumour
suppressor genes.

44
Figure 7 : In vivo oxidative metabolic pathway of benzo(a)pyrene via hydrophilic intermediates (I-IV) and formation of DNA adducts w ith guanine base
From Formenton et al. 2005
It has been established conclusively that PAH-DNA adducts derived from
cigarette-smoke carcinogens cause specific mutations, most frequently G>T, that
lead to miscoding (Pfeifer and Denissenko 1998, Hecht 2003). If growth
controlling genes are involved, these somatic mutations strongly contribute to
cellular transformation and the development of tumours. Recently, it has been
demonstrated (Anna et al. 2009) that carriers of G to T transversions also had a
high level of bulky DNA adducts in non-tumorous lung tissue, thus providing

45
evidence for tobacco-related carcinogenesis in lung cancer development. The
mutated cell(s) are selected in vivo because of their growth advantage (e.g. loss
of contact inhibition, loss of apoptotic pathways), which correlates with increased
genetic instability (i.e. the potential to acquire further advantageous genetic
changes) and with capability to metastasize (Beerenwikel et al. 2007). As a
result, proto-oncogenes (e.g. KRAS) and tumour suppressor genes (e.g. TP53
and CDKN2A) in particular, but also all genes involved in cell-cycle regulation,
tumour cell invasion, DNA repair, chromatin remodelling, cell signalling,
transcription, and apoptosis, are critical targets of mutations by carcinogens.
Damaged cells may be removed by apoptosis but if uncontrolled cell growth
persists, premalignant cells will gradually develop into neoplastic ones. This is
the final stage of tumorigenesis, the progression phase, where cells bear some or
all of the “hallmarks of cancer”. Six “hallmarks of cancer” cells have been
originally described by Hanahan and Weinberg. These hallmarks included
persistent proliferative signalling (e.g. through disrupted negative-feedback
mechanisms that attenuate proliferative signalling), insensitivity to growth
suppressors, evasion of apoptosis, limitless replicative potential, sustained
angiogenesis and activated tissue invasion and metastasis (Hanahan and
Weinberg 2000). A recent re-assessment (Hanahan and Weinberg 2011) has
added 4 additional “hallmarks” (inducing genome instability and mutation;
avoiding immune destruction; deregulating cellular energetic; tumour-promoting
inflammation). These functions allow cancer cells to survive, to proliferate and to
disseminate, and they are acquired in different tumour types via distinct
mechanisms and at various times during the course of multistep tumorigenesis.
Nutrition and other lifestyle-related factors that influence cellular processes may
also interfere with the hallmarks’ development at many levels. Of course they are
critical in directly influencing energy metabolism and interconnected mechanisms
leading to inflammation. At a more subtle level, they may also have a direct effect
on the tumour micro-environment, on the control of the production of potentially
46
damaging reactive oxygen or nitrogen species and on carcinogen metabolism or
detoxification reactions.
Somatic mutations that are causally related to environmental carcinogen
exposure and that may activate downstream proliferative pathways are valuable
candidates both as biomarkers of exposure and biomarkers of effect. A
carcinogenic mutational spectrum shows distinctive features, a sort of molecular
“signature” of carcinogenesis that traces the causative carcinogenic agent. The
PAH-DNA adduct positions are known today as the major mutational hotspots of
TP53 in human lung cancer (Greenblatt et al. 1994). A TP53 Mutation Database
has been maintained and developed at the International Agency for Research on
Cancer in Lyon, France, since 1994. The database compiles all TP53 mutations
that have been reported in the published literature since 1989 (Petitjean et al.
2007). This database is highly informative concerning the mutational spectra in
TP53 with respect to interactions with mutagenic chemicals and other
environmental carcinogens.
TP53 encodes an all-round tumour suppressor transcription factor, p53, which
mediates multiple anti-proliferative effects in response to a variety of stresses,
including in particular DNA damage. Most known mutations fall within the DNA-
binding domain and inactivate the suppressor activity by preventing DNA binding
and transactivation (Figure 8). Mutations at five major “hotspots” account for
about 30% of all known mutations. These codons are R175, G245, R248, R249,
R273 and R282. The apparent “hypermutability” of these sites is due to two
factors that suggest interplay between selection and mutagenesis. First, these
residues play important roles at the surface of contact between p53 and target
DNA. Thus, substitution of these residues results in a protein with decreased
affinity for DNA, which has lost the capacity to suppress proliferation (Cho et al.,
1994). Second, G to T transversion mutations induced by benzo(a)pyrene diol
epoxide adducts from tobacco smoke in TP53 have been shown to occur
preferentially at methylated CpG (cytosine-phosphate-guanine) sites, thus
strengthening a link between PAHs present in cigarette smoke, lung cancer
mutations and epigenetic marks (Yoon et al. 2001).

47
Figure 8: Codon distribution of TP53 mutations
From IARC TP53 database, November 2010

48
Epigenetic changes can precede and drive genetic alterations, thus contributing
to attenuate maintenance of the integrity of the genome. In this sense epigenetic
instability could be the counterpart of genetic instability. The most studied
epigenetic change that in some cases is associated with a genetic one is gene
promoter hypermethylation driving somatic point mutations, which in turn may
activate oncogenes and inactivate tumour suppressor genes. As an example, a
significant association between epigenetic silencing by promoter methylation of
O6-methylguanine-DNA methyltransferase (MGMT) and G:C-to-A:T transition
mutations in TP53 and in KRAS at codon 12, has been found (Watanabe et al.
2005; Esteller et al., 2000).
DNA methylation is a postreplication modification almost exclusively found in the
position 5 of cytosines (5-mC) in a dinucleotide CpG sequence context, and is
carried out by methyltransferase enzymes. The CpG dinucleotide is
underrepresented in the genome and is generally methylated, except for CpG-
rich clusters of approximately 1-2 Kb length (so called CpG islands) found in the
promoter region and first exons of many genes. Methylation of CpG islands is
important for the establishment and maintenance of cell-type and/or tissue-
specific gene expression. It is often associated with the inhibition of gene
expression, but not necessarily with gene silencing, and it changes slowly with
age and in response to environmental effects such as diet.
It is not clearly understood why certain CpG islands are hypermethylated in
cancer cells while others remain methylation free, but it can be hypothesized, as
it has been done in the case of genetic mutations, that a particular gene is
preferentially methylated with respect to others in certain tumour types because
its inactivation confers a selective clonal advantage. Another hypothesis
concerns the role played by the environment and nutrition, since the most
hypermethylated tumour types are those of the gastrointestinal tract (Esteller,
2007) probably because they are more exposed to external carcinogenic agents.
Evidence of a causal role of the environment in epigenetic modifications came
first from observing that epigenetic patterns of monozygotic twin pairs diverged

49
as they became older (Fraga et al., 2005). It is thus quite reasonable to assume
that external factors such as smoking, physical activity or diet, among others,
together with internal factors can influence the hypermethylation status of specific
tumour suppressor genes.
Major epigenetic changes include DNA methylation, post-translational
modifications of histone proteins (affecting mainly chromatin folding) and non-
coding RNAs (playing a role in heterochromatin formation, DNA methylation
targeting and gene silencing). Epigenetic mechanisms affect functional DNA
regulation without changing the DNA structure and they can be seen as acting at
the interface between genome and environmental signals. The list of genes
altered by epigenetic mechanisms and observed to be associated with cancer is
rapidly expanding due to next-generation sequencing techniques and to various
initiatives in the field of epigenetics, such as the Human Epigenome Project. The
epigenome is extremely sensitive to endogenous and exogenous (environmental)
stimuli in cancer. It is characterized by a gradual and reversible acquisition of
tumour-specific alterations that are implicated in virtually every step of tumour
development and progression (Jones and Baylin 2002), thus acting as ideal
intermediate biomarkers. In particular, several studies have provided evidence
that DNA promoter hypermethylation detected in tumour cells as well as
surrogate cancerous tissues (blood or plasma DNA) could be exploited as a
source of diagnostic and prognostic biomarkers for lung cancer.
Even if the exact causal relationship is still poorly understood, it has been
suggested that gene promoter hyper-methylation could: (i) contribute to enhance
the binding of carcinogens, (ii) increase the mutability of methylated cytosines
and (iii) silence tumour-suppressor genes and DNA repair genes facilitating
tumourigenesis (Sawan et al. 2008). Aberrant DNA methylation may also
precede genetic changes and possibly trigger them in the course of tumour
development. Mouse models of lung cancer development have shown that even
a few weeks of exposure to tobacco smoke or tobacco smoke condensate can
increase the methylation levels of numerous genes prior to any overt

50
histopathological changes (Phillips and Goodman 2009). Anyway, the
mechanisms in humans through which smoking inactivates genes involved in
DNA repair, detoxification, cell cycle regulation, and apoptosis are still not clearly
understood. In exposed humans, tobacco smoking has been shown to influence
DNA methylation levels of specific genes (e.g. MTHFR) whereas methylation
levels of other genes investigated (including CDKN2A and RASSF1A) were not
associated with smoking status (Vaissière et al., 2009; Vineis et al., 2011). These
interesting results indicate that tobacco smoke may target specific genes for
promoter methylation and point out that DNA methylation changes may alter the
expression of genes with weak or no tumour suppressing activity, including
genes with other cellular functions such as DNA repair or carcinogen detoxifying
activity.
The search for predictive epigenetic biomarkers could then be reasonably
expanded beyond the traditional panel of tumour suppressor genes. To date, only
few studies have investigated overall 5-mC content (e.g. LINE-1: repetitive
elements often used as indicators of global DNA methylation) and smoking and
they failed to find a clear association, at least in adulthood. However, global
hypo-methylation co-exists with gene-specific promoter hyper-methylation in
most human cancers (Herceg 2007) and it is thought to re-express proto-
oncogenes or imprinted genes, to activate latent viral and parasitic transposons,
thus contributing to genomic chromosomal instability. It has been suggested that
tobacco smoke chemicals that affect epigenetic marks in adulthood could have a
larger impact when exposure occurs in utero, i.e. during establishment of
epigenetic profiles. Evidences of altered epigenetic patterns in the offspring of
women who smoked during pregnancy (Breton et al. 2009) may suggest a role of
epigenetic mechanisms in developmental disease.
In summary, epigenetic mechanisms can be viewed as an interface between the
environment and the genome; their deregulation may disrupt key cellular
processes and ultimately result in oncogenic transformation and tumour
development. Environmental factors such as tobacco smoke may leave

51
epigenetic fingerprints that could be exploited as biomarkers for risk assessment
and prevention. In contrast to the genome itself, epigenetic status is more
dynamic and recent studies suggested that the establishment and maintenance
of epigenetic patterns might be particularly sensitive to environmental influences
during specific stages (such as in utero development). Also, epigenetic
alterations are reversible and typically acquired in a gradual manner, thus
offering opportunities for prospective investigations on exposed individuals who
develop alterations over time. However, still much remains unknown and future
studies need to establish epigenomes in normal tissues and specific cancers as
well as to identify environmental factors associated with epigenetic changes.
There is also the need to elucidate the molecular mechanisms by which
environmental factors deregulate normal epigenetic patterns and how these
events relate to cancer development. Finally, it remains to be established how
epigenetic deregulation induced by exposures in early life could influence cancer
risk in adulthood. Remarkable conceptual advances in epigenetics and the
emergence of powerful technologies that allow the analysis of epigenetic events
in high throughput and genome-wide settings as well as the availability of unique
prospective and population-based cohorts should facilitate this task. A genome-
wide approach using surrogate samples such as peripheral tissue samples for
epigenetic risk factors may provide important information for the discovery of new
tissue- and cell- specific epigenetic biomarkers.

52
Protective effect of diet against cancer developmen t
The close relationship between nutrition and health has always been clear to
humans, as witnesses this ancient statement of Hippocrates in 400 B.C.: “…to
the human body it makes a great difference whether the bread be fine or coarse;
with or without the hull, whether mixed with much or little water, strongly wrought
or scarcely at all, baked or raw…. Whoever pays no attention to these things, or,
paying attention, does not comprehend them, how can he understand the
diseases which befall man?”
The field of nutrition started to gain interest in the mid 1900, and in 1975 the
results from a small prospective study suggested that people with a low intake of
vitamin A from foods were at increased risk for lung cancer (Bjelke 1975). The
differences in cancer rates between countries in relation to diet were also
investigated at that time and it was suggested that various dietary factors,
including plant foods, might have important effects on cancer risk (Armstrong and
Doll 1975). The number of epidemiological studies on nutrient intake and cancer
then started to increase, and in 1992 a review of 156 studies concluded that ‘for
most cancer sites, persons with low fruit and vegetable intake experience about
twice the risk of cancer compared to those with a high intake, even after control
for potentially confounding factors’ (Block et al. 1992). Figure 9 suggests a role
for red meat intake in colon cancer development, as the countries with the
highest incidence (North-America and Australia in Panel A) correlate well with the
countries consuming the most red-meat (Panel B). Epidemiological evidence
started also to be supported by mechanistic results showing the potential
protective effects of various micro-nutrients, such as the reduction of oxidative
DNA damage or an increased activity of carcinogens detoxifying enzymes
(Steinmetz and Potter 1991). In 1997, the First World Cancer Research Report
on Diet and Cancer (World Cancer Research Fund/American Institute for Cancer
Research 1997) established that there was convincing evidence that high intakes

53
of fruit and/or vegetables may decrease the risk of cancers of mouth, pharynx,
oesophagus, stomach, colon and lung.
Figure 9: Comparison between colon cancer incidence and red meat consumption
From Bingham et al. 2004

54
The same report, 10 years after, updated the previous evidence from convincing
to either probable or limited-suggestive (World Cancer Research Fund/American
Institute for Cancer Research 2007), highlighting the difficulty to extrapolate
epidemiological findings to humans. This report is the most comprehensive
critical review to date on diet and cancer and includes an updated process to
continuously incorporate new evidence, perform meta-analyses and to revise
judgements as necessary. The association of fruit and vegetable consumption
with smoking-related cancer incidence was evaluated in the large European
Prospective Investigation into Cancer and Nutrition (EPIC) and found to
significantly decrease lung cancer risk (Linseisen et al. 2007). In contrast, other
studies showed no beneficial effects (Tsubono et al. 2001) or failed to find a
positive association for a reduced risk of lung cancer (Wright et al. 2008). IARC
evaluation (IARC, Handbook of Cancer Prevention Vol. 9, 2004b) concluded that
there was limited evidence that eating cruciferous vegetables reduces lung
cancer risk and inadequate evidence to assess the independent effects on
human cancer risk of specific micronutrients (e.g. isothiocyanates) as opposed to
their combined effects with other compounds.
Clearly, a huge challenge encountered by nutritional epidemiology is an accurate
estimate of exposure’s levels to identify which dietary components, at what doses
and over what time periods, enhance risk or protect against cancer development
(Jenab et al. 2009). In many epidemiological studies, exposure is assessed from
food frequency questionnaires giving rise to a number of methodological issues
such as problems of misclassification, confounding and recall bias. The difficulty
in exposure assessment is due to the poor use of validated diet assessment
instruments and there is a need for development and application of dietary
biomarkers.
Consumption of foods varies by season, dietary habits, age and environment.
The best approach is to estimate dietary intake by combining information on
intake with measured concentrations of the micronutrient under study. A
biomarker or set of biomarkers (e.g. urinary isothiocyanates) better reflect the

55
intake of a food, that contains a specific pattern of substances, and may also
provide insights into biological mechanisms. Moreover, biomarkers of dietary
exposure offer objectivity and accuracy and overcome differences in cooking and
dietary habits.
In conclusion, the use of biomarkers in nutrition is very attractive although very
few dietary biomarkers have been validated in humans so far. In vitro studies are
very promising and agents that decrease oxidative DNA damage have already
been proven to decrease the subsequent development of cancer. On the other
hand, the actual mechanisms in humans of these chemopreventive agents are
very complex and a biomarker will need to account for the actual dietary intake,
different bioavailabilities (different metabolites in tissue compared to
plasma/urine), high inter-individual variability in metabolic processes, lifestyle
variables (e.g. smoking, physical activity).
Protective mechanisms of polyphenols and isothiocya nates: epigenetic
modulation
A new research field in nutrition which carries the promise of elucidating
mechanism pathways is the study of epigenetic regulation by diet. The molecular
link between epigenetics and nutrition can be exemplified by the one-carbon
metabolic pathway whereby dietary compounds such as vitamin B12 or folic acid
are implicated in the regulation of the cytosine methylation pathway (Figure 10).
Given that S-adenosylmethionine (SAM) is the donor of methyl groups during
DNA methylation, dietary sources of methyl groups, including folate and
methionine, are primary candidates as potential modulators of DNA methylation.
More broadly, dietary factors that interact with the one-carbon metabolism
include B vitamins that act as coenzymes (e.g. vitamins B6 and B12) and are
also modulators of DNA methylation.

56
It is not clearly understood why certain CpG islands are hypermethylated in
cancer cells while others remain methylation free. The environment and nutrition
could modulate this local hypermethylation, since the most hypermethylated
tumour types are those of the gastrointestinal tract that are more exposed to
external carcinogenic agents. Moreover, if we take into consideration the study
from Fraga et al. (Fraga et al. 2007) that reports that patterns of epigenetic
modifications of monozygotic twin pairs diverge as they become older, it is not
surprising that external factors such as smoking habits, or diet, together with
internal factors, can influence the hypermethylation status of specific tumour
suppressor genes. Another proof of principle that dietary exposures affect
epigenetic marks comes from studies of the adult offspring of women exposed to
famine during their pregnancy. Adults who were exposed periconceptionally to
famine during the Dutch Hunger Winter of 1944–1945 had lower methylation
levels of the imprinted gene insulin-like growth factor-2 (a gene critical for
tumourigenesis) compared with their unexposed, same-sex siblings (Heijmans et
al. 2008).
Even if these studies had several limitations including lack of knowledge of the
specific dietary habits linked with the DNA methylation changes, they
demonstrate the impact of dietary changes on epigenetic marks.
Nowadays, a growing body of literature demonstrates that some micronutrients,
constituents of food and herbs, may have a great influence on DNA methylation
patterns. Studies of effect of natural compounds indicate that they are able to
prevent or reverse promoter hypermethylation-induced silencing of key tumour
suppressor genes and inhibit cancer development (Lee et al. 2005; Fang et al.
2003).

57
Figure 10: Methyldonor through one-carbon metabolis m
Methionine reacts with ATP to form S-adenosyl methionine (SAM) which is the methyl (-CH3) donor for DNA methylation. Folate in the form of tetrahydrofolate (THF) participates in one-carbon transfer reactions. Vitamin B12 acts as an essential co-enzyme in the transfer of the methyl group from 5-methyl THF to methionine. Vitamin B6 serves as a co-enzyme in other reactions (TS, thymidylate synthase; MS, methionine synthase). From Lamprecht and Lipkin 2003.

58
Among the many plant phytochemicals, tea polyphenols (e.g. catechin,
epicatechin, (-)-epigallocatechin-3-gallate), bioflavonoids (e.g. quercetin, fisetin,
myricetin), genistein from soybean and coffee polyphenols (e.g. caffeic acid,
chlorogenic acid) have received much attention for their health benefits. It was
recently shown that they have the ability to inhibit DNA methyltransferase, thus
DNA methylation levels, and eventually provide chemopreventive and anticancer
properties (Li and Tleefsbol 2010). It was recently proposed (Guarrera et al.
2007) that a flavonoids-rich diet might influence the gene expression of DNA
repair genes and thus possibly be implicated in decreasing tumour development.
Flavonoids have been reported to have multiple biological effects, depending on
their structure and characteristics, including scavenging of oxidative agents, anti-
inflammatory action, inhibition of platelet aggregation and antimicrobial activity
(Rhodes and Price. 1997, Yang et al. 2001, Yoon and Baek 2005; Shen et al.
2005).
The numerous in vitro and in vivo evidences of chemopreventive and therapeutic
effects of these phytochemicals have encouraged several clinical trials looking for
evidence of cancer prevention. In vitro studies have shown that tea polyphenols
and bioflavonoids inhibit DNMT-1-mediated DNA methylation in a dose-
dependent manner (Lee et al. 2005). This effect appears to be due to increased
synthesis of S-adenosylhomocysteine (SAH), a non-competitive inhibitor of trans-
methylation reactions, by decreasing methionine synthase activity. Polyphenols
are present in fruits, vegetables, seeds and drinks (e.g. green tea) and are
regularly consumed in a healthy diet.
Several thousand polyphenolic molecules have been identified (i.e. with a
common structure of diphenylpropanes C6-C3-C6), providing a large panel of
diverse structures that influence polyphenols’ bioavailability, biological properties
and health effects (Figure 11).

59
Figure 11: The basic structure of flavonoids and th e chemical structure of selected polyphenols
From Manach et al. 2004
In particular, it has been reported that epigallocatechin gallate (EGCG; a
polyphenol contained in green tea) inhibited DNA methyltransferase activity
dose-dependently in several types of cancer cells, resulting in transcriptional
reactivation (increased protein expression) of the methylation-silenced genes
CDKN2A and MLH1 (a gene involved in DNA mismatch repair) (Fang et al.
2003). The proposed mechanism of action of EGCG is a competitive inhibition of
DNA methyltransferase 1 (DNMT1) through interaction with its catalytic site
(Figure 12).

60
Figure 12: Interaction of EGCG with DNMT1
From Li and Tleefsbol 2010
However, it is important to note that the gene expression regulation seems to be
cell specific (based on in vitro differences among cells from the same tissue),
dose- (opposite effects for the same polyphenol depending on dose level) and
time-dependent (Ramos 2008). Moreover, polyphenols markedly differ from one
another in their bioavailability and intestinal metabolism.
Another class of highly promising cancer-preventive dietary agents, which
possibly act through epigenetic mechanisms, is the isothiocyanates (ITCs). ITCs
are metabolites of glucosinolates stored in plants such as cruciferous vegetables
(e.g., broccoli, cabbage, cauliflower, Brussels sprouts). Cruciferous vegetables
belong to the large botanical family of Brassicaceae, which count about 3000
species. The petals of plants of this family have a distinctive cruciform
arrangement, which is the origin of the term “cruciferous”. Upon wounding of the
vegetable, for example during harvesting, during freeze-thawing, during food
preparation, or during chewing whilst eating, myrosinase is released from the
“myrosin” cells and is able to hydrolyse glucosinolates within the damaged plant.
The outcome of the reaction with myrosinase depends on the nature of the
aglycone, as well as the reaction temperature and the pH (Figure 13).

61
Figure 13: Hydrolysis of glucosinolates
At high or neutral pH the formation of isothiocyanates is favoured while at low pH the formation of nitriles is favoured. From Hayes 2008.
Hydrolysis of glucosinolates with aliphatic or aromatic side chains gives rise
primarily to ITCs at neutral pH (Hayes et al. 2008). The bioavailability of ITCs
greatly depends upon myrosinase activity, which can be partially inactivated by
heat during cooking or steaming, and by the length of time the vegetable is
chewed.
Many of the biological properties of these compounds are determined by the
chemical structure of the side-chain, which, in turn, is determined by the structure
of the parent glucosinolate molecule. In view of the diverse spectrum of
chemicals generated from glucosinolates, it is not surprising that a number of
distinct cancer chemopreventive mechanisms have been proposed for
cruciferous vegetables. In vitro studies suggested that ITCs may induce
apoptosis, cell-cycle arrest and Phase II carcinogen-detoxifying enzymes (Zhang
2004; Seow et al. 2005). The xenobiotic-metabolizing phase II enzymes are
among the most important of the defence systems. They modulate the access of

62
intermediate chemical carcinogens to DNA in target tissues, usually by reducing
their biological activity and by accelerating their excretion. ITCs may inhibit the
bioactivation of pro-carcinogens found in tobacco smoke such as PAH (Hecht
2000), enhancing excretion of carcinogenic metabolites before they can damage
DNA. Recent epidemiological evidence of the protective effect of ITCs against
cancer comes from studies on lung cancer risk and consumption of either total or
specific cruciferous vegetables (Lam et al. 2009, IARC 2004b). It has also been
suggested that ITCs may indirectly activate transcription factors such as Nrf2
(nuclear factor E2-related factor 2) and NF-kB (nuclear factor-kappaB), whose
signalling pathways cover a variety of protective cellular events (Shen et al.
2005). Finally, the isothiocyanate sulforaphane has been shown to inhibit histone
deacetylases (HDACs) (Myzak et al. 2006), possibly altering gene expression
and having then implications for cell fate by altering tumourigenesis. HDAC
enzymes may prevent gene transcription by favouring chromatin’s coiled
structure. In pre-cancerous and cancerous cells, tumour suppressor genes are
associated with deacetylated histones, resulting in the inactivation of these
genes. Inhibition of HDACs may prevent the removal of acetyl moieties from
histones, thus allowing transcription of the tumour suppressor genes.
Many other food compounds, including food toxins, alcohol and folate, may
influence DNA methylation. Folate is a vitamin B that participates in the one-
carbon metabolism and affects methyl-group availability; alcohol is known to
interfere with folate absorption and supply to tissue (Hillman and Steinberg
1982). Moreover, recently, alcohol and folate were shown to be significantly and
independently associated with methylation profiles in breast tumours
(Christensen et al. 2010).
Several studies on nutrition and cancer show highly encouraging results from
both in vitro and in human evidence, but several questions still remain to be
addressed. Since the pathways of nutrient metabolism are encoded in the genes
it is essential to understand the influence of an individual’s genetic make-up on
the metabolism of nutrients and of nutrients on gene regulation.

63
Numerous bioactive compounds have been isolated and identified, and their
potential health-promoting effects evaluated extensively, both in vitro and in vivo.
An important aspect that could be advocated is that purified phytochemicals not
necessarily have the same beneficial health effect as when their source is a food
or a complete diet. There is a growing body of evidence suggesting that the
actions of phytochemicals administered as dietary supplements may fail to
provide the health benefits that have been observed when following diets rich in
fruits, vegetables or whole grains.
Compounds contained in cruciferous vegetables could affect cancer risk by
several mechanisms and relatively high doses of single bioactive agents may
show potent anti-carcinogenic effects. As a note, the cancer-preventive effects
that certain whole foods and diets were shown to have can better be explained in
terms of synergistic interactions between the different dietary ingredients
involved. In conclusion the field of diet influence on cancer risk is a very complex
and challenging one, where new biomarkers of exposure and effect are most
needed and where emerging mechanistic hypotheses should be tested in
appropriately designed randomised controlled trials.
Biomarkers of environmental exposure: genetic and e pigenetic approaches
Many studies on exposure have focused on environmental factors that induce
measurable biomarkers in exposed subjects ahead of disease development.
This category of biomarkers of exposure is very wide and includes DNA or
protein adducts of carcinogens, measurement of viral loads, of immune
response, of the accumulation of toxins, of inflammatory cytokines, etc. In recent
years, studies on the early steps of carcinogenesis have helped identify early
genetic changes that are detectable primarily in cancer tissues but are thought to
occur well before development of the tumours. Two of these early changes are
mutations in “master” cancer genes such as TP53, and modifications of

64
epigenetic patterns in the promoter region of specific genes involved in cell cycle,
apoptosis or DNA repair. Evidence that these changes may occur and be
detectable in normal tissue as the result of exposure to specific cancer-causing
agents is still scarce due to practical and ethical difficulties in conducting
experimental prospective studies in a human setting.
Nevertheless, mutations and methylation in several genes that are good
candidate markers of exposure to carcinogens have been studied in some details
in tobacco-induced lung carcinogenesis. With respect to TP53 mutation patterns,
it has been shown that some tobacco carcinogens induce specific mutations that
are rare in cancers associated with exposures other than tobacco (including lung
cancers of never-smokers). With respect to methylation patterns, several studies
using bronchial tumour and matched, non tumour tissues have uncovered the
presence of high levels of methylation in the promoter of genes such as CDKN2a
or RASSF1.
Not only tobacco but also diet may alter DNA methylation in tissues. Recent in
vitro evidences showed the capacity of specific micronutrients (i.e. polyphenols)
to inhibit DNA methyltransferase activity in several cancer cells, thus
transcriptionally reactivating methylation-silenced tumour suppressor genes or
genes involved in cell-cycle regulation. However, the mechanisms through which
these epigenetic changes occur is still poorly understood and effects in humans
are controversial.
Thus, while it is legitimate to consider that these modifications occur as a direct
or indirect result of exposure, whether such mutation or methylation changes can
be used as biomarkers of exposure in molecular epidemiology is still very
questionable.

65
Chapter II: Research Objectives
In this thesis, I have explored the application of either DNA methylation changes
or TP53 mutations to the study of exposure to tobacco smoking in two different
settings, i.e. observational and experimental. The main objective was to identify
and solve logistical, technical, data analysis and interpretation problems related
to the application of these molecular parameters as biomarkers. Moreover, the
prognosis impact of mutations (i.e. TP53, KRAS or EGFR) on the risk of lung
cancer recurrence or metastasis was explored, evaluating their use as
biomarkers of disease progression, and the use of DNA methylation as biomarker
of exposure to diet.
The project was articulated in two parts:
A: Study of the effects of a calibrated, defined dietary intervention on DNA
methylation patterns of specific genes, in heavy smokers
In a randomized intervention trial, 90 heavy smoking volunteers were assigned to
different dietary regimens for one month. Peripheral blood was collected at
inclusion in the study and at the end of the intervention period, and patterns of
methylation were analysed by pyrosequencing. We have measured levels of
gene-promoter methylation as biomarker of exposure to tobacco and as
biomarker of intermediate effect of specific micronutrients (i.e. cruciferous
vegetables and isothiocyanates). An intervention trial design was adopted since
DNA methylation has not been yet established or validated as a biomarker of
dietary exposure. In this study, the relationship between levels of DNA
methylation (both global and gene-specific) and the response to particular
micronutrients was analysed retrospectively. We analysed promoter methylation
of genes involved in cell-cycle regulation or 1-carbon metabolism and of
repetitive elements dispersed throughout the genome (used as indicators of
global methylation).

66
B: Study of the pattern, types and distribution of somatic mutations and
polymorphisms in an international series of lung cancer tissues
Defined cases of lung cancers were recruited prospectively in several hospitals in
Western Europe. Case-case comparisons were performed to identify differences
in mutation patterns in relation with histology and history of exposure to
carcinogens as well as to other factors for which data were collected at
recruitment. The target material was DNA extracted from primary lung cancer
tissue collected in a clinical setup. We have extended the analysis to test retro-
prospectively the biomarkers’ predictive value for lung cancer recurrence in order
to identify whether an individual’s prognosis can be based on their status.
The detailed design, methods, results and discussion are presented for each of
these approaches and the results summarized in a general discussion
underlining the challenges of using these parameters as biomarkers of exposure
and early effects in cancer research.
67
Chapter III:
Methylation patterns in sentinel genes in periphera l blood cells
of heavy smokers: influence of cruciferous vegetabl es in an
intervention study
Working Hypothesis
In this randomized intervention study, the methylation patterns of selected genes
were analysed before and after a 4-week intervention of protective diets in a
heavy-smokers population. To date, there have been few studies that have
examined the effects of dietary (and other environmental) factors on epigenetic
marks in intervention studies in humans. Current available evidence is derived
from either observational studies (which however may carry uncertainties about
causality and difficulties in characterizing exposure) or animal studies (where, in
some cases, experimental conditions and/or exposure doses may be difficult to
translate to humans). In humans, tobacco smoking has been shown to increase
DNA methylation of cancer-associated genes such as RASSF1A (encoding a
modulator of RAS signalling), MTHFR (a regulator of folate metabolism) and
CDKN2A/ARF (encoding the suppressor proteins p16INK4A and p14ARF) (Vaissière
et al. 2009). Moreover, in a cohort of smokers, Stidley et al. observed that folate
and other nutrients were associated with decreased gene promoter methylation
levels in cells exfoliated from the aerodigestive tract (Stidley et al. 2010). We
have observed a similar association in a previous study using DNA extracted
from peripheral white blood cells (WBC). In a nested case-control study on lung
cancer within the EPIC cohort, serum methionine levels were associated with
decreased smoking-associated hyper-methylation in CDKN2A, RASSF1A and
MTHFR (Vineis et al 2011).
A randomized intervention trial was initially undertaken to investigate the ability of
different diets to increase urinary anti-mutagenicity and to inhibit the formation of
DNA adducts in exfoliated bladder cells of heavy smokers (Malaveille et al 2004;

68
Talaska et al. 2006). These studies showed an increased anti-mutagenicity but
no consistent effect on DNA adducts. Here we have extended this trial to
measure patterns of methylation levels in DNA extracted from WBC of heavy
smokers. The rationale for the project was that tobacco carcinogens can affect
DNA methylation of certain key genes and dietary components may regulate this
process. Therefore, we have analysed 5 genes proposed to be frequent targets
of methylation in lung cancer or involved in the DNA methylation process itself,
and with distinct endogenous methylation patterns (Table 2).
Table 2: Epigenetic study: list of genes and their putative biomarker function
Gene Gene card Putative biomarker characteristic
LINE-1 Multi-copy,
retrotransposable
element evenly
distributed
throughout the
genome
Provide a marker for overall genome methylation; their
expression may be associated with increased
retrotransposition
RASSF1A Tumour suppressor
gene regulator of
RAS signalling
Very commonly hypermethylated and down-regulated in
tobacco-induced lung cancers
CDKN2As:
p14ARF,
p16 INK4a
Locus encoding
two critical
suppressor factors
regulating cell
cycle and
apoptosis
Often hypermethylated in tobacco-induced cancers
MLH1 Gene involved in
DNA mismatch
repair and
therefore in the
control of genetic
stability
Its down-regulation may be linked to a “mutator phenotype”
by which cells may acquire cancer-causing mutations at a
high rate
MTHFR Gene coding a
folate-metabolism
enzyme
Critical regulator 1C-metabolism with multiple effects on
energy metabolism and, in particular, on precursors of DNA
methylation and on the biosynthesis of nucleic acids

69
Materials and Methods
Study design
The study was designed according to the CONSORT guidelines
(http://www.consort-statement.org). This blind randomized controlled trial was
conducted in Torino, Italy, among a population of healthy blood-donor volunteers,
all heavy smokers.
An introduction phase (run-in), lasting 1 month, preceded the trial and consisted
in a qualifying visit during which 120 consenting volunteers were asked to
complete a questionnaire on lifestyle and medical conditions. Healthy (on the
basis of a medical questionnaire) men, aged 52 years on average, with self-
reported history of heavy smoking (i.e. at least 15 cigarettes/day over the last 10
years) and with balanced dietary habits were included (vegetarians were
excluded). Inclusion data were verified by medical and epidemiological staff and
qualifying volunteers were asked to provide informed consent for participation
into the intervention trial.
A total of 90 volunteers complied with all requirements and provided a non-
fasting blood sample at the beginning and at the end of the trial. A sequential
number was assigned to each eligible volunteer. Computer-assisted
randomization was conducted to assign the participants to each of the
intervention groups. All subsequent sample management and analyses were
conducted in a manner blinded as to the status of the participants.
The participants were given an induction course by a professional cook on how to
prepare diets according to their assigned intervention group. Participants were
invited to substitute their regular diet with the intervention diet and to report daily
compliance using an intervention diary. Group 1 was assigned a ‘normal diet’,
consisting of an isocaloric diet balanced in fruits and vegetables (according to the
recommendation of the World Cancer Research Fund). Group 2 was assigned an
‘enriched diet’, including polyphenols- and isothiocyanates-rich foods such as
cruciferous vegetables; and Group 3 was assigned a ‘supplemented diet’, based

70
on supplementation of the normal diet with polyphenols in the form of green tea
and soy products.
The trial lasted 4 weeks, starting the day after the induction course. All
participants filled a food frequency questionnaire (FFQ) at inclusion and a dietary
diary for the duration of the intervention. A FFQ was filled again 1 year after the
end of the trial and smoking habits were recorded again (Figure 14).
Figure 14: Schema representing the dietary recordin gs during the project
Intakes of micronutrients (flavonoids, several vitamins and folate) were estimated
through the self-administered diary, checked weekly and abstracted by a dietician
who developed a food-nutrient-intake matrix specifically focused on flavonoids, to
quantitatively assess their intake.
Statistical analysis
For each gene and each individual, methylation levels were expressed as the
average percentage of methylation at all the CpGs included in the DNA domain
analysed. Methylation levels in each intervention group were expressed as
medians and interquartile range. We tested differences in methylation levels
between T0 and T4 using the non-parametric Wilcoxon signed rank test. Equality
of variance was tested using the folded form F statistic.
To assess these differences, we did not include in this comparison samples with
a methylation value of 0 at both T0 (inclusion) and T4 (end of intervention).
These negative samples included 25 pairs (T0/T4) for MLH1 and 10 pairs for
ARF. Similarly, an outlier value for LINE1 was not included in the final analysis.
This outlier was observed at T4 for patient 67 (normal diet: T0=72.05; T4=66.23).
T 0 T 4 weeks
FFQ
T 1 year
FFQ Dietary diary
T 0 T 4 weeks
FFQ
T 1 year
FFQ
71
The Kruskal-Wallis test was used for comparison of differences in methylation
across the three dietary regimes.
All analyses were performed using STATA 11 and SAS V9.2. All tests were two
sided and statistical significance was assessed at the level of 0.05.
Laboratory Methods
DNA methylation analysis
To identify gene-specific and global DNA methylation (methylation of repetitive
elements interspersed throughout the genome) of genomic DNA from blood
lymphocytes, we relied on the well validated pyrosequencing technique. Sensitive
and quantitative methods are needed to detect even subtle changes in the
degree of methylation as biological samples often represent a heterogeneous
mixture of different cells.
The analysis involved several steps: (1) the bisulfite treatment to discriminate the
methylation status of the sample, (2) the PCR amplification of the sample, (3)
sample preparation for pyrosequencing analysis and (4) analysis in the
pyrosequencing instrument.
Bisulfite treatment of genomic DNA
Bisulfite treatment of genomic DNA samples results in the hydrolytic deamination
of nonmethylated cytosines (C) to uracils (U), whereas methylated cytosines
(mC) are resistant to conversion (Figure 15). After PCR, U is amplified as
thymine (T), and mC is amplified as C. In the resulting pyrogram, mC and C are
therefore represented as C (former methylayed cytosine) and T (former
nonmethylated cytosine) peaks, respectively, and can be analysed as a virtual
C/T polymorphism in the bisulfite-treated DNA. Probably the most critical step in
the bisulfite conversion is denaturing the DNA since only single-stranded DNA is
accessible to chemical modification.

72
Figure 15: Bisulfite treatment and example of DNA s equencing product
The methylated cytosine at nucleotide position #5 remained intact while the unmethylated
cytosines at positions #7, 9, 11, 14 and 15 are converted into uracil and detected as thymine
following PCR. Adapted from Zymo Research website.
0.5-1µg of genomic DNA from blood lymphocytes were treated with EZ DNA
methylation-Gold KitTM (D5007, Zymo Research, Orange, USA), according to the
manufacturer protocol which allows a conversion efficiency >99% and DNA
recovery >75%. 130µl of CT conversion reagent was added to 20µl of each DNA
sample in a conversion plate. DNA was denaturated (at 98°C for 10min),
incubated (at 64°C for 2.5h) and stored (at 4°C up to 20h). After desulphonation,
single-stranded DNA was washed and desulphonated. 30µl were recovered with
an elution buffer and stored at -20°C.
PCR amplification
DNA treatment with sodium bisulfite converts the four-letter genetic code into a
three-letter alphabet. As the former complementary DNA strands are differentially
modified, 2 populations of DNAs are available for primer design. DNA was
quantified by PicoGreen (Picofluor™ Fluorometer and PicoGreen dsDNA

73
Quantitation Reagent, supplied by Molecular Probes, Inc., Eugene, Oregon) and
diluted to 20-25ng/µL. Bisulfite-treated DNA was amplified in 50 µL using specific
PCR conditions (Table 3) and primers (Table 4). PCR reactions involved a 15-
min polymerase activation at 95°C, 50 cycles of denaturation (95°C, 30s), primer
annealing (30s at 51°C for MLH1, 55°C for RASSF1A and ARF, 56°C for
MTHFR, 58°C for LINE-1, 64°C for CDKN2A), and extension (72°C, 30s),
followed by a final 10-min extension at 72°C. 10µL of PCR products were
checked on agarose gel previous to pyrosequencing analysis.
Table 3: PCR mixtures
Purification and preparation
PCR products were converted into single-stranded DNA, one strand was isolated
(through labelling with biotin) and used as template in the pyrosequencing
reaction. dNTP were removed from the PCR mixture to allow for controlled
addition of single nucleotides (PyroGold Reagent kit, Biotage AB, Uppsala,
Sweden). 3µl of Streptavidin Sepharose HP beads (Amersham Biosciences,
Uppsala, Sweden) were added to 40µl binding buffer (10 mM Tris-HCl, pH 7.6, 2
M NaCl, 1 mM EDTA, 0.1% Tween 20) and mixed with 40µl PCR product for 10
min at room temperature. The beads containing the immobilized templates were
captured on the filter probes after the vacuum was applied and then washed with
70% ethanol for 10s, denaturation solution (0.2 M NaOH) for 10s, and washing
buffer (10 mM Tris-acetate, pH 7.6) for 10s. The vacuum was then released, and
the beads were released into a PSQ 96 Plate Low (Biotage AB) containing 40µl
annealing buffer (20 mM Tris-acetate, 2 mM MgAc2, pH 7.6) and 0.5 µM
sequencing primer.
MLH1 – RASSF1A – MTHFR – LINE-1 5u/µl GoTaq Hot Start (Biomega), 5X buffer, 25mM MgCl2, 8mM each dNTP, 10µM each primer
ARF – CDKN2A 5u/µl Hotstar Taq (Qiagen), 10X buffer, 8mM each dNTP, 10µM each primer

74
Table 4: List of primers used in the pyrosequencing assay
Gene Amplification primers (5' →3') Sequencing primers (5'→3')
Modified sequence/corresponding unmodified sequence analysed (5' →3')
p14ARF (F) TTGAGGGTGGGAAGATGGT GGAGGGAGAGGAA YGYGGGTTTTGAGTYGTTYGYGYGYGYG
p14ARF (R) biotin-CCCRAACCTCCAAAATCTC CGCGGGCCCTGAGCCGCCCGCGCGCGCG
RASSF1A (F) AGTTTGGATTTTGGGGGAGG GGGTTAGTTTTGTGGTTT YGTTYGGTTYGYGTTTGTTAGYGTTTAAAGTTAGYG
RASSF1A (R)
biotin-CAACTCAATAAACTCAAACTCCCC CGCCCGGCCCGCGCTTGCTAGCGCCCAAAGCCAGCG
LINE-1 (F) biotin-TAGGGAGTGTTAGATAGTGG AACTCCCTAACCCCTTAC RCCCTACTTCRACTCRCRCACRATACR
LINE-1 (R) AACTCCCTAACCCCTTAC GCCCTGCTTCGGCTCGCGCACGGTGCG
MLH1 (F) TTTAGGAGTGAAGGAGGT GTTTTGAYGTAGAYGTTTTATTAGGGT
YGYGYGTTYGTYGTTYGTTATATATYGTTYGTAGTATT
MLH1 (R) biotin-CCCTATACCTAATCTATC CGCGCGCTCGCCGTCCGCCACATACCGCTCGTAGTATT
MTHFR (F) TTTTAATTTTTGTTTGGAGGGTAGT GGGTTTGGATTTTGAG YGGTATGAGAGATTTYGGGAGAAGATGAGGYGGYGATTG
MTHFR (R) biotin-AAAAAAACCACTTATCACCAAATTC CGGCATGAGAGACTCCGGGAGAAGATGAGGCGGCGATTG
p16INK4a (F) GAGGGGTTGGTTGGTTATTAGA TGGTTATTAGAGGGTG GGGYGGATYGYGTGYGTTYGGYGGTTGYGGAGAGG
p16INK4a (R) biotin-TACAAACCCTCTACCCACCTAAAT GGGCGGACCGCGTGCGCTCGGCGGCTGCGGAGAGG

75
Pyrosequencing reaction
Pyrosequencing reactions were performed according to the manufacturer's
instructions using the PSQ 96 SNP Reagent Kit (Biotage AB), which contained
the enzyme, substrate, and nucleotides. The PCR involved two amplification
primers that are specific to the sequence of interest, one of which is a biotinylated
primer (please refer to Table 4 for details). During the PCR, the biotin tail is
incorporated into the amplicon sequence. Biotin-labeled amplicons are captured
by binding to streptavidin-coated Sepharose beads, and DNA is denatured to
produce ssDNA template for the pyrosequencing assay. The ssDNA is released
and is combined with the sequencing primer, which is extended during the
pyrosequencing reaction to provide the sequence of the template DNA.
The sequential incorporation of every nucleotide is converted to light, which is
detected by the PSQ 96 instrument, enabling the sequence of the template
strand to be determined. DNA polymerase catalyzes the incorporation of the
dNTP into the DNA strand if it is complementary to the base in the template
strand. Each incorporation event releases a pyrophosphate, which is converted
to ATP by a sulfurylase (Figure 16). This ATP then drives the luciferase-mediated
conversion of luciferin to oxyluciferin that generates visible light in amounts that
are proportional to the amount of ATP. ATP and unincorporated dNTPs are
continuously degraded by apyrase. The light is switched off, and the next dNTP
is added. As the process continues, the complementary DNA strand is built up.
The light signal is detected via CCD camera and is converted into a quantitative
signal in the program which allows determination of the nucleotide sequence.
The resulting pyrograms are converted to numerical values for peak heights
using the instrument’s software.

76
Figure 16: The principle of pyrosequencing and the output pyrogram
Double peak heights indicate incorporation of two nucleotides in a row. Adapted from Qiagen
website.
The degree of methylation at a single CpG is calculated as allele frequency:
Figure 17 gives an example of pyrogram showing the percentage at each CpG
site interrogated in the gene (for each CpG dinucleotide interrogated, C
represents the methylated allele and T represents the un-methylated allele
converted during the bisulfite treatment).
Methylation % =
peak height methylated
peak height methylated + peak height non-methylated
* 100

77
Figure 17: RASSF1A pyrogram of promoter methylation in sample 1 at th e end of the trial (T4 of supplemented diet)
200
300
400
E S A T C A G T C A G T C A G T C A G T G T A G T C A G T A G T A G T C T G
T:98.8%
C:1.2%
T:98.4%
C:1.6%
T:98.1%
C:1.9%
T:100.0%
C:0.0%
T:98.1%
C:1.9%
T:97.8%
C:2.2%
5 10 15 20 25 30 35

78
The methylation levels for each gene at the target CpGs were finally expressed
as mean percentage of methylation of all CpG sites analysed.
Pyrosequencing is a highly reliable and quantitative method for the analysis of
DNA methylation at multiple CpGs and it provides a quantitative estimate of the
level of DNA methylation at defined CpG sites with reference to built-in internal
controls (Tost et al. 2003) to minimize PCR bias.
We analysed promoter methylation of p16INK4A, p14ARF, MTHFR, RASSF1A
and MLH1. INK4A assay interrogated 7 CpGs; ARF assay interrogated 8 CpGs;
MTHFR assay interrogated 6 CpGs; RASSF1A assay interrogated 6 CpGs and
MLH1 assay interrogated 8 CpGs. LINE-1 assay interrogated 6 CpG sites.

79
Results
Life-style profiles in the different dietary groups
Table 6 shows dietary habits (data from diary at the end of the study) among the
three groups. The regimens were successful in increasing the intake of
isothiocyanates (i.e. cruciferous vegetables), particularly in the group following
the enriched diet, and of polyphenols (i.e. green tea and soya products) in the
group receiving flavonoids supplementation. Moreover, a previous publication on
the same study (Table 5) showed that blood protein adducts levels of dietary
isothiocyanates (i.e. SFN-Lys: sulforaphane lysine) correlated with cruciferous
vegetables intake in the enriched group as determined by the dietary
questionnaire (Kumar et al. 2010). Adducts levels of sulforaphane mirrored ITCs
bioavailability during the 4-week intervention (T0: baseline and T4: end of study).
Table 5: SFN-Lys and cruciferous vegetable intake b y trial arm at T0 and T4 Dietary group (n) SFN-Lysine (%) Cruciferous vegetables (g/day)
T0 T4 T0 T4
Control (29) 17.2 10.3 2.4 6.3
Enriched (29) 13.8 31.0 4.9 68.8
Supplemented (27) 44.4 29.6 4.5 38.7
Adapted from Kumar et al. 2010

80
Table 6 : Mean (g/day averaged on the 4-weeks intervention) and standard deviation (SD) of selected food items for each dietary group
Dietary items Normal diet (n=29)
Enriched diet (n=30)
Supplemented diet (n=29) P-value
Other foods 13.90 (32.03) 27.95 (18.00) 20.96 (12.55) <0.0001 Soft drinks 13.91 (22.49) 19.42 (34.33) 30.21 (67.05) 0.81 Butter 2.31 (3.97) 1.78 (2.00) 1.42 (1.32) 0.89 Coffee 140.10 (68.08) 140.35 (54.46) 130.27 (61.14) 0.63 Meat 111.97 (52.36) 86.20 (36.70) 112.58 (67.39) 0.06 Cereals 393.43 (157.28) 373.18 (98.68) 373.01 (116.40) 0.93 Sweets 64.27 (51.60) 66.01 (44.43) 58.63 (33.95) 0.87 Cheese 41.42 (25.31) 40.99 (25.32) 33.86 (16.79) 0.35 Fruits 317.14 (192.01) 459.69 (147.23) 359.57 (167.10) 0.002 Nuts 2.01 (2.36) 3.59 (5.26) 0.83 (1.65) 0.002 Milk 87.13 (190.17) 64.86 (69.65) 73.33 (74.31) 0.59 Legumes 22.52 (19.94) 42.16 (22.93) 36.93 (20.91) 0.002 Margarine 0.04 (0.12) 0.01 (0.04) 0.06 (0.25) 0.48 Oil 26.52 (8.98) 25.20 (7.17) 23.06 (10.14) 0.17 Potatoes 32.04 (21.22) 33.68 (23.35) 43.46 (19.93) 0.07 Fish 56.49 (32.04) 52.83 (21.82) 45.74 (21.48) 0.42 Spices 0.45 (1.46) 0.18 (0.24) 0.26 (0.35) 0.35 Soya and derivatives 0.45 (1.20) 2.62 (7.71) 3.54 (7.34) 0.05 Green tea 6.10 (22.39) 1.42 (6.10) 56.23 (61.13) <0.0001 Eggs 12.38 (6.46) 9.42 (5.76) 11.78 (8.08) 0.24 Vegetables 227.70 (103.26) 298.72 (125.76) 253.64 (93.45) 0.06 Cruciferous 6.30 (9.43) 68.80 (46.43) 38.73 (32.24) <0.0001 Flavonoids (mg/day) 61.71 [59.73] 217.47 [77.83] 229.23 [84.00] < 0.0001

81
There is evidence that age, alcohol, and folate may influence DNA methylation.
Age is associated with methylation in non-pathological tissues (Ozanne and
Constancia 2007), folate is a vitamin B that participates in the one-carbon
metabolism and affects methyl-group availability, and alcohol is known to
interfere with folate absorption and supply to tissues (Hillman and Steinberg
1982). We studied the levels of these variables by type of diet and found no
association (see Table 7) for folate, age or alcohol. Consequently we think that
these factors should not confound the association between methylation and diet.
On the other hand, participants in the normal-dietary group appeared to smoke
slightly more than in the experimental groups. Consequently all comparisons are
adjusted by number of cigarettes smoked at the time of blood collection.
Table 7 : Age, selected lifestyle and dietary habits by diet ary group on the 4-week intervention, mean (SD)
Variable Normal diet (n=29)
Enriched diet (n=30)
Supplemented diet (n=29) P-value
Age (years) 51.19 (7.02) 53.65 (6.99) 52.39 (6.15) 0.40
Alcohol (mg/day) 303.56 (246.07) 242.28 (255.78) 228.48 (126.31) 0.53
Folate intake (g/day) 212.40 (66.13) 199.86 (6.79) 200.60 (8.56) 0.34
Smoking (cigs/day) 27.28 (9.52) 20.43 (5.48) 20.28 (5.94) 0.005

82
Methylation patterns in individual markers
Three distinct patterns of methylation were distinguishable (Figure 18). LINE-1
was highly methylated, with over 70% of all CpGs consistently methylated in all
subjects at both time points. MTHFR showed an intermediate methylation pattern
with an average of over 50% methylated sites. The two CDKN2A genes and
MLH1 showed a low constitutive methylation level (between 0% and 5%);
p14ARF showed methylation below the detection levels in 11% of individuals and
MLH1 in 29%, at both T0 and T4. RASSF1A methylation values were between
5% and 15% for 16% of individuals at T0 and 5% at T4.
The high methylation level of LINE-1 is in agreement with the hypothesis that
these nuclear elements, which are distributed across the genome, may reflect on
average the whole genome methylation changes. Previous studies have reported
a similar level of methylation of LINE-1 in other groups of subjects, including
cancer cases and controls. The intermediate methylation status of MTHFR
suggests that this locus has a mechanism of methylation control distinct from
whole genome methylation. Methylation levels of the cancer-related genes
CDKN2As (p16INK4a and p14ARF), RASSF1A and MLH1 were very low and had a
skewed distribution (with a large number of null values), at both the beginning
and the end of the 4-week dietary intervention.

83
Figure 18: Plots of % methylation distribution in t he selected genes and LINE1 sequences, by three dietary regimes
0.00
10.00
20.00
30.00
40.00
50.00
60.00
70.00
80.00
111111111111 111111111111111 1 1 22222222222222 22 222222222222 22 33333333333333 3 3 333333333333 3
Normal Enriched Supplemented
Dietary Groups
Mea
n %
met
hyla
tion
LINE T0LINE T4MLH1 T0MLH1 T4RASSF1A T0RASSF1A T4INK4a T0INK4a T4MTHFR T0MTHFR T4ARF T0ARF T4
Influence of a 4-week dietary intervention
In Table 8, the difference between methylation levels at T0 and T4 (p-value1) and
the equality of variance in the two populations (p-value2) are presented.
The comparison between methylation patterns at T0 and T4 across all dietary
regimes shows small but significant changes for LINE-1, but not for MTHFR. For
the latter gene, no changes were detected between T0 and T4 within any
intervention group or between the three intervention groups.
Methylation levels of the cancer-related genes were very low (<5%) both before
and after dietary intervention. Consequently, changes in methylation, although
statistically significant, are unlikely to impair gene expression but could reflect
changes in peripheral blood cells population.

84
Table 8: Median and Inter Quartile Range (IQR) of p ercentage methylation levels, by gene, dietary group and time point (T0 and T4)
LINE-1 interquartile range at T4 appears to be much smaller than at T0, with
statistically significant differences in the variances at T0 and T4, respectively
(also in Figure 19). This result suggests a decrease of inter-individual methylation
levels of LINE1 after dietary intervention.
Figure 19: % methylation of LINE-1 and MTHFR by diet
For the cancer-related genes the changes were of low amplitude counting for
T0 T4 Gene Diet Median [IQR] Median [IQR]
P-value 1 P-value 2
LINE-1 Normal 72.1 [69.5-73.7] 73.4 [72.6-74.3] <0.0001 <0.0001 Enriched 72.4 [69.7-73.7] 73.2 [72.4-74.0] 0.0009 <0.0001 Supplem. 71.9 [70.5-72.8] 74.0 [71.9-74.5] <0.0001 0.36
MTHFR Normal 54.2 [46.0-63.2] 53.7 [48.7-61.4] 0.85 0.34 Enriched 54.3 [44.6-59.5] 53.3 [44.0-58.4] 0.59 0.99 Supplem. 55.6 [44.9-63.6] 54.2 [45.5-64.6] 0.98 0.73
p16 INK4a Normal 0.8 [0.0-1.2] 1.3 [0.6-2.1] 0.0002 0.12 Enriched 0.7 [0.0-1.1] 1.3 [0.5-2.3] 0.0001 0.07 Supplem. 0.8 [0.4-1.5] 1.5 [1.0-2.1] <0.0001 0.14
p14ARF Normal 0.2 [0.0-1.3] 0.7 [0.4-1.0] <0.0001 <0.0001 Enriched 0.2 [0.0-0.6] 0.5 [0.2-0.7] 0.0002 0.22 Supplem. 0.0 [0.0-0.4] 0.5 [0.4-0.8] <0.0001 0.08
RASSF1A Normal 1.6 [0.9-16.1] 2.0 [1.8-14.9] 0.25 0.02 Enriched 1.1 [0.8-11.7] 1.7 [1.3-2.1] 0.005 <0.0001 Supplem. 1.1 [0.9-1.4] 1.9 [1.4-4.7] <0.0001 <0.0001
MLH1 Normal 0.1 [0.1-0.8] 1.6 [0.6-4.2] <0.0001 <0.0001 Enriched 0.1 [0.0-0.1] 2.7 [0.9-5.4] <0.0001 <0.0001 Supplem. 0.0 [0.0-0.0] 2.0 [1.0-4.2] 0.05 <0.0001
Normal diet Supplemented dietEnriched diet
p <0.0001 p =0.0009 p <0.0001
LINE-1Normal diet Supplemented dietEnriched diet
p <0.0001 p =0.0009 p <0.0001
Normal diet Supplemented dietEnriched diet
p <0.0001 p =0.0009 p <0.0001
LINE-1

85
Figure 20 shows the difference between methylation levels at T0 and T4 in the
remaining genes analysed.
Figure 20: % methylation of INK4A , ARF, RASSF1A and MLH1 by diet

86
Kruskal-Wallis test was performed for comparing differences in methylation
across the three dietary regimes at each time point (T0 and T4). Results are
shown in Figure 21 (diet 1=normal diet, diet 2= enriched diet, diet 3=
supplemented diet).
We judged the measured changes for genes other than LINE-1 and MTHFR to
be too unstable for any meaningful comparison.
Figure 21: LINE-1 and MTHFR % methylation at T0 and T4 for each diet

87
Discussion
As described previously, specific pyrosequencing primers were designed to focus
on a series of five to eight CpG dinucleotides in the promoter region of the cyclin-
dependent kinases inhibitor 2A (p16INK4A and p14ARF), the
methylenetetrahydrofolate reductase (MTHFR), the Ras-association domain
family 1 isoform A (RASSF1A), the mutL homolog 1 (MLH1) gene and for the
LINE-1 (long interspersed nuclear elements) repetitive sequence.
Pyrosequencing has been extensively used to measure DNA methylation in our
laboratory (Vaissire et al. 2009) and the food frequency questionnaire was
previously validated by biological measures of nutrients intake (Kumar et al.
2010). Nevertheless we cannot rule out the possibility to have encountered PCR
bias due to preferential amplification of one allele and a laboratory drift due to a
batch effect. PCR bias may result in a large sequence difference between
completely methylated and non-methylated template after bisulfite treatment.
Moreover, even if we obtained good standard deviation from repeating a subset
of samples with the two time points from the same subject in the same batch, we
have run them in first instance in different batches and here we have presented
results from this first experiment.
The observed inter-individual differences (often an order of magnitude) in all
genes do not appear to be a result of a technical artifact attributable to
pyrosequencing, because similar large inter-individual differences for many
genes have been validated in other studies by quantitative RT-PCR. These
changes could be linked to substantial variation in allele-specific methylation at
each locus. Intra-individual differences between the baseline and the end of the
dietary intervention were observed in particular for LINE-1 and MTHFR; the
remaining genes showing negligible differences. These differences may reflect a
dietary impact on global methylation levels and on one-carbon metabolism.
Moreover, since there are evidences that different CpG sites within a genomic
island may be methylated at different level, and that smoking may affect the

88
methylation status of some (but not other) CpG sites in the same gene, it would
be of great interest to perform single CpG analyses, rather than regional, and
evaluate the associated mRNA promoter expression in response to diet.
Loss of methylation of LINE-1 has been considered as a risk factor for cancer,
neurological and cardiovascular diseases (Baccarelli et al. 2009). LINE-1 are a
group of transposable elements distributed throughout the genome. While most
LINE-1 sequences are methylated and silent, a small subset of them is actively
transcribed and can be retrotransposed within the human genome. We observed
a high methylation level for LINE-1 (median above 72%), in agreement with
methylation levels reported in cancer-free individuals in peripheral blood cells
(Choi et al. 2009, Zhang et al. 2011). We also observed a small but significant
increase in global methylation of LINE-1 among the participants, consistent with
the role of DNA methylation in controlling retrotransposon mobility by lowering
their activities and thereby stabilizing the genome. Moreover, the inter-individual
methylation levels of LINE-1 decreased after dietary intervention, while this effect
was not obvious for the selected genes. Specifically, the Interquartile Range
appears to be much smaller at the end of the intervention, with statistically
significant differences in the variances with respect to the baseline. This result
suggests that intervention with a controlled diet may have beneficial impact at
individual level by stabilizing the basal patterns of DNA methylation levels
distributed over the genome, narrowing inter-individual epigenetic variations and
thus reducing biodiversity. Together, the increase in LINE-1 methylation and the
decrease of dispersion in the distribution of individual LINE-1 methylation levels
may reflect a form of increased epigenetic stability after dietary intervention. In
the case of LINE-1, this epigenetic stability may have an impact on the
expression and retrotransposition of these multi-copy, mobile elements, thus
controlling their capacity to modify genetic and chromatin landscapes. Epigenetic
stability could be the counterpart of genetic stability and play a role in cancer
prevention, since it has been shown that loss of genetic stability may promote
tumour progression. More precise evaluation of these changes will require a

89
better understanding of temporal changes in methylation patterns in subjects who
did not change their diet.
Methylation levels of cancer-related genes analysed in the cancer-free individuals
were extremely low (<5%) and we did not observe the aberrations potentially
associated with smoking in cancer cells such as promoter hyper-methylation of
cancer-related genes (Vaissière et al. 2009). Also, average levels of MTHFR
methylation were 50% as reported in tumours of never-smokers. The
mechanisms through which smoking might trigger epigenetic changes are still not
clearly understood and our patterns of methylation do not seem to suggest
exposure to tobacco smoking.
We observed no major difference between the intervention groups, suggesting
that the effects detected at T4 were not driven by differences in the nature of the
dietary intervention. We have evidence from questionnaires (Malaveille et al.
2004, Talaska et al. 2006) that subjects did alter their dietary habits when
entering the study. Correspondingly, we observed a change in methylation levels
after intervention in each group, including in the normal isocaloric diet group. It is
likely that the dietary changes induced in group 1, which forms the basis of the
diet received by the two other groups, superseded those of specific
supplementation at this particular time point. Shorter as well as longer time points
would be necessary to conclude whether the supplementation in groups 2 and 3
may have a specific effect on methylation patterns in addition to those of the
isocaloric diet (designed following dietary international recommendations).
Epigenetic regulation of gene expression by dietary polyphenols is most probably
cell specific, dose- and time-dependent (Ramos 2008). Moreover, the
mechanisms in humans is further complicated by the actual dietary intake
(particularly of methyl donors), different bioavailabilities (different metabolites in
tissue compared to plasma/urine) and high inter-individual variability in metabolic
processes. Consequently, our results raise the question of whether peripheral

90
blood may be an adequate source of DNA for monitoring variations in methylation
patterns induced by environmental exposures or by dietary interventions.
Peripheral blood cells mainly comprise quiescent or post-mitotic cells, in which
DNA methylation levels might be extremely stable as compared to those of
actively dividing cells. On the other hand, the lifetime of peripheral blood cells
varies from a few hours to a few weeks suggesting that in the present study
design (extending over a 4-week period), most cells may have been completely
renewed at least once, if not several times.
It would be interesting to extend the intervention described here in two directions.
First, it would be important to use shorter time intervals to better monitor the
patterns of DNA methylation changes that may occur within the lifetime of a given
blood cell population (e.g., over one week). Second, it would be interesting to
separate different cell populations and assess their methylation profiles in relation
to their proliferative capacity (Wu et al. 2011). The use of a combination of
markers in flow cytometry may allow the isolation of a small subpopulation of
cells with hematopoietic stem cell (HSC) characteristics in which intervention-
induced methylation changes may be of much greater amplitude and relevance
to cancer than whole peripheral blood cells. In the present study design, such
variations may be masked by the stability of methylation patterns of the post-
mitotic cells that form the overwhelming population of cells present in buffy coat.
Further studies to calibrate methylation in different populations of blood cells
would be useful to determine how to best use this biomarker in intervention
studies.

91
Chapter IV:
Prevalence and prognostic value of TP53 KRAS and EGFR
mutations in NSCLC: the EUELC cohort
Working Hypothesis
In the multicenter study somatic mutations in tumour suppressor genes, which
were most probably the consequence of a long process involving the effect of
exposure to tobacco carcinogens, were analysed prior to NSCLC recurrence. At
early stages of NSCLC, three genes appear commonly mutated: TP53 (in both
ADC and SCC), EGFR and KRAS (mostly, if not exclusively, occurring in ADC
and in a mutually exclusive manner). The biological impact of these mutations is
relatively well understood: while inactivation of TP53 removes a central
mechanism of growth suppression in response to DNA damage, activating
mutations in EGFR or KRAS constitutively stimulate one of the main growth and
survival promoting signalling pathways.
Somatic mutations may be induced by exposure to a variety of mutagens
occurring in the external environment. The most common sequence changes are
base substitutions, transitions or transversion, which usually involve replacement
of a single base. Transitions (pyrimidine C or T replaced by a pyrimidine, or
purine A or G replaced by a purine) are commoner than transversions (pyrimidine
replaced by a purine or conversely). The excess of transitions over transversions
is at least partly due to the high frequency of C>T transitions resulting from
cytosine methylation and subsequent spontaneous deamination in the CpG
dinucleotide (Shen et al. 1992). These transitions may occur in the absence of
direct mutagen attack onto DNA. In contrast, transversions (e.g. G >T) are often
the consequence of covalent damage to DNA (e.g. bulky DNA adducts).

92
Functionally, TP53 mutations may differ according to their nature and position, as
well as to the presence of a common polymorphism at codon 72 in the mutant
allele (Bergamaschi et al. 2003). Knowing TP53 mutation status has potential
applications for cancer prognosis (Schneider et al. 2000, Samowitz et al. 2002)
and early diagnosis (Sidransky 2002), identification of mutagen "fingerprints"
(Greenblatt et al. 1994), and prediction of therapeutic outcomes (Borresen et al.
1995). Most known mutations fall within the DNA-binding domain and inactivate
the tumour suppressor by preventing DNA binding and transactivation.
In addition, the TP53 gene is highly polymorphic and there is evidence that
mutations may occur at different rates on different TP53 alleles. We have
analysed the distribution of 3 common polymorphisms located within a 312 bp
region of the TP53 gene encoding the N-terminus of p53, in relation with TP53
mutation status. These three polymorphisms are located in intron 2 (PIN2,
rs.1642785: G to C), intron 3 (PIN3, rs.17878362: 16bp duplication) and in exon
4 (PEX4, rs.1042522: non-silent G to C). Many studies have investigated the
associations of TP53 polymorphisms with increased risk for cancers. The P72R
polymorphism in exon 4 is the most extensively studied both in experimental and
population studies. In lung cancer, the Pro/Pro genotype in exon 4 could predict
for shorter progression-free survival (Han et al. 2008, Liu et al. 2011). The current
consensus from a large number of studies is that the alleles of rs1042522 in
TP53 that encode arginine (G-allele) or proline (C-allele) at codon 72 have
different apoptotic capacities, and that R72 is more effective in inducing
apoptosis than P72, which in turn associates with accelerated smoking-related
decline in lung function (Hancox et al. 2009).
P72R is in partial linkage disequilibrium with the duplication of a 16 base pairs in
intron 3 (PIN3) that was found to be weakly associated with increased lung
cancer risk (Wu et al. 2011, Hu et al. 2010). PIN3 may require the presence of
Pro codon 72 variant for stronger prognostic effect (Boldrini et al. 2008). The
mechanism trough which PIN3 may increase the risk of developing cancer
remains to be elucidated, but the 16 base pair insertion might influence

93
alternative splicing of p53 protein, leading to unstable transcripts or proteins with
altered activities (Gemignani et al. 2004).
The possible biological impact of PIN2 variant in intron 2 is a matter for
speculation. This polymorphism has been much less studied than PEX4 and
PIN3 and there is no strong data on its possible association with cancer risk.
Nevertheless, it is in almost complete linkage disequilibrium with PEX4, so that
many of the associations reported for PEX4 might as well be due to PIN2 (or to
the combination of both polymorphisms). Preliminary experimental evidence
suggests that PIN2 may regulate the stability of p53 pre-mRNA, with
consequences that remain to be explored (Hainaut, personal communication).
Given the complex polymorphic structure of TP53, haplotypes may provide more
relevant information than individual polymorphisms. We have also analysed TP53
haplotypes by combining the three polymorphisms. As reference we have defined
GNA haplotype as the presence of G allele in intron 2 (rs.1642785), Non-
duplication in intron 3 (rs.17878362) and G allele coding for Arginine in exon 4
(rs.1042522); and CDP haplotype as the presence of PIN2 C allele, PIN3
Duplication and PEX4 C allele coding for a Proline.
EGFR gene encodes a transmembrane receptor for Epidermal Growth Factor
and related ligands, which contains an intracellular tyrosine kinase domain
(important for signal transduction). Deregulation of human epidermal growth
factor receptor pathways by over-expression or constitutive activation can
promote tumour processes including angiogenesis and metastasis and is
associated with poor prognosis, in particular in a certain fraction of NSCLCs
(Marks et al. 2008). Somatic mutations of EGFR gene are found almost
exclusively in adenocarcinomas of never-smoking women and cluster in domains
of the kinase that constitutively induce its activity and signal transduction
(Tokumo et al. 2005). EGFR is a valid lung cancer marker that is well known to
correlate with clinical response to tyrosine kinase inhibitor’s therapy (Paez et al.
2004).

94
KRAS gene encodes GTP/GDP exchange factor, acting as a downstream
effector of EGFR signalling that mediates the activation of growth promoting
signalling cascades of kinases. Mutations mostly fall at codon 12, located in the
GTP binding pocket and preventing its hydrolysis. KRAS status is a valid
biomarker to predict clinical response to Cetuximab treatment in colorectal
cancer patients (Van Cutsem et al. 2009). There is evidence that TP53 or KRAS
transversion mutations in NSCLC of smokers occur prevalently at G bases and
are commonly the sites of adduct formation by metabolites of polycyclic aromatic
hydrocarbons (Denissenko et al. 1996; Hainaut and Pfeifer 2001; Hussain et al.
2001).
These observations suggest that at least some of these mutations may occur as
the consequence of exposure to tobacco smoke and precede the development of
cancer (Table 9), and therefore have an impact on molecular and biological
patterns of lung carcinogenesis, but their impact on clinical lung cancer prognosis
remains a matter of debate. The central hypothesis behind the project is that by
detecting and treating lung cancer at an early stage, patient mortality can be
lowered. The purposes of the study were to assess if mutations in TP53, KRAS
or EGFR genes may act as biomarkers of tobacco exposure and to investigate
their use as biomarkers of risk for lung cancer recurrence or metastasis.
Table 9: Genetic study: list of genes and their put ative biomarker function
Gene Gene card Putative biomarker characteristic
TP53 Tumour suppressor
gene
Mutations are strongly associated with tobacco-induced
cancers and polymorphisms
KRAS Oncogene Activating mutations and expression is common in a subset
of tobacco-induced cancers
EGFR Coding a receptor
tyrosine kinase
Over-expression is common in multiple cancers; mutations
occur in a subset of lung adenocarcinoma in never-smokers

95
Materials and Methods
Study Design
The EBTB and EUELC databases
We took advantage of the European Early Lung Cancer (EUELC) project and
biobank (Cassidy et al. 2009; Field et al. 2009) to collect patients with good
quality frozen tissues. The EUELC project is a collaborative effort among 12
centres in France, Germany, Italy, the Netherlands, Spain and the United
Kingdom. The study was funded under the European Union Framework V
Programme, which sought to promote greater research integration, co-ordination
and exchange among European research institutions.
The European Bronchial Tissue Bank (EBTB) central database was set up at the
University of Liverpool (Liverpool, UK) to optimise standardisation, preservation
and use of clinical specimens. Specimens were collected by a technician
employed by each participating centre for this purpose. Standard operating
procedures were developed to ensure uniformity in the collection and labelling of
specimens. All specimens (lung cancer biopsies, sputum, bronchial lavage and
blood) were processed and archived at the EBTB.
The EUELC web-based database was created in SQL Server 2000 in partnership
with InferMed. The database contained all specimens’ details and allowed an
interactive access from all study centres to directly enter lifestyle and medical
data during each follow-up visit. This approach ensured controlled data entry for
each centre with data editing being restricted to the data manager and to the
principal investigators.
Selection of patients
Beginning in 2002 and continuing through 2006 were selected 1,177 patients
from participating hospitals with surgically resected primary NSCLC with limited
cancer stages (such as T1N0; confirmed either by histological or cytological
analysis). The patients were considered at very high risk of developing
progressive lung cancer (i.e. Second Primary Lung Cancer (SPLC) and/or

96
metastasis) and were all Caucasians. Finally 733 patients with primary lung
cancer surgery and complete data from life-style questionnaire were selected
(Figure 22). Patients were followed-up every 6 months up to 2011 with a median
follow-up period of about 48 months. The different statuses available to define
patient’s health were: Alive and Well, Alive with the disease, Died from other
causes, Died from the disease, Metastatic recurrence, SPLC, Treatment with
chemotherapy, with radiotherapy, or with both.
Progressive Disease (PD) was defined as the development of a SPLC or
recurrence/metastasis in individuals with a history of a completely resected
primary lung or head & neck cancer. Disease Free (DF) was defined as the
absence of Progressive Disease after surgery at the time of the last follow-up.
Figure 22: Selection of patients from the EUELC dat abase
157 patients excluded because missing smoking habits, clinical or follow-up data
890 Patients with Primary Lung Cancer surgery
733 Patients with Primary Lung Cancer surgery
1177 Patients with resected PLC/HN
938 Patients with Primary Lung Cancer surgery
239 patients excluded because of non consent
48 patients excluded because undefined histology

97
Life-style questionnaire
Instructions for interviewing and coding were developed and training to research
interviewers was carried out in each centre. All lifestyle questionnaires were
translated to ensure consistency across European partners. After obtaining
written consent, all participants completed a 45-min in-person interview. The
questionnaire collected detailed information on socioeconomic and demographic
characteristics, medical history, family history of cancer, history of tobacco
consumption and occupational exposure to asbestos. Extensive information
about tobacco smoking was elicited for all participants including their age at
start/end of consumption and the number of cigarettes smoked per day.
Individuals who had smoked at least 100 cigarettes in their lifetime were
considered as ever-smokers. A former smoker quit smoking at least 1 year
before diagnosis while a current smoker smoked in the last 2 years before
interview. Information on history of cancer among first-degree relatives (i.e.
parents, siblings and biological children) was recorded, including age at
diagnosis and site of cancer.
Selection of tumour samples
Immunohistochemistry of p53 protein was first tested on 306 lung cancer frozen
tissues by a collaborative centre in France. Our laboratory received 273 p53
positive samples ready for DNA extraction and for laboratory analysis of TP53,
KRAS and EGFR genes. Only samples with known follow-up of the
corresponding patient were included in the statistical analysis (Figure 23).
Our series (Table 10) included 11 never-smokers (<100 cigarettes smoked in a
lifetime), 86 former smokers (smoking cessation ≥ 2 years before diagnosis) and
152 current smokers, and 1 patient without informed smoking status. There were
110 SCC, 133 ADC and 7 patients recorded as “other histologies” (large cell
carcinoma or mixed histologies).

98
Figure 23: Selection of samples for mutational anal ysis
Table 10: Characteristics of patients included in the analysi s
Variable (missing) Items n
Gender Male 210 Female 40 Age < 60 89 [60-65[ 82 [65-70[ 30 ≥ 70 49 Histology ADC 133 SCC 110 Others 7 Asbestos exposure (2) None 191 Yes 57 Tumour score (1) T1 76 T2 150 T3 15 T4 8 Nodal score (1) N0 173 N1 65 N2 2 NX 9 Past pulmonary illness (2) No 110 Yes 138 Smoking status (1) Current smoker 152 Former smoker 86 Never-smoker 11 Total 250
273 samples with DNA extracted and qualified for
PCR/sequencing
306 samples received
EGFR 157 samples analyzed in all
ADC (n=130) and in a subset of SCC (n=27)
TP53 - KRAS 273 samples analyzed
27 EGFR non-ADC samples excluded 23 TP53 and 24 KRAS samples without
known follow-up status excluded
TP53 status (n=250) TP53 polymorphisms (n=249)
KRAS status (n=249) EGFR status (n=130)
P53 IHC score (n=230)

99
Statistical analysis
250 patients with known follow-up status were selected for statistical analysis of
TP53 mutations; 249 samples for KRAS; 130 ADC samples for EGFR and 249
samples for TP53 polymorphisms. As a data quality check, Hardy Weinberg
equilibrium was tested for all polymorphisms studied using the χ2 test.
The Mantel-Haenszel χ2 test, stratified by centre, was used to test both the
association of clinical parameters with biomarkers and between biomarkers (e.g.
mutation status with polymorphisms). Bootstrap analysis was performed to obtain
non-parametric confidence intervals for risk estimates. This method creates
multiple samples of patients through a process of random selection and performs
the analysis on each dataset to calculate a mean risk with its non-parametric
confidence intervals.
KRAS mutations were independently analysed from another EUELC partner
using a different laboratory assay. Results were analysed for reproducibility
between the two centres using the Kappa test statistic for measure of agreement
beyond chance.
The Kappa coefficient is a measure of inter-agreement and has been computed
by SAS software as:
K = (Pa-Pe) / (1-Pe)
Pa = [(wild-types + mutants) / total samples] and Pe = [P(mutant) + P(wild-type)].
In this case, the K coefficient measures the agreement between two or more
judges who have coded a qualitative variable. A value of 0 denotes an agreement
due to chance while a value of 1 means a perfect agreement. Agreement is
considered important beyond a value of 0.60.
A Cox proportional hazard model was used to test how certain biomarkers affect
survival, both overall and specifically from lung cancer. Clinical parameters
associated with mortality were additionally adjusted for. The Fine & Gray (F&G)

100
model was applied to estimate association of biomarkers and clinical variables
with the progression of primary lung cancer. The F&G model takes into account
the presence of “competing risks” for patients who died from causes other than
lung cancer. The aim of the regression analysis was to estimate lung cancer-
specific recurrence probabilities, by censoring failures due to competing risks.
Univariate F&G analysis was carried out by computing unadjusted matched HR
to compare Progressive Disease (PD) subjects and Disease Free (DF) subjects
for each variable of interest. PD patients were individually matched with DF
patients on centre, sex, age at surgery (±3 years), histology, nodal stage and
follow-up time (at least as long as the event time for matched PD subjects).
Biomarkers were assessed one at a time in a multivariate F&G model adjusted
for T and N cancer scores (of the TNM classification system, Beasley et al. 2004)
for potential risk factors of cancer recurrence identified from the univariate
analysis. Multivariable analysis was conducted to identify risk factors that were
independently associated with Progressive Disease. The criteria for selection of
these variables for possible inclusion in the multivariable analysis were based on
both biological importance and a p value of less than 0.10 in the univariate
analysis. The analysis was stratified by centre to account for differences in the
number of patients recruited. According to the distribution of follow up duration
we censored the analysis at 48 months. Cumulative incidence plots were
performed to illustrate the risk of disease progression through time according to
the mutation status of the genes analysed.
All statistical analyses were performed using SAS 9.1.3 (SAS Institute, NC). The
F&G model was used to compute Hazard Ratio (HR) and 95% confidence
interval (CI). Statistical significance was assessed at the level of 0.05.

101
Laboratory Methods
Analysis of somatic mutations
DNA previously extracted from frozen tissue was received from the European
Bronchial Tissue Bank and analysed for TP53 (exons 4-10 including flanking
splice sites, i.e. residues 52 to 364) mutations by pre-screening with denaturing
high-pressure liquid chromatography (dHPLC) followed by a second PCR and bi-
directional sequencing. Specimen with matched dHPLC and sequencing results
were considered as containing a mutation. Finally, TP53 mutation’s type was
analysed with reference to the IARC mutation database.
KRAS mutations at codon 12 were analysed by mutant-enriched PCR as
described by Gormally et al. (Gormally et al. 2006). To avoid false-positive results
generated during successive PCR rounds, all analyses were repeated twice.
After digestion with MvaI enzyme, the mutant PCR product is excised, amplified
and sequenced. KRAS codon 12 ME-PCR was able to detect up to 0.1% of
mutant DNA in wild-type DNA (Figure 24).
EGFR mutations were detected using PCR-based direct sequencing of the four
exons of the TK domain (exons 18–21) as described by Pao et al. (Pao et al.
2004). All sequencing reactions were performed in both forward and reverse
directions, and all mutations were confirmed by an independent PCR
amplification.

102
Figure 24: Flow chart illustrating the main steps o f the procedure for TP53 and KRAS analysis
From Le Calvez et al. 2005

103
Detection of TP53 mutations by dHPLC and sequencing
It has been previously demonstrated (Le Calvez et al. 2005) that pre-screening
by dHPLC represents a sensitive method with detection levels of mutant DNA
ranging between 3% and 12% depending on mutation type and sequence
context (Table 11). In comparison, direct sequencing does not detect most
mutations in samples containing less than 25%–30% of mutated DNA
(Rosenblum et al. 1997; Ahrendt et al. 1999).
Table 11: Detection limit of percent mutant DNA by dHPLC
dHPLC is a conformation-based method of mutation detection that relies on the
fact that DNA fragments analysed are a mixture of wild-type and mutant DNA.
DNA that contains a sequence alteration (most commonly occurring in
heterozygous form) has differential mobility under partially denaturing conditions
during reverse-phase ion-exchange HPLC (Keller et al. 2001), resulting in
heteroduplexes eluting first from the column. To allow for heteroduplex formation
PCR products were heated at 95°C for 4min and then cooled at room
temperature for one hour.
5 to 10µl of the PCR products were then injected into a preheated reverse-phase
column (DNASep Column, Transgenomic) equilibrated by an ion pairing agent
TEAA 0.1M (triethylammonium acetate). DNA was removed from the column at a
constant flow rate of 0.9ml/min by a linear acetonitrile gradient, achieved by
mixing a buffer A (TEAA 0.1M) with a buffer B (TEAA 0.1M and acetonitrile 25%).
Cell line Exon Codon Mutation dHPLC
Hs578T 5 157 GTC>TTC 12.50
T47D 6 194 CTT>TTT 3.12
TE11 7 237 ATG>ATT 3.12
TE6 7 248 CGG> CAG 6.25
TE1 8 272 GTG>ATG 3.12
MDA-MB 231 9 280 AGA>AAA 6.25

104
Acetonitrile (CH3CN) rose of 2% per min during 2.5 min from an initial
concentration at T0.
The temperature for optimum separation of heteroduplex from homoduplex was
calculated by Transgenomic software in order to maintain almost 75% of PCR
product in a double stranded form. The assay was run at three temperatures
(except for exon 7) to attain maximal sensitivity.
dHPLC, whilst very sensitive, will not distinguish between pathogenic and non-
pathogenic sequence variants and consequently it was always performed
injecting both positive and negative internal controls for each screening
temperature (Table 12).
Table 12: dHPLC conditions used for TP53 screening
The eluted DNA was detected at 260nm. Figure 25 shows chromatogram of a
blank sample (Blk), of a negative control (e.g. lymphocytes – Lym-) and of a
positive control bearing a known mutation (e.g. TE1 or R).
The positive controls consisted either of DNA isolated from cell lines that
contained a mutation diluted with equal quantity of wild-type DNA (e.g. TE1 +
Exon Temperature
(°C)
(%CH3CN)
T0-T2.5 Cell line Mutation Cancer
62 50-58 IGR191 (cd 36: CCG-CCA)
65 50-55 IGR2 (cd 91: TGG-TGA)
Squamous Cell
Carcinoma
4
68 45-50 Raji (R) (cd 72: CGC-CCC) Burkitt lymphoma
62 59-64 T47D (cd 194: CTT-TTT) Breast
66 53-58 YL38 (cd 144: CAG-TAG) Oesophagus
5-6
68 50-55 Hs578T (cd 157: GTC-TTC) Breast
7 64 53-58 TE6
TE11
(cd 248: CGG-CAG)
(cd 237: ATG-ATT)
60 58-63 TE1 (cd 272: GTG-ATG)
62 56-61 TE1 (cd 272: GTG-ATG)
Oesophagus 8-9
65 50-55 MDA-
MB231 (cd 280: AGA-AAA) Breast

105
lymphocytes) to enable heteroduplex formation (because only mutant sequences
were present in our cell lines); or of DNA isolated from tumour samples (e.g. R)
that contained mutant sequences and wild-type sequences from neighbouring
non-tumour cells.
Figure 25: Negative and positive dHPLC controls
PCR reactions for exons 4, 5-6 and 8-9 of TP53 gene involved a 2-minute
polymerase activation at 94°C, 20 cycles of denaturation (94°C, 30s), primer
annealing (63°C, 45s), and extension (72°C, 60s), followed by 30 cycles of
denaturation (94°C, 30s), primer annealing (60°C, 45s), and extension (72°C,
60s) and a final 10-minute extension at 72°C.
BlkLymR
Time (Minutes)7654321
Abs
orba
nce
(mV
)
14
12
10
8
6
4
2
0
BlkLymLym + TE1
Time (Minutes)7654321
Abs
orba
nce
(mV
)
14
12
10
8
6
4
2
0

106
PCR reaction for exon 7 involved a 15-minute polymerase activation at 95°C, 50
cycles of denaturation (94°C, 30s), primer annealing (60°C, 30s), and extension
(72°C, 30s), followed by a final 10-minute extension at 72°C.
Table 13 lists the amplification conditions and primers (HotStar Taq and Taq
Platinum both from Invitrogen, Paisley, UK).
Table 13: PCR conditions for TP53 exons 4 to 9
Bidirectional sequencing of PCR products was used as a final step of the
mutation scanning procedure, both confirming and identifying the sequence
alteration. Sequencing was performed on an independent PCR product to
confirm presence of a mutation.
Conventional unidirectional sequencing of PCR products by fluorescent di-deoxy
terminators has a sensitivity of about 95% (i.e. may miss 1 in 20 mutations) and a
PCR conditions Exon 4 Forward tgaggacctggtcctctgac Primers
(5’3’) Reverse agaggaatcccaaagttccA Mix Taq Platinum (0.8U/20ul mix), 1.5mM MgCl2,
0.2mM each dNTP, 1µM each primer
Exon 5-6 Forward tgttcacttgtgccctgact Primers
(5’3’) Reverse ttaacccctcctcccagaga Mix Taq Platinum (0.8U/20ul mix), 1.5mM MgCl2,
0.2mM each dNTP, 0.4µM each primer
Exon 7 Forward cttgcccacggtctccccaa Primers
(5’3’) Reverse aggggtcagcggcaagcaga Mix HotStar Taq (0.8U/20ul mix), 1.5mM MgCl2
0.2mM each dNTP, 0.4µM each primer
Exon 8-9 Forward ttgggagtagatggagcct Primers
(5’3’) Reverse agtgttagactggaaacttt Mix Taq Platinum (0.8U/20ul mix), 2mM MgCl2,
0.2mM each dNTP, 0.4µM each primer

107
low but finite false positive rate due to base mis-incorporation and other
sequencing, optical or polymer artefacts.
Prior sequence analysis, PCR products were purified with the enzyme ExoSap-IT
(USB) for 15min at 37°C and 15min at 80°C. PCR prod ucts were analysed by a
16-capillary automated sequencer (ABI PRISM® 3100 Genetic Analyser, Applied
Biosystems), based on the Sanger method (see principle at:
http://www.bio.davidson.edu/Courses/Molbio/MolStudents/spring2003/Obenrader
/sanger_method_page.htm). Sequencing reaction was done with 1.5µl BigDye®
Terminator v1.1 Cycle Sequencing Kit (Applied Biosystems, Carlsbad, California,
USA) on 7µl of purified PCR product, adding 1.25µl buffer and 0.5µl primer at
10µM (same primers as those used for PCR amplification reactions).
The PCR reaction involved 30 cycles of 10-min denaturation at 96°C, primer
annealing (50°C, 5s), and extension (60°C, 4min). Sequences were imported in a
sequence-analysis software using the reference sequence NC_000017.9 from
Genbank (http://www-p53.iarc.fr/TP53sequence_NC_000017-9.html) to allow
visual inspection of chromatograms. Variations were finally checked with the
mutation validation tool available at IARC (http://www-p53.iarc.fr) to distinguish
between a known polymorphism and a mutation as well as to obtain frequency
and functional data.
Detection of EGFR mutations by bidirectional sequen cing
EGFR mutations were detected using PCR-based direct sequencing. All
sequencing reactions were performed in both forward and reverse directions, and
all mutations were confirmed by PCR amplification of an independent DNA
isolate. The PCR mix contained 1.5mM MgCl2, 0.8µM of each primer, 200µM of
each dNTP, 1.5U of Taq platinum polymerase. PCR reactions involved a 2-
minute Taq platinum polymerase activation at 94°C, 50 cycles of denaturation
(94°C, 30s), primer annealing (59°C, 45s), and extension (72°C, 45s), followed
by a final 10-minute extension at 72°C. After bidirectional sequencing,
occurrence of mutations was assessed with reference to sequences in the
COSMIC mutation database (www.sanger.ac.uk/genetics/CGP/cosmic/).

108
Detection of KRAS mutations by ME-PCR
Exon 1 of KRAS gene was amplified with AmpliTaq Gold (Applied Biosystems,
Foster City, CA, USA) and with primers forward (1F) 5'-
actgaatataaacttgtggtagtgggacct-3' and reverse (3R) 5'-
ggtgcaggaccattctttgatacagat-3'. SW480 (human colon adenocarcinoma cell line
containing mutation at KRAS codon 12, CCA>CAA, Glycine> Valine) was used
as PCR internal positive control.
The PCR mix contained 1.5mM MgCl2, 0.4µM of each primer, 200µM of each
dNTP, 1.5U of polymerase, 10mM Tris-HCl and 50mM KCl. PCR reaction
involved a 6-minute polymerase activation at 95°C, 50 cycles of denaturation
(94°C, 30s), primer annealing (58°C, 30s), and extension (72°C, 30s), followed
by a final 10-minute extension at 72°C. PCR product was checked on a 2%
agarose gel.
10µl of the amplified product (157 bp) were digested with restriction
endonuclease Mva I (Roche Applied Science) at 37°C overnight. The enzyme
recognises a CC/TGG sequence, which has been created between codons 11
and 12 by primer 1F and between codons 48 to 50 by primer 3R. Wild type
sequence at codon 12 gives 3 digestion products of 29, 114 and 14 bp whereas
mutant sequence at any of the 2 first positions of codon 12 abolishes the
restriction site introduced by primer 1F giving two restriction products of 143bp
and 14 bp. Digested products were checked on a 3% agarose gel. Enrichment of
the mutant DNA was performed from 1µl of the first PCR product, which was re-
amplified by semi-nested PCR using primers 1F and 2R 5'-
gaggtaaatcttgttttattatgcatatta-3' under the same conditions. The 135 bp
amplification product was digested with Mva I. Only mutant re-amplified
fragments (and uncompleted wild-type digested product) contain restriction sites
and are cut with Mva I. This second step allows detection of mutations in small
quantities of mutated DNA.

109
Detection of TP53 polymorphisms
Exon 4 was pre-screened by dHPLC; abnormal chromatograms were additionally
analysed by RFLP on an independent PCR product. A new PCR (for primers and
conditions please refers to Table 14) and digestion of 7µl of PCR product were
performed. The BstUI restriction endonuclease (BioLabs) was used to cut within
the GC|CG sequence encompassing codon 72 (CGC). Mutant fragments were
visualised on 3% agarose gel stained with ethidium bromide, eluted, re-amplified
by PCR and sequenced.
PIN2 and PIN3 were analysed by bi-directional sequencing and each reaction
was repeated at least twice. Exons 2-3 of TP53 gene were amplified with primers
forward 5’-tctcatgctggatccccact-3’ and reverse 5’-agtcagaggaccaggtcctc-3’. The
PCR mix contained Taq Platinum (0.8U/20µl mix), 1.5mM MgCl2, 0.2mM of each
dNTP, 0.4µM of each primer (p559 forward and pE3Ri reverse). PCR reaction
involved a 2-minute polymerase activation at 94°C, 50 cycles of denaturation
(94°C, 30s), primer annealing (61°C, 45s), and extension (72°C, 45s), followed
by a final 10-minute extension at 72°C. PCR products were sequenced and
procedure was repeated to confirm the presence of the polymorphism.
Detection of TP53 haplotypes (PIN2-PIN3-PEX4)
To determine the haplotypes defined by the three TP53 polymorphisms, we used
a method developed at IARC (Marcel et al. 2009), based on the amplification
refractory mutation system (ARMS) and involving four different allele-specific
PCR to identify haplotypes directly on agarose gel prior confirmation by
bidirectional sequencing.
Figure 26 represents primers location on TP53 gene for amplification of the two
PIN2 alleles (1F, G allele: 5'-aagggcaggccaggaggggG-3' and 2F, C allele: 5'-
aagggcaggccaggaggggC-3') and the two PEX4 alleles (3R, allele coding a P: 5'-
tgctggtgcaggggccacgG-3' and 4R, allele coding an R: 5'-tgctggtgcaggggccacgC-
3').
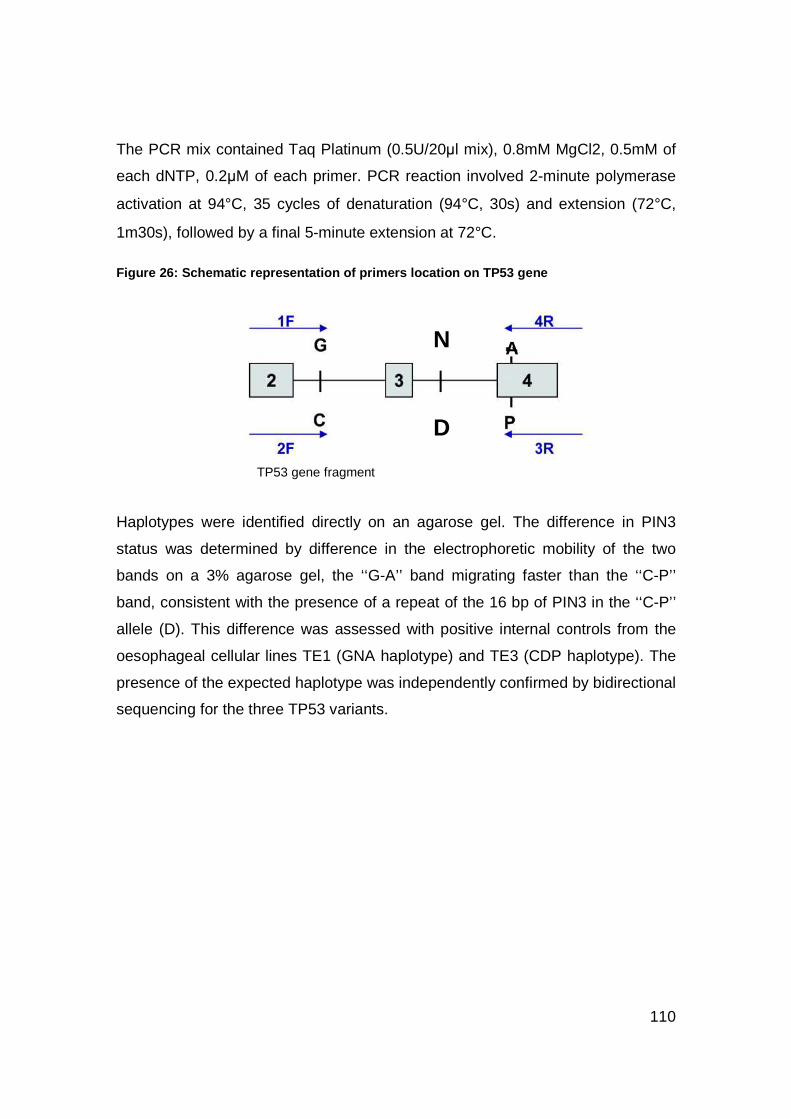
110
The PCR mix contained Taq Platinum (0.5U/20µl mix), 0.8mM MgCl2, 0.5mM of
each dNTP, 0.2µM of each primer. PCR reaction involved 2-minute polymerase
activation at 94°C, 35 cycles of denaturation (94°C, 30s) and extension (72°C,
1m30s), followed by a final 5-minute extension at 72°C.
Figure 26: Schematic representation of primers loca tion on TP53 gene
Haplotypes were identified directly on an agarose gel. The difference in PIN3
status was determined by difference in the electrophoretic mobility of the two
bands on a 3% agarose gel, the ‘‘G-A’’ band migrating faster than the ‘‘C-P’’
band, consistent with the presence of a repeat of the 16 bp of PIN3 in the ‘‘C-P’’
allele (D). This difference was assessed with positive internal controls from the
oesophageal cellular lines TE1 (GNA haplotype) and TE3 (CDP haplotype). The
presence of the expected haplotype was independently confirmed by bidirectional
sequencing for the three TP53 variants.
N
D
TP53 gene ’ s fragment
A N
D
TP53 gene fragment
A

111
Results
Mutation prevalence
Table 14 shows the mutation prevalence in the selected genes in the EUELC
cohort. 48.4% of 250 patients bore a TP53 mutation (including 5 silent
mutations). A total of 18.5% KRAS mutations at codons 12 and 13 were
detected. EGFR mutations were initially analysed in 157 cases (140 ADC and 17
non-ADC). Since earlier reports suggest that this gene is rarely mutated in
NSCLC types other than ADC, and since we found only 1 mutation (exon 19,
codon 742, Val>Leu) in non-ADC cases, we performed the statistical analysis on
a selection of 130 ADC cases with known follow-up status and we detected
13.1% EGFR mutations.
Eighteen patients had mutations in two genes (Table 15), including 11 patients
with TP53 mutations among 46 with KRAS mutations, and 6 patients with TP53
mutations among 17 with EGFR mutations. One patient with KRAS mutation also
had a silent mutation in exon 21 of EGFR (codon 836, CGC>CGT Arg>Arg). No
patient had mutations in the 3 genes.
Table 14: Mutation prevalence in EUELC patients
Table 15: Prevalence of cases with mutations in mor e than one gene
Gene Status n %
TP53 (n=250) Wild-type 129 51.6 Mutant (exons 4-9) 121 48.4
KRAS (n=249) Wild-type 203 81.5 Mutant (codon 12) 46 18.5
EGFR (n=130) Wild-type 113 86.9 Mutant 17 13.1
Mutations n %
KRAS (n=46) TP53 11 23.9%
EGFR (n=17) TP53 6 35.3% KRAS 1 5%

112
TP53 mutations
Functionally, TP53 mutations may differ according to their nature and position.
Knowing TP53 mutation status has potential applications for identification of
mutagen "fingerprints" (Greenblatt et al. 1994) and early diagnosis (Sidransky
2002).
Patterns and distribution
DNA extracted from tumour material was analysed for TP53 mutations covering
exons 4 to 9 including flanking splice sites. Based on data in the IARC TP53
mutation database, these regions contain over 90% of all mutations ever reported
in lung cancer. DNA was analysed for mutations in TP53 by a two-step approach,
with first pre-screening by dHPLC followed by an independent analysis by direct
sequencing of all DNA fragments that gave an abnormal chromatogram. Figure
27 gives an example of mutated sample identified by an abnormal chromatogram
(id: 04-053-00-TfD in Panel B) with a profile equivalent to that of a positive
(mutated) internal standard (cell line TE1 in Panel A).
Patterns of TP53 mutations are shown in Figure 28. This mutation pattern is
dominated by a high prevalence of G:C to T:A transversions (33%), with an
overall prevalence of transversions at G:C and A:T base pairs (49%) and G:C to
A:T transitions at CpG dinucleotides rare (6%). This pattern is compatible with
the known profile of TP53 mutations in lung cancers of smokers. The codon
distribution was also in agreement with the known smoking-patterns; i.e. with G:C
to T:A transversions and hotspots at codons 157 and 158 (Figure 28).

113
Figure 27: Panel A: Chromatogram of internal standa rds for TP53 exons 8-9 (wild-type: lymphocyte, mutant: TE1); Panel B: example of posit ive sample (id: 04-053-00-TfD)
BlkLymLym + TE1
Time (Minutes)7654321
Ab
sorb
ance
(m
V)
14
12
10
8
6
4
2
0
Lym04-029-00-TfD04-039-00-TfD04-043-00-TfD04-047-00-TfD04-049-00-TfD04-053-00-TfD
Time (Minutes)7654321
Abs
orba
nce
(mV
)
14
12
10
8
6
4
2
0
A
B

114
Figure 28: Patterns of TP53 mutations broken down by type of base substitution : Panel A: EUELC; Panel B: TP53 database
Mutation pattern / 121 mutations / EUELC project
Mutation pattern / 26608 mutations / IARC TP53 Database, November 2010
4% 10%
4% 1%
16%
14% 6%
11%
33%
1%
A:T>C:G A:T>G:C A:T>T:A complex del G:C>A:T G:C>A:T at CpG G:C>C:G G:C>T:A ins
B
A

115
Figure 29a shows the distribution of mutations along the coding sequence of
TP53. Codons with the highest mutation prevalence were 157, 158, 249, 273 and
282. These sites correspond to the codons reported as “hotspots” in lung
cancers. Minor mutation spots were observed at codons 234, 244 and 285. All
hotspots mutations are categorized as “deleterious” in the IARC TP53 mutation
database, i.e. predicting loss of p53 transactivation function.
Figure 29b shows the specific location of the codons that carried G to T
transversions. Transversions at codon 157, 158, 273 are typical mutations
following DNA damage by metabolites of PAH. In contrast, codon 249 has not
been described as a major site of adduction for such compounds. Rather, it is
specific to aflatoxin adducts. Nevertheless, an excess of G to T transversions at
codon 249 has already been noted in lung cancers, in smokers as well as in non-
smokers. Unconfirmed reports have suggested a possible role of radon as
inducer of these mutations.
Figure 29a: TP53 mutations distribution at exons 4 to 9
282158157
273
249
0
1
2
3
4
5
6
7
8
53 111 130 151 157 163 179 192 205 221 240 245 251 263 272 275 281 285 314
Codon number
Per
cent
Sin
gle
Bas
e S
ubst
itutio
n
244
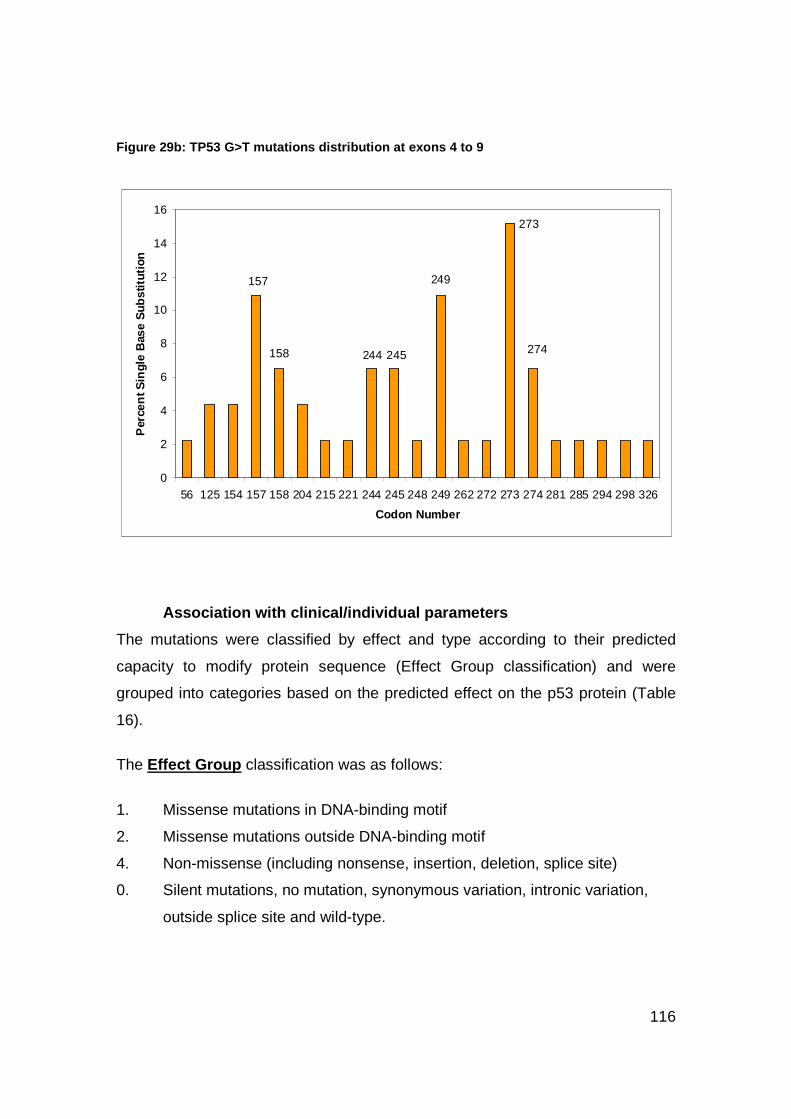
116
Figure 29b: TP53 G>T mutations distribution at exons 4 to 9
157
158 244 245
249
273
274
0
2
4
6
8
10
12
14
16
56 125 154 157 158 204 215 221 244 245 248 249 262 272 273 274 281 285 294 298 326
Codon Number
Per
cen
t Sin
gle
Bas
e S
ubst
itutio
n
Association with clinical/individual parameters
The mutations were classified by effect and type according to their predicted
capacity to modify protein sequence (Effect Group classification) and were
grouped into categories based on the predicted effect on the p53 protein (Table
16).
The Effect Group classification was as follows:
1. Missense mutations in DNA-binding motif
2. Missense mutations outside DNA-binding motif
4. Non-missense (including nonsense, insertion, deletion, splice site)
0. Silent mutations, no mutation, synonymous variation, intronic variation,
outside splice site and wild-type.

117
The categories for TP53 mutations were as follows: Category: CONSERVATION
� Deleterious = 1
� Neutral = 2
� NA = 4 or 0 (i.e. silent mutant and wild-type)
Based on evolutionary protein conservation, groups 2 and 0 are predicted to not
affect protein function while groups 1 and 4 are predicted to affect it.
Category: TRANSACTIVATION
� Non-functional = 1
� Functional/Partially functional = 2
� NA = 4 or 0 (=silent mutant and wild-type)
In yeast assays, groups 2 and 0 retain transactivation capacity while groups 1
and 4 loose it.
Category: STRUCTURE
� Same values as Effect Group
Category: CLINICAL IMPACT
� Deleterious = 1 (Effect Group 4 and 1)
� Non-deleterious = 2 (Effect Group 2 and functional mutations)
� Wild-type samples and silent mutations = 0
Group 1 relates to very bad clinical outcome while group 2 relates to intermediate
clinical outcome. If a sample contained more than one mutation, we considered
the more deleterious one for statistical analysis.

118
Table 16 : TP53 mutation distribution by effect and type grouped i nto categories for predicted effect on the protein TP53 Categories Mutation effect n % Conservation 0 – Silent (and WT) 133 54.1 1 – Deleterious 78 31.7 2 – Neutral 1 0.4 4 – Non missense 34 13.8 Transactivation 0 – Silent (and WT) 133 54.1 1 – Non Functional 73 29.7 2 – Functional/Partially functional 6 2.4 4 – NA 34 13.8 Structure 0 – Silent (and WT) 133 54.7 1 – Missense mutations in DNA-binding domain 44 18.1 2 – Missense mutations outside DNA-binding domain 32 13.2 4 – Non-missense 34 14.0 Type 0 – Wild Type 130 53.3 1 – CpGs sites 6 2.5 2 – A:T > xxx 24 9.8 3 – All G>T 36 14.8 4 – G>A or G>C not a CpG sites 27 11.1 5 – Other 21 8.6 Clinical impact 0 – Silent (and WT) 133 53.8 1 – Deleterious 82 33.2 2 – Non-deleterious 32 13.0
Tables 17a to d classify TP53 mutations into different categories and smoking
variables. We found no association between smoking exposure and TP53
mutations broken down by predicted effect on conservation, transactivation, and
structure of p53 protein or clinical impact.
Table 18 shows the association between the prevalence of TP53 G>T
transversion and exposure to tobacco smoking. We did not find any association.

119
Table 17a: TP53 mutations classified into conservation categories in relation to smoking
CONSERVATION categories (n=246)
2+0 1 4 Variable (missing) Items
n % n % n %
P value
Smoking status (1) Current smoker 80 60.2 43 55.1 25 73.5 0.49 Former smoker 46 34.6 32 41.0 8 23.5 Never-smoker 7 5.3 3 3.8 1 2.9 Age at smoking initiation (1) < 16 51 40.5 28 37.8 12 36.4 0.25 [16 – 18[ 21 16.7 14 18.9 5 15.2 [18 – 20[ 24 19.1 11 14.9 12 36.4 ≥ 20 30 23.8 21 28.4 4 12.1 Years of smoking (2) < 30 16 12.8 16 21.6 1 3.0 0.18 [30 – 40[ 37 29.6 19 25.7 12 36.4 [40 – 50[ 34 27.2 26 35.1 12 36.4 ≥ 50 38 30.4 13 17.6 8 24.2 Pack-years (3) < 20 21 15.9 13 16.9 3 8.8 0.80 [20 – 40[ 43 32.6 32 41.6 12 35.3 [40 – 50[ 23 17.4 12 15.6 8 23.5 > 50 45 34.0 20 26.0 11 32.4 Cigarette type (4) Filter 54 43.6 33 45.2 16 48.5 0.85 Mixed 39 31.5 20 27.4 7 21.2 Non filter & rolled 31 25.0 20 27.4 10 30.3 Years since quit smoking [2 – 6[ 10 21.7 2 6.3 1 12.5 0.58 [6 – 13[ 14 30.4 10 31.3 4 50.0 [13 – 20[ 8 17.4 11 34.4 2 25.0 ≥ 20 14 30.4 9 28.1 1 12.5

120
Table 17b: TP53 mutations classified into transactivation categories in relation to smoking
TRANSACTIVATION categories (n=245)
2+0 1 4 Variable (missing) Items
n % n % n %
P value
Smoking status (1) Current smoker 83 60.1 40 54.8 25 73.5 0.50 Former smoker 48 34.8 30 41.1 8 23.5 Never-smoker 7 5.1 3 4.1 1 2.9
< 16 52 39.7 27 39.1 12 36.4 0.15 Age at smoking initiation (1) [16 – 18[ 21 16.0 14 20.3 5 15.2
[18 – 20[ 27 20.6 8 11.6 12 36.4 ≥ 20 31 23.7 20 29.0 4 12.1
< 30 17 13.1 15 21.7 1 3.0 0.10 Years of smoking (2) [30 – 40[ 39 30.0 17 24.6 12 36.4 [40 – 50[ 34 26.2 26 37.7 12 36.4 ≥ 50 40 30.8 11 15.9 8 24.2 Pack-years (3) < 20 22 16.1 12 16.7 3 8.8 0.89 [20 – 40[ 46 33.6 29 40.3 12 35.3 [40 – 50[ 23 16.8 12 16.7 8 23.5 > 50 46 33.6 19 26.4 11 32.4 Cigarette type (4) Filter 56 43.4 31 45.6 16 48.5 0.81 Mixed 41 31.8 18 26.5 7 21.2 Non filter & rolled 32 24.8 19 27.9 10 30.3 Years since quit smoking [2 – 6[ 10 20.8 2 6.7 1 12.5 0.59 [6 – 13[ 15 31.3 9 30.0 4 50.0 [13 – 20[ 8 16.7 11 36.7 2 25.0 ≥ 20 15 31.3 8 26.7 1 12.5

121
Table 17c: TP53 mutations classified into structure categories in relation to smoking
STRUCTURE categories (n=243)
0 1 2 4 Variable (missing) Items
n % n % n % n %
P value
Smoking status (1) Current smoker 80 60.6 25 56.8 17 53.1 25 73.5 0.59 Former smoker 45 34.1 18 40.9 13 40.6 8 23.5 Never-smoker 7 5.3 1 2.3 2 6.3 1 2.9
< 16 51 40.8 19 45.2 9 30.0 12 36.4 0.31 Age at smoking initiation (1) [16 – 18[ 20 16.0 8 19.1 6 20.0 5 15.2
[18 – 20[ 24 19.2 6 14.3 4 13.3 12 36.4 ≥ 20 30 24.0 9 21.4 11 36.7 4 12.1
< 30 16 12.9 7 16.7 9 30.0 1 3.03 0.11 Years of smoking (2) [30 – 40[ 36 29.0 12 28.6 8 26.7 12 36.4 [40 – 50[ 34 27.4 13 31.0 12 40.0 12 36.4 ≥ 50 38 30.7 10 23.8 1 3.3 8 24.2 Pack-years (3) < 20 21 16.0 7 16.3 6 18.8 3 8.8 0.67 [20 – 40[ 42 9.2 19 44.2 13 40.6 12 35.3 [40 – 50[ 23 17.6 4 9.3 7 21.9 8 23.5 > 50 45 34.4 13 30.2 6 18.8 11 32.4 Cigarette type (4) Filter 53 43.1 21 51.2 13 43.3 16 48.5 0.86 Mixed 39 31.7 10 24.4 9 30.0 7 21.2 Non filter & rolled 31 25.2 10 24.4 8 26.7 10 30.3 Years since quit smoking [2 – 6[ 9 20 0 0 3 23.1 1 12.5 0.60 [6 – 13[ 14 31.1 6 33.3 3 23.1 4 50.0 [13 – 20[ 8 17.8 6 33.3 4 30.8 2 25.0 ≥ 20 14 31.1 6 33.3 3 23.1 1 12.5

122
Table 17d: TP53 mutations classified into clinical impact categories in relation to smoking
CLINICAL IMPACT categories (n=247)
0 1 2 Variable (missing) Items
n % n % n %
P value
Smoking status (1) Current smoker 80 60.6 54 65.9 17 53.1 0.71 Former smoker 45 34.1 26 31.7 13 40.6 Never-smoker 7 5.3 2 2.4 2 6.3
< 16 51 40.8 31 39.2 9 30.0 0.69 Age at smoking initiation (1) [16 – 18[ 20 16.0 14 17.7 6 20.0 [18 – 20[ 24 19.2 19 24.1 4 13.3 ≥ 20 30 24.0 15 19.0 11 36.7
< 30 16 12.9 10 12.7 9 30.0 0.08 Years of smoking (2) [30 – 40[ 36 29.0 26 32.9 8 26.7 [40 – 50[ 34 27.4 25 31.7 12 40.0 ≥ 50 38 30.7 18 22.8 1 3.3 Pack-years (3) < 20 21 16.0 11 13.6 6 18.8 0.84 [20 – 40[ 42 32.1 33 40.7 13 40.6 [40 – 50[ 23 17.6 13 16.0 7 21.9 > 50 45 34.4 24 29.6 6 18.8 Cigarette type (4) Filter 53 43.1 38 48.7 13 43.3 0.71 Mixed 39 31.7 18 23.1 9 30.0 Non filter & rolled 31 25.2 22 28.2 8 26.7 Years since quit smoking [2 – 6[ 9 20.0 1 3.9 3 23.1 0.60 [6 – 13[ 14 31.1 10 38.5 3 23.1 [13 – 20[ 8 17.8 8 30.8 4 30.8 ≥ 20 14 31.1 7 26.9 3 23.1

123
Table 18: TP53 smoking-related mutations in relation to smoking
Other (n = 130)
All G > T (n = 36) Variable (missing) Items
n % n % P value
Smoking status (1) Current smoker 78 60.5 25 69.4 0.60 Former smoker 44 34.1 10 27.8 Never-smoker 7 5.4 1 2.8
< 16 51 41.8 14 41.2 0.29 Age at smoking initiation (1) [16 – 18[ 20 16.4 3 8.8 [18 – 20[ 22 18.0 4 11.8 ≥ 20 29 23.8 13 38.2
< 30 15 12.4 6 17.7 0.67 Years of smoking (2) [30 – 40[ 36 29.8 11 32.4 [40 – 50[ 33 27.3 12 35.3 ≥ 50 37 30.6 5 14.7 Pack-years (3) < 20 20 15.6 4 11.4 0.24 [20 – 40[ 41 32.0 18 51.4 [40 – 50[ 22 17.2 5 14.3 > 50 45 35.2 8 22.9 Cigarette type (4) Filter 53 44.2 16 45.7 0.78 Mixed 38 31.7 9 25.7 Non filter & rolled 29 24.2 10 28.6 Years since quit smoking [2 – 6[ 9 20.5 1 10.0 0.54 [6 – 13[ 14 31.8 3 30.0 [13 – 20[ 8 18.2 5 50.0 ≥ 20 13 29.6 1 10.0

124
TP53 mutations and p53 immunodetection
Since missense TP53 mutations may lead to nuclear accumulation of mutant p53
protein we tested their association in our series. Information on both mutation
status and IHC was available for a subset of 230 patients.
P53 immunostaining was expressed as a score summing up intensity and
distribution as follows: sum of 0, no staining (= score 0); sum of 1 to 3, slight
staining (= score 1); sum of 4 to 5, moderate staining (= score 2); and sum of 6 to
7, marked staining (= score 3).
We found a strong correlation between mutation status and p53 IHC (p<0.0001).
Among tumours with mutations, 62% were highly positive for p53 protein.
Surprisingly, also 25% of tumours with wild-type TP53 had high expression of
p53 across the tumour (Table 19). This result suggests that p53 may be
consistently expressed in a subset of lung cancers without missense mutations in
the DNA binding domain.
Table 19: p53 expression in association with TP53 status
TP53 status p53 expression score
Wild Type Mutated Total
0,1,2 87 37.8 %
43 18.7 %
130 56.5 %
3 29 12.6 %
71 30.9 %
100 43.5 %
Total 116 50.4 %
114 49.6 %
230 100 %
TP53 polymorphisms
The TP53 gene is highly polymorphic and there is evidence that mutations may
occur at different rates on different TP53 alleles. We have analysed the
distribution of 3 common polymorphisms located within a 312 bp region of the
TP53 gene encoding the N-terminus of p53, in relation with TP53 mutation
status. These three polymorphisms are located in intron 2 (PIN2, rs.1642785: G

125
to C), intron 3 (PIN3, rs.17878362: 16bp duplication) and in exon 4 (PEX4,
rs.1042522: non-silent G to C).
Data (Table 20) show that TP53 mutations occurred preferentially (p=0.05) in
subjects who were homozygous for the rare PEX4 allele (i.e. CC subjects). TP53
mutations in PEX4 CC samples were 85.7%, as compared to 43.9% and 46.6%
in G-C heterozygous and G-G homozygous respectively. The two other
polymorphisms did not appear to be associated with significant differences in
mutation prevalence.
Table 20 : TP53 status and polymorphisms
TP53 status Wild type (n = 128) Mutated (n = 117)
TP53 polymorphism (n= 245) TP53 allele
n % n %
P value
CC 7 5.5 15 12.8 GC 58 45.3 44 37.6 PIN2
GG 63 49.2 58 49.6
0.21
DD 4 3.1 8 6.8 ND 43 33.6 29 24.8 PIN3
NN 81 63.3 80 68.4
0.16
CC 2 1.6 12 10.3 CG 55 43.0 43 36.8 PEX4
GG 71 55.5 62 53.0
0.05
The G allele in PIN2 was more frequent in men than women (p=0.0019).
Tobacco exposure variables (i.e. “pack-years” and “cigarette type”) were
differently distributed among individuals with different PIN2 alleles (Table 21a).
Borderline association was observed between the 16bp duplication and the
individual history of pulmonary illness (p=0.047, Table 21b).
Previous studies (Marcel et al. 2009) showed linkage disequilibrium between
TP53 PIN2 and TP53 PEX4. Similarly to PIN2, there were significantly more men
than women with a PEX4 GG homozygous genotype (Table 21c).

126
Table 21a: TP53 PIN2 and clinical variables
PIN2 (n=249) CC/CG GG Variable (missing) Items n % n %
P value
Gender Male 97 77.0 111 90.2 0.0019 Female 29 23.0 12 9.8 Age < 60 47 37.3 40 32.5 0.35 [60-65[ 45 35.7 37 30.1 [65-70[ 12 9.5 19 15.5 ≥ 70 22 17.5 27 22.0 Past pulmonary illness (2) No 59 47.2 50 41.0 0.30 Yes 66 52.8 72 59.0 Asbestos exposure (2) None 102 81.6 89 73.0 0.12 Yes 23 18.4 33 27.1 Nodal score (1) N0 85 68.0 89 72.4 0.47 N1,N2,NX 34 27.6 40 32.0 Tumour score (1) T1 42 33.6 35 28.5 0.40 T2, T3, T4 83 66.4 88 71.5 Histology SCC / Others 60 48.8 54 42.9 0.50 ADC 63 51.2 72 57.1 Smoking status (1) Current smoker 74 58.7 78 63.9 0.32 Former smoker 44 34.9 41 33.6 Never-smoker 8 6.4 3 2.5 Years of smoking (2) < 30 22 19.0 14 11.8 0.10 [30-40[ 38 32.8 30 25.2 [40-50[ 29 25.0 44 37.0 ≥ 50 27 23.3 31 26.1 Age at smoking initiation (1) < 16 43 36.8 46 38.7 0.42 [16-18[ 24 20.5 18 15.1 [18-20[ 18 15.4 28 23.5 ≥ 20 32 27.4 27 22.7 Pack-years (3) < 20 26 21.0 13 10.7 0.04 [20-40[ 41 33.1 47 38.5 [40-50[ 26 21.0 18 14.8 ≥ 50 31 25.0 44 36.1 Years since quit smoking [2 – 6[ 7 15.9 6 14.6 0.88 [6 – 13[ 12 27.3 14 34.2 [13 – 20[ 11 25.0 10 24.4 ≥ 20 14 31.8 11 26.8 Cigarette type (4) Filter 59 51.3 44 37.3 0.036 Mixed 32 27.8 35 30.0 Non Filter & Rolled 24 20.9 39 33.1 Family history of Lung/HN cancer (6) No Lung/HN cancer 94 77.1 86 71.1 0.32 Lung/HN cancer 28 23.0 35 28.9
No Lung/HN cancer 114 91.2 110 90.2 0.93 Personal history of Lung/HN cancer (2)
Lung/HN cancer 11 8.8 12 9.8

127
Table 21b: TP53 PIN3 and clinical variables
PIN 3 (n=249) NN DD/ND Variable (missing) Items
n % n % P value
Gender Male 141 86 67 78,8 0.16 Female 23 14 18 21,2 Age < 60 56 34,1 31 36,5 0.07 [60-65[ 48 29,3 34 40 [65-70[ 20 12,2 11 12,9 ≥ 70 40 24,4 9 10,6 Past pulmonary illness (2) No 64 39,3 45 53,6 0.047 Yes 99 60,7 39 46,4 Asbestos exposure (2) None 127 77,9 64 76,2 0.53 Yes 36 22,1 20 23,8 Nodal score (1) N0 119 72,6 55 65,5 0.20 N1,N2,NX 45 27.4 29 34.5 Tumour score (1) T1 45 27,4 32 38,1 0.47 T2, T3, T4 119 72.6 52 61.9 Histology SCC / Others 82 50 53 62,4 0.33 ADC 82 50 32 37.6 Smoking status (1) Current smoker 101 62 51 60 0.96 Former smoker 55 33,7 30 35,3 Never-smoker 7 4,3 4 4,7 Years of smoking (2) < 30 30 18,4 17 20,5 0.40 [30-40[ 41 25,2 27 32,5 [40-50[ 52 31,9 21 25,3 ≥ 50 40 24,5 18 21,7 Age at smoking initiation (1) < 16 60 38,5 29 36,3 0.45 [16-18[ 29 18,6 13 16,3 [18-20[ 33 21,2 13 16,3 ≥ 20 34 21,8 25 31,3 Pack-years (3) < 20 25 15,3 14 16,9 0.19 [20-40[ 57 35 31 37,3 [40-50[ 24 14,7 20 24,1 ≥ 50 57 35 18 21,7 Years since quit smoking [2 – 6[ 7 12,7 6 20 0.57 [6 – 13[ 19 34,5 7 23,3 [13 – 20[ 15 27,3 6 20 ≥ 20 14 25,5 11 36,7 Cigarette type (4) Filter 64 41,6 39 49,4 0.26 Mixed 43 27,9 24 30,4 Non Filter & Rolled 47 30,5 16 20,3 Family history of Lung/HN cancer (6) No Lung/HN cancer 114 70,8 66 80,5 0.11 Lung/HN cancer 47 29,2 16 19,5 Personal history of Lung/HN cancer (2) No Lung/HN cancer 147 90,2 77 91,7 0.96 Lung/HN cancer 16 9,8 7 8,3

128
Table 21c: TP53 PEX4 and clinical variables
PEX4 (n=249) GG CG/CC Variable (missing) Items
n % n % P value
Gender Male 120 88,2 88 77,9 0.0079 Female 16 11,8 25 22,1 Age < 60 43 31,6 44 38,9 0.39 [60-65[ 20 14,7 11 9,7 [65-70[ 30 22,1 19 16,8 ≥ 70 43 31,6 39 34,5 Past pulmonary illness (2) No 56 41,5 53 47,3 0.39 Yes 79 58,5 59 52,7 Asbestos exposure (2) None 101 74,8 90 80,4 0.32 Yes 34 25,2 22 19,6 Nodal score (1) N0 97 71,3 77 68,8 0.66 N1,N2,NX 39 28.7 35 31.3 Tumour score (1) T1 38 27,9 39 34,8 0.17 T2, T3, T4 98 72.1 73 65.2 Histology SCC / Others 67 49.3 47 41.6 0.42 ADC 69 50,7 66 58,4 Smoking status (1) Current smoker 86 63,7 66 58,4 0.38 Former smoker 45 33,3 40 35,4 Never-smoker 4 3 7 6,2 Years of smoking (2) < 30 21 15,6 26 23,4 0.15 [30-40[ 32 23,7 36 32,4 [40-50[ 46 34,1 27 24,3 ≥ 50 36 26,7 22 19,8 Age at smoking initiation (1) < 16 50 38,2 39 37,1 0.88 [16-18[ 21 16 21 20 [18-20[ 28 21,4 18 17,1 ≥ 20 32 24,4 27 25,7 Pack-years (3) < 20 16 11,9 23 20,7 0.08 [20-40[ 51 37,8 37 33,3 [40-50[ 20 14,8 24 21,6 ≥ 50 48 35,6 27 24,3 Years since quit smoking [2 – 6[ 7 15,6 6 15 0.92 [6 – 13[ 15 33,3 11 27,5 [13 – 20[ 11 24,4 10 25 ≥ 20 12 26,7 13 32,5 Cigarette type (4) Filter 50 38,5 53 51,5 0.10 Mixed 40 30,8 27 26,2 Non Filter & Rolled 40 30,8 23 22,3 Family history of Lung/HN cancer (6) No Lung/HN cancer 97 72,9 83 75,5 0.71 Lung/HN cancer 36 27,1 27 24,5
No Lung/HN cancer 122 90,4 102 91,1 0.69 Personal history of Lung/HN cancer (2)
Lung/HN cancer 13 9,6 10 8,9

129
TP53 haplotypes
Haplotypes were analysed by ARMS. Figure 30 shows an example of “CDA”
haplotype (i.e. PIN2-C allele, PIN3-Duplication and PEX4-G allele coding
Arginine) charged on a 3% gel. Four different PCR mix were prepared to allow
identification of PIN2 and PEX4 alleles. Positive controls allowed identification of
PIN3: TE1 cell line was used as control for GNA haplotype (bearing Non-
duplication in PIN3) and TE3 cell line was used as control for CDP haplotype
(bearing Duplication in PIN3).
Figure 30: CDA haplotype sample charged on a 3% gel
. The different distribution of TP53 status among the haplotypes proved to be not
statistically significant (Table 22).
When TP53 haplotypes were analysed in relation to individual and clinical
variables (Table 23) the GNA allele appeared to be significantly associated with
male gender, no exposure to asbestos and an intermediate number of cigarettes
smoked (in pack-years).
The GNA allele frequency was of 66.85%; the following most represented alleles
were CDP with a frequency of 16.12% and CNP with an allele frequency of
9.16%.
1F-1
R
1F-2
R
2F-1
R
2F-2
R
1F-1
R
1F-2
R
2F-1
R
2F-2
R
1F-1
R
1F-2
R
2F-1
R
2F-2
R
1F-1
R
1F-2
R
2F-1
R
2F-2
R
GP
G
A
CP
C
A
GP
G
A
CP
C
A
GP
G
A
CP
C
A
GP
G
A
CP
C
A

130
Table 22 : TP53 status among haplotypes
Table 23 : TP53 haplotypes and clinical variables
TP53 haplotypes (n= 249) GNA-CDP GNA-CNP GNA-GNA Others Variable (missing) Items n % n % n % n %
P value
Gender Male 43 76.8 24 75.0 102 89.5 39 83.0 0.046 Female 13 23.2 8 25.0 12 10.5 8 17.0 Age < 60 21 37.5 12 37.5 38 33.3 16 34.0 0.27 [60-65[ 6 10.7 1 3.13 15 13.2 9 19.2 [65-70[ 6 10.7 9 28.1 27 23.7 7 14.9 ≥ 70 23 41.7 10 31.3 34 29.8 15 31.9
No 29 52.7 13 40.6 44 38.9 23 48.9 0.41 Past pulmonary illness (2) Yes 26 47.3 19 59.4 69 61.1 24 51.1
None 47 85.5 28 87.5 85 75.2 31 66.0 0.02 Asbestos exposure (2) Yes 8 14.6 4 12.5 28 24.8 16 34.0 Nodal score (1) N0 37 67.3 24 75.0 84 73.7 29 61.7 0.52 N1,N2,NX 18 32.7 8 25.0 30 26.3 18 38.3 Tumour score (1) T1 25 45.5 10 31.3 32 28.1 10 21.3 0.11 T2, T3, T4 30 54.6 22 68.8 82 71.9 37 78.7 Histology SCC/Others 19 33.9 16 50.0 58 50.9 21 44.7 0.36 ADC 37 66.1 16 50.0 56 49.1 26 55.3 Smoking status (1) Current 33 58.9 19 59.4 71 62.8 29 61.7 0.65 Former 20 35.7 10 31.3 39 34.5 16 34.0 Never 3 5.4 3 9.4 3 2.7 2 4.3 Years of smoking (2) < 30 7 13.5 7 24.1 13 11.8 9 20.5 0.61 [30-40[ 18 34.6 8 27.6 29 26.4 13 30.0 [40-50[ 14 26.9 7 24.1 38 34.6 14 31.8 ≥ 50 13 25.0 7 24.1 30 27.3 8 18.2
< 16 17 32.1 12 41.4 40 36.4 20 45.5 0.65 Age at smoking initiation (1) [16-18[ 10 18.9 6 20.7 18 16.4 8 18.2 [18-20[ 10 18.9 5 17.2 27 24.6 4 9.1 ≥ 20 16 30.2 6 20.7 25 22.7 12 27.3 Pack-years (3) < 20 9 16.4 11 34.4 12 10.6 7 15.2 0.01 [20-40[ 24 43.6 6 18.8 45 39.8 13 28.3 [40-50[ 10 18.2 6 18.8 15 13.3 13 28.3 ≥ 50 12 21.8 9 28.1 41 36.3 13 28.3
TP53 status Wild type (n = 128) Mutated (n = 117)
TP53 haplotypes (n= 245)
n % n %
P value
GNA-CDP 35 63.6 20 36.4 0.38
GNA-CNP 16 50.0 16 50.0
GNA-GNA 56 50.0 56 50.0
Others 21 45.7 25 54.4

131
Years since quit smoking [2 – 6[ 4 20.0 1 10.0 5 12.8 3 18.8 0.85 [6 – 13[ 6 30.0 3 30.0 14 35.9 3 18.8 [13 – 20[ 3 15.0 4 40.0 10 25.6 4 25.0 ≥ 20 7 35.0 2 20 10 25.6 6 37.5 Cigarette type (4) Filter 25 48.1 14 48.3 41 37.6 23 53.5 0.29 Mixed 15 28.9 7 24.1 32 29.4 13 30.2 NonFilter/Rolled 12 23.1 8 27.6 36 33.0 7 16.3
No LC/HNC 41 75.9 22 68.8 81 72.3 36 80.0 0.73 Family history of Lung/HN cancer (6) LC/HNC 13 24.1 10 31.3 31 27.7 9 20.0
No LC/HNC 51 92.7 29 90.6 101 89.4 43 91.5 0.71 Personal history of Lung/HN cancer (2) LC/HNC 4 7.3 3 9.4 12 10.6 4 8.5
Figure 31 shows patterns of TP53 genotypes distribution in the EUELC
population. The three major genotypes found were GGNNAA, GCNDAP and
GCNNAP. As a comparison we show the genotypes distribution in a Brazilian
population (results from Marcel et al. 2009).

132
Figure 31: Patterns of TP53 genotype distribution in the EUELC population and in a Brazilian population
Caucasian population
4%
3%
2%
23%
45%13%
GG NN AA
GC ND AP
GC NN AP
GC NN AA
GG ND AA
CC ND PP
CC DD PP
GC DD AP
GG NN AP
CC DD AP
CC NN AP
CC NN PP
CC DD AA
CC ND AA
CC ND AP
CC NN AA
GC NN PP
Brazilian population
3%
2%
50%
17%
16%
Caucasian population
4%
3%
2%
23%
45%13%
GG NN AA
GC ND AP
GC NN AP
GC NN AA
GG ND AA
CC ND PP
CC DD PP
GC DD AP
GG NN AP
CC DD AP
CC NN AP
CC NN PP
CC DD AA
CC ND AA
CC ND AP
CC NN AA
GC NN PP
Brazilian population
3%
2%
50%
17%
16%

133
EGFR mutations
Deregulation of human epidermal growth factor receptor pathways by over-
expression or constitutive activation can promote tumour processes including
angiogenesis and metastasis and is associated with poor prognosis, in particular
in a certain fraction of NSCLCs (Marks et al. 2008). Somatic mutations of EGFR
gene cluster in domains of the kinase that constitutively induce its activity and
signal transduction (in exons 18 to 21). We found 13.07% EGFR mutations,
spread among the 4 exons tested (4% in exon 18, 3% in exon 19, 3% in exon 20
and 5% in exon 21). 30 % of mutations were deletion in exon 19 and the single-
point mutation at position 858 (L858R) in exon 21. All EGFR mutations were
reported by the COSMIC mutation database. Figure 32 shows a silent EGFR
mutation (in a patient who also carried a KRAS mutation).
Figure 32: EGFR mutation: exon 21, codon 836, CG C>CGT, Arg>Arg
KRAS mutations and Reproducibility of KRAS mutational analysis
A total of 18.5% KRAS mutations at codon 12 and 13 were detected. Missense
G>T transversions represented 98% of KRAS mutations. Transversions were
either GGT>TGT (Gly>Cys) or GGT>GTT (Gly>Val) at codon 12. KRAS and
EGFR mutations were mutually exclusive except for one tumour containing both
mutations (an extremely rare occurrence according to the literature).
Interestingly, in this tumour the EGFR mutation was a silent mutation (codon 836
CGC>CGT Arg>Arg) and was thus not supposed to lead to tyrosine kinase
activation.

134
Figure 33 shows digestion products of KRAS samples (panel A). Negative (i.e.
lymphocyte) and positive (i.e. SW480 cell line, KRAS mutated at codon 12)
controls were also loaded on gel. A sequence variation at any of the 2 first
positions of codon 12 gives two restriction products of 143bp and 14bp (non
visible band of mutant sample). Panel B is an example of sequence that revealed
KRAS mutations at codon 12 CCA>ACA→GGT>TGT: Gly>Cys.
Figure 33: Panel A: wild type and mutant KRAS samples charged on a 3% gel; Panel B: sequence of the mutant sample
A EUELC partner in the Netherlands analysed KRAS mutations by point
EXACCT method (Thunissen et al. 2011); we tested the two methods (ME-PCR
and microarray) for reproducibility. We observed clear reproducibility of KRAS
mutations from both EUELC partners (Kappa coefficient = 0.94 and 95%CI=
[0.88 – 1.00]; Table 24).
110bp
147bp
Lym
SW480
WT
MT
A B
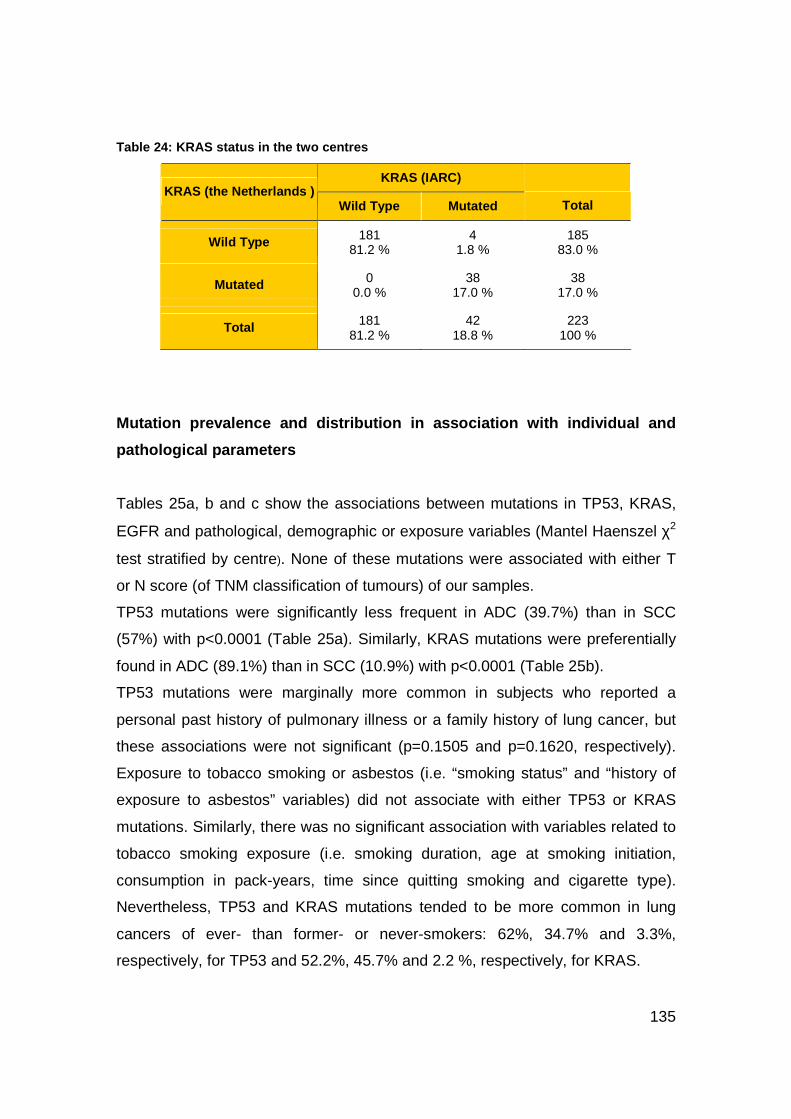
135
Table 24: KRAS status in the two centres
Mutation prevalence and distribution in association with individual and
pathological parameters
Tables 25a, b and c show the associations between mutations in TP53, KRAS,
EGFR and pathological, demographic or exposure variables (Mantel Haenszel χ2
test stratified by centre). None of these mutations were associated with either T
or N score (of TNM classification of tumours) of our samples.
TP53 mutations were significantly less frequent in ADC (39.7%) than in SCC
(57%) with p<0.0001 (Table 25a). Similarly, KRAS mutations were preferentially
found in ADC (89.1%) than in SCC (10.9%) with p<0.0001 (Table 25b).
TP53 mutations were marginally more common in subjects who reported a
personal past history of pulmonary illness or a family history of lung cancer, but
these associations were not significant (p=0.1505 and p=0.1620, respectively).
Exposure to tobacco smoking or asbestos (i.e. “smoking status” and “history of
exposure to asbestos” variables) did not associate with either TP53 or KRAS
mutations. Similarly, there was no significant association with variables related to
tobacco smoking exposure (i.e. smoking duration, age at smoking initiation,
consumption in pack-years, time since quitting smoking and cigarette type).
Nevertheless, TP53 and KRAS mutations tended to be more common in lung
cancers of ever- than former- or never-smokers: 62%, 34.7% and 3.3%,
respectively, for TP53 and 52.2%, 45.7% and 2.2 %, respectively, for KRAS.
KRAS (IARC) KRAS (the Netherlands )
Wild Type Mutated Total
Wild Type 181 81.2 %
4 1.8 %
185 83.0 %
Mutated 0 0.0 %
38 17.0 %
38 17.0 %
Total 181 81.2 %
42 18.8 %
223 100 %

136
When analyzing EGFR status in association with smoking variables we found
that EGFR mutations were significantly more present in never-smoking women
(Table 25c). Somatic mutations of EGFR gene are found almost exclusively in
adenocarcinoma of never-smoking women and cluster in domains of the kinase
that constitutively activate its activity and signal transduction (Tokumo et al.
2005).
Table 25a : TP53 status in association with clinical and smoking va riables
TP53 status Wild type (n = 129) Mutated (n = 121) Variable (missing) Items
n % n % P value
Gender Male 107 82.9 103 85.1 0.89 Female 22 17.1 18 14.9 Age < 60 40 31 49 40.5 0.60 [60-65[ 16 12.4 14 11.6 [65-70[ 24 18.6 25 20.7 ≥ 70 49 38 33 27.3 Marital Status (2) Unaccompanied 39 30.2 26 21.5 0.10 Accompanied 90 69.8 95 78.5 Education level (39) No/Primary Level 93 76.2 88 74.6 0.72 High educated 29 23.8 30 25.4 Past pulmonary illness (2) No 50 39.4 60 49.6 0.15 Yes 77 60.6 61 50.4 Asbestos exposure (11) No 100 78.7 91 75.2 0.80 Yes 27 21.3 30 24.8 Nodal score (4) N0 89 69.5 84 69.4 0.37 N1 30 23.4 35 28.9 N2 2 1.6 0 0 NX 7 5.5 2 1.7 Tumour score (4) T1 39 30.5 37 30.6 0.98 T2 76 59.4 74 61.2 T3 8 6.3 7 5.8 T4 5 3.9 3 2.5 Histology (1) ADC 85 65.9 48 39.7 <.0001 SCC 41 31.8 69 57 Others 3 2.3 4 3,3 Smoking status (1) Current smoker 77 60.2 75 62 0.83 Former smoker 44 34.4 42 34,7 Never-smoker 7 5.5 4 3,3 Years of smoking (14) < 30 15 12.5 20 17.2 0.37 [30-40[ 35 29.2 35 30.2 [40-50[ 33 27.5 39 33.6 ≥ 50 37 30.8 22 19.0 Age at smoking initiation (5) < 16 50 41.3 41 35.3 0.78 [16-18[ 20 16.5 21 18.1

137
[18-20[ 22 18.2 26 22.4 ≥ 20 29 24.0 28 24.1 Pack-years (18) < 20 20 15.8 18 15.0 0.76 [20-40[ 41 32.3 48 40.0 [40-50[ 22 17.3 22 18.3 ≥ 50 44 34.7 32 26.7 Years since quit smoking [2 – 6[ 9 20.5 4 9.5 0.71 [6 – 13[ 14 31.8 14 33.3 [13 – 20[ 8 18.2 13 31.0 ≥ 20 13 29.6 11 26.2 Cigarette type (33) Filter 52 43.7 52 45.2 0.55 Mixed 38 31.9 29 25.2 Non filter & rolled 29 24.4 34 29.6
No Lung/HN cancer
96 76,8 83 69,7 0.16 Family history of Lung/HN cancer (32)
Lung/HN cancer 29 23,2 36 30,3 No Lung/HN
cancer 118 92,9 107 88,4 0.44 Personal history of
Lung/HN cancer (3) Lung/HN cancer 9 7,1 14 11,6
Table 25b: KRAS status in association with clinical and smoking va riables
KRAS status Wild type (n = 203) Mutated (n = 46) Variable (missing) Items
n % n % P value
Gender Male 172 84.7 38 82.6 0.81 Female 31 15.3 8 17.4 Age < 60 73 36 14 30.4 0.77 [60-65[ 26 12.8 5 10.9 [65-70[ 38 18.7 12 26.1 ≥ 70 66 32.5 15 32.6 Past pulmonary illness (2) No 88 43.6 21 46.7 0.77 Yes 114 56.4 24 53.3 Asbestos exposure (2) No 154 76.2 36 80 0.82 Yes 48 23.8 9 20 Nodal score (1) N0 140 69.3 33 71.7 0.60 N1, N2, NX 62 30.7 13 28.3 Tumour score (1) T1 68 33.7 9 19.6 0.10 T2, T3, T4 134 66.3 37 80.4 Histology SCC / Others 110 54.2 5 10.9 <.0001 ADC 93 45.8 41 89.1 Smoking status (1) Current smoker 128 63.4 24 52.2 0.08 Former smoker 64 31.7 21 45.7 Never-smoker 10 5 1 2.2 Years of smoking (14) < 30 27 14.1 9 20.0 0.29 [30-40[ 54 28.3 14 31.1 [40-50[ 63 33.0 10 22.2 ≥ 50 47 24.6 12 26.7 Age at smoking initiation (5) < 16 75 39.1 17 37.8 0.95

138
[16-18[ 32 16.7 9 20.0 [18-20[ 36 18.8 9 20.0 ≥ 20 49 25.5 10 22.2 Pack-years (18) < 20 28 13.9 10 21.7 0.64 [20-40[ 74 36.8 15 32.6 [40-50[ 36 17.9 8 17.4 ≥ 50 63 31.3 13 28.3 Years since quit smoking [2 – 6[ 11 17.2 2 9.5 0.71 [6 – 13[ 22 34.4 6 28.6 [13 – 20[ 15 23.4 5 23.8 ≥ 20 16 25.0 8 38.1 Cigarette type (4) Filter 79 42 24 53.3 0.23 Mixed 58 30.9 9 20 Non Filter & Rolled 51 27.1 12 26.7
No Lung/HN cancer 146 73.4 33 73.3 0.92 Family history of Lung/HN cancer (5) Lung/HN cancer 53 26.6 12 26.7
No Lung/HN cancer 183 90.6 41 91.1 0.49 Personal history of Lung/HN cancer (2) Lung/HN cancer 19 9.4 4 8.9
Table 25c: EGFR status in association with clinical and smoking va riables
EGFR status Wild type (n = 113) Mutated (n = 17) Variable (missing) Items
n % n % P value
Gender Male 92 81.4 11 64.7 0.35 Female 21 18.6 6 35.3 Age < 60 41 36.3 5 29.4 0.21 [60-65[ 15 13.3 2 11.8 [65-70[ 19 16.8 6 35.3 ≥ 70 38 33.6 4 23.5 Past pulmonary illness No 55 48.7 8 47.1 0.72 Yes 58 51.3 9 52.9 Asbestos exposure No 89 78.8 14 82.4 0.93 Yes 24 21.2 3 17.7 Nodal score (1) N0 83 73.5 11 68.8 0.95 N1, N2, NX 30 26.6 5 31.3 Tumour score (1) T1 36 31.9 5 31.3 0.87 T2, T3, T4 77 68.1 11 68.8 Smoking status Current smoker 64 56.6 8 47.1 0.11 Former smoker 43 38.1 5 29.4 Never-smoker 6 5.3 4 23.5 Years of smoking (1) < 30 21 19.8 4 30.8 0.49 [30-40[ 33 31.1 2 15.4 [40-50[ 29 27.4 3 23.1 ≥ 50 23 21.7 4 30.8 Age at smoking initiation ≥ 16 59 55.1 8 61.5 0.87 < 16 48 44.9 5 38.5 Pack-years (1) ≤ 40 61 54.5 13 76.5 0.15 > 40 51 45.5 4 23.5 Years since quit smoking ≥ 13 24 55.8 3 60.0 0.96

139
< 13 19 44.2 2 40.0 Cigarette type (3) Filter 48 45.7 5 41.7 0.97 Mixed 31 29.5 4 33.3 Non Filter & Rolled 26 24.8 3 25.0
No Lung/HN cancer 80 71.4 10 62.5 0.34 Family history of Lung/HN cancer (2) Lung/HN cancer 32 28.6 6 37.5
No Lung/HN cancer 103 91.2 16 94.1 0.79 Personal history of Lung/HN cancer Lung/HN cancer 10 8.9 1 5.9 Gender / Smoking status Others 109 96.5 13 76.5 0.0067
Never-smoker female 4 3.5 4 23.5
Update of follow-up status for EUELC patients
The statistical analysis in the present report is based on the 2011 version of the
EUELC database. Laboratory analyses were completed in 2007 but the overall
median follow-up time per centre at that time was of only 16.6 months. This short
follow-up could have biased both the selection of Progressive Disease (PD) and
Disease Free (DF) subjects. Moreover, clinical data appeared to be incomplete
for several important variables (e.g. tobacco smoking) potentially related to
somatic mutations in TP53, KRAS and EGFR genes. In 2011 we decided that we
were not able to exploit the laboratory results in full and consequently we asked
the 12 centres involved in the EUELC project to provide us with clinical update.
These centres were: Liverpool, Leicester, Belfast, Edinburg and Dublin (UK),
Nancy and Grenoble (France), Nijmegen and Amsterdam (the Netherlands),
Milan (Italy), Heidelberg (Germany) and Pamplona (Spain). Table 26 provides
details of missing values for each centre as recorded in the EUELC database
2007 version.

140
Table 26: Percentage of missing values in clinical variables by participating centre in 2007
* Percentage computed on former and current smokers
Centres Variable
Amsterdam Belfast Dublin Edinburgh Grenoble Heidelberg Leicester Liverpool Milan Nancy Nijmegen Pamplona
Gender 0,1 Date of interview 0,1 1,9 0,1 0,2 1,9 0,4 Date of birth 0,1 0,1 Marital status 2,1 0,1 0,2 0,1 1,2 Age at end of education 0,4 3,5 0,1 0,4 0,4 2,9 0,2 2 0,1 0,3 1,6 0,8 Highest education level 0,2 3,4 0,4 0,2 0,2 1,8 0,1 1,6 Smoking status 1,9 0,4 0,3 0,1 1,5 Pack-years* 0,2 2,5 0,1 0,7 0,5 0,5 0,1 0,1 1,8 0,4 Age at smoking initiation* 2,3 0,5 0,1 0,4 0,1 1,5 0,1 Time since quit smoking* 2 0,5 0,4 0,1 1,5 Smoking duration* 0,2 2,3 0,6 0,5 0,5 0,1 0,1 1,8 0,4 Type of cigarette* 0,2 3,6 0,7 1,5 0,5 0,5 0,4 0,1 1,8 0,2 Past cancerous malignant growth / tumour 0,1 1,6 0,1 0,6 0,3 1,5 Location of past cancerous malignant growth 0,5 7,1 0,5 2,5 1 1,5 0,5 7,6 Asbestos exposure 0,1 2,3 0,8 0,4 0,6 1,5 Family history of lung/head&neck cancer 0,2 3,6 2,6 0,1 0,3 1,1 0,1 1,9 0,1 Family history of any cancer 0,2 3,6 2,6 0,1 0,3 1,1 0,1 1,9 0,1 Primary lung cancer status 0,1 0,1 Date of Surgery PLC Histology PLC TNM PLC 0,2 0,1 0,6 0,1 Head and neck cancer status 0,2 0,1 1 0,1 Date of surgery HN 2,9 8,6 2,9 25,7 5,7 Histology HN 8,6 2,9 2,9 25,7 2,9 TNM HN 8,6 2,9 25,7 2,9 2,9 Total average missing values per patient 0,42 5,39 0,06 1,95 0,28 0,43 1,65 0,89 0,48 0,04 3,41 0,20

141
The update- work plan involved the following steps:
1. Identification of a Minimal Variable List corresponding to the information
we determined as both useful and practically feasible;
2. Personal contact and individual arrangements with each of the major
participating centres to develop data retrieval, taking into account the
specificities of each centre;
3. Final collation of results into the EUELC database.
The Minimal Variable list for completeness of follow-up status included: “Alive
and Well”, “Alive with disease” (no treatment), “Died from other causes”, “Died
from the disease”, “Metastatic relapse/reoccurrence”, “SPLC” (Second Primary
Lung Cancer), “Treatment with chemotherapy”, “Treatment with radiotherapy”,
“Treatment with both chemotherapy and radiotherapy”. The clinical status in 2007
and the updated one in 2011 are shown in Table 27. According to follow-up
status we censored the analysis at 48 months and the overall free median follow-
up rose to 29 months.
Table 27: Clinical status of EUELC patients before and after update of the database
Clinical status Year: 2007 Year: 2011
Progressive Disease (%) 22.1% 26.4%
Disease Free (%) Disease Free median follow up (months)
77.9% 18
73.6 % 29
Overall median follow up (months) 16.6 25
Died of other causes (%) 5.7% 21.7 %
Died of the disease (%) 14.7% 17.5 %

142
Prognostic significance of somatic mutations
Patients were grouped into two categories according to disease evolution status
until September 2011. In the univariate analysis, those who developed a second
primary lung cancer, a recurrence or metastasis, or who died of the disease were
grouped as progressive disease (PD). PD represented 26.4% of EUELC patients.
Patients who were alive and asymptomatic for the disease and who were not
undergoing treatment by chemotherapy and/or radiotherapy, were classified as
disease-free (DF) and represent 73.6% of our series.
We could identify that a more severe PLC tumour (i.e. tumour showing higher T
and N scores) was associated to an increased risk of disease progression
(respectively p=0.0014 and p=0.0006, Table 28). Surprisingly, smoking duration
longer than 40 years was more frequent among DF patients than among PD
patients (56.1% versus 43.3%).
Table 28: Clinical risk factors of disease progress ion
* 9 stages unknown because of undetermined pN
DF (n=162 ) PD (n=99 ) Variable (missing) Items
n % n % P value
Gender (1) Female 23 14,2 18 18,4 0.1285 Age > 65 81 50 51 51,5 0.5066 Education duration (22) in years > 16 54 35,8 37 41,6 0.7591 Professional exposure (6) Asbestos 35 22 21 21,9 0.5629 Past pulmonary illness (6) At least one 83 52,2 61 63,5 0.0991 Family history of HN/Lung cancer (10) HN/Lung cancer 44 28 22 23,4 0.4807
Family history of cancer (10) Any cancer 79 50,3 47 50 0.7761 Smoking status (1) Current smoker 36 22,2 13 13,3 0.0634 Cigarette type (10) Non Filtered 82 55,4 52 56,5 0.7210 Years since quit smoking < 5 68 42 43 43,4 0.7059 Age at smoking initiation < 16 years old 74 45,7 37 37,4 0.5271 Pack-years (8) > 40 79 50,3 42 43,3 0.1196 Smoking duration in years ( 8) >40 88 56,1 42 43,3 0.0224 PLC Histology ADC 89 54,9 54 54,5 0.5583 SCC 70 43,2 40 40,4 0.4535 Tumour score (1) T2, T3, T4 vs T0, T1 99 61,1 82 83,7 0.0014 Nodal score (1) N1, N2, Nx vs N0 33 20,4 44 44,9 0.0006 Tumour Stage (1+ 9 Nx*) Stages II & III vs Stage I 34 21,4 42 45,2 0.0038

143
TP53, KRAS or EGFR mutation status, however, were not associated with
disease evolution. There were 45.4% patients with TP53 mutation in the PD
category versus 50.7% in the DF category (p=NS). No prognostic value was
found when mutations were grouped into different categories according to their
predicted effects on p53 protein structure or function (Table 29). G to T
transversions were marginally more common among PD patients than DF but this
effect was not statistically significant (adjusted HR: 1.46 [0.89 – 2.41], p=0.14).
Likewise, p53 IHC positive status was not associated with prognosis (p=NS).
Table 29 : Associations between biomarkers and disease progres sion
DF PD Variable Items
n % n % HR
(95% CI) P* Adj HR (95% CI)
P$
TP53 status (n=250)
Wild Type 70 49.3 59 54.6 1 1
Mutated 72 50.7 49 45.4 0.86 (0.59 – 1.27)
0.45 0.91 (0.62 – 1.40)
0.64
Conservation (n=246)
0 – Silent 74 51.7 60 58.3 1 1
1 – Deleterious
44 30.8 34 33 0.74 (0.93 – 0.61) 1.01 (0.66 – 1.56)
4 – Non missense
25 17.5 9 8.7 0.56 (0.28 – 1.14)
0.28
0.69 (0.34 – 1.40)
0.56
Transactivation (n=246)
0 – Silent mt / wt/ Functional / Partially functional 77 53.8 62 60.2 1 1
1 – Non Functional
41 28.7 32 31.1 0.93 (0.60 – 1.44) 0.99 (0.64 – 1.54)
4 – Non missense
25 17.5 9 8.7 0.56 (0.28 – 1.14)
0.28
0.68 (0.33 – 1.39)
0.56
Structure (n=243)
0 – Silent and WT 73 51.8 60 58.8 1 1
1 – Missense in DNA-binding domain 23 16.3 21 20.6 1.01 (0.61 – 1.67) 1.05 (0.63 – 1.74)
2 – Missense outside DNA-binding domain 20 14.2 12 11.8 0.79 (0.42 – 1.49) 0.83 (0.44 – 1.56)
4 – Non missense
25 17.7 9 8.8 0.55 (0.27 – 1.12)
0.37
0.67 (0.33 – 1.36)
0.65
Structure
0/4 – Silent and WT / Non missense 98 69.5 69 67.6 1 1
1/2 – Missense
43 30.5 33 32.4 1.01 (0.67 – 1.54) 0.95
1.02 (0.67 – 1.55) 0.93
0 – Others 124 88.6 84 80.8 1 1 Type (n=244) 1 – All G > T
16 11.4 20 19.2 1.4 (0.9 – 2.3) 0.19
1.46 (0.89 – 2.41) 0.14
Deleterious 0 – Wild Type and silent mutations 73 51.4 60 57.1 1 1
1 – Deleterious
49 34.5 33 31.4 0.86 (0.56 – 1.32) 0.95 (0.61 – 1.47)
2 – Non deleterious
20 14.1 12 11.4 0.79 (0.42 – 1.48)
0.66
0.82 (0.43 – 1.54)
0.82
KRAS status Wild Type 118 84.3 85 78 1 1
Mutated
22 15.7 24 22 1.30 (0.82 – 2.06) 0.26
1.19 (0.75 – 1.90) 0.46

144
KRAS / TP53
Otherwise 138 97.9 102 93.6 1 1
Both Mutated
3 2.1 7 6.4 2.08 (0.95 – 4.57) 0.07
1.67 (0.74 – 3.77) 0.21
KRAS / TP53
Otherwise 52 36.4 40 37.7 1 1
At least one Mutated
91 63.6 66 62.3 0.92 (0.62 – 1.37) 0.70
0.97 (0.65 – 1.44) 0.87
PIN2 CC 13 9.2 9 8.4 0.98 (0.48 – 2.02) 0.97 (0.47 – 2.00)
CG 59 41.5 45 42.1 1.11 (0.74 – 1.67) 1.15 (0.76 – 1.74)
GG 70 49.3 53 49.5 1
0.86
1
0.77
PIN3 DD 5 3.5 7 6.5 1.46 (0.66 – 3.23) 1.39 (0.62 – 3.10)
ND 44 31 29 27.1 1.04 (0.67 – 1.62) 1.08 (0.68 – 1.70)
NN 93 65.5 71 66.4 1
0.65
1
0.71
PEX4 CC 9 6.3 5 4.7 0.79 (0.31 – 2.01) 0.83 (0.32 – 2.14)
CG 57 40.1 42 39.3 1.07 (0.71 – 1.60) 1.09 (0.72 – 1.65)
GG 76 53.5 60 56.1 1
0.85
1
0.83
P53 Haplotype GNA-CDP 33 23.6 23 21.1 1.07 (0.64 – 1.76) 1.16 (0.69 – 1.96)
GNA-CNP 17 12.1 15 13.8 1.15 (0.63 – 2.07) 1.52 (0.63 – 2.11)
OTHERS 65 46.4 49 45 1.15 (0.69 – 1.92) 1.11 (0.66 – 1.89)
GNA-GNA 25 17.9 22 20.2 1
0.95
1
0.93
Wild Type 62 87.3 51 86.4 1 1 EGFR status (only ADC)
Mutated 9 12.7 8 13.6 1.31 (0.62 – 2.80) 0.48
0.97 (0.67 – 1.38) 0.68
p53 expression 0 , 1 , 2 96 53.6 67 52.8 1 1
3 83 46.4 60 47.2 1.00 (0.70 – 1.43) 1.00
0.98 (0.68 – 1.41) 0.91
p53 / TP53 Otherwise 88 67.2 71 71.7 1 1
p53 = 3 and TP53 = mutated 43 32.8 28 28.3 0.87 (0.56 – 1.35) 0.53
0.95 (0.60 – 1.49) 0.81
* F&G model with centre stratification $ F&G model with centre stratification adjusted on T and N scores.

145
Since there were important disparities in patient recruitment between countries
and centres, we repeated these analyses on the largest homogenous subgroup,
that is on the 103 patients from the French centres (Nancy and Grenoble; Table
30).
Table 30 : Number of patients with available TP53 mutation status, by country
Country N° patients Percentage
France 103 41.20
Italy 47 18.80
UK 37 14.80
Germany 31 12.40
Spain 22 8.80
The Netherlands 10 4.00
Similarly, neither KRAS nor TP53 mutations had prognostic value in this
subgroup (Table 31, F&G model with centre stratification adjusted on T and N
scores). However, patients with tumours that carried both KRAS and TP53
mutations had a marginally significantly higher risk of developing a SPLC, lung
cancer recurrence or metastasis (adjusted HR: 3.26 [1.07-9.90], p=0.038).
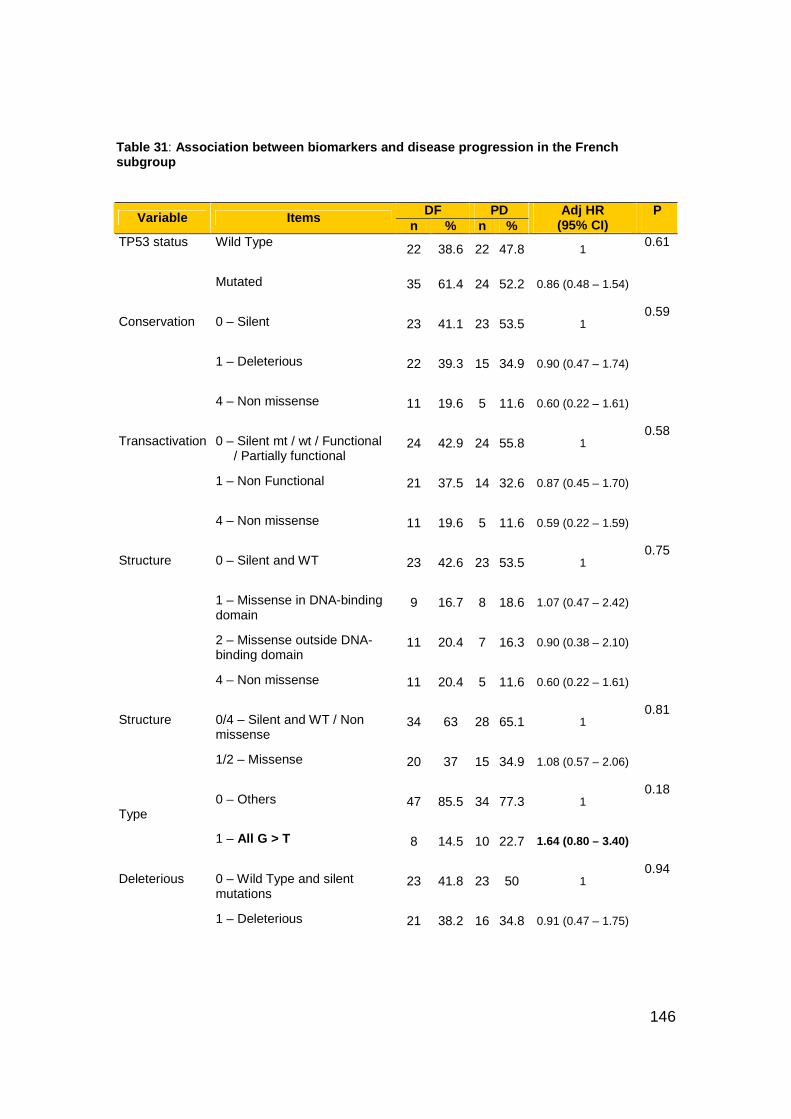
146
Table 31 : Association between biomarkers and disease progress ion in the French subgroup
DF PD Variable Items n % n %
Adj HR (95% CI)
P
TP53 status
Wild Type 22 38.6 22 47.8 1
Mutated
35 61.4 24 52.2 0.86 (0.48 – 1.54)
0.61
Conservation
0 – Silent
23 41.1 23 53.5 1
1 – Deleterious
22 39.3 15 34.9 0.90 (0.47 – 1.74)
4 – Non missense
11 19.6 5 11.6 0.60 (0.22 – 1.61)
0.59
Transactivation
0 – Silent mt / wt / Functional / Partially functional
24 42.9 24 55.8 1
1 – Non Functional
21 37.5 14 32.6 0.87 (0.45 – 1.70)
4 – Non missense
11 19.6 5 11.6 0.59 (0.22 – 1.59)
0.58
Structure
0 – Silent and WT
23 42.6 23 53.5 1
1 – Missense in DNA-binding domain
9 16.7 8 18.6 1.07 (0.47 – 2.42)
2 – Missense outside DNA-binding domain
11 20.4 7 16.3 0.90 (0.38 – 2.10)
4 – Non missense
11 20.4 5 11.6 0.60 (0.22 – 1.61)
0.75
Structure
0/4 – Silent and WT / Non missense
34 63 28 65.1 1
1/2 – Missense
20 37 15 34.9 1.08 (0.57 – 2.06)
0.81
Type 0 – Others
47 85.5 34 77.3 1
1 – All G > T
8 14.5 10 22.7 1.64 (0.80 – 3.40)
0.18
Deleterious
0 – Wild Type and silent mutations
23 41.8 23 50 1
1 – Deleterious
21 38.2 16 34.8 0.91 (0.47 – 1.75)
0.94

147
2 – Non deleterious
11 20 7 15.2 0.88 (0.38 – 2.06)
KRAS status
Wild Type
52 89.7 38 80.9 1
Mutated
6 10.3 9 19.1 1.53 (0.73 – 3.22)
0.26
KRAS / TP53
Otherwise
57 98.3 43 91.5 1
Both Mutated
1 1.7 4 8.5 3.26 (1.07 – 9.90)
0.038
KRAS / TP53
Otherwise 17 29.8 17 37 1
At least one Mutated
40 70.2 29 63 0.86 (0.47 – 1.57)
0.62
PIN2 CC 7 12.3 5 10.6 0.72 (0.26 – 2.04)
CG 25 43.9 17 36.2 1.02 (0.54 – 1.91)
GG 25 43.9 25 53.2 1
0.82
PIN3 DD/ND 36 63.2 34 72.3 0.85 (0.44 – 1.64)
NN 21 36.8 13 27.7 1
0.62
PEX4 CC 6 10.5 4 8.5 0.75 (0.25 – 2.22)
CG 24 42.1 17 36.2 0.97 (0.52 – 1.80)
GG 27 47.4 26 55.3 1
0.87
P53 Haplotype GNA-CDP 13 22.8 8 17 1.03 (0.45 – 2.38)
GNA-CNP 8 14 7 14.9 1.06 (0.45 – 2.52)
OTHERS 23 40.4 23 48.9 0.70 (0.32 – 1.56)
GNA-GNA 13 22.8 9 19.1 1
0.82
Wild type 24 85.7 21 100 1 EGFR status (only ADC)
Mutated 4 14.3 0 0 Not computable
-
P53 Expression 0 , 1 , 2
37 56.9 29 59.2 1
3 28 43.1 20 40.8 1.00 (0.56 – 1.80)
1.00
P53 / TP53 Otherwise 35 62.5 31 68.9 1
P53 = 3 and TP53 = mutated 21 37.5 14 31.1 0.91 (0.48 – 1.72)
0.76

148
Cumulative incidence plots were performed (Figure 34, P values are from
univariate Fine & Gray model) to illustrate the risk of disease progression through
time according to the mutation status of the 3 genes, namely TP53, KRAS and
EGFR. It appeared that the risk to develop a PD was higher (but not statistically
significant) for patients with KRAS or EGFR mutation.
Figure 34: Cumulative incidence plots of the Progre ssive Disease risk for TP53, KRAS and EGFR mutation
0 6 12 18 24 30 36 42 48
0.0
0.1
0.2
0.3
0.4
0.5
0.6
Follow Up months
Pro
babi
lity
TP53 Wild TypeTP53 Mutated
P value = 0.45
0 6 12 18 24 30 36 42 48
0.0
0.1
0.2
0.3
0.4
0.5
0.6
Follow Up months
Pro
babi
lity
KRAS Wild TypeKRAS Mutated
P value = 0.26
0 6 12 18 24 30 36 42 48
0.0
0.1
0.2
0.3
0.4
0.5
0.6
Follow Up months
Pro
babi
lity
EGFR Wild TypeEGFR Mutated
P value = 0.48

149
Discussion
Many studies have investigated the prognostic value of TP53 or KRAS mutations
in lung cancer. There is evidence that both the pattern and frequency of
mutations vary according to the risk factors. However, it remains unclear whether
mutations are associated with increased risk of rapid disease progression and of
unfavourable outcome. Here we have used the setup of a large European
collaborative study, EUELC, to assess TP53, KRAS and EGFR mutations value
as biomarkers of exposure to tobacco smoke and their prognostic value in a
structured series of NSCLC cases. We have assessed EGFR mutations in a
subgroup of 130 adenocarcinomas, as mutations in this gene have been reported
to be rare in other histological types of lung cancers (Shigematsu et al. 2005,
Yatabe and Mitsudomi 2007). We have also analysed the relationships between
TP53 mutations and several common TP53 polymorphisms.
Our data show that TP53, KRAS and EGFR mutations allow discrimination
between the two main lung cancer histological subtypes, since the mutations
occurred at different rates among SCC and ADC cases. TP53 mutations were
detected in 57% of SCC, versus 39.7% of ADC. In contrast, KRAS mutations
were detected in 89.1% of ADC and were rarer in SCC (10.9%). Of 110 ADC
analysed, 13.1% were positive for EGFR mutation in contrast to none in SCC.
Distribution of TP53, KRAS and EGFR mutations among NSCLC histologies
were in agreement with previous studies in Caucasians.
Mutation patterns clearly reflected exposure to tobacco smoking, thus enabling
their use as biomarkers of exposure to tobacco. The TP53 mutation prevalence
and pattern were in agreement with previous publications and with the IARC
TP53 Mutation Database. For both TP53 and KRAS genes, the codon distribution
showed a higher proportion of G to T transversions, in agreement with the well-
documented prevalence of this mutation type in lung cancers of smokers.
Moreover, as shown in other case series, KRAS and TP53 mutations tended to
be more common in lung cancers of ever-smokers than in former- or never-

150
smokers. EGFR mutations were significantly associated with never-smoking
status but not restricted to NSCLC of never-smokers, since detected in about
10% of former (5/48) or current (8/72) smokers. One tumour was found to contain
both EGFR and KRAS mutation, an extremely rare occurrence according to the
literature. Interestingly, the EGFR mutation in this tumour was a silent one (codon
836 CGC>CGT Arg>Arg) and thus would not lead to tyrosine kinase activation.
We did not encounter major technical limitations. All the laboratory techniques
used were previously well validated for high sensitivity and specificity and we
showed high reproducibility for KRAS analyses with a collaborative centre.
Moreover, the EUELC database provided us with good quality frozen tissues and
warranties that data collection from life-style questionnaires was the most
homogeneous among centres as possible.
In the present case series, mutation of none of the three genes analysed seems
to carry a significant prognosis value in the cohort as a whole or in specific
histological subgroups. Given the multi-centric character of the study, and the
possibility of a bias due to recruitment centre, we performed a separate analysis
on the largest and most homogeneous subgroup (French centres) that revealed a
borderline effect in patients carrying both TP53 and KRAS mutations (HR=3.26
[1.07-9.90], p=0.038) but not in patients carrying either of these mutations.
Similar to our results, a study on Japanese patients with surgically resected ADC
did not identify any prognostic implication for TP53 or KRAS mutations (Kosaka
et al.2009). The authors detected a significant association between EGFR
mutation and longer survival while none of the gene mutations appeared to be an
independent prognosis marker. Of note, in this Japanese series 49% of the
patients had EGFR mutations, a much higher rate than in the present Caucasian
series (13.1%). It is well documented that mutations in EGFR are associated with
never-smoking status, female gender and Asian ethnicity (Mounawar et al. 2007,
Shigematsu et al. 2005, ) then the relatively low prevalence of EGFR mutations in
our series may reflect the characteristics of the patients recruited in EUELC, i.e.
Caucasian, 84% males and 95.2% ever smokers. Other studies on Caucasian

151
populations reporting higher prevalence of EGFR mutations (Rosell et al. 2009)
also show a more important proportion of never-smokers and/or of women in
their series. The low number of non-smokers could have biased the mutation
prevalence in our series as well as the association of mutations with smoking
status.
Based on these results, the conservative conclusion is that mutation status does
not predict short-term outcomes in completely resected lung cancers. However,
given the overall poor prognosis of lung cancer over a period of 5 to 8 years, the
short length of follow-up time was a main impairing factor to the full assessment
of prognostic significance of the genes. It remains to be determined whether
mutation status may be a prognosis factor for longer-term outcomes. The
absence of short-term prognosis value does not preclude that mutations have
significance as predictors of response to specific forms of therapies. Mutations in
EGFR, for example, are predictors of response to Tyrosine Kinase Inhibitors
(Paez et al. 2004). From a biological viewpoint, TP53 and KRAS mutations may
represent very early events in lung carcinogenesis, occurring before tumour
onset as the result of genetic damage by tobacco carcinogens. Although these
mutations do participate in launching bronchial cells on the path to transformation
and progression, it is likely that the tumour behaviour may be dictated by specific,
additional events that occur after their initiation. The fact that tumours carrying
both TP53 and KRAS mutations might have a worse prognosis can have two
explanations. First, these patients may have particularly high exposure to
tobacco carcinogens, or second, they are particularly susceptible to their
mutagenic effects. These patients may thus have increased risk of acquiring
additional mutations which, in turn, may be responsible of their poorer prognosis.
Thus, presence of both TP53 and KRAS mutations in the same lesion may
identify a small group of tumours that are genetically unstable and prone to the
accumulation of mutations accelerating disease progression and/or escape from
therapy.

152
Molecular diagnosis of EUELC patients was based on bronchial biopsies which
showed a high heterogeneity among the primary lung cancers. We could have
taken advantage of this wide clinical population by analysing somatic mutation
according to different stages of the tumours. Since the T and N scores of TNM
tumours classification were associated with disease progression, it would be
valuable to analyse the prognostic value of our biomarkers in the more common
subpopulation of primary lung cancers (i.e. T1+T2, N0+N1). Moreover, SPLC
should be distinguished from recurrence in the definition of disease progression
since they show very different histopathological features and accordingly they
may show very different mutator phenotypes and clinical outcome. In addition,
TP53 mutations are used for tumor response to cysplatin-based therapy, tumors
carrying EGFR mutations may be sensitive to lung cancer therapy with EGFR
inhibitors and our results may suggest that tumors carrying both KRAS and TP53
mutations might respond differently to therapeutic intervention. Since we have
knowledge that in EUELC the progressive-diseases were treated by adjuvant
therapy (both radiotherapy and chemotherapy), it would be extremely valuable to
analyse the status of our biomarkers according to the different chemotherapeutic
intervention that patients undergone, thus effectively translating our findings.
Other candidate markers may involve genes with activating mutations, making it
possible to treat these cancers using selective pharmacological inhibitors
(Sharma et al. 2010), and epigenetic changes in DNA methylation patterns and in
microRNA expression which may distinguish different NSCLC subgroups
(Voortman et al. 2010).
We have additionally analysed TP53 polymorphisms and showed their potential
to modulate lung cancer pathways. Our data show that TP53 mutations tend to
occur at different rates on different TP53 alleles. Although the group of patients
was small, patients with two C alleles of PEX4 (encoding Proline instead of
Arginine at codon 72) tended to have more frequently a mutation in TP53 than
patients with at least one G allele. Thus, the C allele of TP53 may be intrinsically
more “mutable” than the G allele, perhaps as a result of subtle differences in the

153
functional properties of p53 proteins with either Arginine or Proline at position 72.
Experimental studies have identified such functional differences, including a
greater ability to induce apopotosis for 72P than for 72A (Dumont et al. 2003).
This observation is in agreement with results from Mechanic et al. (Mechanic et
al. 2007) who found that common genetic variation in TP53 could modulate lung
cancer pathways, as suggested by the association of TP53 codon 72
polymorphism with lung cancer in African Americans and with somatic TP53
mutation frequency in lung tumours. Thus, in future studies, it will be important to
take into account both TP53 mutation and TP53 haplotypes in assessing the
prognosis and predictive significance of TP53 gene status in lung cancer.

154
Chapter V: General Discussion and Future Perspectiv es
In this project two approaches have been investigated to advance the use of
biomarkers of exposure and intermediate effect in molecular epidemiology.
The potential advantages of using biomarkers in molecular epidemiological
studies are commonly reported as the possibility to improve the accuracy of
exposure measurement, to identify intermediate health effects and to identify
subpopulations with increased susceptibility to develop health effects in the
presence of a carcinogen (Gallo et al. 2011). Examples of the potential
opportunities for exposure and risk assessment of incorporating biomarkers in
cancer epidemiological studies are the use of patterns of TP53 mutations to
distinguish tobacco-related lung cancer from non tobacco-related lung cancer
(Hainaut and Pfeifer 2001), of EGFR and KRAS status to distinguish those
individuals who will clinically respond positively to therapy (Marks et al. 2008,
Van Cutsem et al. 2009) and more recently, of DNA methylation to trace
exposure to tobacco and diet (Vaissière et al. 2009, Vineis et al 2011).
The actual value of a biomarker largely depends on its validity. While the list of
biomarkers is growing fast, the validation of new biomarkers is lagging behind. In
this thesis we have used well validated techniques of laboratory analysis, such as
dHPLC and pyrosequencing, for all our experiments.
The first part of the project is an intervention study in vivo to investigate the
usefulness of epigenetic patterns as biomarkers of modifying effects of diet on
tobacco-related methylation changes. This approach encompasses two
successive hypotheses as to the amplitude of the changes that may occur in
actual biomarker levels. First, we put forward the hypothesis that methylation
levels in DNA from blood lymphocytes are significantly altered by smoking.
Second, we formulate the subsequent hypothesis that specific dietary

155
intervention may at least partially reverse these methylation changes and restore
methylation patterns similar (or close) to those detectable in never-smokers.
Thus, one of the intrinsic difficulties of this study was that, within the proposed
design, we were not in a position to assess each of these two hypotheses
separately. We lacked a control group of never-smokers to establish whether
methylation levels were different (and to which extent) from those of our smoking
population. Therefore, we could only speculate about the amplitude of the
expected effect of dietary intervention. These difficulties are compounded by the
limited knowledge of the dynamics of methylation patterns in DNA from
peripheral blood lymphocytes.
Despite these limitations, our study has identified several features that may pave
the way to future studies using methylation patterns as biomarkers for monitoring
the effects of dietary intervention. In particular, one of the most striking results is
that, in subjects receiving polyphenols supplementation, overall methylation
levels as measured through LINE-1 methylation patterns showed an important
reduction in their variations from one participant to the other, although the actual
difference in average levels themselves was only very minor. This type of
biological modification makes sense: providing participants with a homogeneous,
calibrated diet, we may have reduced the impact of normal variability in the
distribution of the biomarker. It follows that the intervention has somehow
stabilized individual methylation patterns. This, in turn, is an interesting
observation with respect to the concept of “epigenetic stability”. Indeed, it could
be proposed that the main beneficial effect of a calibrated dietary intervention
may stand not in increasing or decreasing methylation patterns (depending upon
the particular gene under study) but in stabilizing the baseline pattern. Stabilizing
baseline methylation patterns may indeed make them less prone to variations
and consequently more resistant to modifications by reactive substances such as
oxyradicals. In some aspects, this concept of “biomarker stabilization” is related
to the concept of “biodiversity” used in ecological studies, with, however, a major
difference. In the ecological conceptual model it is assumed that the larger the
diversity, the better the impact at population level. A large dispersion and

156
diversity in the biomarker distribution is supposed to help the population to cope
with a wide range of environmental changes. In contrast, for “epigenetic
biomarker stabilization”, the beneficial impact at individual level would stem from
a narrower range of variations, due to re-enforcements of the mechanisms that
control and “repair” the biomarker status. It would be of great interest to take this
concept into further biomarker studies and examine its usefulness, in particular in
monitoring preventive interventions.
The second part of the project is a prospective study designed to assess whether
somatic mutations can act as biomarkers of exposure to tobacco smoke and of
risk of lung cancer recurrence. Our approach is based on a standard model of
lung carcinogenesis, which implies the accumulation of mutations in key genes
whose patterns reflect exposure to tobacco smoke. While this model is well
established in both experimental and animal studies, for obvious reasons it has
not been as such demonstrated in smokers. No one would accept taking biopsies
in pre-cancerous and cancerous tissues of patients and keep them under
observation to quantify the accumulation of molecular changes. Thus, our
interpretation of the significance of the biomarkers is constrained by the
limitations of this concept. For example, there is excellent observational and
experimental evidence that PAHs from tobacco smoke can induce G to T
transversions in TP53 gene. Yet in our analysis, we did not detect a significant
association between tobacco smoking status and presence of G to T
transversion. The lack of this expected association can be, in part, due to
insufficient precision in estimating tobacco consumption through questionnaires.
It may also be the consequence of the fact that tobacco contains numerous
carcinogens other than PAH capable of inducing a wide pattern of mutations.
Thus, measuring tobacco consumption is by no means identical to measuring
levels of PAH that may form specific DNA-adducts in target tissues. Moreover,
the individual susceptibility to DNA damage induced by tobacco carcinogens is
under strong control by genetic and epigenetic factors, which as such were not
measured in our model.

157
Aside from possible associations with exposure to tobacco smoke, mutations in
TP53 or KRAS were strongly expected to reveal information on tumour
prognosis. We formulated indeed the hypothesis that tumours with a defined,
measurable detrimental mutation may have a worse biological behaviour than
tumours without that specific mutation. However, this view overlooks the fact that
tumours lacking a defined mutation may carry even worse genetic (or epigenetic)
alterations in another, not measured, biomarker. In many instances, the
biomarker may be a factor belonging to the same pathway (e.g. a factor
regulating p53 expression, stability or activity), thus having the same overall
effect as the measured mutation. In such circumstances, it would indeed be
impossible to identify different prognostic effects by studying a specific mutation.
Rather than assessing a particular form of damage in a gene, it might have been
necessary to assess the overall function of the gene product.
In line with the notions above, it is quite remarkable that studies on lung cancer
as well as on other cancers where TP53 mutations are frequent have failed to
assign a clear prognostic value to the mutations. We suggest that, in a manner
comparable to the effects of a calibrated diet as discussed above, tobacco may
also operate as a factor that “homogenizes” genetic and epigenetic patterns.
Rather than generating a large diversity of changes (which would be expected to
lead to widely different clinical behaviour of cancers), tobacco may act by
targeting specific pathways with a high load of mutagens, thus breaking these
pathways at different points with functionally equivalent effects. Interestingly, a
strong prognostic effect has been assigned to TP53 mutations in breast cancer.
In this latter cancer type, mutations are detected in only about 20-25% of the
cases and there is strong molecular evidence that breast cancer occurs in distinct
types and subtypes. Those cancers with TP53 mutation might well then develop
according to mechanisms very different than those without mutations.
In conclusion, our work further highlights the difficulties of implementing
biomarkers in epidemiological cancer studies. In addition to the technical,
logistical and statistical considerations, the main constraints are the study design

158
and the conceptual model on which the hypotheses on the significance of the
biomarker are generated. Our work shows that it is very difficult to master these
two aspects even in the context of studies of limited size and with biomarkers of
limited complexity. These problems are compounded to a large scale when using
“omics” approaches, in which the multiplicity and complexity of data points
representing biomarkers may be even more difficult to harness within a single
study design and conceptual model.

159
References
1. Abu-Asab M, Chaouchi M, Alesci S, et al. Biomarker in the age of omics: time for a
system biology approach. Omics 2011; 15(3): 105-12.
2. Anna L, Holmila R, Kovács K, Gyorffy E, Gyori Z, Segesdi J, Minárovits J, Soltész I,
Kostic S, Csekeo A, Husgafvel-Pursiainen K, Schoket B. Relationship between TP53
tumour suppressor gene mutations and smoking-related bulky DNA adducts in a lung
cancer study population from Hungary. Mutagenesis 2009; 24(6):475-80.
3. Antequera F, Boyes J, Bird A. High levels of de novo methylation and altered
chromatin structure at CpG islands in cell lines. Cell 1990; 62:503-14.
4. Ahrendt SA, Halachmi S, Chow JT, Wu L, Halachmi N, Yang SC, et al. Rapid p53
sequence analysis in primary lung cancer using an oligonucleotide probe array. Proc
Natl Acad Sci U S A 1999; 96:7382–7.
5. Aquilina NJ, Delgado-Saborit JM, Meddings C, et al. Environmental and biological
monitoring of exposures to PAHs and ETS in the general population. Environ Int 2010;
36(7): 763-71.
6. Armstrong B, Doll R. Environmental factors, cancer incidence and mortality in
different countries with special reference to dietary practices. Int J Cancer 1975; 15(4):
617–31.
7. Balassiano K, Lima S, Jenab M, et al. Aberrant DNA methylation of cancer-
associated genes in gastric cancer in the European Prospective Investigation into
Cancer and Nutrition (EPIC-EURGAST). Cancer Lett 2011; 311(1):85-95.
8. Baccarelli A, Wright RO, Bollati V et al. Rapid DNA methylation changes after
exposure to traffic particles. AJRCCM 2009; 179:572-78.
9. Banerjee HN, Verma M. Epigenetic mechanisms in cancer. Biomark Med 2009;
3(4):397-410.
10. Beasley MB, Brambilla E, Travis WD. The 2004 World Health Organization
classification of lung tumours. Semin Roentgenol 2005; 40(2): 90–7.
11. Beerenwinkel N, Antal T, Dingli D, et al. Genetic progression and the waiting time to
cancer. PLoS Comput Biol 2007; 3 (11): 225.
12. Bergamaschi D, Gasco M, Hiller L, Sullivan A, Syed N, Trigiante G, et al. p53
polymorphism influences response in cancer chemotherapy via modulation of p73-
dependent apoptosis. Cancer Cell 2003; 3:387-402.
13. Bjelke E. Dietary vitamin A and human lung cancer. Int J Cancer 1975; 15(4): 561–
65.
14. Biomarkers Working Group. Biomarkers and surrogate endpoints: preferred
definitions and conceptual framework. Clin Pharmacol Ther 2001; 69(3):89-95.

160
15. Bingham S, Riboli E. Diet and cancer—the European Prospective Investigation into
Cancer and Nutrition. Nat Rev Cancer 2004; 4(3):206-15.
16. Block G, Patterson B, Subar A. Fruit, vegetables, and cancer prevention: a review of
the epidemiological evidence. Nutr Cancer 1992; 18(1): 1–29.
17. Boccia S, Boffetta P, Brennan P, Ricciardi G, Gianfagna F, Matsuo K, van Duijn CM,
Hung RJ. Meta-analyses of the methylenetetrahydrofolate reductase C677T and
A1298C polymorphisms and risk of head and neck and lung cancer. Cancer Lett 2009;
273(1):55-61.
18. Boldrini L, Gisfredi S, Ursino S, et al. Effect of the p53 codon 72 and intron 3
polymorphisms on non-small cell lung cancer (NSCLC) prognosis. Cancer Invest 2008;
26(2): 168-72.
19. Borresen AL, Andersen TI, Eyfjord JE, Cornelis RS, Thorlacius S, Borg A, et al.
TP53 mutations and breast cancer prognosis: particularly poor survival rates for cases
with mutations in the zinc-binding domains. Genes Chromosomes Cancer 1995; 14:71-
75.
20. Brey RL, Cote SA, McGlasson DL, et al. Effects of repeated freeze-thaw cycles on
anticardiolipin antibody immunoreactivity. Am J Clin Pathol 1994; 102:586.
21. Brennan P, Hainaut P, Boffetta P. Genetics of lung-cancer susceptibility. Lancet
Oncology 2011; 12 (4): 399-408.
22. Breton HM, Byun M, Wenten F, et al. Prenatal tobacco smoke exposure affects
global and gene-specific DNA methylation. Am J Respir Crit Care Med 2009; 180:462-7.
23. Brock MV, Hooker CM, Ota-Machida E, Han Y, Guo M, Ames S, Glöckner S,
Piantadosi S, Gabrielson E, Pridham G, Pelosky K, Belinsky SA, Yang SC, Baylin SB,
Herman JG. DNA methylation markers and early recurrence in stage I lung cancer. N
Engl J Med 2008; 358(11):1118-28.
24. Caboux E, Hainaut P, Gormally E. Biological Resource Centers in Molecular
Epidemiology Studies: Collecting, Storing and Analyzing Biospecimens. Molecular
Epidemiology of Chronic Diseases. Vineis P, Garte S, Wild C. 2008; 267-78.
25. Cassidy A, Balsan J, Vesin A, et al. Cancer diagnosis in first-degree relatives and
non-small cell lung cancer risk: Results from a multi-centre case-control study in
Europe. Eur J Cancer 2009; 45(17): 3047-53.
26. Chan DW, Semmes OJ, Petricoin EF, et al. National Academy of Clinical
Biochemistry Guidelines: The Use of MALDI-TOF Mass Spectrometry Profiling to
Diagnose Cancer. American Association for Clinical Chemistry 2006.
27. Cho Y, Gorina S, Jeffrey PD, et al. Crystal structure of a p53 tumour suppressor-
DNA complex: understanding tumourigenic mutations. Science 1994; 265: 346-55.

161
28. Choi JY, James SR, Link PA, et al. Association between global DNA
hypomethylation in leukocytes and risk of breast cancer. Carcinogenesis 2009;
30(11):1889-97.
29. Christensen BC, Kelsey KT, Zheng S, et al. Breast cancer DNA methylation profiles
are associated with tumour size and alcohol folate intake. PLoS Genet 2010; 6(7):
e1001043.
30. COSMIC Database. www.sanger.ac.uk/genetics/CGP/cosmic/. Last Modified Mar 23
2011.
31. Denissenko MF, Pao A, Tang MS, et al. Preferential formation of benzo[a]pyrene
adducts at lung cancer mutational hotspot in P53. Science 1996; 274: 430–32.
32. Diamandis EP, Fritche H, Lilja H, et al. Tumour Markers: Physiology, Pathobiology,
Technology, and Clinical Applications. Washington, DC: AACC Press 2002.
33. Diamandis EP, Schmitt M, van der Merwe D. National Academy of Clinical
Biochemistry Guidelines: The Use of Microarrays in Cancer Diagnostics. American
Association for Clinical Chemistry 2006.
34. Doll R, Peto R, Boreham J, Sutherland I. Mortality in relation to smoking: 50 years’
observations on male British doctors. Bmj 2004; 328:1519.
35. Downs JA. Chromatin structure and DNA double-strand break responses in cancer
progression and therapy. Oncogene 2007; 26: 7765–72.
36. Dumont P, Leu JI, Della Pietra AC, et al. The codon 72 polymorphic variants of p53
have markedly different apoptotic potential. Nat Genet 2003; 33(3): 357-65.
37. ECNIS 2006. Biomarkers of carcinogen exposure and early effects. Nofer Institute of
Occupational Medicine. Farmer PB, Emeny JM, editors.
38. ECNIS 2007. Epidemiological concepts of validation of biomarkers for the
identification/quantification of environmental carcinogenic exposures. Vineis P, Gallo V.
editors.
39. Esteller M., Toyota M., Sanchez-Cespedes M., et al. Inactivation of the DNA repair
gene O6-methylguanine-DNA methyltransferase by promoter hypermethylation is
associated with G to A mutations in K-ras in colorectal tumourigenesis. Cancer Res
2000; 60: 2368–2371. PMID: 10811111.
40. Esteller M. Cancer epigenomics: DNA methylomes and histone-modification maps.
Nat Rev 2007; 8:286-98.
41. Esteban M; Castano A. Non-invasive matrices in human biomonitoring: A review.
Environ Int 2009; 35: 438-49.
42. Epigenetics and human health. Linking hereditary, environmental and nutritional
aspects. Edited by Haslberger AG and Gressler S. 2009.

162
43. Fang MZ, Wang Y, Ai N, et al. Tea polyphenol (-)-epigallocatechin-3-gallate inhibits
DNA methyltransferase and reactivates methylation-silenced genes in cancer cell lines.
Cancer Res 2003; 63, 7563–70.
44. Field JK, Liloglou T, Niaz A, et al. EUELC project: a multi-centre, multipurpose study
to investigate early stage NSCLC, and to establish a biobank for ongoing collaboration.
ERJ 2009; 34(6): 1477-86.
45. Figueiredo JC, GrauMV, Wallace K, et al. Global DNA hypomethylation (LINE-1) in
the normal colon and lifestyle characteristics and dietary and genetic factors. CEBP
2009; 18: 1041-49.
46. Formenton-Catai AP, Pereira R, Lanças FM, et al. Solid-Phase Purification of
Deoxyguanosine-benzo[a]pyrene Diol Epoxide Adducts from Genomic DNA Adduct
Synthesis. J Braz Chem Soc 2005; 16(4): 808-14.
47. Fraga MF, Ballestar E, Paz MF, et al. Epigenetic differences arise during the lifetime
of monozygotic twins. Proc. Natl. Acad. Sci. USA 2005; 102:10604-10609. PMID:
16009939.
48. Gallo V, Egger M, McCormack V, et al. STrengthening the Reporting of
OBservational studies in Epidemiology - Molecular Epidemiology (STROBE-ME): An
extension of the STROBE statement. Mutagenesis. 2011.
49. Gemignani F, Moreno V, Landi S. et al. A TP53 polymorphism is associated with
increased risk of colorectal cancer and with reduced levels of TP53 mRNA. Oncogene
2004; 23(10): 1954-6.
50. GLOBOCAN 2008, Cancer Incidence and Mortality Worldwide. Ferlay J, Shin HR,
Bray F, et al. Available from: http://globocan.iarc.fr
51. Gormally E, Vineis P, Matullo G, et al. TP53 and KRAS2 mutations in plasma DNA
of healthy subjects and subsequent cancer occurrence: a prospective study. Cancer
Res. 2006; 66(13):6871-6.
52. Greenblatt MS, Bennett WP, Hollstein M, et al. Mutations in the p53 tumour
suppressor gene: Clues to cancer etiology and molecular pathogenesis. Cancer Res
1994; 54: 4855–78.
53. Guengerich FP. Cytochrome P450 oxidations in the generation of reactive
electrophiles: epoxidation and related reactions.Arch Biochem Biophys 2003; 409:59-
71.
54. Guarrera S, Sacerdote C, Fiorni L, et al. Expression of DNA repair and metabolic
genes in response to a flavonoid-rich diet. Br J Nutr 2007; 98:525-33.
55. Han JY, Lee GK, Jang DH, et al. Association of p53 Codon 72 Polymorphism and
MDM2 SNP309 With Clinical Outcome of Advanced Nonsmall Cell Lung Cancer.
Cancer 2008; 113(4): 799-807.

163
56. Hancox RJ, Poulton R, Welch D, et al. Accelerated decline in lung function in
cigarette smokers is associated with TP53/MDM2 polymorphisms. Hum Genet 2009;
126: 559–565.
57. Hainaut P, Pfeifer GP. Patterns of p53 G–>T transversions in lung cancers reflect
the primary mutagenic signature of DNA-damage by tobacco smoke. Carcinogenesis
2001; 22:367-77.
58. Hanahan D, Weinberg RA. The hallmarks of cancer. Cell 2000; 100:57-70.
59. Hanahan D, Weinberg RA. Hallmarks of cancer: the next generation. Cell. 2011;
144(5):646-74.
60. Harris L, Fritsche H, Mennel R, et al. American Society of Clinical Oncology 2007
update of recommendations for the use of tumour markers in breast cancer. J Clin
Oncol 2007 20; 25(33):5287-312.
61. Hayes JD, Kelleher MO, Eggleston IM. The cancer chemopreventive actions of
phytochemicals derived from glucosinolates. Eur J Nutr 2008; 47 Suppl 2: 73-88.
62. Hecht SS. Inhibition of carcinogenesis by isothiocyanates. Drug Metab Rev 2000;
32:395–411.
63. Hecht SS. Tobacco carcinogens, their biomarkers and tobacco-induced cancer. Nat
Rev Cancer 2003; 3:733.
64. Heijmans BT, Tobi EW, Stein AD, et al. Persistent epigenetic differences associated
with prenatal exposure to famine in humans. Proc Natl Acad Sci USA 2008; 105:
17046-49.
65. Herceg Z. Epigenetics and cancer: towards an evaluation of the impact of
environmental and dietary factors. Mutagenesis 2007; 22:91–103.
66. Hillman RS and Steinberg SE. The effects of alcohol on folate metabolism. Annu
Rev Med 1982; 33:345-54.
67. Hoffmann D, Djordjevic MV, Hoffmann I. The changing cigarette. Prev Med 1997;
26(4): 427-34.
68. Hu Z, Li X, Qu X, et al. Intron 3 16 bp duplication polymorphism of TP53 contributes
to cancer susceptibility: a meta-analysis. Carcinogenesis 2010; 31(4): 643-7.
69. Hussain SP, Amstad P, Raja K, et al. Mutability of p53 hotspot codons to
benzo(a)pyrene diol epoxide (BPDE) and the frequency of p53 mutations in
nontumourous human lung. Cancer Res 2001; 61: 6350–5.
70. IARC 1986. Monographs on the Evaluation of the Carcinogenic Risk of Chemicals to
Humans. Tobacco Smoking Vol. 38:1–421.
71. IARC 1999. Dos Santos Silva I. Cancer epidemiology: principles and methods.
72. IARC 2002. Monographs on the Evaluation of the Carcinogenic Risk of Chemicals to
Humans. Aflatoxins Vol 82: 39-267.

164
73. IARC 2004a. Monographs on the Evaluation of the Carcinogenic Risk of Chemicals
to Humans. Tobacco smoke and involuntary smoking. Vol. 83: 1-1438.
74. IARC 2004b. Handbooks of Cancer Prevention Volume 9: Cruciferous vegetables,
isothiocyanates and indoles.
75. IARC 2004c.Cancer Pathology and Genetics. Tumours of the Lung, Pleura, Thymus
and Heart. International Agency for Research on Cancer.
76. IARC 2004d. Olivier M, Hussain SP, Caron de Fromentel C, et al. TP53 mutation
spectra and load: a tool for generating hypotheses on the etiology of cancer. 247-70.
77. IARC 2004e. Hagmar L, Stromberg U, Tinnerberg H, et al. Epidemiological
evaluation of cytogenetic biomarkers as potential surrogate endpoints for cancer.:207–
15.
78. IARC 2006. Report of the Advisory Group to Review the Amended Preamble to the
IARC Monographs.
79. IARC 2007.Cancer Incidence in Five Continents, Vol. 9; 160.
80. IARC 2010. Monographs on the Evaluation of the Carcinogenic Risk of Chemicals to
Humans. Volume 100F and 100E. In press.
81. Issaq HJ, Waybright TJ and Veenstra TD. Cancer biomarker discovery; opportunities
and pitfalls in analytical methods. Electrophoresis 2011; 32(9):967-75.
82. Jarabek AM, Pottenger LH, Andrews LS, et al. Creating context for the use of DNA
adduct data in cancer risk assessment: I. Data organization. Crit Rev Toxicol 2009; 39:
659-78.
83. Jemal A, Siegel R, Ward E, et al. Cancer Statistics 2010; 60:277-300.
84. Jenab M, Slimani N, Bictash M., et al. Biomarkers in nutritional epidemiology:
applications, needs and new horizons. Hum Genet 2009; 125:507-25.
85. Jones PA, Baylin SB. The fundamental role of epigenetic events in cancer. Nat Rev
Genet 2002; 3:415-28.
86. Keller G, Hartmann A, Mueller J, et al. Denaturing high pressure liquid
chromatography (DHPLC) for the analysis of somatic p53 mutations. Lab Invest 2001;
81(12):1735-7.
87. Key TJ. Fruit and vegetables and cancer risk. BJC 2011; 104: 6-11.
88. Khuder SA. Effect of cigarette smoking on major histological types of lung cancer: a
meta-analysis. Lung Cancer 2001; 31:139–48.
89. Kosaka T, Yatabe Y, Onozato R, et al. Prognostic implication of EGFR, KRAS, and
TP53 gene mutations in a large cohort of Japanese patients with surgically treated lung
adenocarcinoma. J Thorac Oncol 2009; 4(1):22-9.
90. Kumar A, Vineis P, Sacerdote C, et al. Determination of new biomarkers to monitor
the dietary consumption of isothiocyanates. Biomarkers 2010; 15:739-45.

165
91. Kulasingam V and Diamandis P. Strategies for discovering novel cancer biomarkers
through utilization of emerging technologies. Nat Clin Pract Oncol 2008; 5 (10): 588-99.
92. Lahiri DK and Schnabel B. DNA isolation by a rapid method from human blood
samples: effects of MgCl2, EDTA, storage time, and temperature on DNA yield and
quality. Biochem Genet 1993; 31:321-8.
93. Lam TK, Gallicchio L, Lindsley K et al. Cruciferous vegetable consumption and lung
cancer risk: a systematic review. Cancer Epidemiol Biomarkers Prev 2009; 18:184-95.
94. Lamprecht SA, Lipkin M. Chemoprevention of colon cancer by calcium, vitamin D
and folate: molecular mechanisms. Nat Rev Cancer 2003; 3(8):601-14.
95. Le Calvez F, Mukeria A, Hunt J, et al. TP53 and KRAS Mutation Load and Types in
Lung Cancers in Relation to Tobacco Smoke: Distinct Patterns in Never, Former, and
Current Smokers. Cancer Research 2005; 65:5076-83.
96. Lee WJ, Shim JY and Zhu BT. Mechanisms for the inhibition of DNA
methyltransferases by tea catechins and bioflavonoids. Mol Pharmacol 2005; 68:1018–
30.
97. Li Y and Tleefsbol T. Impact on DNA metylation in cancer prevention and therapy by
bioactive components. Curr Med Chem 2010; 17(20): 2141-51.
98. Linseisen J, Rohrmann S, Miller AB, et al. Fruit and vegetable consumption and lung
cancer risk: updated information from the European Prospective Investigation into
Cancer and Nutrition (EPIC). International Journal of Cancer 2007; 121:1103–14.
99. Liu L, Wu C, Wang Y, et al. Combined Effect of Genetic Polymorphisms in P53, P73,
and MDM2 on Non-small Cell Lung Cancer Survival. J Thorac Oncol. 2011 Aug 11.
100. Loeb LA, Bielas JH, Beckman RA. Cancers exhibit a mutator phenotype: clinical
implications. Cancer Res 2008; 68: 3551–57.
101. Lopez AD, Collishaw NE, and Piha T. A descriptive model of the cigarette epidemic
in developed countries. Tobacco Control 1994; 3: 242-247.
102. Ludwig J and Weinstein J. Biomarkers in Cancer Staging, Prognosis and Treatment
Selection. Nature Reviews Cancer 2005; 5: 845-56.
103. Luo K, Liu Z, Karayiannis P. Effect of antiviral treatment on alfa-fetoprotein levels in
HBV-related cirrhotic patients: early detection of hepatocellular carcinoma. J Viral Hepat
2010; 17(7).
104. MacMahon B, Trichopoulos D, Brown J, et al. Age at menarche, urine estrogens and
breast cancer risk. Int J Cancer 1982; 30(4):427-3.
105. Malaveille C, Fiorini L, Bianchini M, et al. Randomized controlled trial of dietary
intervention: association between level of urinary phenolics and anti-mutagenicity.
Mutat Res 2004; 561:83-90.

166
106. Manach C, Scalbert A, Morand C, et al. Polyphenols: food sources and
bioavailability. Am J Clin Nutr 2004; 79: 727-47.
107. Marcel V, Palmero EI, Falagan-Lotsch P, et al. TP53 PIN3 and MDM2 SNP309
polymorphisms as genetic modifiers in the Li-Fraumeni syndrome: impact on age at first
diagnosis. J Med Genet 2009; 46(11):766-72.
108. Martinez J, Georgoff I, Martinez J, Levine AJ. Cellular localization and cell cycle
regulation by a temperature sensitive p53 protein. Genes Dev 1991, 5:151-159.
109. Marks JL, Broderick S, Zhou Q, et al. Prognostic and therapeutic implications of
EGFR and KRAS mutations in resected lung adenocarcinoma. J Thorac Oncol 2008;
3(2): 111-6.
110. McGuire WL, Horwitz KB, Pearson OH, et al. Current status of estrogen and
progesterone receptors in breast cancer. A review. Cancer 1977; 39(6 Suppl):2934-47.
111. Mechanic LE, Bowman ED, Welsh JA, et al. Common genetic variation in TP53 is
associated with lung cancer risk and prognosis in African Americans and somatic
mutations in lung tumours. Cancer Epidemiol Biomarkers Prev 2007; 16(2):214-22.
112. Medical Research Council. Tobacco smoking and cancer of the lung. British Medical
Journal 1957; 1: 1523–24.
113. Melhem MF, Law JC, el-Ashmawy L, Johnson JT, Landreneau RJ, Srivastava S,
Whiteside TL. Assessment of sensitivity and specificity of immunohistochemical staining
of p53 in lung and head and neck cancers. Am J Pathol. 1995; 146(5):1170-7.
114. Moore HM, Kelly AB, Jewell SD, et al. Biospecimen reporting for improved study
quality (BRISQ). J Proteome Res 2011; 10(8):3429-38.
115. Mounawar M, Mukeria A, Le Calvez F, et al. Patterns of EGFR, HER2, TP53, and
KRAS Mutations of p14arf Expression in Non–Small Cell Lung Cancers in Relation to
Smoking History. Cancer Res 2007; 67(12): 5667-72.
116. Myzak MC, Hardin K, Wang R, Dashwood RH, Ho E. Sulforaphane inhibits histone
deacetylase activity in BPH-1, LnCaP and PC-3 prostate epithelial cells. Carcinogenesis
2006; 27:811–9.
117. Nature Valid concerns. Editorial 2010; 463: 401-402.
118. Ozanne SE and Constancia M. Mechanisms of disease: the developmental origins
of disease and the role of the epigenotype. Nat Clin Pract Endocrinol Metab 2007; 3(7):
539-46.
119. Paez G, Janne PA, Lee JC, et al. EGFR mutations in lung cancer: correlation with
clinical responde to gefitinib therapy. Science 2004; 304: 1497-1500.
120. Pao W, Miller V, Zakowski M, et al. EGF receptor gene mutations are common in
lung cancers from ‘‘never-smokers’’ and are associated with sensitivity of tumours to
gefitinib and erlotinib. Proc Natl Acad Sci USA 2004; 101:13306-11.

167
121. Perera FP and Weinstein IB. Molecular epidemiology: recent advances and future
directions. Carcinogenesis 2000; 21: 517-24.
122. Petitjean A, Mathe E, Kato S, et al. Impact of mutant p53 functional properties on
TP53 mutation patterns and tumour phenotype: lessons from recent developments in
the IARC TP53 database. Human Mutation 2007; 28(6):622-9. Latest database version
(R14, November 2009). http://www-p53.iarc.fr/index.html
123. Peto J. Cancer epidemiology in the last century and the next decade. Nature. 2001;
411:390-5.
124. Pfeifer GP and Denissenko MF. Formation and repair of DNA lesions in the p53
gene: Relation to cancer mutation. Environ Mol Mutag 1998; 31: 197–205.
125. Phillips JM and Goodman JI. Inhalation of cigarette smoke induces regions of
altered DNA methylation (RAMs) in SENCAR mouse lung. Toxicology 2009; 260:7–15.
126. Ramos S. Cancer chemoprevention and chemotherapy: dietary polyphenols and
signalling pathways. Mol Nutr Food Res 2008; 52:507-26.
127. Rhodes M, Price K. Identification and analysis of plant phenolic antioxidants. Eur J
Cancer Prev 1997; 6:518-21.
128. Riboli E, Hunt KJ, Slimani N, et al. European Prospective Investigation into Cancer
and Nutrition (EPIC): study populations and data collection. Public Health Nutr 2002; 5:
1113 – 24.
129. Rosell R, Moran T, Queralt C, et al. Screening for epidermal growth factor receptor
mutations in lung cancer. N Engl J Med 2009; 361(10):958-67.
130. Rosenblum BB, Lee LG, Spurgeon SL, Khan SH, Menchen SM, Heiner CR, et al.
New dye-labeled terminators for improved DNA sequencing patterns. Nucleic Acids Res
1997; 25:4500–4. 17.
131. Rothman N, Stewart WF, Schulte P. Incorporating biomarkers into cancer
epidemiology: a matrix of biomarker and study design categories. CEBP 1995, 4:301-
11.
132. Rundle A, Vineis P, Ahsan H. Design options for molecular epidemiology research
within cohort studies. CEBP 2005; 14(8):1899-907.
133. Samowitz WS, Curtin K, Ma KN, Edwards S, Schaffer D, Leppert MF, et al.
Prognostic significance of p53 mutations in colon cancer at the population level. Int J
Cancer 2002; 99:597-602.
134. Sawan C, Vaissière T, Murr R, et al. Epigenetic drivers and genetic passengers on
the road to cancer. Mutat Res 2008; 642(1-2):1-13.
135. Schatzkin A, Freedman LS, Schiffman MH, et al. Validation of intermediate end
points in cancer research. J Natl Cancer Inst 1990; 82 (22): 1746-52.

168
136. Schneider PM, Stoeltzing O, Roth JA, Hoelscher AH, Wegerer S, Mizumoto S, et al.
P53 mutational status improves estimation of prognosis in patients with curatively
resected adenocarcinoma in Barrett’s esophagus. Clin Cancer Res 2000; 6: 3153-315.
137. Schulte PA, Perera FP. Molecular Epidemiology: Principles and Practices. San
Diego: Academic Press; 1993.
138. Schwartz AG, Prysak GM, Bock CH, et al. The molecular epidemiology of lung
cancer. Carcinogenesis 2007; 28:507–18.
139. Seow A, Vainio H, Yu MC. Effect of glutathione-S-transferace M1 polymorphisms on
the cancer preventive potential of isothiocyanates: An epidemiological perspective.
Mutat Res 2005; 592:1283–91.
140. Sharma SV, Haber DA, Settleman J. Cell line-based platforms to evaluate the
therapeutic efficacy of candidate anticancer agents. Nat Rev Cancer 2010; 10(4):241-
53.
141. Shen JC, Rideout WM the 3rd, Jones PA. High frequency mutagenesis by a DNA
methyltransferase. Cell 1992; 71:1073-80.
142. Shen G, Jeong W, Hu R, et al. Regulation of Nrf2, NfkB and AP-1 signaling
pathways by chemopreventive agents. ARS 2005; 7 (11-12):1648-63.
143. Shigematsu H, Lin L, Takahashi T, et al. Clinical and biological features associated
with epidermal growth factor receptor gene mutations in lung cancers. JNCI 2005; 97:
339–46.
144. Sidransky D. Emerging molecular markers of cancer. Nat Rev Cancer 2002; 2:210-
219.
145. Steinmetz KA, Potter JD. Vegetables, fruit, and cancer. II. Mechanisms. Cancer
Causes Control 1991; 2(6): 427–42.
146. Stidley CA, Picchi MA, Leng S, et al. Multivitamins, folate and green vegetables
protect against gene promoter methylation in the aerodigestive tract of smokers. Cancer
Res 2010; 70:568-74.
147. Talaska G, Al-Zoughool M, Malaveille C, et al. Randomized controlled trial: effects of
diet on DNA damage in heavy smokers. Mutagenesis 2006; 21:179-83.
148. Thunissen FB, Prinsen C, Hol B, et al.Smoking history and lung carcinoma: KRAS
mutation is an early hit in lung adenocarcinoma development. Lung Cancer 2011; in
press.
149. Terry MB, Delgado-Cruzata L, Vin-Raviv N, et al. DNA methylation in white blood
cells: Association with risk factors in epidemiologic studies. Epigenetics 2011; 6:828-37.
150. Tokumo M, Toyooka S, Kiura K, et al. The relationship between epidermal growth
factor receptor mutations and clinicopathologic features in non-small cell lung cancers.
Clin Cancer Res 2005; 11:1167-73.

169
151. Tost J, Dunker J, Gut IG. Analysis and quantification of multiple methylation variable
positions in CpG islands by pyrosequencing. Biotechniques 2003; 35:152–6.
152. Tsubono Y, Nishino Y, Komatsu S, et al. Green tea and the risk of gastric cancer in
Japan. N Engl J Med 2001; 344: 632-36.
153. Vaissière T, Hung RJ, Zaridze D, et al. Quantitative analysis of DNA methylation
profiles in lung cancer identifies aberrant DNA methylation of specific genes and its
association with gender and cancer risk factors. Cancer Res 2009; 69(1):243-52.
154. Van Cutsem E, Kohne CH, Hitre E, et al. Cetuximab and chemotherapy as initial
treatment for metastatic colorectal cancer. N Engl J Med 2009; 360: 1408-17.
155. Van den Berg L, Rose D. Effect of freezing on the pH and composition of sodium
and potassium phosphate solutions: the reciprocal system KH2PO4-Na2HPO4-H2O.
Arch Biochem Biophys 1959; 81:319- 29.
156. Vineis P, Malats N, Porta M, et al. Human cancer, carcinogenic exposures and
mutation spectra. Mutat Res 1999; 436: 185-94.
157. Vineis P, Kogevinas M, Simonato L, Brennan P, Boffetta P. Levelling-off of the risk
of lung and bladder cancer in heavy smokers: an analysis based on multicentric case-
control studies and a metabolic interpretation. Mutat Res 2000; 463:103-110.
158. Vineis P and Perera F. Molecular Epidemiology and Biomarkers in Etiologic Cancer
Research: The New in Light of the Old. CEBP 2007; 16(10):1954-65.
159. Vineis P, Chuang S, Vaissière T, et al. DNA methylation changes associated with
cancer risk factors and blood levels of vitamin metabolites in a prospective study.
Epigenetics 2011; 6(2):1-7.
160. Voortman J, Goto A, Mendiboure J, et al. MicroRNA expression and clinical
outcomes in patients treated with adjuvant chemotherapy after complete resection of
non-small cell lung carcinoma. Cancer Res 2010; 70(21):8288-98.
161. Watanabe T, Katayama Y, Komine C, et al. O6-methylguanine-DNA
methyltransferase methylation and TP53 mutation in malignant astrocytomas and their
relationships with clinical course. Int J Cancer 2005; 113(4):581-7.
162. Weigelt B, Hu Z, He X, et al. Molecular portraits and 70-gene prognosis signature
are preserved throughout the metastatic process of breast cancer. Cancer Res 2005;
65: 9155–9158.
163. WHO 2011. Report on the global tobacco epidemic,
http://www.who.int/tobacco/global_report/2011/en/index.html.
164. Wild CP, Jiang YZ, Sabbioni G, et al. Evaluation of methods for quantitation of
aflatoxinalbumin adducts and their application to human exposure assessment. Cancer
Res 1990; 50: 245-51.

170
165. Wild CP, Fortuin M, Donato F, et al. Aflatoxin, liver enzymes and hepatitis B virus
infection in Gambian children. CEBP 1993; 2: 555-561.
166. Wild C. Completing the Genome with an “Exposome”: The Outstanding Challenge of
Environmental Exposure Measurement in Molecular Epidemiology. Cancer Epidemiol
Biomarkers Prev 2005; 14: 1847.
167. Wild CP, Vineis P, Garte S. Molecular epidemiology of chronic diseases. 2008.
168. Wild C. Environmental exposure measurement in cancer epidemiology. Mutagenesis
2009; 24:117-125.
169. World Cancer Research Fund/American Institute for Cancer Research. Food,
Nutrition, Physical Activity and the Prevention of Cancer: A Global Perspective. AIRC
1997.
170. World Cancer Research Fund/American Institute for Cancer Research. Food,
Nutrition and the Prevention of Cancer: A Global Perspective. AIRC 2007.
171. Wright ME, Park Y, Subar AF, et al. Intakes of fruit, vegetables, and specific
botanical groups in relation to lung cancer risk in the NIH-AARP Diet and Health Study.
Am J Epidemiol 2008; 168: 1024-34.
172. Wu HC, Delgado-Cruzata L, Flom JD, et al. Global methylation profiles in DNA from
different blood cell types. Epigenetics 2011; 6:76-85.
173. Yang C, Landau J, Huang M, et al. Inhibition of carcinogenesis by dietary
polyphenolic compounds. Annu Rev Nutr 2001; 21:381-406.
174. Yatabe Y and Mitsudomi T. Epidermal growth factor receptor mutations in lung
cancers. Pathology International 2007; 57: 233–44.
175. Yoon J, Baek S. Molecular targets of dietary polyphenols with anti-inflammatory
properties. Yonsei Med J 2005; 46:585-96.
176. Yoon J, Smith L, Feng Z, et al. Methylated CpG Dinucleotides Are the Preferential
Targets for G-to-T Transversion Mutations Induced by Benzo[a]pyrene Diol Epoxide in
Mammalian Cells : Similarities with the p53 Mutation Spectrum in Smoking-associated
Lung Cancers. Cancer Res 2001; 61:7110-17.
177. Youlden DR, Cramb SM, Baade PD. The International Epidemiology of Lung
Cancer: geographical distribution and secular trends. J Thorac Oncol. 2008; 3(8):819-
31.
178. Zhang Y. Cancer-preventive isothiocyanates; measurement of human exposure and
mechanism of action. Mut Res 2004; 555:173-190.
179. Zhang FF, Morabia A, Carroll J, et al. Dietary patterns are associated with levels of
global genomic DNA methylation in a cancer-free population. J Nutr 2011; 141(6):1165-
71.