Embed Size (px)
Citation preview
American Journal of Plant Sciences 2013 4 1629-1640 httpdxdoiorg104236ajps201348197 Published Online August 2013 (httpwwwscirporgjournalajps)
Biomass Accumulation and Nutrient Uptake of Jerusalem Artichoke (Helianthus tuberosus L)
Zoltaacuten Izsaacuteki Gabriella Neacutemeth Kaacutedi
Institute of Environmental Sciences Faculty of Economics Agricultural and Health Studies Szent Istvaacuten University Szarvas Hun-gary Email izsakizoltangksziehu Received May 27th 2013 revised June 30th 2013 accepted July 15th 2013 Copyright copy 2013 Zoltaacuten Izsaacuteki Gabriella Neacutemeth Kaacutedi This is an open access article distributed under the Creative Commons At-tribution License which permits unrestricted use distribution and reproduction in any medium provided the original work is prop-erly cited
ABSTRACT
The dynamics of biomass accumulation during the growing period the yield of leafy stalks and tubers and the nutrient concentration and nutrient uptake of the yield were investigated for two Jerusalem artichoke varieties (Taacutepioacutei Korai and Taacutepioacutei Sima) in a field experiment involving mineral fertilisation Considerable differences were observed between the dynamics of leafy stalk and tuber development in Taacutepioacutei Korai which has a short vegetation period and Taacutepioacutei Sima where the vegetation period is long The maximum dry matter ratio between the tuber yield and the leafy stalk yield was 11 for Taacutepioacutei Korai and 145 for Taacutepioacutei Sima During the period when the maximum aboveground biomass developed in Taacutepioacutei Korai 100 kghaminus1 N and P fertiliser resulted in the highest leafy stalk yield (3834 thaminus1) while for Taacutepioacutei Sima which developed a much greater leafy stalk mass the highest aboveground biomass yield (78 - 80 thaminus1) was given in response to 200 kghaminus1 N supplemented by P and K fertiliser Both artichoke varieties produced the greatest tuber yield at a N rate of 200 kghaminus1 supplemented with P and K fertiliser The nutrient concentration in the leafy stalks was highest on the 85th day of the vegetation period prior to intensive dry matter accumulation in the leafy stalks and before tuber formation began In both varieties the maximum nutrient uptake was recorded on the 155th day Great differences were observed between the varieties in terms of specific nutrient uptake For a tuber yield of 10 t together with the corresponding leafy stalk yield the specific nutrient uptake of the Taacutepioacutei Korai variety amounted to 48 kg N 10 kg P 83 kg K 30 kg Ca and 10 kg Mg while for Taacutepioacutei Sima these figures were 162 kg N 30 kg P 300 kg K 84 kg Ca and 45 kg Mg Keywords Jerusalem Artichoke Mineral Fertilisation Biomass Accumulation Yield Nutrient Uptake
1 Introduction
On a world scale Jerusalem artichoke (Helianthus tube- rosus L) is a crop of minor importance Between 2006 and 2010 the growing area averaged 130000 hectares worldwide of which 78000 ha was located in Europe The major producers in Europe are Italy (50000 ha) Spain (16000 ha) and France (9000 ha) Averaged over the last five years the tuber yield amounted to around 11 tha on a world scale and 10 thaminus1 in Europe (FAOSTAT) Due to its multiple uses and excellent economic value the Jerusalem artichoke deserves a higher ranking among the worldrsquos crops
The species has great yield potential producing 10 - 20 thaminus1 under poor conditions 25 - 40 thaminus1 on moder-
ately fertile areas and 45 - 80 thaminus1 under intensive con- ditions Depending on the end-use and site conditions the summer leafy stalk yield ranges from 15 - 50 thaminus1 and the autumn leafy stalk yield from 20 - 50 thaminus1 The young leafy stalk yield can be used as fresh fodder or for silaging Thanks to its good regeneration ability it can be cut 3 or 4 times when the water supplies are favourable The autumn leafy stalk yield has poorer fodder value but can be used as litter as raw material for the paper Indus- try or for biogas production and as fuel The tubers have a carbohydrate content of 10 - 22 consisting of 80 - 90 inulin 7 - 14 sucrose and 3 - 6 reducing sugars In addition to the carbohydrates they contain 12 - 20 protein 02 fat and 20 - 25 fibre The tubers can be used for human consumption livestock feeding and bioethanol production and they can be processed into inulin-rich diabetic sweeteners [1-5]
This research was funded from a Szeacutechenyi grant (No NKFP 3012 2001-2004)
Copyright copy 2013 SciRes AJPS
Biomass Accumulation and Nutrient Uptake of Jerusalem Artichoke (Helianthus tuberosus L) 1630
The development of the above and belowground or- gans of Jerusalem artichokes the dynamics of biomass accumulation the yield of tubers and leafy stalks and their chemical composition are all fundamentally influ- enced by ecological conditions variety traits and the technology Of the many factors involved the most deci- sive are the water supplies the yield potential and vege- tation period of the variety and the nutrient supplies
In Thailand the effect of the location times genotype in- teraction on the tuber yield was examined for 15 Jerusa- lem artichoke clones with diverse genotypes grown at 9 locations [6] The tuber yield ranged from 30 - 172 thaminus1 under the poorest conditions and from 261 - 389 thaminus1 at the best location Averaged over four years dif- ferences in tuber yield of 15 - 28 thaminus1 were caused for the same genotypes by differences in the site conditions (water supplies soil type)
The tubers begin to develop in July and August and growth continues until the foliage withers The main pe- riod of tuber development for varieties with a short vegetation period is in August while development con- tinues into September and October for those with a longer growing period Jerusalem artichoke is a relatively drought-tolerant crop but the size of the tuber yield is determined to a major extent by the water supplies during the tuber formation period Varieties with a longer vege- tation period have greater water requirements and yields However the higher yield potential is only manifested compared with earlier maturing varieties if the tuber de- velopment period has good water supplies and if har- vesting is carried out as late as possible [137-9]
Jerusalem artichokes are able to accumulate great biomass for which a large amount of nutrients are re- quired The crop has good nutrient use efficiency how- ever as also shown by Raso [10] who recorded the highest tuber yield (34 thaminus1) on fertile sandy soil with 50 kghaminus1 N while higher N rates (100 150 200 kghaminus1) led to a slight decline in yield K fertilisation (100 200 kghaminus1) had no influence on the yield and no N times K interaction was observed
Among the macroelements the N supplies were most decisive for the size and quality of the tuber yield and for the quantity of aboveground biomass Excessive N sup-plies caused a considerable increase in the leafy stalk mass with a reduction in tuber yield and harvest index Tuber formation was negatively influenced by P and K deficiencies [11-15]
Little attention has been given in fertilisation experi- ments to an analysis of the nutrient uptake and nutrient requirements of the crop Angeli [1] and Izsaacuteki [3] found the specific nutrient requirements of a 10-t tuber yield plus the corresponding leafy stalk yield amounted to 32 - 46 kg N 13 - 23 kg P and 75 - 100 kg K There may however be considerable deviations in the specific nu-
trient uptake of Jerusalem artichoke as the varieties and clones differ in terms of leafy stalk yield tuber yield po- tential and the nutrient concentrations of the plant organs even under the same growing conditions Seiler and Campbell [1617] examined the nutrient content of the leafy stalk yield of nine wild-growing Jerusalem arti- choke populations at flowering and found significant genetic variability in the N P K Ca and Mg concentra- tions of the leafy stalks of these wild populations Similar results were reported for the nutrient concentration of the leafy stalks of ten varieties with values ranging from 080 - 178 N 010 - 025 P 078 - 297 K 108 - 323 Ca and 017 - 026 Mg Genetic vari- ability could also be detected in the nutrient concentra- tions of the tubers both for wild populations and for va- rieties This great genetic variability in the nutrient con- tents of the plant organs was found to be suitable for classifying the origin of Jerusalem artichoke varieties and clones [1819] In recent years major sources [19-24] have given the following ranges for the tuber nutrient content in terms of dry matter 100 - 170 N 015 - 048 P 092 - 262 K 013 - 148 Ca 006 - 024 Mg 002 - 004 Na 16 - 150 mgkgminus1 Fe 40 - 100 mgkgminus1 Mn 11 - 35 mgkgminus1 Zn 20 - 90 mgkgminus1 Cu and 9 - 13 mgkgminus1 B The accumulation of nutrients and their concentration and distribution in the various plant organs (stalk leaves stolon tuber) may change substantially during the vegetation period The nutrient content of the leafy stalk declines to a considerable ex- tent during tuber formation [25-27] Notable differences in yield potential and in the leafy stalktuber ratio were recorded between the varieties
In the light of the above observation the nutrient re-quirements of Jerusalem artichoke cannot be determined independently of the variety or variety group and cannot be expressed in terms of generally applicable specific nutrient uptake values The aim of the paper was to de-termine the dynamics of biomass accumulation in the plant organs changes in nutrient concentration during the growing period and the nutrient uptake of two Jerusalem artichoke varieties grown in a fertilisation experiment
2 Materials and Method
21 Experimental Site Treatments Crop Management
A mineral fertilisation experiment on Jerusalem arti-choke was set up in Szarvas Hungary (46˚86N 20˚55E) in 2002 on a chernozem meadow soil calcareous in the deeper layers with the following major parameters dep- th of the humus-containing layer 85 - 100 cm pH (KCl) of the ploughed layer 58 humus content 265 no CaCO3 content upper limit of plasticity (KA) 46 texture clay loam The mean depth of the groundwater was 300 - 350 cm
Copyright copy 2013 SciRes AJPS
Biomass Accumulation and Nutrient Uptake of Jerusalem Artichoke (Helianthus tuberosus L) 1631
According to soil analysis carried out in autumn 2001 before the experiment was set up the nutrient content of the ploughed layer was as follows (mgkgminus1) AL-P2O5 121 AL-K2O 278 AL-Na 119 KCl-Mg 955 EDTA- Mn 250 EDTA-Cu 68 and EDTA-Zn 26 Based on the methods and limit values recommended by the Plant Protection and Agrochemistry Centre [2829] the soil has moderate P supplies good K Cu and Zn supplies and a high level of Na Mg and Mn supplies
The experiment was set up in a split-plot design in four replications Factor ldquoArdquo was the two Jerusalem arti- choke varieties Taacutepioacutei Korai (short growing period) and Taacutepioacutei Sima (long growing period) while factor ldquoBrdquo was the 13 fertiliser rates listed in Table 1 The high rates of P and K fertiliser were applied partly to ensure the phos- phorus and potassium required for three growing periods and partly to create distinct supply levels in the soil Ni- trogen was applied in spring in the form of ammonium nitrate (34 N) while phosphorus and potassium were applied in autumn in the form of super-phosphate (18 P2O5) and potassium chloride (40 K2O) The previous crop was spring barley The crop was sown with a row distance of 75 cm and a plant distance of 60 cm with 72 plants per plot (plant density 22222 plantsha) on 20 March 2002 The subplot size was 324 m2 (45 times 72 m)
The weather data for the location are presented in Ta- ble 2
22 Measurement Plant Analysis
In order to study the dynamics of biomass accumulation
Table 1 Fertiliser treatments applied in the experiment
Fertiliser active ingredients kghaminus1
Treatment code N P2O5 K2O
Control - - -
N1 100 - -
N2 200 - -
N3 300 - -
N1P1 100 100 -
N1P1K1 100 100 300
N1P2 100 500 -
N1K2 100 - 600
N1P2K2 100 500 600
N2P3 200 1000 -
N2K3 200 - 1200
N2P3K3 200 1000 1200
N3P3K3 300 1000 1200
Table 2 Weather data for the experimental location (Szar-vas 1901-1975 2002)
Precipitation mm Temperatures ˚C Month
1901-1975 2002 1901-1975 2002
Jan 30 6 minus20 minus06
Feb 32 28 00 49
Mar 31 6 53 77
Apr 44 19 110 114
May 59 56 165 194
Jun 68 49 198 217
Jul 51 118 219 238
Aug 52 61 211 215
Sep 39 50 168 158
Oct 43 26 111 107
Nov 49 25 52 76
Dec 40 45 05 minus12
Annual 538 489 106 114
leafy stalk samples were taken for mass measurements on four (Taacutepioacutei Korai) or five (Taacutepioacutei Sima) occasions The tuber mass was recorded twice for Taacutepioacutei Korai and three times for Taacutepioacutei Sima during tuber development The sampling dates were on the 85th (12 Jun) 115th (12 Jul) 155th (21 Aug) 195th (30 Sep) and 225th (30 Oct) days after planting On each sampling date six plants were harvested (27 m2) and on the last harvesting date the leafy stalk yield and tuber yield were recorded for the whole plot (243 and 216 m2) For the analysis of leafy stalks each sample consisted of one main shoot and the corresponding side-shoots for each plant In the case of the tubers five tubers were chosen from each plant These were cleaned of soil washed pulpified and frozen until required for analysis
The leafy stalk and tuber samples were analysed for the following nutrients N P K Na Ca Mg Fe Mn Zn and Cu For the determination of N P K and Na the samples were digested first with sulphuric acid and then with hydrogen peroxide after which N and P were measured photometrically and Na and K using a flame photometer The Ca Mg Fe Mn Zn and Cu contents were determined with an atomic absorption spectrometer (AAS) after hydrolysis with 2 moldmndash3 KCl The nutria- ent concentrations are given in terms of dry matter av- eraged over the fertilisation treatments
23 Statistical Analysis
The data of the leafy stalk and the tuber yield were statis-
Copyright copy 2013 SciRes AJPS
Biomass Accumulation and Nutrient Uptake of Jerusalem Artichoke (Helianthus tuberosus L) 1632
tically processed using single-factor analysis of variance for each variety according to the method given by Svaacuteb [30] The least significant differences (LSD) were given at the P = 005 level
3 Results and Discussion
31 Leafy Stalk Yield
The accumulation of fresh and dry matter in the leafy stalks of the Taacutepioacutei Korai variety is presented in Tables 3 and 4
Averaged over the fertiliser treatments 60 of the to- tal fresh leafy stalk mass was accumulated by the 85th day of the growing season and 84 of the total above- ground biomass by the 115th day The maximum fresh leafy stalk mass was recorded on the 155th day so 40 of the total aboveground fresh mass was formed in the course of 70 days between the 85th and 155th days of the vegetation period The leafy stalks of this early maturing variety gradually withered from the last ten days of Au- gust the leaves dropped and only 22 of the above- ground biomass could be harvested on the 195th day of the season (Table 3)
Averaged over the fertilisation treatments the dy- namoics of dry matter accumulation in the leafy stalks
Table 3 Fresh leafy stalk yield of the Taacutepioacutei Korai Jerusa-lem artichoke variety thaminus1 (Szarvas 12 Jun-30 Sep 2002)
Fresh leafy stalk yield thaminus1
Day of the vegetation period Treatment code
85th 115th 155th 195th
Control 1595 2036 2407 696
N1 1659 2972 2938 645
N2 1957 3157 2864 661
N3 2058 2843 3756 691
N1P1 2027 3205 3834 782
N1P1K1 2167 2964 3657 634
N1P2 1770 2206 2427 632
N1K2 1959 2530 3064 908
N1P2K2 2035 2958 3316 837
N2P3 2226 2617 3712 825
N2K3 2205 2762 3713 845
N2P3K3 2203 3034 3815 765
N3P3K3 2153 2934 3833 826
LSD5 185 363 405 112
Mean 2001 2786 3334 749
60 84 100 22
Table 4 Dry matter yield of the leafy stalks of the Taacutepioacutei Korai Jerusalem artichoke variety thaminus1 (Szarvas 12 Jun- 30 Sep 2002)
Dry matter yield of the leafy stalks thaminus1
Day of the vegetation period Treatment code
85th 115th 155th 195th
Control 127 366 797 254
N1 133 535 969 257
N2 156 568 944 256
N3 164 511 1239 253
N1P1 162 577 1235 294
N1P1K1 173 515 1206 241
N1P2 141 397 801 237
N1K2 156 455 1011 352
N1P2K2 162 532 1094 326
N2P3 178 471 1225 313
N2K3 181 497 1225 342
N2P3K3 176 546 1259 272
N3P3K3 172 528 1264 302
LSD5 014 067 133 045
Mean 160 500 1097 284
15 46 100 26
differed from that of the fresh mass due to the fact that the dry matter content of the leafy stalks gradually in- creased throughout the growing period On the 85th day the dry matter content of the leafy stalks was 8 while this increased to 18 33 and 38 respectively by the 115th 155th and 195th days 15 of the total aboveground dry matter had formed by the 85th day of the vegetation period and 46 by the 115th day The most dynamic dry matter incorporation was detected between the 115th and 155th days when the maximum value was recorded So 54 of the aboveground dry matter was formed over the course of 40 days Only 26 of the maximum leafy stalk dry matter could be harvested on the 195th day of the growing season (Table 4)
The maximum values of fresh and dry mass were achieved in the leafy stalks of the Taacutepioacutei Korai variety on the 155th day of the growing period when the fresh mass was around 33 thaminus1 and the dry matter around 11 thaminus1 averaged over the fertiliser treatments When the effect of fertilisation was examined over the maximum biomass formation period it was found that without fertilisation a fresh mass of 2407 thaminus1 was achieved which was sig- nificantly increased by N fertiliser alone The application
Copyright copy 2013 SciRes AJPS
Biomass Accumulation and Nutrient Uptake of Jerusalem Artichoke (Helianthus tuberosus L) 1633
of the 300 kghaminus1 rate of N fertiliser (N3) resulted in a fresh mass of 3756 thaminus1 and none of the fertiliser treatments caused a significant increase compared with this yield The 100 kghaminus1 rate of N fertiliser combined with 100 kghaminus1 P fertiliser (N1P1) gave a very similar yield (3834 thaminus1) to that achieved with N3 As the soil had good K supplies the addition of 100 kghaminus1 K fer- tileiser (N1P1K1) had no significant influence on the fresh leafy stalk mass compared with N1P1 High rates of P and K fertiliser (P2 K2) combined with 100 kghaminus1 N led to a significant reduction in the fresh mass compared with N1P1 However this negative effect of replenishment rates of P and K was not observed at the 200 and 300 kghaminus1 N supply levels In the early stages of the grow- ing period the fertiliser effects were similar to those ob- served during the period of maximum fresh mass accu- mulation When maximum dry matter accumulation was observed in the leafy stalks the dry matter mass of the aboveground plant organs was 797 thaminus1 without fertile- iser The effect of the various fertiliser levels on the dry matter content of the leafy stalks was very similar to that described for the fresh mass (Tables 3 and 4)
The accumulation of fresh and dry matter in the leafy stalks of the Taacutepioacutei Sima variety is presented in Tables 5 and 6 Table 5 Fresh leafy stalk yield of the Taacutepioacutei Sima Jerusa-lem artichoke variety thaminus1 (Szarvas 12 Jun-30 Oct 2002)
Fresh leafy stalk yield thaminus1
Day of the vegetation period Treatment code
85th 115th 155th 195th 225th
Control 1634 2629 5778 5130 2937
N1 1712 2704 5642 4943 3287
N2 1797 2560 5945 3597 2481
N3 1953 2735 7130 3760 2259
N1P1 2002 2611 6124 3759 2444
N1P1K1 2096 3009 6834 5812 3617
N1P2 1937 2450 6112 5508 3864
N1K2 1961 2588 6320 4118 3287
N1P2K2 2153 3061 7336 5877 4148
N2P3 2189 2728 7838 4172 3876
N2K3 2245 2453 8026 4571 4222
N2P3K3 2178 2824 7448 4204 3357
N3P3K3 2193 2905 8025 4237 4617
LSD5 159 392 766 468 441
Mean 2003 2712 6812 4591 3415
29 40 100 67 50
Table 6 Dry matter yield of the leafy stalks of the Taacutepioacutei Sima Jerusalem artichoke variety thaminus1 (Szarvas 12 Jun- 30 Oct 2002)
Dry matter yield of the leafy stalks thaminus1
Day of the vegetation period Treatment code
85th 115th 155th 195th 225th
Control 131 490 1907 1700 969
N1 137 487 1862 1827 1084
N2 144 461 1962 1402 818
N3 156 402 2352 1466 745
N1P1 161 470 2021 1465 806
N1P1K1 168 552 2695 2148 1274
N1P2 155 441 2017 1676 863
N1K2 157 467 2086 1605 1084
N1P2K2 173 551 2347 1811 1369
N2P3 175 491 2586 1627 1279
N2K3 180 441 2912 1783 1393
N2P3K3 174 508 2458 1576 1123
N3P3K3 175 523 2602 1652 1023
LSD5 012 069 351 384 241
Mean 160 483 2292 1672 1063
7 21 100 73 46
The Taacutepioacutei Sima variety has a longer vegetation period
develops greater aboveground biomass and has some- what different growth dynamics compared with the Taacutepioacutei Korai variety Averaged over the fertilisation treatments only 30 of the total fresh leafy stalk mass was accumulated by the 85th day and this figure only increased to 40 by the 115th day The maximum fresh leafy stalk mass was recorded on the 155th day of the growing period The most dynamic growth period was between the 115th and 155th days when 41 of the total aboveground fresh mass was formed over a period of 40 days The foliage gradually began to wither from the beginning of September and 50 of the fresh leafy stalk mass could be harvested at the end of October (225th day) (Table 5)
Averaged over the fertiliser treatments the maximum quantity of leafy stalk dry matter was recorded on the 155th day Dry matter accumulation was only at the 7 and 21 level respectively on the 85th and 115th day of the vegetation period when the dry matter content of the fresh mass had reached 8 and 18 respectively The most dynamic dry matter accumulation was observed between days 115 and 155 when more than 18 t dry
Copyright copy 2013 SciRes AJPS
Biomass Accumulation and Nutrient Uptake of Jerusalem Artichoke (Helianthus tuberosus L) 1634
matter was formed per hectare in the course of 40 days equivalent to around 80 of the total dry matter At this time the dry matter content of the leafy stalks averaged 34 and this did not change substantially until the end of October (225th day) On average 46 of the maxi- mum dry matter could be harvested at the end of the growing period (Table 6)
The maximum fresh and dry matter yield of the leafy stalks of the Taacutepioacutei Sima variety amounted to around 68 and 23 thaminus1 respectively averaged over the treatments When the effect of fertilisation was examined during the period when the greatest aboveground biomass was ac- cumulated (155th day) the fresh mass of the leafy stalks was found to be 5778 thaminus1 without fertilisation Only the highest rate (300 kgha) of N fertiliser gave a signifi- cant increase in fresh mass (7130 thaminus1) compared to the control when applied alone and a similar yield (6834 thaminus1) was achieved when the 100 kghaminus1 N rate was supplemented with P and K fertiliser (N1P1K1) Further significant increases in aboveground fresh mass were recorded when the higher (200 300 kghaminus1) N rates were applied in combination with P and K fertiliser In the earlier part of the growing season (115th day) only the N1P1K1 level of fertilisation resulted in a significantly higher fresh mass than in the control while at a later stage (195th day) the highest leafy stalk mass was ob- tained in the N1P1K1 and N1P2K2 treatments The effect of the nutrient supplies on the dry matter mass of the leafy stalks was very similar to that described for the fresh mass in this case too the best fertiliser level was found to be N1P1K1 (Tables 5 and 6)
32 Tuber Yield
The tuber yield data of the two Jerusalem artichoke va- rieties are presented in Table 7
At the end of September (195th day) when the Taacutepioacutei Korai variety was harvested the tuber yield without fer- tilisation was 4043 thaminus1 When N fertiliser was applied alone the 100 kghaminus1 rate resulted in a significant yield surplus (859 thaminus1) compared to the control while the higher N rates (200 300 kghaminus1) led to a significant yield reduction compared to the 4902 thaminus1 yield achieved with 100 kghaminus1 N When this N rate was com- bined with P and K fertilisation no significant increase in yield was recorded while the 200 kghaminus1 N rate only led to a significantly higher tuber yield when supple- mented with P and K Compared with the maximum yield (6001 thaminus1 N2P3) the highest 300 kghaminus1 N rate (N3P3K3) led to a significant reduction in the tuber yield The rainfall (137 mm) during the tuber formation pe- riod of the Taacutepioacutei Sima variety (August-October) was equivalent to the long-term mean but was nevertheless unable to satisfy the water requirements of the crop in
Table 7 Tuber yield of the Taacutepioacutei Korai eacutes Taacutepioacutei Sima Jerusalem artichoke varieties thaminus1 (Szarvas 21 Aug-30 Oct 2002)
Tuber yield thaminus1
Day of the vegetation period Treatment code
155th 195th 155th 195th 225th
Taacutepioacutei Korai Taacutepioacutei Sima
Control 3083 4043 169 889 1892
N1 3352 4902 229 896 1982
N2 3812 4149 294 897 2148
N3 3357 3774 298 952 1917
N1P1 4067 4503 282 906 1851
N1P1K1 4494 4998 269 1145 1842
N1P2 3692 4139 218 611 2037
N1K2 4235 4803 194 543 1815
N1P2K2 3939 4820 271 838 2033
N2P3 5809 6001 272 1032 3074
N2K3 5186 5616 198 687 2359
N2P3K3 4915 5604 212 866 2938
N3P3K3 5260 5350 345 905 3232
LSD5 518 460 054 198 394
Mean 4246 4823 250 859 2240
88 100 11 38 100
this stage of development For this reason the tuber yield of this variety was only 46 of that achieved for Taacutepioacutei Korai averaged over the treatments Without fertilisation the tuber yield was 1892 thaminus1 at harvesting in late Oc- tober (225th day) This yield level was only significantly increased by the 200 kghaminus1 N rate when supplemented with P and K On this soil which has moderate P and good K supplies the yield-enhancing effect of P fertiliser is greater than that of K at the 200 kghaminus1 N level No further significant rise in the tuber yield was achieved at the 300 kghaminus1 N rate combined with P and K fertiliser (N3P3K3)
33 Total Biomass
The total biomass data for the two Jerusalem artichoke varieties averaged over the fertiliser treatments are pre- sented in Table 8
Both the changes in the nutrient concentrations in the various plant organs during the growing season and the quantity of nutrients absorbed also depend on the bio- mass accumulation The accumulation of fresh and dry
Copyright copy 2013 SciRes AJPS
Biomass Accumulation and Nutrient Uptake of Jerusalem Artichoke (Helianthus tuberosus L) 1635
Table 8 Biomass of the Taacutepioacutei Korai and Taacutepioacutei Sima Je-rusalem artichoke varieties during the growing season av-eraged over the fertiliser treatments thaminus1 (Szarvas 2002)
Day of the vegetation period Plant organ
85th 115th 155th 195th 225th
Taacutepioacutei Korai Fresh mass thaminus1
Leafy stalks 2001 2786 3334 749 -
Tubers - - 4246 4823 -
Total 2001 2786 7580 5572 -
Dry mass thaminus1
Leafy stalks 160 500 1097 284 -
Tubers - - 752 1058 -
Total 160 500 1849 1342 -
Taacutepioacutei Sima Fresh mass thaminus1
Leafy stalks 2003 2712 6812 4591 3415
Tubers - - 250 859 2240
Total 2003 2712 7062 5450 5655
Dry mass thaminus1
Leafy stalks 160 483 2292 1672 1063
Tubers - - 042 162 506
Total 160 483 2334 1834 1569
matter in the leafy stalks and tuber yield of the two varie-ties during the vegetation period can be seen in Table 8
The dry matter content of the leafy stalks and tubers gradually increased as the growing season progressed At sampling dates between the 85th and 195th days of the season the dry matter content of the leafy stalks of the Taacutepioacutei Korai variety amounted to 8-18-33-38 while that of the tubers was found to be 176 and 219 on the 155th and 195th days respectively In the case of Taacutepioacutei Sima the dry matter content of the leafy stalks was 8-18-34-36-31 between days 85 and 225 while that of the tubers was 168-188-225 at the three sampling dates
The maximum values of fresh and dry matter mass were recorded on the 155th day in the early maturing Taacutepioacutei Korai variety At this date 59 of the total dry matter mass (1849 thaminus1) was found in the leafy stalks and 41 in the tuber yield but the proportion shifted to 7921 in favour of the tuber yield by harvest In this variety the dynamics of dry biomass accumulation showed the following pattern on the 85th-115th-155th- 195th days of the growing season 9-27-100-73
The late maturing Taacutepioacutei Sima variety also exhibited maximum values of fresh and dry matter mass on the
155th day of the growing period At this date 98 of the total dry matter was found in the leafy stalks and only 2 in the tubers but by harvest this ratio had changed to 6832 The dynamics of total dry matter accumulation for this variety showed a pattern of 7-21-100- 79-67 on the 85th-115th-155th-195th-225th days of the vegetation period
A comparison of the two varieties revealed a substan- tial difference in the accumulation dynamics of the leafy stalk and tuber yields and in the mass ratio of the yield components
34 Nutrient Concentration
The nutrient concentrations in the leafy stalks and tubers of the Taacutepioacutei Korai Jerusalem artichoke variety are pre- sented in Tables 9 and 10
With the exception of Ca the highest nutrient concen- trations in the leafy stalks were recorded on the 85th day of the growing period (12 Jun) when 9 of the total dry matter content had formed and tuber formation had not yet begun Over the next 30 days the aboveground shoot system grew intensively resulting in dilution especially for the N P and K concentrations The reduction in the nutrient concentration was 20 for N 17 for P and 33 for K while only moderate dilution could be de- tected for the other nutrients The tuber formation of the Taacutepioacutei Korai variety began in the middle ten days of July (115th day) and the most intensive leafy stalk and tuber formation was recorded over the next 40 days (between days 115 and 155) when 73 of the total dry matter was accumulated The greatest decline in the nutrient concen- trations was observed during this growth period Table 9 Nutrient content in the leafy stalks of the Taacutepioacutei Korai Jerusalem artichoke variety during the growing sea-son (Szarvas 2002)
Nutrient content
Day of the vegetation period Units
85th 115th 155th 195th
N 299 242 109 037
P 036 030 020 015
K 496 333 191 127
Na 006 005 006 006
Ca 127 118 124 157
Mg 060 059 037 029
Cu mgkgminus1 9 8 6 5
Zn mgkgminus1 31 27 24 21
Mn mgkgminus1 48 45 37 33
Fe mgkgminus1 286 275 120 116
Copyright copy 2013 SciRes AJPS
Biomass Accumulation and Nutrient Uptake of Jerusalem Artichoke (Helianthus tuberosus L) 1636
Table 10 Nutrient content in the tubers of the Taacutepioacutei Korai and Taacutepioacutei Sima Jerusalem artichoke varieties during the gorwing season (Szarvas 2002)
Nutrient content
Day of the veegetation period Nuterient Units
155th 195th 155th 195th 225th
Taacutepioacutei Korai Taacutepioacutei Sima
N 147 166 220 205 191
P 037 037 049 044 039
K 250 209 303 263 203
Na 003 005 002 003 006
Ca 014 010 019 012 010
Mg 012 009 015 011 008
Cu mgkgminus1 14 11 17 14 10
Zn mgkgminus1 25 17 33 24 20
Mn mgkgminus1 35 26 14 13 7
Fe mgkgminus1 578 836 300 355 110
Compared with the initial concentrations (100 85th day) the concentrations in the leafy stalks dropped to 36 for N 56 for P 39 for K 62 for Mg 66 for Cu 77 for Zn and Mn and 42 for Fe Little change was ob- served in the Na concentration during the growing period while the Ca concentration was greatest at the end of the growing season The leafy stalks started withering from the end of August which was associated with a further decrease in the nutrient concentrations by harvest (Table 9)
The tuber yield of the Taacutepioacutei Korai variety was ana- lysed on days 155 and 195 The N content of the tubers was highest at harvest (166) while the P content did not change (037) and the K content dropped steeply (209) The Ca and Mg contents of the tubers were ex- emely low compared to those of the other macroelements (009 - 014) The microelement contents of the tu- bers declined up to harvesting with the exception of the Fe content which increased (Table 10)
The nutrient concentration data for the leafy stalks of the Taacutepioacutei Sima variety are presented in Table 11
On the 85th day of the growing period (12 Jun) both Jerusalem artichoke varieties had similar dry matter mass in the leafy stalks (160 thaminus1) Nevertheless the N P K and Ca contents of the Taacutepioacutei Sima variety were consid- erably lower than those of Taacutepioacutei Korai In the Taacutepioacutei Sima variety 7 of the total dry matter had accumulated by the 85th day of the vegetation period and 21 by the 115th day with no significant change in the nutrient con- centration of the leafy stalks The greatest extent of dry
Table 11 Nutrient content in the leafy stalks of the Taacutepioacutei Sima Jerusalem artichoke variety during the growing sea-son (Szarvas 2002)
Nutrient content
Day of the vegetation period Nutrient Units
85th 115th 155th 195th 225th
N 210 190 155 074 048
P 027 027 029 016 010
K 326 339 288 134 118
Na 005 007 006 007 006
Ca 092 094 082 063 064
Mg 060 068 043 043 045
Cu mgkgminus1 8 8 7 6 7
Zn mgkgminus1 29 27 30 23 26
Mn mgkgminus1 35 36 30 22 23
Fe mgkgminus1 149 182 120 96 107
matter incorporation was detected between the 115th and 155th days when 79 of the total dry matter was accu- mulated in the course of 40 days and a considerable dilu- tion of the nutrient concentrations was observed amount- ing to 26 for N 12 for K 11 for Ca and 28 for Mg Tuber formation did not begin until the second half of August in the Taacutepioacutei Sima variety and the tuber yield made up 2 of the total dry matter mass on the 155th day of the growing season The intensive period of tuber formation occurred between the 155th and 225th days when the translocation of nutrients into the tuber began accompanied by the withering and collapse of the leafy stalks This process resulted in a considerable decline in the nutrient concentration of the leafy stalks which meant that only 23 of the initial nutrient concentration (85th day) could be detected for N 37 for P 36 for K 70 for Ca 75 for Mg 66 for Mn and 72 for Fe
Changes in the nutrient contents in the tubers of the Taacutepioacutei Sima Jerusalem artichoke variety during the growing season can be seen in Table 10
The nutrient concentrations in the tubers were highest on the 155th day of the vegetation period at the begin- ning of tuber formation with the exception of Na and Fe
By harvest (225th day) the nutrient contents decreased by 13 for N 20 for P and 33 for K The contents of Ca Mg Cu Zn and Mn were 40 - 50 lower at this stage than at the start of tuber formation The tuber Fe concentration declined to the greatest extent (by almost two-thirds) while the Na content increased A compare- son of the nutrient contents in the tubers of the two varie- ties at harvest revealed that the N content was higher in
Copyright copy 2013 SciRes AJPS
Biomass Accumulation and Nutrient Uptake of Jerusalem Artichoke (Helianthus tuberosus L) 1637
the Taacutepioacutei Sima variety than in the Taacutepioacutei Korai variety while the Mn and Fe concentrations were lower No great differences were observed for the other nutrients
35 Nutrient Uptake
Data on the nutrient uptake of the Taacutepioacutei Korai Jerusalem artichoke variety are presented in Table 12 Table 12 Nutrient uptake of the Taacutepioacutei Sima Jerusalem artichoke variety during the growing season kghaminus1 (Szar-vas 2002)
Nutrient uptake kghaminus1
Day of the vegetation period Nutrient
85 115 155 195
Leafy stalks
N 48 121 120 28
P 6 15 22 4
K 79 166 210 36
Na 1 3 7 2
Ca 20 59 136 45
Mg 10 30 41 8
Cu 001 004 007 001
Zn 005 014 026 006
Mn 008 023 041 009
Fe 046 137 132 033
Tubers
N - - 110 176
P - - 28 39
K - - 188 221
Na - - 2 5
Ca - - 10 11
Mg - - 9 10
Cu - - 010 012
Zn - - 019 018
Mn - - 026 028
Fe - - 435 884
Leafy stalks + tubers
N 48 121 230 204
P 6 15 50 43
K 79 166 398 257
Na 1 3 9 7
Ca 20 59 146 56
Mg 10 30 50 18
Cu 001 004 017 013
Zn 005 014 045 024
Mn 008 023 067 037
Fe 046 137 567 917
The most intensive accumulation of the nutrients N P K Mg Ca Cu and Fe in the leafy stalks was observed between the 85th and 115th days of the growing season
The maximum incorporation of nutrients in the leafy stalks was recorded on the 155th day The most dynamic nutrient accumulation period for the tubers was between days 115 and 155 of the vegetation period after which- nutrient incorporation into the tubers became less intense The maximum nutrient uptake of the whole plant (leafy stalks + tubers) was observed on the 155th day These values were used in calculating specific nutrient uptake as this was the nutrient quantity required for yield forma- tion
The specific nutrient uptake data for the Taacutepioacutei Korai Jerusalem artichoke variety are presented in Table 13 The specific nutrient uptake required for 10 t tuber yield plus the corresponding leafy stalks was calculated on the basis of the maximum nutrient uptake and the tuber yield at harvest as 48 kg N 10 kg P 83 kg K 30 kg Ca and 10 kg Mg
The nutrient uptake of the Taacutepioacutei Sima Jerusalem ar-tichoke variety during the growing season can be seen in Table 14
The most intensive period of dry matter and nutrient accumulation in the leafy stalks was observed between the 115th and 155th days At the end of this period the dry matter mass of the leafy stalks was around 23 thaminus1 nu- trient uptake had reached a maximum and a total of 355 kg N 66 kg P 660 kg K 188 kg Ca and 99 kg Mg had been incorporated In this later maturing variety tuber formation began later in the second half of August and the greatest nutrient accumulation in the tuber yield was observed in October The maximum nutrient uptake for Table 13 Specific nutrient uptake of the Taacutepioacutei Korai and Taacutepioacutei Sima Jerusalem artichoke varieties kg 10haminus1 tuber yield + the corresponding leafy stalks (Szarvas 2002)
Specific nutrient uptake Nutrient Units
Taacutepioacutei Korai Taacutepioacutei Sima
N kgmiddot10tminus1 48 162
P kgmiddot10tminus1 10 30
K kgmiddot10tminus1 83 300
Na kgmiddot10tminus1 2 6
Ca kgmiddot10tminus1 30 84
Mg kgmiddot10tminus1 10 45
Cu gmiddot10tminus1 35 76
Zn gmiddot10tminus1 93 31
Mn gmiddot10tminus1 139 31
Fe gmiddot10tminus1 1175 1285
Copyright copy 2013 SciRes AJPS
Biomass Accumulation and Nutrient Uptake of Jerusalem Artichoke (Helianthus tuberosus L) 1638
Table 14 Nutrient uptake of the Taacutepioacutei Sima Jerusalem artichoke variety during the growing season kghaminus1 (Szar-vas 2002)
Nutrient uptake kghaminus1
Day of the vegetation period Nutrient
85th 115th 155th 195th 225th
Leafy stalks
N 34 92 355 124 51
P 4 13 66 27 11
K 52 164 660 224 125
Na 1 3 14 12 6
Ca 15 45 188 105 68
Mg 10 33 99 72 48
Cu 001 004 016 010 007
Zn 005 013 069 038 028
Mn 006 017 069 037 024
Fe 024 088 275 160 014
Tubers
N - - 9 33 97
P - - 2 7 20
K - - 13 43 103
Na - - 008 1 3
Ca - - 079 2 3
Mg - - 063 2 4
Cu - - 001 002 005
Zn - - 001 004 010
Mn - - 001 002 004
Fe - - 013 058 056
Leafy stalks + tubers
N 34 92 364 157 148
P 4 13 68 34 31
K 52 164 673 267 228
Na 1 3 14 13 9
Ca 15 45 189 107 73
Mg 10 33 100 74 52
Cu 001 004 017 012 012
Zn 005 013 070 042 038
Mn 006 017 070 039 028
Fe 024 088 288 218 170
the whole plant (leafy stalks + tubers) was recorded on the 155th day of the growing period and was almost equivalent to the quantity of nutrients incorporated into the leafy stalks as tuber formation had only just begun By the end of the growing period (225th day) 40 of the maximum nutrient uptake could be detected for N 45 for P 34 for K 39 for Ca and 52 for Mg
The maximum quantity of nutrients absorbed and the tuber yield at harvest (224 thaminus1) were used to calculate the specific nutrient uptake In the case of the Taacutepioacutei Sima variety the specific nutrient uptake for 10 t tuber yield plus the corresponding leafy stalks amounted to 162 kg N 30 kg P 300 kg K 84 kg Ca and 45 kg Mg
A comparison of the two varieties shows that the spe- cific three times that of the Taacutepioacutei Korai variety (Table 12) This could be explained by the fact that the leafy stalk yield of Taacutepioacutei Sima was twice that of Taacutepioacutei Korai while the tuber yield was only half as great There was thus a substantial difference in the proportion of the maximum dry matter mass in the tuber yield and the leafy stalks which was 11 for Taacutepioacutei Korai and 145 for Taacutepioacutei Sima
4 Conclusions
Substantial differences could be observed between the dynamics of growth biomass accumulation and tuber formation in the early maturing Jerusalem artichoke vari- ety Taacutepioacutei Korai and the late maturing variety Taacutepioacutei Sima The most intensive period of main stalk growth was between the 85th and 115th days for Taacutepioacutei Korai and between the 115th and 155th days for Taacutepioacutei Sima
Averaged over the fertiliser treatments the maximum total biomass of both varieties was recorded on the 155th day but there were considerable differences in the share of the leafy stalks and tubers in the total biomass At this stage the tuber yield made up 56 of the biomass in Taacutepioacutei Korai and 4 in Taacutepioacutei Sima This ratio rose to 87 and 40 respectively by harvest The ratio of tu- bers to leafy stalks in the maximum dry matter mass was 11 for Taacutepioacutei Korai and 145 for Taacutepioacutei Sima
During the period when the maximum aboveground biomass was formed 100 kghaminus1 rates of N and P fertile- iser resulted in the greatest leafy stalk yield (3834 thaminus1) for Taacutepioacutei Korai In the case of Taacutepioacutei Sima which pro- duced a substantially greater leafy stalk mass the highest quantity of aboveground biomass (78 - 80 thaminus1) was obtained with the 200 kghaminus1 N rate supplemented with P and K fertiliser
The excessive (300 kghaminus1) N rate without P or K led to a decrease in the tuber yield of Taacutepioacutei Korai The highest tuber yield for both varieties was achieved with 200 kghaminus1 N supplemented with P and K fertiliser
The highest nutrient concentration in the leafy stalks was recorded on the 85th day of the growing season prior
Copyright copy 2013 SciRes AJPS
Biomass Accumulation and Nutrient Uptake of Jerusalem Artichoke (Helianthus tuberosus L) 1639
to intensive dry matter accumulation in the stalks and before tuber formation began The greatest reduction in the nutrient content of the leafy stalks was observed dur- ing tuber formation
Maximum nutrient uptake was recorded for both va- rieties on the 155th day when 230 kg N 50 kg P 398 kg K 146 kg Ca and 50 kg Mg had been incorporated into the total dry matter (1849 thaminus1) of Taacutepioacutei Korai and 364 kg N 68 kg P 673 kg K 189 kg Ca and 100 kg Mg into that of Taacutepioacutei Sima (2334 thaminus1)
Great differences were observed in the specific nutria- ent uptake of the two varieties as there was a substantial deviation in the ratio of the tubers and leafy stalks in the maximum dry matter mass The specific nutrient uptake required for 10 t tuber yield plus the corresponding leafy stalks was 48 kg N 10 kg P 83 kg K 30 kg Ca and 10 kg Mg for Taacutepioacutei Korai and 162 kg N 30 kg P 300 kg K 84 kg Ca and 45 kg Mg for Taacutepioacutei Sima
REFERENCES [1] I Angeli J Barta and L Molnaacuter ldquoA Gyoacutegyiacutetoacute Csic-
soacutekardquo Mezőgazda Kiadoacute Budapest 2000
[2] E Laacuteszloacute and I Reacuteczey ldquoMeguacutejuloacute Nyersanyagok nem Eacutelelmiszeripari Felhasznaacutelaacutesardquo NF-2000 Magyarorszaacuteg Informaacutecioacute Szolgaacuteltatoacute Rendszer Budapest 2000
[3] Z Izsaacuteki ldquoCsicsoacutekardquo In J Antal Ed Noumlveacutenytermesz- teacutestan Mezőgazda Kiadoacute Budapest 2005 pp 93-102
[4] J Barta and G Paacutetkai ldquoChemical Composition and Stor- ability of Jerusalem Artichoke Tubersrdquo Acta Alimentaria Vol 36 No 2 2007 pp 257-267 doi101556AAlim362007213
[5] J Stanley F Kays and Stephen ldquoBiology and Chemistry of Jerusalem Artichokerdquo CRC Press Nottingham 2007
[6] W Pimsaen S Joglay B Suriharn T Kesmala V Pen- suk and A Patanothai ldquoGenotype by Environment (G times E) Interactions for Yield Components of Jerusalem Arti- choke (Helianthus tuberosus L)rdquo Asian Journal of Plant Sciences Vol 9 No 1 2010 pp 11-19 doi103923ajps20101119
[7] D G Dorell and B B Chubey ldquoIrrigation Fertilizer Harvest Dates and Storage on the Reducing and Fructose Concentrations of Jerusalem Artichoke Tubersrdquo Cana- dian Journal of Plant Science Vol 57 No 2 1977 pp 591-596 doi104141cjps77-084
[8] P Denoroy ldquoThe Crop Physiology of Helianthus tube- rosus (L) a Model Oriented Viewrdquo Biomass Bioenerg Vol 11 No 1 1996 pp 11-32 doi1010160961-9534(96)00006-2
[9] W J Mclaurin Z C Somda and S J Kays ldquoJerusalem Artichoke Growth Development and Field Storage I Numerical Assessment of Plant Part Development and Dry Matter Acquisition and Allocationrdquo Journal of Plant Nutrition Vol 22 No 8 1999 pp 1303-1313 doi10108001904169909365714
[10] E Raso ldquoJerusalem Artichoke Effect of Nitrogen-Po-
tassium Fertilizingrdquo Terra e Sole Vol 45 No 575-576 1990 pp 431-433
[11] G Soja G Dersch and W Praznick ldquoHarvest Dates Fertilizer and Varietal Effect on Yield Concentration and Molecular Distribution of Fructan in Jerusalem Artichoke (Helianthus tuberosus L)rdquo Journal of Agronomy and Crop Science Vol 165 No 2 1990 pp 181-189 doi101111j1439-037X1990tb00849x
[12] G Soja and E Haunold ldquoLeaf Gas Exchange and Tuber Yield in Jerusalem Artichoke (Helianthus tuberosus L) Cultivarsrdquo Field Crop Research Vol 26 No 3 1991 pp 241-252 doi1010160378-4290(91)90002-D
[13] B Sawicka ldquoChanges in chemical composition of Heli- anthus tuberosus L under Differentiated Nitrogen Fer- tilizationrdquo Zeszyty Problemove Postepow Nauk Rolnic- zych No 484 2002 pp 573-579
[14] M A Rodrigues L Sousa J E Cabanas and M Arrobas ldquoTuber Yield and Leaf Mineral Composition of Jerusalem Artichoke (Helianthus tuberosus L) Grown under Dif- ferent Cropping Practicesrdquo Spanish Journal of Agricul- tural Research Vol 5 No 4 2007 pp 545-553
[15] K Gao T Zhu and G Han ldquoWater and Nitrogen Interac- tively Increased the Biomass Production of Jerusalem Ar- tichoke (Helianthus tuberosus L) in Semi Arid Areardquo African Journal of Biotechnology Vol 10 No 34 2011 pp 6466-6472
[16] G J Seiler and L G Campbell ldquoGenetic Variability for Mineral Element Concentrations of Wild Jerusalem Arti- choke Foragerdquo Crop Science Vol 44 No 1 2004 pp 289-292
[17] G J Seiler and L G Campbell ldquoGenetic Variability for Mineral Concentration in the Forage of Jerusalem Arti- choke Cultivarsrdquo Euphytica Vol 150 No 1-2 2006 pp 281-288 doi101007s10681-006-9119-2
[18] S Terzic M Zoric J Atlagic I Maksimovic T Zerem-ski and B Dedic ldquoClassification of Jerusalem Artichoke Accessions by Linear Discriminant Analysis of Mineral Concentration in Tubers and Leavesrdquo Helia Vol 34 No 55 2011 pp 83-90 doi102298HEL1155083T
[19] H Danilcenko E Jariene M Gajewski J Cerniauskiene J Kulaitiene B Sawicka and P Aleknaviciene ldquoAccu- mulation of Elements in Some Organically Grown Alter- native Horticultural Crops in Lithuaniardquo Hortorum Cul- tusmdashActa Scientiarum Polonorum Vol 10 No 2 2011 pp 23-31
[20] E CieslikrdquoMineral Content of Jerusalem Artichoke New Tubersrdquo Zeszyty Naukowe Akademii Rolniczej Vol 342 No 10 1998 pp 23-30
[21] V Tamas D Belala F Ionescu M Popescu and M Neagu ldquoResearch for Obtaining from Affordable Natural Mineral Sources Agreed to Replace Some Synthetic Animal Feed Additivesrdquo Lucrari Stiintifice Seria Agronomie Vol 52 2009 pp 75-79
[22] S Terzic and J Atlagic ldquoNitrogen and Sugar Content Variability in Tubers of Jerusalem Artichoke (Helianthus tuberosus L)rdquo Genetika Vol 41 No 3 2009 pp 289- 295 doi102298GENSR0903289T
[23] X Y Ma L H Zhang H B Shao G Xu F Zhang F T
Copyright copy 2013 SciRes AJPS
Biomass Accumulation and Nutrient Uptake of Jerusalem Artichoke (Helianthus tuberosus L)
Copyright copy 2013 SciRes AJPS
1640
Ni and M Brestic ldquoJerusalem Artichoke (Helianthus tu- berosus L) a Medical Salt-Resistant Plant Has High Adaptability and Multiple-Use Valuesrdquo Journal of Medi- cal Plants Research Vol 5 No 8 2011 pp 1272-1279
[24] M Harmankaya F A Juhaimi and M M Oumlzcan ldquoMin- eral Contents of Jerusalem Artichoke (Helianthus tube- rosus L) Growing Wild in Turkeyrdquo Analytical Letters Vol 45 No 15 2012 pp 2269-2275 doi101080000327192012686131
[25] G Neacutemeth and Z Izsaacuteki ldquoMacro- and Micro-Element Content and Uptake of Jerusalem Artichoke (Helianthus tuberosus L)rdquo Cereal Research Communications Vol 34 No 1 2006 pp 597-600 doi101556CRC3420061149
[26] M A Rodrigues L Sousa J E Cabanas and M Arrobas ldquoTuber Yield and Leaf Mineral Composition of Jerusalem
Artichoke (Helianthus tuberosus L) Grown under Dif- ferent Cropping Practicesrdquo Spanish Journal of Agricul- tural Research Vol 5 No 4 2007 pp 545-553
[27] Z C Somda Z C McLaurin and S J Kays ldquoJerusalem Artichoke Growth Development and Field Storage II Carbon and Nutrient Element Allocation and Redistribu- tionrdquo Journal of Plant Nutrition Vol 22 No 8 2008 pp 1315-1334 doi10108001904169909365715
[28] MEacuteM NAK ldquoA TVG Taacutepanyagvizsgaacuteloacute Laboratoacuterium Moacutedszerkoumlnyverdquo MEacuteM Noumlveacutenyveacutedelmi eacutes Agrokeacutemiai Koumlzpont Budapest 1978
[29] MEacuteM NAK ldquoMűtraacutegyaacutezaacutesi Iraacutenyelvek eacutes Uumlzemi Moacuteds- zerrdquo MEacuteM Noumlveacutenyveacutedelmi eacutes Agrokeacutemiai Koumlzpont Bu- dapest 1979
[30] J Svaacuteb ldquoBiometrical Methods in Research Workrdquo Me- zőgazdasaacutegi Kiadoacute Budapest 1981
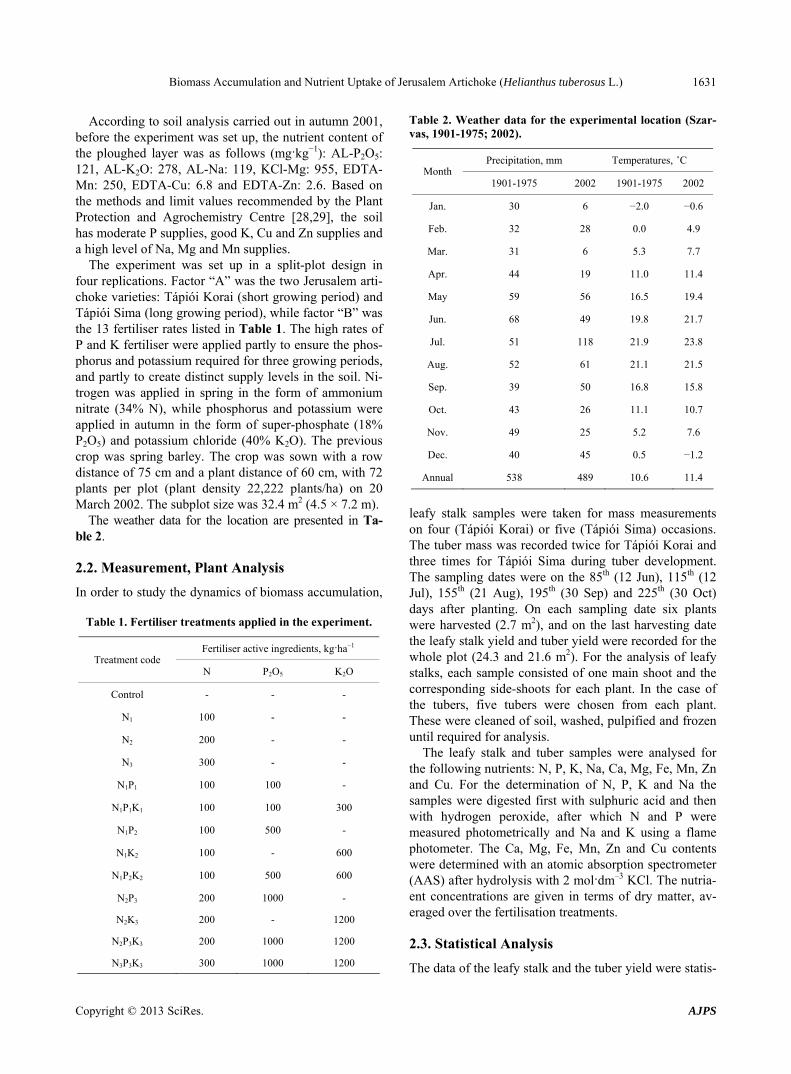
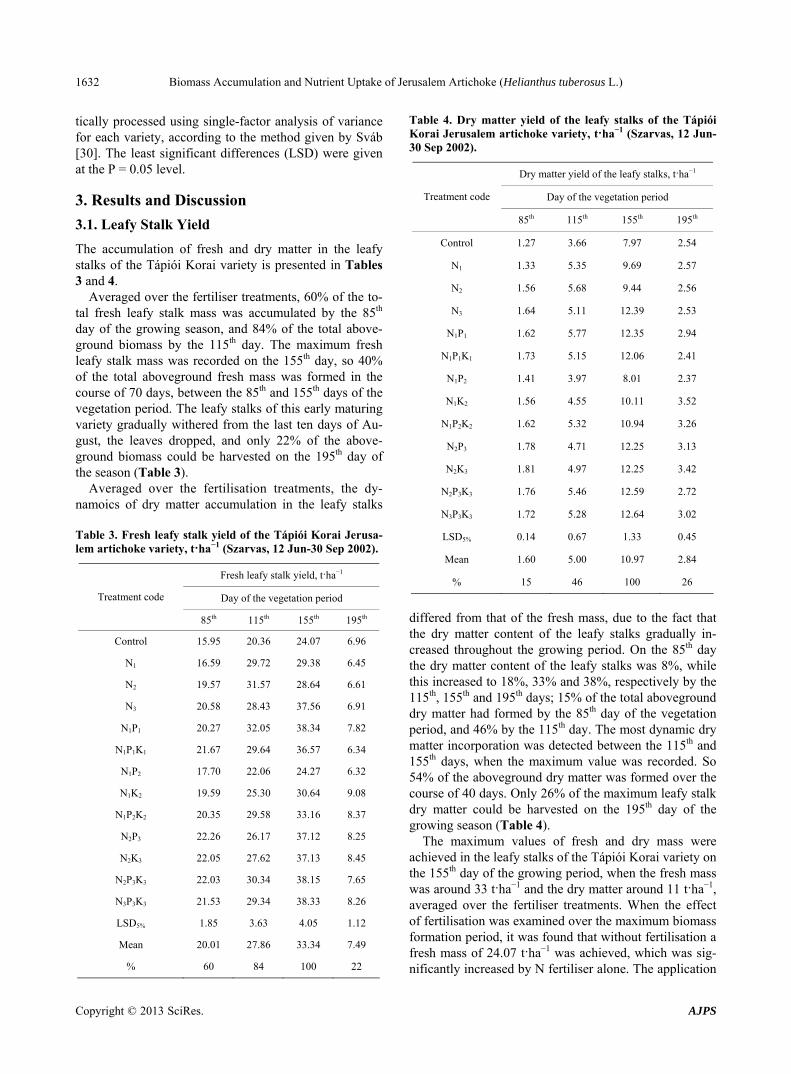
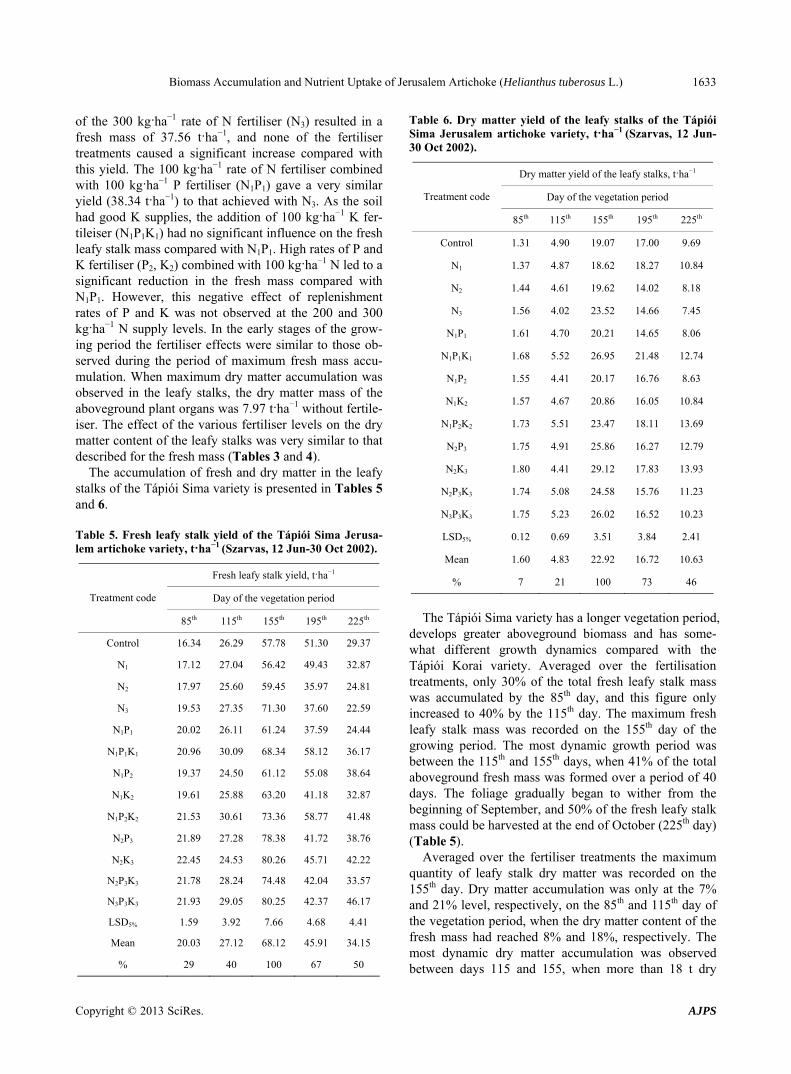
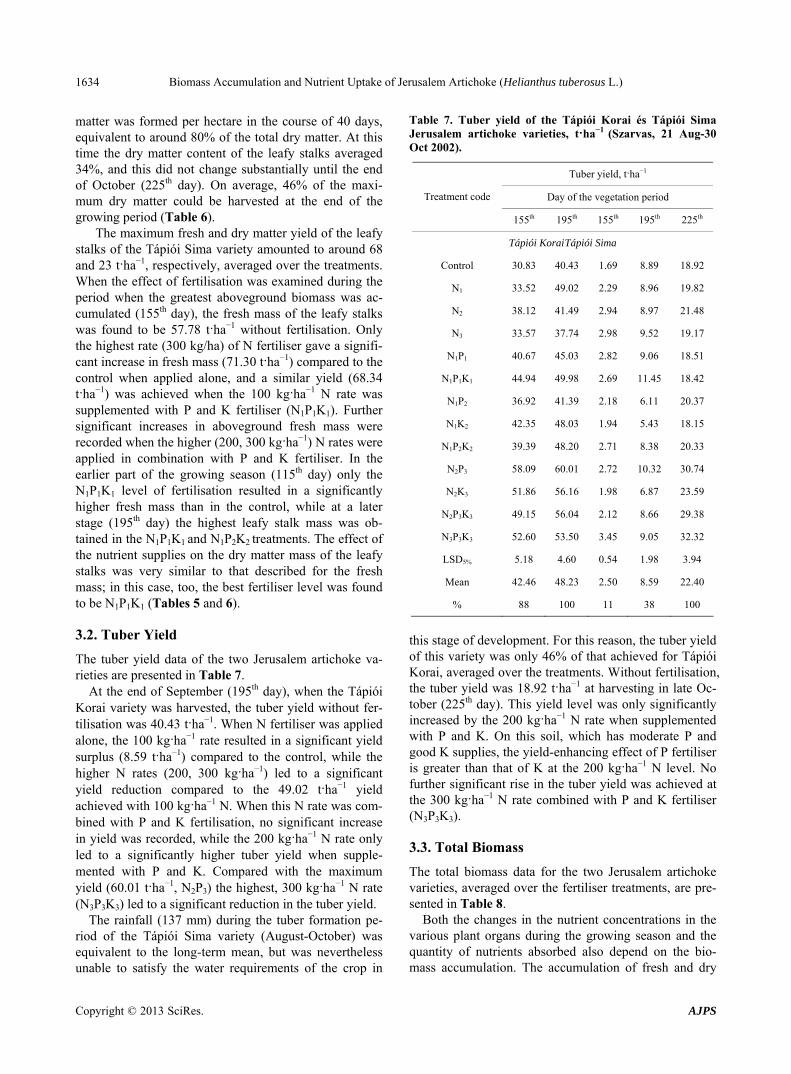
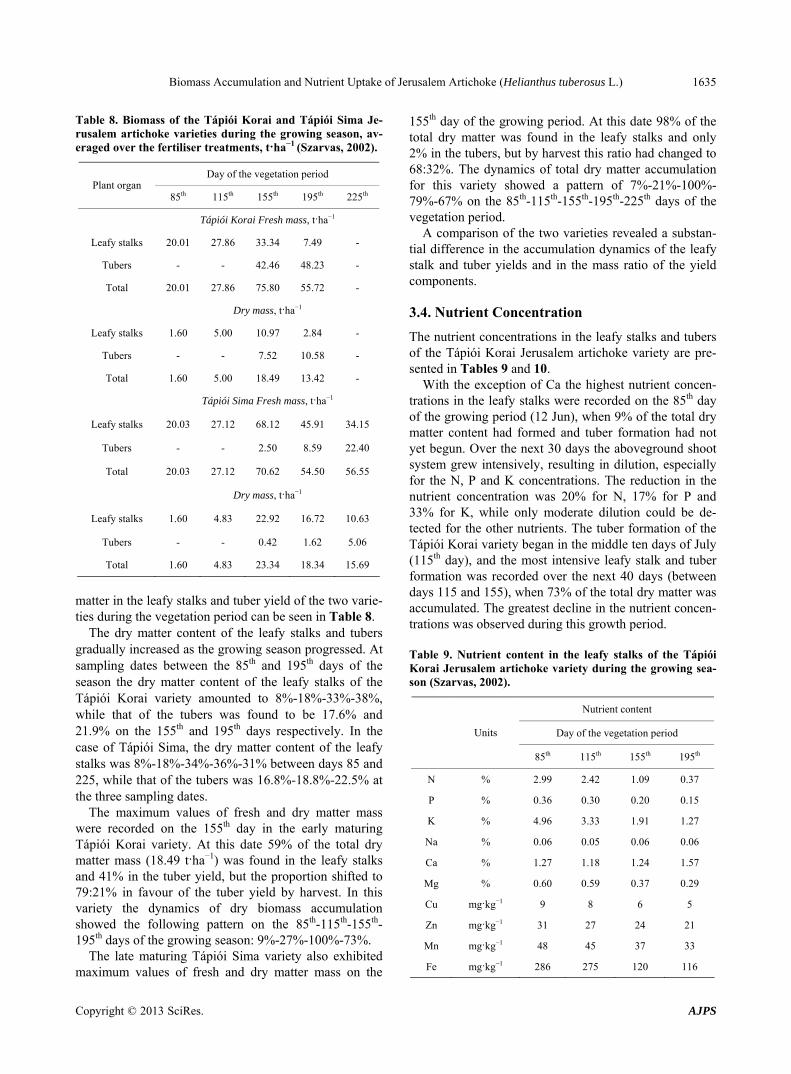
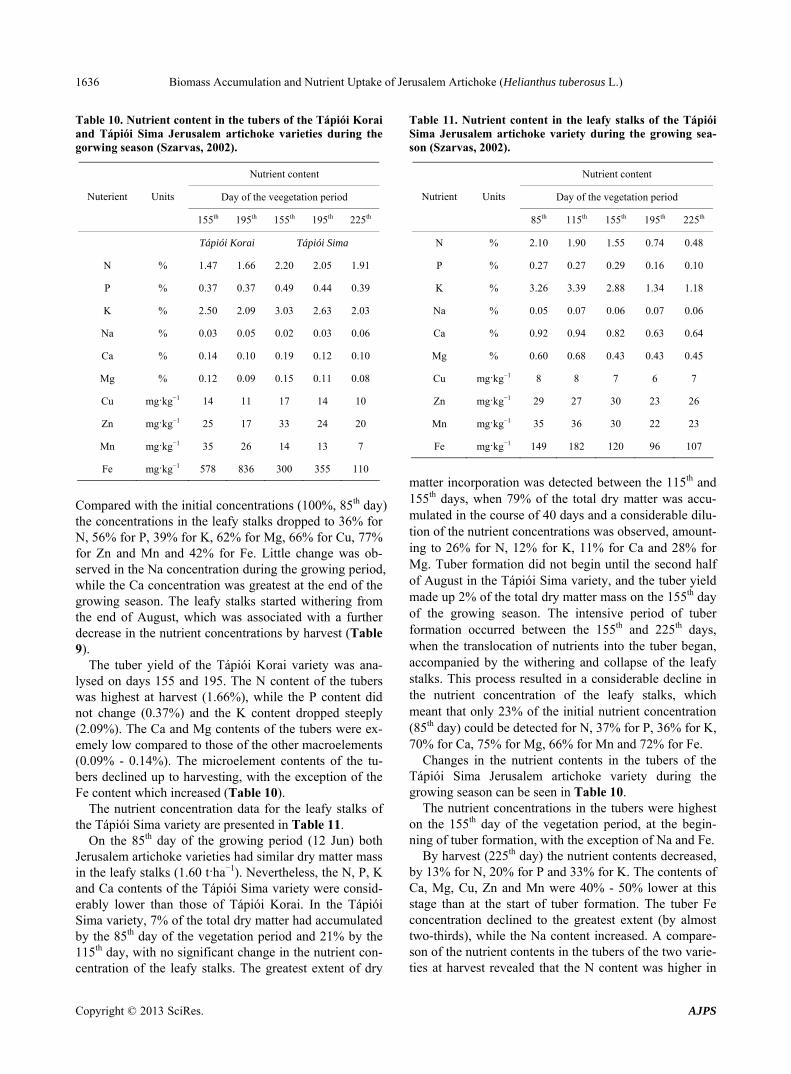
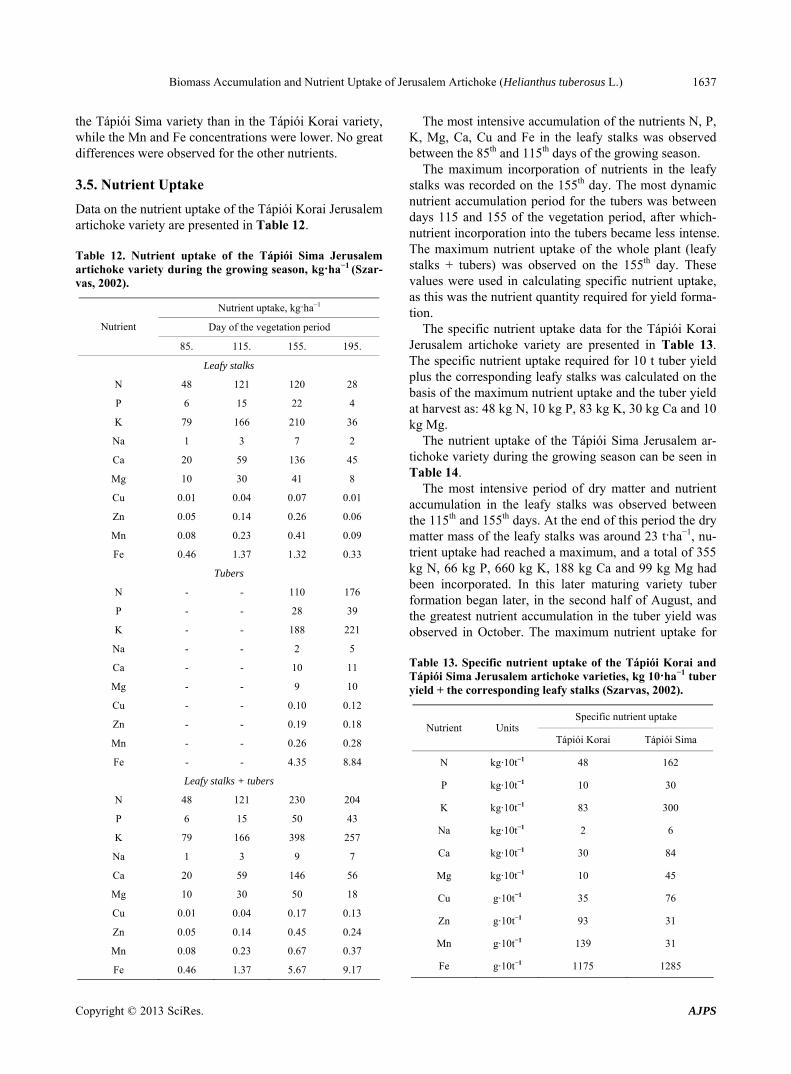
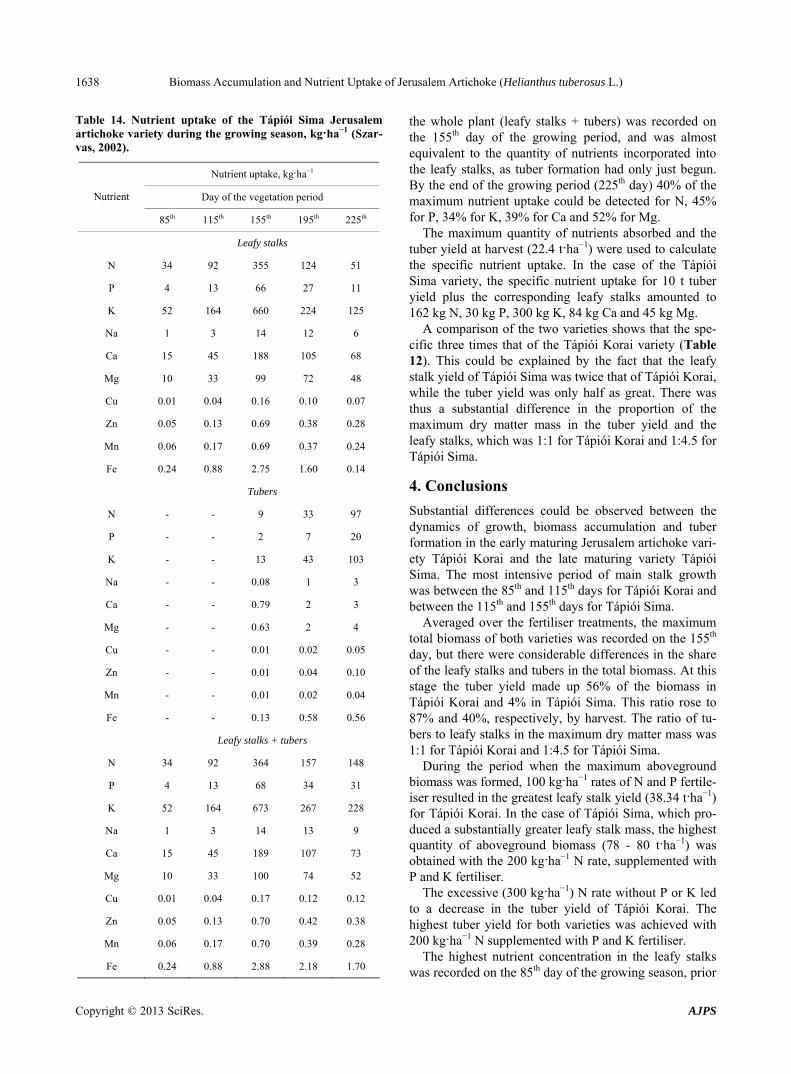