Embed Size (px)
Citation preview
BIOMASS FUEL SUPPLY STUDY (Rajasthan)
for
Rajasthan Renewable Energy Corporation Limited
E-166, Yudhishtir Marg, C-Scheme
Jaipur-302005, Rajasthan.
Ph: 0141-2225859, Fax: 0141-2226028
www.rrecl.com
Prepared by
ABI ENERGY CONSULTANCY SERVICES PRIVATE LIMITED
Sreenivi, No 22, Subramaniyanagar Second Street,
Rengarajapuram, Kodambakkam, Chennai-24
Ph: 044-6538 3966, Fax: 044-2480 2416
www.abienergy.com
May 2015
CONTENTS Study Area – Map . . . . . . . . . . . . . . . . . . . . . . . . . . . . . . . . . . . . . . . . . . . . . . . . . . . . . . . . . . . . . . . . . . . . . . . . . . . . . . . . . . . i
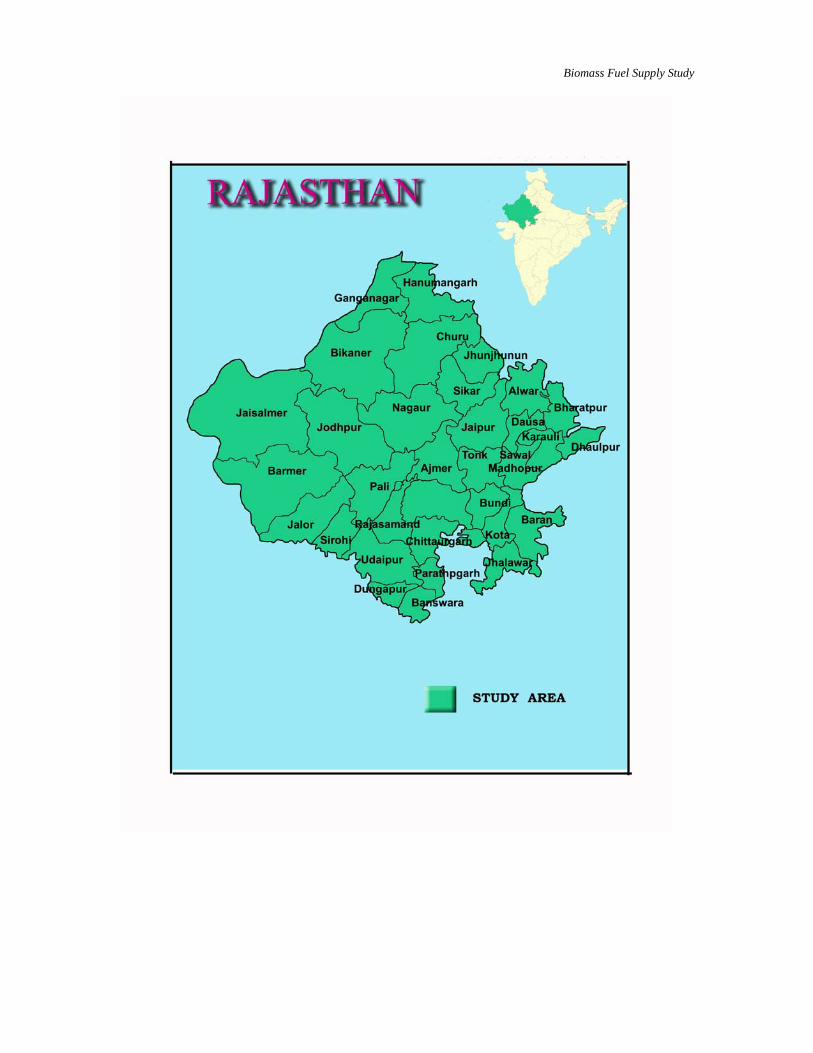
Study Area –A Glance . . . . . . . . . . . . . . . . . . . . . . . . . . . . . . . . . . . . . . . . . . . . . . . . . . . . . . . . . . . . . . . . . . . . . . . . . . . . i i
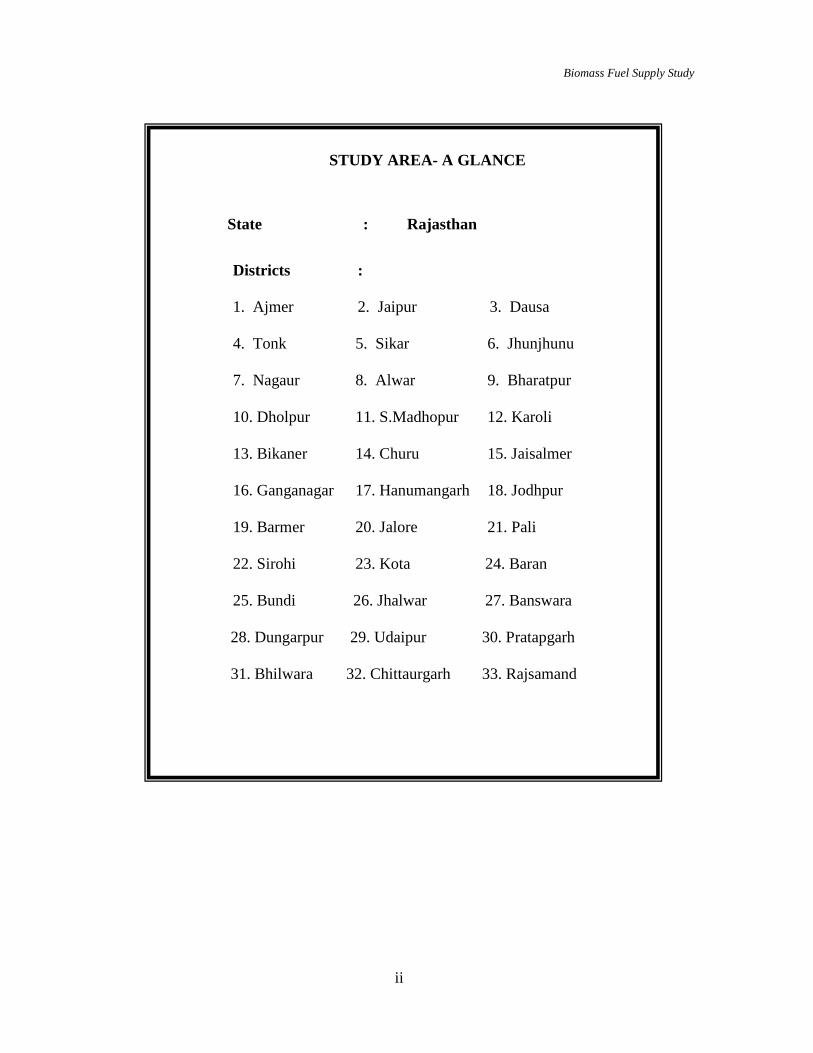
Biomass Power Plant –Map . . . . . . . . . . . . . . . . . . . . . . . . . . . . . . . . . . . . . . . . . . . . . . . . . . . . . . . . . . . . . . . . . . . . i i i
Major Biomass in Rajasthan . . . . . . . . . . . . . . . . . . . . . . . . . . . . . . . . . . . . . . . . . . . . . . . . . . . . . . . . . . . . . . . . . . . . iv
Major Biomass Details (Mustard Stalks & Husk) - A Glance . . . . . . . . . . . . . . . . . . . . . . . v
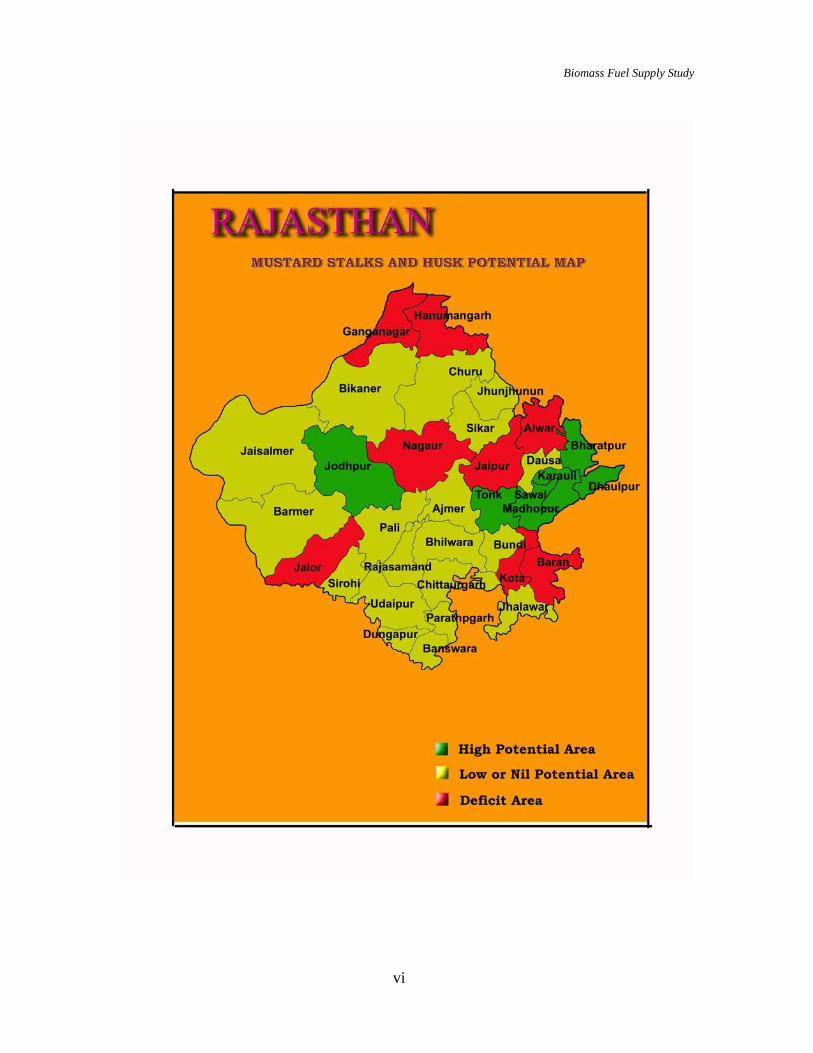
Mustard Stalks & Husk Potential-Map . . . . . . . . . . . . . . . . . . . . . . . . . . . . . . . . . . . . . . . . . . . . . . . . . . . . . vi
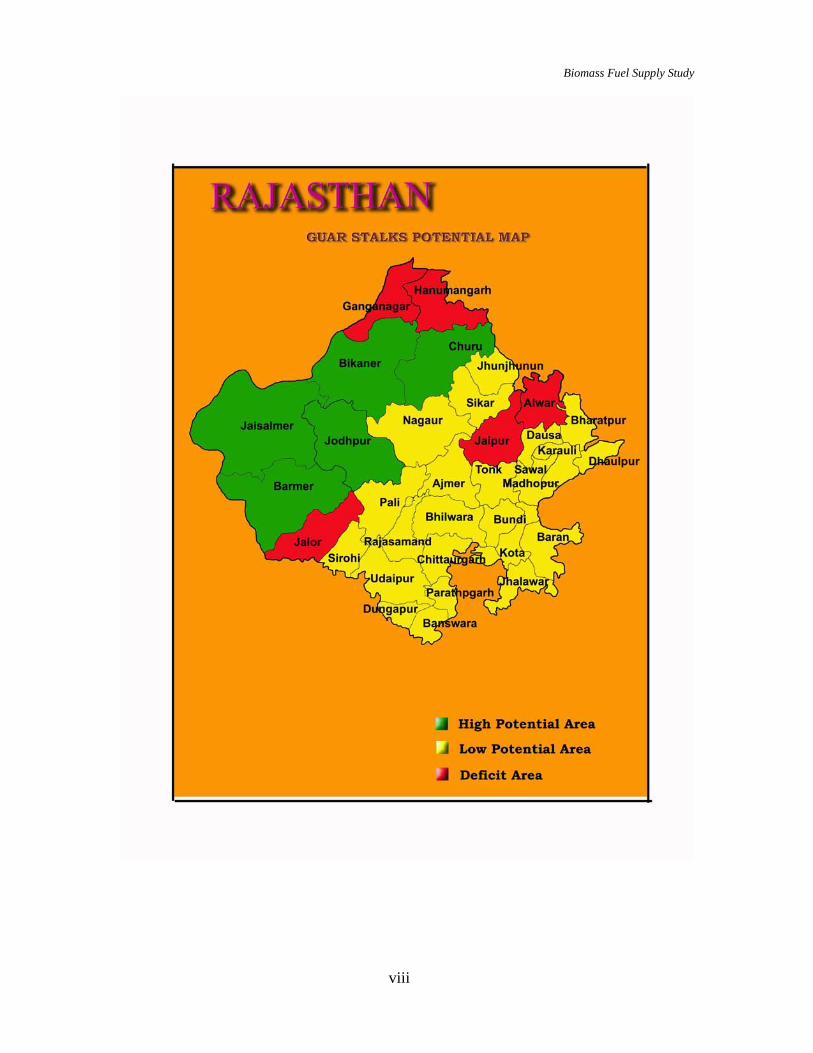
Major Biomass Details (Guar Stalks) - A Glance . . . . . . . . . . . . . . . . . . . . . . . . . . . . . . . . . . . . . . vii
Guar Stalks Potential-Map .. . . . . . . . . . . . . . . . . . . . . . . . . . . . . . . . . . . . . . . . . . . . . . . . . . . . . . . . . . . . . . . . . . . viii
Major Biomass Details (Prosopis Juliflora Wood) - A Glance . . . . . . . . . . . . . . . . . . . . . ix
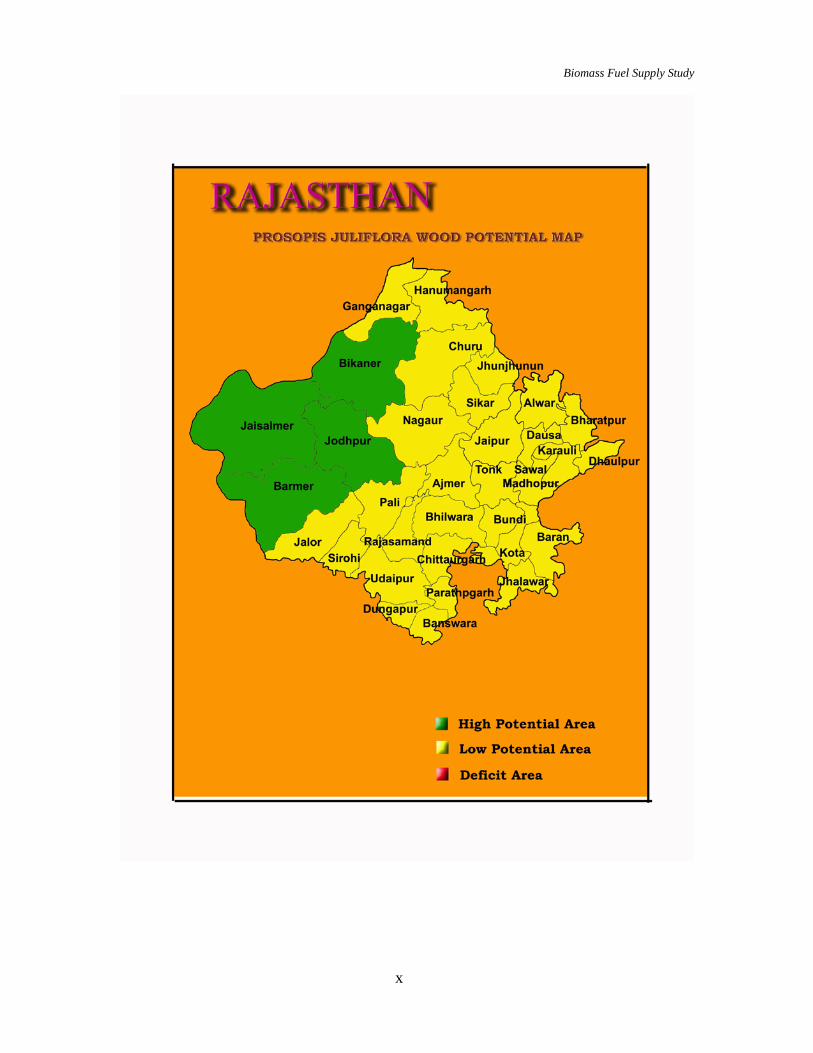
Prosopis Juliflora Wood Potential-Map .. . . . . . . . . . . . . . . . . . . . . . . . . . . . . . . . . . . . . . . . . . . . . . . . . . . . x
Major Biomass Details (Cotton Stalks) - A Glance . . . . . . . . . . . . . . . . . . . . . . . . . . . . . . . . . . . . xi
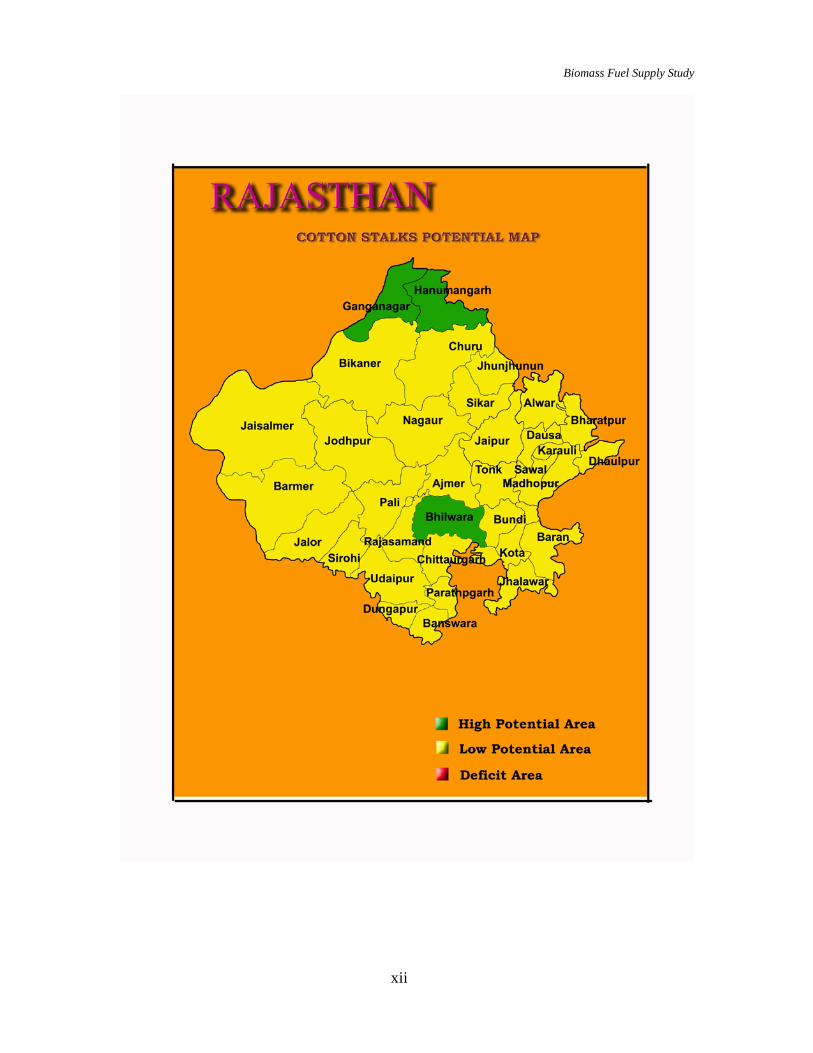
Cotton Stalks Potential-Map .. . . . . . . . . . . . . . . . . . . . . . . . . . . . . . . . . . . . . . . . . . . . . . . . . . . . . . . . . . . . . . . . . xii
Chapter 1 INTRODUCTION
1.0 Introduction ....................................................................... 1
1.1 Background of the Study ..................................................... 1
1.2 Objective of the Study ........................................................ 2
Chapter 2 METHODOLOGY ADOPTED
2.0 Introduction ....................................................................... 3
2.1 Data Sheet Development ..................................................... 3
2.2 Primary Data Collection ..................................................... 3
2.3 Secondary Data Collection .................................................. 4
2.4 Field Survey & Data Collection .......................................... 4
Chapter 3 BIOMASS FROM AGRICULTURE LAND
3.0 Introduction ....................................................................... 7
3.1 Biomass Generation ........................................................... 7
3.2 Biomass Consumption and Surplus ................................... 10
Chapter 4 BIOMASS FROM WASTE LAND
4.0 Introduction ..................................................................... 13
4.1 Prosopis Juliflora .......................................................... 13
4.2 Prosopis Juliflora Generation Consumption and Surplus ... 15
4.3 Energy Plantation ........................................................... 17
Chapter 5 MAJOR BIOMASS IN THE STUDY AREA
5.0. Introduction ..................................................................... 20
5.1 Selection of Suitable Biomass for Plant ............................. 21
5.2 Mustard Stalks & Husk…………………………………….… 21
5.3 Guar Stalks ...................................................................... 24
5.4 Castor Stem .................................................................. 26
5.5 Ground Nut Stalks ......................................................... 29
5.6 Gram Stalks .................................................................. 31
5.7 Cotton Stalks ................................................................ 33
5.8 Soyabean Stalks ............................................................ 36
Chapter 6 BIOMASS PRICE TRENDS & FORECAST ANALYSIS
6.0. Introduction ..................................................................... 39
6.1 Mustard Stalks & Husk Price Trend ................................... 39
6.2 Guar Stalks Price Trend ...…………………………………… 43
6.3 Prosopis Juliflora Wood Price Trend ................................ 46
6.4 Cotton Stalks Price Trend .............................................. 50
6.5 Biomass Power Plant Fuel Mix ....................................... 53
Chapter 7 BIOMASS STACKING & FEEDING COST
7.0. Introduction ..................................................................... 59
7.1 Stacking & Covering Cost ................................................. 59
7.2 Biomass Storage Losses……………………………………… 60
Chapter 8 CALORIFIC VALUE OF MAJOR BIOMASS
8.0. Introduction ..................................................................... 61
8.1 Calorific Value of Mustard Stalks and Husk ....................... 61
8.2 Calorific Value of Major Biomass………………...………… 64
Chapter 9 BIOMASS POWER PLANTS IN RAJASTHAN
9.0 Introduction ..................................................................... 65
9.1 Sathyam Green Power Pvt Ltd ........................................... 66
9.2 Transtech Green Power Pvt Ltd ........................................... 71
9.3 S M Environmental Technologies Pvt Ltd .......................... 77
9.4 Kalpataru Power Transmission Ltd-Ganganagar .................... 82
9.5 Kalpataru Power Transmission Ltd-Tonk ............................. 89
9.6 Sanjog Sugars & Eco Power Pvt Ltd. ................................... 95
9.7 Orient Green Power Company (Rajasthan) Pvt Ltd .............. 100
9.8 Surya Chamball Power Ltd ............................................... 104
Chapter 10 CONCLUSIONS
10.0 Conclusions ................................................................... 111
Biomass Fuel Supply Study
Biomass Fuel Supply Study
ii
STUDY AREA- A GLANCE
State : Rajasthan
Districts :
1. Ajmer 2. Jaipur
3. Dausa
4. Tonk 5. Sikar 6. Jhunjhunu 7. Nagaur 8. Alwar 9. Bharatpur 10. Dholpur 11. S.Madhopur
12. Karoli
13. Bikaner 14. Churu
15. Jaisalmer
16. Ganganagar 17. Hanumangarh
18. Jodhpur
19. Barmer 20. Jalore
21. Pali
22. Sirohi 23. Kota
24. Baran
25. Bundi
26. Jhalwar
27. Banswara
28. Dungarpur 29. Udaipur 30. Pratapgarh 31. Bhilwara 32. Chittaurgarh 33. Rajsamand
Biomass Fuel Supply Study
iii
Biomass Fuel Supply Study
iv
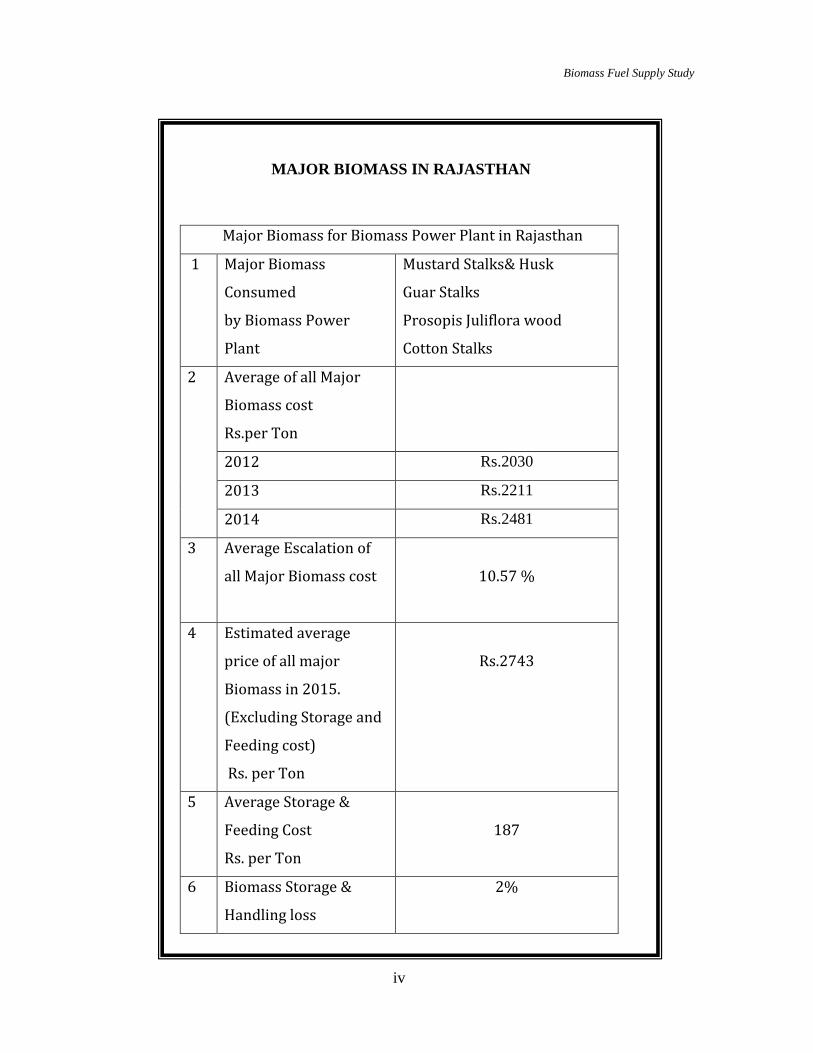
MAJOR BIOMASS IN RAJASTHAN
Major Biomass for Biomass Power Plant in Rajasthan
1 Major Biomass
Consumed
by Biomass Power
Plant
Mustard Stalks& Husk
Guar Stalks
Prosopis Juliflora wood
Cotton Stalks
2 Average of all Major
Biomass cost
Rs.per Ton
2012 Rs.2030
2013 Rs.2211
2014 Rs.2481
3 Average Escalation of
all Major Biomass cost
10.57 %
4 Estimated average
price of all major
Biomass in 2015.
(Excluding Storage and
Feeding cost)
Rs. per Ton
Rs.2743
5 Average Storage &
Feeding Cost
Rs. per Ton
187
6 Biomass Storage &
Handling loss
2%
Biomass Fuel Supply Study
v
Details
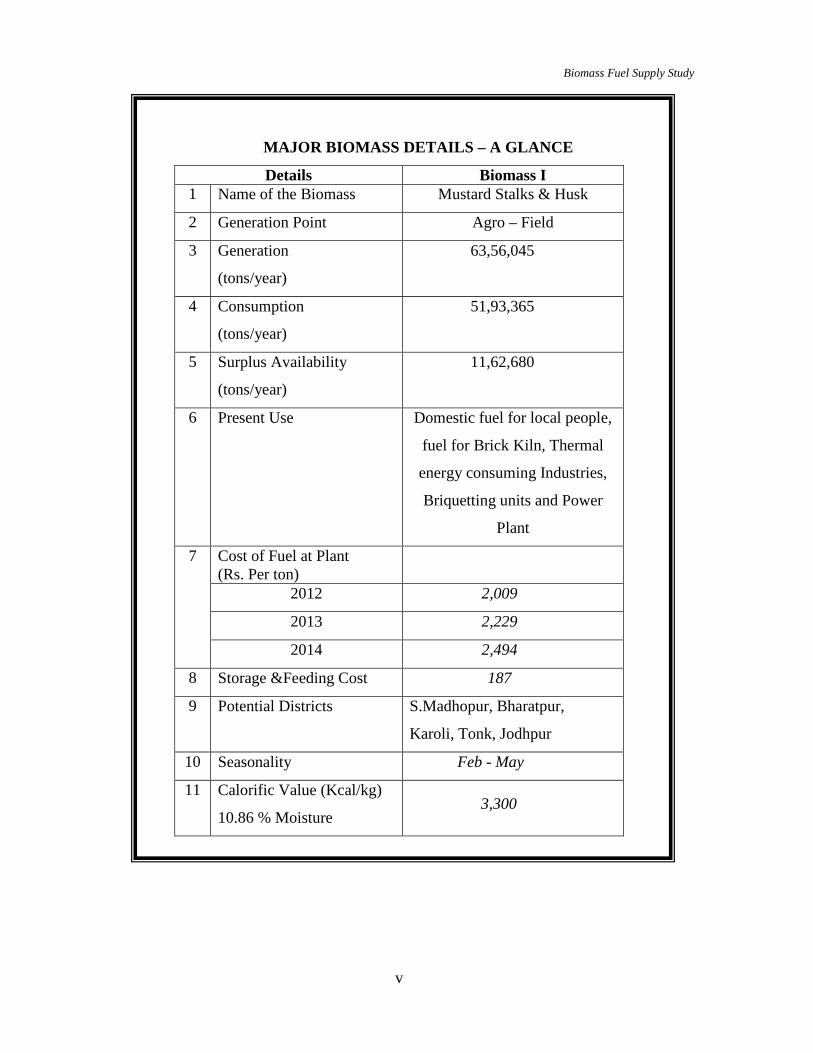
MAJOR BIOMASS DETAILS – A GLANCE
Biomass I 1 Name of the Biomass Mustard Stalks & Husk
2 Generation Point Agro – Field
3 Generation
(tons/year)
63,56,045
4 Consumption
(tons/year)
51,93,365
5 Surplus Availability
(tons/year)
11,62,680
6 Present Use Domestic fuel for local people,
fuel for Brick Kiln, Thermal
energy consuming Industries,
Briquetting units and Power
Plant
7 Cost of Fuel at Plant (Rs. Per ton)
2012 2,009
2013 2,229
2014 2,494
8 Storage &Feeding Cost 187
9 Potential Districts S.Madhopur, Bharatpur,
Karoli, Tonk, Jodhpur
10 Seasonality Feb - May
11 Calorific Value (Kcal/kg)
10.86 % Moisture 3,300
Biomass Fuel Supply Study
vi
Biomass Fuel Supply Study
vii
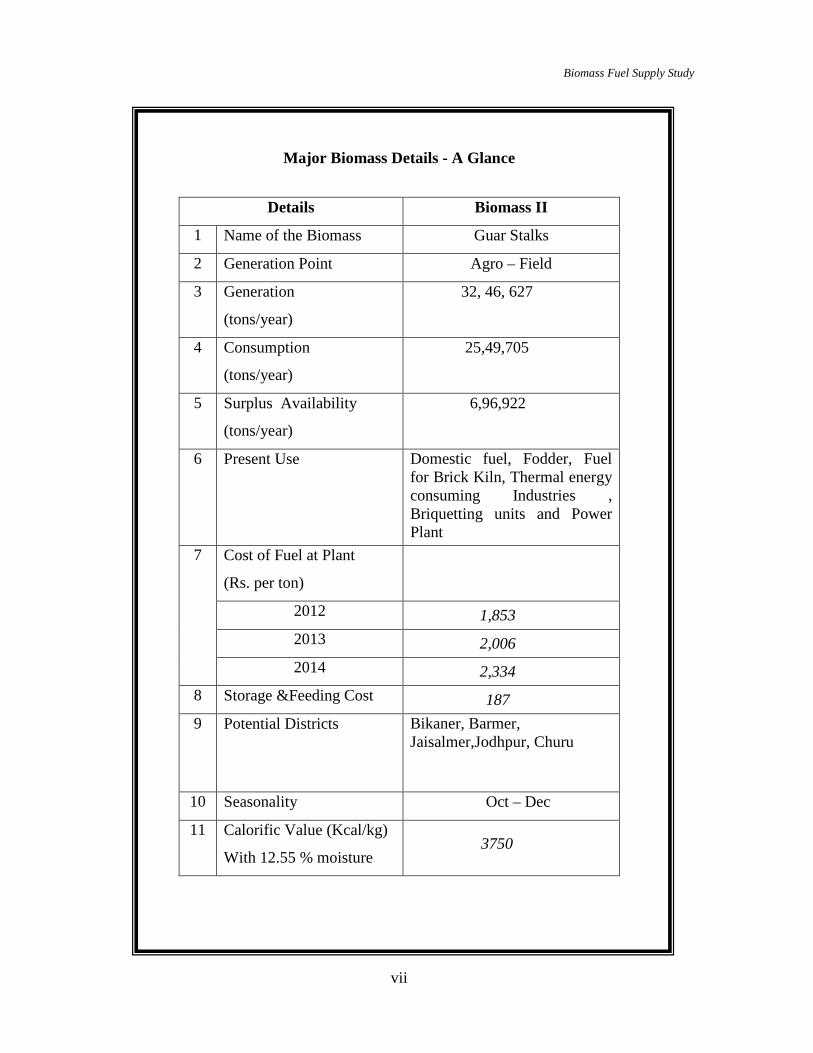
Major Biomass Details - A Glance
Details Biomass II
1 Name of the Biomass Guar Stalks
2 Generation Point Agro – Field
3 Generation
(tons/year)
32, 46, 627
4 Consumption
(tons/year)
25,49,705
5 Surplus Availability
(tons/year)
6,96,922
6 Present Use Domestic fuel, Fodder, Fuel for Brick Kiln, Thermal energy consuming Industries , Briquetting units and Power Plant
7 Cost of Fuel at Plant
(Rs. per ton)
2012 1,853 2013 2,006 2014 2,334
8 Storage &Feeding Cost 187 9 Potential Districts Bikaner, Barmer,
Jaisalmer,Jodhpur, Churu
10 Seasonality Oct – Dec
11 Calorific Value (Kcal/kg)
With 12.55 % moisture 3750
Biomass Fuel Supply Study
viii
Biomass Fuel Supply Study
ix
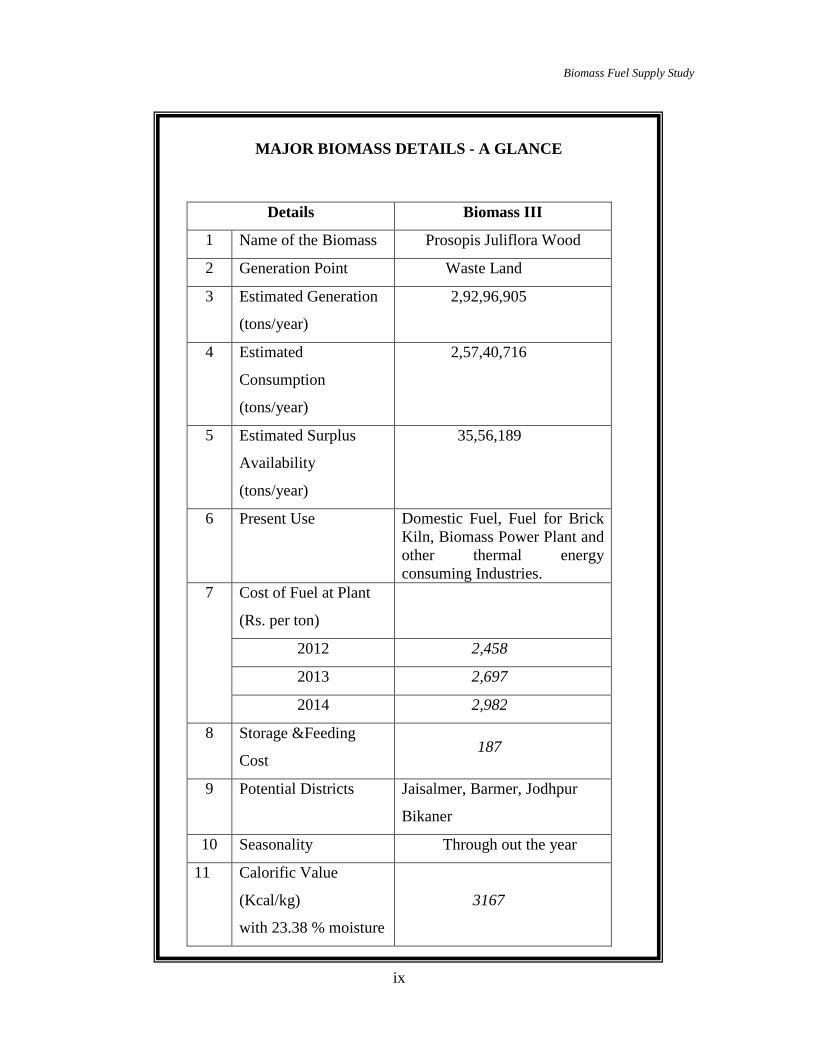
MAJOR BIOMASS DETAILS - A GLANCE
Details Biomass III
1 Name of the Biomass Prosopis Juliflora Wood
2 Generation Point Waste Land
3 Estimated Generation
(tons/year)
2,92,96,905
4 Estimated
Consumption
(tons/year)
2,57,40,716
5 Estimated Surplus
Availability
(tons/year)
35,56,189
6 Present Use Domestic Fuel, Fuel for Brick Kiln, Biomass Power Plant and other thermal energy consuming Industries.
7 Cost of Fuel at Plant
(Rs. per ton)
2012 2,458
2013 2,697
2014 2,982
8 Storage &Feeding
Cost 187
9 Potential Districts Jaisalmer, Barmer, Jodhpur
Bikaner
10 Seasonality Through out the year
11 Calorific Value
(Kcal/kg)
with 23.38 % moisture
3167
Biomass Fuel Supply Study
x
Biomass Fuel Supply Study
xi
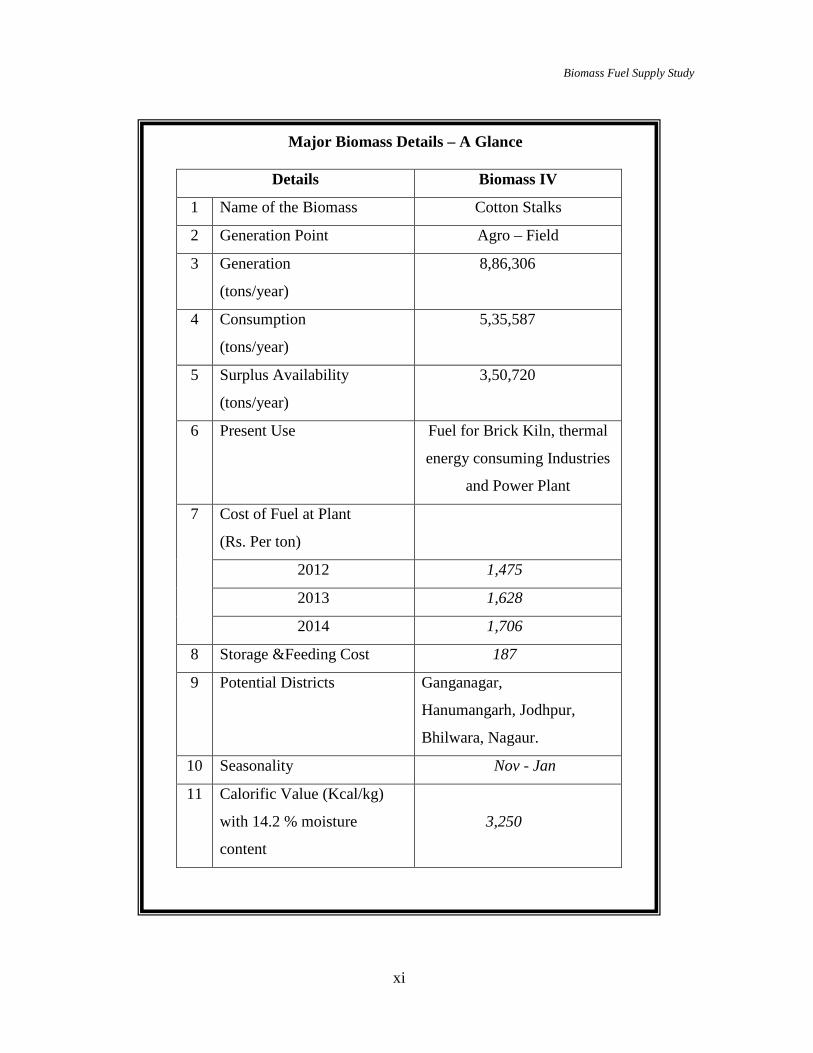
Major Biomass Details – A Glance
Details Biomass IV
1 Name of the Biomass Cotton Stalks
2 Generation Point Agro – Field
3 Generation
(tons/year)
8,86,306
4 Consumption
(tons/year)
5,35,587
5 Surplus Availability
(tons/year)
3,50,720
6 Present Use Fuel for Brick Kiln, thermal
energy consuming Industries
and Power Plant
7 Cost of Fuel at Plant
(Rs. Per ton)
2012 1,475
2013 1,628
2014 1,706
8 Storage &Feeding Cost 187
9 Potential Districts Ganganagar,
Hanumangarh, Jodhpur,
Bhilwara, Nagaur.
10 Seasonality Nov - Jan
11 Calorific Value (Kcal/kg)
with 14.2 % moisture
content
3,250
Biomass Fuel Supply Study
xii
Biomass Fuel Supply Study
Abi Energy Consultancy Services Pvt Ltd Rajasthan Renewable Energy Corporation Ltd
1
Chapter 1
INTRODUCTION
1.0 INTRODUCTION
India is an agricultural country with more than 70% of population living in rural
areas. The major activities of the rural population are production, processing and selling
of agricultural products. Energy is the lifeline of the major activities in rural India. At
present, power requirement of the country is met by three main sources namely, thermal,
hydro and nuclear. While hydro and nuclear have their own limitations, thermal power
does not have any, except the availability of fuel. Currently, thermal power stations meet
the major demand of the country (to an extent of 70%) and use coal as the fuel, whose
availability is finite.
The Government of Rajasthan has accorded a high priority to setting up power
projects based on non conventional energy sources in the State. With a view to promote
generation of power from these sources, Government of Rajasthan issued a "Policy for
Promoting Generation for Electricity from Non Conventional Energy Sources” in 1999.
Keeping in view the requirements from time to time, this Policy has been amended from
time to time. Recently the Government of Rajasthan has issued ‘Policy for Promoting for
Generation of Electricity from Biomass, 2010” (Policy-2010).
1.1 BACKGROUND OF THE STUDY
Rajasthan Electricity Regulatory Commission (RERC) has passed an order dated
24/02/2014 in the matter of determination of tariff for sale of electricity from Juliflora based
biomass power plants and in the matter of review and amendment in norms/parameters
specified by the Commission in RERC (Terms and Conditions for Determination of Tariff)
Regulations, 2009. In Para – 51(4) of the said Order RERC has desired that a study or survey
of availability of biomass fuels particularly in respect of Mustard crop and Juliflora Biomass
in the State, their pricing and periodic revision of price is required to ensure that biomass
power projects continue to generate electricity on a sustainable basis. RERC has nominated
Rajasthan Renewable Energy Corporation Ltd. (RREC), the Nodal Agency responsible for
promotion of renewable energy in the State, to get the prices and price trend of main biomass
Biomass Fuel Supply Study
Abi Energy Consultancy Services Pvt Ltd Rajasthan Renewable Energy Corporation Ltd
2
fuel in the State studied/surveyed, particularly in respect of Mustard crop based and Juliflora
Bio-mass and furnish its recommendations.
In view of above, RREC appointed Abi Energy Consultancy Services Private
Limited for Biomass Fuel Supply Studies in Rajasthan.
1.2 OBJECTIVE OF THE STUDY
The objective of the study is to identify the biomass sources within Rajasthan
state and assessment of their availability in terms of quality and quantity. The scope also
includes the realistic estimation of surplus biomass availability of various types of
biomass particularly in respect of Mustard husk and Juliflora, revision of price including
escalation factor for fuel price and losses in storage etc.
With this in mind, the major objectives of the study are designed as given
hereunder.
1 Identification of biomass sources of the Study Area and assessment of their
availability in terms of quality and quantity.
2 Estimation of quantum of biomass consumed for various activities in the Study
Area (as fuel, fodder, thatching, etc.)
3 Establishment of a realistic estimate of the various types of biomass that is
available in surplus after accounting for utilization.
4 Presentation of a brief outline of biomass sourcing from the village, seasonal
availability, cost sensitivity, procurement mode, losses, storage etc.
Biomass Fuel Supply Study
Abi Energy Consultancy Services Pvt Ltd Rajasthan Renewable Energy Corporation Ltd
3
Chapter 2
METHODOLOGY ADOPTED
2.0 INTRODUCTION
The basic objective of the study was to assess the biomass resources availability,
their consumption, the surplus biomass availability along with their price and price trend
in the state of Rajasthan. This objective was kept in mind while preceding the
methodology. The study was organized stage wise as shown here under.
2.1 DATA SHEET DEVELOPMENT
The data sheet was designed considering the main objective of the study namely
the estimation of surplus biomass availability and biomass price in Rajasthan State. The
district level data collection provides information on land details, biomass generation
from agricultural activities, waste land, their consumption for various activities and the
surplus biomass availability.
2.2 PRIMARY DATA COLLECTION
This data sheet included only the data relevant to the study, the geographical area,
land details, agricultural activities, biomass generation, consumption and estimation of
surplus availability of biomass.
The most crucial and important data that had to be established through this study area
namely the surplus biomass availability was collected by
1 having interactions with the Govt. Official, food grain dealers, biomass dealers
farmers and others
2 manually taking account of the biomass leaving the village during a specific time
period
3 physically measuring the quantum of biomass utilized for thatching, fodder, fuel
and manure on a sample basis and extrapolating the same to the required data
size.
Biomass Fuel Supply Study
Abi Energy Consultancy Services Pvt Ltd Rajasthan Renewable Energy Corporation Ltd
4
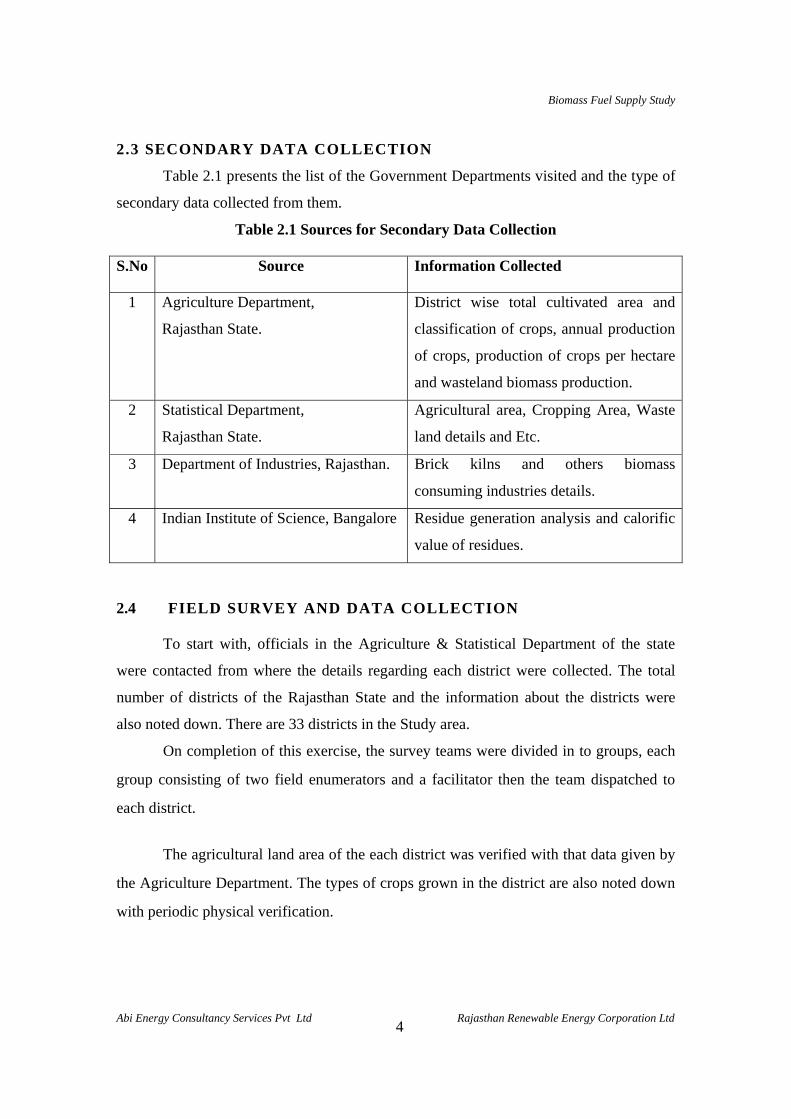
2.3 SECONDARY DATA COLLECTION
Table 2.1 presents the list of the Government Departments visited and the type of
secondary data collected from them.
Table 2.1 Sources for Secondary Data Collection
S.No Source Information Collected
1 Agriculture Department,
Rajasthan State.
District wise total cultivated area and
classification of crops, annual production
of crops, production of crops per hectare
and wasteland biomass production.
2 Statistical Department,
Rajasthan State.
Agricultural area, Cropping Area, Waste
land details and Etc.
3 Department of Industries, Rajasthan. Brick kilns and others biomass
consuming industries details.
4 Indian Institute of Science, Bangalore
Residue generation analysis and calorific
value of residues.
2.4 FIELD SURVEY AND DATA COLLECTION
To start with, officials in the Agriculture & Statistical Department of the state
were contacted from where the details regarding each district were collected. The total
number of districts of the Rajasthan State and the information about the districts were
also noted down. There are 33 districts in the Study area.
On completion of this exercise, the survey teams were divided in to groups, each
group consisting of two field enumerators and a facilitator then the team dispatched to
each district.
The agricultural land area of the each district was verified with that data given by
the Agriculture Department. The types of crops grown in the district are also noted down
with periodic physical verification.
Biomass Fuel Supply Study
Abi Energy Consultancy Services Pvt Ltd Rajasthan Renewable Energy Corporation Ltd
5
The production of crops from the cultivated land was gathered from local farmers
/ landlords as a sort of verification against that provided by the Agriculture Department.
Minor variations have been observed which however was overlooked as we anticipated
that this would not really influence much to the total crop yield thereby the biomass
generation.
It was also instructed to the field enumerators to not to look for major and minor
classification of the crops at the field level data collection as it would be difficult to
classify this at field level. On completion of the survey work on all the districts, the major
/ minor crop classification was made. The yield of crop at the field was gathered from
land owners was compared with the yield given by the agriculture department. The result
was positive inferring that primary data collected at field level by the enumerators
matched well with that provided by the Government Department.
On completion of the survey, the biomass generation potential at the field was
both computed and measured. Indian Institute of Science, Bangalore established the
computation of biomass generation. As verification measure Biomass residue generated
was estimated by measurement in the field. This exercise was done specifically for all
major crops in the Study area.
Thus, the district level survey and the verification of biomass residue generation
at the field were carried out.
To estimate the surplus biomass availability, some of the tools employed are as
follows.
A Discussion with Farmers
B Personal Observation
C Questionnaire made by the literate people of the districts etc.
D Details from biomass and food grain traders.
Biomass Fuel Supply Study
Abi Energy Consultancy Services Pvt Ltd Rajasthan Renewable Energy Corporation Ltd
6
Although it can’t be said that this will represent the true picture of the surplus availability
nevertheless it does give a fairly reliable acceptable estimate of surplus. As the aim of the
study was precisely this, all concerned in the study to establish this aspect did a rigorous
work.
On completion of the field level survey, the other task like cost at source and
trend, availability, transportation cost and destination of biomass were also gathered. This
task was time consuming although not difficult.
Biomass Fuel Supply Study
Abi Energy Consultancy Services Pvt Ltd Rajasthan Renewable Energy Corporation Ltd
7
Chapter 3
BIOMASS FROM AGRICULTURE LAND
3.0 INTRODUCTION
This chapter covers biomass ,generation, consumption and surplus availability in
Rajasthan from agricultural land.
3.1 BIOMASS GENERATION
Crop residues are form major portion of the biomass generation. The main crop
residues of the study area are
1 Paddy Straw 2 Jowar Stalks 3 Bajra Stalks
4 Maize Stalks 5 Moong Stalks 6 Urad Stalks
7 Moth Stalks 8 Seasamum Stalks 9 Groundnut Stalks
10 Soyabean Stalks 11 Castor Stem 12 Cotton Stalks
13 Guar Stalks 14 Wheat Stalks 15 Barley Stalks
16 Gram Stalks 17 Mustard Stalks & Husk
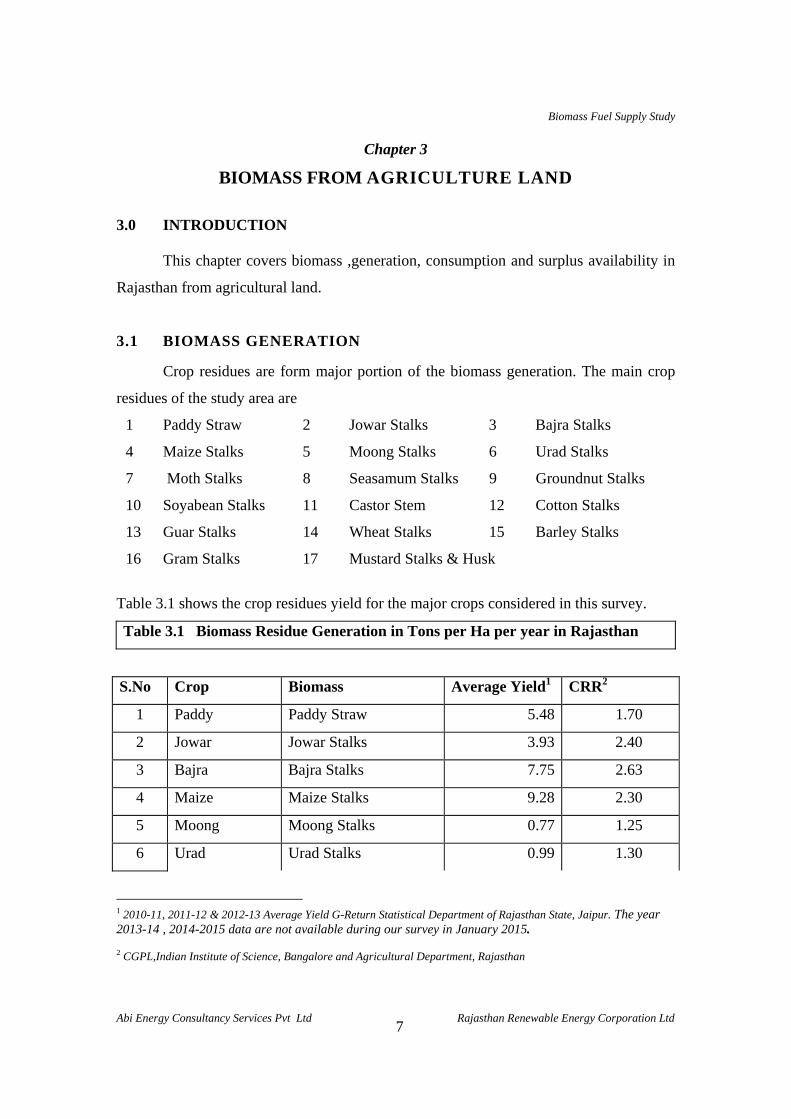
Table 3.1 shows the crop residues yield for the major crops considered in this survey.
Table 3.1 Biomass Residue Generation in Tons per Ha per year in Rajasthan
S.No Crop Biomass Average Yield1 CRR2
1 Paddy Paddy Straw 5.48 1.70
2 Jowar Jowar Stalks 3.93 2.40
3 Bajra Bajra Stalks 7.75 2.63
4 Maize Maize Stalks 9.28 2.30
5 Moong Moong Stalks 0.77 1.25
6 Urad Urad Stalks 0.99 1.30
1 2010-11, 2011-12 & 2012-13 Average Yield G-Return Statistical Department of Rajasthan State, Jaipur. The year 2013-14 , 2014-2015 data are not available during our survey in January 2015. 2 CGPL,Indian Institute of Science, Bangalore and Agricultural Department, Rajasthan
Biomass Fuel Supply Study
Abi Energy Consultancy Services Pvt Ltd Rajasthan Renewable Energy Corporation Ltd
8
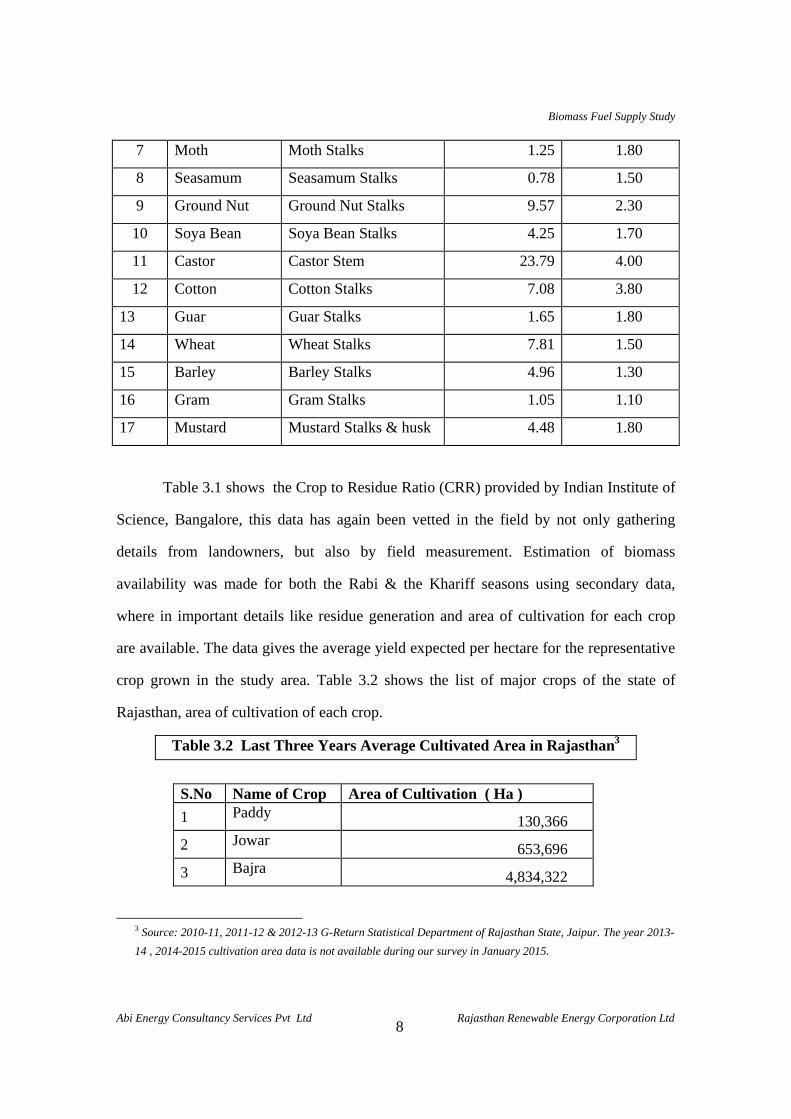
7 Moth Moth Stalks 1.25 1.80
8 Seasamum Seasamum Stalks 0.78 1.50
9 Ground Nut Ground Nut Stalks 9.57 2.30
10 Soya Bean Soya Bean Stalks 4.25 1.70
11 Castor Castor Stem 23.79 4.00
12 Cotton Cotton Stalks 7.08 3.80
13 Guar Guar Stalks 1.65 1.80
14 Wheat Wheat Stalks 7.81 1.50
15 Barley Barley Stalks 4.96 1.30
16 Gram Gram Stalks 1.05 1.10
17 Mustard Mustard Stalks & husk 4.48 1.80
Table 3.1 shows the Crop to Residue Ratio (CRR) provided by Indian Institute of
Science, Bangalore, this data has again been vetted in the field by not only gathering
details from landowners, but also by field measurement. Estimation of biomass
availability was made for both the Rabi & the Khariff seasons using secondary data,
where in important details like residue generation and area of cultivation for each crop
are available. The data gives the average yield expected per hectare for the representative
crop grown in the study area. Table 3.2 shows the list of major crops of the state of
Rajasthan, area of cultivation of each crop.
Table 3.2 Last Three Years Average Cultivated Area in Rajasthan3
S.No Name of Crop Area of Cultivation ( Ha )
1 Paddy 130,366
2 Jowar 653,696
3 Bajra 4,834,322
3 Source: 2010-11, 2011-12 & 2012-13 G-Return Statistical Department of Rajasthan State, Jaipur. The year 2013-
14 , 2014-2015 cultivation area data is not available during our survey in January 2015.
Biomass Fuel Supply Study
Abi Energy Consultancy Services Pvt Ltd Rajasthan Renewable Energy Corporation Ltd
9
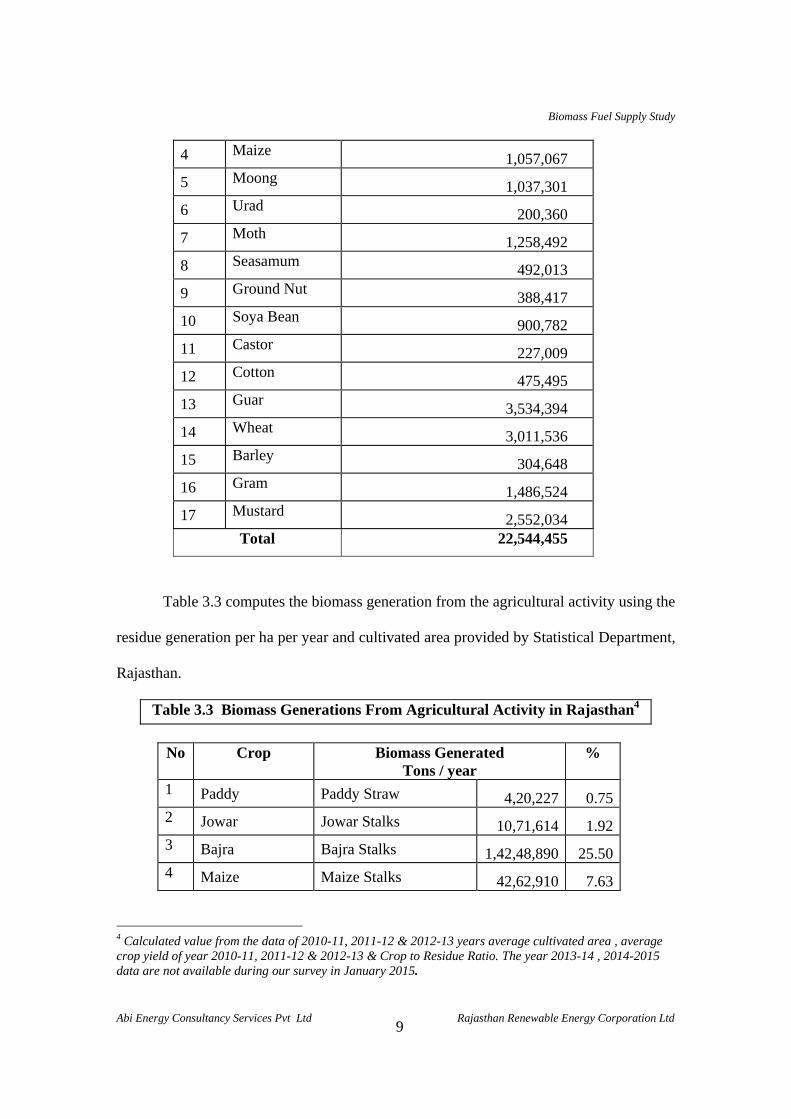
4 Maize 1,057,067
5 Moong 1,037,301
6 Urad 200,360
7 Moth 1,258,492
8 Seasamum 492,013
9 Ground Nut 388,417
10 Soya Bean 900,782
11 Castor 227,009
12 Cotton 475,495
13 Guar 3,534,394
14 Wheat 3,011,536
15 Barley 304,648
16 Gram 1,486,524
17 Mustard 2,552,034
Total 22,544,455
Table 3.3 computes the biomass generation from the agricultural activity using the
residue generation per ha per year and cultivated area provided by Statistical Department,
Rajasthan.
Table 3.3 Biomass Generations From Agricultural Activity in Rajasthan4
No Crop Biomass Generated
Tons / year %
1 Paddy Paddy Straw 4,20,227 0.75 2 Jowar Jowar Stalks 10,71,614 1.92 3 Bajra Bajra Stalks 1,42,48,890 25.50 4 Maize Maize Stalks 42,62,910 7.63
4 Calculated value from the data of 2010-11, 2011-12 & 2012-13 years average cultivated area , average crop yield of year 2010-11, 2011-12 & 2012-13 & Crop to Residue Ratio. The year 2013-14 , 2014-2015 data are not available during our survey in January 2015.
Biomass Fuel Supply Study
Abi Energy Consultancy Services Pvt Ltd Rajasthan Renewable Energy Corporation Ltd
10
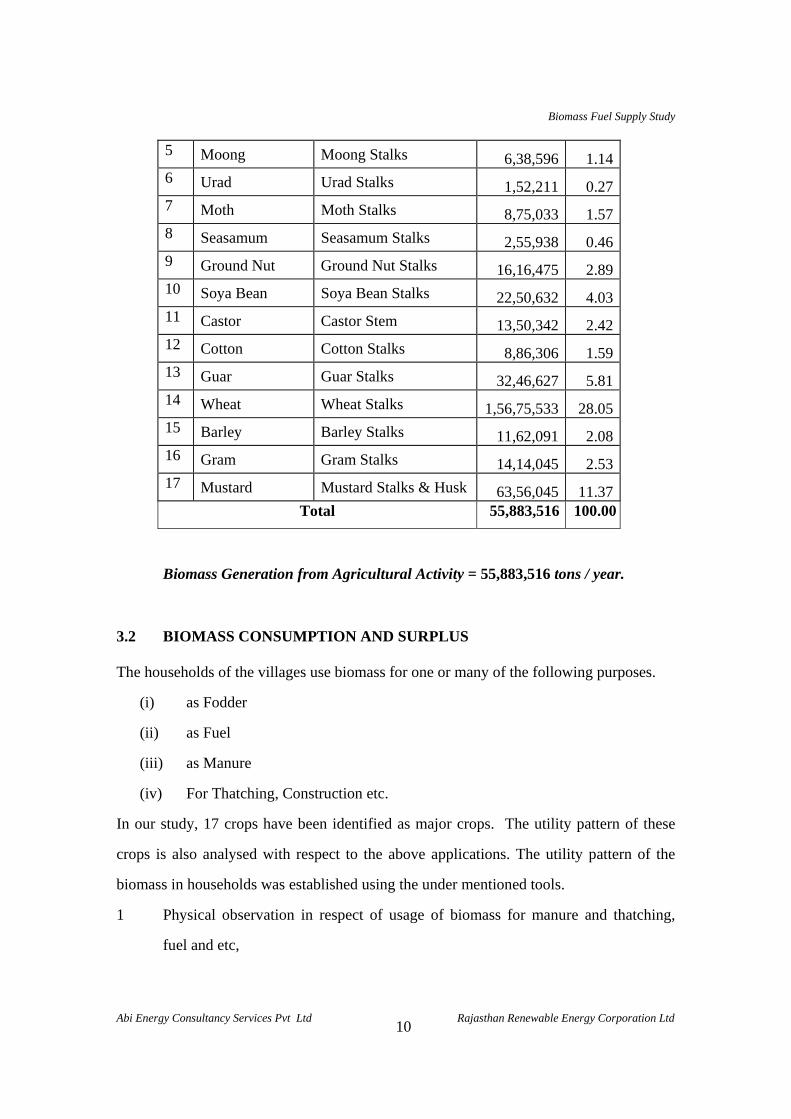
5 Moong Moong Stalks 6,38,596 1.14 6 Urad Urad Stalks 1,52,211 0.27 7 Moth Moth Stalks 8,75,033 1.57 8 Seasamum Seasamum Stalks 2,55,938 0.46 9 Ground Nut Ground Nut Stalks 16,16,475 2.89 10 Soya Bean Soya Bean Stalks 22,50,632 4.03 11 Castor Castor Stem 13,50,342 2.42 12 Cotton Cotton Stalks 8,86,306 1.59 13 Guar Guar Stalks 32,46,627 5.81 14 Wheat Wheat Stalks 1,56,75,533 28.05 15 Barley Barley Stalks 11,62,091 2.08 16 Gram Gram Stalks 14,14,045 2.53 17 Mustard Mustard Stalks & Husk 63,56,045 11.37
Total 55,883,516 100.00
Biomass Generation from Agricultural Activity = 55,883,516 tons / year.
3.2 BIOMASS CONSUMPTION AND SURPLUS The households of the villages use biomass for one or many of the following purposes.
(i) as Fodder
(ii) as Fuel
(iii) as Manure
(iv) For Thatching, Construction etc.
In our study, 17 crops have been identified as major crops. The utility pattern of these
crops is also analysed with respect to the above applications. The utility pattern of the
biomass in households was established using the under mentioned tools.
1 Physical observation in respect of usage of biomass for manure and thatching,
fuel and etc,
Biomass Fuel Supply Study
Abi Energy Consultancy Services Pvt Ltd Rajasthan Renewable Energy Corporation Ltd
11
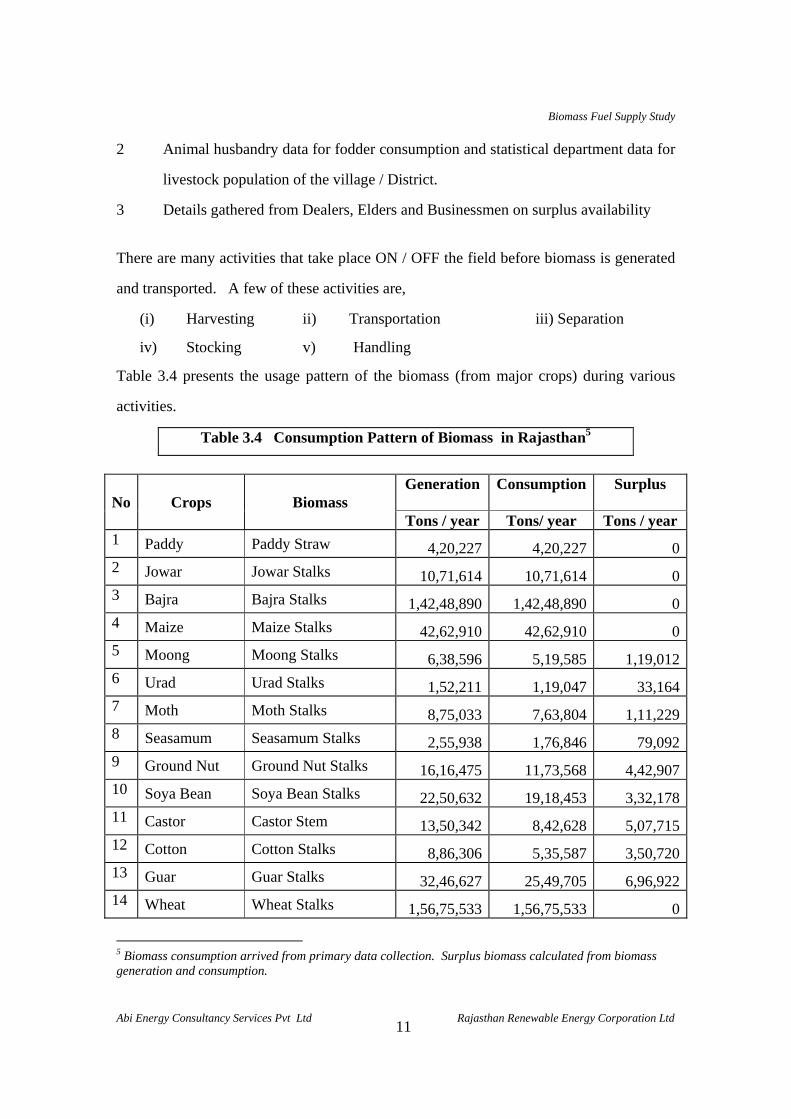
2 Animal husbandry data for fodder consumption and statistical department data for
livestock population of the village / District.
3 Details gathered from Dealers, Elders and Businessmen on surplus availability
There are many activities that take place ON / OFF the field before biomass is generated
and transported. A few of these activities are,
(i) Harvesting ii) Transportation iii) Separation
iv) Stocking v) Handling
Table 3.4 presents the usage pattern of the biomass (from major crops) during various
activities.
Table 3.4 Consumption Pattern of Biomass in Rajasthan5
No Crops Biomass Generation
Consumption Surplus
Tons / year Tons/ year Tons / year
1 Paddy Paddy Straw 4,20,227 4,20,227 02 Jowar Jowar Stalks 10,71,614 10,71,614 03 Bajra Bajra Stalks 1,42,48,890 1,42,48,890 04 Maize Maize Stalks 42,62,910 42,62,910 05 Moong Moong Stalks 6,38,596 5,19,585 1,19,0126 Urad Urad Stalks 1,52,211 1,19,047 33,1647 Moth Moth Stalks 8,75,033 7,63,804 1,11,2298 Seasamum Seasamum Stalks 2,55,938 1,76,846 79,0929 Ground Nut Ground Nut Stalks 16,16,475 11,73,568 4,42,90710 Soya Bean Soya Bean Stalks 22,50,632 19,18,453 3,32,17811 Castor Castor Stem 13,50,342 8,42,628 5,07,71512 Cotton Cotton Stalks 8,86,306 5,35,587 3,50,72013 Guar Guar Stalks 32,46,627 25,49,705 6,96,92214 Wheat Wheat Stalks 1,56,75,533 1,56,75,533 0
5 Biomass consumption arrived from primary data collection. Surplus biomass calculated from biomass generation and consumption.
Biomass Fuel Supply Study
Abi Energy Consultancy Services Pvt Ltd Rajasthan Renewable Energy Corporation Ltd
12
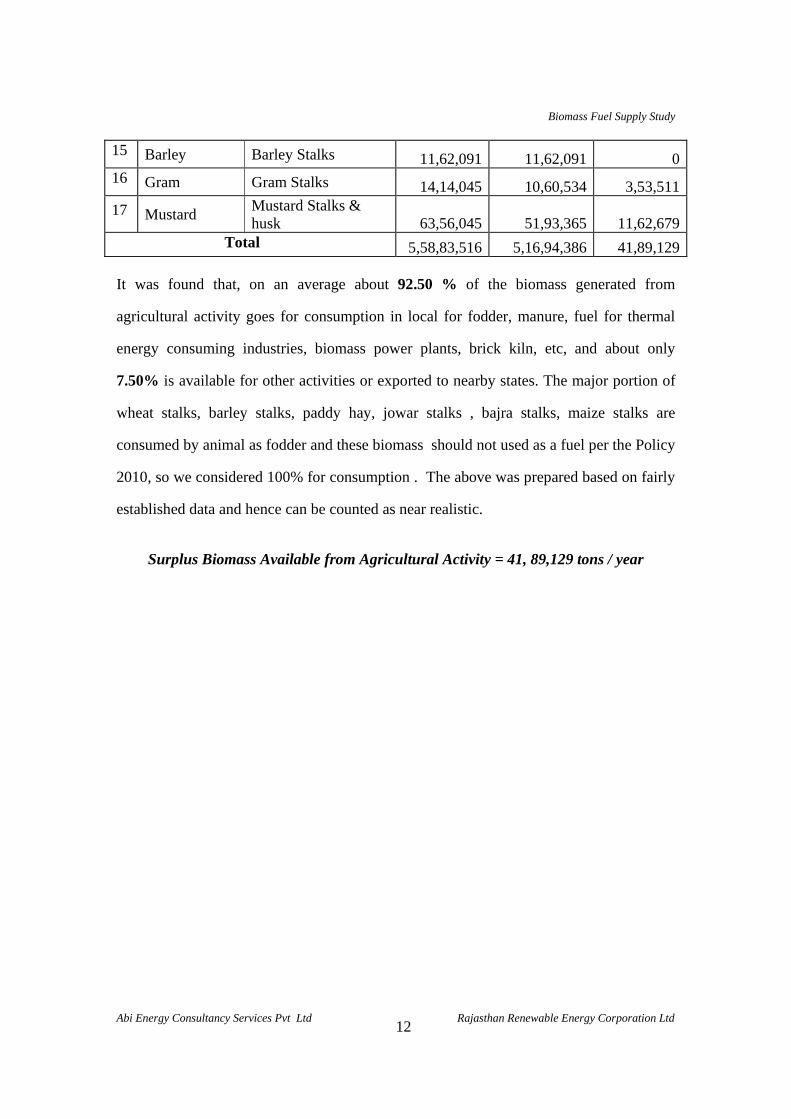
15 Barley Barley Stalks 11,62,091 11,62,091 016 Gram Gram Stalks 14,14,045 10,60,534 3,53,511
17 Mustard Mustard Stalks & husk 63,56,045 51,93,365 11,62,679
Total 5,58,83,516 5,16,94,386 41,89,129 It was found that, on an average about 92.50 % of the biomass generated from
agricultural activity goes for consumption in local for fodder, manure, fuel for thermal
energy consuming industries, biomass power plants, brick kiln, etc, and about only
7.50% is available for other activities or exported to nearby states. The major portion of
wheat stalks, barley stalks, paddy hay, jowar stalks , bajra stalks, maize stalks are
consumed by animal as fodder and these biomass should not used as a fuel per the Policy
2010, so we considered 100% for consumption . The above was prepared based on fairly
established data and hence can be counted as near realistic.
Surplus Biomass Available from Agricultural Activity = 41, 89,129 tons / year
Biomass Fuel Supply Study
Abi Energy Consultancy Services Pvt Ltd Rajasthan Renewable Energy Corporation Ltd
13
BIOMASS FROM WASTE LAND
4.0 INTRODUCTION
Out of the total geographical area of 3, 42, 23,9006 hectares in study area,
93,68,9473 hectares were identified as wasteland out which Prosopis Juliflora is
grown in 58, 59, 3813 hectares of cultivable waste land and fallow land in
Rajasthan. Prosopis Juliflora is the major wasteland biomass in this study area.
Prosopis juliflora was introduced to India around 1877 to check encroaching desert
sands and as a regreening tool. The first large-scale planting was in Gujarat in about
1894, and the species was introduced to Rajasthan in 1913. In all 11 districts of
western Rajasthan, Prosopis juliflora has spread widely, with high plant densities
encountered in the districts of Pali, Jalore, Jodhpur and Nagaur. There has been a
great spread into east and south Rajasthan in the last 25 years. Initially it was
introduced along roads, it has now spread into many habitats, including rocky
terrains and saline lands. As the species spread, the resulting shrinking pastures
may have been the cause of the decline of many wild grassland animals. This
species is prevailing in this area massively for quite some decades, may be due to
soil and other related environmental features.
4.1 PROSOPIS JULIFLORA
Prosopis Juliflora is well adapted to warm and dry tropical climates. It grows well
in areas receiving 250-600 mm annual rainfall. It is a fast growing tree and has a
deep to very deep, well meshed root system. It does not require any special care for
rehabilitating marginal lands or wastelands. This species is however, quite
susceptible to frost, and its distribution is very much restricted in areas where there
is a regular occurrence of frost during winter months. Such as the interdunal zones
of Barmer, Jaisalmer, Bikaner and Churu. In areas which experience frost once in
every 4 to 8 years, the plant suffers dieback to ground level, and later in February-
March the plant sprouts back and assumes its original height within a 9-10 month
period.
6 Nine fold land use classification, 2010-11, 2011-12 & 2012-13 G-Return Statistical Department of Rajasthan State, Jaipur.
Biomass Fuel Supply Study
Abi Energy Consultancy Services Pvt Ltd Rajasthan Renewable Energy Corporation Ltd
14
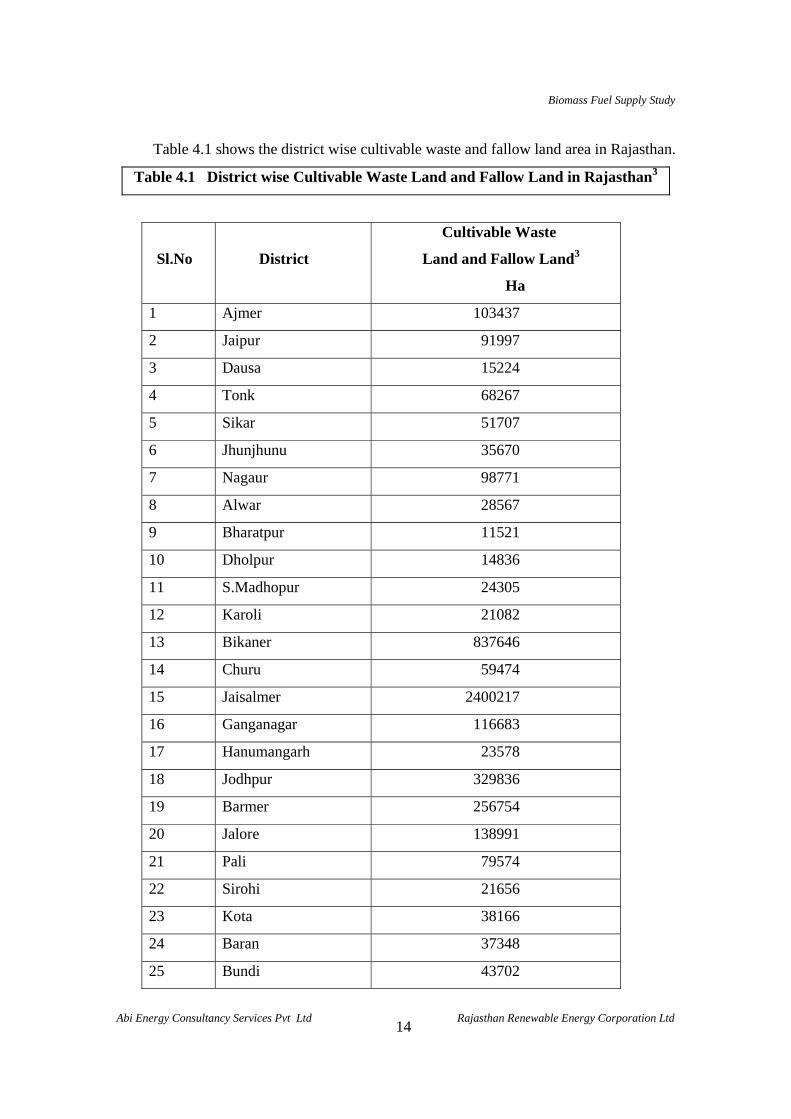
Table 4.1 shows the district wise cultivable waste and fallow land area in Rajasthan.
Table 4.1 District wise Cultivable Waste Land and Fallow Land in Rajasthan3
Sl.No District
Cultivable Waste
Land and Fallow Land3
Ha
1 Ajmer 103437
2 Jaipur 91997
3 Dausa 15224
4 Tonk 68267
5 Sikar 51707
6 Jhunjhunu 35670
7 Nagaur 98771
8 Alwar 28567
9 Bharatpur 11521
10 Dholpur 14836
11 S.Madhopur 24305
12 Karoli 21082
13 Bikaner 837646
14 Churu 59474
15 Jaisalmer 2400217
16 Ganganagar 116683
17 Hanumangarh 23578
18 Jodhpur 329836
19 Barmer 256754
20 Jalore 138991
21 Pali 79574
22 Sirohi 21656
23 Kota 38166
24 Baran 37348
25 Bundi 43702
Biomass Fuel Supply Study
Abi Energy Consultancy Services Pvt Ltd Rajasthan Renewable Energy Corporation Ltd
15
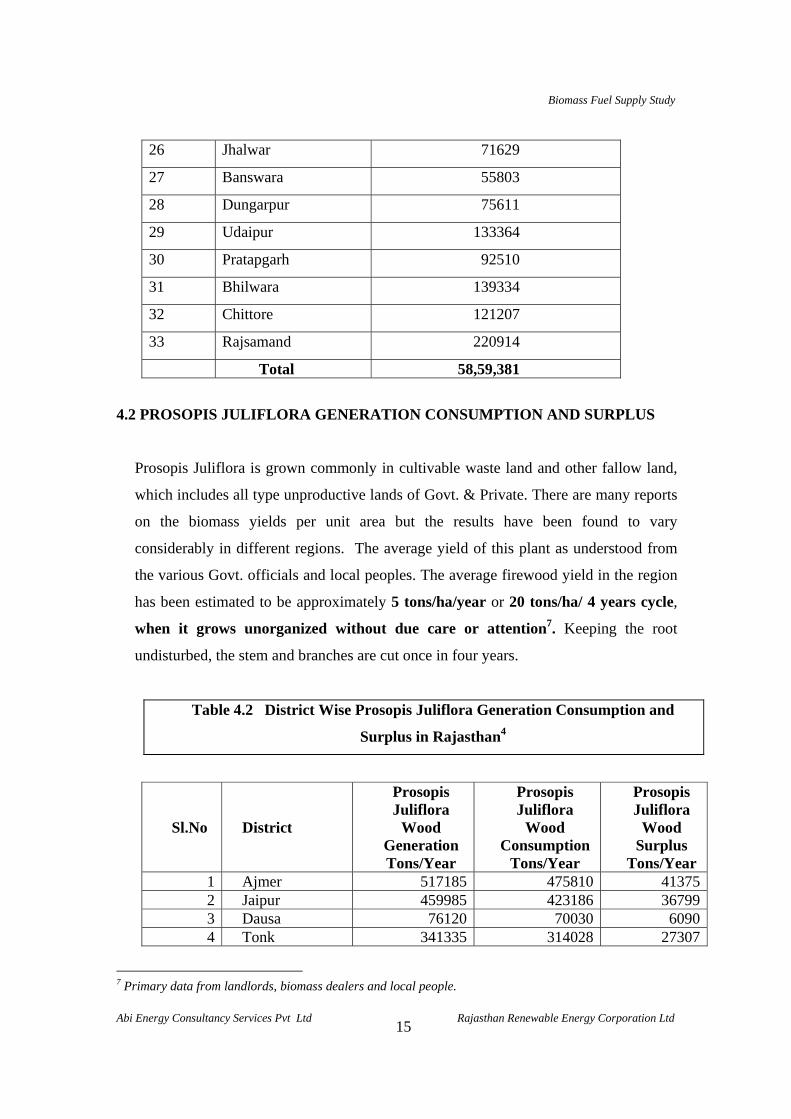
26 Jhalwar 71629
27 Banswara 55803
28 Dungarpur 75611
29 Udaipur 133364
30 Pratapgarh 92510
31 Bhilwara 139334
32 Chittore 121207
33 Rajsamand 220914
Total 58,59,381
4.2 PROSOPIS JULIFLORA GENERATION CONSUMPTION AND SURPLUS
Prosopis Juliflora is grown commonly in cultivable waste land and other fallow land,
which includes all type unproductive lands of Govt. & Private. There are many reports
on the biomass yields per unit area but the results have been found to vary
considerably in different regions. The average yield of this plant as understood from
the various Govt. officials and local peoples. The average firewood yield in the region
has been estimated to be approximately 5 tons/ha/year or 20 tons/ha/ 4 years cycle,
when it grows unorganized without due care or attention7. Keeping the root
undisturbed, the stem and branches are cut once in four years.
Table 4.2 District Wise Prosopis Juliflora Generation Consumption and
Surplus in Rajasthan4
Sl.No District
Prosopis Juliflora
Wood Generation Tons/Year
Prosopis Juliflora
Wood Consumption
Tons/Year
Prosopis Juliflora
Wood Surplus
Tons/Year 1 Ajmer 517185 475810 413752 Jaipur 459985 423186 367993 Dausa 76120 70030 60904 Tonk 341335 314028 27307
7 Primary data from landlords, biomass dealers and local people.
Biomass Fuel Supply Study
Abi Energy Consultancy Services Pvt Ltd Rajasthan Renewable Energy Corporation Ltd
16
5 Sikar 258535 237852 206836 Jhunjhunu 178350 164082 142687 Nagaur 493855 454347 395088 Alwar 142835 131408 114279 Bharatpur 57605 52997 4608
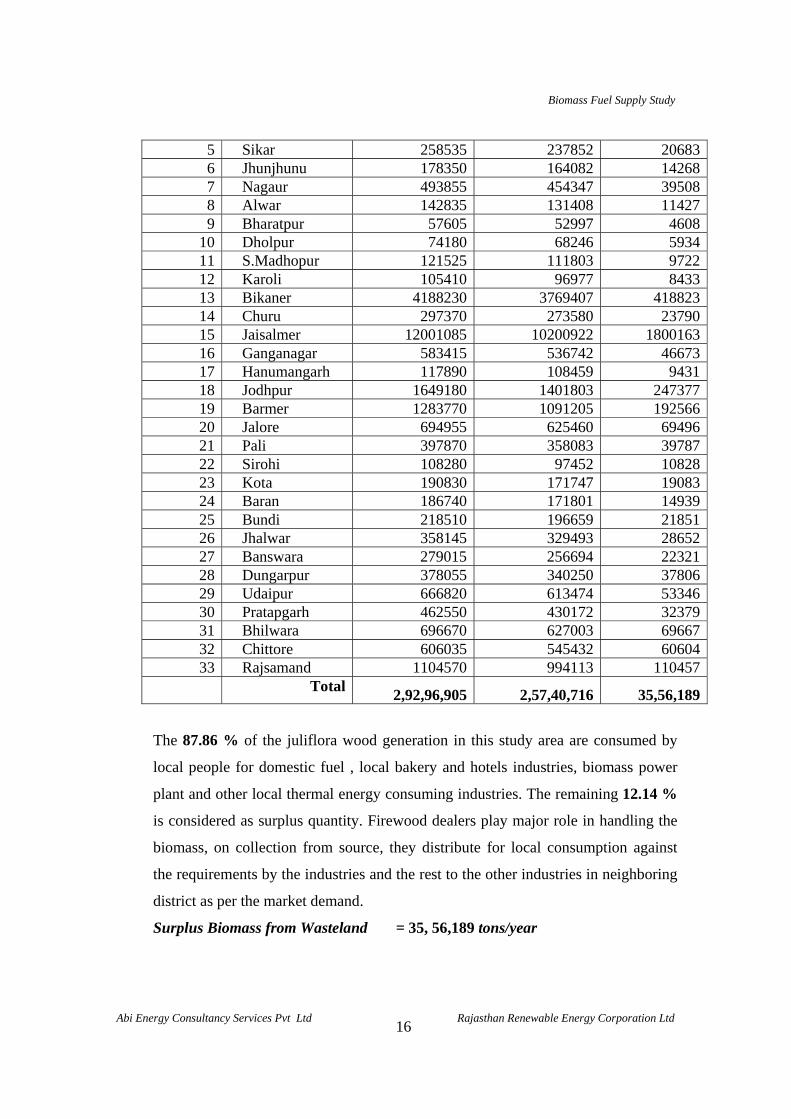
10 Dholpur 74180 68246 593411 S.Madhopur 121525 111803 972212 Karoli 105410 96977 843313 Bikaner 4188230 3769407 41882314 Churu 297370 273580 2379015 Jaisalmer 12001085 10200922 180016316 Ganganagar 583415 536742 4667317 Hanumangarh 117890 108459 943118 Jodhpur 1649180 1401803 24737719 Barmer 1283770 1091205 19256620 Jalore 694955 625460 6949621 Pali 397870 358083 3978722 Sirohi 108280 97452 1082823 Kota 190830 171747 1908324 Baran 186740 171801 1493925 Bundi 218510 196659 2185126 Jhalwar 358145 329493 2865227 Banswara 279015 256694 2232128 Dungarpur 378055 340250 3780629 Udaipur 666820 613474 5334630 Pratapgarh 462550 430172 3237931 Bhilwara 696670 627003 6966732 Chittore 606035 545432 6060433 Rajsamand 1104570 994113 110457
Total
2,92,96,905 2,57,40,716 35,56,189
The 87.86 % of the juliflora wood generation in this study area are consumed by
local people for domestic fuel , local bakery and hotels industries, biomass power
plant and other local thermal energy consuming industries. The remaining 12.14 %
is considered as surplus quantity. Firewood dealers play major role in handling the
biomass, on collection from source, they distribute for local consumption against
the requirements by the industries and the rest to the other industries in neighboring
district as per the market demand.
Surplus Biomass from Wasteland = 35, 56,189 tons/year
Biomass Fuel Supply Study
Abi Energy Consultancy Services Pvt Ltd Rajasthan Renewable Energy Corporation Ltd
17
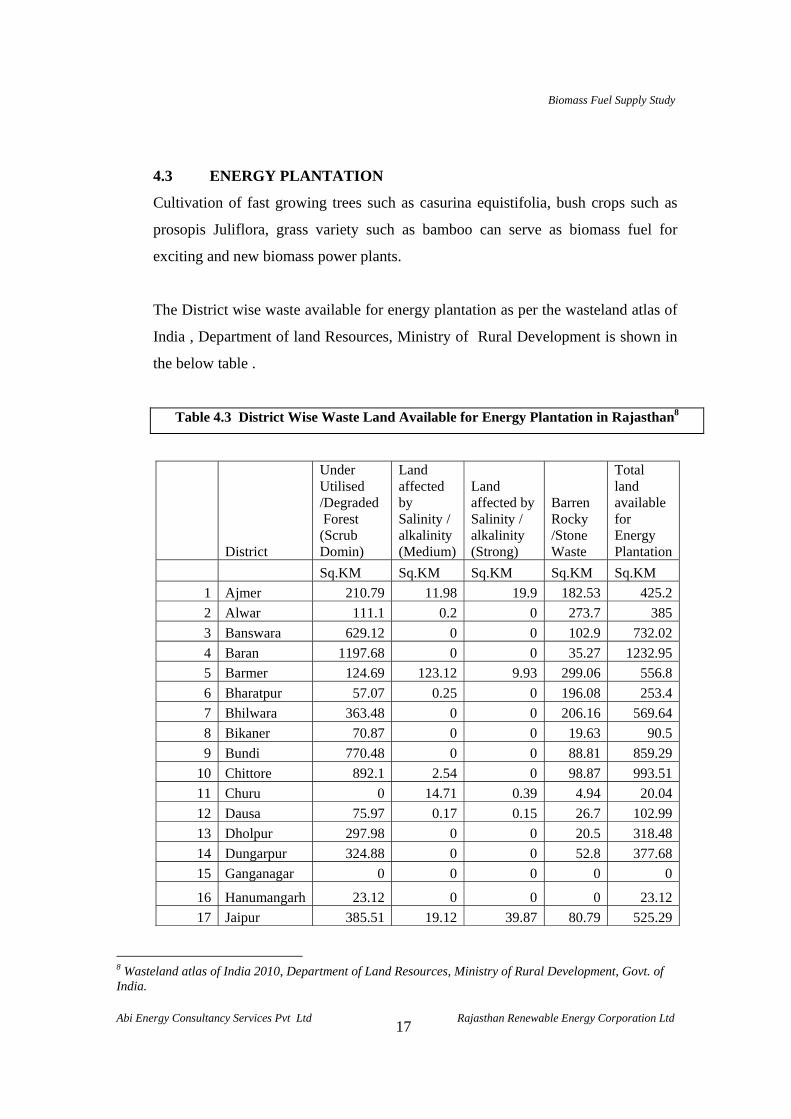
4.3 ENERGY PLANTATION
Cultivation of fast growing trees such as casurina equistifolia, bush crops such as
prosopis Juliflora, grass variety such as bamboo can serve as biomass fuel for
exciting and new biomass power plants.
The District wise waste available for energy plantation as per the wasteland atlas of
India , Department of land Resources, Ministry of Rural Development is shown in
the below table .
Table 4.3 District Wise Waste Land Available for Energy Plantation in Rajasthan8
District
Under Utilised /Degraded Forest (Scrub Domin)
Land affected by Salinity / alkalinity (Medium)
Land affected by Salinity / alkalinity (Strong)
Barren Rocky /Stone Waste
Total land available for Energy Plantation
Sq.KM Sq.KM Sq.KM Sq.KM Sq.KM
1 Ajmer 210.79 11.98 19.9 182.53 425.2
2 Alwar 111.1 0.2 0 273.7 385
3 Banswara 629.12 0 0 102.9 732.02
4 Baran 1197.68 0 0 35.27 1232.95
5 Barmer 124.69 123.12 9.93 299.06 556.8
6 Bharatpur 57.07 0.25 0 196.08 253.4
7 Bhilwara 363.48 0 0 206.16 569.64
8 Bikaner 70.87 0 0 19.63 90.5
9 Bundi 770.48 0 0 88.81 859.29
10 Chittore 892.1 2.54 0 98.87 993.51
11 Churu 0 14.71 0.39 4.94 20.04
12 Dausa 75.97 0.17 0.15 26.7 102.99
13 Dholpur 297.98 0 0 20.5 318.48
14 Dungarpur 324.88 0 0 52.8 377.68
15 Ganganagar 0 0 0 0 0
16 Hanumangarh 23.12 0 0 0 23.12
17 Jaipur 385.51 19.12 39.87 80.79 525.29
8 Wasteland atlas of India 2010, Department of Land Resources, Ministry of Rural Development, Govt. of India.
Biomass Fuel Supply Study
Abi Energy Consultancy Services Pvt Ltd Rajasthan Renewable Energy Corporation Ltd
18
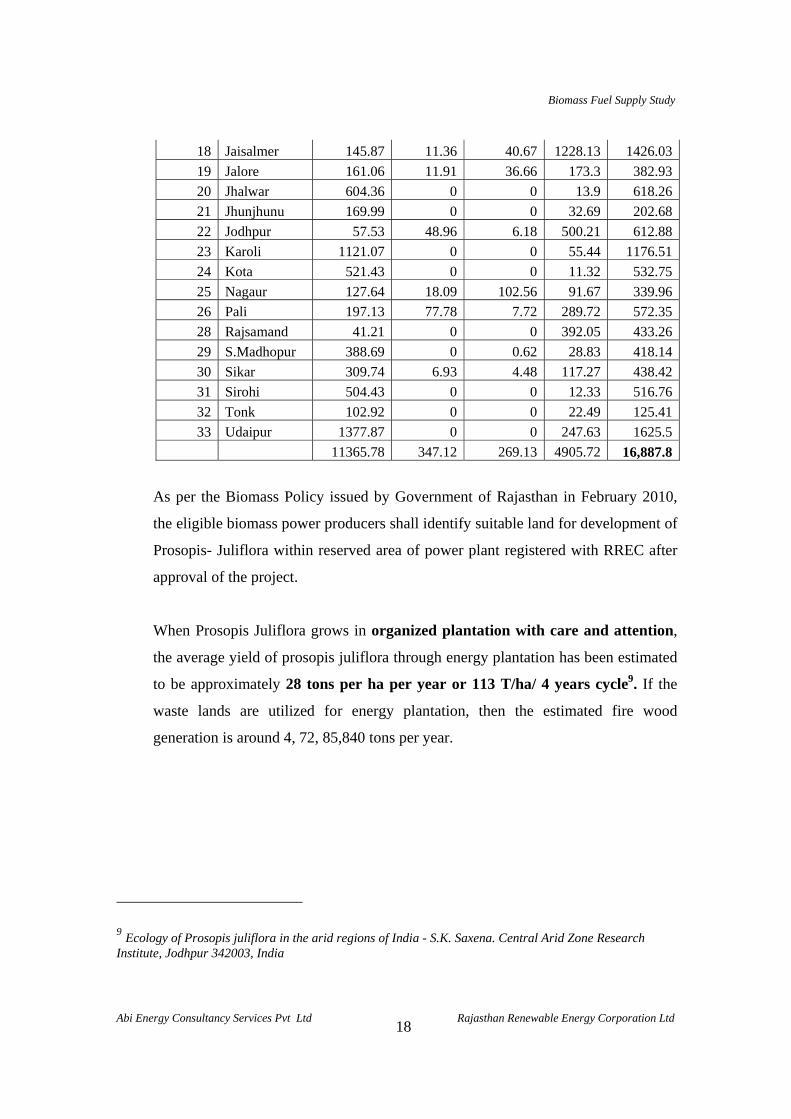
18 Jaisalmer 145.87 11.36 40.67 1228.13 1426.03
19 Jalore 161.06 11.91 36.66 173.3 382.93
20 Jhalwar 604.36 0 0 13.9 618.26
21 Jhunjhunu 169.99 0 0 32.69 202.68
22 Jodhpur 57.53 48.96 6.18 500.21 612.88
23 Karoli 1121.07 0 0 55.44 1176.51
24 Kota 521.43 0 0 11.32 532.75
25 Nagaur 127.64 18.09 102.56 91.67 339.96
26 Pali 197.13 77.78 7.72 289.72 572.35
28 Rajsamand 41.21 0 0 392.05 433.26
29 S.Madhopur 388.69 0 0.62 28.83 418.14
30 Sikar 309.74 6.93 4.48 117.27 438.42
31 Sirohi 504.43 0 0 12.33 516.76
32 Tonk 102.92 0 0 22.49 125.41
33 Udaipur 1377.87 0 0 247.63 1625.5
11365.78 347.12 269.13 4905.72 16,887.8
As per the Biomass Policy issued by Government of Rajasthan in February 2010,
the eligible biomass power producers shall identify suitable land for development of
Prosopis- Juliflora within reserved area of power plant registered with RREC after
approval of the project.
When Prosopis Juliflora grows in organized plantation with care and attention,
the average yield of prosopis juliflora through energy plantation has been estimated
to be approximately 28 tons per ha per year or 113 T/ha/ 4 years cycle9. If the
waste lands are utilized for energy plantation, then the estimated fire wood
generation is around 4, 72, 85,840 tons per year.
9 Ecology of Prosopis juliflora in the arid regions of India - S.K. Saxena. Central Arid Zone Research Institute, Jodhpur 342003, India
Biomass Fuel Supply Study
Abi Energy Consultancy Services Pvt Ltd Rajasthan Renewable Energy Corporation Ltd
19
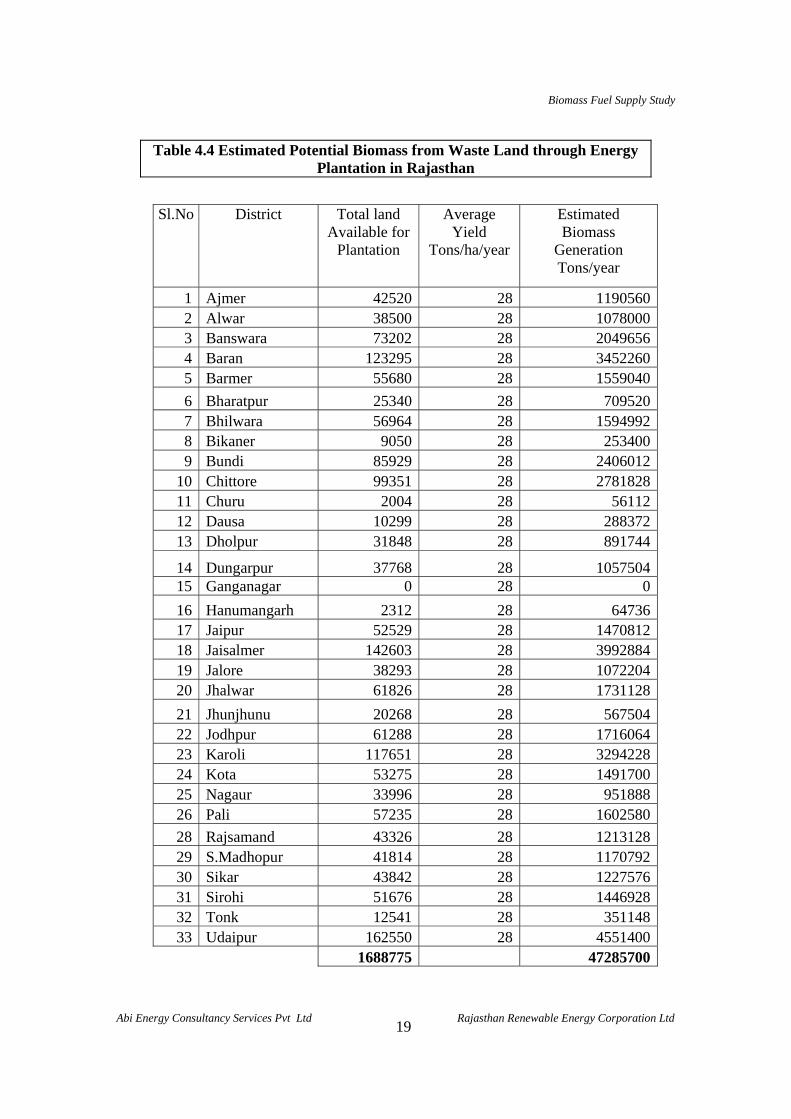
Table 4.4 Estimated Potential Biomass from Waste Land through Energy Plantation in Rajasthan
Sl.No District Total land Available for
Plantation
Average Yield
Tons/ha/year
Estimated Biomass
Generation Tons/year
1 Ajmer 42520 28 1190560 2 Alwar 38500 28 1078000 3 Banswara 73202 28 2049656 4 Baran 123295 28 3452260 5 Barmer 55680 28 1559040
6 Bharatpur 25340 28 709520 7 Bhilwara 56964 28 1594992 8 Bikaner 9050 28 253400 9 Bundi 85929 28 2406012
10 Chittore 99351 28 2781828 11 Churu 2004 28 56112 12 Dausa 10299 28 288372 13 Dholpur 31848 28 891744
14 Dungarpur 37768 28 1057504 15 Ganganagar 0 28 0
16 Hanumangarh 2312 28 64736 17 Jaipur 52529 28 1470812 18 Jaisalmer 142603 28 3992884 19 Jalore 38293 28 1072204 20 Jhalwar 61826 28 1731128
21 Jhunjhunu 20268 28 567504 22 Jodhpur 61288 28 1716064 23 Karoli 117651 28 3294228 24 Kota 53275 28 1491700 25 Nagaur 33996 28 951888 26 Pali 57235 28 1602580
28 Rajsamand 43326 28 1213128 29 S.Madhopur 41814 28 1170792 30 Sikar 43842 28 1227576 31 Sirohi 51676 28 1446928 32 Tonk 12541 28 351148 33 Udaipur 162550 28 4551400
1688775 47285700
Biomass Fuel Supply Study
Abi Energy Consultancy Services Pvt Ltd Rajasthan Renewable Energy Corporation Ltd
20
Chapter 5
MAJOR BIOMASS IN THE STUDY AREA
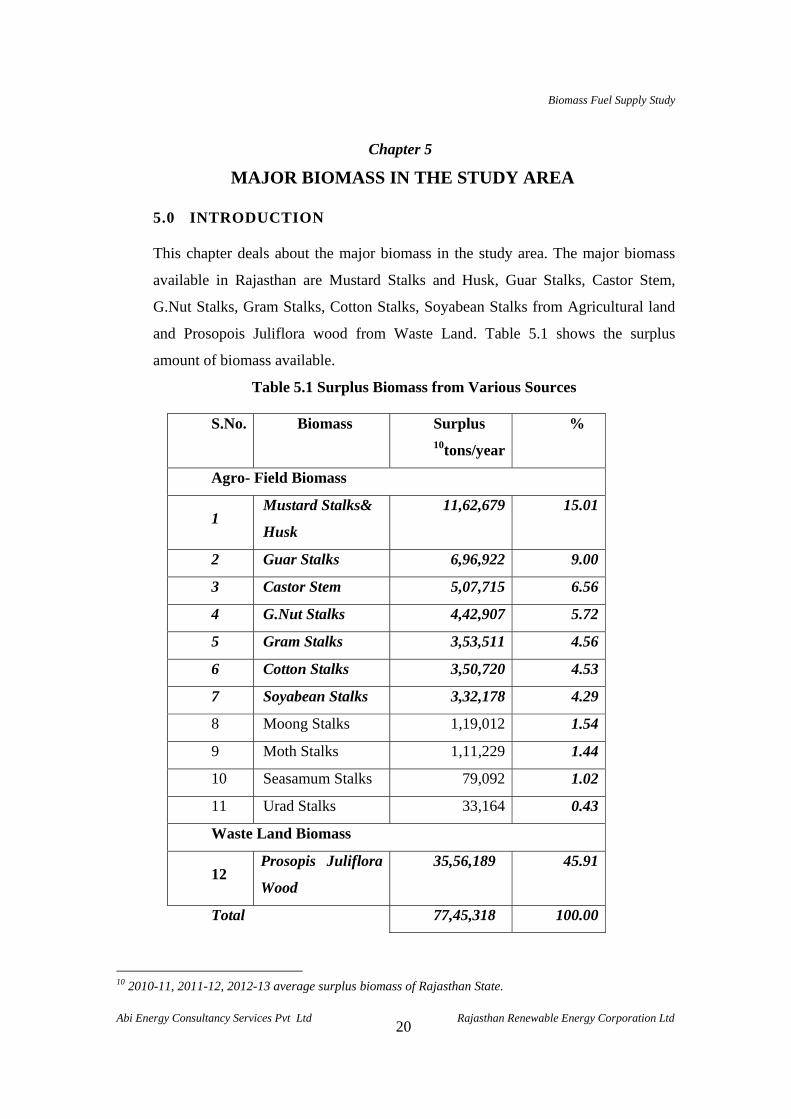
5.0 INTRODUCTION
This chapter deals about the major biomass in the study area. The major biomass
available in Rajasthan are Mustard Stalks and Husk, Guar Stalks, Castor Stem,
G.Nut Stalks, Gram Stalks, Cotton Stalks, Soyabean Stalks from Agricultural land
and Prosopois Juliflora wood from Waste Land. Table 5.1 shows the surplus
amount of biomass available.
Table 5.1 Surplus Biomass from Various Sources
S.No. Biomass Surplus 10tons/year
%
Agro- Field Biomass
1 Mustard Stalks&
Husk
11,62,679 15.01
2 Guar Stalks 6,96,922 9.00
3 Castor Stem 5,07,715 6.56
4 G.Nut Stalks 4,42,907 5.72
5 Gram Stalks 3,53,511 4.56
6 Cotton Stalks 3,50,720 4.53
7 Soyabean Stalks 3,32,178 4.29
8 Moong Stalks 1,19,012 1.54
9 Moth Stalks 1,11,229 1.44
10 Seasamum Stalks 79,092 1.02
11 Urad Stalks 33,164 0.43
Waste Land Biomass
12 Prosopis Juliflora
Wood
35,56,189 45.91
Total 77,45,318 100.00
10 2010-11, 2011-12, 2012-13 average surplus biomass of Rajasthan State.
Biomass Fuel Supply Study
Abi Energy Consultancy Services Pvt Ltd Rajasthan Renewable Energy Corporation Ltd
21
5.1 SELECTION OF SUITABLE BIOMASS FOR PLANT
The major biomasses considered for detailed discussion are as follows:
1) Mustard Stalks& Husk
2) Guar Stalks
3) Castor Steam
4) Ground Nut Stalks
5) Gram Stalks
6) Cotton Stalks
7) Soyabean Stalks
8) Prosopis Juliflora wood
Moong Stalks, Moth Stalks, Seasamum Stalks, Urad Stalks are not considered for the
detailed discussion because of its meager quantity in the study area. The district wise
major crop cultivation area, biomass generation, consumption and surplus of are
discussed below. The Prosopis Juliflora already discussed detailed in the chapter 4.
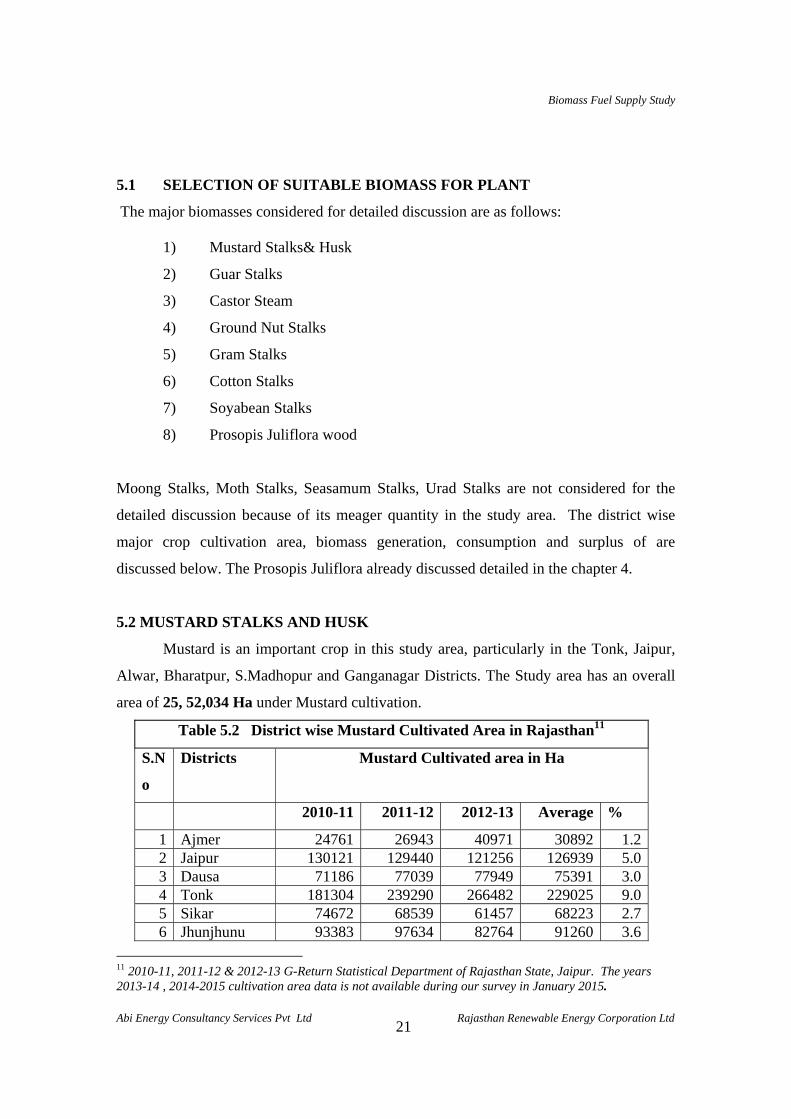
5.2 MUSTARD STALKS AND HUSK
Mustard is an important crop in this study area, particularly in the Tonk, Jaipur,
Alwar, Bharatpur, S.Madhopur and Ganganagar Districts. The Study area has an overall
area of 25, 52,034 Ha under Mustard cultivation.
Table 5.2 District wise Mustard Cultivated Area in Rajasthan11
S.N
o
Districts Mustard Cultivated area in Ha
2010-11 2011-12 2012-13 Average %
1 Ajmer 24761 26943 40971 30892 1.2 2 Jaipur 130121 129440 121256 126939 5.0 3 Dausa 71186 77039 77949 75391 3.0 4 Tonk 181304 239290 266482 229025 9.0 5 Sikar 74672 68539 61457 68223 2.7 6 Jhunjhunu 93383 97634 82764 91260 3.6
11 2010-11, 2011-12 & 2012-13 G-Return Statistical Department of Rajasthan State, Jaipur. The years 2013-14 , 2014-2015 cultivation area data is not available during our survey in January 2015.
Biomass Fuel Supply Study
Abi Energy Consultancy Services Pvt Ltd Rajasthan Renewable Energy Corporation Ltd
22
7 Nagaur 52924 29496 68825 50415 2.0 8 Alwar 252730 264822 245516 254356 10.0 9 Bharatpur 202688 208018 231278 213995 8.4
10 Dholpur 60772 69037 71388 67066 2.6 11 S.Madhopur 151680 171164 181313 168052 6.6 12 Karoli 74140 80521 82711 79124 3.1 13 Bikaner 42172 48242 49612 46675 1.8 14 Churu 20679 24100 29637 24805 1.0 15 Jaisalmer 69288 62909 57838 63345 2.5 16 Ganganagar 281408 272238 257010 270219 10.6 17 Hanumangarh 108061 88991 105523 100858 4.0 18 Jodhpur 78487 63350 79784 73874 2.9 19 Barmer 25982 10249 14604 16945 0.7 20 Jalore 105461 46496 69169 73709 2.9 21 Pali 44012 40601 70796 51803 2.0 22 Sirohi 22935 17687 22768 21130 0.8 23 Kota 55614 60738 76313 64222 2.5 24 Baran 77635 65192 89736 77521 3.0 25 Bundi 41689 53284 66967 53980 2.1 26 Jhalwar 32622 32390 79561 48191 1.9 27 Banswara 111 99 83 98 0.0 28 Dungarpur 926 760 925 870 0.0 29 Udaipur 17541 13925 13107 14858 0.6 30 Pratapgarh 5585 5267 10797 7216 0.3 31 Bhilwara 32230 28729 42144 34368 1.3 32 Chittore 53119 40643 54103 49288 1.9 33 Rajsamand 3974 3421 2569 3321 0.1
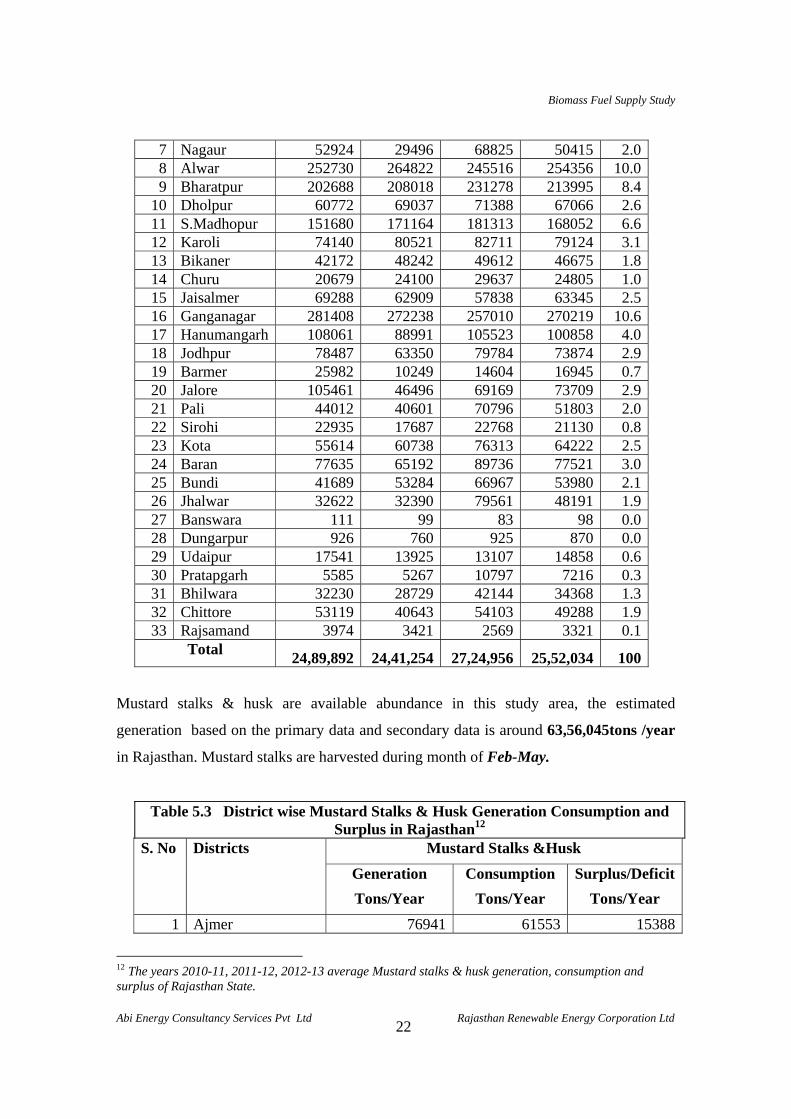
Total 24,89,892 24,41,254 27,24,956 25,52,034 100
Mustard stalks & husk are available abundance in this study area, the estimated
generation based on the primary data and secondary data is around 63,56,045tons /year
in Rajasthan. Mustard stalks are harvested during month of Feb-May.
Table 5.3 District wise Mustard Stalks & Husk Generation Consumption and Surplus in Rajasthan12
S. No Districts Mustard Stalks &Husk
Generation
Tons/Year
Consumption
Tons/Year
Surplus/Deficit
Tons/Year
1 Ajmer 76941 61553 15388
12 The years 2010-11, 2011-12, 2012-13 average Mustard stalks & husk generation, consumption and surplus of Rajasthan State.
Biomass Fuel Supply Study
Abi Energy Consultancy Services Pvt Ltd Rajasthan Renewable Energy Corporation Ltd
23
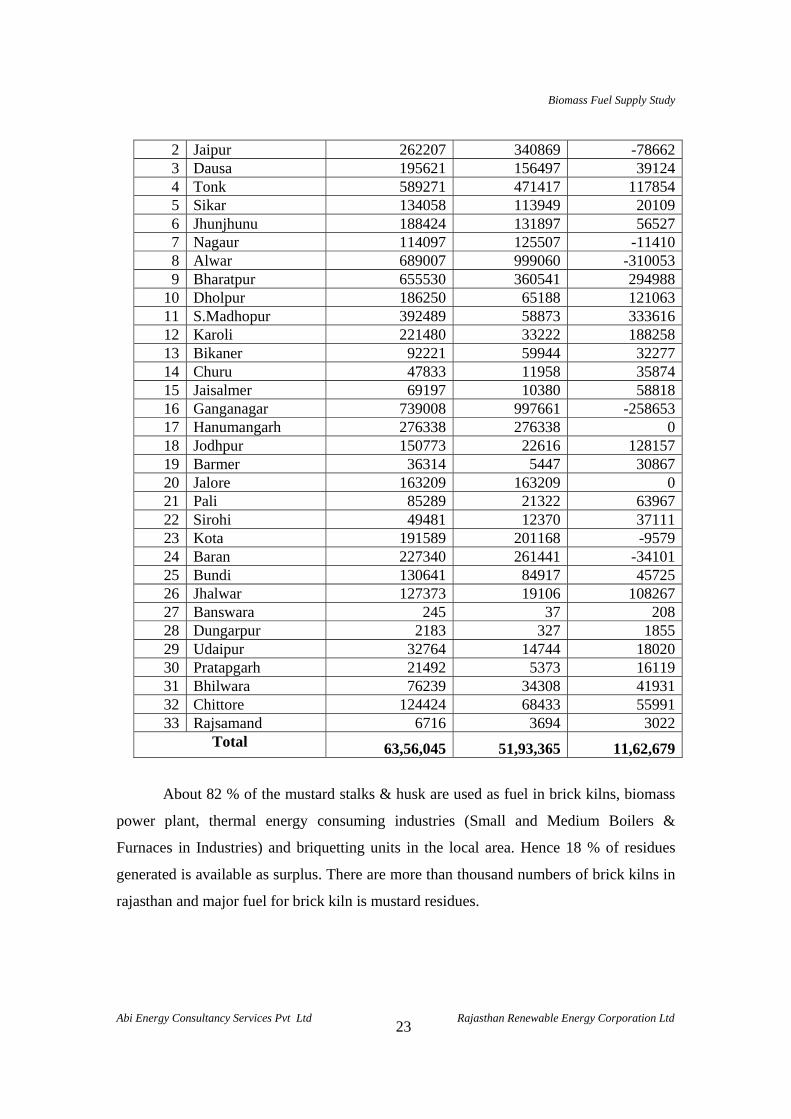
2 Jaipur 262207 340869 -786623 Dausa 195621 156497 391244 Tonk 589271 471417 1178545 Sikar 134058 113949 201096 Jhunjhunu 188424 131897 565277 Nagaur 114097 125507 -114108 Alwar 689007 999060 -3100539 Bharatpur 655530 360541 294988
10 Dholpur 186250 65188 12106311 S.Madhopur 392489 58873 33361612 Karoli 221480 33222 18825813 Bikaner 92221 59944 3227714 Churu 47833 11958 3587415 Jaisalmer 69197 10380 5881816 Ganganagar 739008 997661 -25865317 Hanumangarh 276338 276338 018 Jodhpur 150773 22616 12815719 Barmer 36314 5447 3086720 Jalore 163209 163209 021 Pali 85289 21322 6396722 Sirohi 49481 12370 3711123 Kota 191589 201168 -957924 Baran 227340 261441 -3410125 Bundi 130641 84917 4572526 Jhalwar 127373 19106 10826727 Banswara 245 37 20828 Dungarpur 2183 327 185529 Udaipur 32764 14744 1802030 Pratapgarh 21492 5373 1611931 Bhilwara 76239 34308 4193132 Chittore 124424 68433 5599133 Rajsamand 6716 3694 3022
Total 63,56,045 51,93,365 11,62,679
About 82 % of the mustard stalks & husk are used as fuel in brick kilns, biomass
power plant, thermal energy consuming industries (Small and Medium Boilers &
Furnaces in Industries) and briquetting units in the local area. Hence 18 % of residues
generated is available as surplus. There are more than thousand numbers of brick kilns in
rajasthan and major fuel for brick kiln is mustard residues.
Biomass Fuel Supply Study
Abi Energy Consultancy Services Pvt Ltd Rajasthan Renewable Energy Corporation Ltd
24
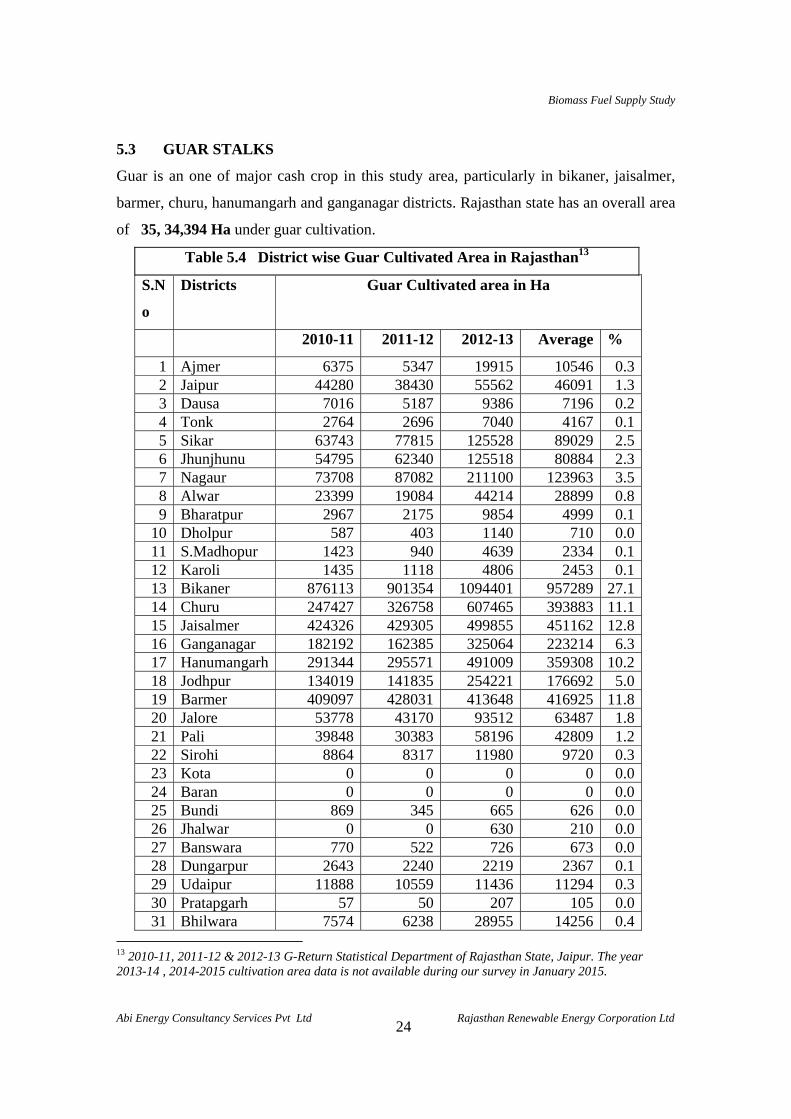
5.3 GUAR STALKS
Guar is an one of major cash crop in this study area, particularly in bikaner, jaisalmer,
barmer, churu, hanumangarh and ganganagar districts. Rajasthan state has an overall area
of 35, 34,394 Ha under guar cultivation.
Table 5.4 District wise Guar Cultivated Area in Rajasthan13
S.N
o
Districts Guar Cultivated area in Ha
2010-11 2011-12 2012-13 Average %
1 Ajmer 6375 5347 19915 10546 0.3 2 Jaipur 44280 38430 55562 46091 1.3 3 Dausa 7016 5187 9386 7196 0.2 4 Tonk 2764 2696 7040 4167 0.1 5 Sikar 63743 77815 125528 89029 2.5 6 Jhunjhunu 54795 62340 125518 80884 2.3 7 Nagaur 73708 87082 211100 123963 3.5 8 Alwar 23399 19084 44214 28899 0.8 9 Bharatpur 2967 2175 9854 4999 0.1
10 Dholpur 587 403 1140 710 0.0 11 S.Madhopur 1423 940 4639 2334 0.1 12 Karoli 1435 1118 4806 2453 0.1 13 Bikaner 876113 901354 1094401 957289 27.1 14 Churu 247427 326758 607465 393883 11.1 15 Jaisalmer 424326 429305 499855 451162 12.8 16 Ganganagar 182192 162385 325064 223214 6.3 17 Hanumangarh 291344 295571 491009 359308 10.2 18 Jodhpur 134019 141835 254221 176692 5.0 19 Barmer 409097 428031 413648 416925 11.8 20 Jalore 53778 43170 93512 63487 1.8 21 Pali 39848 30383 58196 42809 1.2 22 Sirohi 8864 8317 11980 9720 0.3 23 Kota 0 0 0 0 0.0 24 Baran 0 0 0 0 0.0 25 Bundi 869 345 665 626 0.0 26 Jhalwar 0 0 630 210 0.0 27 Banswara 770 522 726 673 0.0 28 Dungarpur 2643 2240 2219 2367 0.1 29 Udaipur 11888 10559 11436 11294 0.3 30 Pratapgarh 57 50 207 105 0.0 31 Bhilwara 7574 6238 28955 14256 0.4
13 2010-11, 2011-12 & 2012-13 G-Return Statistical Department of Rajasthan State, Jaipur. The year 2013-14 , 2014-2015 cultivation area data is not available during our survey in January 2015.
Biomass Fuel Supply Study
Abi Energy Consultancy Services Pvt Ltd Rajasthan Renewable Energy Corporation Ltd
25
32 Chittore 3756 3436 8486 5226 0.1 33 Rajsamand 3889 2753 4991 3878 0.1
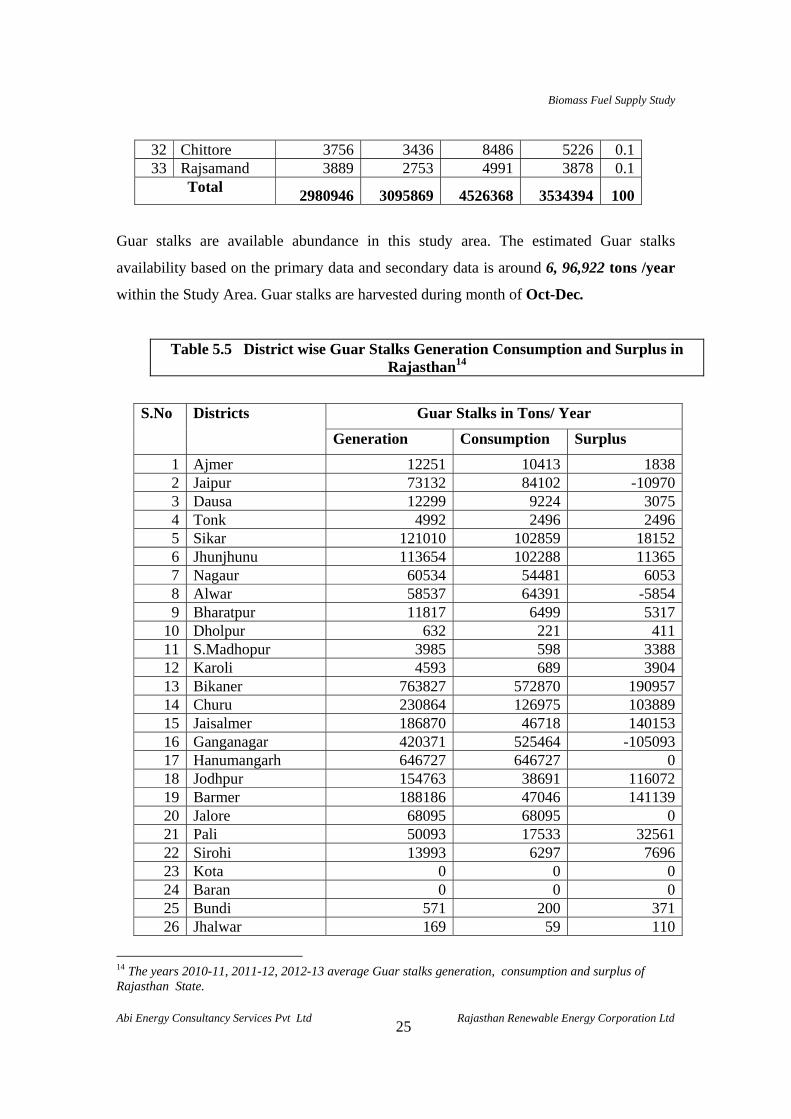
Total 2980946 3095869 4526368 3534394 100
Guar stalks are available abundance in this study area. The estimated Guar stalks
availability based on the primary data and secondary data is around 6, 96,922 tons /year
within the Study Area. Guar stalks are harvested during month of Oct-Dec.
Table 5.5 District wise Guar Stalks Generation Consumption and Surplus in Rajasthan14
S.No Districts Guar Stalks in Tons/ Year
Generation Consumption Surplus
1 Ajmer 12251 10413 18382 Jaipur 73132 84102 -109703 Dausa 12299 9224 30754 Tonk 4992 2496 24965 Sikar 121010 102859 181526 Jhunjhunu 113654 102288 113657 Nagaur 60534 54481 60538 Alwar 58537 64391 -58549 Bharatpur 11817 6499 5317
10 Dholpur 632 221 41111 S.Madhopur 3985 598 338812 Karoli 4593 689 390413 Bikaner 763827 572870 19095714 Churu 230864 126975 10388915 Jaisalmer 186870 46718 14015316 Ganganagar 420371 525464 -10509317 Hanumangarh 646727 646727 018 Jodhpur 154763 38691 11607219 Barmer 188186 47046 14113920 Jalore 68095 68095 021 Pali 50093 17533 3256122 Sirohi 13993 6297 769623 Kota 0 0 024 Baran 0 0 025 Bundi 571 200 37126 Jhalwar 169 59 110
14 The years 2010-11, 2011-12, 2012-13 average Guar stalks generation, consumption and surplus of Rajasthan State.
Biomass Fuel Supply Study
Abi Energy Consultancy Services Pvt Ltd Rajasthan Renewable Energy Corporation Ltd
26
27 Banswara 729 255 47428 Dungarpur 2068 724 134429 Udaipur 16623 5818 1080530 Pratapgarh 91 32 5931 Bhilwara 14521 3630 1089032 Chittore 5890 2651 324033 Rajsamand 4740 1659 3081
Total 32,46,627 25,49,705 6,96,922
About 79 % of the stalks are used for fodder, brick units, briquetting units and industrial
fuel purposes. Hence 21 % of stalks generated is available as surplus.
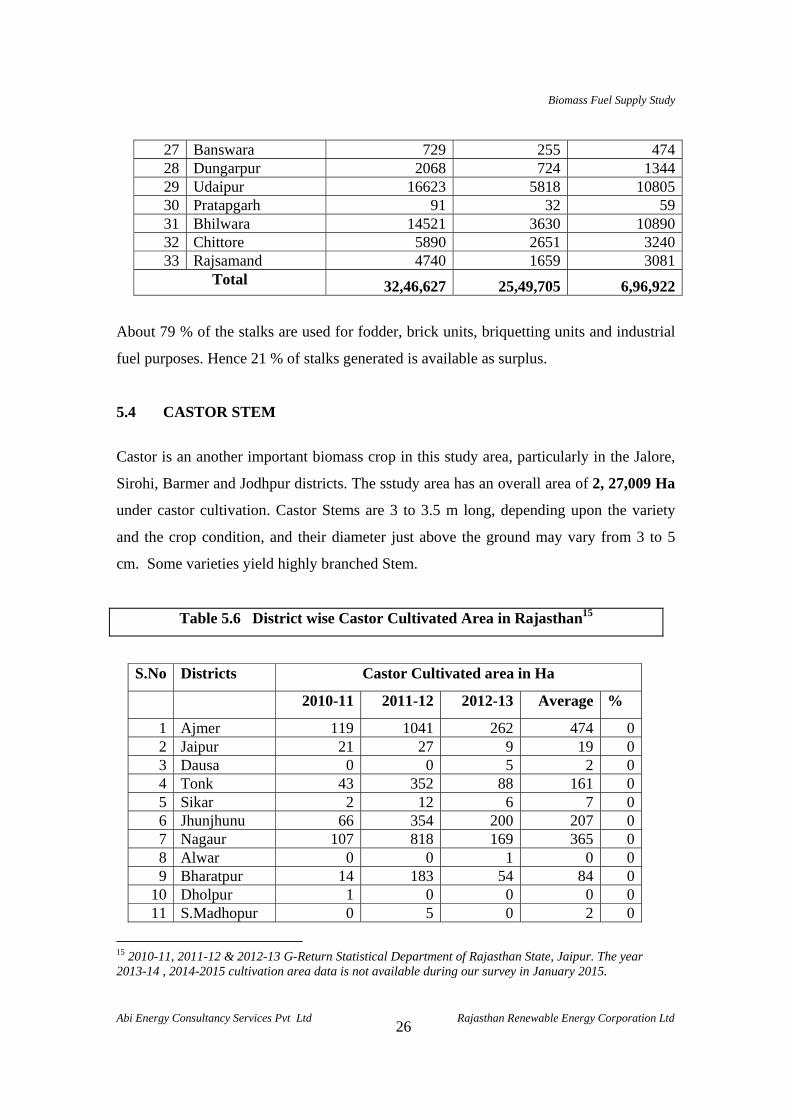
5.4 CASTOR STEM
Castor is an another important biomass crop in this study area, particularly in the Jalore,
Sirohi, Barmer and Jodhpur districts. The sstudy area has an overall area of 2, 27,009 Ha
under castor cultivation. Castor Stems are 3 to 3.5 m long, depending upon the variety
and the crop condition, and their diameter just above the ground may vary from 3 to 5
cm. Some varieties yield highly branched Stem.
Table 5.6 District wise Castor Cultivated Area in Rajasthan15
S.No Districts Castor Cultivated area in Ha
2010-11 2011-12 2012-13 Average %
1 Ajmer 119 1041 262 474 0 2 Jaipur 21 27 9 19 0 3 Dausa 0 0 5 2 0 4 Tonk 43 352 88 161 0 5 Sikar 2 12 6 7 0 6 Jhunjhunu 66 354 200 207 0 7 Nagaur 107 818 169 365 0 8 Alwar 0 0 1 0 0 9 Bharatpur 14 183 54 84 0
10 Dholpur 1 0 0 0 0 11 S.Madhopur 0 5 0 2 0
15 2010-11, 2011-12 & 2012-13 G-Return Statistical Department of Rajasthan State, Jaipur. The year 2013-14 , 2014-2015 cultivation area data is not available during our survey in January 2015.
Biomass Fuel Supply Study
Abi Energy Consultancy Services Pvt Ltd Rajasthan Renewable Energy Corporation Ltd
27
12 Karoli 0 1 2 1 0 13 Bikaner 145 581 222 316 0 14 Churu 0 11 6 6 0 15 Jaisalmer 2103 7493 6018 5205 2 16 Ganganagar 1694 3052 728 1825 1 17 Hanumangarh 4179 5611 777 3522 2 18 Jodhpur 25682 40266 39249 35066 15 19 Barmer 29510 43147 37502 36720 16 20 Jalore 67253 123273 87067 92531 41 21 Pali 2792 10904 6519 6738 3 22 Sirohi 32879 53173 43519 43190 19 23 Kota 0 0 11 4 0 24 Baran 0 2 0 1 0 25 Bundi 0 21 9 10 0 26 Jhalwar 0 2 0 1 0 27 Banswara 31 32 7 23 0 28 Dungarpur 32 549 435 339 0 29 Udaipur 17 17 27 20 0 30 Pratapgarh 35 4 1 13 0 31 Bhilwara 15 337 94 149 0 32 Chittore 6 26 1 11 0 33 Rajsamand 0 0 0 0 0
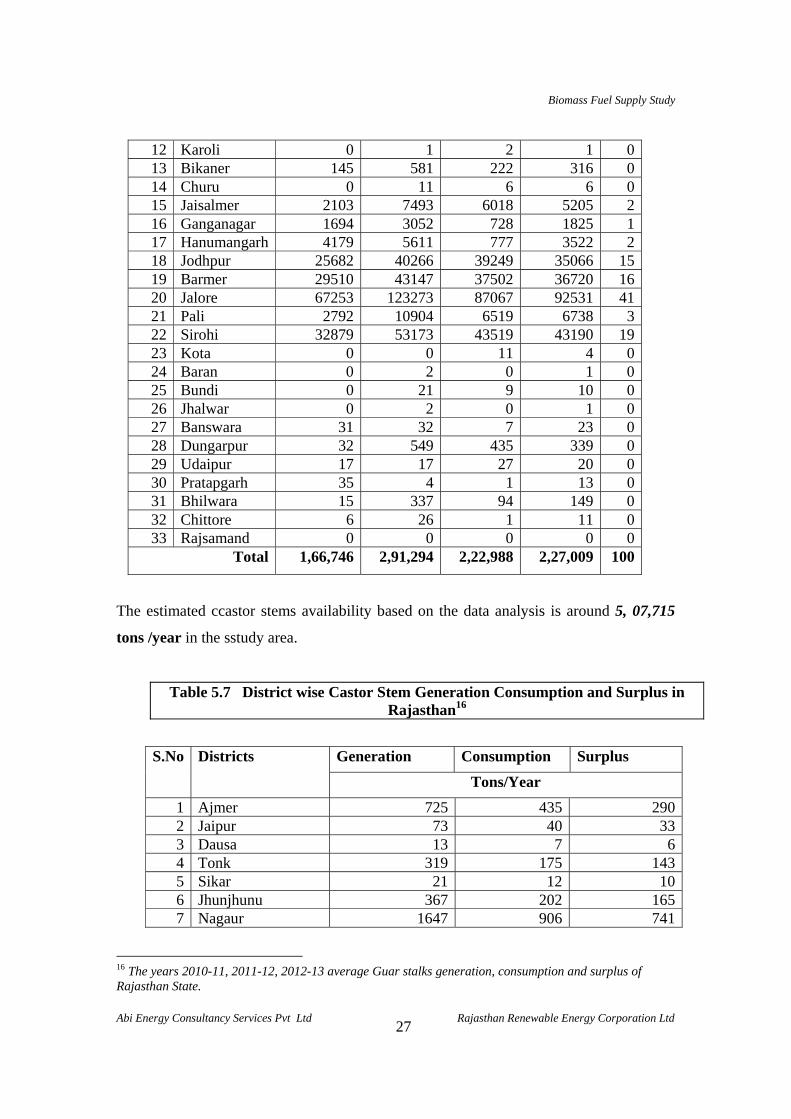
Total 1,66,746 2,91,294 2,22,988 2,27,009 100
The estimated ccastor stems availability based on the data analysis is around 5, 07,715
tons /year in the sstudy area.
Table 5.7 District wise Castor Stem Generation Consumption and Surplus in Rajasthan16
S.No Districts Generation Consumption Surplus
Tons/Year
1 Ajmer 725 435 2902 Jaipur 73 40 333 Dausa 13 7 64 Tonk 319 175 1435 Sikar 21 12 106 Jhunjhunu 367 202 1657 Nagaur 1647 906 741
16 The years 2010-11, 2011-12, 2012-13 average Guar stalks generation, consumption and surplus of Rajasthan State.
Biomass Fuel Supply Study
Abi Energy Consultancy Services Pvt Ltd Rajasthan Renewable Energy Corporation Ltd
28
8 Alwar 0 0 09 Bharatpur 323 177 145
10 Dholpur 1 1 111 S.Madhopur 7 4 312 Karoli 4 2 213 Bikaner 1245 685 56014 Churu 12 7 515 Jaisalmer 5858 3222 263616 Ganganagar 4232 2328 190517 Hanumangarh 25714 19285 642818 Jodhpur 69888 45427 2446119 Barmer 110099 71564 3853520 Jalore 767620 498953 26866721 Pali 20688 11379 931022 Sirohi 340158 187087 15307123 Kota 13 7 624 Baran 3 1 125 Bundi 40 22 1826 Jhalwar 1 1 127 Banswara 12 7 528 Dungarpur 777 428 35029 Udaipur 61 34 2830 Pratapgarh 19 10 831 Bhilwara 344 189 15532 Chittore 57 32 2633 Rajsamand 0 0 0
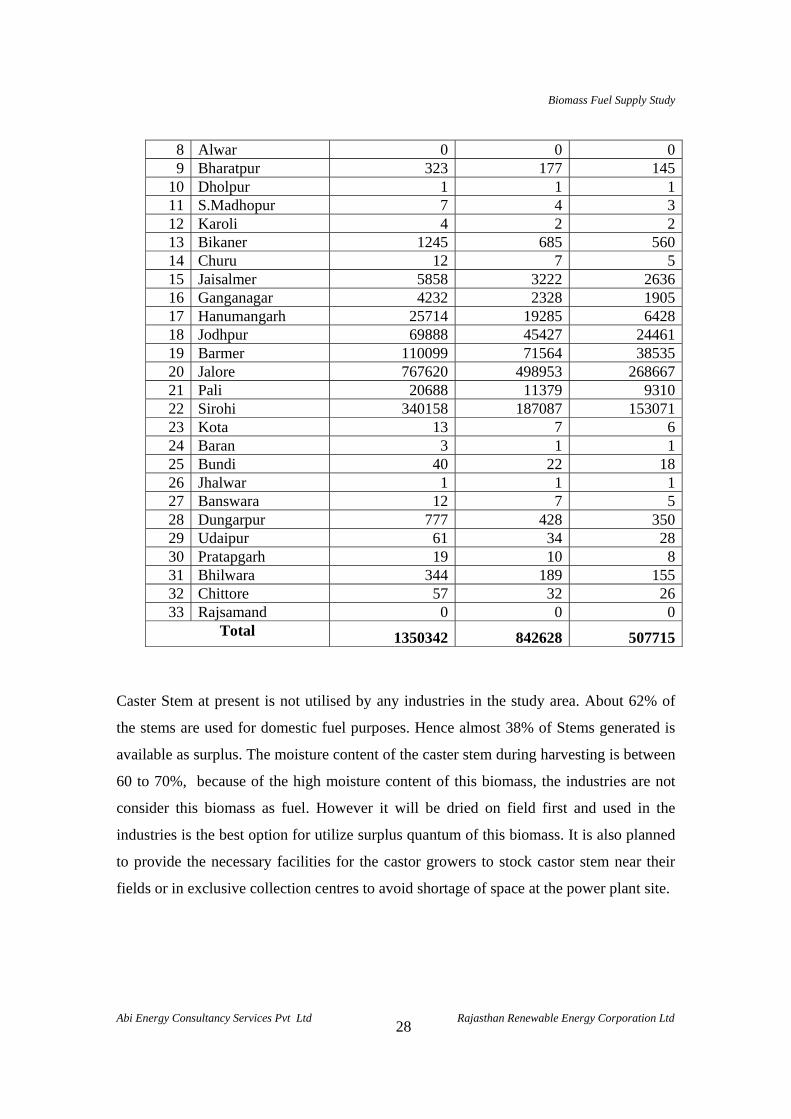
Total 1350342 842628 507715
Caster Stem at present is not utilised by any industries in the study area. About 62% of
the stems are used for domestic fuel purposes. Hence almost 38% of Stems generated is
available as surplus. The moisture content of the caster stem during harvesting is between
60 to 70%, because of the high moisture content of this biomass, the industries are not
consider this biomass as fuel. However it will be dried on field first and used in the
industries is the best option for utilize surplus quantum of this biomass. It is also planned
to provide the necessary facilities for the castor growers to stock castor stem near their
fields or in exclusive collection centres to avoid shortage of space at the power plant site.
Biomass Fuel Supply Study
Abi Energy Consultancy Services Pvt Ltd Rajasthan Renewable Energy Corporation Ltd
29
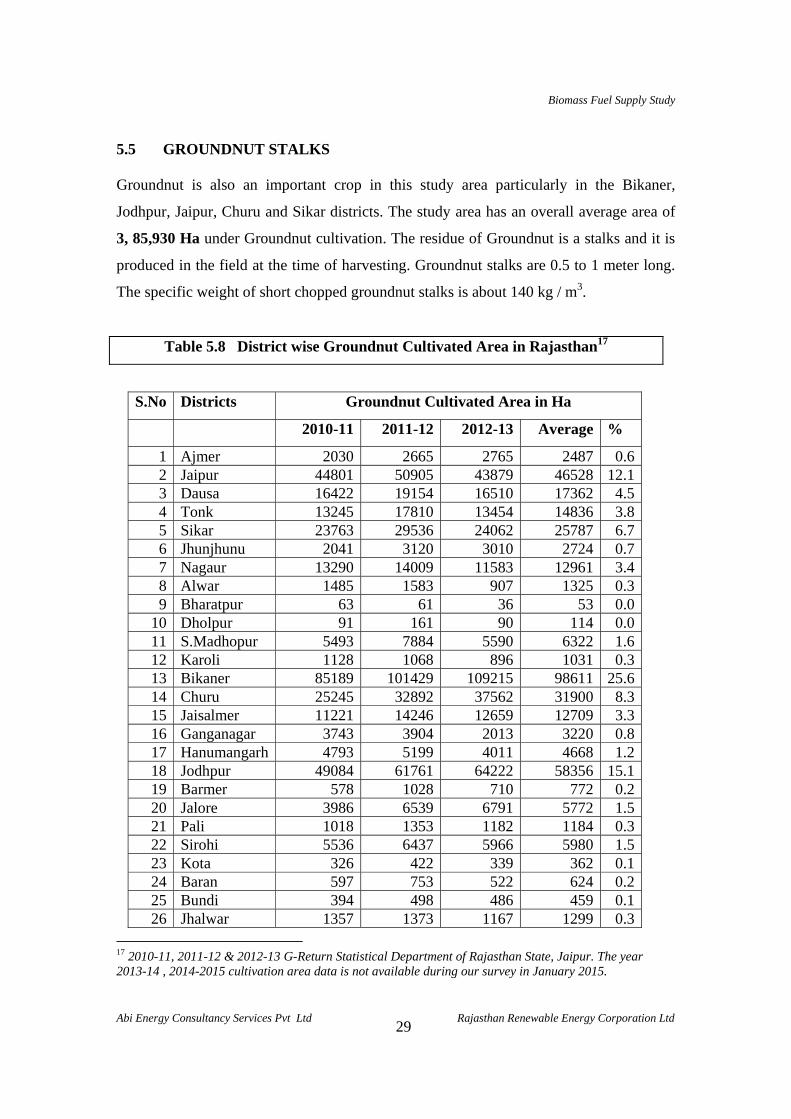
5.5 GROUNDNUT STALKS
Groundnut is also an important crop in this study area particularly in the Bikaner,
Jodhpur, Jaipur, Churu and Sikar districts. The study area has an overall average area of
3, 85,930 Ha under Groundnut cultivation. The residue of Groundnut is a stalks and it is
produced in the field at the time of harvesting. Groundnut stalks are 0.5 to 1 meter long.
The specific weight of short chopped groundnut stalks is about 140 kg / m3.
Table 5.8 District wise Groundnut Cultivated Area in Rajasthan17
S.No Districts Groundnut Cultivated Area in Ha
2010-11 2011-12 2012-13 Average %
1 Ajmer 2030 2665 2765 2487 0.6 2 Jaipur 44801 50905 43879 46528 12.1 3 Dausa 16422 19154 16510 17362 4.5 4 Tonk 13245 17810 13454 14836 3.8 5 Sikar 23763 29536 24062 25787 6.7 6 Jhunjhunu 2041 3120 3010 2724 0.7 7 Nagaur 13290 14009 11583 12961 3.4 8 Alwar 1485 1583 907 1325 0.3 9 Bharatpur 63 61 36 53 0.0
10 Dholpur 91 161 90 114 0.0 11 S.Madhopur 5493 7884 5590 6322 1.6 12 Karoli 1128 1068 896 1031 0.3 13 Bikaner 85189 101429 109215 98611 25.6 14 Churu 25245 32892 37562 31900 8.3 15 Jaisalmer 11221 14246 12659 12709 3.3 16 Ganganagar 3743 3904 2013 3220 0.8 17 Hanumangarh 4793 5199 4011 4668 1.2 18 Jodhpur 49084 61761 64222 58356 15.1 19 Barmer 578 1028 710 772 0.2 20 Jalore 3986 6539 6791 5772 1.5 21 Pali 1018 1353 1182 1184 0.3 22 Sirohi 5536 6437 5966 5980 1.5 23 Kota 326 422 339 362 0.1 24 Baran 597 753 522 624 0.2 25 Bundi 394 498 486 459 0.1 26 Jhalwar 1357 1373 1167 1299 0.3
17 2010-11, 2011-12 & 2012-13 G-Return Statistical Department of Rajasthan State, Jaipur. The year 2013-14 , 2014-2015 cultivation area data is not available during our survey in January 2015.
Biomass Fuel Supply Study
Abi Energy Consultancy Services Pvt Ltd Rajasthan Renewable Energy Corporation Ltd
30
27 Banswara 189 205 163 186 0.0 28 Dungarpur 31 41 6 26 0.0 29 Udaipur 3185 2814 2803 2934 0.8 30 Pratapgarh 801 808 584 731 0.2 31 Bhilwara 6918 7196 6400 6838 1.8 32 Chittore 19393 19379 16580 18451 4.8 33 Rajsamand 1895 1877 1646 1806 0.5
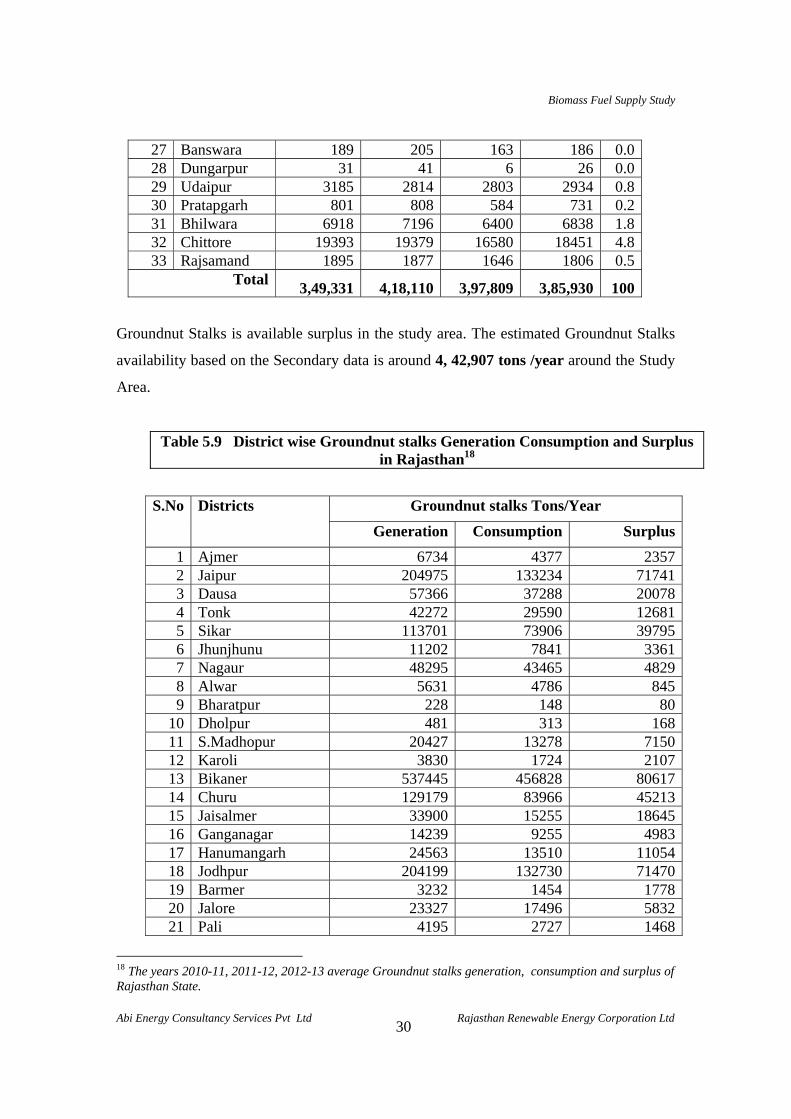
Total 3,49,331 4,18,110 3,97,809 3,85,930 100
Groundnut Stalks is available surplus in the study area. The estimated Groundnut Stalks
availability based on the Secondary data is around 4, 42,907 tons /year around the Study
Area.
Table 5.9 District wise Groundnut stalks Generation Consumption and Surplus in Rajasthan18
S.No Districts Groundnut stalks Tons/Year
Generation Consumption Surplus
1 Ajmer 6734 4377 23572 Jaipur 204975 133234 717413 Dausa 57366 37288 200784 Tonk 42272 29590 126815 Sikar 113701 73906 397956 Jhunjhunu 11202 7841 33617 Nagaur 48295 43465 48298 Alwar 5631 4786 8459 Bharatpur 228 148 80
10 Dholpur 481 313 16811 S.Madhopur 20427 13278 715012 Karoli 3830 1724 210713 Bikaner 537445 456828 8061714 Churu 129179 83966 4521315 Jaisalmer 33900 15255 1864516 Ganganagar 14239 9255 498317 Hanumangarh 24563 13510 1105418 Jodhpur 204199 132730 7147019 Barmer 3232 1454 177820 Jalore 23327 17496 583221 Pali 4195 2727 1468
18 The years 2010-11, 2011-12, 2012-13 average Groundnut stalks generation, consumption and surplus of Rajasthan State.
Biomass Fuel Supply Study
Abi Energy Consultancy Services Pvt Ltd Rajasthan Renewable Energy Corporation Ltd
31
22 Sirohi 21970 16477 549223 Kota 1517 1138 37924 Baran 2632 1711 92125 Bundi 1907 1621 28626 Jhalwar 4595 2068 252727 Banswara 781 352 43028 Dungarpur 114 51 6329 Udaipur 5851 3803 204830 Pratapgarh 2459 1599 86131 Bhilwara 19175 12464 671132 Chittore 61808 46356 1545233 Rajsamand 4244 2758 1485
Total 16,16,475 11,73,568 4,42,907
Groundnut stalks is the residue left after the removal of the kernel form the pod. At
present 73 % of the generated stalks is consumed by local people for domestic activity,
some the brick kilns, biomass power plant and thermal industries in this study area.
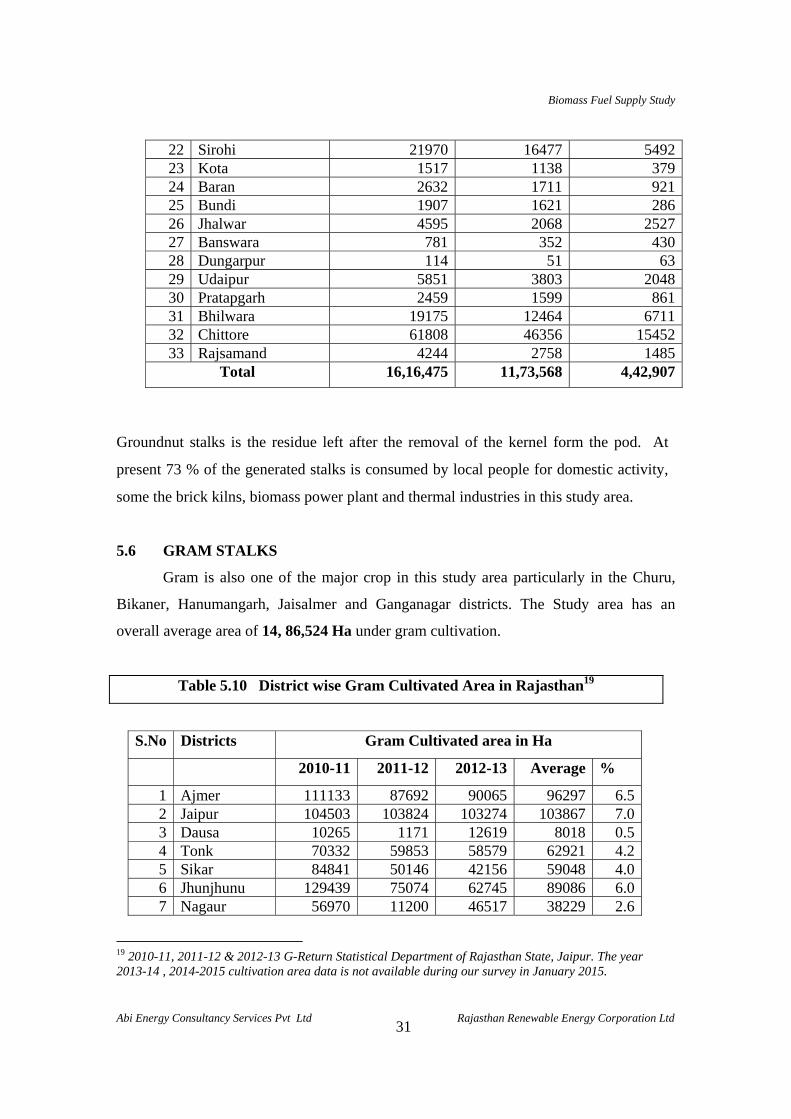
5.6 GRAM STALKS
Gram is also one of the major crop in this study area particularly in the Churu,
Bikaner, Hanumangarh, Jaisalmer and Ganganagar districts. The Study area has an
overall average area of 14, 86,524 Ha under gram cultivation.
Table 5.10 District wise Gram Cultivated Area in Rajasthan19
S.No Districts Gram Cultivated area in Ha
2010-11 2011-12 2012-13 Average %
1 Ajmer 111133 87692 90065 96297 6.5 2 Jaipur 104503 103824 103274 103867 7.0 3 Dausa 10265 1171 12619 8018 0.5 4 Tonk 70332 59853 58579 62921 4.2 5 Sikar 84841 50146 42156 59048 4.0 6 Jhunjhunu 129439 75074 62745 89086 6.0 7 Nagaur 56970 11200 46517 38229 2.6
19 2010-11, 2011-12 & 2012-13 G-Return Statistical Department of Rajasthan State, Jaipur. The year 2013-14 , 2014-2015 cultivation area data is not available during our survey in January 2015.
Biomass Fuel Supply Study
Abi Energy Consultancy Services Pvt Ltd Rajasthan Renewable Energy Corporation Ltd
32
8 Alwar 13667 11289 11914 12290 0.8 9 Bharatpur 4885 4437 4321 4548 0.3
10 Dholpur 2266 1874 1496 1879 0.1 11 S.Madhopur 19231 14406 16552 16730 1.1 12 Karoli 16625 18650 16888 17388 1.2 13 Bikaner 163767 170383 188566 174239 11.7 14 Churu 358725 319454 127128 268436 18.1 15 Jaisalmer 79529 94024 130493 101349 6.8 16 Ganganagar 103991 93642 100048 99227 6.7 17 Hanumangarh 193983 154335 70150 139489 9.4 18 Jodhpur 5802 2820 1889 3504 0.2 19 Barmer 1072 461 297 610 0.0 20 Jalore 7910 4115 1848 4624 0.3 21 Pali 54513 14976 34268 34586 2.3 22 Sirohi 7515 5397 2578 5163 0.3 23 Kota 7942 5799 4098 5946 0.4 24 Baran 7628 3948 9450 7009 0.5 25 Bundi 9065 5824 5190 6693 0.5 26 Jhalwar 36467 14761 16993 22740 1.5 27 Banswara 13828 13719 13751 13766 0.9 28 Dungarpur 13566 14971 15384 14640 1.0 29 Udaipur 11157 9563 8420 9713 0.7 30 Pratapgarh 22421 19380 19020 20274 1.4 31 Bhilwara 50088 29300 29244 36211 2.4 32 Chittore 8817 5935 6013 6922 0.5 33 Rajsamand 1338 931 982 1084 0.1
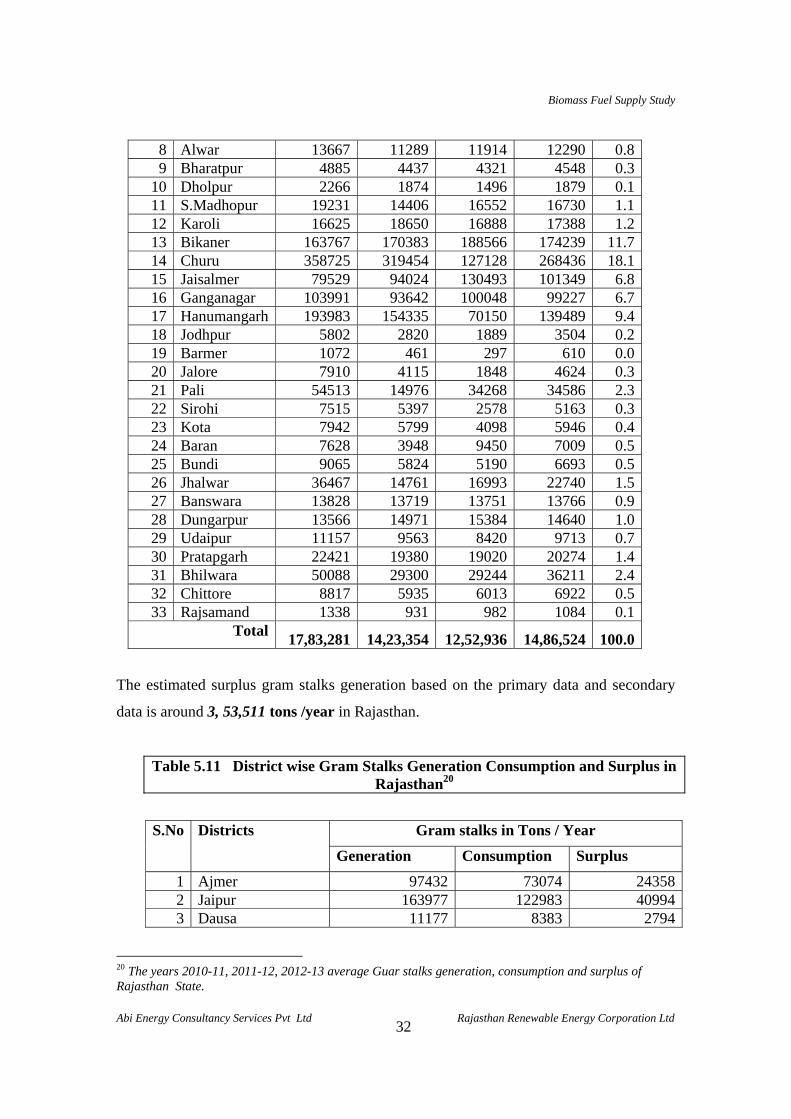
Total 17,83,281 14,23,354 12,52,936 14,86,524 100.0
The estimated surplus gram stalks generation based on the primary data and secondary
data is around 3, 53,511 tons /year in Rajasthan.
Table 5.11 District wise Gram Stalks Generation Consumption and Surplus in Rajasthan20
S.No Districts Gram stalks in Tons / Year
Generation Consumption Surplus
1 Ajmer 97432 73074 243582 Jaipur 163977 122983 409943 Dausa 11177 8383 2794
20 The years 2010-11, 2011-12, 2012-13 average Guar stalks generation, consumption and surplus of Rajasthan State.
Biomass Fuel Supply Study
Abi Energy Consultancy Services Pvt Ltd Rajasthan Renewable Energy Corporation Ltd
33
4 Tonk 65638 49228 164095 Sikar 76616 57462 191546 Jhunjhunu 111774 83830 279437 Nagaur 45771 34328 114438 Alwar 18617 13963 46549 Bharatpur 8144 6108 2036
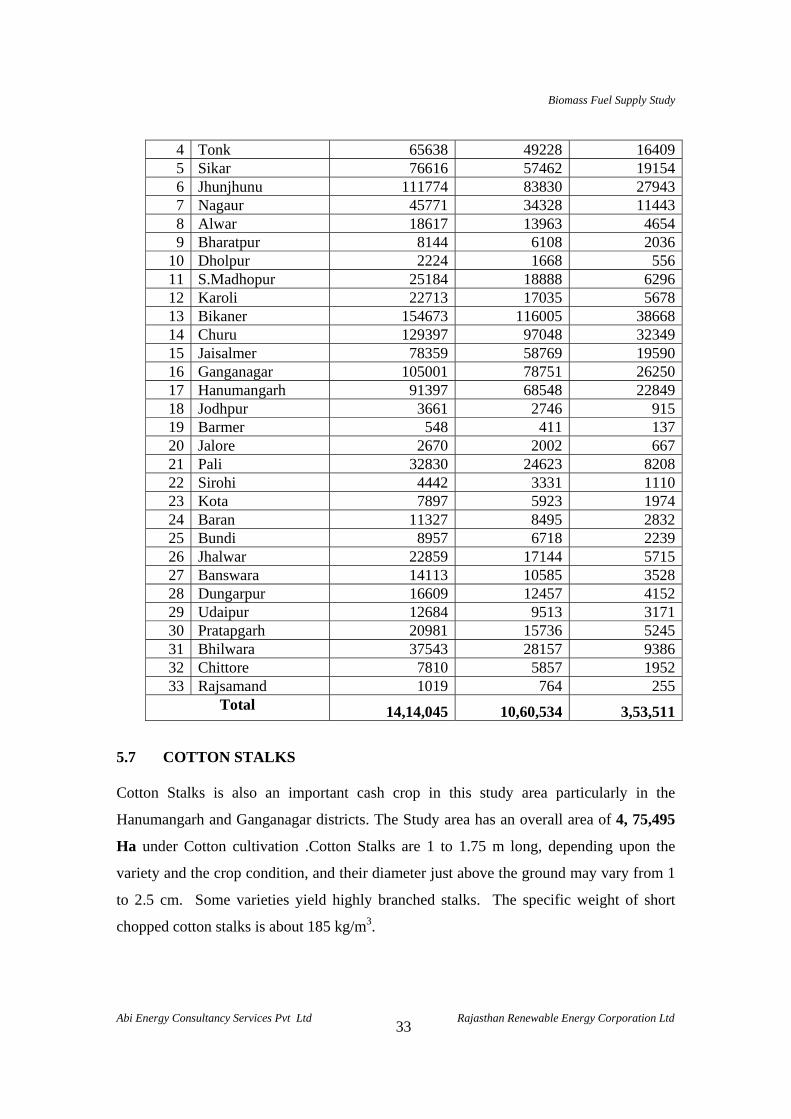
10 Dholpur 2224 1668 55611 S.Madhopur 25184 18888 629612 Karoli 22713 17035 567813 Bikaner 154673 116005 3866814 Churu 129397 97048 3234915 Jaisalmer 78359 58769 1959016 Ganganagar 105001 78751 2625017 Hanumangarh 91397 68548 2284918 Jodhpur 3661 2746 91519 Barmer 548 411 13720 Jalore 2670 2002 66721 Pali 32830 24623 820822 Sirohi 4442 3331 111023 Kota 7897 5923 197424 Baran 11327 8495 283225 Bundi 8957 6718 223926 Jhalwar 22859 17144 571527 Banswara 14113 10585 352828 Dungarpur 16609 12457 415229 Udaipur 12684 9513 317130 Pratapgarh 20981 15736 524531 Bhilwara 37543 28157 938632 Chittore 7810 5857 195233 Rajsamand 1019 764 255
Total 14,14,045 10,60,534 3,53,511
5.7 COTTON STALKS
Cotton Stalks is also an important cash crop in this study area particularly in the
Hanumangarh and Ganganagar districts. The Study area has an overall area of 4, 75,495
Ha under Cotton cultivation .Cotton Stalks are 1 to 1.75 m long, depending upon the
variety and the crop condition, and their diameter just above the ground may vary from 1
to 2.5 cm. Some varieties yield highly branched stalks. The specific weight of short
chopped cotton stalks is about 185 kg/m3.
Biomass Fuel Supply Study
Abi Energy Consultancy Services Pvt Ltd Rajasthan Renewable Energy Corporation Ltd
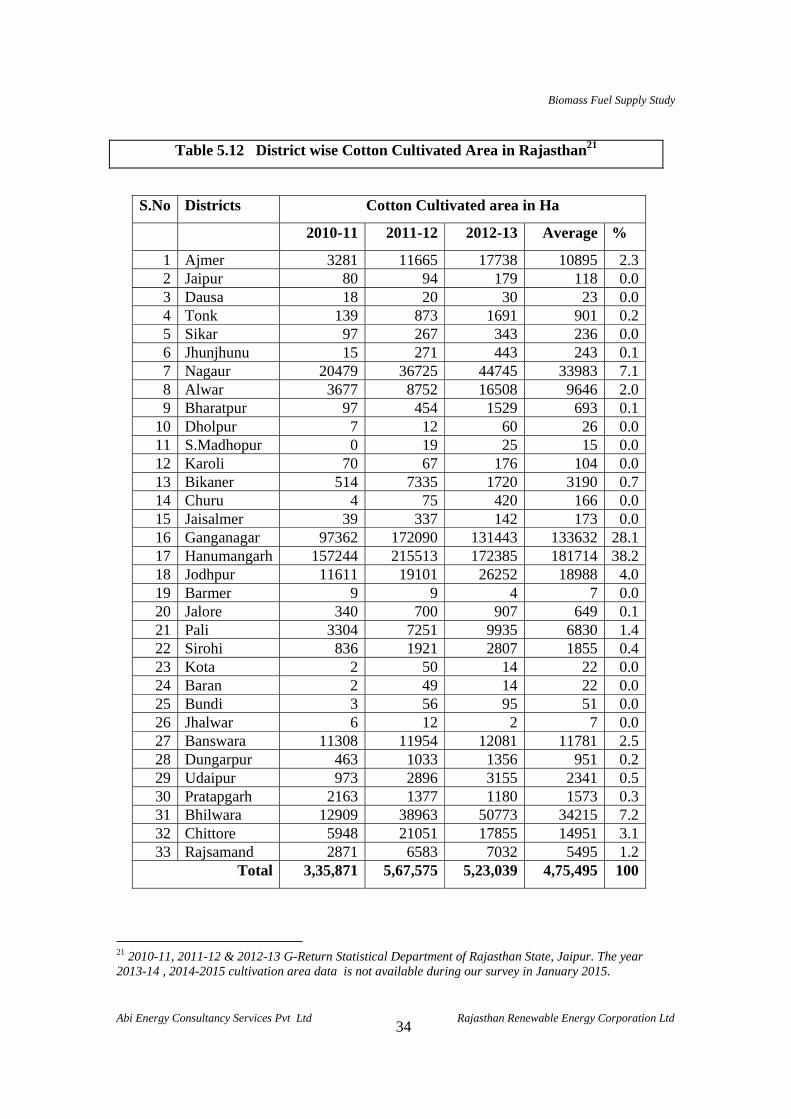
34
Table 5.12 District wise Cotton Cultivated Area in Rajasthan21
S.No Districts Cotton Cultivated area in Ha
2010-11 2011-12 2012-13 Average %
1 Ajmer 3281 11665 17738 10895 2.3 2 Jaipur 80 94 179 118 0.0 3 Dausa 18 20 30 23 0.0 4 Tonk 139 873 1691 901 0.2 5 Sikar 97 267 343 236 0.0 6 Jhunjhunu 15 271 443 243 0.1 7 Nagaur 20479 36725 44745 33983 7.1 8 Alwar 3677 8752 16508 9646 2.0 9 Bharatpur 97 454 1529 693 0.1
10 Dholpur 7 12 60 26 0.0 11 S.Madhopur 0 19 25 15 0.0 12 Karoli 70 67 176 104 0.0 13 Bikaner 514 7335 1720 3190 0.7 14 Churu 4 75 420 166 0.0 15 Jaisalmer 39 337 142 173 0.0 16 Ganganagar 97362 172090 131443 133632 28.1 17 Hanumangarh 157244 215513 172385 181714 38.2 18 Jodhpur 11611 19101 26252 18988 4.0 19 Barmer 9 9 4 7 0.0 20 Jalore 340 700 907 649 0.1 21 Pali 3304 7251 9935 6830 1.4 22 Sirohi 836 1921 2807 1855 0.4 23 Kota 2 50 14 22 0.0 24 Baran 2 49 14 22 0.0 25 Bundi 3 56 95 51 0.0 26 Jhalwar 6 12 2 7 0.0 27 Banswara 11308 11954 12081 11781 2.5 28 Dungarpur 463 1033 1356 951 0.2 29 Udaipur 973 2896 3155 2341 0.5 30 Pratapgarh 2163 1377 1180 1573 0.3 31 Bhilwara 12909 38963 50773 34215 7.2 32 Chittore 5948 21051 17855 14951 3.1 33 Rajsamand 2871 6583 7032 5495 1.2
Total 3,35,871 5,67,575 5,23,039 4,75,495 100
21 2010-11, 2011-12 & 2012-13 G-Return Statistical Department of Rajasthan State, Jaipur. The year 2013-14 , 2014-2015 cultivation area data is not available during our survey in January 2015.
Biomass Fuel Supply Study
Abi Energy Consultancy Services Pvt Ltd Rajasthan Renewable Energy Corporation Ltd
35
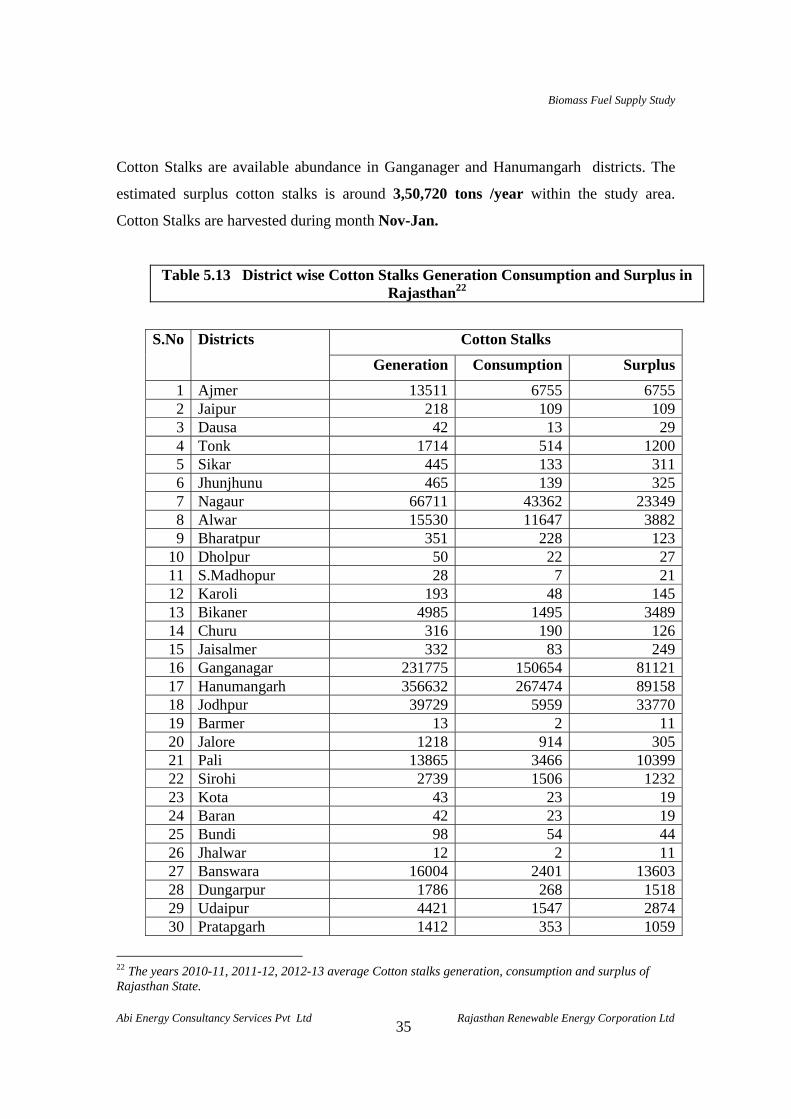
Cotton Stalks are available abundance in Ganganager and Hanumangarh districts. The
estimated surplus cotton stalks is around 3,50,720 tons /year within the study area.
Cotton Stalks are harvested during month Nov-Jan.
Table 5.13 District wise Cotton Stalks Generation Consumption and Surplus in Rajasthan22
S.No Districts Cotton Stalks
Generation Consumption Surplus
1 Ajmer 13511 6755 67552 Jaipur 218 109 1093 Dausa 42 13 294 Tonk 1714 514 12005 Sikar 445 133 3116 Jhunjhunu 465 139 3257 Nagaur 66711 43362 233498 Alwar 15530 11647 38829 Bharatpur 351 228 123
10 Dholpur 50 22 2711 S.Madhopur 28 7 2112 Karoli 193 48 14513 Bikaner 4985 1495 348914 Churu 316 190 12615 Jaisalmer 332 83 24916 Ganganagar 231775 150654 8112117 Hanumangarh 356632 267474 8915818 Jodhpur 39729 5959 3377019 Barmer 13 2 1120 Jalore 1218 914 30521 Pali 13865 3466 1039922 Sirohi 2739 1506 123223 Kota 43 23 1924 Baran 42 23 1925 Bundi 98 54 4426 Jhalwar 12 2 1127 Banswara 16004 2401 1360328 Dungarpur 1786 268 151829 Udaipur 4421 1547 287430 Pratapgarh 1412 353 1059
22 The years 2010-11, 2011-12, 2012-13 average Cotton stalks generation, consumption and surplus of Rajasthan State.
Biomass Fuel Supply Study
Abi Energy Consultancy Services Pvt Ltd Rajasthan Renewable Energy Corporation Ltd
36
31 Bhilwara 63337 15834 4750332 Chittore 34568 15555 1901233 Rajsamand 13722 4803 8919
Total 8,86,306 5,35,587 3,50,720
The Cotton stalks at present is utilised by local people as domestic fuel, brick kiln,
biomass power plant, thermal energy consuming industries in the study area. About 60%
of the total cotton stalks generation is taken as consumption as fuel in brick Kiln and
domestic fuel leaving a surplus of about 3, 50,720 tons/year.
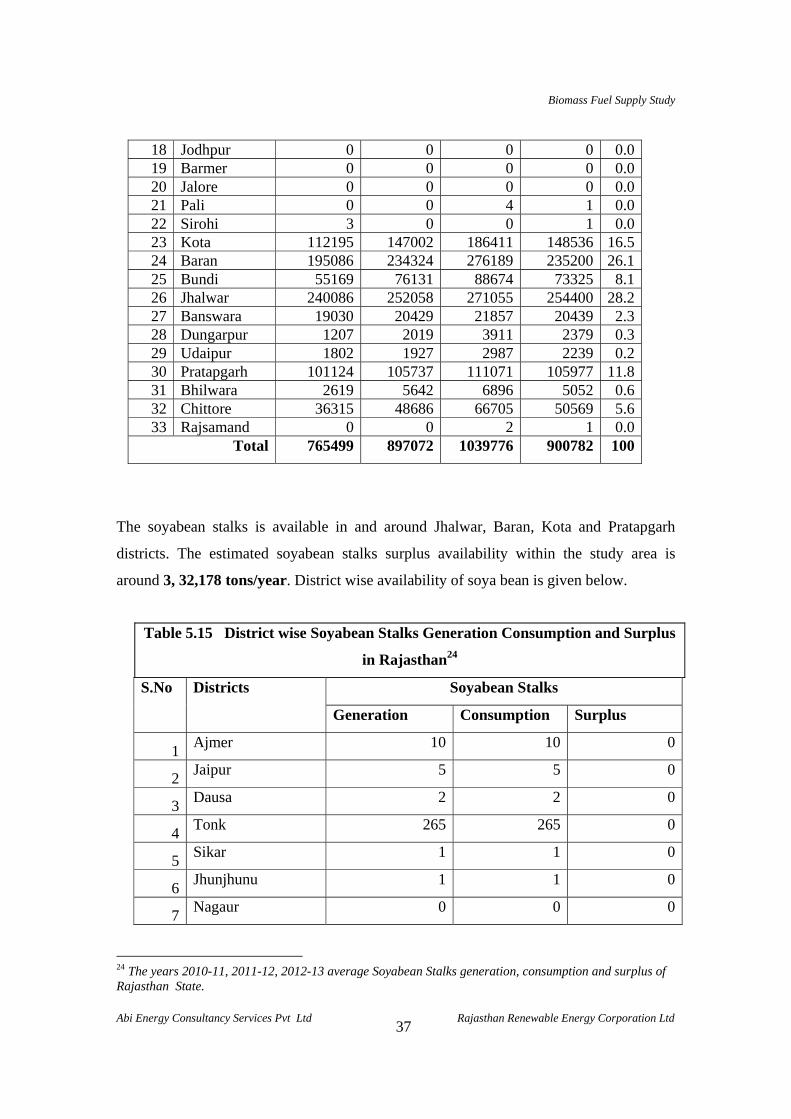
5.6 SOYABEAN STALKS
Soyabean is an another major crop in Rajasthan particularly in the Jhalwar, Baran, Kota
and Pratapgarh districts. The Study area has an overall area of 9, 00,782 Ha under Soya
Bean cultivation. Soya Bean is grown in Kharif season.
Table 5.14 District wise Soyabean Cultivated Area in Rajasthan23
S.No Districts Soyabean Cultivated area in Ha
2010-11 2011-12 2012-13 Average %
1 Ajmer 10 2 1 4 0.0 2 Jaipur 0 5 0 2 0.0 3 Dausa 0 2 1 1 0.0 4 Tonk 67 126 123 105 0.0 5 Sikar 0 0 1 0 0.0 6 Jhunjhunu 0 0 1 0 0.0 7 Nagaur 0 0 0 0 0.0 8 Alwar 0 0 0 0 0.0 9 Bharatpur 0 17 0 6 0.0
10 Dholpur 0 3 2 2 0.0 11 S.Madhopur 786 2962 3884 2544 0.3 12 Karoli 0 0 1 0 0.0 13 Bikaner 0 0 0 0 0.0 14 Churu 0 0 0 0 0.0 15 Jaisalmer 0 0 0 0 0.0 16 Ganganagar 0 0 0 0 0.0 17 Hanumangarh 0 0 0 0 0.0
23 2010-11, 2011-12 & 2012-13 G-Return Statistical Department of Rajasthan State, Jaipur. The year 2013-14 , 2014-2015 cultivation area data is not available during our survey in January 2015.
Biomass Fuel Supply Study
Abi Energy Consultancy Services Pvt Ltd Rajasthan Renewable Energy Corporation Ltd
37
18 Jodhpur 0 0 0 0 0.0 19 Barmer 0 0 0 0 0.0 20 Jalore 0 0 0 0 0.0 21 Pali 0 0 4 1 0.0 22 Sirohi 3 0 0 1 0.0 23 Kota 112195 147002 186411 148536 16.5 24 Baran 195086 234324 276189 235200 26.1 25 Bundi 55169 76131 88674 73325 8.1 26 Jhalwar 240086 252058 271055 254400 28.2 27 Banswara 19030 20429 21857 20439 2.3 28 Dungarpur 1207 2019 3911 2379 0.3 29 Udaipur 1802 1927 2987 2239 0.2 30 Pratapgarh 101124 105737 111071 105977 11.8 31 Bhilwara 2619 5642 6896 5052 0.6 32 Chittore 36315 48686 66705 50569 5.6 33 Rajsamand 0 0 2 1 0.0
Total 765499 897072 1039776 900782 100
The soyabean stalks is available in and around Jhalwar, Baran, Kota and Pratapgarh
districts. The estimated soyabean stalks surplus availability within the study area is
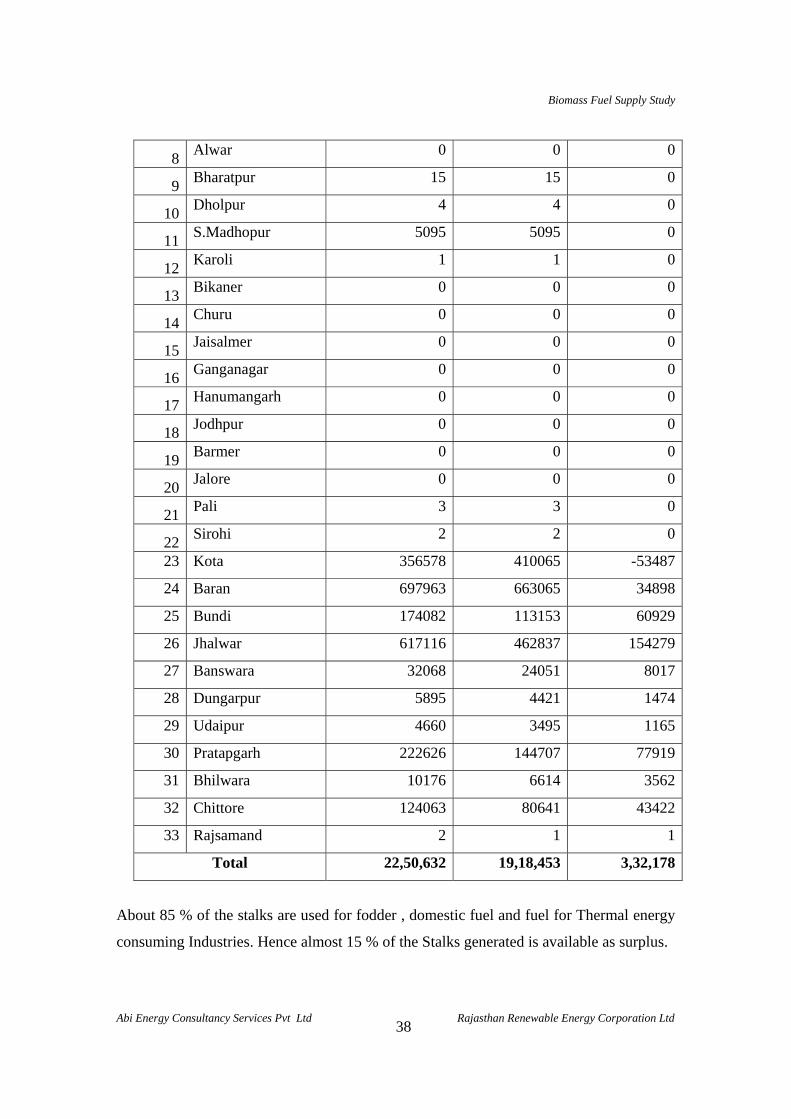
around 3, 32,178 tons/year. District wise availability of soya bean is given below.
Table 5.15 District wise Soyabean Stalks Generation Consumption and Surplus
in Rajasthan24
S.No Districts Soyabean Stalks
Generation Consumption Surplus
1 Ajmer 10 10 0
2 Jaipur 5 5 0
3 Dausa 2 2 0
4 Tonk 265 265 0
5 Sikar 1 1 0
6 Jhunjhunu 1 1 0
7 Nagaur 0 0 0
24 The years 2010-11, 2011-12, 2012-13 average Soyabean Stalks generation, consumption and surplus of Rajasthan State.
Biomass Fuel Supply Study
Abi Energy Consultancy Services Pvt Ltd Rajasthan Renewable Energy Corporation Ltd
38
8 Alwar 0 0 0
9 Bharatpur 15 15 0
10 Dholpur 4 4 0
11 S.Madhopur 5095 5095 0
12 Karoli 1 1 0
13 Bikaner 0 0 0
14 Churu 0 0 0
15 Jaisalmer 0 0 0
16 Ganganagar 0 0 0
17 Hanumangarh 0 0 0
18 Jodhpur 0 0 0
19 Barmer 0 0 0
20 Jalore 0 0 0
21 Pali 3 3 0
22 Sirohi 2 2 0
23 Kota 356578 410065 -53487
24 Baran 697963 663065 34898
25 Bundi 174082 113153 60929
26 Jhalwar 617116 462837 154279
27 Banswara 32068 24051 8017
28 Dungarpur 5895 4421 1474
29 Udaipur 4660 3495 1165
30 Pratapgarh 222626 144707 77919
31 Bhilwara 10176 6614 3562
32 Chittore 124063 80641 43422
33 Rajsamand 2 1 1
Total 22,50,632 19,18,453 3,32,178
About 85 % of the stalks are used for fodder , domestic fuel and fuel for Thermal energy
consuming Industries. Hence almost 15 % of the Stalks generated is available as surplus.
Biomass Fuel Supply Study
39 Abi Energy Consultancy Services Pvt Ltd Rajasthan Renewable Energy Corporation Ltd
Chapter 6
BIOMASS PRICE, TRENDS & FORECAST ANALYSIS
6.0 INTRODUCTION: Biomass power plants are located in various districts of Rajasthan namely
Ganganagar, Hanumangarh, Kota, Baran, Tonk, Jaipur, Nagaur, Sirohi, and Jalore
districts. The major biomass consumed by the power plants are Mustard Stalks &
Husk, Gaur Stalks, Prosopis Juliflora Wood and Cotton Stalks.
The variations in the procurement cost of major biomass with respect to the power
plant consumption pattern for the past three years are discussed in the price trend
analysis. Also, the trend analysis includes a prediction on the future escalation of
biomass price.
The details of the price trend of each biomass are discussed in the following order
i. Mustard Stalks and Husk Price Trend
ii. Gaur Stalks Price Trend
iii. Prosopis Juliflora Wood Price Trend
iv. Cotton Stalks Price Trend
6.1 MUSTARD STALKS &HUSK PRICE TREND: The mustard stalks & husk stands first in the discussion of price analysis because of
its higher generation and consumption pattern in Rajasthan.
All the running biomass power plants in the Rajasthan state are using the mustard
stalks & husk as a major fuel for biomass power plant.
The procurement of mustard stalks & husk starts within the harvesting period and
ends with respect to the storage capacity & fund availability of the consuming
industries. The below table shows the price trend of mustard stalks & husk for the
period of three years (2012,2013 & 2014)
Biomass Fuel Supply Study
40 Abi Energy Consultancy Services Pvt Ltd Rajasthan Renewable Energy Corporation Ltd
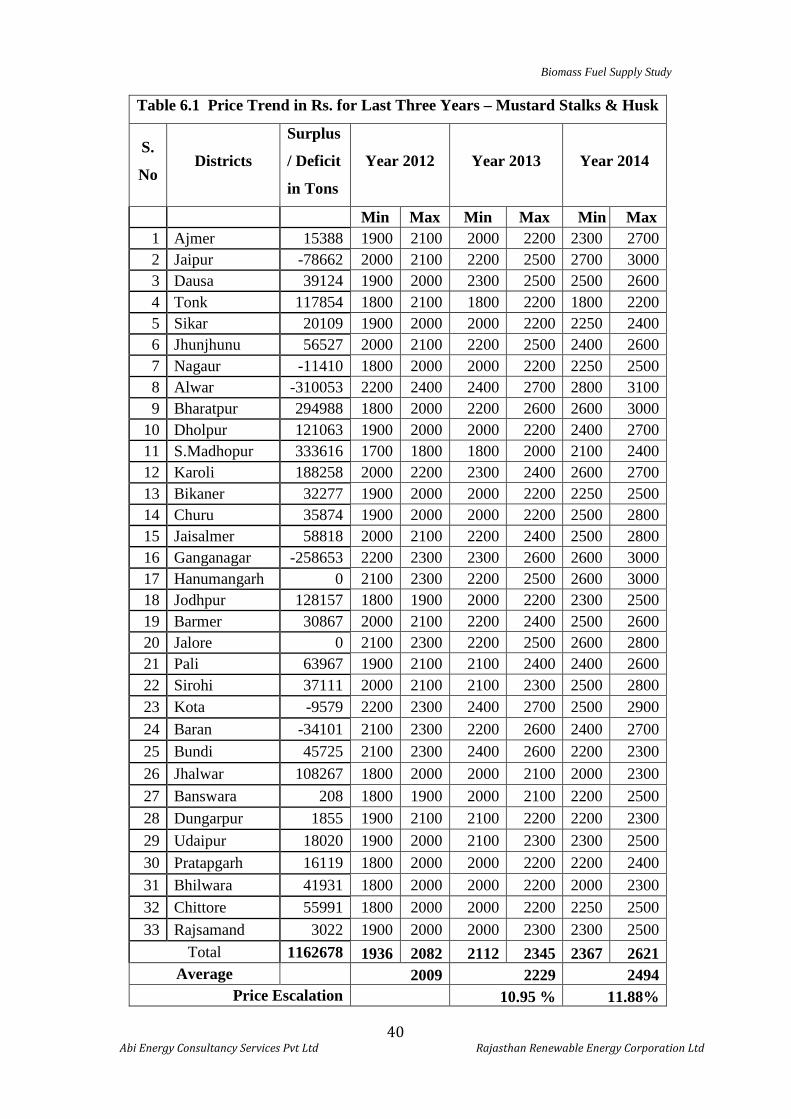
Table 6.1 Price Trend in Rs. for Last Three Years – Mustard Stalks & Husk
S.
No Districts
Surplus
/ Deficit
in Tons
Year 2012
Year 2013 Year 2014
Min Max Min Max Min Max 1 Ajmer 15388 1900 2100 2000 2200 2300 2700 2 Jaipur -78662 2000 2100 2200 2500 2700 3000 3 Dausa 39124 1900 2000 2300 2500 2500 2600 4 Tonk 117854 1800 2100 1800 2200 1800 2200 5 Sikar 20109 1900 2000 2000 2200 2250 2400 6 Jhunjhunu 56527 2000 2100 2200 2500 2400 2600 7 Nagaur -11410 1800 2000 2000 2200 2250 2500 8 Alwar -310053 2200 2400 2400 2700 2800 3100 9 Bharatpur 294988 1800 2000 2200 2600 2600 3000
10 Dholpur 121063 1900 2000 2000 2200 2400 2700 11 S.Madhopur 333616 1700 1800 1800 2000 2100 2400 12 Karoli 188258 2000 2200 2300 2400 2600 2700 13 Bikaner 32277 1900 2000 2000 2200 2250 2500 14 Churu 35874 1900 2000 2000 2200 2500 2800 15 Jaisalmer 58818 2000 2100 2200 2400 2500 2800 16 Ganganagar -258653 2200 2300 2300 2600 2600 3000 17 Hanumangarh 0 2100 2300 2200 2500 2600 3000 18 Jodhpur 128157 1800 1900 2000 2200 2300 2500 19 Barmer 30867 2000 2100 2200 2400 2500 2600 20 Jalore 0 2100 2300 2200 2500 2600 2800 21 Pali 63967 1900 2100 2100 2400 2400 2600 22 Sirohi 37111 2000 2100 2100 2300 2500 2800 23 Kota -9579 2200 2300 2400 2700 2500 2900 24 Baran -34101 2100 2300 2200 2600 2400 2700 25 Bundi 45725 2100 2300 2400 2600 2200 2300 26 Jhalwar 108267 1800 2000 2000 2100 2000 2300 27 Banswara 208 1800 1900 2000 2100 2200 2500 28 Dungarpur 1855 1900 2100 2100 2200 2200 2300 29 Udaipur 18020 1900 2000 2100 2300 2300 2500 30 Pratapgarh 16119 1800 2000 2000 2200 2200 2400 31 Bhilwara 41931 1800 2000 2000 2200 2000 2300 32 Chittore 55991 1800 2000 2000 2200 2250 2500 33 Rajsamand 3022 1900 2000 2000 2300 2300 2500
Total 1162678 1936 2082 2112 2345 2367 2621 Average 2009 2229 2494
Price Escalation 10.95 % 11.88%
Biomass Fuel Supply Study
41 Abi Energy Consultancy Services Pvt Ltd Rajasthan Renewable Energy Corporation Ltd
The average price variation in the year 2012 is Rs 1,777 to Rs1929, price variation in
the year 2013 is Rs 1913 to Rs 2100 and price variation in year 2014 is Rs 2210 to Rs
2458 respectively. Based on the last three-year price data, the price variation of
mustard stalks & husk is between Rs.1700 to Rs.3100. The escalated in the cost of
mustard stalks & husk from the year 2012-13 is 10.95% and 2013-14 is 11.88%.
Thus, it is clear from the data that the cost of biomass has got fluctuated in the
increasing trend.
Biomass Fuel Supply Study
42 Abi Energy Consultancy Services Pvt Ltd Rajasthan Renewable Energy Corporation Ltd
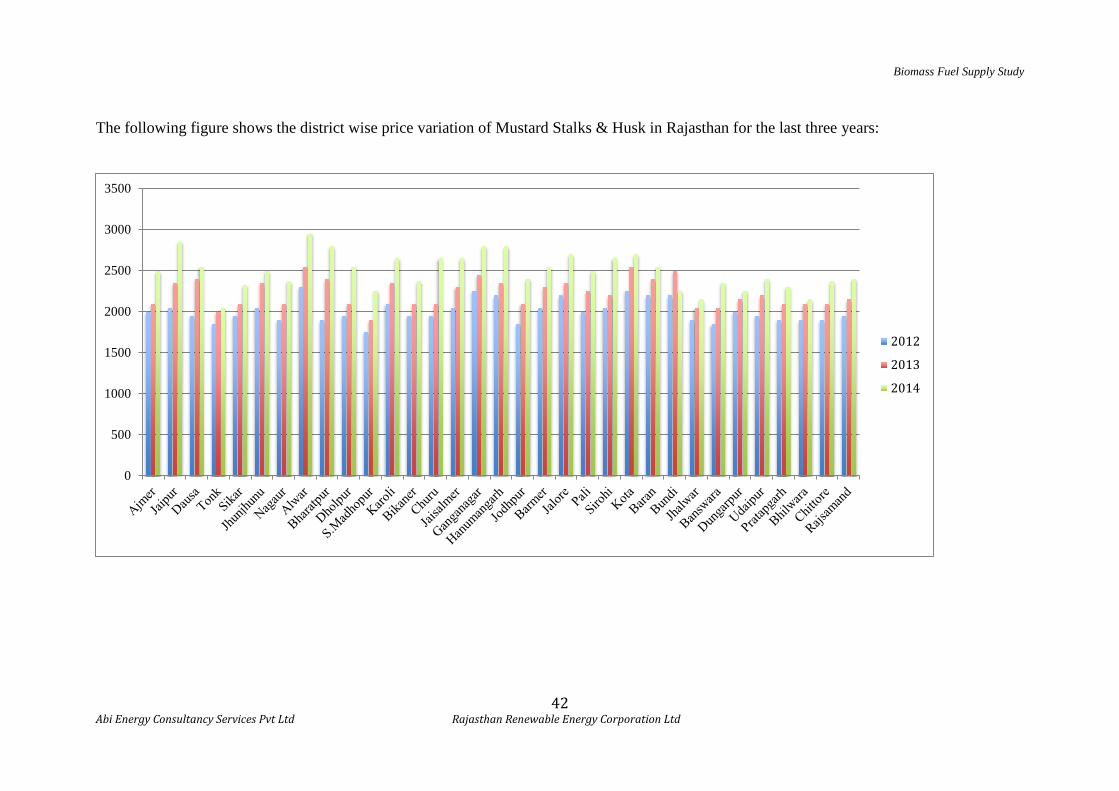
The following figure shows the district wise price variation of Mustard Stalks & Husk in Rajasthan for the last three years:
0
500
1000
1500
2000
2500
3000
3500
2012
2013
2014
Biomass Fuel Supply Study
43 Abi Energy Consultancy Services Pvt Ltd Rajasthan Renewable Energy Corporation Ltd
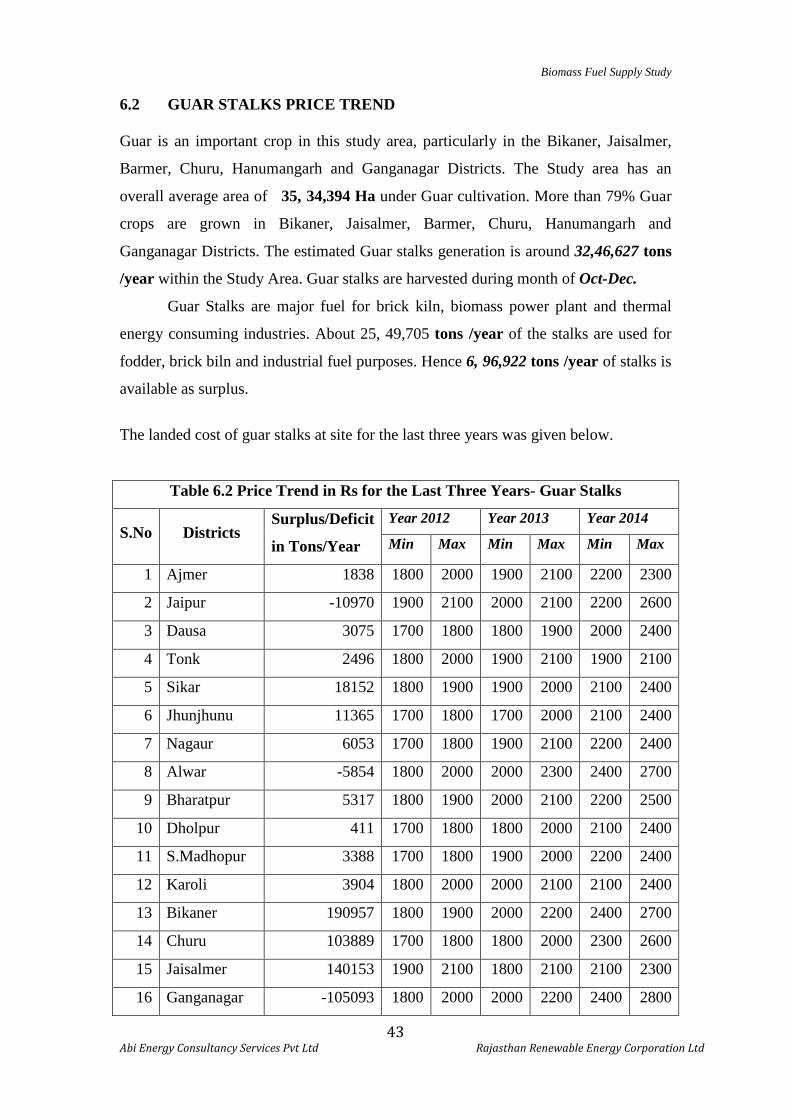
6.2 GUAR STALKS PRICE TREND Guar is an important crop in this study area, particularly in the Bikaner, Jaisalmer,
Barmer, Churu, Hanumangarh and Ganganagar Districts. The Study area has an
overall average area of 35, 34,394 Ha under Guar cultivation. More than 79% Guar
crops are grown in Bikaner, Jaisalmer, Barmer, Churu, Hanumangarh and
Ganganagar Districts. The estimated Guar stalks generation is around 32,46,627 tons
/year within the Study Area. Guar stalks are harvested during month of Oct-Dec.
Guar Stalks are major fuel for brick kiln, biomass power plant and thermal
energy consuming industries. About 25, 49,705 tons /year of the stalks are used for
fodder, brick biln and industrial fuel purposes. Hence 6, 96,922 tons /year of stalks is
available as surplus.
The landed cost of guar stalks at site for the last three years was given below.
Table 6.2 Price Trend in Rs for the Last Three Years- Guar Stalks
S.No Districts Surplus/Deficit
in Tons/Year
Year 2012 Year 2013 Year 2014
Min Max Min Max Min Max
1 Ajmer 1838 1800 2000 1900 2100 2200 2300
2 Jaipur -10970 1900 2100 2000 2100 2200 2600
3 Dausa 3075 1700 1800 1800 1900 2000 2400
4 Tonk 2496 1800 2000 1900 2100 1900 2100
5 Sikar 18152 1800 1900 1900 2000 2100 2400
6 Jhunjhunu 11365 1700 1800 1700 2000 2100 2400
7 Nagaur 6053 1700 1800 1900 2100 2200 2400
8 Alwar -5854 1800 2000 2000 2300 2400 2700
9 Bharatpur 5317 1800 1900 2000 2100 2200 2500
10 Dholpur 411 1700 1800 1800 2000 2100 2400
11 S.Madhopur 3388 1700 1800 1900 2000 2200 2400
12 Karoli 3904 1800 2000 2000 2100 2100 2400
13 Bikaner 190957 1800 1900 2000 2200 2400 2700
14 Churu 103889 1700 1800 1800 2000 2300 2600
15 Jaisalmer 140153 1900 2100 1800 2100 2100 2300
16 Ganganagar -105093 1800 2000 2000 2200 2400 2800
Biomass Fuel Supply Study
44 Abi Energy Consultancy Services Pvt Ltd Rajasthan Renewable Energy Corporation Ltd
17 Hanumangarh 0 1800 2000 2100 2300 2300 2600
18 Jodhpur 116072 1700 1900 1800 2200 2300 2400
19 Barmer 141139 1700 1900 1900 2100 2300 2500
20 Jalore 0 1800 2000 2000 2200 2200 2500
21 Pali 32561 1900 2100 2000 2200 2300 2500
22 Sirohi 7696 1800 2000 2100 2300 2300 2500
23 Kota N.A N.A N.A N.A N.A N.A N.A
24 Baran N.A N.A N.A N.A N.A N.A N.A
25 Bundi 371 1800 1900 1900 2100 2200 2400
26 Jhalwar 110 1700 1900 1900 2000 2100 2300
27 Banswara 474 1900 2000 2000 2200 2300 2500
28 Dungarpur 1344 1900 2000 1800 1900 2000 2300
29 Udaipur 10805 1600 1700 1800 2000 2200 2400
30 Pratapgarh 59 1700 1800 1800 1900 2300 2400
31 Bhilwara 10890 1800 1900 1800 2000 2200 2500
32 Chittore 3240 1800 2000 2000 2200 2300 2500
33 Rajsamand 3081 1800 2000 2000 2200 2300 2500
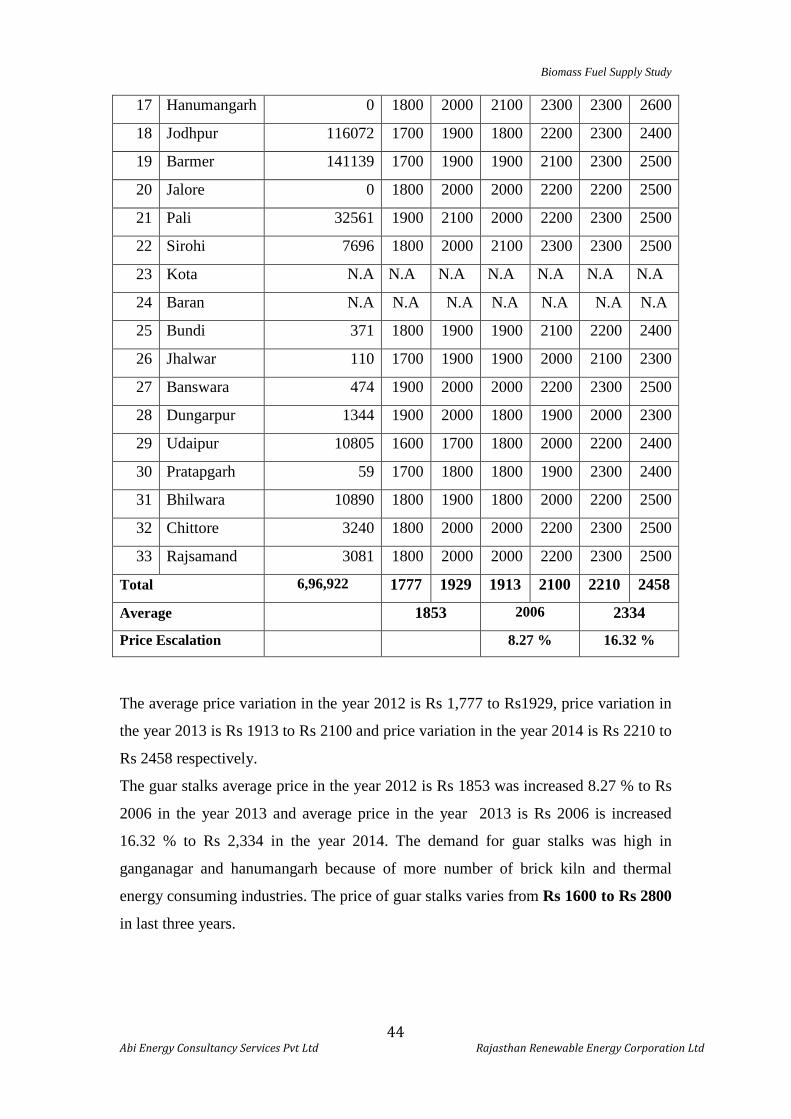
Total 6,96,922 1777 1929 1913 2100 2210 2458
Average 1853 2006 2334
Price Escalation 8.27 % 16.32 %
The average price variation in the year 2012 is Rs 1,777 to Rs1929, price variation in
the year 2013 is Rs 1913 to Rs 2100 and price variation in the year 2014 is Rs 2210 to
Rs 2458 respectively.
The guar stalks average price in the year 2012 is Rs 1853 was increased 8.27 % to Rs
2006 in the year 2013 and average price in the year 2013 is Rs 2006 is increased
16.32 % to Rs 2,334 in the year 2014. The demand for guar stalks was high in
ganganagar and hanumangarh because of more number of brick kiln and thermal
energy consuming industries. The price of guar stalks varies from Rs 1600 to Rs 2800
in last three years.
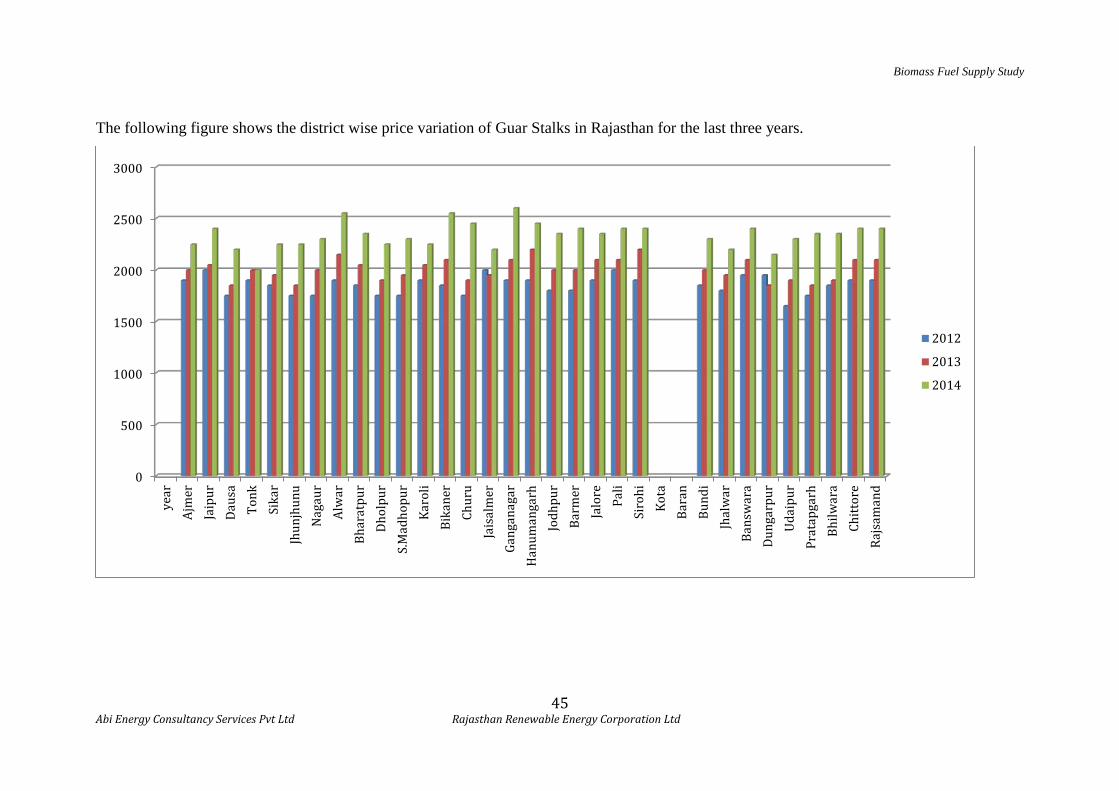
Biomass Fuel Supply Study
45 Abi Energy Consultancy Services Pvt Ltd Rajasthan Renewable Energy Corporation Ltd
The following figure shows the district wise price variation of Guar Stalks in Rajasthan for the last three years.
0
500
1000
1500
2000
2500
3000 ye
ar
Ajm
er
Jaip
ur
Daus
a To
nk
Sika
r Jh
unjh
unu
Nag
aur
Alw
ar
Bhar
atpu
r Dh
olpu
r S.
Mad
hopu
r Ka
roli
Bika
ner
Chur
u Ja
isal
mer
Ga
ngan
agar
H
anum
anga
rh
Jodh
pur
Barm
er
Jalo
re
Pali
Siro
hi
Kota
Ba
ran
Bund
i Jh
alw
ar
Bans
war
a Du
ngar
pur
Udai
pur
Prat
apga
rh
Bhilw
ara
Chitt
ore
Rajs
aman
d
2012
2013
2014
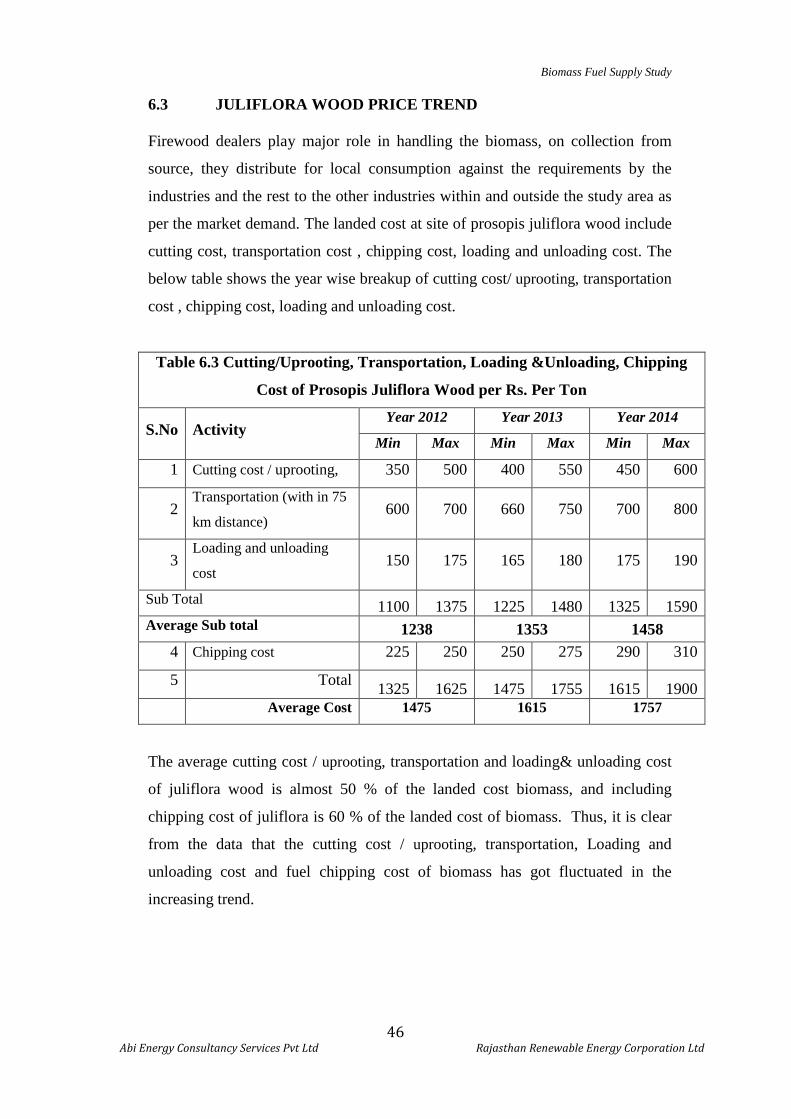
Biomass Fuel Supply Study
46 Abi Energy Consultancy Services Pvt Ltd Rajasthan Renewable Energy Corporation Ltd
6.3 JULIFLORA WOOD PRICE TREND
Firewood dealers play major role in handling the biomass, on collection from
source, they distribute for local consumption against the requirements by the
industries and the rest to the other industries within and outside the study area as
per the market demand. The landed cost at site of prosopis juliflora wood include
cutting cost, transportation cost , chipping cost, loading and unloading cost. The
below table shows the year wise breakup of cutting cost/ uprooting, transportation
cost , chipping cost, loading and unloading cost.
Table 6.3 Cutting/Uprooting, Transportation, Loading &Unloading, Chipping
Cost of Prosopis Juliflora Wood per Rs. Per Ton
S.No Activity Year 2012 Year 2013 Year 2014
Min Max Min Max Min Max
1 Cutting cost / uprooting, 350 500 400 550 450 600
2 Transportation (with in 75
km distance) 600 700 660 750 700 800
3 Loading and unloading
cost 150 175 165 180 175 190
Sub Total 1100 1375 1225 1480 1325 1590 Average Sub total 1238 1353 1458
4 Chipping cost 225 250 250 275 290 310
5 Total 1325 1625 1475 1755 1615 1900 Average Cost 1475 1615 1757
The average cutting cost / uprooting, transportation and loading& unloading cost
of juliflora wood is almost 50 % of the landed cost biomass, and including
chipping cost of juliflora is 60 % of the landed cost of biomass. Thus, it is clear
from the data that the cutting cost / uprooting, transportation, Loading and
unloading cost and fuel chipping cost of biomass has got fluctuated in the
increasing trend.
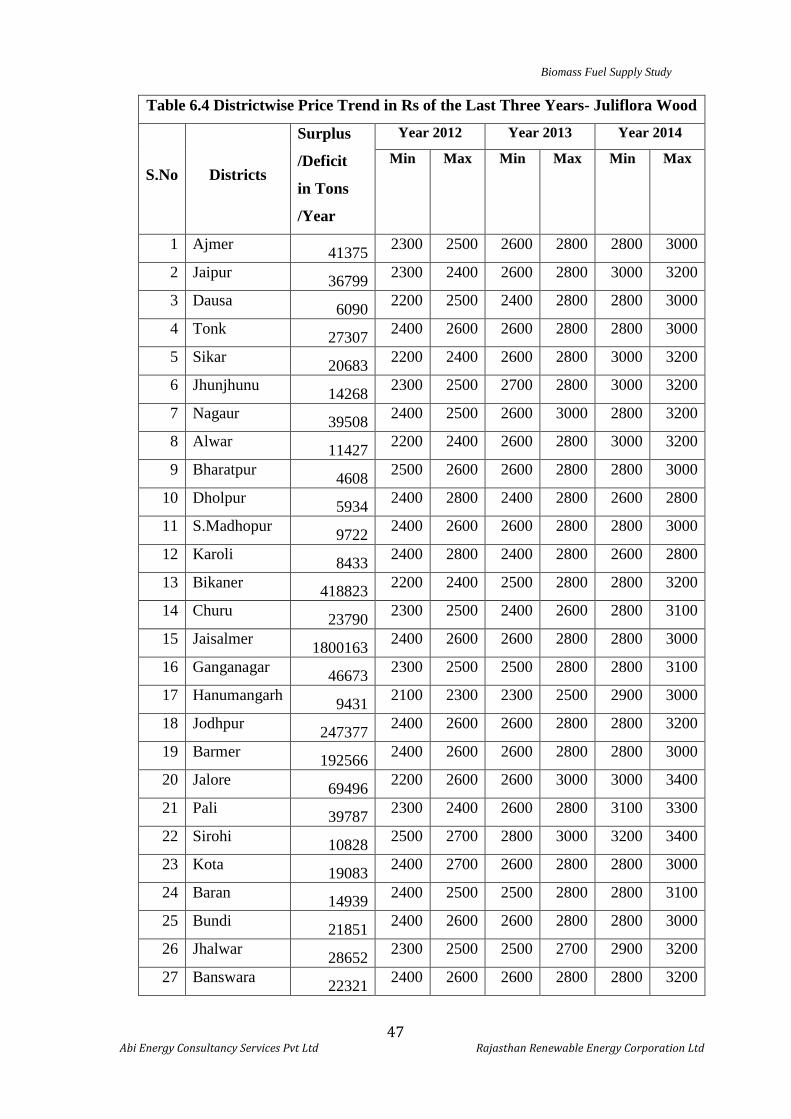
Biomass Fuel Supply Study
47 Abi Energy Consultancy Services Pvt Ltd Rajasthan Renewable Energy Corporation Ltd
Table 6.4 Districtwise Price Trend in Rs of the Last Three Years- Juliflora Wood
S.No Districts
Surplus
/Deficit
in Tons
/Year
Year 2012 Year 2013 Year 2014
Min Max Min Max Min Max
1 Ajmer 41375 2300 2500 2600 2800 2800 3000
2 Jaipur 36799 2300 2400 2600 2800 3000 3200
3 Dausa 6090 2200 2500 2400 2800 2800 3000
4 Tonk 27307 2400 2600 2600 2800 2800 3000
5 Sikar 20683 2200 2400 2600 2800 3000 3200
6 Jhunjhunu 14268 2300 2500 2700 2800 3000 3200
7 Nagaur 39508 2400 2500 2600 3000 2800 3200
8 Alwar 11427 2200 2400 2600 2800 3000 3200
9 Bharatpur 4608 2500 2600 2600 2800 2800 3000
10 Dholpur 5934 2400 2800 2400 2800 2600 2800
11 S.Madhopur 9722 2400 2600 2600 2800 2800 3000
12 Karoli 8433 2400 2800 2400 2800 2600 2800
13 Bikaner 418823 2200 2400 2500 2800 2800 3200
14 Churu 23790 2300 2500 2400 2600 2800 3100
15 Jaisalmer 1800163 2400 2600 2600 2800 2800 3000
16 Ganganagar 46673 2300 2500 2500 2800 2800 3100
17 Hanumangarh 9431 2100 2300 2300 2500 2900 3000
18 Jodhpur 247377 2400 2600 2600 2800 2800 3200
19 Barmer 192566 2400 2600 2600 2800 2800 3000
20 Jalore 69496 2200 2600 2600 3000 3000 3400
21 Pali 39787 2300 2400 2600 2800 3100 3300
22 Sirohi 10828 2500 2700 2800 3000 3200 3400
23 Kota 19083 2400 2700 2600 2800 2800 3000
24 Baran 14939 2400 2500 2500 2800 2800 3100
25 Bundi 21851 2400 2600 2600 2800 2800 3000
26 Jhalwar 28652 2300 2500 2500 2700 2900 3200
27 Banswara 22321 2400 2600 2600 2800 2800 3200
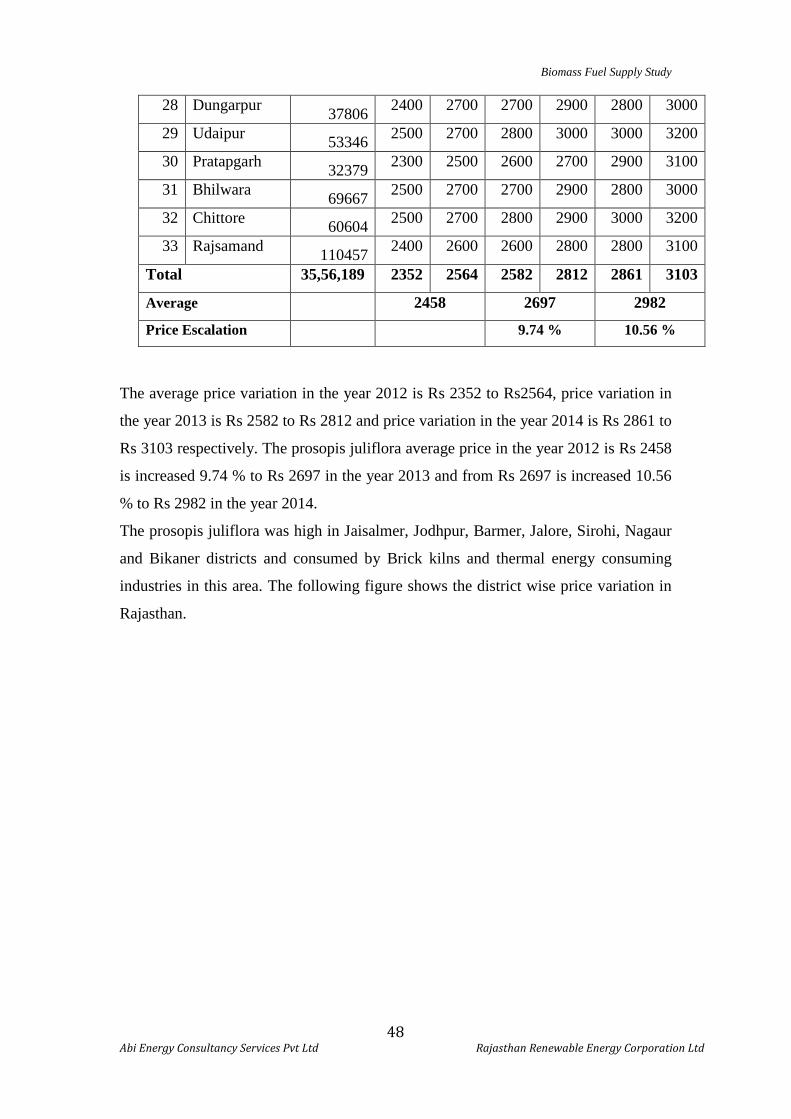
Biomass Fuel Supply Study
48 Abi Energy Consultancy Services Pvt Ltd Rajasthan Renewable Energy Corporation Ltd
28 Dungarpur 37806 2400 2700 2700 2900 2800 3000
29 Udaipur 53346 2500 2700 2800 3000 3000 3200
30 Pratapgarh 32379 2300 2500 2600 2700 2900 3100
31 Bhilwara 69667 2500 2700 2700 2900 2800 3000
32 Chittore 60604 2500 2700 2800 2900 3000 3200
33 Rajsamand 110457 2400 2600 2600 2800 2800 3100
Total 35,56,189 2352 2564 2582 2812 2861 3103
Average 2458 2697 2982
Price Escalation 9.74 % 10.56 %
The average price variation in the year 2012 is Rs 2352 to Rs2564, price variation in
the year 2013 is Rs 2582 to Rs 2812 and price variation in the year 2014 is Rs 2861 to
Rs 3103 respectively. The prosopis juliflora average price in the year 2012 is Rs 2458
is increased 9.74 % to Rs 2697 in the year 2013 and from Rs 2697 is increased 10.56
% to Rs 2982 in the year 2014.
The prosopis juliflora was high in Jaisalmer, Jodhpur, Barmer, Jalore, Sirohi, Nagaur
and Bikaner districts and consumed by Brick kilns and thermal energy consuming
industries in this area. The following figure shows the district wise price variation in
Rajasthan.
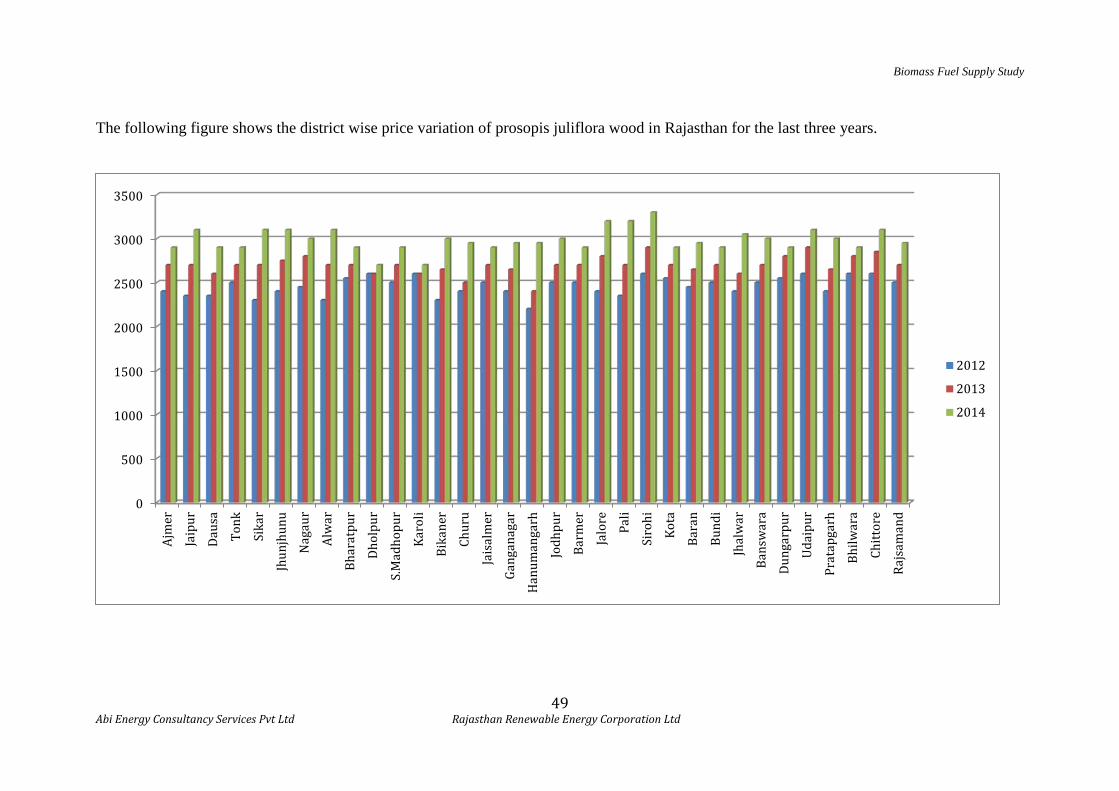
Biomass Fuel Supply Study
49 Abi Energy Consultancy Services Pvt Ltd Rajasthan Renewable Energy Corporation Ltd
The following figure shows the district wise price variation of prosopis juliflora wood in Rajasthan for the last three years.
0
500
1000
1500
2000
2500
3000
3500
Ajm
er
Jaip
ur
Daus
a
Tonk
Sika
r
Jhun
jhun
u
Nag
aur
Alw
ar
Bhar
atpu
r
Dhol
pur
S.M
adho
pur
Karo
li
Bika
ner
Chur
u
Jais
alm
er
Gang
anag
ar
Han
uman
garh
Jodh
pur
Barm
er
Jalo
re
Pali
Siro
hi
Kota
Bara
n
Bund
i
Jhal
war
Bans
war
a
Dung
arpu
r
Udai
pur
Prat
apga
rh
Bhilw
ara
Chitt
ore
Rajs
aman
d
2012
2013
2014
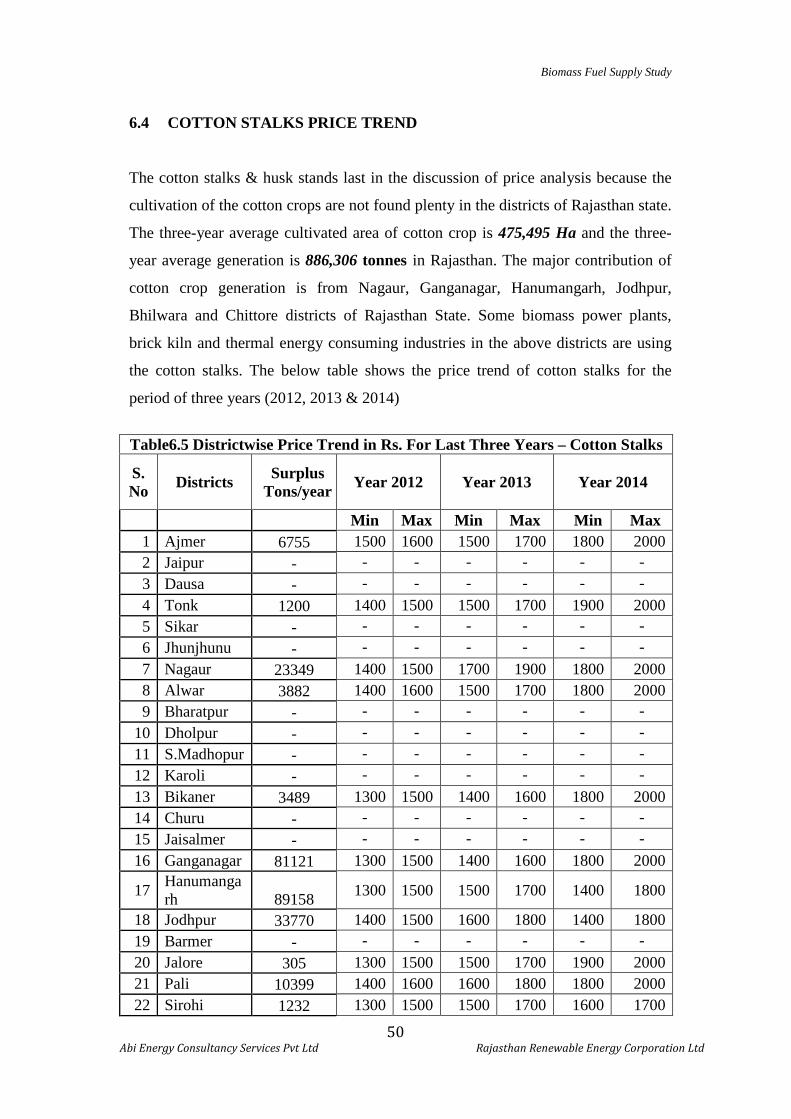
Biomass Fuel Supply Study
50 Abi Energy Consultancy Services Pvt Ltd Rajasthan Renewable Energy Corporation Ltd
6.4 COTTON STALKS PRICE TREND The cotton stalks & husk stands last in the discussion of price analysis because the
cultivation of the cotton crops are not found plenty in the districts of Rajasthan state.
The three-year average cultivated area of cotton crop is 475,495 Ha and the three-
year average generation is 886,306 tonnes in Rajasthan. The major contribution of
cotton crop generation is from Nagaur, Ganganagar, Hanumangarh, Jodhpur,
Bhilwara and Chittore districts of Rajasthan State. Some biomass power plants,
brick kiln and thermal energy consuming industries in the above districts are using
the cotton stalks. The below table shows the price trend of cotton stalks for the
period of three years (2012, 2013 & 2014)
Table6.5 Districtwise Price Trend in Rs. For Last Three Years – Cotton Stalks
S.No Districts Surplus
Tons/year Year 2012 Year 2013
Year 2014
Min Max Min Max Min Max 1 Ajmer 6755 1500 1600 1500 1700 1800 2000 2 Jaipur - - - - - - - 3 Dausa - - - - - - - 4 Tonk 1200 1400 1500 1500 1700 1900 2000 5 Sikar - - - - - - - 6 Jhunjhunu - - - - - - - 7 Nagaur 23349 1400 1500 1700 1900 1800 2000 8 Alwar 3882 1400 1600 1500 1700 1800 2000 9 Bharatpur - - - - - - -
10 Dholpur - - - - - - - 11 S.Madhopur - - - - - - - 12 Karoli - - - - - - - 13 Bikaner 3489 1300 1500 1400 1600 1800 2000 14 Churu - - - - - - - 15 Jaisalmer - - - - - - - 16 Ganganagar 81121 1300 1500 1400 1600 1800 2000
17 Hanumangarh 89158 1300 1500 1500 1700 1400 1800
18 Jodhpur 33770 1400 1500 1600 1800 1400 1800 19 Barmer - - - - - - - 20 Jalore 305 1300 1500 1500 1700 1900 2000 21 Pali 10399 1400 1600 1600 1800 1800 2000 22 Sirohi 1232 1300 1500 1500 1700 1600 1700
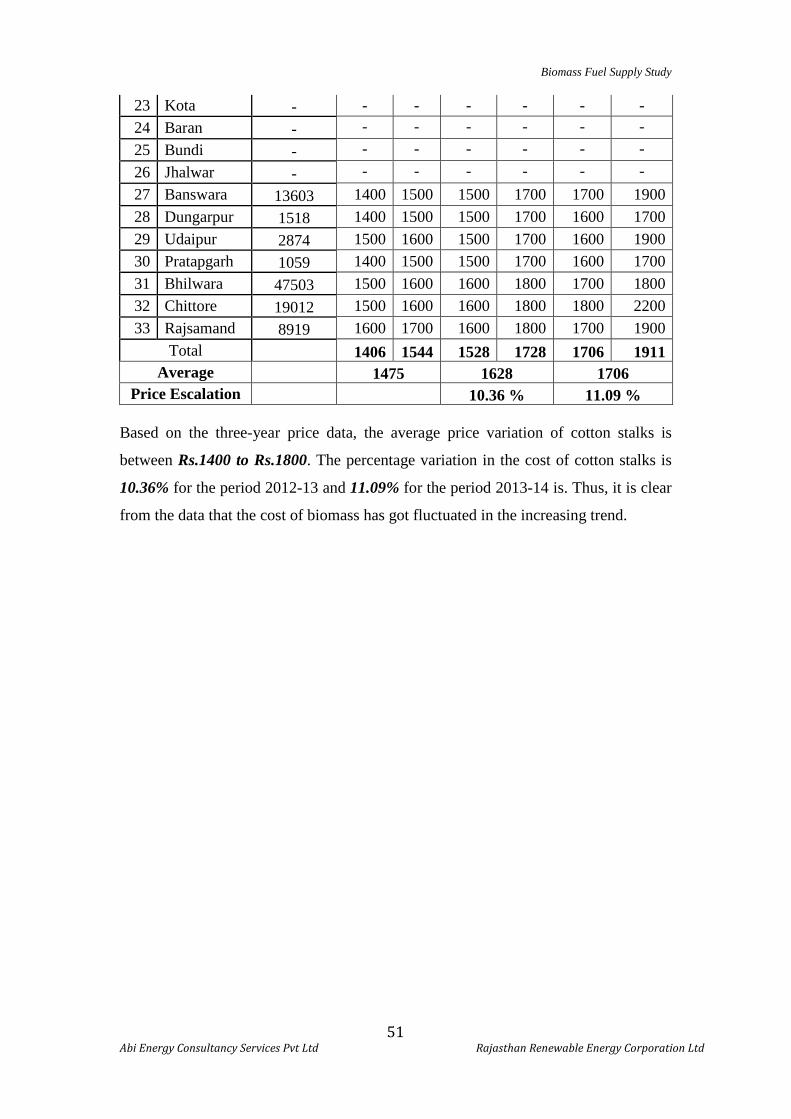
Biomass Fuel Supply Study
51 Abi Energy Consultancy Services Pvt Ltd Rajasthan Renewable Energy Corporation Ltd
23 Kota - - - - - - - 24 Baran - - - - - - - 25 Bundi - - - - - - - 26 Jhalwar - - - - - - - 27 Banswara 13603 1400 1500 1500 1700 1700 1900 28 Dungarpur 1518 1400 1500 1500 1700 1600 1700 29 Udaipur 2874 1500 1600 1500 1700 1600 1900 30 Pratapgarh 1059 1400 1500 1500 1700 1600 1700 31 Bhilwara 47503 1500 1600 1600 1800 1700 1800 32 Chittore 19012 1500 1600 1600 1800 1800 2200 33 Rajsamand 8919 1600 1700 1600 1800 1700 1900
Total 1406 1544 1528 1728 1706 1911 Average 1475 1628 1706
Price Escalation 10.36 % 11.09 %
Based on the three-year price data, the average price variation of cotton stalks is
between Rs.1400 to Rs.1800. The percentage variation in the cost of cotton stalks is
10.36% for the period 2012-13 and 11.09% for the period 2013-14 is. Thus, it is clear
from the data that the cost of biomass has got fluctuated in the increasing trend.
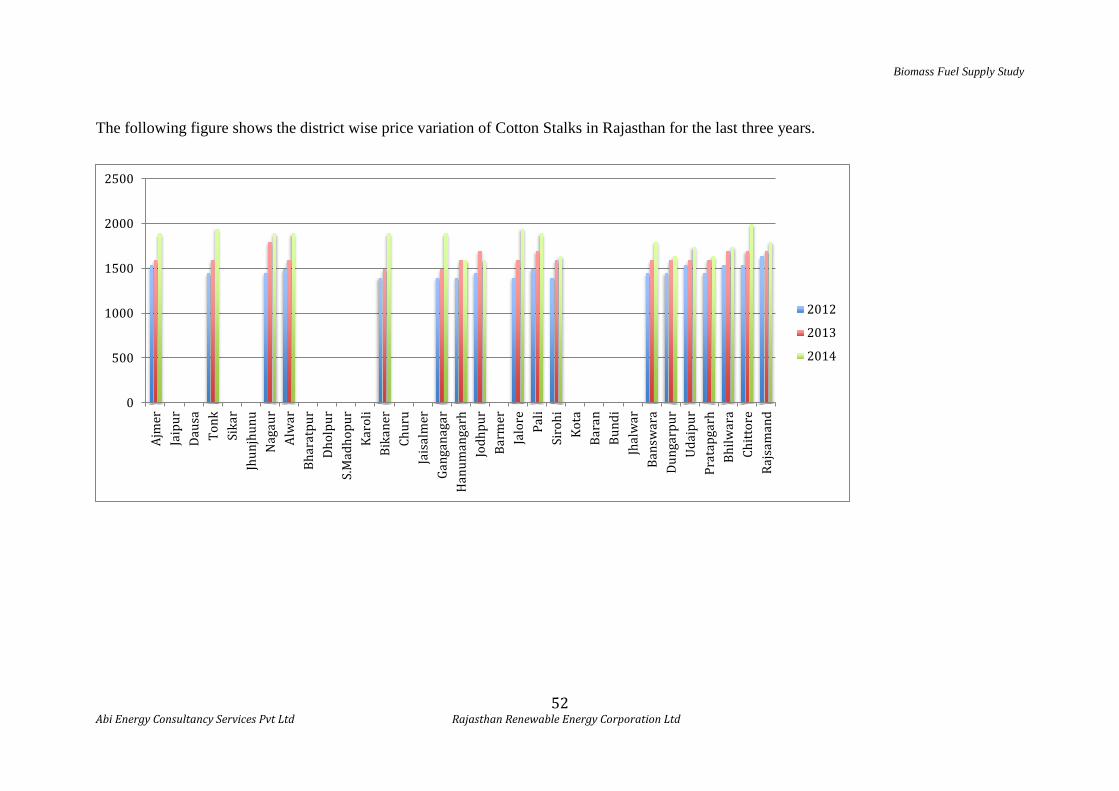
Biomass Fuel Supply Study
52 Abi Energy Consultancy Services Pvt Ltd Rajasthan Renewable Energy Corporation Ltd
The following figure shows the district wise price variation of Cotton Stalks in Rajasthan for the last three years.
0
500
1000
1500
2000
2500
Ajm
er
Jaip
ur
Daus
a To
nk
Sika
r Jh
unjh
unu
Nag
aur
Alw
ar
Bhar
atpu
r Dh
olpu
r S.
Mad
hopu
r Ka
roli
Bika
ner
Chur
u Ja
isal
mer
Ga
ngan
agar
H
anum
anga
rh
Jodh
pur
Barm
er
Jalo
re
Pali
Siro
hi
Kota
Ba
ran
Bund
i Jh
alw
ar
Bans
war
a Du
ngar
pur
Udai
pur
Prat
apga
rh
Bhilw
ara
Chitt
ore
Rajs
aman
d
2012
2013
2014
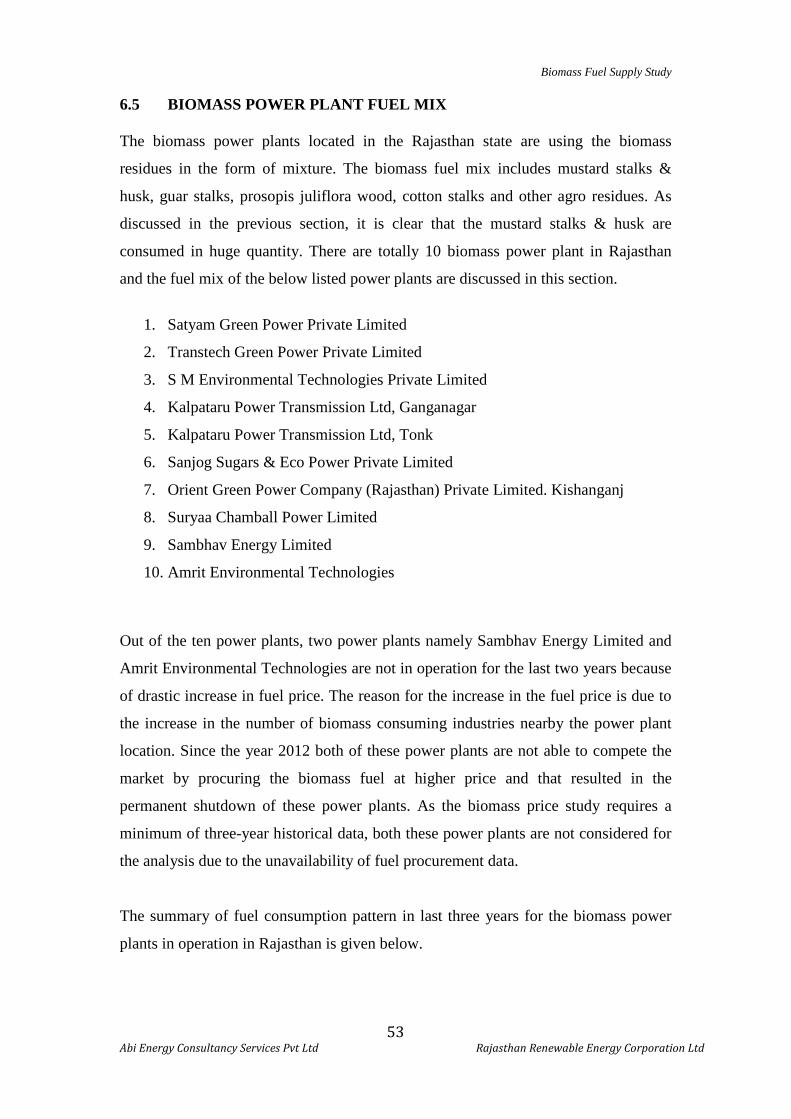
Biomass Fuel Supply Study
53 Abi Energy Consultancy Services Pvt Ltd Rajasthan Renewable Energy Corporation Ltd
6.5 BIOMASS POWER PLANT FUEL MIX The biomass power plants located in the Rajasthan state are using the biomass
residues in the form of mixture. The biomass fuel mix includes mustard stalks &
husk, guar stalks, prosopis juliflora wood, cotton stalks and other agro residues. As
discussed in the previous section, it is clear that the mustard stalks & husk are
consumed in huge quantity. There are totally 10 biomass power plant in Rajasthan
and the fuel mix of the below listed power plants are discussed in this section.
1. Satyam Green Power Private Limited
2. Transtech Green Power Private Limited
3. S M Environmental Technologies Private Limited
4. Kalpataru Power Transmission Ltd, Ganganagar
5. Kalpataru Power Transmission Ltd, Tonk
6. Sanjog Sugars & Eco Power Private Limited
7. Orient Green Power Company (Rajasthan) Private Limited. Kishanganj
8. Suryaa Chamball Power Limited
9. Sambhav Energy Limited
10. Amrit Environmental Technologies
Out of the ten power plants, two power plants namely Sambhav Energy Limited and
Amrit Environmental Technologies are not in operation for the last two years because
of drastic increase in fuel price. The reason for the increase in the fuel price is due to
the increase in the number of biomass consuming industries nearby the power plant
location. Since the year 2012 both of these power plants are not able to compete the
market by procuring the biomass fuel at higher price and that resulted in the
permanent shutdown of these power plants. As the biomass price study requires a
minimum of three-year historical data, both these power plants are not considered for
the analysis due to the unavailability of fuel procurement data.
The summary of fuel consumption pattern in last three years for the biomass power
plants in operation in Rajasthan is given below.
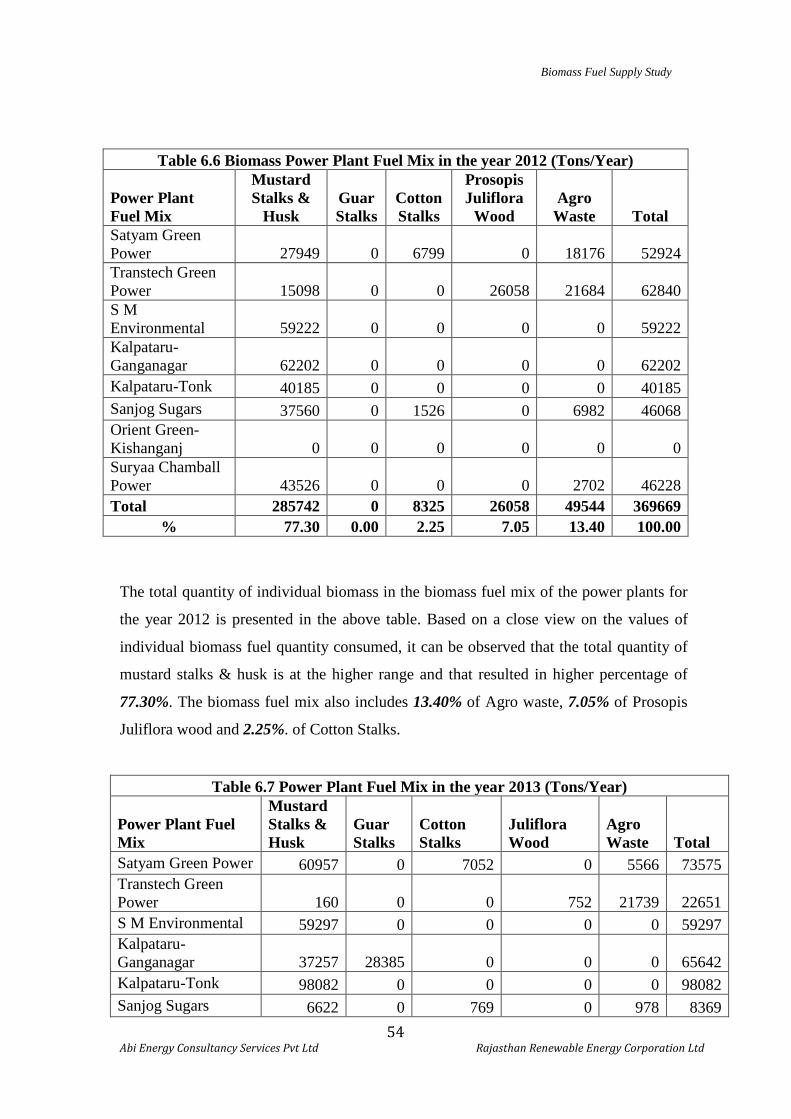
Biomass Fuel Supply Study
54 Abi Energy Consultancy Services Pvt Ltd Rajasthan Renewable Energy Corporation Ltd
The total quantity of individual biomass in the biomass fuel mix of the power plants for
the year 2012 is presented in the above table. Based on a close view on the values of
individual biomass fuel quantity consumed, it can be observed that the total quantity of
mustard stalks & husk is at the higher range and that resulted in higher percentage of
77.30%. The biomass fuel mix also includes 13.40% of Agro waste, 7.05% of Prosopis
Juliflora wood and 2.25%. of Cotton Stalks.
Table 6.7 Power Plant Fuel Mix in the year 2013 (Tons/Year)
Power Plant Fuel Mix
Mustard Stalks & Husk
Guar Stalks
Cotton Stalks
Juliflora Wood
Agro Waste Total
Satyam Green Power 60957 0 7052 0 5566 73575 Transtech Green Power 160 0 0 752 21739 22651 S M Environmental 59297 0 0 0 0 59297 Kalpataru-Ganganagar 37257 28385 0 0 0 65642 Kalpataru-Tonk 98082 0 0 0 0 98082 Sanjog Sugars 6622 0 769 0 978 8369
Table 6.6 Biomass Power Plant Fuel Mix in the year 2012 (Tons/Year)
Power Plant Fuel Mix
Mustard Stalks &
Husk Guar Stalks
Cotton Stalks
Prosopis Juliflora
Wood Agro
Waste Total Satyam Green Power 27949 0 6799 0 18176 52924 Transtech Green Power 15098 0 0 26058 21684 62840 S M Environmental 59222 0 0 0 0 59222 Kalpataru-Ganganagar 62202 0 0 0 0 62202 Kalpataru-Tonk 40185 0 0 0 0 40185 Sanjog Sugars 37560 0 1526 0 6982 46068 Orient Green-Kishanganj 0 0 0 0 0 0 Suryaa Chamball Power 43526 0 0 0 2702 46228 Total 285742 0 8325 26058 49544 369669
% 77.30 0.00 2.25 7.05 13.40 100.00
Biomass Fuel Supply Study
55 Abi Energy Consultancy Services Pvt Ltd Rajasthan Renewable Energy Corporation Ltd
Orient Green-Kishanganj 23,939 0 0 0 0 23,939 Suryaa Chamball Power 72042 0 0 0 1758 73800 Total 358356 28385 7821 752 30041 401416 % 84.25 6.67 1.84 0.18 7.06 100.00 For the year 2013, it can be noted that the contribution of guar stalks is increased to
6.67% while comparing with the last year. However, the contribution of juliflora
wood and agro waste in the fuel mix has got reduced drastically comparing with the
last year. The Juliflora wood has contributed 0.18% that is 6.87% lower than previous
year and the agro residue has contributed 7.06% that is 6.34% lower than the previous
year. Therefore, based on the observation it is quite clear that the Mustard Stalks &
Husk has scored the higher percentage of 84.25% among the fuel mix and that is
6.95% higher than previous year.
Table 6.8 Power Plant Fuel Mix in 2014 (Tons /Year)
Power Plant Fuel Mix
Mustard Stalks &
Husk Guar Stalks
Cotton Stalks
Juliflora Wood
Agro Waste Total
Satyam Green Power 45741 0 4500 0 1112 51353 Transtech Green Power 8958 0 0 12029 16170 37157 S M Environmental 67920 0 0 0 0 67920 Kalpataru-Ganganagar 48941 40053 0 0 0 88994 Kalpataru-Tonk 90088 0 0 0 0 90088 Sanjog Sugars 2129 0 880 0 2853 5862 Orient Green-Kishanganj 42881 0 0 0 0 42881 Suryaa Chamball Power 65280 0 0 0 793 66073 Total 371938 40053 5380 12029 20928 450328 % 82.59 8.89 1.19 2.67 4.65 100.00
For the year 2014, it can be noted that the contribution of mustard stalks & husk is
reduced in a small margin. The contribution of Guar stalks is increased to 8.89%. The
Juliflora wood has contributed 2.67% and the agro residue has contributed 4.65%.
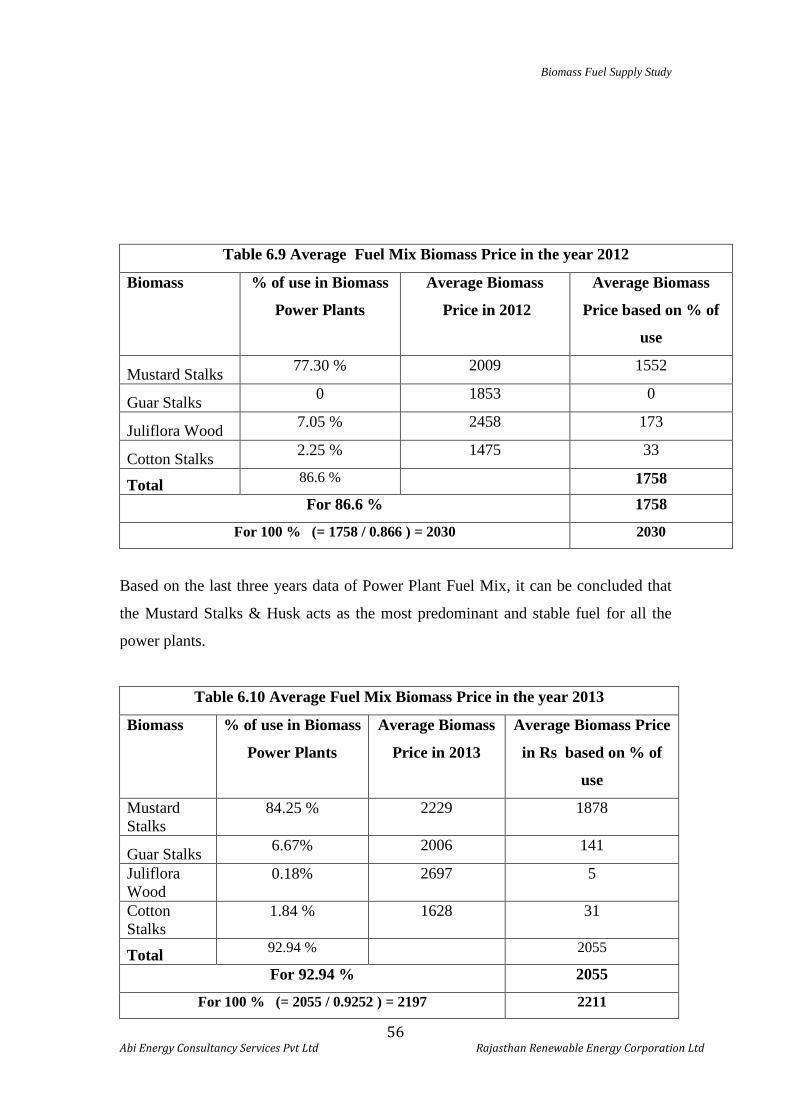
Biomass Fuel Supply Study
56 Abi Energy Consultancy Services Pvt Ltd Rajasthan Renewable Energy Corporation Ltd
Based on the last three years data of Power Plant Fuel Mix, it can be concluded that
the Mustard Stalks & Husk acts as the most predominant and stable fuel for all the
power plants.
Table 6.10 Average Fuel Mix Biomass Price in the year 2013
Biomass % of use in Biomass
Power Plants
Average Biomass
Price in 2013
Average Biomass Price
in Rs based on % of
use
Mustard Stalks
84.25 % 2229 1878
Guar Stalks 6.67% 2006 141
Juliflora Wood
0.18% 2697 5
Cotton Stalks
1.84 % 1628 31
Total 92.94 % 2055
For 92.94 % 2055
For 100 % (= 2055 / 0.9252 ) = 2197 2211
Table 6.9 Average Fuel Mix Biomass Price in the year 2012
Biomass % of use in Biomass
Power Plants
Average Biomass
Price in 2012
Average Biomass
Price based on % of
use
Mustard Stalks 77.30 % 2009 1552
Guar Stalks 0 1853 0
Juliflora Wood 7.05 % 2458 173
Cotton Stalks 2.25 % 1475 33
Total 86.6 % 1758
For 86.6 % 1758
For 100 % (= 1758 / 0.866 ) = 2030 2030
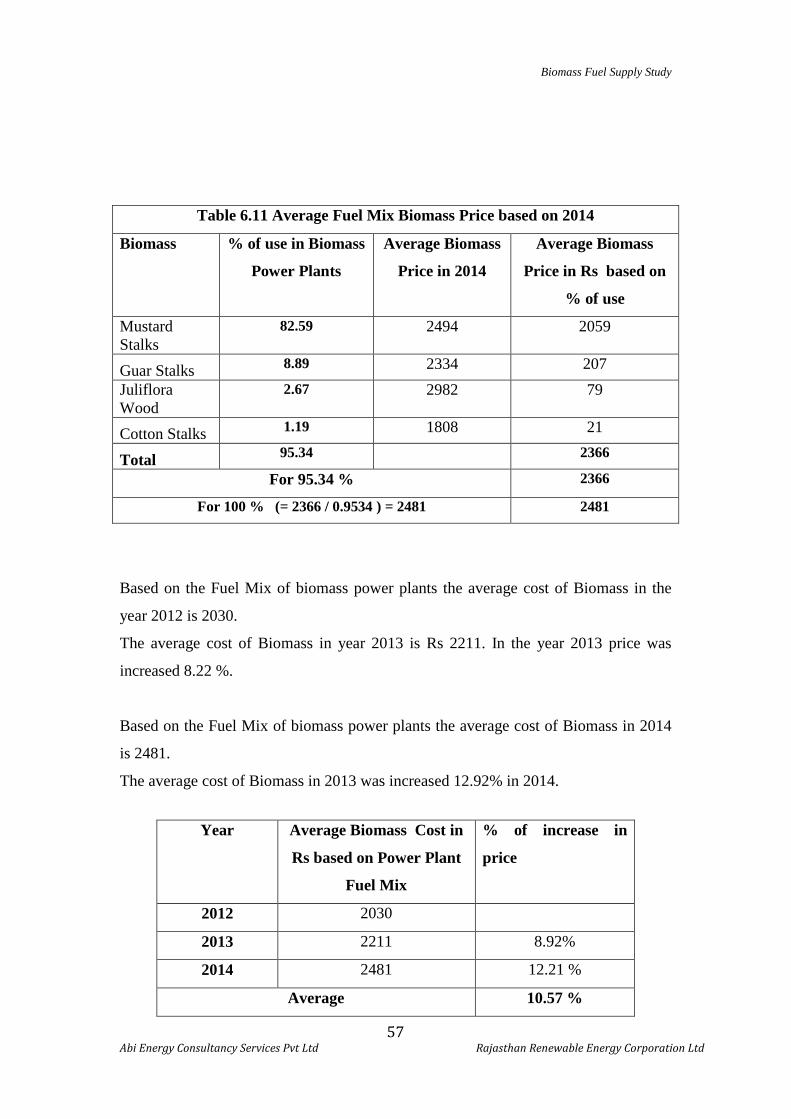
Biomass Fuel Supply Study
57 Abi Energy Consultancy Services Pvt Ltd Rajasthan Renewable Energy Corporation Ltd
Table 6.11 Average Fuel Mix Biomass Price based on 2014
Biomass % of use in Biomass
Power Plants
Average Biomass
Price in 2014
Average Biomass
Price in Rs based on
% of use
Mustard Stalks
82.59 2494 2059
Guar Stalks 8.89 2334 207 Juliflora Wood
2.67 2982 79
Cotton Stalks 1.19 1808 21
Total 95.34 2366
For 95.34 % 2366
For 100 % (= 2366 / 0.9534 ) = 2481 2481
Based on the Fuel Mix of biomass power plants the average cost of Biomass in the
year 2012 is 2030.
The average cost of Biomass in year 2013 is Rs 2211. In the year 2013 price was
increased 8.22 %.
Based on the Fuel Mix of biomass power plants the average cost of Biomass in 2014
is 2481.
The average cost of Biomass in 2013 was increased 12.92% in 2014.
Year Average Biomass Cost in
Rs based on Power Plant
Fuel Mix
% of increase in
price
2012 2030
2013 2211 8.92%
2014 2481 12.21 %
Average 10.57 %
Biomass Fuel Supply Study
58 Abi Energy Consultancy Services Pvt Ltd Rajasthan Renewable Energy Corporation Ltd
The expected price increase in 2015 is 10.57%. The 10.57 % increase in Rs 2481 will
be 2015 price. Hence biomass cost in 2015 will be Rs.2743.
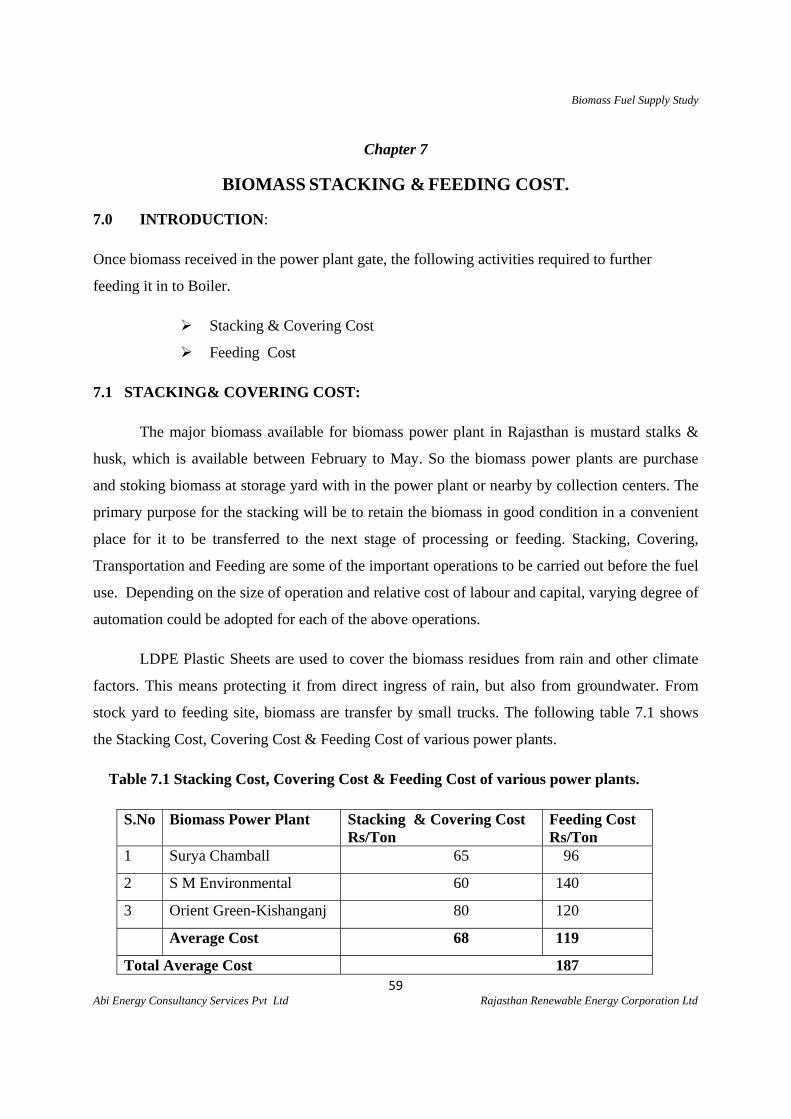
Biomass Fuel Supply Study
59 Abi Energy Consultancy Services Pvt Ltd Rajasthan Renewable Energy Corporation Ltd
Chapter 7
BIOMASS STACKING & FEEDING COST.
7.0 INTRODUCTION:
Once biomass received in the power plant gate, the following activities required to further
feeding it in to Boiler.
Stacking & Covering Cost
Feeding Cost
7.1 STACKING& COVERING COST:
The major biomass available for biomass power plant in Rajasthan is mustard stalks &
husk, which is available between February to May. So the biomass power plants are purchase
and stoking biomass at storage yard with in the power plant or nearby by collection centers. The
primary purpose for the stacking will be to retain the biomass in good condition in a convenient
place for it to be transferred to the next stage of processing or feeding. Stacking, Covering,
Transportation and Feeding are some of the important operations to be carried out before the fuel
use. Depending on the size of operation and relative cost of labour and capital, varying degree of
automation could be adopted for each of the above operations.
LDPE Plastic Sheets are used to cover the biomass residues from rain and other climate
factors. This means protecting it from direct ingress of rain, but also from groundwater. From
stock yard to feeding site, biomass are transfer by small trucks. The following table 7.1 shows
the Stacking Cost, Covering Cost & Feeding Cost of various power plants.
Table 7.1 Stacking Cost, Covering Cost & Feeding Cost of various power plants.
S.No Biomass Power Plant Stacking & Covering Cost Rs/Ton
Feeding Cost Rs/Ton
1 Surya Chamball 65 96
2 S M Environmental 60 140
3 Orient Green-Kishanganj 80 120
Average Cost 68 119
Total Average Cost 187
Biomass Fuel Supply Study
60 Abi Energy Consultancy Services Pvt Ltd Rajasthan Renewable Energy Corporation Ltd
The average Stacking & Covering and Feeding Cost of Biomass is around Rs 187 per tons.
7.2 BIOMASS STORAGE LOSSESS
Three types of losses considered during the storage of biomass in the biomass yard.
1 Land Settlement :
Biomass at bottom of heap gets mixed with sand and cannot be used in boiler.
However, with leveling of ground and proper drainage system, land settlement loss
can be reduced to about 0.4 %
2 Loss of Fuel during Sand Storm:
This loss can be completely eliminated by covering the biomass with tarpaulin.
3 GCV Loss due to decaying of biomass
Decaying loss can be reduced to about 1.5% by covering the biomass with tarpaulin
and proper drainage
Total Storage loss of biomass is around 2 %
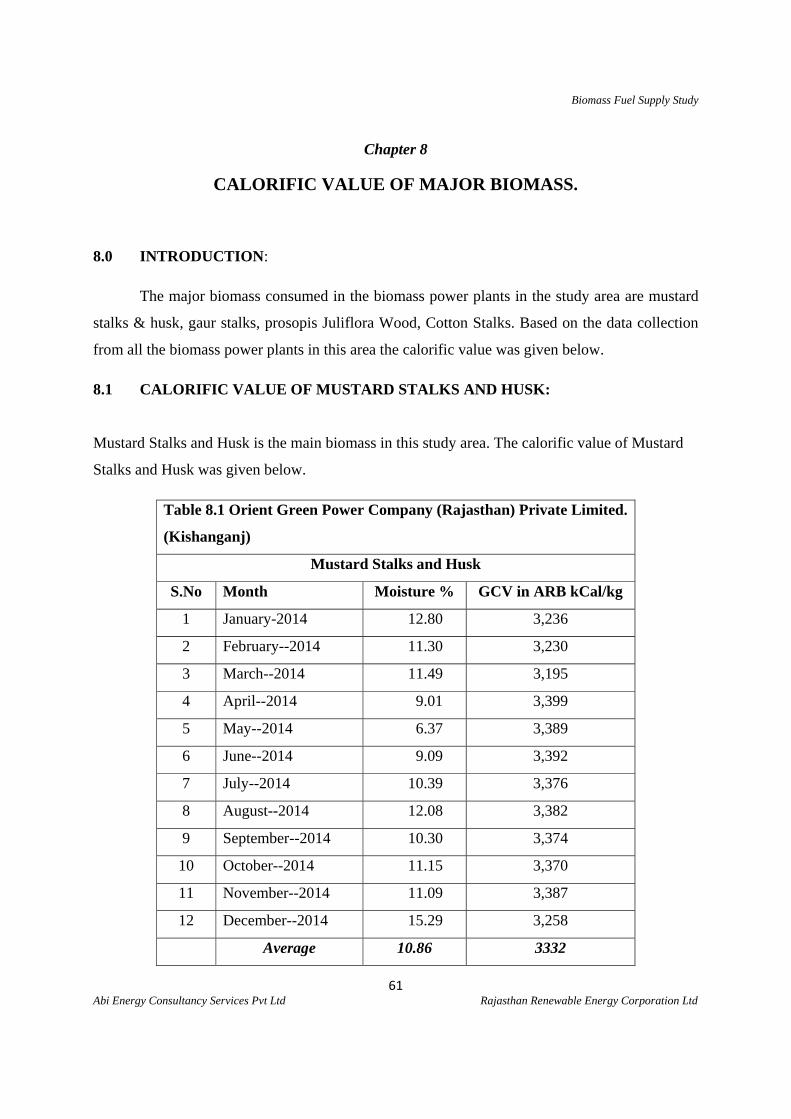
Biomass Fuel Supply Study
61 Abi Energy Consultancy Services Pvt Ltd Rajasthan Renewable Energy Corporation Ltd
Chapter 8
CALORIFIC VALUE OF MAJOR BIOMASS.
8.0 INTRODUCTION:
The major biomass consumed in the biomass power plants in the study area are mustard
stalks & husk, gaur stalks, prosopis Juliflora Wood, Cotton Stalks. Based on the data collection
from all the biomass power plants in this area the calorific value was given below.
8.1 CALORIFIC VALUE OF MUSTARD STALKS AND HUSK:
Mustard Stalks and Husk is the main biomass in this study area. The calorific value of Mustard
Stalks and Husk was given below.
Table 8.1 Orient Green Power Company (Rajasthan) Private Limited.
(Kishanganj)
Mustard Stalks and Husk
S.No Month Moisture % GCV in ARB kCal/kg
1 January-2014 12.80 3,236
2 February--2014 11.30 3,230
3 March--2014 11.49 3,195
4 April--2014 9.01 3,399
5 May--2014 6.37 3,389
6 June--2014 9.09 3,392
7 July--2014 10.39 3,376
8 August--2014 12.08 3,382
9 September--2014 10.30 3,374
10 October--2014 11.15 3,370
11 November--2014 11.09 3,387
12 December--2014 15.29 3,258
Average 10.86 3332
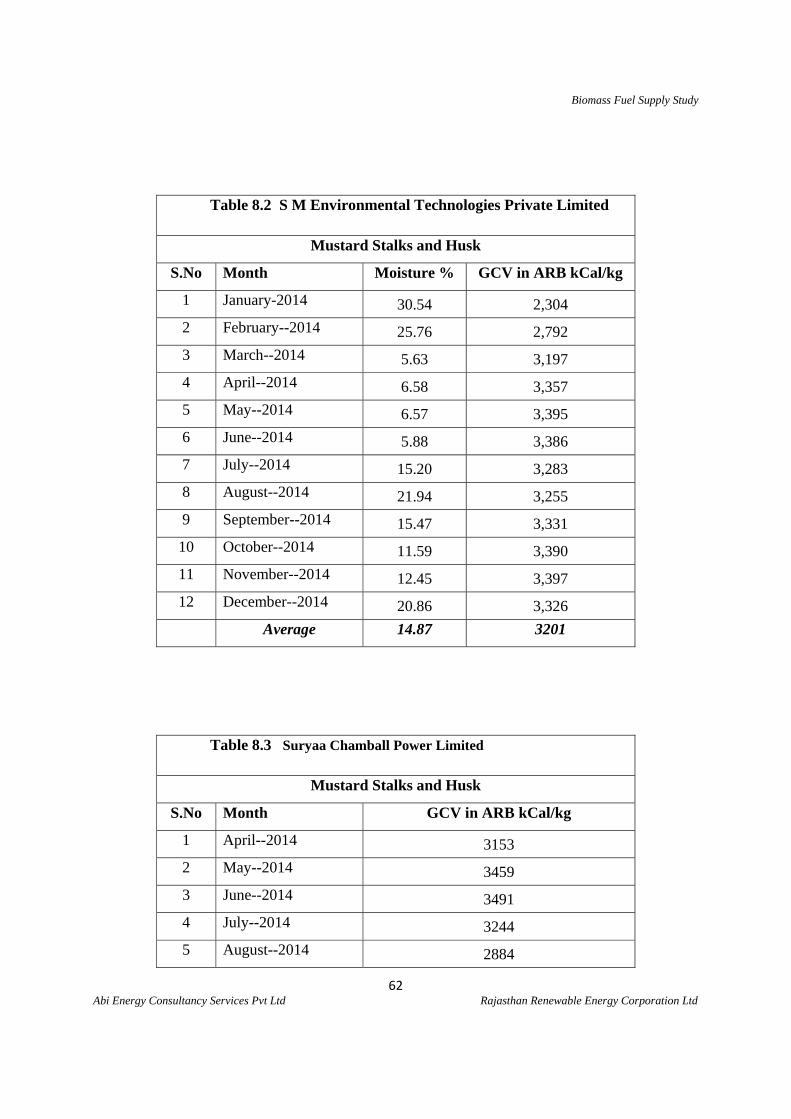
Biomass Fuel Supply Study
62 Abi Energy Consultancy Services Pvt Ltd Rajasthan Renewable Energy Corporation Ltd
Table 8.2 S M Environmental Technologies Private Limited
Mustard Stalks and Husk
S.No Month Moisture % GCV in ARB kCal/kg
1 January-2014 30.54 2,304
2 February--2014 25.76 2,792
3 March--2014 5.63 3,197
4 April--2014 6.58 3,357
5 May--2014 6.57 3,395
6 June--2014 5.88 3,386
7 July--2014 15.20 3,283
8 August--2014 21.94 3,255
9 September--2014 15.47 3,331
10 October--2014 11.59 3,390
11 November--2014 12.45 3,397
12 December--2014 20.86 3,326
Average 14.87 3201
Table 8.3 Suryaa Chamball Power Limited
Mustard Stalks and Husk
S.No Month GCV in ARB kCal/kg
1 April--2014 3153
2 May--2014 3459
3 June--2014 3491
4 July--2014 3244
5 August--2014 2884
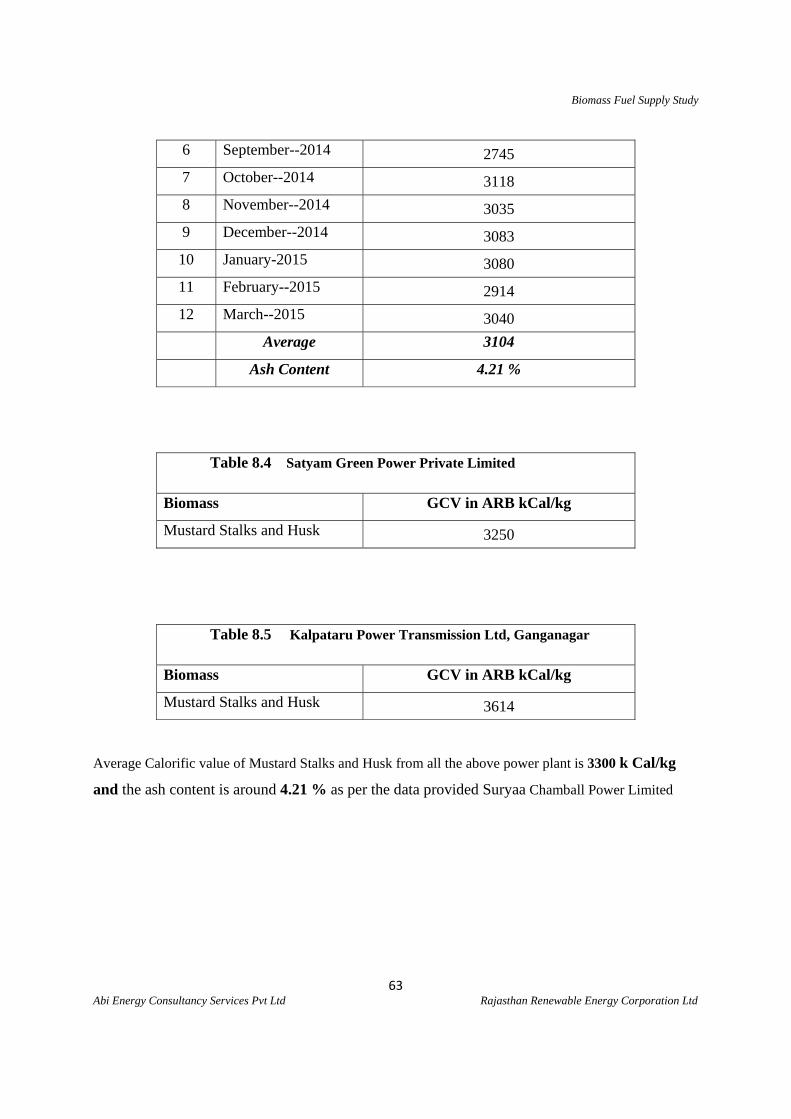
Biomass Fuel Supply Study
63 Abi Energy Consultancy Services Pvt Ltd Rajasthan Renewable Energy Corporation Ltd
Average Calorific value of Mustard Stalks and Husk from all the above power plant is 3300 k Cal/kg
and the ash content is around 4.21 % as per the data provided Suryaa Chamball Power Limited
6 September--2014 2745
7 October--2014 3118
8 November--2014 3035
9 December--2014 3083
10 January-2015 3080
11 February--2015 2914
12 March--2015 3040
Average 3104
Ash Content 4.21 %
Table 8.4 Satyam Green Power Private Limited
Biomass GCV in ARB kCal/kg
Mustard Stalks and Husk 3250
Table 8.5 Kalpataru Power Transmission Ltd, Ganganagar
Biomass GCV in ARB kCal/kg
Mustard Stalks and Husk 3614
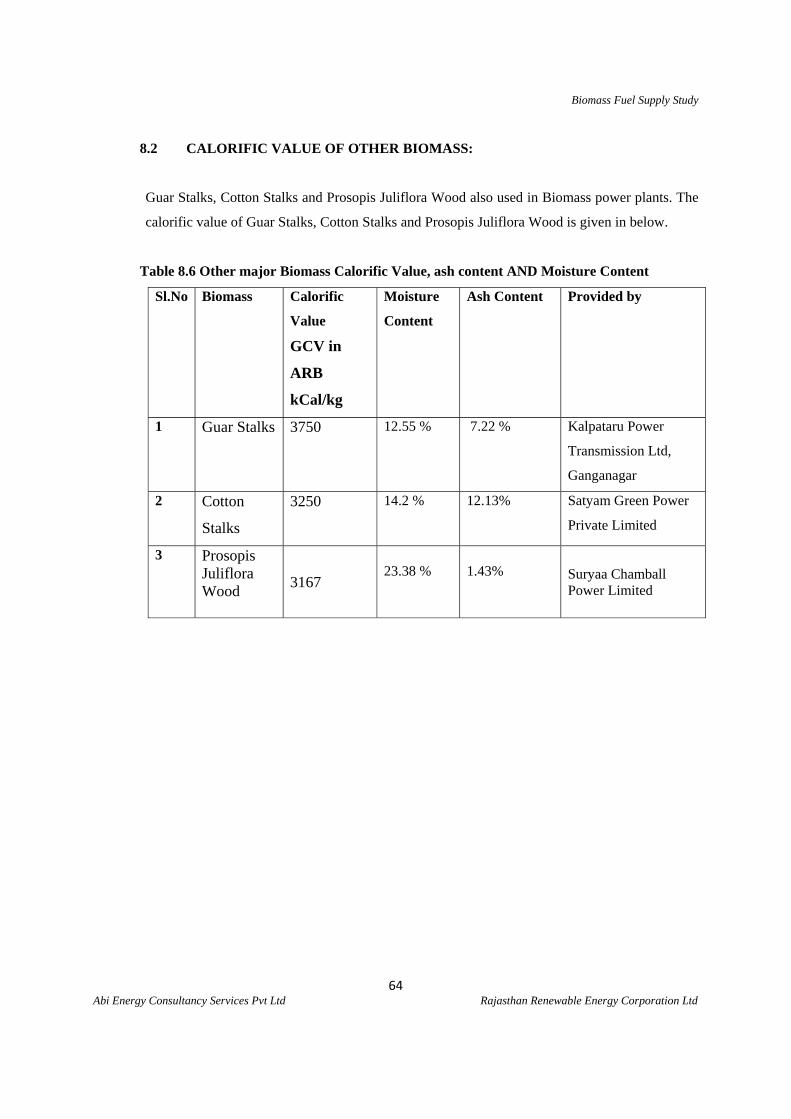
Biomass Fuel Supply Study
64 Abi Energy Consultancy Services Pvt Ltd Rajasthan Renewable Energy Corporation Ltd
8.2 CALORIFIC VALUE OF OTHER BIOMASS:
Guar Stalks, Cotton Stalks and Prosopis Juliflora Wood also used in Biomass power plants. The
calorific value of Guar Stalks, Cotton Stalks and Prosopis Juliflora Wood is given in below.
Table 8.6 Other major Biomass Calorific Value, ash content AND Moisture Content
Sl.No Biomass Calorific
Value
GCV in
ARB
kCal/kg
Moisture
Content
Ash Content Provided by
1 Guar Stalks 3750 12.55 % 7.22 %
Kalpataru Power
Transmission Ltd,
Ganganagar
2 Cotton
Stalks
3250 14.2 % 12.13% Satyam Green Power
Private Limited
3 Prosopis Juliflora Wood
3167
23.38 %
1.43% Suryaa Chamball
Power Limited
Biomass Fuel Supply Study
65 Abi Energy Consultancy Services Pvt Ltd Rajasthan Renewable Energy Corporation Ltd
Chapter 9
BIOMASS POWER PLANTS IN RAJASTHAN
9.0 INTRODUCTION
The Rajasthan state consists of 33 districts and the average cultivated area of Rajasthan state for
the past three years is coming around 225,44,455 Ha. The residues of Mustard, Guar, Cotton and
Prosopis Juliflora are considered by the biomass power plants as the main fuel for power
generation. The biomass power plants are managing their fuel requirement by mixing the
available crop residues like mustard stalks & husk, guar stalks, cotton stalks, other agro residues
and waste land biomass like Prosopis Juliflora wood. The generation of the mustard stalks &
husk, guar stalks, cotton stalks are quite stable and predictable. There are totally 10 biomass
power plant in Rajasthan and the fuel procurement and consumption of the below listed power
plants are discussed in this section,
1. Satyam Green Power Private Limited
2. Transtech Green Power Private Limited
3. S M Environmental Technologies Private Limited
4. Kalpataru Power Transmission Ltd-Ganganagar
5. Kalpataru Power Transmission Ltd-Tonk
6. Sanjog Sugars & Eco Power Private Limited
7. Orient Green Power Company (Rajasthan) Private Limited. Kishanganj
8. Suryaa Chamball Power Limited
9. Sambhav Energy Limited
10. Amrit Environmental Technologies.
Out of the ten power plants, two power plants namely Sambhav Energy Limited and Amrit
Environmental Technologies are not in operation for the last two years because of drastic
increase in fuel price. The reason for the increase in the fuel price is due to the increase in the
number of consuming industries nearby the power plant location. Since 2012 both these power
plants are not able to compete the market by procuring the biomass fuel at higher price and that
resulted in the permanent shutdown of these power plants. As the biomass price study requires
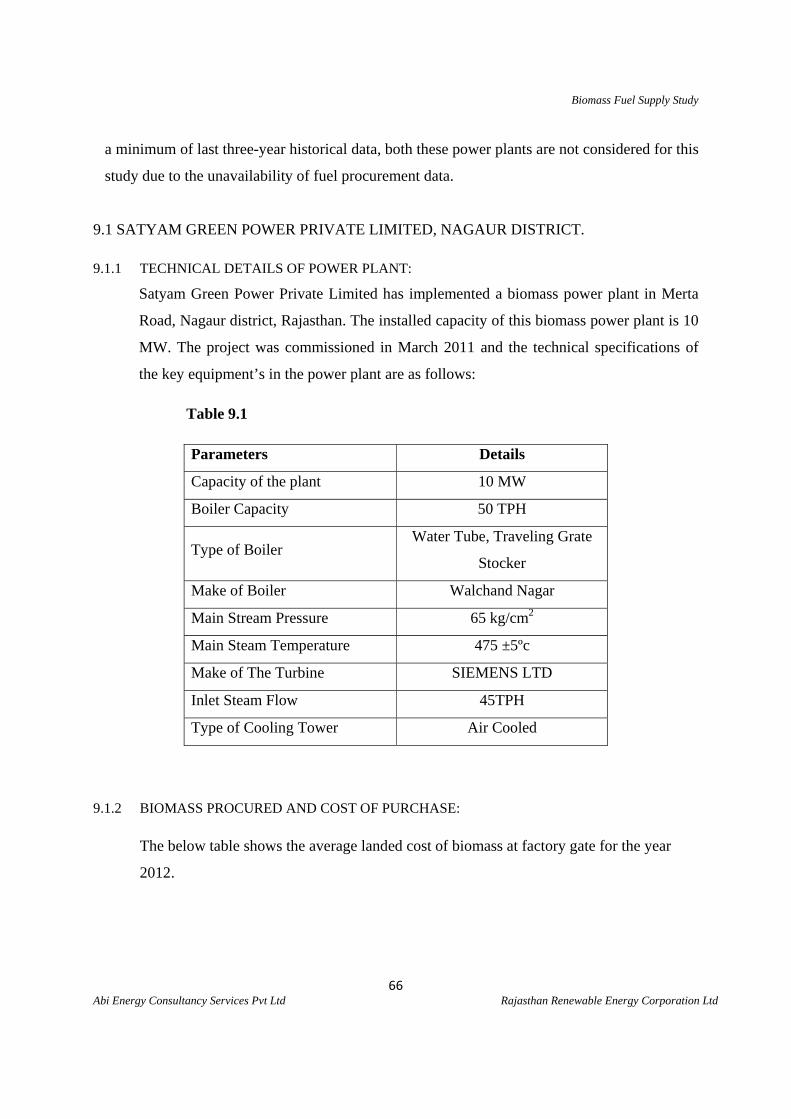
Biomass Fuel Supply Study
66 Abi Energy Consultancy Services Pvt Ltd Rajasthan Renewable Energy Corporation Ltd
a minimum of last three-year historical data, both these power plants are not considered for this
study due to the unavailability of fuel procurement data.
9.1 SATYAM GREEN POWER PRIVATE LIMITED, NAGAUR DISTRICT.
9.1.1 TECHNICAL DETAILS OF POWER PLANT:
Satyam Green Power Private Limited has implemented a biomass power plant in Merta
Road, Nagaur district, Rajasthan. The installed capacity of this biomass power plant is 10
MW. The project was commissioned in March 2011 and the technical specifications of
the key equipment’s in the power plant are as follows:
Table 9.1
Parameters Details
Capacity of the plant 10 MW
Boiler Capacity 50 TPH
Type of Boiler Water Tube, Traveling Grate
Stocker
Make of Boiler Walchand Nagar
Main Stream Pressure 65 kg/cm2
Main Steam Temperature 475 ±5ºc
Make of The Turbine SIEMENS LTD
Inlet Steam Flow 45TPH
Type of Cooling Tower Air Cooled
9.1.2 BIOMASS PROCURED AND COST OF PURCHASE: The below table shows the average landed cost of biomass at factory gate for the year
2012.
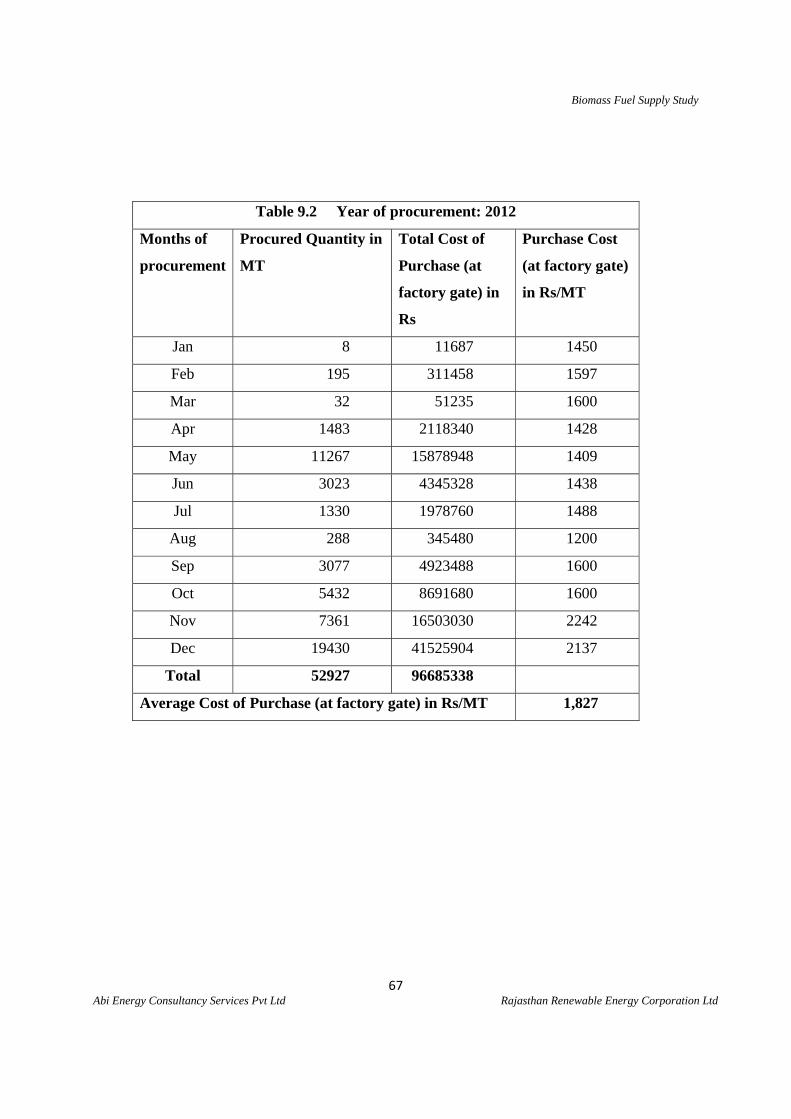
Biomass Fuel Supply Study
67 Abi Energy Consultancy Services Pvt Ltd Rajasthan Renewable Energy Corporation Ltd
Table 9.2 Year of procurement: 2012
Months of
procurement
Procured Quantity in
MT
Total Cost of
Purchase (at
factory gate) in
Rs
Purchase Cost
(at factory gate)
in Rs/MT
Jan 8 11687 1450
Feb 195 311458 1597
Mar 32 51235 1600
Apr 1483 2118340 1428
May 11267 15878948 1409
Jun 3023 4345328 1438
Jul 1330 1978760 1488
Aug 288 345480 1200
Sep 3077 4923488 1600
Oct 5432 8691680 1600
Nov 7361 16503030 2242
Dec 19430 41525904 2137
Total 52927 96685338
Average Cost of Purchase (at factory gate) in Rs/MT 1,827
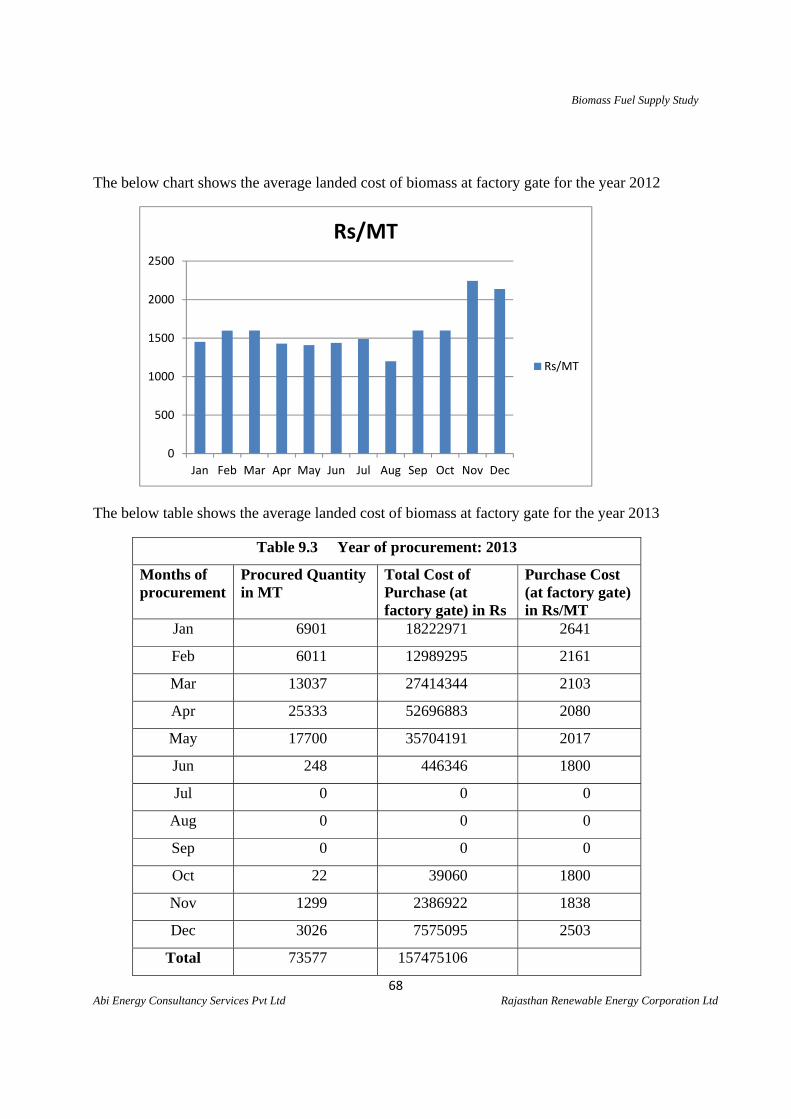
Biomass Fuel Supply Study
68 Abi Energy Consultancy Services Pvt Ltd Rajasthan Renewable Energy Corporation Ltd
The below chart shows the average landed cost of biomass at factory gate for the year 2012
The below table shows the average landed cost of biomass at factory gate for the year 2013
Table 9.3 Year of procurement: 2013
Months of procurement
Procured Quantity in MT
Total Cost of Purchase (at factory gate) in Rs
Purchase Cost (at factory gate) in Rs/MT
Jan 6901 18222971 2641
Feb 6011 12989295 2161
Mar 13037 27414344 2103
Apr 25333 52696883 2080
May 17700 35704191 2017
Jun 248 446346 1800
Jul 0 0 0
Aug 0 0 0
Sep 0 0 0
Oct 22 39060 1800
Nov 1299 2386922 1838
Dec 3026 7575095 2503
Total 73577 157475106
0
500
1000
1500
2000
2500
Jan Feb Mar Apr May Jun Jul Aug Sep Oct Nov Dec
Rs/MT
Rs/MT
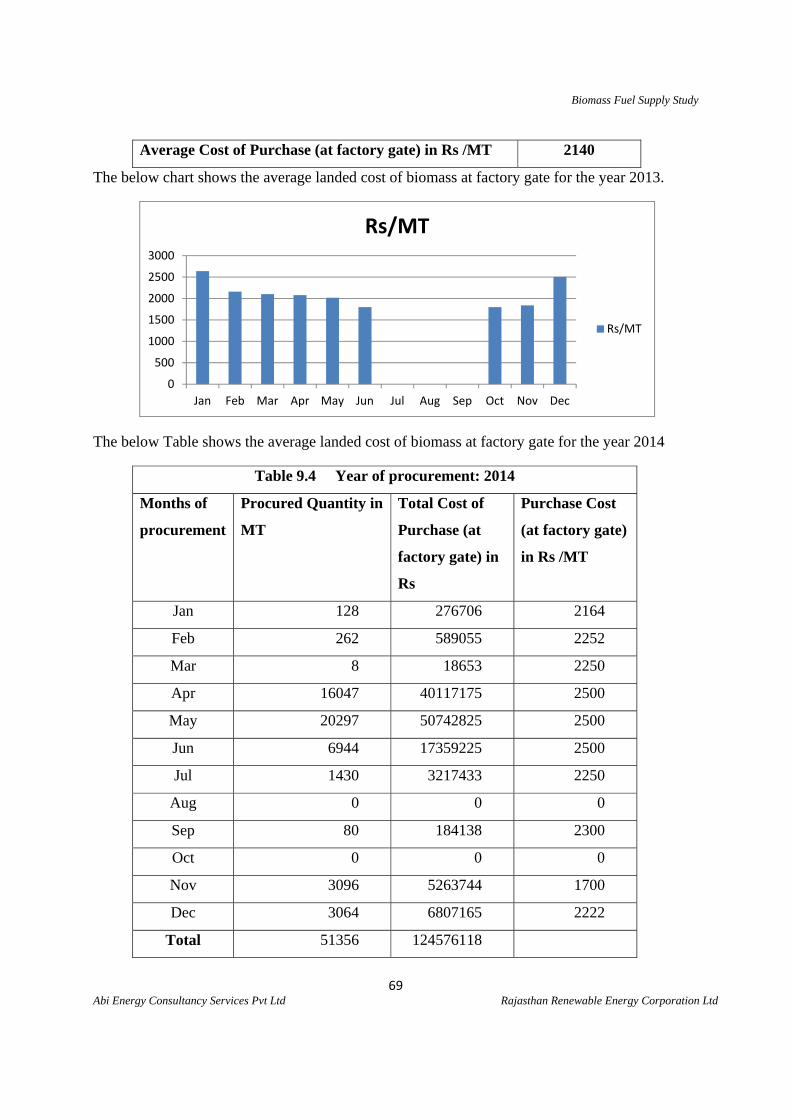
Biomass Fuel Supply Study
69 Abi Energy Consultancy Services Pvt Ltd Rajasthan Renewable Energy Corporation Ltd
Average Cost of Purchase (at factory gate) in Rs /MT 2140
The below chart shows the average landed cost of biomass at factory gate for the year 2013.
The below Table shows the average landed cost of biomass at factory gate for the year 2014
Table 9.4 Year of procurement: 2014
Months of
procurement
Procured Quantity in
MT
Total Cost of
Purchase (at
factory gate) in
Rs
Purchase Cost
(at factory gate)
in Rs /MT
Jan 128 276706 2164
Feb 262 589055 2252
Mar 8 18653 2250
Apr 16047 40117175 2500
May 20297 50742825 2500
Jun 6944 17359225 2500
Jul 1430 3217433 2250
Aug 0 0 0
Sep 80 184138 2300
Oct 0 0 0
Nov 3096 5263744 1700
Dec 3064 6807165 2222
Total 51356 124576118
0
500
1000
1500
2000
2500
3000
Jan Feb Mar Apr May Jun Jul Aug Sep Oct Nov Dec
Rs/MT
Rs/MT
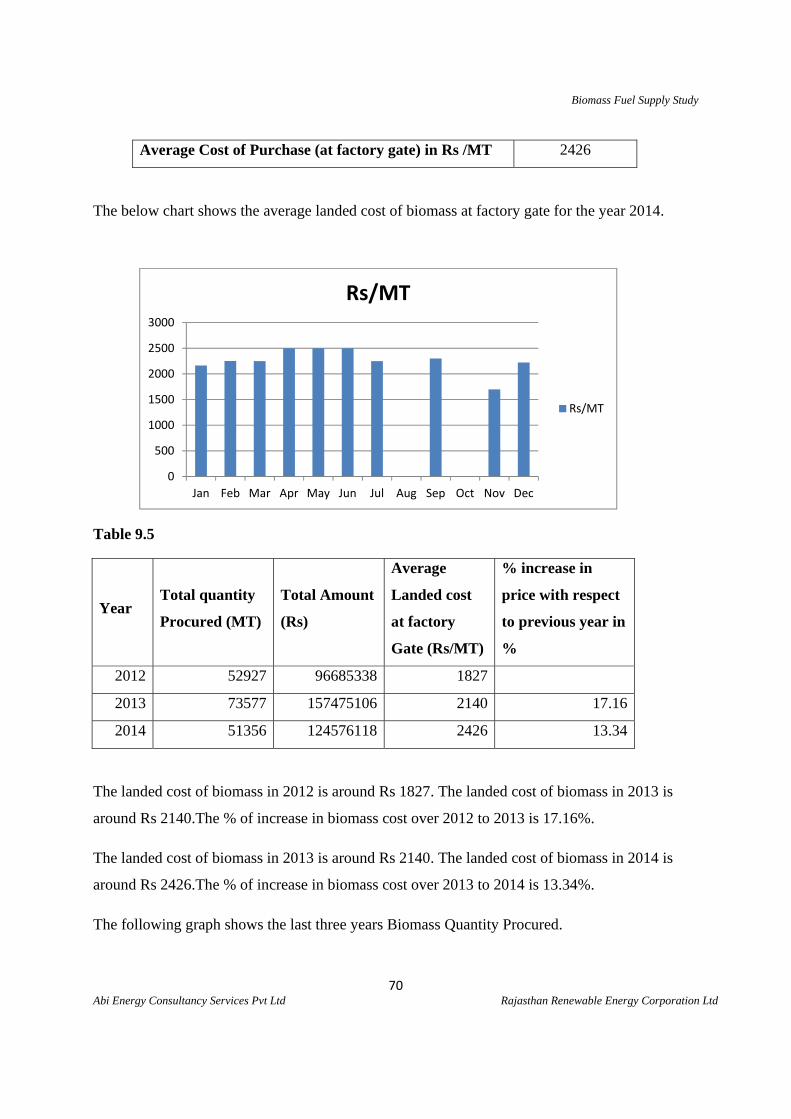
Biomass Fuel Supply Study
70 Abi Energy Consultancy Services Pvt Ltd Rajasthan Renewable Energy Corporation Ltd
Average Cost of Purchase (at factory gate) in Rs /MT 2426
The below chart shows the average landed cost of biomass at factory gate for the year 2014.
Table 9.5
Year Total quantity
Procured (MT)
Total Amount
(Rs)
Average
Landed cost
at factory
Gate (Rs/MT)
% increase in
price with respect
to previous year in
%
2012 52927 96685338 1827
2013 73577 157475106 2140 17.16
2014 51356 124576118 2426 13.34
The landed cost of biomass in 2012 is around Rs 1827. The landed cost of biomass in 2013 is
around Rs 2140.The % of increase in biomass cost over 2012 to 2013 is 17.16%.
The landed cost of biomass in 2013 is around Rs 2140. The landed cost of biomass in 2014 is
around Rs 2426.The % of increase in biomass cost over 2013 to 2014 is 13.34%.
The following graph shows the last three years Biomass Quantity Procured.
0
500
1000
1500
2000
2500
3000
Jan Feb Mar Apr May Jun Jul Aug Sep Oct Nov Dec
Rs/MT
Rs/MT
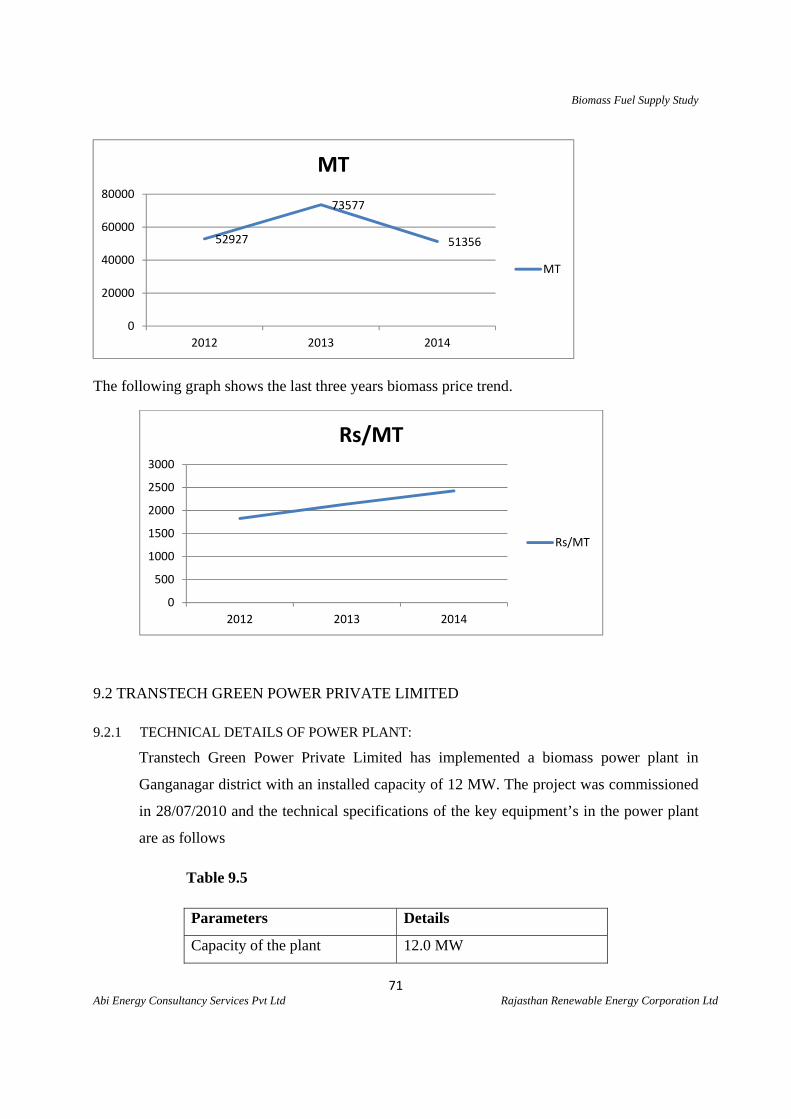
Biomass Fuel Supply Study
71 Abi Energy Consultancy Services Pvt Ltd Rajasthan Renewable Energy Corporation Ltd
The following graph shows the last three years biomass price trend.
9.2 TRANSTECH GREEN POWER PRIVATE LIMITED
9.2.1 TECHNICAL DETAILS OF POWER PLANT:
Transtech Green Power Private Limited has implemented a biomass power plant in
Ganganagar district with an installed capacity of 12 MW. The project was commissioned
in 28/07/2010 and the technical specifications of the key equipment’s in the power plant
are as follows
Table 9.5
Parameters Details
Capacity of the plant 12.0 MW
52927
73577
51356
0
20000
40000
60000
80000
2012 2013 2014
MT
MT
0
500
1000
1500
2000
2500
3000
2012 2013 2014
Rs/MT
Rs/MT
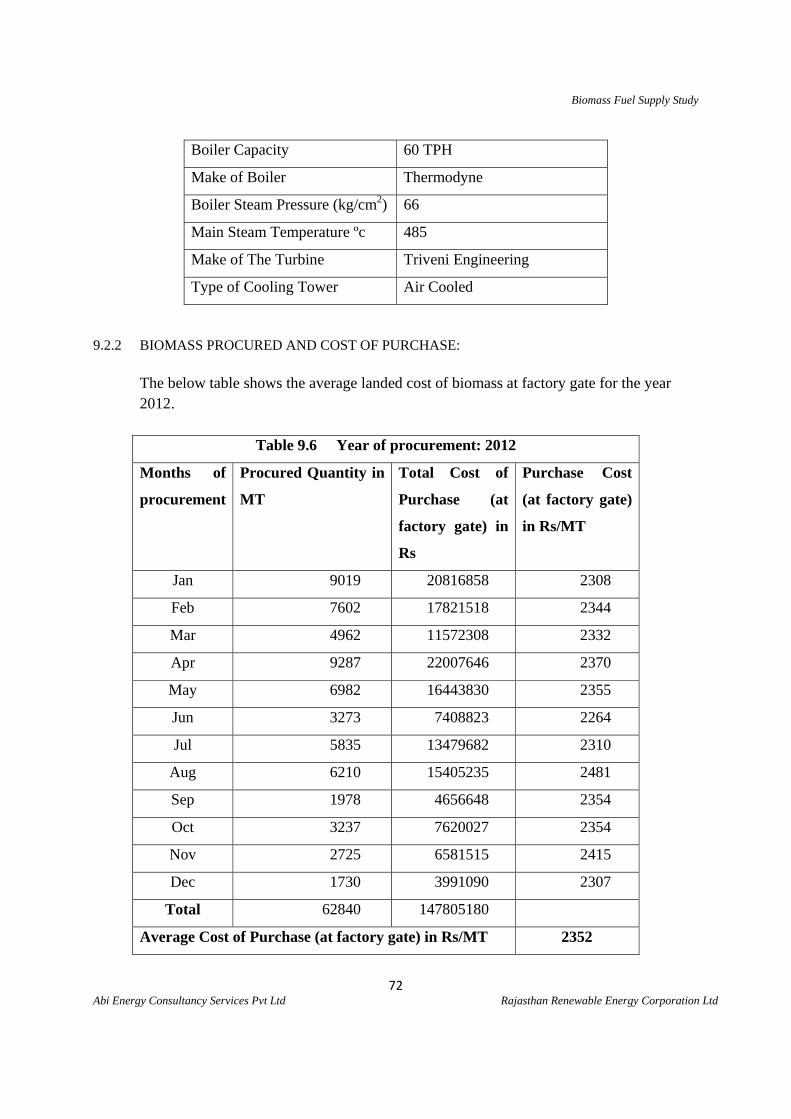
Biomass Fuel Supply Study
72 Abi Energy Consultancy Services Pvt Ltd Rajasthan Renewable Energy Corporation Ltd
Boiler Capacity 60 TPH
Make of Boiler Thermodyne
Boiler Steam Pressure (kg/cm2) 66
Main Steam Temperature ºc 485
Make of The Turbine Triveni Engineering
Type of Cooling Tower Air Cooled
9.2.2 BIOMASS PROCURED AND COST OF PURCHASE: The below table shows the average landed cost of biomass at factory gate for the year 2012.
Table 9.6 Year of procurement: 2012
Months of
procurement
Procured Quantity in
MT
Total Cost of
Purchase (at
factory gate) in
Rs
Purchase Cost
(at factory gate)
in Rs/MT
Jan 9019 20816858 2308
Feb 7602 17821518 2344
Mar 4962 11572308 2332
Apr 9287 22007646 2370
May 6982 16443830 2355
Jun 3273 7408823 2264
Jul 5835 13479682 2310
Aug 6210 15405235 2481
Sep 1978 4656648 2354
Oct 3237 7620027 2354
Nov 2725 6581515 2415
Dec 1730 3991090 2307
Total 62840 147805180
Average Cost of Purchase (at factory gate) in Rs/MT 2352
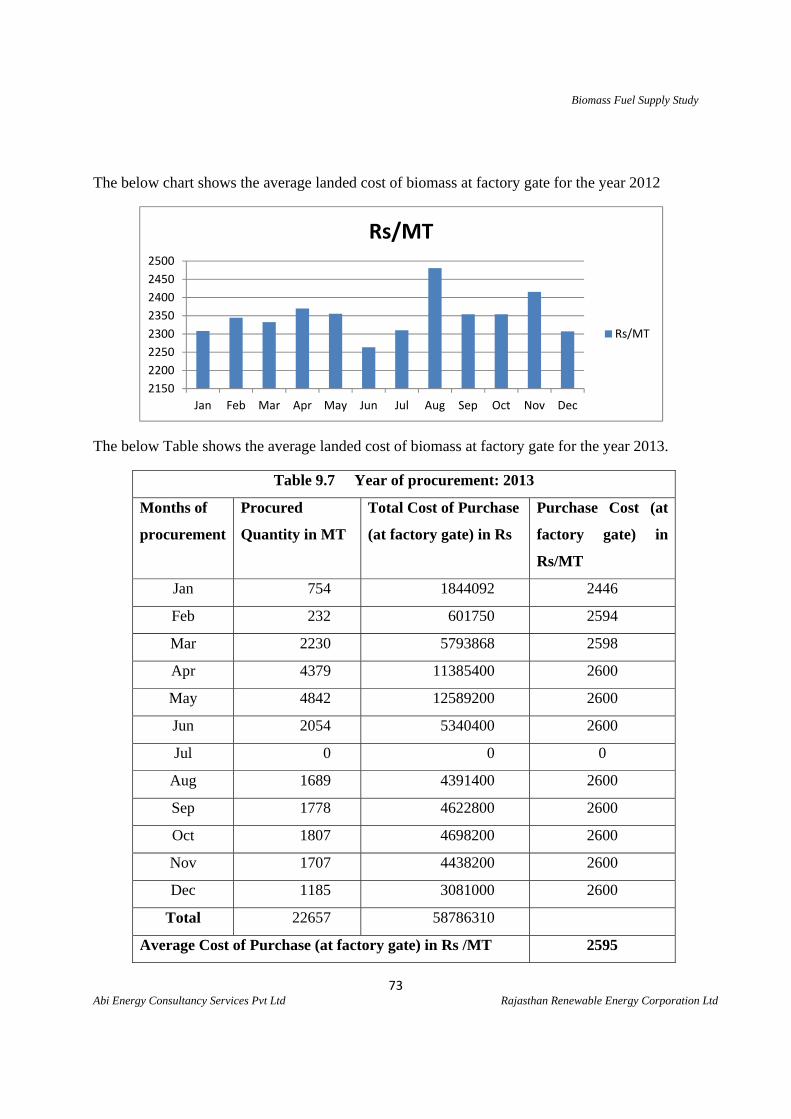
Biomass Fuel Supply Study
73 Abi Energy Consultancy Services Pvt Ltd Rajasthan Renewable Energy Corporation Ltd
The below chart shows the average landed cost of biomass at factory gate for the year 2012
The below Table shows the average landed cost of biomass at factory gate for the year 2013.
Table 9.7 Year of procurement: 2013
Months of
procurement
Procured
Quantity in MT
Total Cost of Purchase
(at factory gate) in Rs
Purchase Cost (at
factory gate) in
Rs/MT
Jan 754 1844092 2446
Feb 232 601750 2594
Mar 2230 5793868 2598
Apr 4379 11385400 2600
May 4842 12589200 2600
Jun 2054 5340400 2600
Jul 0 0 0
Aug 1689 4391400 2600
Sep 1778 4622800 2600
Oct 1807 4698200 2600
Nov 1707 4438200 2600
Dec 1185 3081000 2600
Total 22657 58786310
Average Cost of Purchase (at factory gate) in Rs /MT 2595
2150
2200
2250
2300
2350
2400
2450
2500
Jan Feb Mar Apr May Jun Jul Aug Sep Oct Nov Dec
Rs/MT
Rs/MT
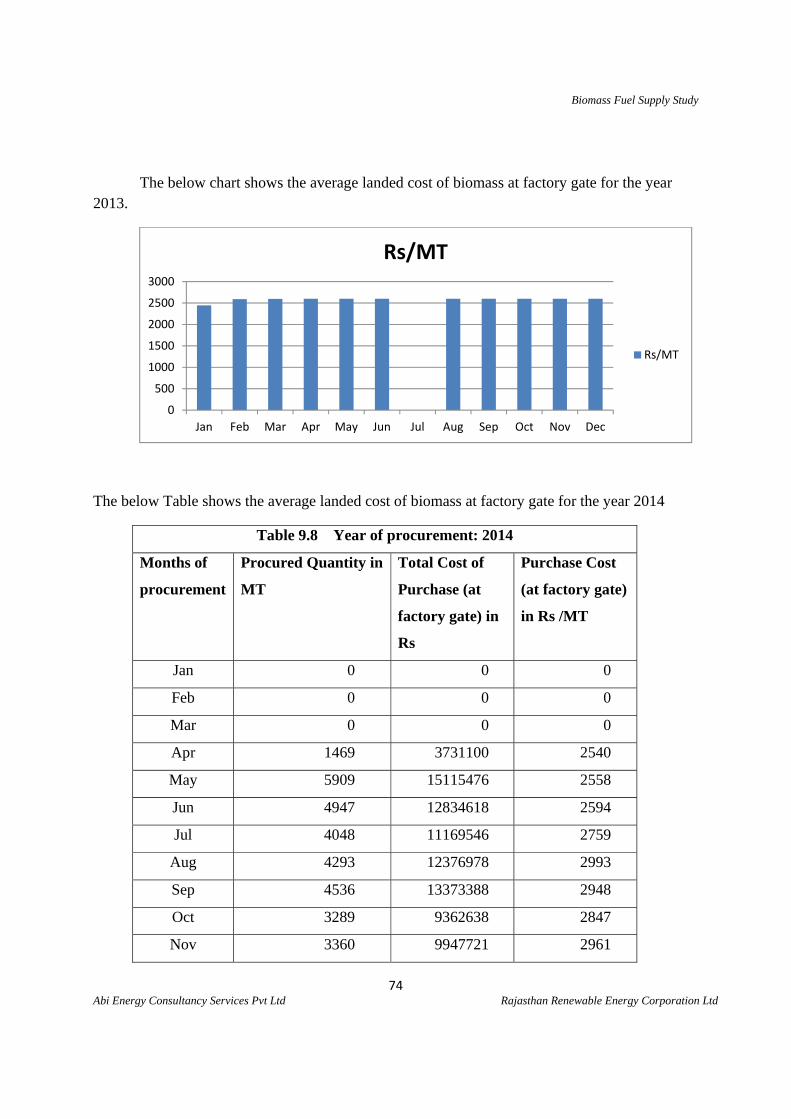
Biomass Fuel Supply Study
74 Abi Energy Consultancy Services Pvt Ltd Rajasthan Renewable Energy Corporation Ltd
The below chart shows the average landed cost of biomass at factory gate for the year 2013.
The below Table shows the average landed cost of biomass at factory gate for the year 2014
Table 9.8 Year of procurement: 2014
Months of
procurement
Procured Quantity in
MT
Total Cost of
Purchase (at
factory gate) in
Rs
Purchase Cost
(at factory gate)
in Rs /MT
Jan 0 0 0
Feb 0 0 0
Mar 0 0 0
Apr 1469 3731100 2540
May 5909 15115476 2558
Jun 4947 12834618 2594
Jul 4048 11169546 2759
Aug 4293 12376978 2993
Sep 4536 13373388 2948
Oct 3289 9362638 2847
Nov 3360 9947721 2961
0
500
1000
1500
2000
2500
3000
Jan Feb Mar Apr May Jun Jul Aug Sep Oct Nov Dec
Rs/MT
Rs/MT
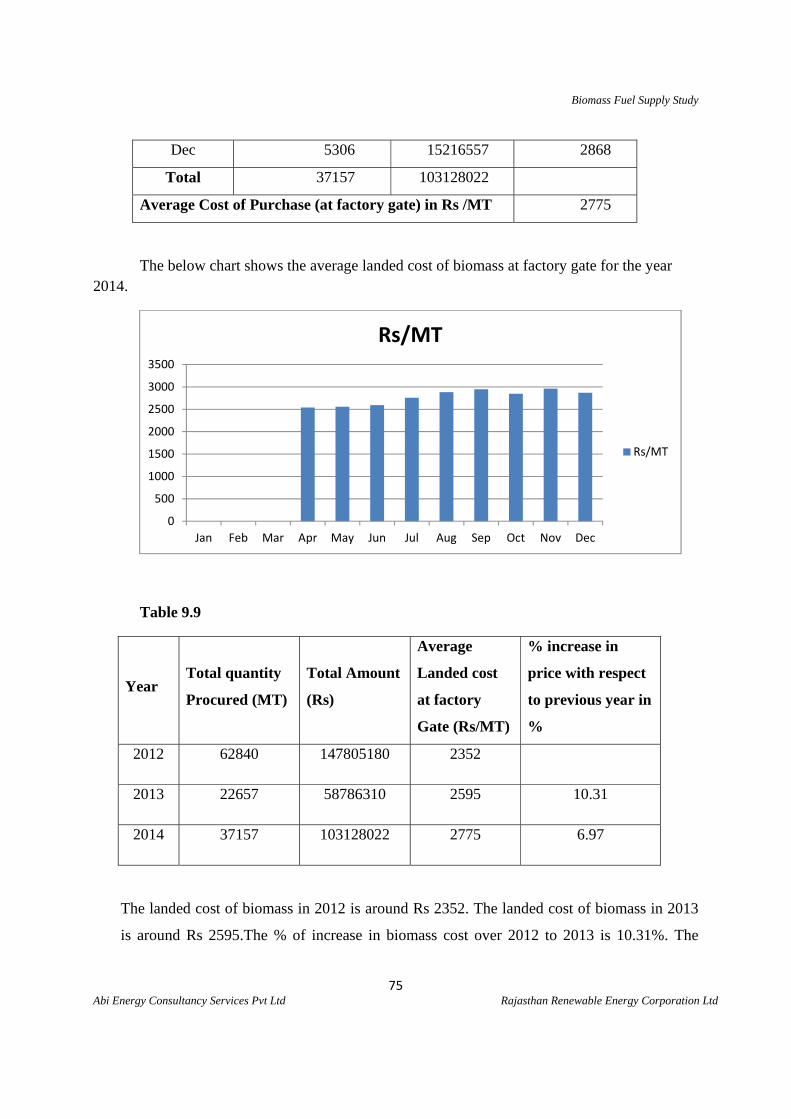
Biomass Fuel Supply Study
75 Abi Energy Consultancy Services Pvt Ltd Rajasthan Renewable Energy Corporation Ltd
Dec 5306 15216557 2868
Total 37157 103128022
Average Cost of Purchase (at factory gate) in Rs /MT 2775
The below chart shows the average landed cost of biomass at factory gate for the year 2014.
Table 9.9
Year Total quantity
Procured (MT)
Total Amount
(Rs)
Average
Landed cost
at factory
Gate (Rs/MT)
% increase in
price with respect
to previous year in
%
2012 62840 147805180 2352
2013 22657 58786310 2595 10.31
2014 37157 103128022 2775 6.97
The landed cost of biomass in 2012 is around Rs 2352. The landed cost of biomass in 2013
is around Rs 2595.The % of increase in biomass cost over 2012 to 2013 is 10.31%. The
0
500
1000
1500
2000
2500
3000
3500
Jan Feb Mar Apr May Jun Jul Aug Sep Oct Nov Dec
Rs/MT
Rs/MT
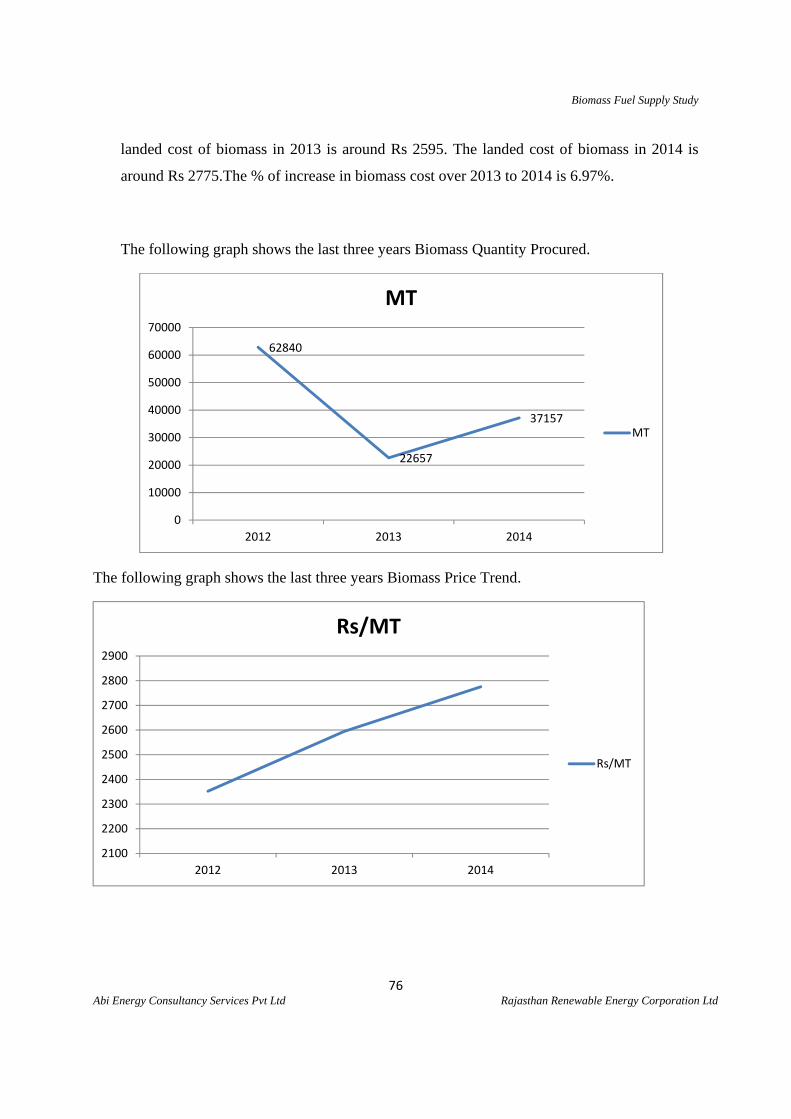
Biomass Fuel Supply Study
76 Abi Energy Consultancy Services Pvt Ltd Rajasthan Renewable Energy Corporation Ltd
landed cost of biomass in 2013 is around Rs 2595. The landed cost of biomass in 2014 is
around Rs 2775.The % of increase in biomass cost over 2013 to 2014 is 6.97%.
The following graph shows the last three years Biomass Quantity Procured.
The following graph shows the last three years Biomass Price Trend.
62840
22657
37157
0
10000
20000
30000
40000
50000
60000
70000
2012 2013 2014
MT
MT
2100
2200
2300
2400
2500
2600
2700
2800
2900
2012 2013 2014
Rs/MT
Rs/MT
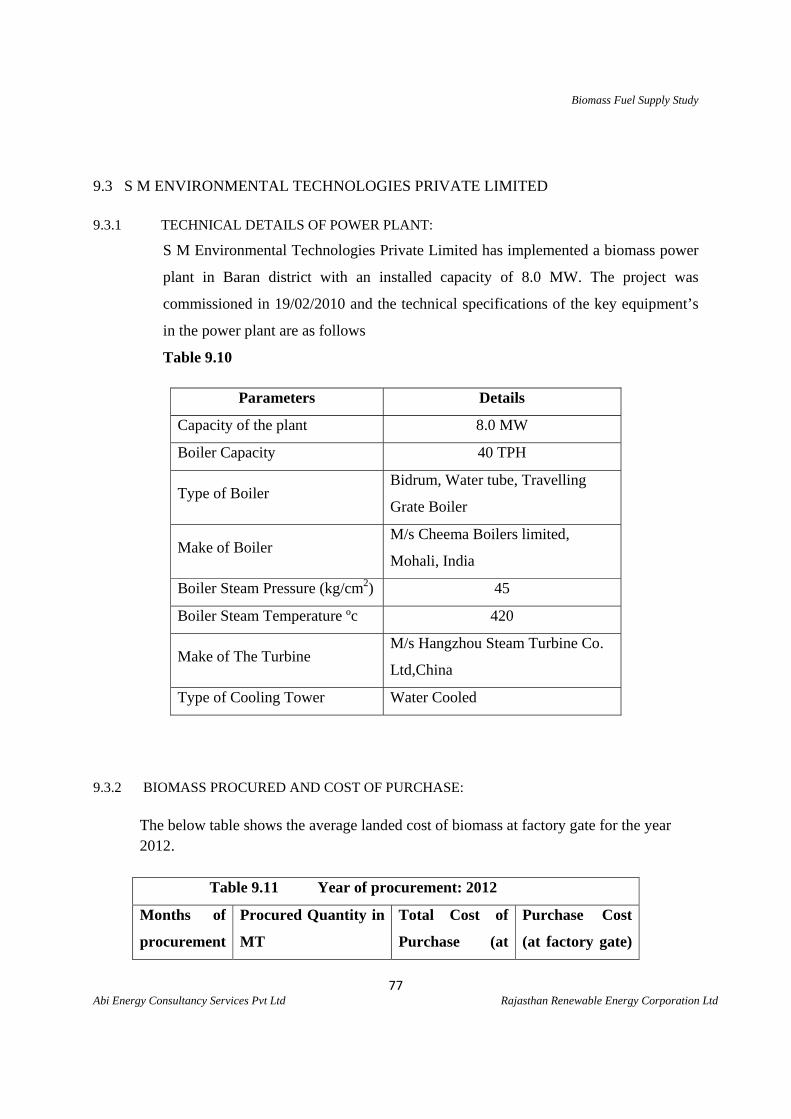
Biomass Fuel Supply Study
77 Abi Energy Consultancy Services Pvt Ltd Rajasthan Renewable Energy Corporation Ltd
9.3 S M ENVIRONMENTAL TECHNOLOGIES PRIVATE LIMITED
9.3.1 TECHNICAL DETAILS OF POWER PLANT:
S M Environmental Technologies Private Limited has implemented a biomass power
plant in Baran district with an installed capacity of 8.0 MW. The project was
commissioned in 19/02/2010 and the technical specifications of the key equipment’s
in the power plant are as follows
Table 9.10
Parameters Details
Capacity of the plant 8.0 MW
Boiler Capacity 40 TPH
Type of Boiler Bidrum, Water tube, Travelling
Grate Boiler
Make of Boiler M/s Cheema Boilers limited,
Mohali, India
Boiler Steam Pressure (kg/cm2) 45
Boiler Steam Temperature ºc 420
Make of The Turbine M/s Hangzhou Steam Turbine Co.
Ltd,China
Type of Cooling Tower Water Cooled
9.3.2 BIOMASS PROCURED AND COST OF PURCHASE: The below table shows the average landed cost of biomass at factory gate for the year 2012.
Table 9.11 Year of procurement: 2012
Months of
procurement
Procured Quantity in
MT
Total Cost of
Purchase (at
Purchase Cost
(at factory gate)
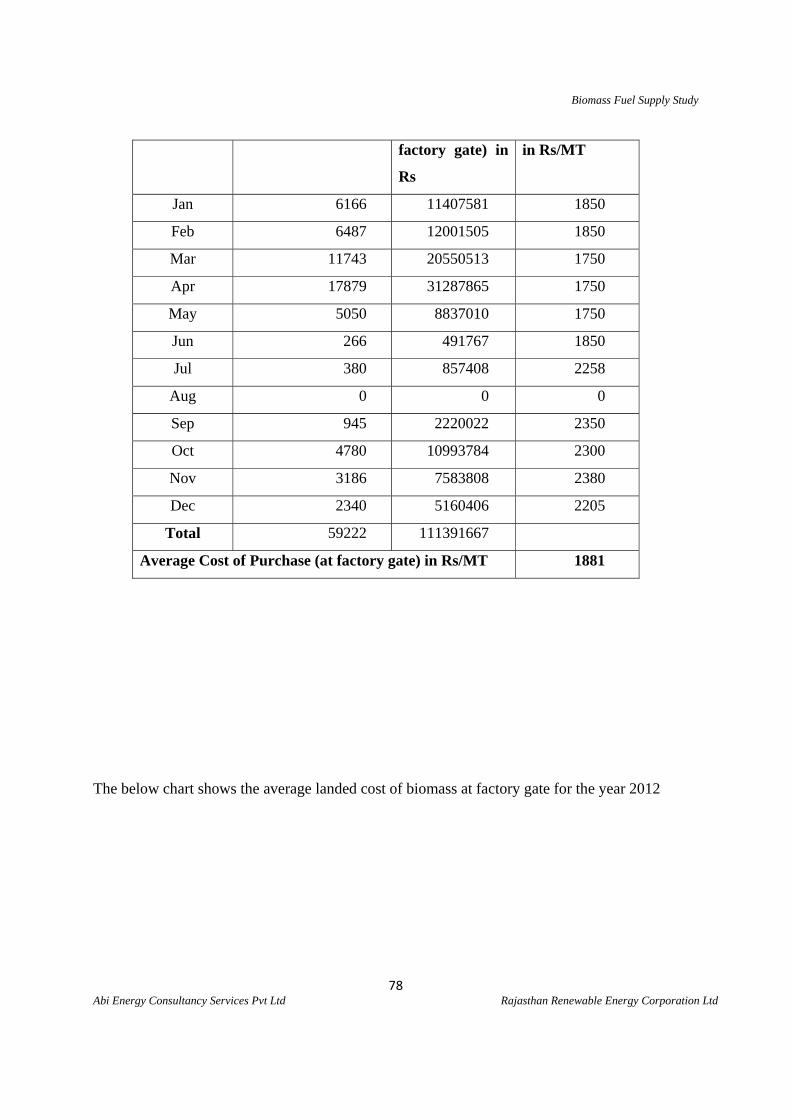
Biomass Fuel Supply Study
78 Abi Energy Consultancy Services Pvt Ltd Rajasthan Renewable Energy Corporation Ltd
factory gate) in
Rs
in Rs/MT
Jan 6166 11407581 1850
Feb 6487 12001505 1850
Mar 11743 20550513 1750
Apr 17879 31287865 1750
May 5050 8837010 1750
Jun 266 491767 1850
Jul 380 857408 2258
Aug 0 0 0
Sep 945 2220022 2350
Oct 4780 10993784 2300
Nov 3186 7583808 2380
Dec 2340 5160406 2205
Total 59222 111391667
Average Cost of Purchase (at factory gate) in Rs/MT 1881
The below chart shows the average landed cost of biomass at factory gate for the year 2012
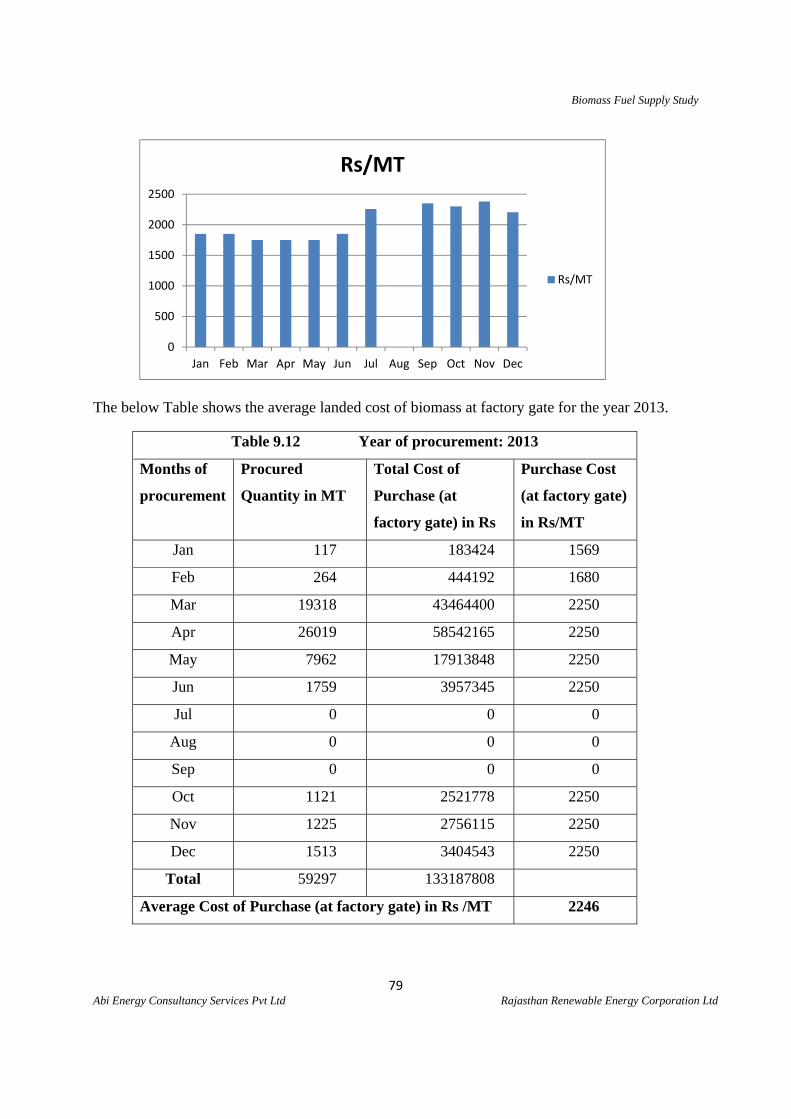
Biomass Fuel Supply Study
79 Abi Energy Consultancy Services Pvt Ltd Rajasthan Renewable Energy Corporation Ltd
The below Table shows the average landed cost of biomass at factory gate for the year 2013.
Table 9.12 Year of procurement: 2013
Months of
procurement
Procured
Quantity in MT
Total Cost of
Purchase (at
factory gate) in Rs
Purchase Cost
(at factory gate)
in Rs/MT
Jan 117 183424 1569
Feb 264 444192 1680
Mar 19318 43464400 2250
Apr 26019 58542165 2250
May 7962 17913848 2250
Jun 1759 3957345 2250
Jul 0 0 0
Aug 0 0 0
Sep 0 0 0
Oct 1121 2521778 2250
Nov 1225 2756115 2250
Dec 1513 3404543 2250
Total 59297 133187808
Average Cost of Purchase (at factory gate) in Rs /MT 2246
0
500
1000
1500
2000
2500
Jan Feb Mar Apr May Jun Jul Aug Sep Oct Nov Dec
Rs/MT
Rs/MT
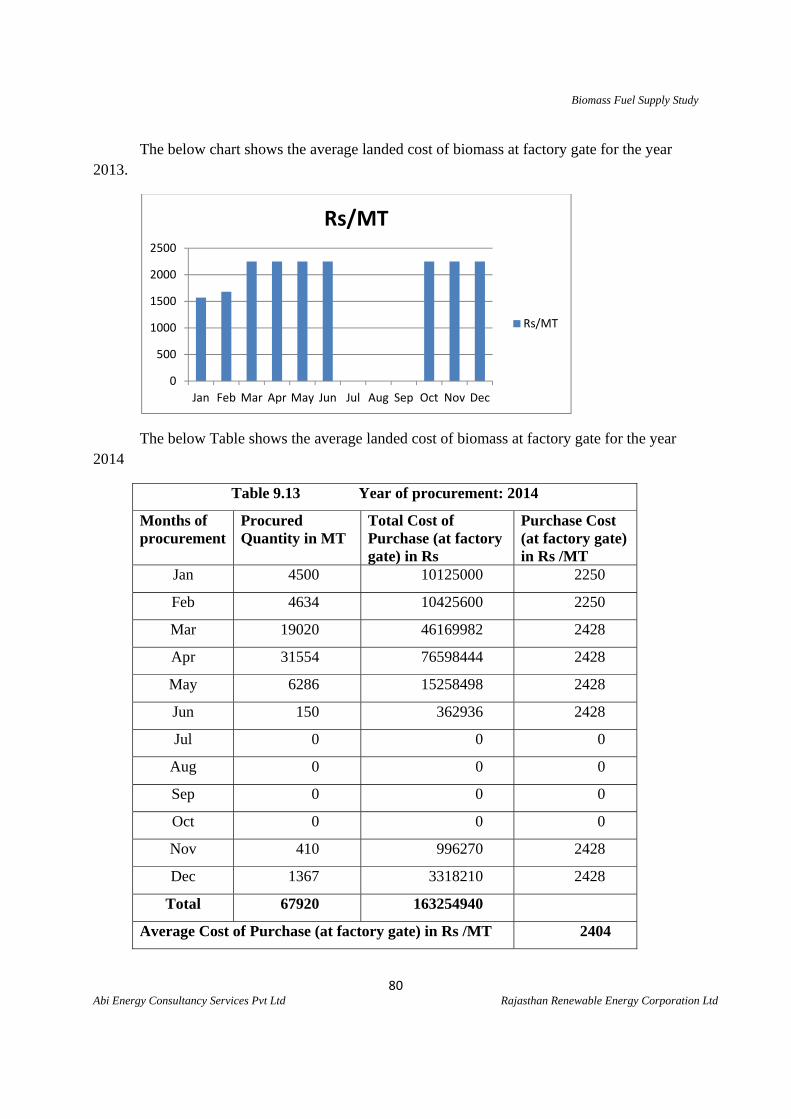
Biomass Fuel Supply Study
80 Abi Energy Consultancy Services Pvt Ltd Rajasthan Renewable Energy Corporation Ltd
The below chart shows the average landed cost of biomass at factory gate for the year 2013.
The below Table shows the average landed cost of biomass at factory gate for the year 2014
Table 9.13 Year of procurement: 2014
Months of procurement
Procured Quantity in MT
Total Cost of Purchase (at factory gate) in Rs
Purchase Cost (at factory gate) in Rs /MT
Jan 4500 10125000 2250
Feb 4634 10425600 2250
Mar 19020 46169982 2428
Apr 31554 76598444 2428
May 6286 15258498 2428
Jun 150 362936 2428
Jul 0 0 0
Aug 0 0 0
Sep 0 0 0
Oct 0 0 0
Nov 410 996270 2428
Dec 1367 3318210 2428
Total 67920 163254940
Average Cost of Purchase (at factory gate) in Rs /MT 2404
0
500
1000
1500
2000
2500
Jan Feb Mar Apr May Jun Jul Aug Sep Oct Nov Dec
Rs/MT
Rs/MT
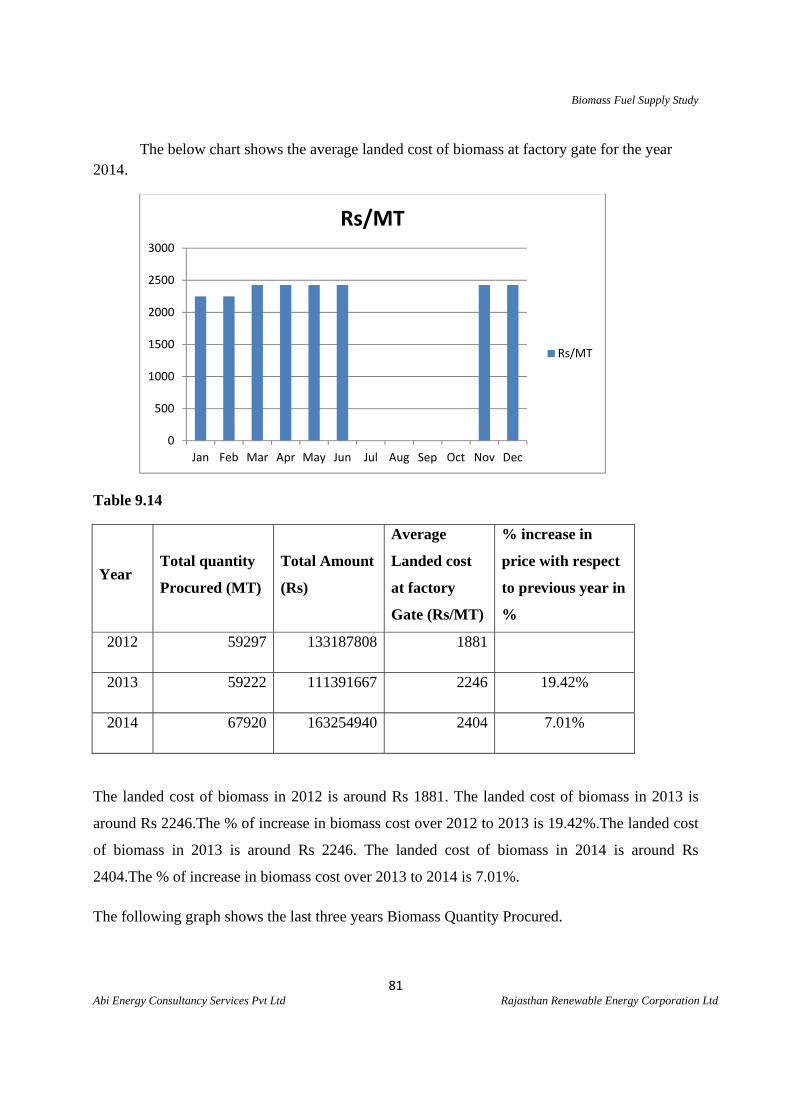
Biomass Fuel Supply Study
81 Abi Energy Consultancy Services Pvt Ltd Rajasthan Renewable Energy Corporation Ltd
The below chart shows the average landed cost of biomass at factory gate for the year 2014.
Table 9.14
Year Total quantity
Procured (MT)
Total Amount
(Rs)
Average
Landed cost
at factory
Gate (Rs/MT)
% increase in
price with respect
to previous year in
%
2012 59297 133187808 1881
2013 59222 111391667 2246 19.42%
2014 67920 163254940 2404 7.01%
The landed cost of biomass in 2012 is around Rs 1881. The landed cost of biomass in 2013 is
around Rs 2246.The % of increase in biomass cost over 2012 to 2013 is 19.42%.The landed cost
of biomass in 2013 is around Rs 2246. The landed cost of biomass in 2014 is around Rs
2404.The % of increase in biomass cost over 2013 to 2014 is 7.01%.
The following graph shows the last three years Biomass Quantity Procured.
0
500
1000
1500
2000
2500
3000
Jan Feb Mar Apr May Jun Jul Aug Sep Oct Nov Dec
Rs/MT
Rs/MT
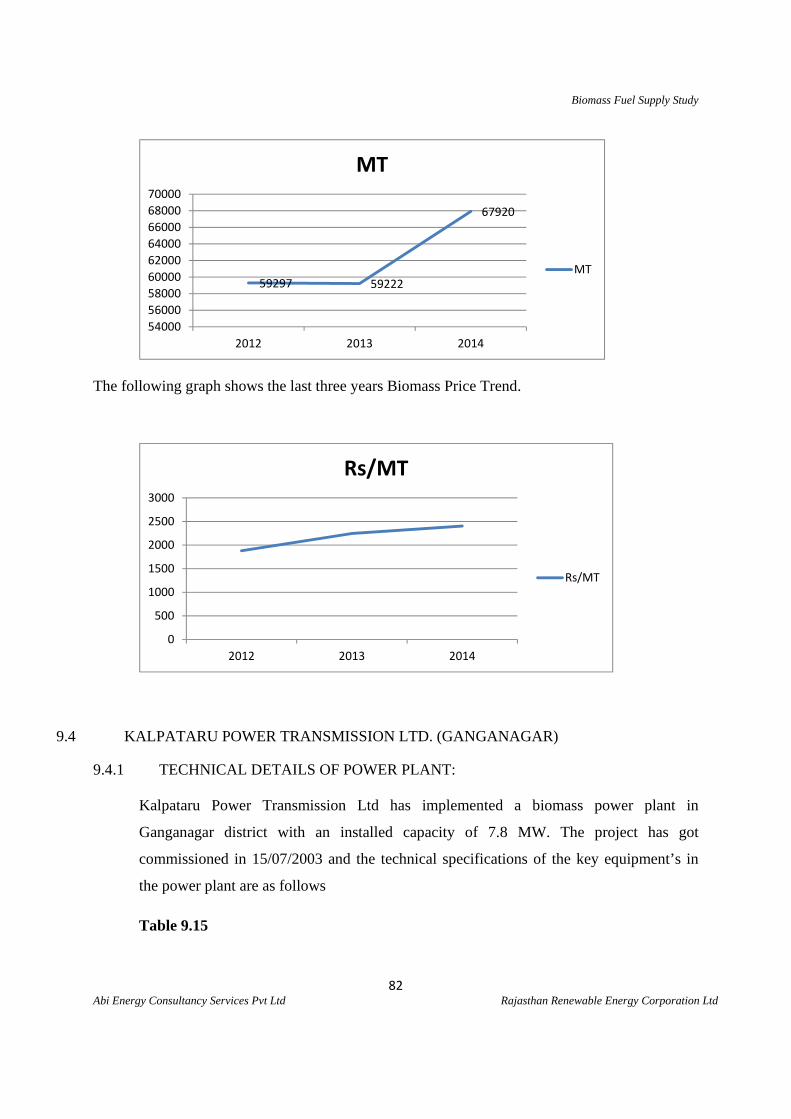
Biomass Fuel Supply Study
82 Abi Energy Consultancy Services Pvt Ltd Rajasthan Renewable Energy Corporation Ltd
The following graph shows the last three years Biomass Price Trend.
9.4 KALPATARU POWER TRANSMISSION LTD. (GANGANAGAR)
9.4.1 TECHNICAL DETAILS OF POWER PLANT: Kalpataru Power Transmission Ltd has implemented a biomass power plant in
Ganganagar district with an installed capacity of 7.8 MW. The project has got
commissioned in 15/07/2003 and the technical specifications of the key equipment’s in
the power plant are as follows
Table 9.15
59297 59222
67920
54000
56000
58000
60000
62000
64000
66000
68000
70000
2012 2013 2014
MT
MT
0
500
1000
1500
2000
2500
3000
2012 2013 2014
Rs/MT
Rs/MT
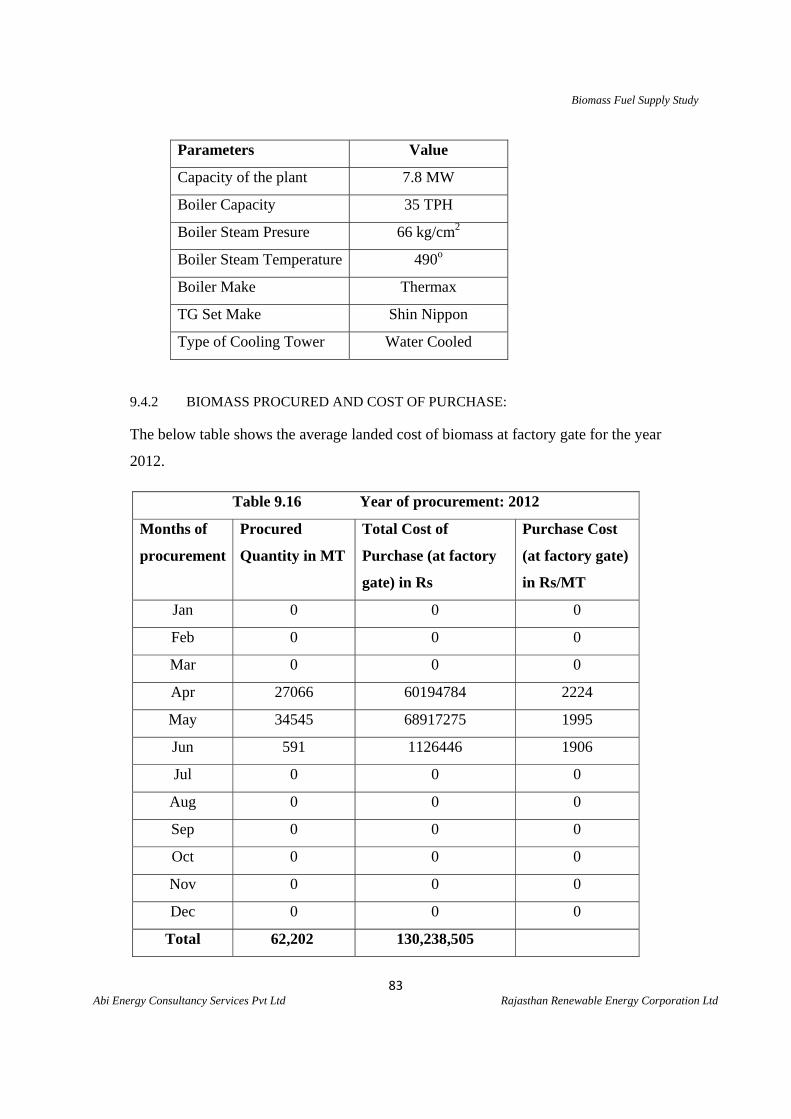
Biomass Fuel Supply Study
83 Abi Energy Consultancy Services Pvt Ltd Rajasthan Renewable Energy Corporation Ltd
Parameters Value
Capacity of the plant 7.8 MW
Boiler Capacity 35 TPH
Boiler Steam Presure 66 kg/cm2
Boiler Steam Temperature 490o
Boiler Make Thermax
TG Set Make Shin Nippon
Type of Cooling Tower Water Cooled
9.4.2 BIOMASS PROCURED AND COST OF PURCHASE:
The below table shows the average landed cost of biomass at factory gate for the year
2012.
Table 9.16 Year of procurement: 2012
Months of
procurement
Procured
Quantity in MT
Total Cost of
Purchase (at factory
gate) in Rs
Purchase Cost
(at factory gate)
in Rs/MT
Jan 0 0 0
Feb 0 0 0
Mar 0 0 0
Apr 27066 60194784 2224
May 34545 68917275 1995
Jun 591 1126446 1906
Jul 0 0 0
Aug 0 0 0
Sep 0 0 0
Oct 0 0 0
Nov 0 0 0
Dec 0 0 0
Total 62,202 130,238,505
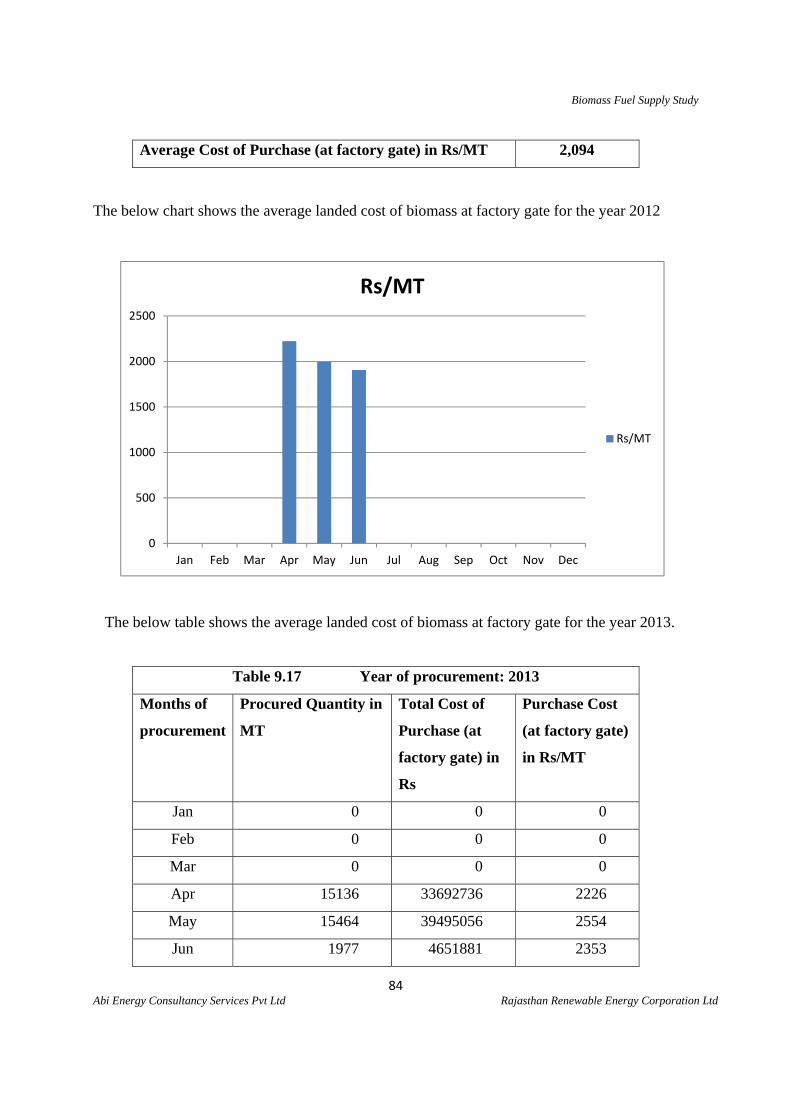
Biomass Fuel Supply Study
84 Abi Energy Consultancy Services Pvt Ltd Rajasthan Renewable Energy Corporation Ltd
Average Cost of Purchase (at factory gate) in Rs/MT 2,094
The below chart shows the average landed cost of biomass at factory gate for the year 2012
The below table shows the average landed cost of biomass at factory gate for the year 2013.
Table 9.17 Year of procurement: 2013
Months of
procurement
Procured Quantity in
MT
Total Cost of
Purchase (at
factory gate) in
Rs
Purchase Cost
(at factory gate)
in Rs/MT
Jan 0 0 0
Feb 0 0 0
Mar 0 0 0
Apr 15136 33692736 2226
May 15464 39495056 2554
Jun 1977 4651881 2353
0
500
1000
1500
2000
2500
Jan Feb Mar Apr May Jun Jul Aug Sep Oct Nov Dec
Rs/MT
Rs/MT
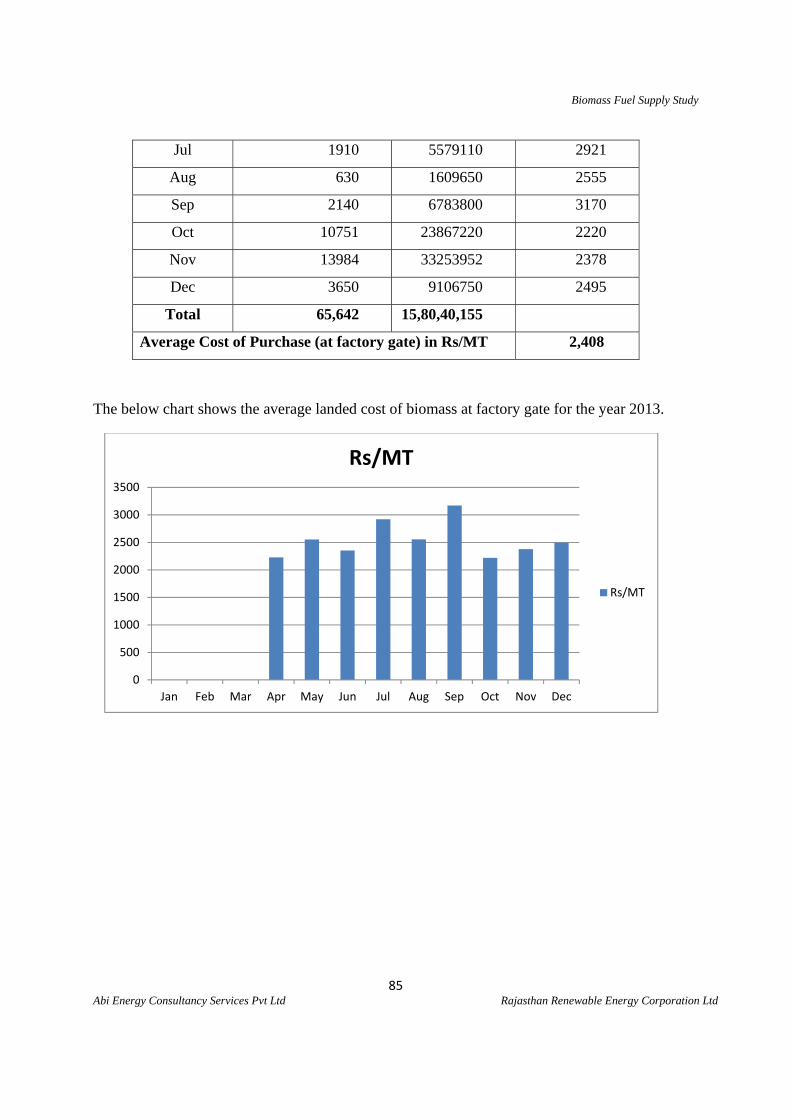
Biomass Fuel Supply Study
85 Abi Energy Consultancy Services Pvt Ltd Rajasthan Renewable Energy Corporation Ltd
Jul 1910 5579110 2921
Aug 630 1609650 2555
Sep 2140 6783800 3170
Oct 10751 23867220 2220
Nov 13984 33253952 2378
Dec 3650 9106750 2495
Total 65,642 15,80,40,155
Average Cost of Purchase (at factory gate) in Rs/MT 2,408
The below chart shows the average landed cost of biomass at factory gate for the year 2013.
0
500
1000
1500
2000
2500
3000
3500
Jan Feb Mar Apr May Jun Jul Aug Sep Oct Nov Dec
Rs/MT
Rs/MT
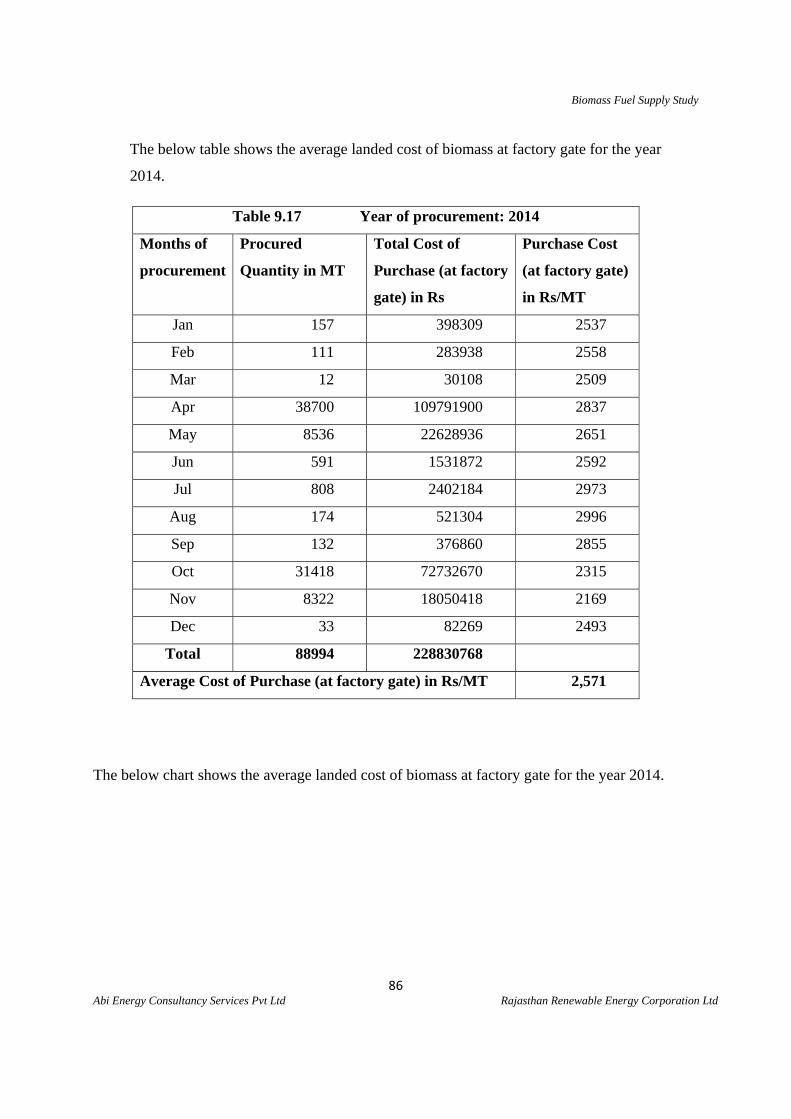
Biomass Fuel Supply Study
86 Abi Energy Consultancy Services Pvt Ltd Rajasthan Renewable Energy Corporation Ltd
The below table shows the average landed cost of biomass at factory gate for the year
2014.
Table 9.17 Year of procurement: 2014
Months of
procurement
Procured
Quantity in MT
Total Cost of
Purchase (at factory
gate) in Rs
Purchase Cost
(at factory gate)
in Rs/MT
Jan 157 398309 2537
Feb 111 283938 2558
Mar 12 30108 2509
Apr 38700 109791900 2837
May 8536 22628936 2651
Jun 591 1531872 2592
Jul 808 2402184 2973
Aug 174 521304 2996
Sep 132 376860 2855
Oct 31418 72732670 2315
Nov 8322 18050418 2169
Dec 33 82269 2493
Total 88994 228830768
Average Cost of Purchase (at factory gate) in Rs/MT 2,571
The below chart shows the average landed cost of biomass at factory gate for the year 2014.
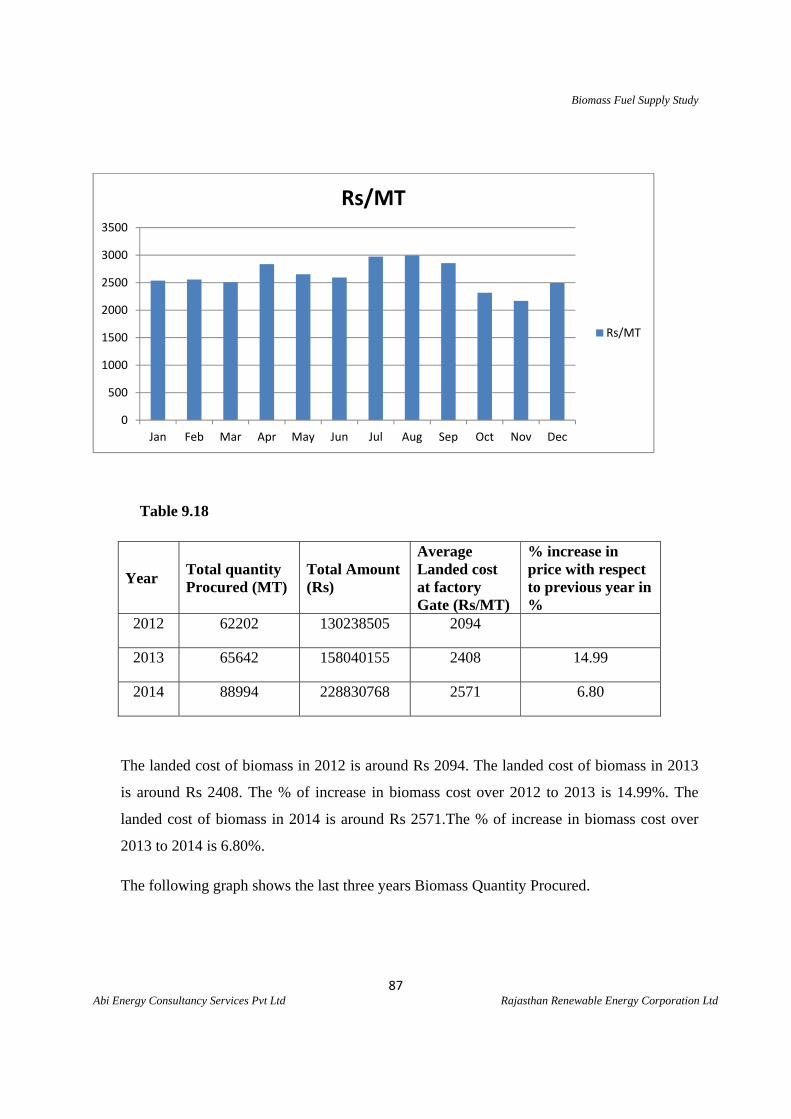
Biomass Fuel Supply Study
87 Abi Energy Consultancy Services Pvt Ltd Rajasthan Renewable Energy Corporation Ltd
Table 9.18
Year Total quantity Procured (MT)
Total Amount (Rs)
Average Landed cost at factory Gate (Rs/MT)
% increase in price with respect to previous year in %
2012 62202 130238505 2094
2013 65642 158040155 2408 14.99
2014 88994 228830768 2571 6.80
The landed cost of biomass in 2012 is around Rs 2094. The landed cost of biomass in 2013
is around Rs 2408. The % of increase in biomass cost over 2012 to 2013 is 14.99%. The
landed cost of biomass in 2014 is around Rs 2571.The % of increase in biomass cost over
2013 to 2014 is 6.80%.
The following graph shows the last three years Biomass Quantity Procured.
0
500
1000
1500
2000
2500
3000
3500
Jan Feb Mar Apr May Jun Jul Aug Sep Oct Nov Dec
Rs/MT
Rs/MT
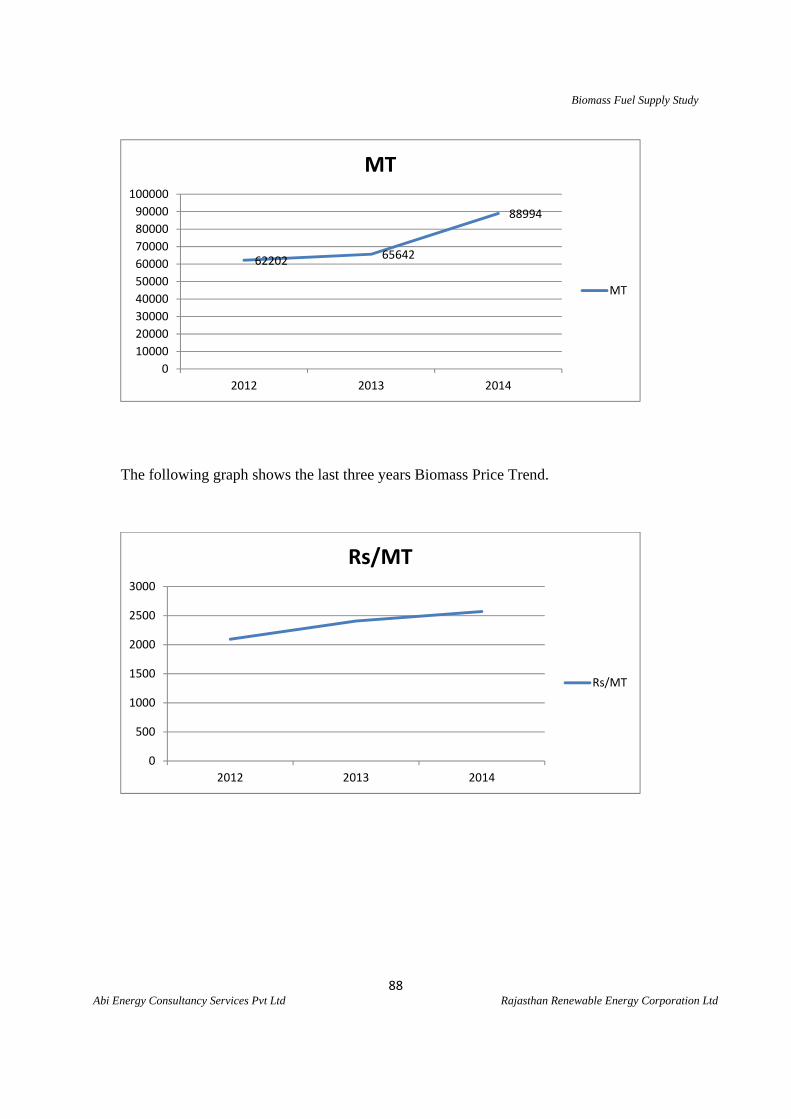
Biomass Fuel Supply Study
88 Abi Energy Consultancy Services Pvt Ltd Rajasthan Renewable Energy Corporation Ltd
The following graph shows the last three years Biomass Price Trend.
62202 65642
88994
0
10000
20000
30000
40000
50000
60000
70000
80000
90000
100000
2012 2013 2014
MT
MT
0
500
1000
1500
2000
2500
3000
2012 2013 2014
Rs/MT
Rs/MT
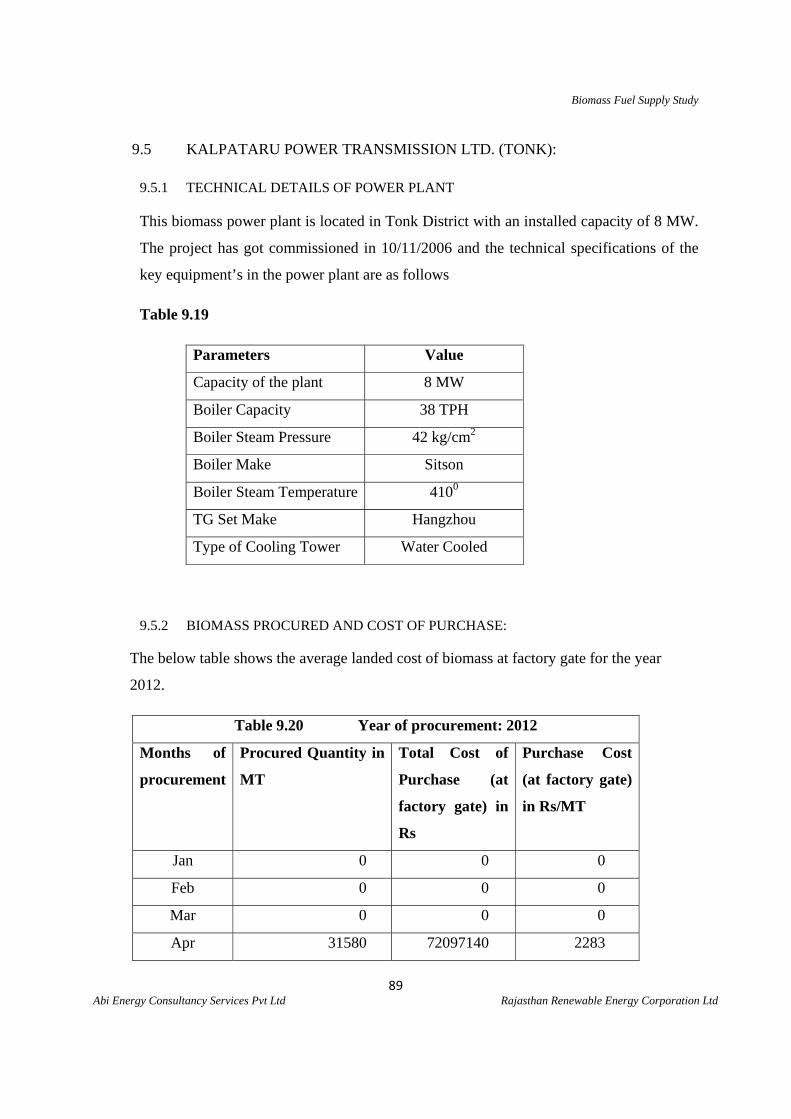
Biomass Fuel Supply Study
89 Abi Energy Consultancy Services Pvt Ltd Rajasthan Renewable Energy Corporation Ltd
9.5 KALPATARU POWER TRANSMISSION LTD. (TONK): 9.5.1 TECHNICAL DETAILS OF POWER PLANT This biomass power plant is located in Tonk District with an installed capacity of 8 MW.
The project has got commissioned in 10/11/2006 and the technical specifications of the
key equipment’s in the power plant are as follows
Table 9.19
Parameters Value
Capacity of the plant 8 MW
Boiler Capacity 38 TPH
Boiler Steam Pressure 42 kg/cm2
Boiler Make Sitson
Boiler Steam Temperature 4100
TG Set Make Hangzhou
Type of Cooling Tower Water Cooled
9.5.2 BIOMASS PROCURED AND COST OF PURCHASE:
The below table shows the average landed cost of biomass at factory gate for the year
2012.
Table 9.20 Year of procurement: 2012
Months of
procurement
Procured Quantity in
MT
Total Cost of
Purchase (at
factory gate) in
Rs
Purchase Cost
(at factory gate)
in Rs/MT
Jan 0 0 0
Feb 0 0 0
Mar 0 0 0
Apr 31580 72097140 2283
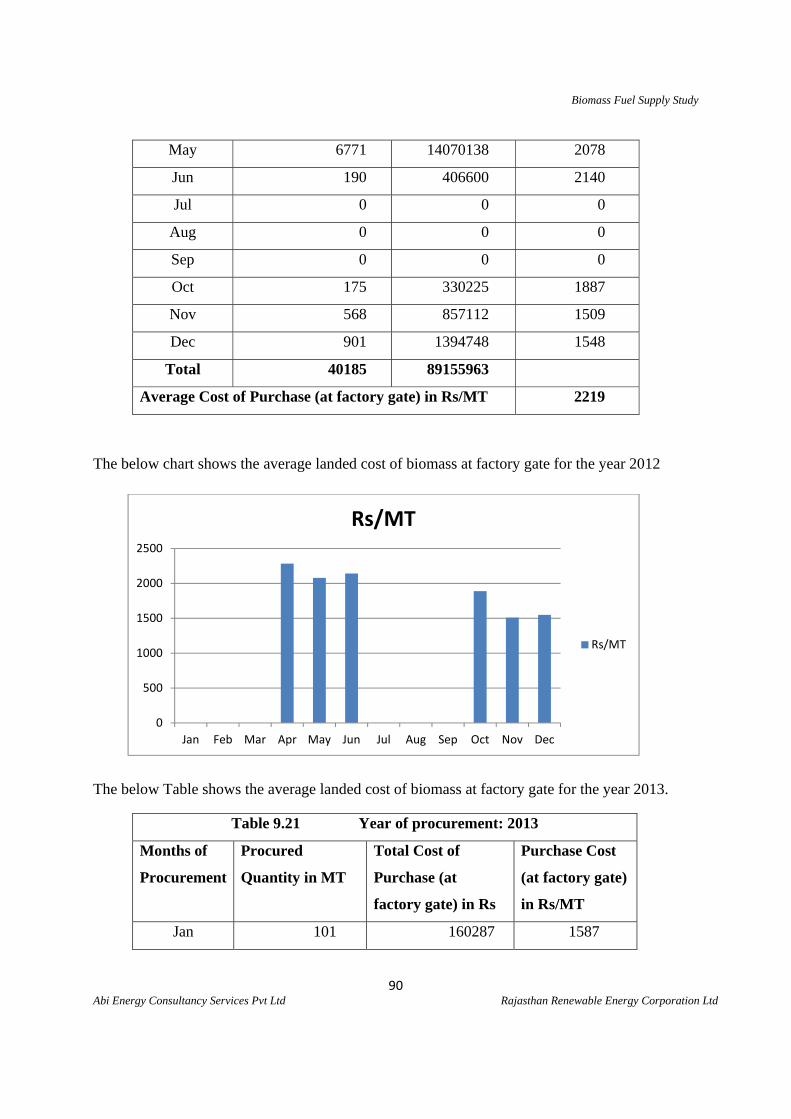
Biomass Fuel Supply Study
90 Abi Energy Consultancy Services Pvt Ltd Rajasthan Renewable Energy Corporation Ltd
May 6771 14070138 2078
Jun 190 406600 2140
Jul 0 0 0
Aug 0 0 0
Sep 0 0 0
Oct 175 330225 1887
Nov 568 857112 1509
Dec 901 1394748 1548
Total 40185 89155963
Average Cost of Purchase (at factory gate) in Rs/MT 2219
The below chart shows the average landed cost of biomass at factory gate for the year 2012
The below Table shows the average landed cost of biomass at factory gate for the year 2013.
Table 9.21 Year of procurement: 2013
Months of
Procurement
Procured
Quantity in MT
Total Cost of
Purchase (at
factory gate) in Rs
Purchase Cost
(at factory gate)
in Rs/MT
Jan 101 160287 1587
0
500
1000
1500
2000
2500
Jan Feb Mar Apr May Jun Jul Aug Sep Oct Nov Dec
Rs/MT
Rs/MT
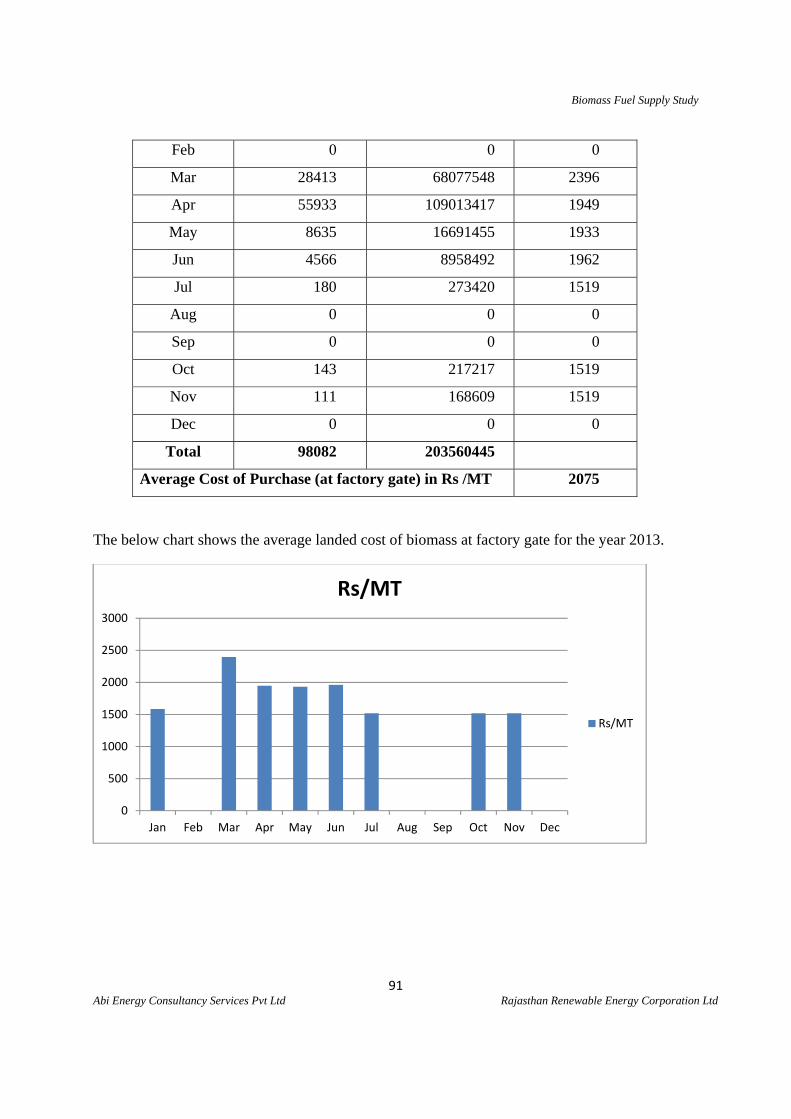
Biomass Fuel Supply Study
91 Abi Energy Consultancy Services Pvt Ltd Rajasthan Renewable Energy Corporation Ltd
Feb 0 0 0
Mar 28413 68077548 2396
Apr 55933 109013417 1949
May 8635 16691455 1933
Jun 4566 8958492 1962
Jul 180 273420 1519
Aug 0 0 0
Sep 0 0 0
Oct 143 217217 1519
Nov 111 168609 1519
Dec 0 0 0
Total 98082 203560445
Average Cost of Purchase (at factory gate) in Rs /MT 2075
The below chart shows the average landed cost of biomass at factory gate for the year 2013.
0
500
1000
1500
2000
2500
3000
Jan Feb Mar Apr May Jun Jul Aug Sep Oct Nov Dec
Rs/MT
Rs/MT
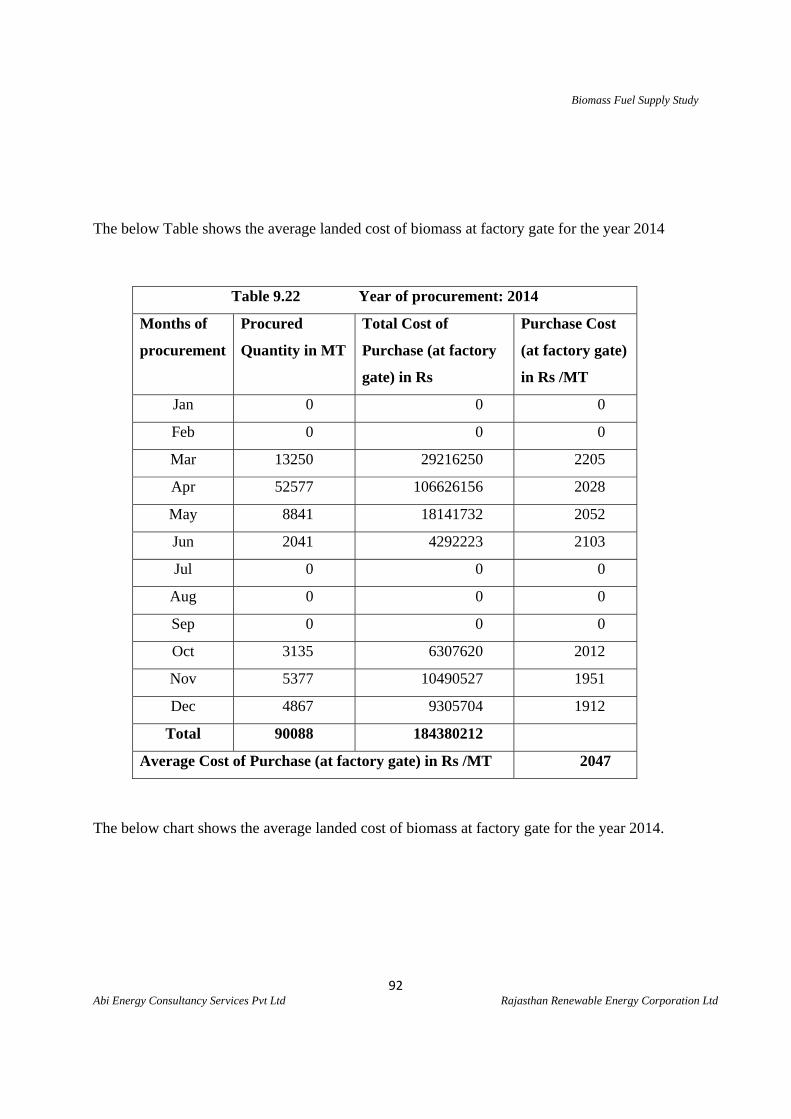
Biomass Fuel Supply Study
92 Abi Energy Consultancy Services Pvt Ltd Rajasthan Renewable Energy Corporation Ltd
The below Table shows the average landed cost of biomass at factory gate for the year 2014
Table 9.22 Year of procurement: 2014
Months of
procurement
Procured
Quantity in MT
Total Cost of
Purchase (at factory
gate) in Rs
Purchase Cost
(at factory gate)
in Rs /MT
Jan 0 0 0
Feb 0 0 0
Mar 13250 29216250 2205
Apr 52577 106626156 2028
May 8841 18141732 2052
Jun 2041 4292223 2103
Jul 0 0 0
Aug 0 0 0
Sep 0 0 0
Oct 3135 6307620 2012
Nov 5377 10490527 1951
Dec 4867 9305704 1912
Total 90088 184380212
Average Cost of Purchase (at factory gate) in Rs /MT 2047
The below chart shows the average landed cost of biomass at factory gate for the year 2014.
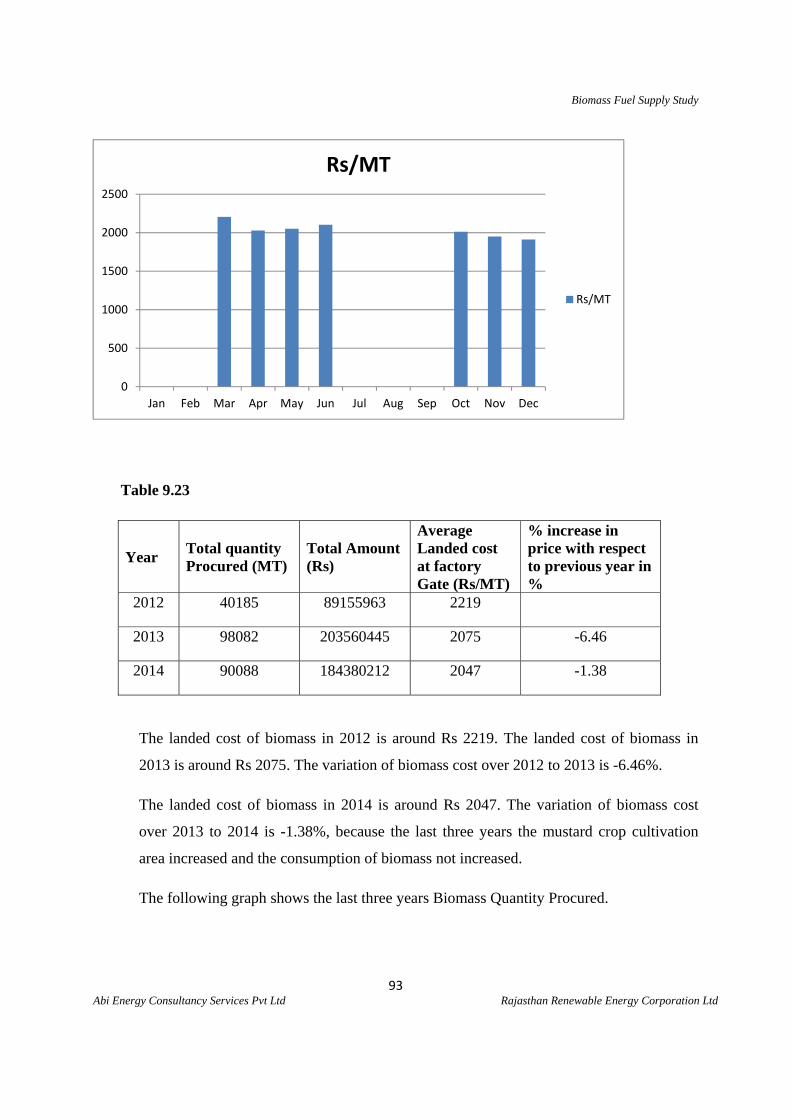
Biomass Fuel Supply Study
93 Abi Energy Consultancy Services Pvt Ltd Rajasthan Renewable Energy Corporation Ltd
Table 9.23
Year Total quantity Procured (MT)
Total Amount (Rs)
Average Landed cost at factory Gate (Rs/MT)
% increase in price with respect to previous year in %
2012 40185 89155963 2219
2013 98082 203560445 2075 -6.46
2014 90088 184380212 2047 -1.38
The landed cost of biomass in 2012 is around Rs 2219. The landed cost of biomass in
2013 is around Rs 2075. The variation of biomass cost over 2012 to 2013 is -6.46%.
The landed cost of biomass in 2014 is around Rs 2047. The variation of biomass cost
over 2013 to 2014 is -1.38%, because the last three years the mustard crop cultivation
area increased and the consumption of biomass not increased.
The following graph shows the last three years Biomass Quantity Procured.
0
500
1000
1500
2000
2500
Jan Feb Mar Apr May Jun Jul Aug Sep Oct Nov Dec
Rs/MT
Rs/MT
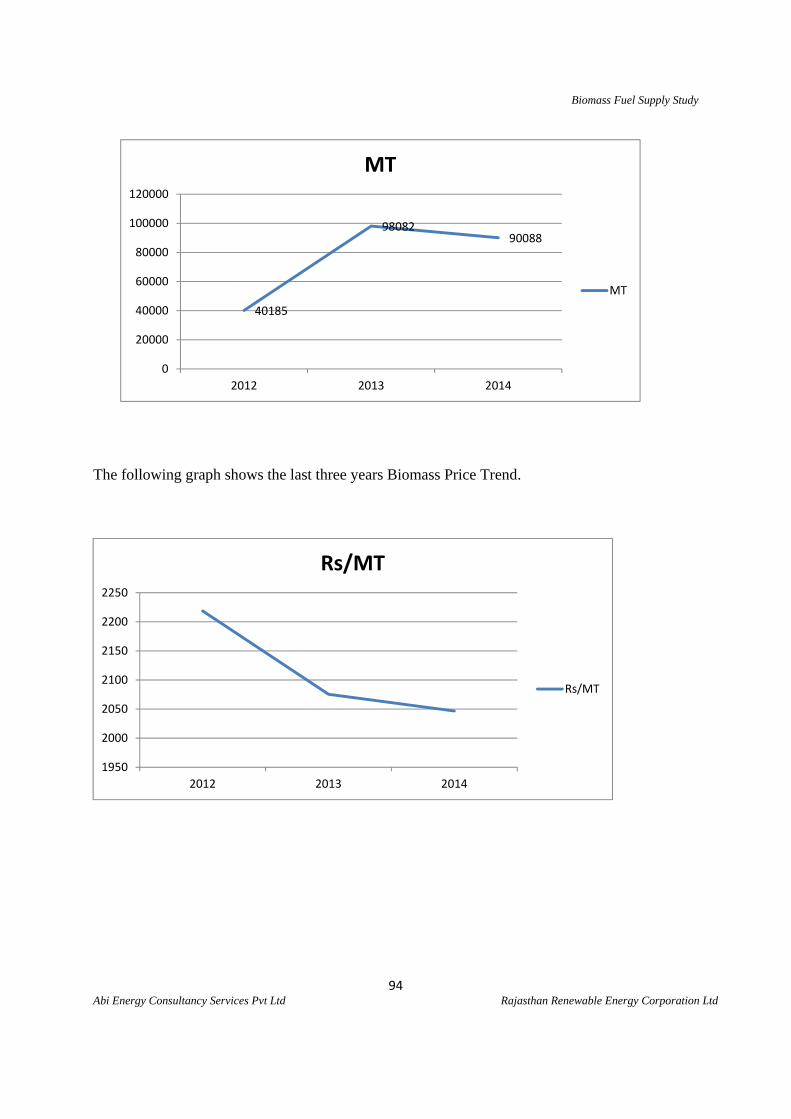
Biomass Fuel Supply Study
94 Abi Energy Consultancy Services Pvt Ltd Rajasthan Renewable Energy Corporation Ltd
The following graph shows the last three years Biomass Price Trend.
40185
9808290088
0
20000
40000
60000
80000
100000
120000
2012 2013 2014
MT
MT
1950
2000
2050
2100
2150
2200
2250
2012 2013 2014
Rs/MT
Rs/MT
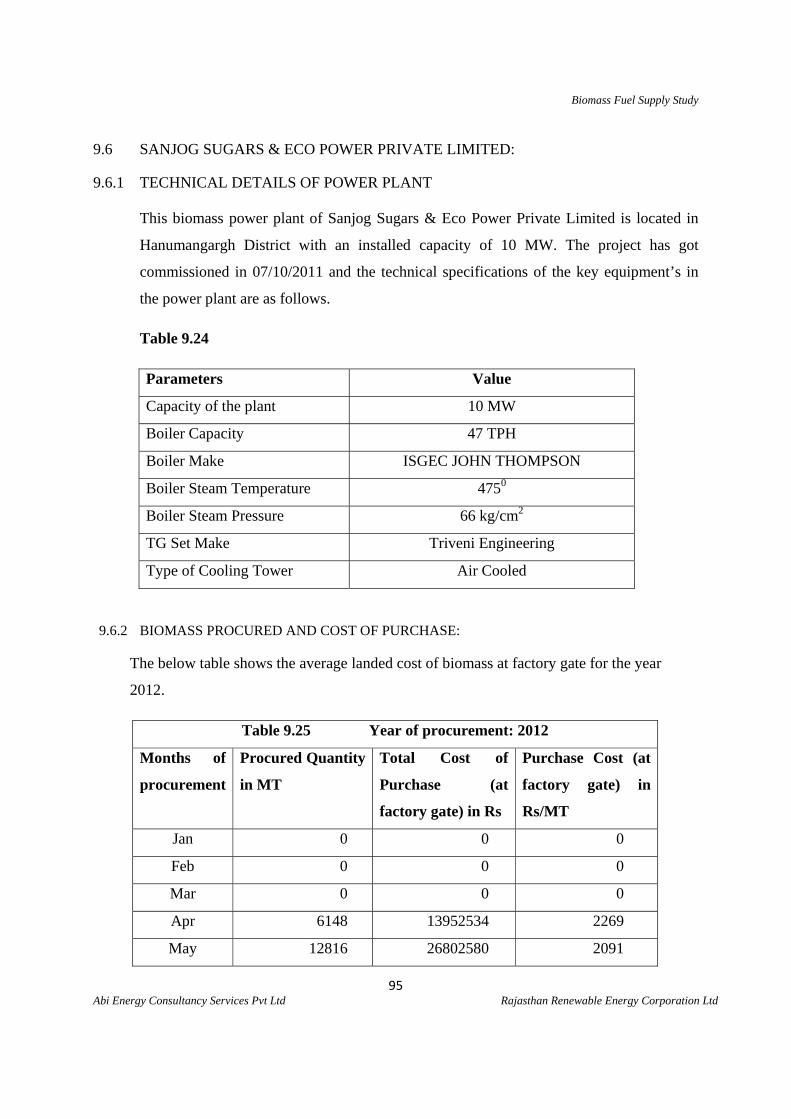
Biomass Fuel Supply Study
95 Abi Energy Consultancy Services Pvt Ltd Rajasthan Renewable Energy Corporation Ltd
9.6 SANJOG SUGARS & ECO POWER PRIVATE LIMITED:
9.6.1 TECHNICAL DETAILS OF POWER PLANT This biomass power plant of Sanjog Sugars & Eco Power Private Limited is located in
Hanumangargh District with an installed capacity of 10 MW. The project has got
commissioned in 07/10/2011 and the technical specifications of the key equipment’s in
the power plant are as follows.
Table 9.24
Parameters Value
Capacity of the plant 10 MW
Boiler Capacity 47 TPH
Boiler Make ISGEC JOHN THOMPSON
Boiler Steam Temperature 4750
Boiler Steam Pressure 66 kg/cm2
TG Set Make Triveni Engineering
Type of Cooling Tower Air Cooled
9.6.2 BIOMASS PROCURED AND COST OF PURCHASE:
The below table shows the average landed cost of biomass at factory gate for the year
2012.
Table 9.25 Year of procurement: 2012
Months of
procurement
Procured Quantity
in MT
Total Cost of
Purchase (at
factory gate) in Rs
Purchase Cost (at
factory gate) in
Rs/MT
Jan 0 0 0
Feb 0 0 0
Mar 0 0 0
Apr 6148 13952534 2269
May 12816 26802580 2091
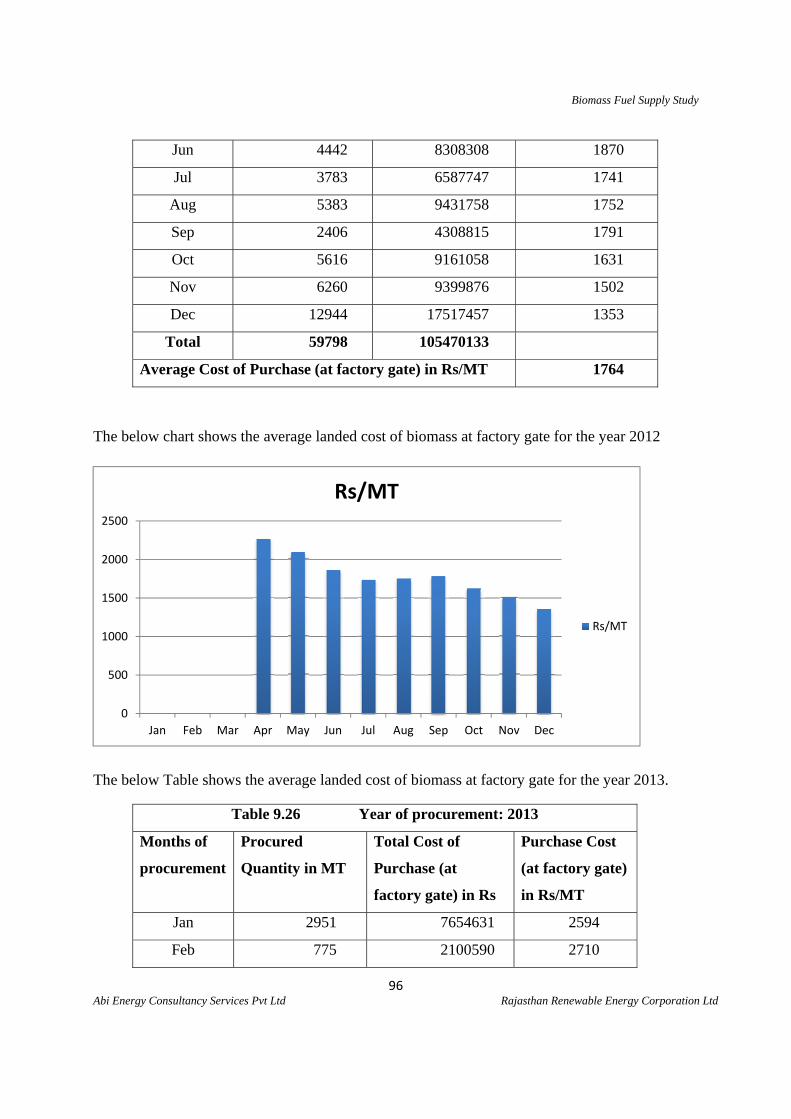
Biomass Fuel Supply Study
96 Abi Energy Consultancy Services Pvt Ltd Rajasthan Renewable Energy Corporation Ltd
Jun 4442 8308308 1870
Jul 3783 6587747 1741
Aug 5383 9431758 1752
Sep 2406 4308815 1791
Oct 5616 9161058 1631
Nov 6260 9399876 1502
Dec 12944 17517457 1353
Total 59798 105470133
Average Cost of Purchase (at factory gate) in Rs/MT 1764
The below chart shows the average landed cost of biomass at factory gate for the year 2012
The below Table shows the average landed cost of biomass at factory gate for the year 2013.
Table 9.26 Year of procurement: 2013
Months of
procurement
Procured
Quantity in MT
Total Cost of
Purchase (at
factory gate) in Rs
Purchase Cost
(at factory gate)
in Rs/MT
Jan 2951 7654631 2594
Feb 775 2100590 2710
0
500
1000
1500
2000
2500
Jan Feb Mar Apr May Jun Jul Aug Sep Oct Nov Dec
Rs/MT
Rs/MT
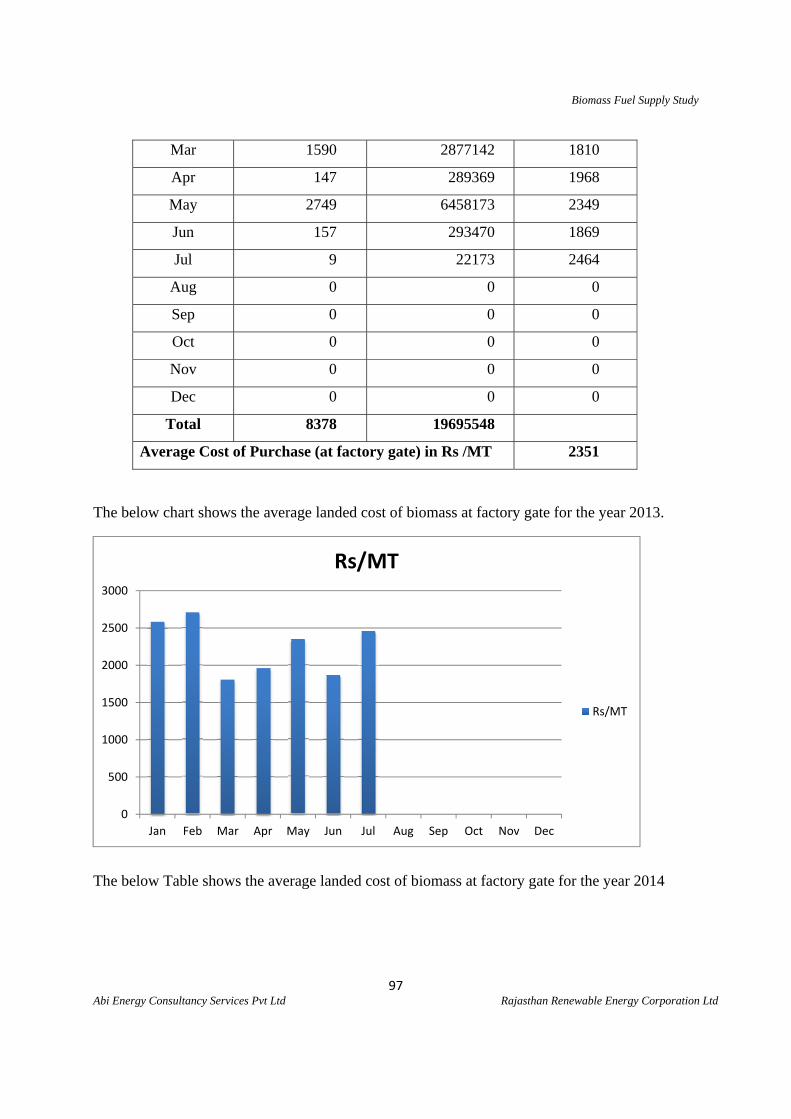
Biomass Fuel Supply Study
97 Abi Energy Consultancy Services Pvt Ltd Rajasthan Renewable Energy Corporation Ltd
Mar 1590 2877142 1810
Apr 147 289369 1968
May 2749 6458173 2349
Jun 157 293470 1869
Jul 9 22173 2464
Aug 0 0 0
Sep 0 0 0
Oct 0 0 0
Nov 0 0 0
Dec 0 0 0
Total 8378 19695548
Average Cost of Purchase (at factory gate) in Rs /MT 2351
The below chart shows the average landed cost of biomass at factory gate for the year 2013.
The below Table shows the average landed cost of biomass at factory gate for the year 2014
0
500
1000
1500
2000
2500
3000
Jan Feb Mar Apr May Jun Jul Aug Sep Oct Nov Dec
Rs/MT
Rs/MT
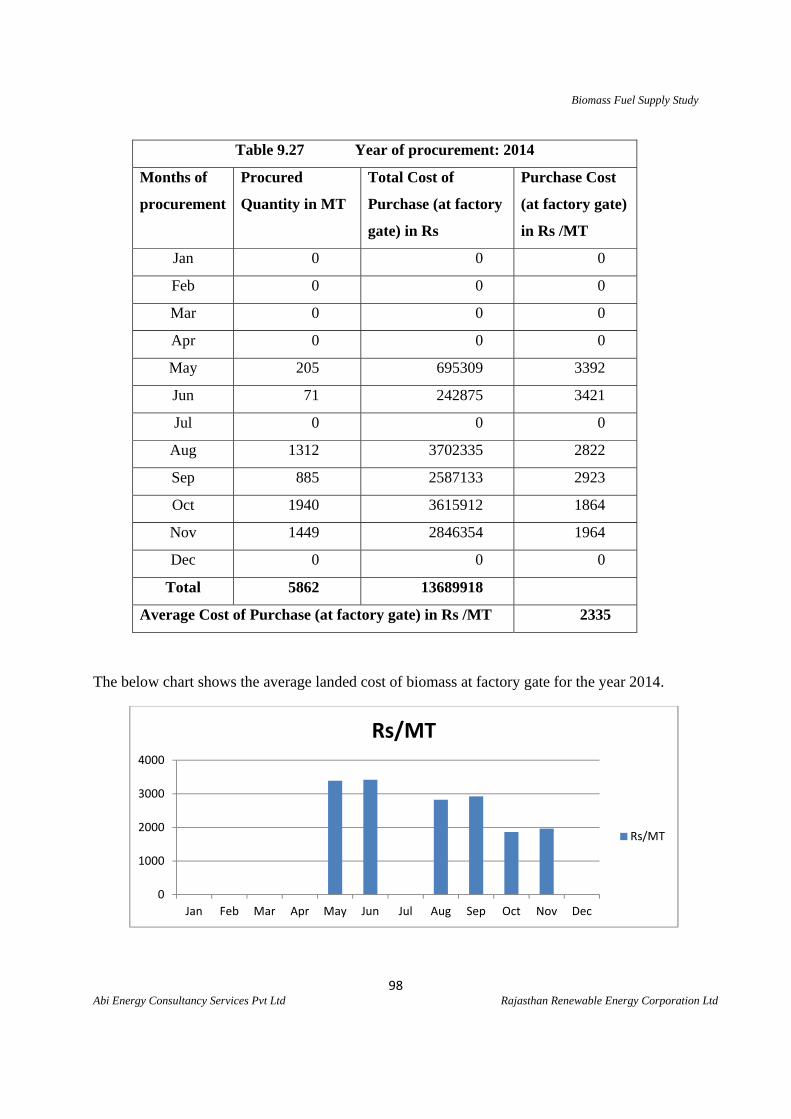
Biomass Fuel Supply Study
98 Abi Energy Consultancy Services Pvt Ltd Rajasthan Renewable Energy Corporation Ltd
Table 9.27 Year of procurement: 2014
Months of
procurement
Procured
Quantity in MT
Total Cost of
Purchase (at factory
gate) in Rs
Purchase Cost
(at factory gate)
in Rs /MT
Jan 0 0 0
Feb 0 0 0
Mar 0 0 0
Apr 0 0 0
May 205 695309 3392
Jun 71 242875 3421
Jul 0 0 0
Aug 1312 3702335 2822
Sep 885 2587133 2923
Oct 1940 3615912 1864
Nov 1449 2846354 1964
Dec 0 0 0
Total 5862 13689918
Average Cost of Purchase (at factory gate) in Rs /MT 2335
The below chart shows the average landed cost of biomass at factory gate for the year 2014.
0
1000
2000
3000
4000
Jan Feb Mar Apr May Jun Jul Aug Sep Oct Nov Dec
Rs/MT
Rs/MT
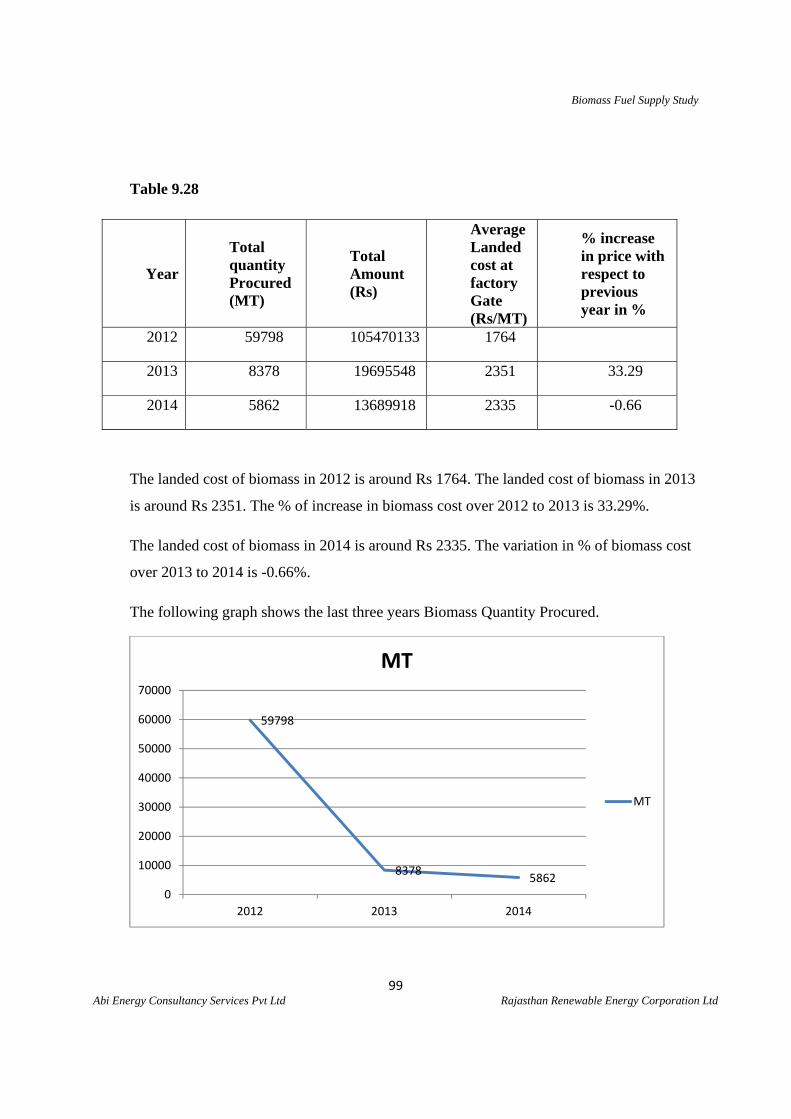
Biomass Fuel Supply Study
99 Abi Energy Consultancy Services Pvt Ltd Rajasthan Renewable Energy Corporation Ltd
Table 9.28
Year
Total quantity Procured (MT)
Total Amount (Rs)
Average Landed cost at factory Gate (Rs/MT)
% increase in price with respect to previous year in %
2012 59798 105470133 1764
2013 8378 19695548 2351 33.29
2014 5862 13689918 2335 -0.66
The landed cost of biomass in 2012 is around Rs 1764. The landed cost of biomass in 2013
is around Rs 2351. The % of increase in biomass cost over 2012 to 2013 is 33.29%.
The landed cost of biomass in 2014 is around Rs 2335. The variation in % of biomass cost
over 2013 to 2014 is -0.66%.
The following graph shows the last three years Biomass Quantity Procured.
59798
83785862
0
10000
20000
30000
40000
50000
60000
70000
2012 2013 2014
MT
MT
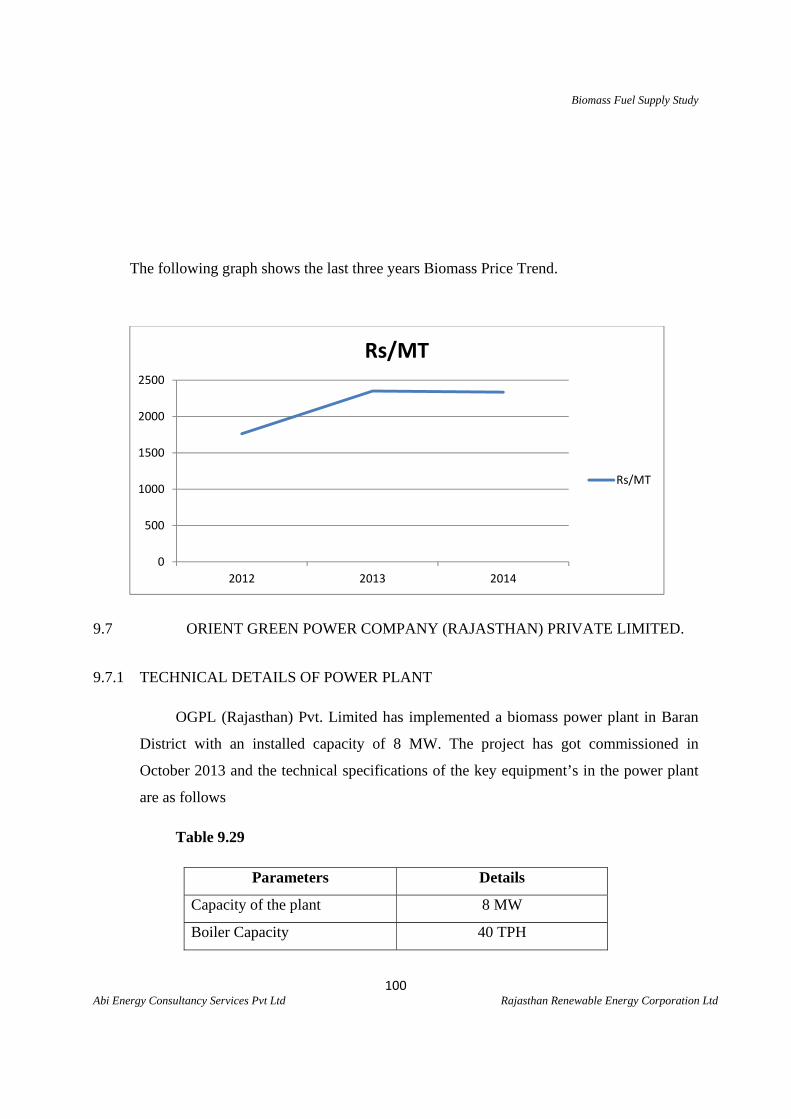
Biomass Fuel Supply Study
100 Abi Energy Consultancy Services Pvt Ltd Rajasthan Renewable Energy Corporation Ltd
The following graph shows the last three years Biomass Price Trend.
9.7 ORIENT GREEN POWER COMPANY (RAJASTHAN) PRIVATE LIMITED.
9.7.1 TECHNICAL DETAILS OF POWER PLANT
OGPL (Rajasthan) Pvt. Limited has implemented a biomass power plant in Baran
District with an installed capacity of 8 MW. The project has got commissioned in
October 2013 and the technical specifications of the key equipment’s in the power plant
are as follows
Table 9.29
Parameters Details
Capacity of the plant 8 MW
Boiler Capacity 40 TPH
0
500
1000
1500
2000
2500
2012 2013 2014
Rs/MT
Rs/MT
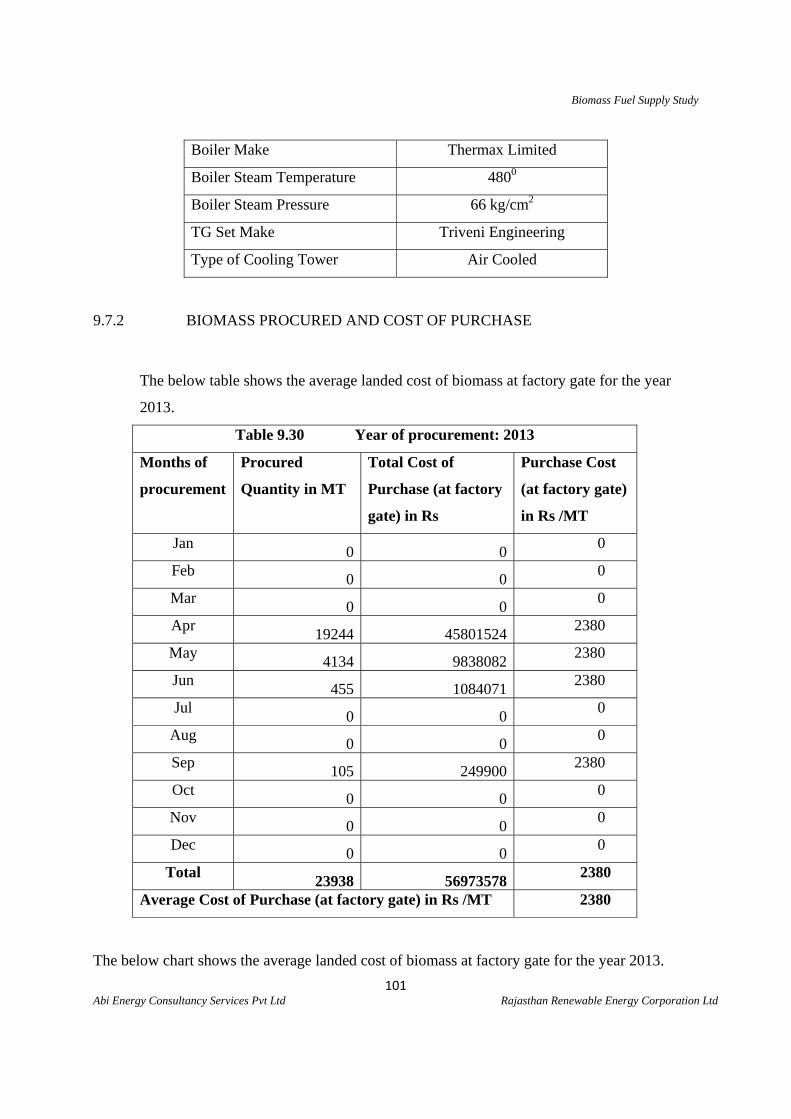
Biomass Fuel Supply Study
101 Abi Energy Consultancy Services Pvt Ltd Rajasthan Renewable Energy Corporation Ltd
Boiler Make Thermax Limited
Boiler Steam Temperature 4800
Boiler Steam Pressure 66 kg/cm2
TG Set Make Triveni Engineering
Type of Cooling Tower Air Cooled
9.7.2 BIOMASS PROCURED AND COST OF PURCHASE
The below table shows the average landed cost of biomass at factory gate for the year
2013.
Table 9.30 Year of procurement: 2013
Months of
procurement
Procured
Quantity in MT
Total Cost of
Purchase (at factory
gate) in Rs
Purchase Cost
(at factory gate)
in Rs /MT
Jan 0 0
0
Feb 0 0
0
Mar 0 0
0
Apr 19244 45801524
2380
May 4134 9838082
2380
Jun 455 1084071
2380
Jul 0 0
0
Aug 0 0
0
Sep 105 249900
2380
Oct 0 0
0
Nov 0 0
0
Dec 0 0
0
Total 23938 56973578
2380
Average Cost of Purchase (at factory gate) in Rs /MT 2380
The below chart shows the average landed cost of biomass at factory gate for the year 2013.
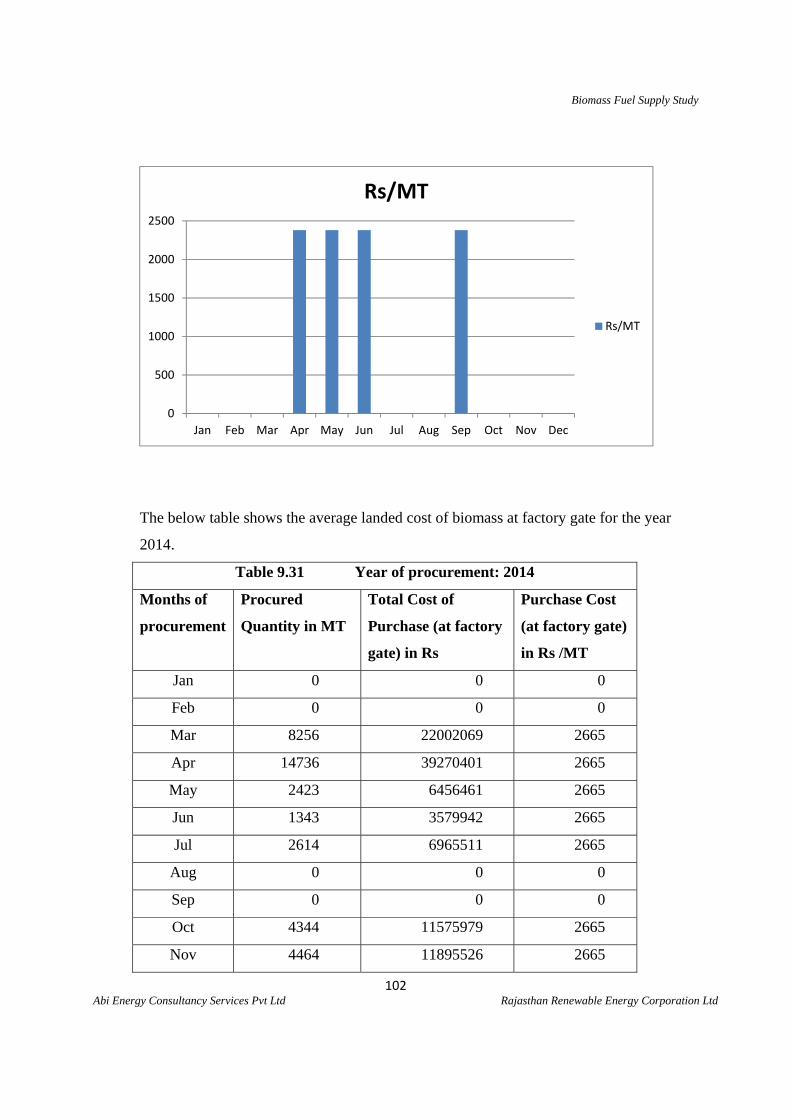
Biomass Fuel Supply Study
102 Abi Energy Consultancy Services Pvt Ltd Rajasthan Renewable Energy Corporation Ltd
The below table shows the average landed cost of biomass at factory gate for the year
2014.
Table 9.31 Year of procurement: 2014
Months of
procurement
Procured
Quantity in MT
Total Cost of
Purchase (at factory
gate) in Rs
Purchase Cost
(at factory gate)
in Rs /MT
Jan 0 0 0
Feb 0 0 0
Mar 8256 22002069 2665
Apr 14736 39270401 2665
May 2423 6456461 2665
Jun 1343 3579942 2665
Jul 2614 6965511 2665
Aug 0 0 0
Sep 0 0 0
Oct 4344 11575979 2665
Nov 4464 11895526 2665
0
500
1000
1500
2000
2500
Jan Feb Mar Apr May Jun Jul Aug Sep Oct Nov Dec
Rs/MT
Rs/MT
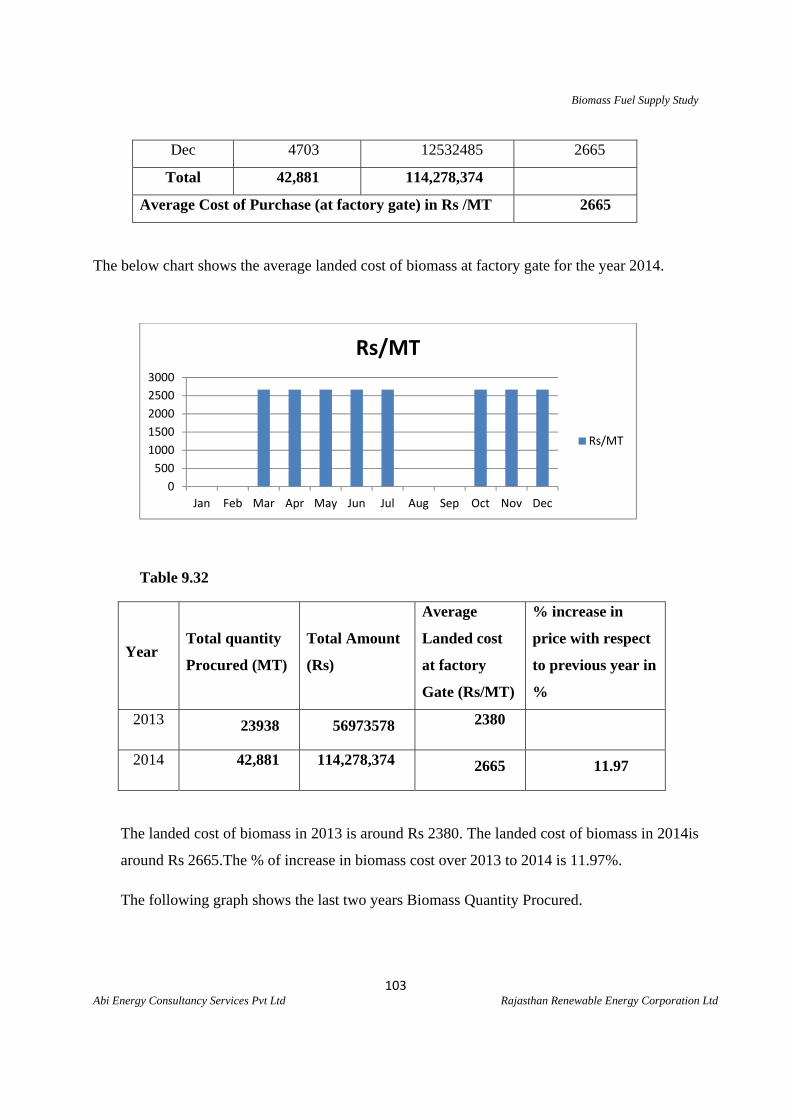
Biomass Fuel Supply Study
103 Abi Energy Consultancy Services Pvt Ltd Rajasthan Renewable Energy Corporation Ltd
Dec 4703 12532485 2665
Total 42,881 114,278,374
Average Cost of Purchase (at factory gate) in Rs /MT 2665
The below chart shows the average landed cost of biomass at factory gate for the year 2014.
Table 9.32
Year Total quantity
Procured (MT)
Total Amount
(Rs)
Average
Landed cost
at factory
Gate (Rs/MT)
% increase in
price with respect
to previous year in
%
2013 23938 56973578 2380
2014 42,881 114,278,374 2665 11.97
The landed cost of biomass in 2013 is around Rs 2380. The landed cost of biomass in 2014is
around Rs 2665.The % of increase in biomass cost over 2013 to 2014 is 11.97%.
The following graph shows the last two years Biomass Quantity Procured.
0
500
1000
1500
2000
2500
3000
Jan Feb Mar Apr May Jun Jul Aug Sep Oct Nov Dec
Rs/MT
Rs/MT
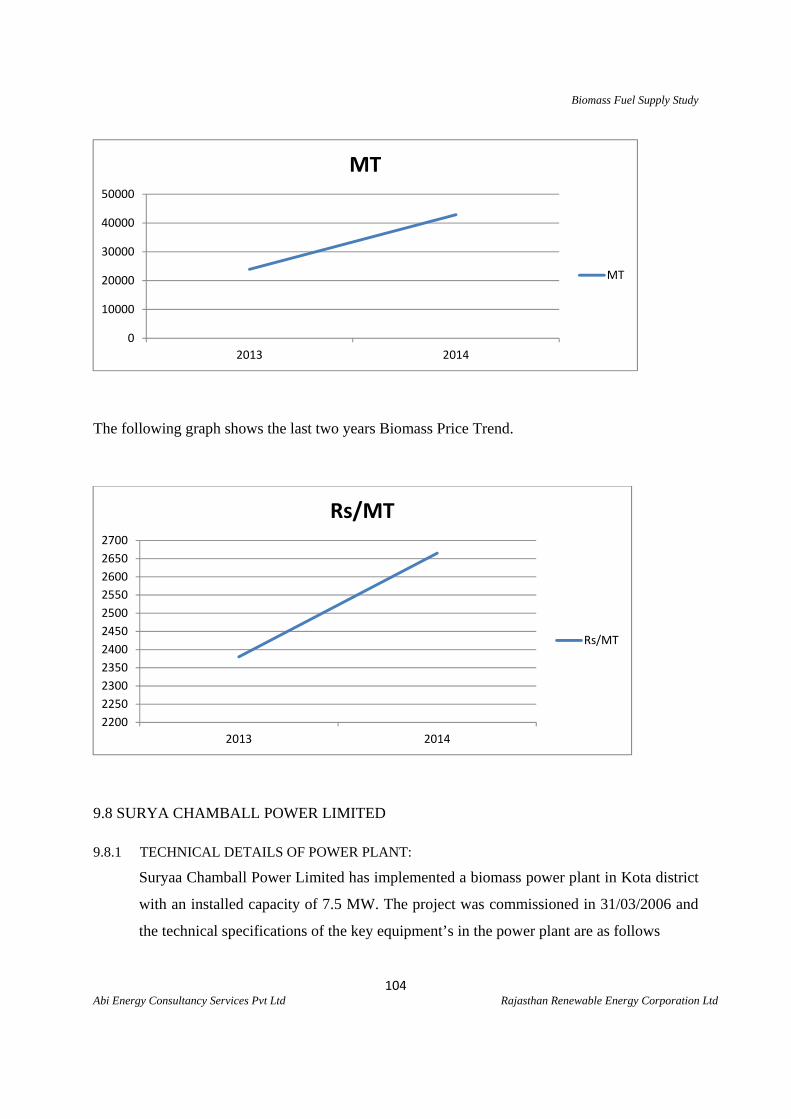
Biomass Fuel Supply Study
104 Abi Energy Consultancy Services Pvt Ltd Rajasthan Renewable Energy Corporation Ltd
The following graph shows the last two years Biomass Price Trend.
9.8 SURYA CHAMBALL POWER LIMITED
9.8.1 TECHNICAL DETAILS OF POWER PLANT:
Suryaa Chamball Power Limited has implemented a biomass power plant in Kota district
with an installed capacity of 7.5 MW. The project was commissioned in 31/03/2006 and
the technical specifications of the key equipment’s in the power plant are as follows
0
10000
20000
30000
40000
50000
2013 2014
MT
MT
2200
2250
2300
2350
2400
2450
2500
2550
2600
2650
2700
2013 2014
Rs/MT
Rs/MT
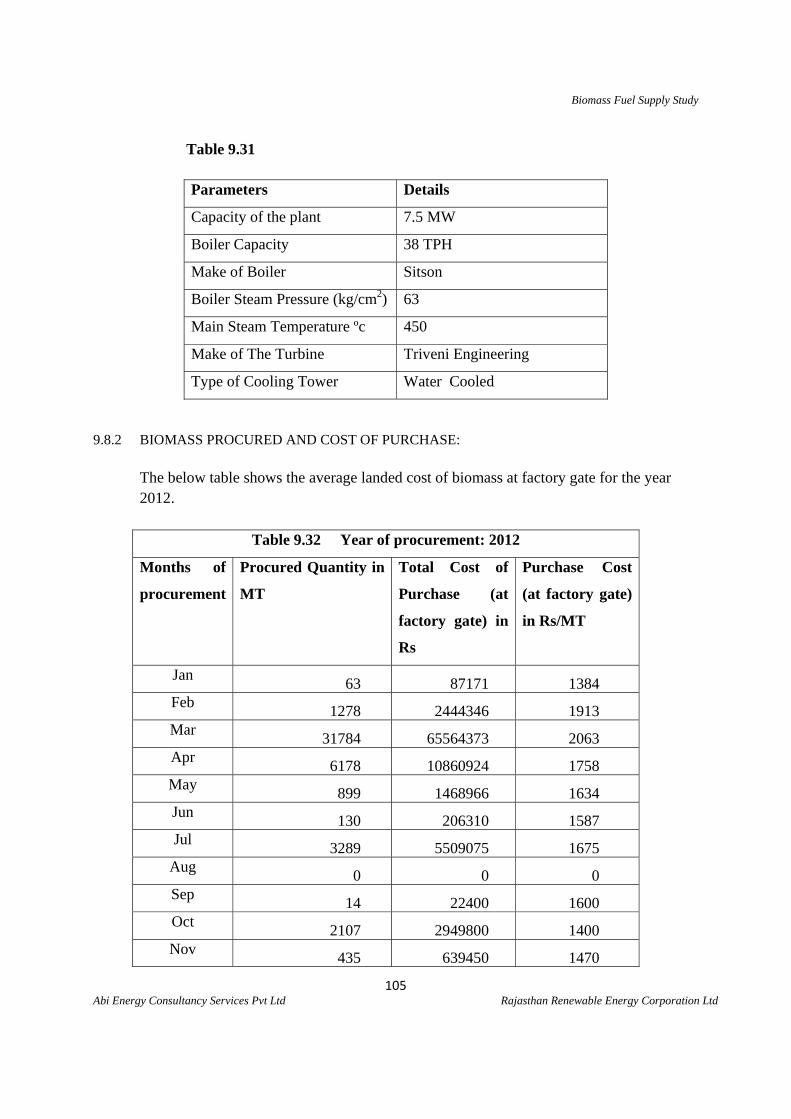
Biomass Fuel Supply Study
105 Abi Energy Consultancy Services Pvt Ltd Rajasthan Renewable Energy Corporation Ltd
Table 9.31
Parameters Details
Capacity of the plant 7.5 MW
Boiler Capacity 38 TPH
Make of Boiler Sitson
Boiler Steam Pressure (kg/cm2) 63
Main Steam Temperature ºc 450
Make of The Turbine Triveni Engineering
Type of Cooling Tower Water Cooled
9.8.2 BIOMASS PROCURED AND COST OF PURCHASE: The below table shows the average landed cost of biomass at factory gate for the year 2012.
Table 9.32 Year of procurement: 2012
Months of
procurement
Procured Quantity in
MT
Total Cost of
Purchase (at
factory gate) in
Rs
Purchase Cost
(at factory gate)
in Rs/MT
Jan 63 87171 1384
Feb 1278 2444346 1913
Mar 31784 65564373 2063
Apr 6178 10860924 1758
May 899 1468966 1634
Jun 130 206310 1587
Jul 3289 5509075 1675
Aug 0 0 0
Sep 14 22400 1600
Oct 2107 2949800 1400
Nov 435 639450 1470
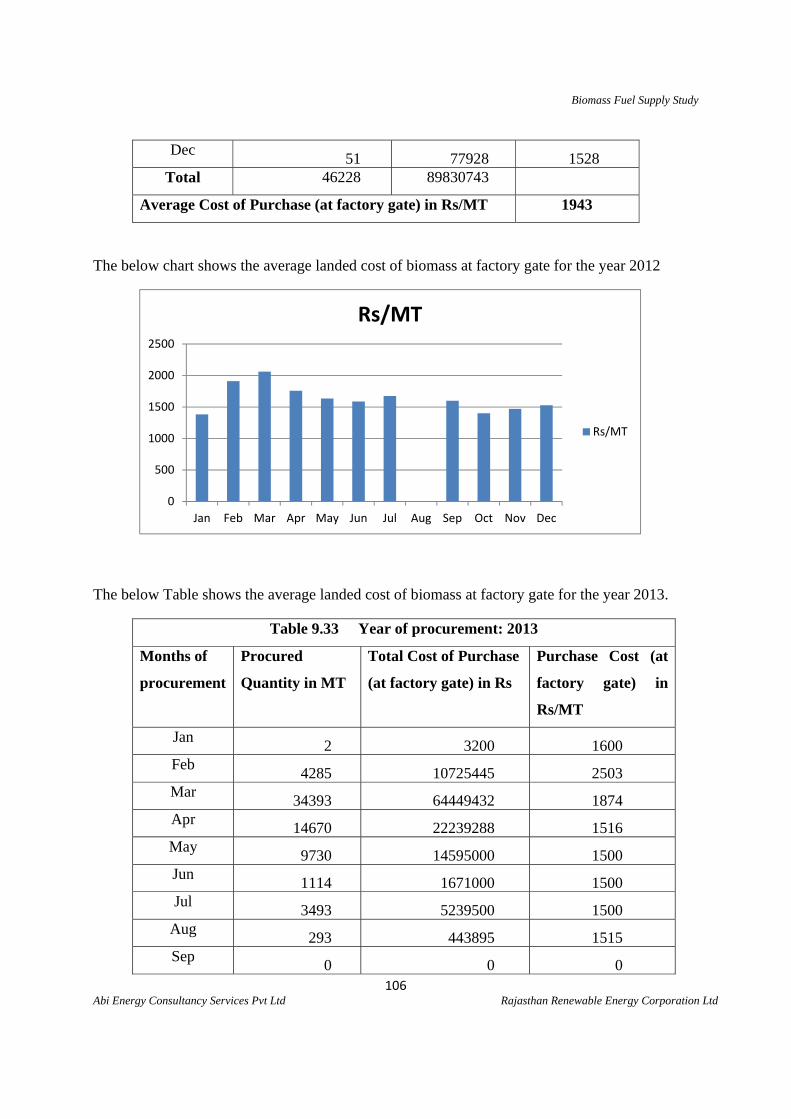
Biomass Fuel Supply Study
106 Abi Energy Consultancy Services Pvt Ltd Rajasthan Renewable Energy Corporation Ltd
Dec 51 77928 1528
Total 46228 89830743
Average Cost of Purchase (at factory gate) in Rs/MT 1943
The below chart shows the average landed cost of biomass at factory gate for the year 2012
The below Table shows the average landed cost of biomass at factory gate for the year 2013.
Table 9.33 Year of procurement: 2013
Months of
procurement
Procured
Quantity in MT
Total Cost of Purchase
(at factory gate) in Rs
Purchase Cost (at
factory gate) in
Rs/MT
Jan 2 3200 1600
Feb 4285 10725445 2503
Mar 34393 64449432 1874
Apr 14670 22239288 1516
May 9730 14595000 1500
Jun 1114 1671000 1500
Jul 3493 5239500 1500
Aug 293 443895 1515
Sep 0 0 0
0
500
1000
1500
2000
2500
Jan Feb Mar Apr May Jun Jul Aug Sep Oct Nov Dec
Rs/MT
Rs/MT
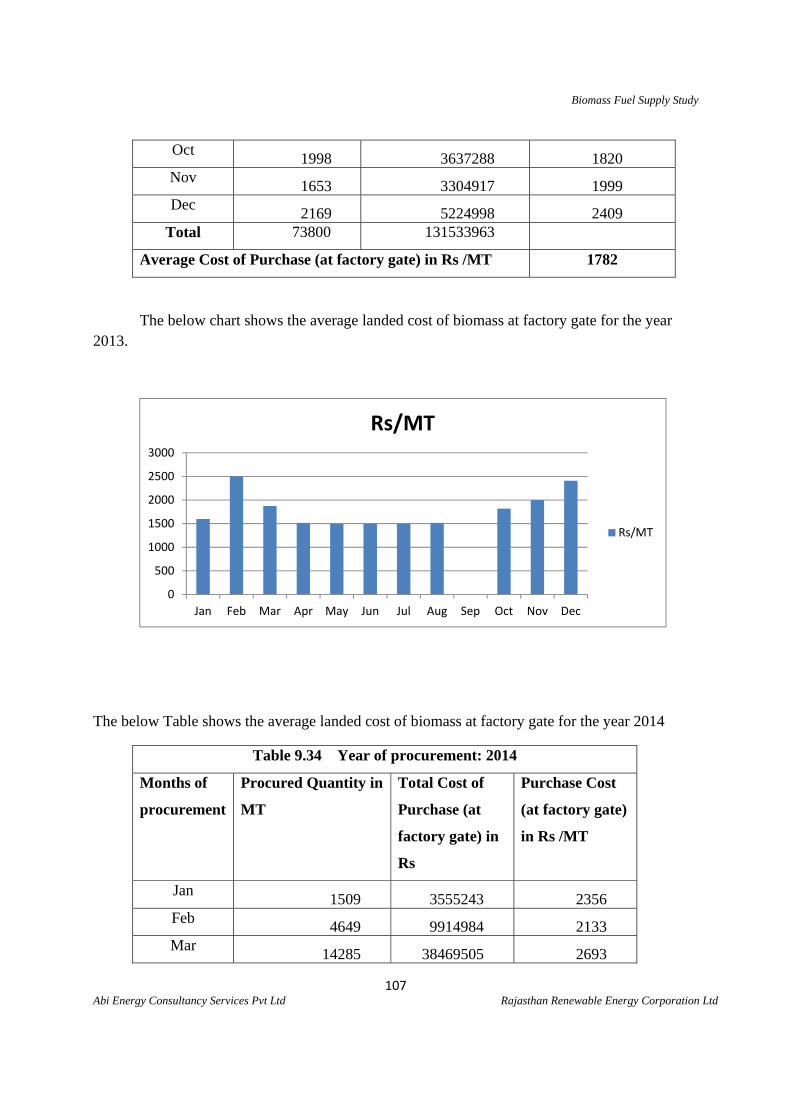
Biomass Fuel Supply Study
107 Abi Energy Consultancy Services Pvt Ltd Rajasthan Renewable Energy Corporation Ltd
Oct 1998 3637288 1820
Nov 1653 3304917 1999
Dec 2169 5224998 2409
Total 73800 131533963
Average Cost of Purchase (at factory gate) in Rs /MT 1782
The below chart shows the average landed cost of biomass at factory gate for the year 2013.
The below Table shows the average landed cost of biomass at factory gate for the year 2014
Table 9.34 Year of procurement: 2014
Months of
procurement
Procured Quantity in
MT
Total Cost of
Purchase (at
factory gate) in
Rs
Purchase Cost
(at factory gate)
in Rs /MT
Jan 1509 3555243 2356
Feb 4649 9914984 2133
Mar 14285 38469505 2693
0
500
1000
1500
2000
2500
3000
Jan Feb Mar Apr May Jun Jul Aug Sep Oct Nov Dec
Rs/MT
Rs/MT
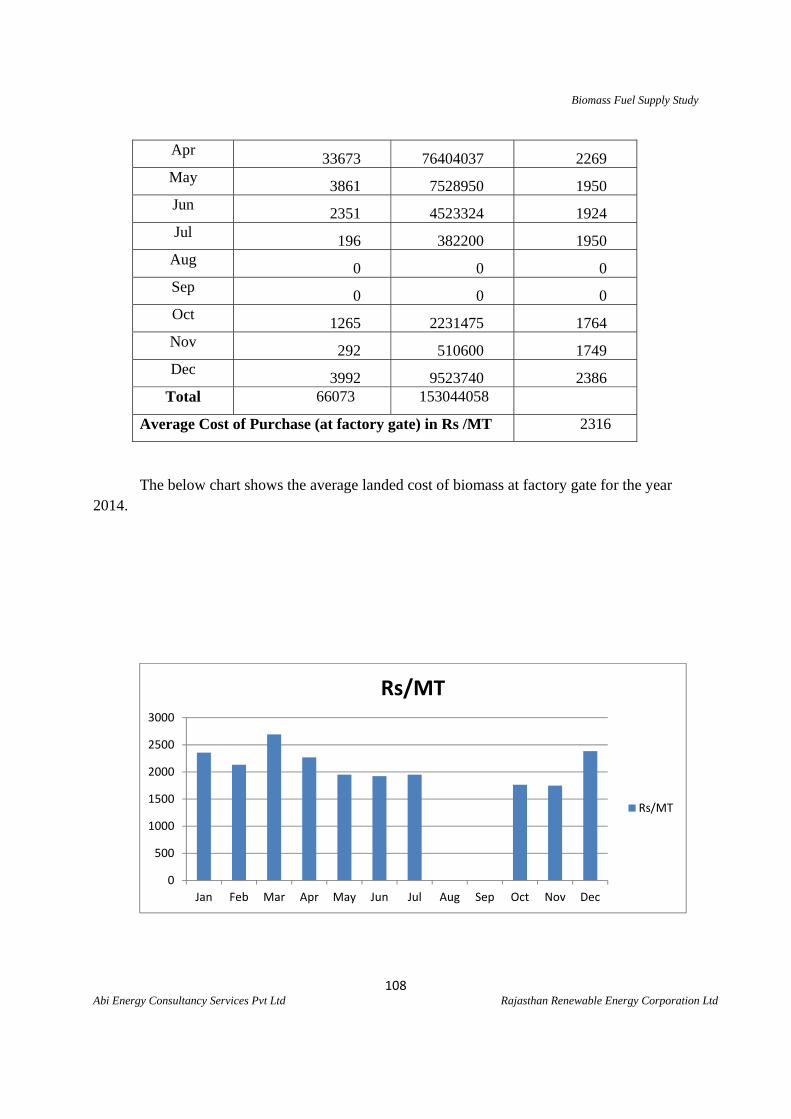
Biomass Fuel Supply Study
108 Abi Energy Consultancy Services Pvt Ltd Rajasthan Renewable Energy Corporation Ltd
Apr 33673 76404037 2269
May 3861 7528950 1950
Jun 2351 4523324 1924
Jul 196 382200 1950
Aug 0 0 0
Sep 0 0 0
Oct 1265 2231475 1764
Nov 292 510600 1749
Dec 3992 9523740 2386
Total 66073 153044058
Average Cost of Purchase (at factory gate) in Rs /MT 2316
The below chart shows the average landed cost of biomass at factory gate for the year 2014.
0
500
1000
1500
2000
2500
3000
Jan Feb Mar Apr May Jun Jul Aug Sep Oct Nov Dec
Rs/MT
Rs/MT
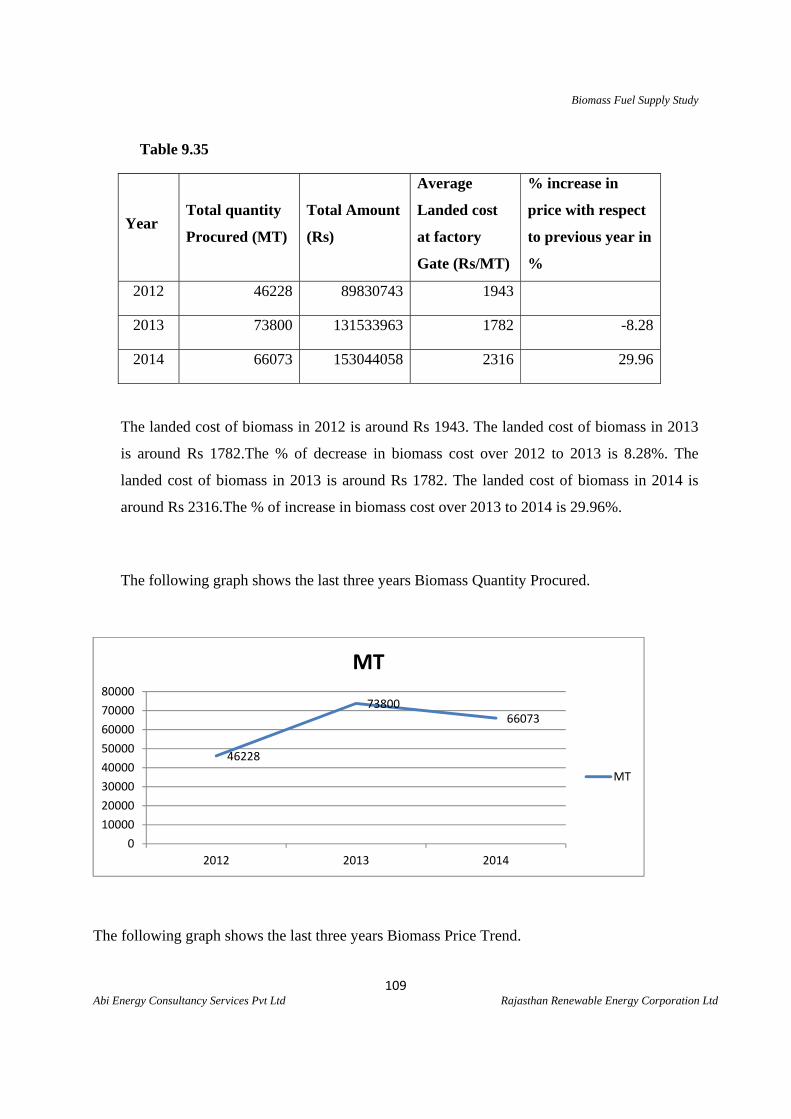
Biomass Fuel Supply Study
109 Abi Energy Consultancy Services Pvt Ltd Rajasthan Renewable Energy Corporation Ltd
Table 9.35
Year Total quantity
Procured (MT)
Total Amount
(Rs)
Average
Landed cost
at factory
Gate (Rs/MT)
% increase in
price with respect
to previous year in
%
2012 46228 89830743 1943
2013 73800 131533963 1782 -8.28
2014 66073 153044058 2316 29.96
The landed cost of biomass in 2012 is around Rs 1943. The landed cost of biomass in 2013
is around Rs 1782.The % of decrease in biomass cost over 2012 to 2013 is 8.28%. The
landed cost of biomass in 2013 is around Rs 1782. The landed cost of biomass in 2014 is
around Rs 2316.The % of increase in biomass cost over 2013 to 2014 is 29.96%.
The following graph shows the last three years Biomass Quantity Procured.
The following graph shows the last three years Biomass Price Trend.
46228
7380066073
0
10000
20000
30000
40000
50000
60000
70000
80000
2012 2013 2014
MT
MT
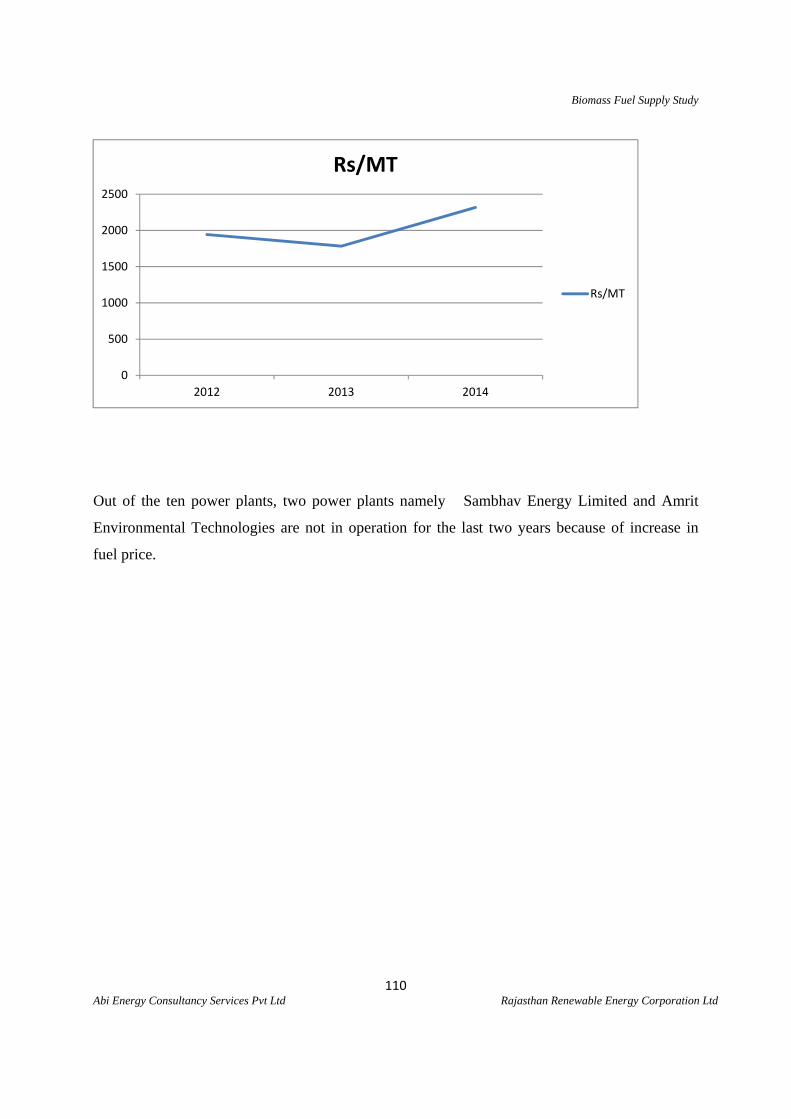
Biomass Fuel Supply Study
110 Abi Energy Consultancy Services Pvt Ltd Rajasthan Renewable Energy Corporation Ltd
Out of the ten power plants, two power plants namely Sambhav Energy Limited and Amrit
Environmental Technologies are not in operation for the last two years because of increase in
fuel price.
0
500
1000
1500
2000
2500
2012 2013 2014
Rs/MT
Rs/MT
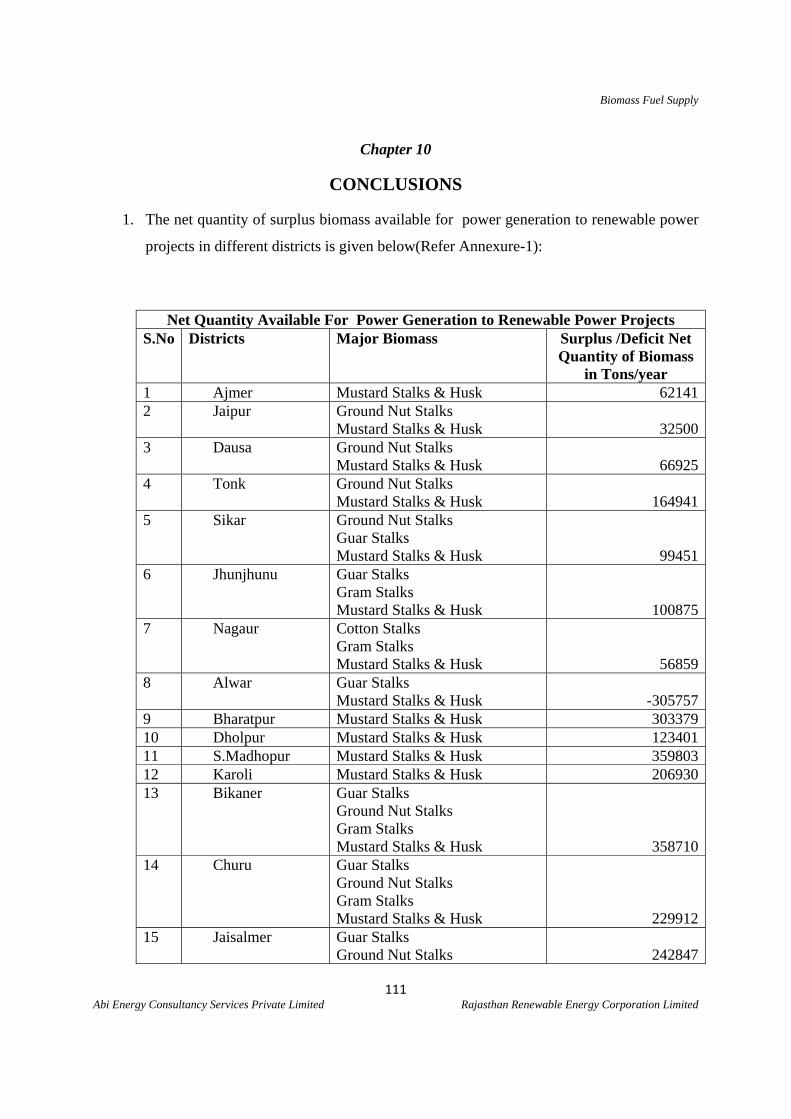
Biomass Fuel Supply
111 Abi Energy Consultancy Services Private Limited Rajasthan Renewable Energy Corporation Limited
Chapter 10
CONCLUSIONS
1. The net quantity of surplus biomass available for power generation to renewable power
projects in different districts is given below(Refer Annexure-1):
Net Quantity Available For Power Generation to Renewable Power Projects S.No Districts Major Biomass Surplus /Deficit Net
Quantity of Biomass in Tons/year
1 Ajmer Mustard Stalks & Husk 621412 Jaipur Ground Nut Stalks
Mustard Stalks & Husk 325003 Dausa Ground Nut Stalks
Mustard Stalks & Husk 669254 Tonk Ground Nut Stalks
Mustard Stalks & Husk 1649415 Sikar Ground Nut Stalks
Guar Stalks Mustard Stalks & Husk 99451
6 Jhunjhunu Guar Stalks Gram Stalks Mustard Stalks & Husk 100875
7 Nagaur Cotton Stalks Gram Stalks Mustard Stalks & Husk 56859
8 Alwar Guar Stalks Mustard Stalks & Husk -305757
9 Bharatpur Mustard Stalks & Husk 30337910 Dholpur Mustard Stalks & Husk 12340111 S.Madhopur Mustard Stalks & Husk 35980312 Karoli Mustard Stalks & Husk 20693013 Bikaner Guar Stalks
Ground Nut Stalks Gram Stalks Mustard Stalks & Husk 358710
14 Churu Guar Stalks Ground Nut Stalks Gram Stalks Mustard Stalks & Husk 229912
15 Jaisalmer Guar Stalks Ground Nut Stalks 242847
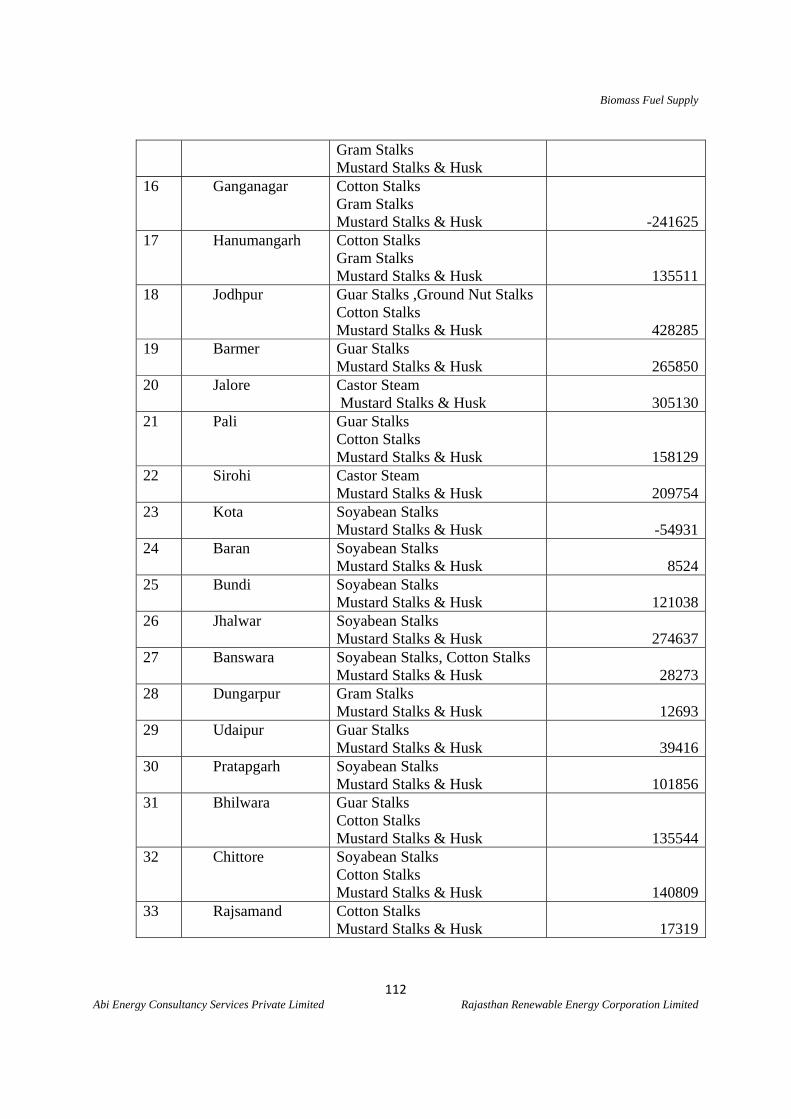
Biomass Fuel Supply
112 Abi Energy Consultancy Services Private Limited Rajasthan Renewable Energy Corporation Limited
Gram Stalks Mustard Stalks & Husk
16 Ganganagar Cotton Stalks Gram Stalks Mustard Stalks & Husk -241625
17 Hanumangarh Cotton Stalks Gram Stalks Mustard Stalks & Husk 135511
18 Jodhpur Guar Stalks ,Ground Nut Stalks Cotton Stalks Mustard Stalks & Husk 428285
19 Barmer Guar Stalks Mustard Stalks & Husk 265850
20 Jalore Castor Steam Mustard Stalks & Husk 305130
21 Pali Guar Stalks Cotton Stalks Mustard Stalks & Husk 158129
22 Sirohi Castor Steam Mustard Stalks & Husk 209754
23 Kota Soyabean Stalks Mustard Stalks & Husk -54931
24 Baran Soyabean Stalks Mustard Stalks & Husk 8524
25 Bundi Soyabean Stalks Mustard Stalks & Husk 121038
26 Jhalwar Soyabean Stalks Mustard Stalks & Husk 274637
27 Banswara Soyabean Stalks, Cotton Stalks Mustard Stalks & Husk 28273
28 Dungarpur Gram Stalks Mustard Stalks & Husk 12693
29 Udaipur Guar Stalks Mustard Stalks & Husk 39416
30 Pratapgarh Soyabean Stalks Mustard Stalks & Husk 101856
31 Bhilwara Guar Stalks Cotton Stalks Mustard Stalks & Husk 135544
32 Chittore Soyabean Stalks Cotton Stalks Mustard Stalks & Husk 140809
33 Rajsamand Cotton Stalks Mustard Stalks & Husk 17319
Biomass Fuel Supply
113 Abi Energy Consultancy Services Private Limited Rajasthan Renewable Energy Corporation Limited
ustard is an important crop in this study area, particularly in the Tonk, Jaipur, Alwar,
Bharatpur, S.Madhopur and Ganganagar Districts. The Rajasthan State has an overall
cultivated area of 25, 52,034 Ha under Mustard cultivation.
1. It was found that, on an average about 92.50 % of the biomass generated from
agricultural activity goes for consumption in local for fodder, manure, fuel for thermal
energy consuming industries, biomass power plants, brick kiln, etc, and about only
7.50% is available for other activities or exported to nearby states. The major portion of
wheat stalks, barley stalks, paddy hay, jowar stalks , bajra stalks, maize stalks are
consumed by animal as fodder and these biomass should not used as a fuel per the
Policy 2010, so we considered 100% for consumption . The above was prepared based
on fairly established data and hence can be counted as near realistic. Surplus Biomass
available from agricultural activity is around 41, 89,129 tons / year.
2. Out of the total geographical area of 3, 42, 23,900 hectares in study area, 93,68, 947
hectares were identified as wasteland out which Prosopis Juliflora is grown in 58, 59,
381 hectares of cultivable waste land and fallow land in Rajasthan.
3. The major biomass consumed by the power plants are Mustard Stalks & Husk, Gaur
Stalks, Prosopis Juliflora Wood and Cotton Stalks.
4. Based on the fuel mix of running biomass power plants
a. The average cost of biomass in the year 2012 is Rs 2030.
b. The average cost of biomass in the year 2013 is Rs 2211.
c. The average cost of biomass in the year 2014 is Rs 2481.
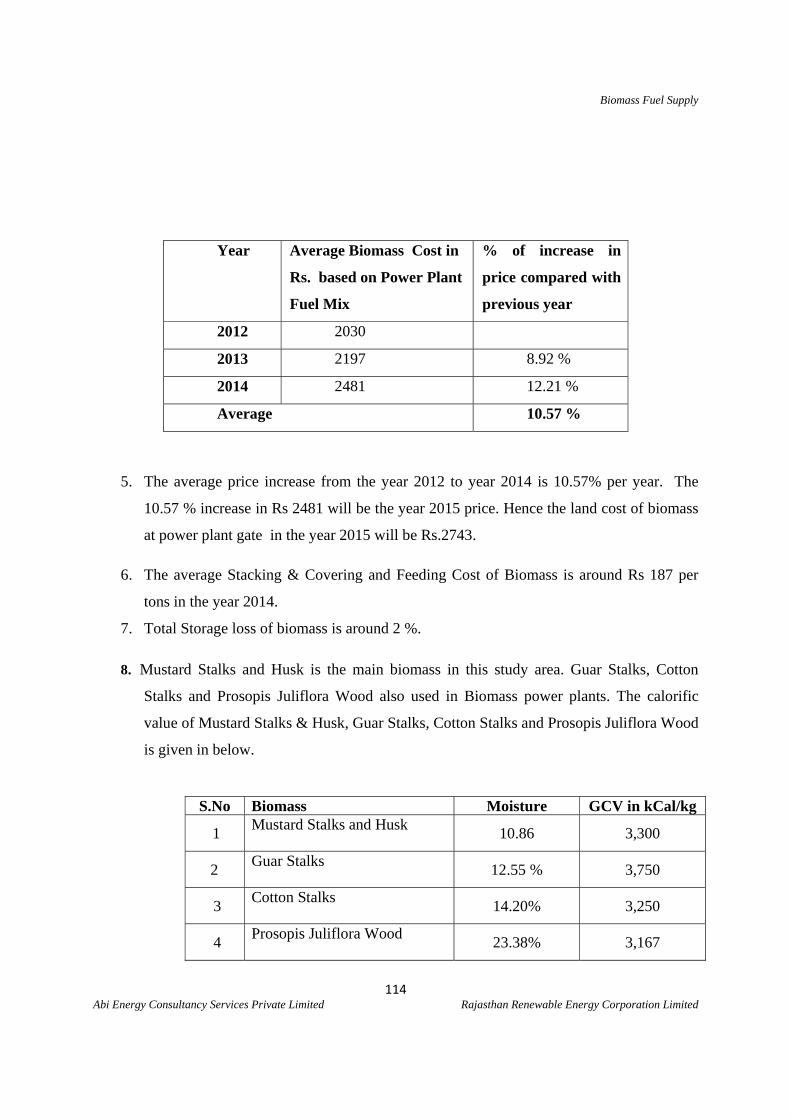
Biomass Fuel Supply
114 Abi Energy Consultancy Services Private Limited Rajasthan Renewable Energy Corporation Limited
5. The average price increase from the year 2012 to year 2014 is 10.57% per year. The
10.57 % increase in Rs 2481 will be the year 2015 price. Hence the land cost of biomass
at power plant gate in the year 2015 will be Rs.2743.
6. The average Stacking & Covering and Feeding Cost of Biomass is around Rs 187 per
tons in the year 2014.
7. Total Storage loss of biomass is around 2 %.
8. Mustard Stalks and Husk is the main biomass in this study area. Guar Stalks, Cotton
Stalks and Prosopis Juliflora Wood also used in Biomass power plants. The calorific
value of Mustard Stalks & Husk, Guar Stalks, Cotton Stalks and Prosopis Juliflora Wood
is given in below.
Year Average Biomass Cost in
Rs. based on Power Plant
Fuel Mix
% of increase in
price compared with
previous year
2012 2030
2013 2197 8.92 %
2014 2481 12.21 %
Average 10.57 %
S.No Biomass Moisture GCV in kCal/kg
1 Mustard Stalks and Husk
10.86 3,300
2 Guar Stalks
12.55 % 3,750
3 Cotton Stalks
14.20% 3,250
4 Prosopis Juliflora Wood
23.38% 3,167


![J I...RAJASTHAN RAJYA VIDYUT PRASARAN NIGAM LIMITED [Corporate Identity Number (CIN):L40109RJ2000SGC016485] Qffice ofthe Accounts Officer (Admn.-Stores) Regd.Office:VidyutBhawan,JyotiNagar,jaipur-302005](https://img.pdfslide.net/doc/110x75/5e70bd074237b16d8d15bd3d/j-i-rajasthan-rajya-vidyut-prasaran-nigam-limited-corporate-identity-number.jpg)


![~,~r...rajasthan rajya vidyut prasaran nigam ltd. [corporate identity number (cin):u40109rj2000sgc016485] regd. office vidyut bhawan, janpath, jyoti nagar, jaipur 302005](https://img.pdfslide.net/doc/110x75/5e7e78836c89324f3a79cff8/r-rajasthan-rajya-vidyut-prasaran-nigam-ltd-corporate-identity-number-cinu40109rj2000sgc016485.jpg)