Embed Size (px)
Citation preview
DOCTORAL THESIS IN CHEMICAL ENGINEERING STOCKHOLM, SWEDEN 2014
BIOMASS GASIFICATION IN ABFB: TAR MITIGATION VERA NEMANOVA
KTH ROYAL INSTITUTE OF TECHNOLOGY SCHOOL OF CHEMICAL SCIENCE AND ENGINEERING
Biomass Gasification in ABFB: Tar Mitigation VERA NEMANOVA TRITA-CHE Report 2014:35 ISSN 1654-1081 ISBN 978-91-7595-257-4 Akademisk avhandling som med tillstånd av Kungliga Tekniska högskolan i Stockholm framlägges till offentlig granskning för avläggande av teknologie doktorsexamen, måndagen den 3 november 2014 klockan 10:00 i Kollegiesalen, Brinellvägen 8, Röda Korsets högskola, KTH Campus, Stockholm. © Vera Nemanova 2014 Tryck: Universitetsservice US AB

Ïîñâÿùàåòñÿ ìîåé ñåìüå

i
ABSTRACT
Biomass gasification may be an attractive alternative for meeting future energy demand. Although gasification is a mature technology, it has yet to be fully commercialised due to tar formation. This study focuses on the tar mitigation in gas produced in an atmospheric bubbling fluidised bed (ABFB) gasification system.
Previous studies indicated significant tar variability along the system. In this work the experimental procedure has been improved for reliable results and better understanding of tar variability in the producer gas. After having introduced a new sample point for tar analysis to the system, experimental results indicated tar reduction in the gasifier, probably due to continuous accumulation of char and ash in the bed, as well as in the ceramic filter owing to thermal and catalytic effects.
Iron-based materials, provided by Höganäs AB, were applied in a secondary catalytic bed reactor for tar decomposition in the producer gas. It was found that tar concentration depends on catalytic and gasification temperatures and catalyst material. When changing the gasification temperature from 850 °C to 800 °C the conditions in the producer gas also changed from reductive to oxidative, transforming the initial metallic state of catalyst into its oxidised form. It may be concluded that the catalysts in their metallic states in general exhibit a better tar cracking capacity than their corresponding oxides.
Due to the low reactivity of petroleum coke, an alternative may be to convert it in combination with other fuels such as biomass. Co-gasification of petroleum coke and biomass was studied in this work. Biomass ash in the blends was found to have a catalytic effect on the reactivity of petroleum coke during co-gasification. Furthermore, this synergetic effect between biomass and petcoke was observed in the kinetics data.
Keywords: ash; biomass; char; gasification; iron-based materials; petcoke; tar

ii
iii
SAMMANFATTNING
Förgasning av biomassa kan bli ett attraktivt alternativ för att möta framtida efterfrågan på energi. Även om förgasning är en mogen teknik, har den ännu inte kommersialiserats helt på grund av tjärbildning. Den aktuella studien fokuserar på att reducera tjära i gas som produceras i ett förgasningssystem med en atmosfärisk bubblande fluidiserad bädd (ABFB).
Tidigare studier visade stor tjärvariabilitet i förgasningssystemet. Detta arbete har förbättrat den experimentella proceduren för tillförlitligare resultat, och ökat förståelsen för tjärvariabilitet i produktgasen. Efter att ha lagt till en ny mätpunkt för tjäranalys till systemet kunde minskad tjära i förgasaren vid experiment påvisas, förmodligen på grund av kontinuerlig ansamling av kol och aska i bädden, liksom i det keramiska filtret på grund av termiska och katalytiska effekter.
Järnbaserat material från Höganäs AB användes i en sekundär reaktor med katalytisk bädd för tjärnedbrytning i produktgasen. Det visade sig att koncentrationen av tjära berodde på katalys och förgasningstemperaturer samt katalysatormaterial. Vid sänkning av förgasningstemperaturen från 850 °C till 800 °C ändrades också villkoren i produktgasen från reducerande till oxidativa, och omvandlade katalysatorns initialt metalliska tillstånd till dess oxiderade form. Det kan konstateras att katalysatorerna i sina metalliska tillstånd i allmänhet uppvisade bättre tjärnedbrytning kapacitet än deras motsvarande oxider.
På grund av den låga reaktiviteten av petroleumkoks kan ett alternativ vara att omvandla den i kombination med andra bränslen såsom biomassa. Co-förgasning av petroleumkoks och biomassa studerades i detta arbete. Aska från biomassa i blandningarna visade sig ha en katalytisk effekt på reaktiviteten av petroleumkoks vid samtidig förgasning. Dessutom observerades denna synergieffekt mellan biomassa och petroleumkoks genom de kinetiska beräkningarna.

iv
v
ÂÂÅÄÅÍÈÅ
Ãàçèôèêàöèÿ ðрàñòèòåëüíîãî ñûðрüÿ (áèîìàññû), êàê äîñòóïíîãî è äåøåâîãî àëüòåðрíàòèâíîãî èñòî÷íèêà ýэíåðрãèè âçàìåí ïîñòîÿííî äîðрîæàþюùèõ ïðрèðрîäíûõ èñêîïàåìûõ èñòî÷íèêîâ ýэíåðрãèè, â ïîñëåäíåå âðрåìÿ âûçûâàåò îñîáûé èíòåðрåñ. Íåñìîòðрÿ íà òî, ÷òî ãàçèôèêàöèÿ ÿâëÿåòñÿ ñòàðрîé òåõíîëîãèåé, îíà äî ñèõ ïîðр íå â ïîëíîé ìåðрå êîììåðрöèàëèçèðрîâàíà. Îäíà èç ñàìûõ âàæíûõ ïðрîáëåì â ãàçèôèêàöèè áèîìàññû - îáðрàçîâàíèå ñìîë. Äàííàÿ èññëåäîâàòåëüñêàÿ ðрàáîòà ïîñâÿùåíà óäàëåíèþю ñìîë â ãàçå, ïîëó÷åííîãî â ïðрîöåññå ãàçèôèêàöèè áèîìàññû â ãàçîãåíåðрàòîðрå ñ êèïÿùèì ñëîåì.
 íàó÷íîé ðрàáîòå ýэêñïåðрèìåíòàëüíàÿ ïðрîöåäóðрà áûëà óñîâåðрøåíñòâîâàíà ñ öåëüþю ïîëó÷åíèÿ áîëåå äîñòîâåðрíûõ ðрåçóëüòàòîâ è èçó÷åíèÿ èçìåí÷èâîñòè êîíöåíòðрàöèè ñìîë â ãàçå. Ïîñëå ââåäåíèÿ íîâîé òî÷êè âûáîðрêè äëÿ ñáîðрà è àíàëèçà ñìîë, ýэêñïåðрèìåíòû ïîêàçàëè ïåðрâîíà÷àëüíîå ñíèæåíèå ñìîë â ãàçîãåíåðрàòîðрå, âåðрîÿòíî, ñâÿçàííîå ñ íåïðрåðрûâíûì îáðрàçîâàíèåì óãëÿ è çîëû â ðрåàêòîðрå. Ñíèæåíèå êîíöåíòðрàöèè ñìîë äàëåå áûëî çàìå÷åíî â êåðрàìè÷åñêîì ôèëüòðрå, â ðрåçóëüòàòå ïðрîòåêàíèÿ òåðрìè÷åñêèõ è êàòàëèòè÷åñêèõ ðрåàêöèé.
Òàêæå â äàííîé ðрàáîòå áûëè èññëåäîâàíû êàòàëèçàòîðрû íà îñíîâå æåëåçà äëÿ ðрàñùåïëåíèÿ ñìîë â ãàçå. Áûëî îáíàðрóæåíî, ÷òî êîíöåíòðрàöèÿ ñìîë íàïðрÿìóþю çàâèñèëà îò êàòàëèòè÷åñêîé è ãàçèôèêàöèîííîé òåìïåðрàòóðрàõ, à òàêæå ìàòåðрèàëà êàòàëèçàòîðрà. Ïðрè èçìåíåíèè òåìïåðрàòóðрû ãàçèôèêàöèè îò 850 °Ñ äî 800 °Ñ ñðрåäà â ãàçå èçìåíèëàñü ñ âîññòàíîâèòåëüíîé íà îêèñëèòåëüíóþю, ïðрåâðрàùàÿ ïåðрâîíà÷àëüíîå ìåòàëëè÷åñêîå ñîñòîÿíèå æåëåçà â ðрàçëè÷íûå åãî îêñèäû.  öåëîì, æåëåçíûå êàòàëèçàòîðрû â èõ ìåòàëëè÷åñêèõ ñîñòîÿíèÿõ äåìîíñòðрèðрîâàëè ëó÷øóþю ñïîñîáíîñòü ðрàñùåïëåíèÿ ñìîë, ÷åì èõ ñîîòâåòñòâóþюùèå îêñèäû.
Ñîâìåñòíàÿ ãàçèôèêàöèè íåôòÿíîãî êîêñà è áèîìàññû òàêæå áûëà ðрàññìîòðрåíà.  ñâÿçè ñ íèçêîé ðрåàêöèîííîé ñïîñîáíîñòüþю êîêñà, åãî ïåðрåðрàáîòêà âîçìîæíà â êîìáèíàöèè ñ äðрóãèìè âèäàìè òîïëèâà, òàêèõ êàê áèîìàññà. Çîëà â áèîìàññå, áûëî óñòàíîâëåíî, êàòàëèòè÷åñêè âëèÿëà íà ðрåàêöèîííóþю ñïîñîáíîñòü íåôòÿíîãî êîêñà â ïðрîöåññå ãàçèôèêàöèè. Êðрîìå òîãî, ñèíåðрãåòè÷åñêèé ýэôôåêò ìåæäó áèîìàññîé è íåôòÿíîé êîêñîì áûë ïîäòâåðрæäåí â êèíåòè÷åñêèõ ðрàñ÷åòàõ.

vi
vii
LIST of PAPERS
This thesis is based on the work contained in the following papers, referred to in the text by Roman numerals, and appended at the end of the thesis.
I. Tar variability in the producer gas in a BFB gasification system V. Nemanova and K. Engvall Accepted for publishing in Energy & Fuels
II. Biomass gasification in an atmospheric fluidised bed: Tar reduction with experimental iron-based granules from Höganäs AB, Sweden V. Nemanova, T. Nordgreen, K. Engvall and K. Sjöström Catalysis Today 176 (2011) 253-257
III. Iron-based materials as tar depletion catalysts in biomass gasification: Dependency on oxygen potential T. Nordgreen, V. Nemanova, K. Engvall and K. Sjöström Fuel 95 (2012) 71-78
IV. Co-gasification of petroleum coke and biomass V. Nemanova, A. Abedini, T. Liliedahl and K. Engvall Fuel 117 (2014) 870-875
Contribution to the papers. The author of this thesis took active part in all stages of the work presented in papers I-IV and had the main responsibility in the experimental planning, implementation and evaluation of the results. The author had the main responsibility for writing papers I, II, IV and wrote part of paper III.
viii
CONFERENCE/SEMINAR CONTRIBUTIONS Biomass gasification in an atmospheric fluidised bed: Tar elimination with commercial iron-based catalysts V. Nemanova, T. Nordgreen and K. Sjöström The 21st North American Catalysis Meeting, San Francisco 2009 Poster presentation
Biomass gasification in an atmospheric fluidised bed: Probability to employ metallic iron as a tar reduction catalyst V. Nemanova, M. Brundu, T. Nordgreen, T. Liliedahl and K. Sjöström The 17th European Biomass Conference and Exhibition, Hamburg 2009 Oral presentation
Biomass gasification in an atmospheric fluidised bed: Catalytic tar reduction with experimental iron-based granules from Höganäs AB T. Nordgreen, V. Nemanova, K. Engvall and K. Sjöström 2nd International Symposium on Air Pollution Abatement Catalysis, Cracow 2010 Oral presentation
Nickel dual function in biomass gasification V. Nemanova, K. Engvall and K. Sjöström 1st Annual World Congress of Bioenergy-2011, Dalian 2011 Poster presentation
Tar cracking in biomass fueled fluidised bed gasification system V. Nemanova Svenskt Förgasningscentrum, Piteå 2012 Oral presentation

ix
Development and optimisation of biomass gasification at KTH V. Nemanova and K. Engvall 10th Edition of the International Workshop CUBASOLAR “Renewable Energies, Environmental Awareness, and Sustainable Development”, Santiago de Cuba 2012 Poster presentation
Tar reforming – effect of alkali V. Nemanova Svenskt Förgasningscentrum, Västerås 2012 Oral presentation
x
AWARDS Ett förslag till nya och användbara sätt att använda överskott av glycerol 2nd place, Glyceroltävlingen Kemivärlden Biotech & Kemisk Tidskrift 2008
Green methane 3d place, Poster Contest KTH Skoldagen 2011
Green methane from biomass 1st place, Poster Contest KTH Energy Platform 2011
Green waste: a puzzle for scientists but the key for sustainable development 1st place, Poster Contest KTH Energy Platform 2012
xi
LIST of FIGURES
Figure 2.1 General composition of biomass……………………………………...6
Figure 2.2 From biomass to energy products and fuels…………………………..7
Figure 2.3 A wood gas vehicle during World War II……………………………..8
Figure 2.4 Different types of biomass gasifiers………………………………….10
Figure 2.5 Different stages in fluidisation……………………………………......12
Figure 2.6 Geldart’s classification of particles…...………………………………15
Figure 2.7 Plugging of piping and fouling of equipment…...……………………17
Figure 2.8 Tar maturation scheme, proposed by Elliott …..…………………….18
Figure 2.9 Types of catalyst used for tar reduction in producer gas……………..22
Figure 2.10 Schematic view of petroleum coke production from crude oil……...25
Figure 3.1 Schematic view of ABFB…………………………………...………..28
Figure 3.2 Schematic view of TGA……………………………………………..29
Figure 4.1 The Ellingham diagram……………………………………………...35
Figure 5.1 Tar content in the gas before and after the filter……………………..38
Figure 5.2 Thermogravimetric analysis of the filter matter……………………...38
Figure 5.3 The oxygen potential in the producer gas after the catalysts…………41
Figure 5.4 XRD measurement of catalyst S……………………………………. 41
Figure 5.5 The difference in total tar reduction (excluding benzene) between metallic and oxidised iron- based material……………………………………......42
xii
Figure 5.6 Thermo-catalytic and thermal reduction of naphthalene at different catalytic bed temperatures for the catalyst materials S, F, D and H………………43
Figure 5.7 Thermo-catalytic and thermal reduction of benzene at different catalytic bed temperatures for the catalyst materials S, F, D and H……...………..44
Figure 5.8 Steam gasification of petcoke and biomass using TGA………………47
Figure 5.9 Experimental and calculated data for 50/50 and 20/80 petcoke/biomass mixtures……………………………………………………….48
xiii
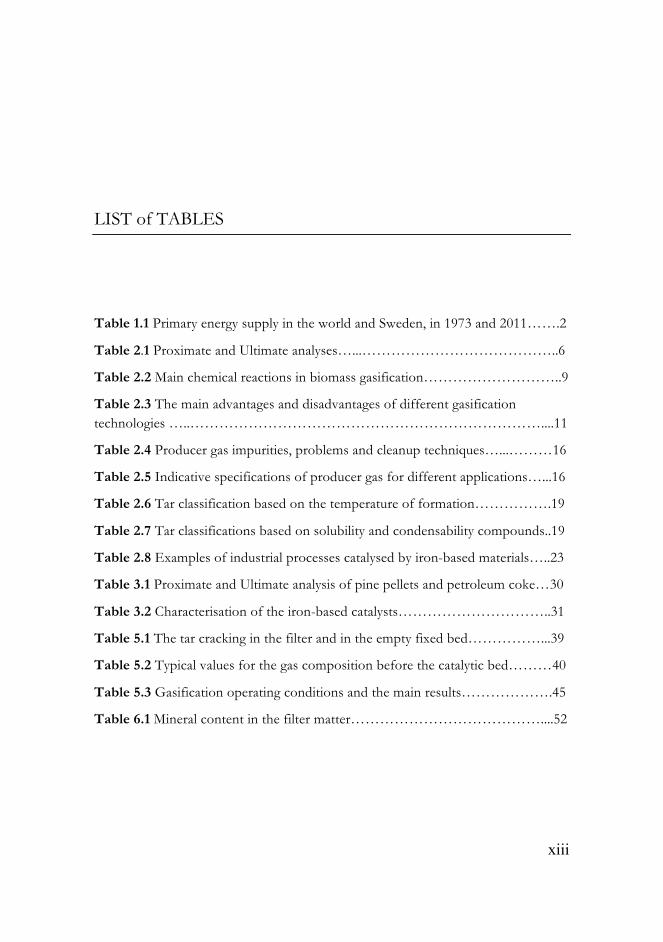
LIST of TABLES
Table 1.1 Primary energy supply in the world and Sweden, in 1973 and 2011…….2
Table 2.1 Proximate and Ultimate analyses…...…………………………………..6
Table 2.2 Main chemical reactions in biomass gasification………………………..9
Table 2.3 The main advantages and disadvantages of different gasification technologies …..………………………………………………………………....11
Table 2.4 Producer gas impurities, problems and cleanup techniques…...………16
Table 2.5 Indicative specifications of producer gas for different applications…...16
Table 2.6 Tar classification based on the temperature of formation…………….19
Table 2.7 Tar classifications based on solubility and condensability compounds..19
Table 2.8 Examples of industrial processes catalysed by iron-based materials…..23
Table 3.1 Proximate and Ultimate analysis of pine pellets and petroleum coke…30
Table 3.2 Characterisation of the iron-based catalysts…………………………..31
Table 5.1 The tar cracking in the filter and in the empty fixed bed……………...39
Table 5.2 Typical values for the gas composition before the catalytic bed………40
Table 5.3 Gasification operating conditions and the main results……………….45
Table 6.1 Mineral content in the filter matter…………………………………....52
xiv
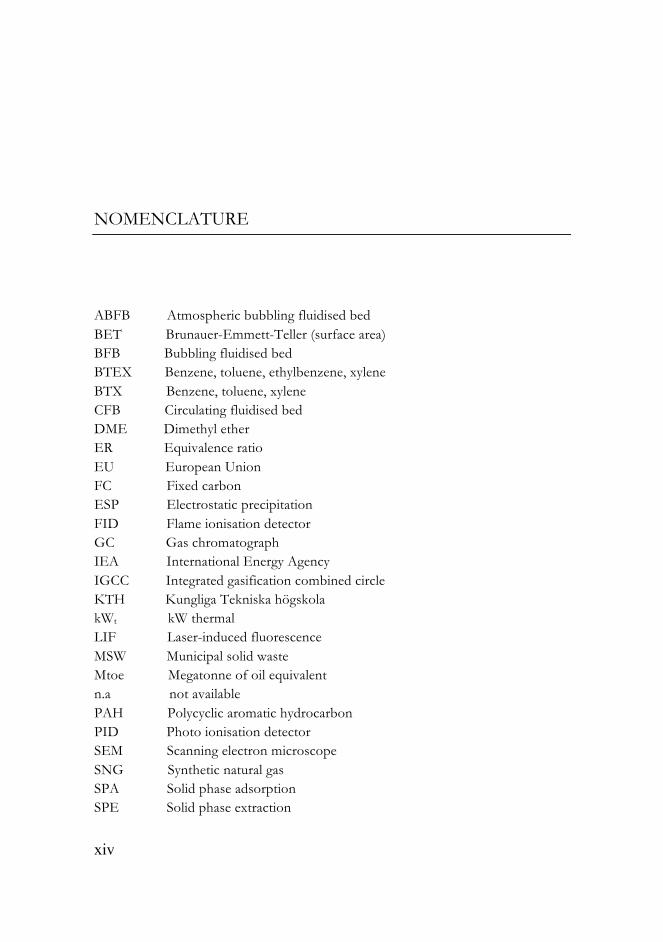
NOMENCLATURE ABFB Atmospheric bubbling fluidised bed BET Brunauer-Emmett-Teller (surface area) BFB Bubbling fluidised bed BTEX Benzene, toluene, ethylbenzene, xylene BTX Benzene, toluene, xylene CFB Circulating fluidised bed DME Dimethyl ether ER Equivalence ratio EU European Union FC Fixed carbon ESP Electrostatic precipitation FID Flame ionisation detector GC Gas chromatograph IEA International Energy Agency IGCC Integrated gasification combined circle KTH Kungliga Tekniska högskola kWt kW thermal LIF Laser-induced fluorescence MSW Municipal solid waste Mtoe Megatonne of oil equivalent n.a not available PAH Polycyclic aromatic hydrocarbon PID Photo ionisation detector SEM Scanning electron microscope SNG Synthetic natural gas SPA Solid phase adsorption SPE Solid phase extraction
xv
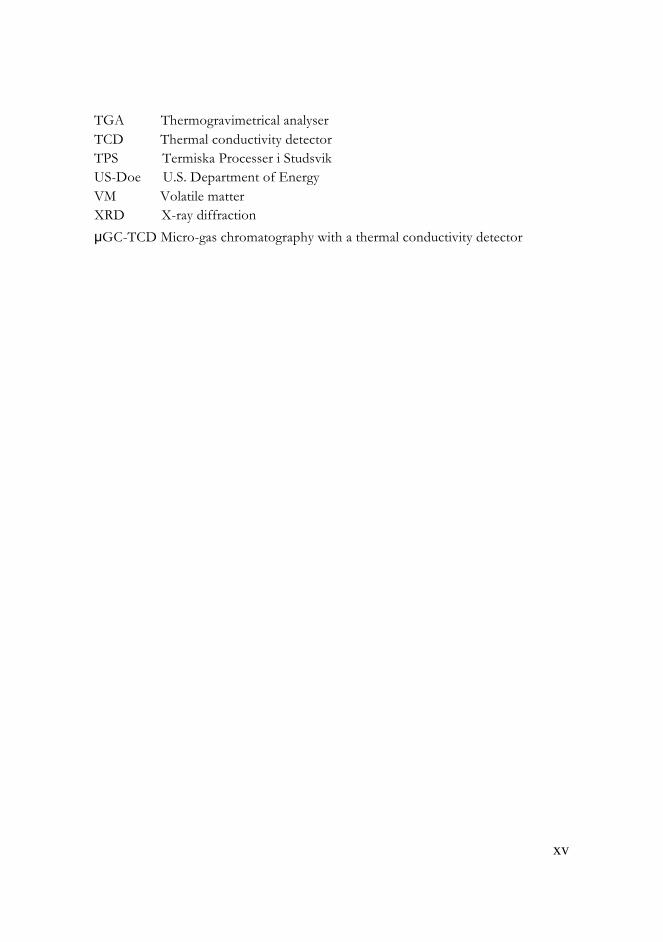
TGA Thermogravimetrical analyser TCD Thermal conductivity detector TPS Termiska Processer i Studsvik US-Doe U.S. Department of Energy VM Volatile matter XRD X-ray diffraction
μGC-TCD Micro-gas chromatography with a thermal conductivity detector

xvi
xvii
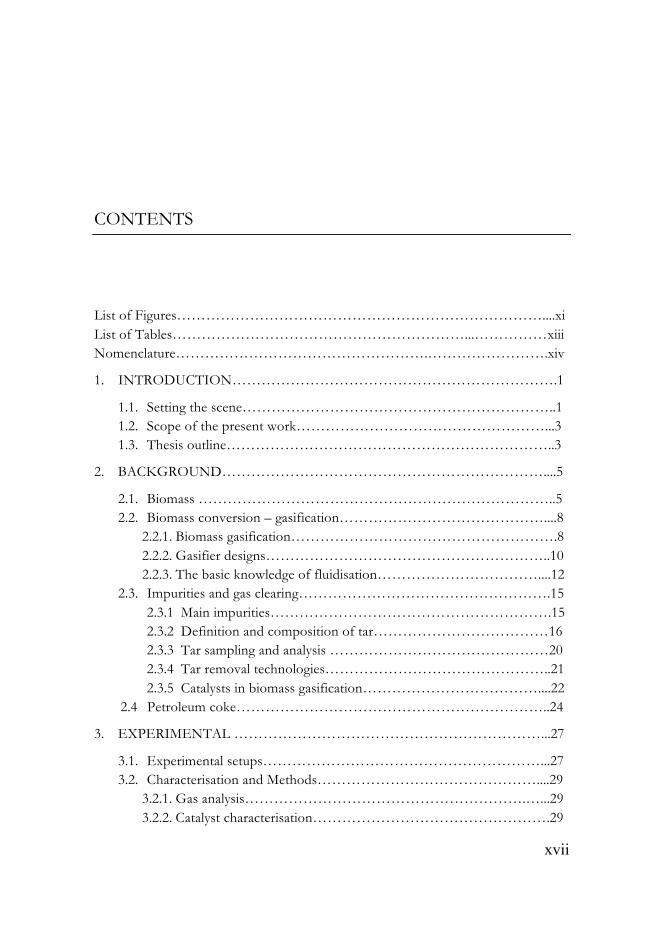
CONTENTS List of Figures…………………………………………………………………....xi List of Tables……………………………………………………...……………xiii Nomenclature…………………………………………….…………………….xiv
1. INTRODUCTION………………………………………………………….1
1.1. Setting the scene………………………………………………………..1 1.2. Scope of the present work……………………………………………...3 1.3. Thesis outline…………………………………………………………..3
2. BACKGROUND…………………………………………………………....5
2.1. Biomass ………………………………………………………………..5 2.2. Biomass conversion – gasification……………………………………....8
2.2.1. Biomass gasification……………………………………………….8 2.2.2. Gasifier designs…………………………………………………..10 2.2.3. The basic knowledge of fluidisation……………………………....12
2.3. Impurities and gas clearing…………………………………………….15 2.3.1 Main impurities………………………………………………….15 2.3.2 Definition and composition of tar………………………………16 2.3.3 Tar sampling and analysis ………………………………………20 2.3.4 Tar removal technologies………………………………………..21 2.3.5 Catalysts in biomass gasification………………………………....22
2.4 Petroleum coke………………………………………………………..24
3. EXPERIMENTAL ………………………………………………………...27
3.1. Experimental setups…………………………………………………...27 3.2. Characterisation and Methods………………………………………....29
3.2.1. Gas analysis………………………………………………….…...29 3.2.2. Catalyst characterisation………………………………………….29
xviii
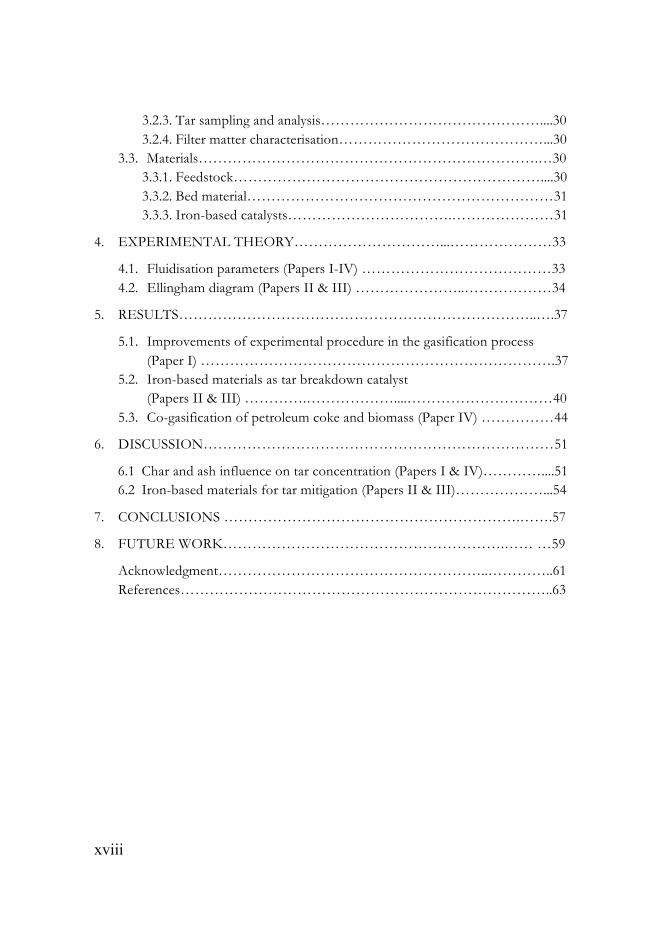
3.2.3. Tar sampling and analysis………………………………………....30 3.2.4. Filter matter characterisation……………………………………...30
3.3. Materials…………………………………………………………….…30 3.3.1. Feedstock………………………………………………………....30 3.3.2. Bed material………………………………………………………31 3.3.3. Iron-based catalysts…………………………….…………………31
4. EXPERIMENTAL THEORY…………………………...…………………33
4.1. Fluidisation parameters (Papers I-IV) …………………………………33 4.2. Ellingham diagram (Papers II & III) …………………..………………34
5. RESULTS………………………………………………………………..….37
5.1. Improvements of experimental procedure in the gasification process (Paper I) ……………………………………………………………….37
5.2. Iron-based materials as tar breakdown catalyst (Papers II & III) ………….………………....…………………………40
5.3. Co-gasification of petroleum coke and biomass (Paper IV) ……………44
6. DISCUSSION………………………………………………………………51
6.1 Char and ash influence on tar concentration (Papers I & IV)…………....51 6.2 Iron-based materials for tar mitigation (Papers II & III)………………...54
7. CONCLUSIONS …………………………………………………….…….57
8. FUTURE WORK………………………………………………….…… …59
Acknowledgment………………………………………………..…………..61 References…………………………………………………………………..63
1
1. INTRODUCTION
Chapter 1 briefly addresses the general world energy outlook, importance of biomass gasification, its major applications and the main challenge to overcome. Finally, the scope of the work and the organisation of the thesis are presented.
1. 1 Setting the scene
Confronting growing world population and depletion of energy resources is an important challenge to overcome in the coming years. Moreover, global warming, anthropogenic hazardous emissions and political turmoil with consequences beyond national borders are effects of fossil fuel usage, in particular crude oil and natural gas.
In the past four decades the total worldwide energy consumption has roughly doubled [1]. Most of that energy originated and still originates from fossil fuels (Table 2.1).
Table 1.1 Primary energy supply in the world and Sweden, in 1973 and 2011
World [1]
Total primary energy supply, Mtoe
Fossil fuels, % Renewable, % Biofuels & waste, %
1973
2011
6 109
13 113
86.6
81.6
12.5
13.3
10.6
10.0
Sweden [2]
1973
2011
40
50
81.4
35.7
18.4
35.2
9.6
22.9
2
In Sweden fossil fuels usage has declined by over 56 % from 1973 until 2011 [2]. On the other hand, the biofuels and waste supply has increased by over 130 %. According to Key World Energy Statistics 2013 [1], Sweden uses the highest proportion of renewable energy (35.2 %) in relation to the total energy supplied among the EU countries.
It should be mentioned that renewable energy includes solar and wind energy, biomass, hydropower and geothermal energy – the energy resources that are naturally renewed on a short term. Nuclear energy is not listed as renewable, but as an alternative type of energy.
Biomass is an attractive renewable resource that can play an important role in heat, energy and fuel production. It is the fourth largest fuel source after crude oil, coal and natural gas that provides between 10 and 15 % of the primary energy consumption in the world [3-6]. Also, biomass can be considered as carbon dioxide (CO2) neutral.
For the utilisation of biomass energy, gasification is a feasible alternative among the different thermochemical technologies since biomass with lower energy value can be upgraded to synthetic gas (syngas) with a higher value, which in turn may be used in gas turbines, engines and fuel cells, or after upgrading, converted into methanol, dimethylether, Fisher-Tropsch oils, synthetic natural gas (SNG) or other chemical products.
The main challenge to overcome in biomass gasification is the tar destruction. Tar is a complex mixture of different aromatic hydrocarbons that cause problems, such as blocking and fouling of engines, filter and pipes plugging, corrosion and catalyst deactivation. Moreover, tar contains carcinogenic compounds that have to be removed to comply with health and environmental demands.
Tar mitigation in the producer gas from biomass gasification is the subject of this thesis.
1.2 Scope of the present work
The main scope of the work presented in this thesis has been to address the challenge of tar mitigation in the gas produced in a gasification system with a 5 kWt
atmospheric bubbling fluidised bed (ABFB) reactor.
Tar mitigation, starting in the ABFB, continuing in the candle filter and finishing in the catalytic bed, has been investigated. Additionally, the effect of biomass on the
3
reactivity of petroleum coke was determined by co-gasifying in the ABFB and thermogravimetrical analyser (TGA).
The thesis is based on the four appended papers, focusing on tar cracking in the gasification gas. In Paper I an experimental procedure in the gasification process has been improved. Papers II and III present results from the evaluation of iron-based catalysts for tar removal in the secondary fixed bed. In Paper IV co-gasification of petroleum coke with biomass has been investigated.
1.3 Thesis outline
The content of this thesis is divided into three key parts: a theoretical section, an experimental part, and the appended published papers.
Following Chapter 1 - Introduction, Chapter 2 provides a background to thermochemical conversion of biomass by means of gasification. Also, a literature review regarding tar formation, analysis and mitigation is given. The second part, Chapters 3-6, gives description of the experimental facilities used in the work, the test procedure and the main results derived from the appended papers. Concluding remarks and suggestions for future work are given in Chapter 7. Finally, in the third part, the four scientific papers are attached.

4

5
2. BACKGROUND
In this chapter general information about biomass and methods of conversion is given. Also, the thermochemical process gasification and different gasification reactors are described. Some background on the main challenge in biomass gasification – tar, and the current solutions are discussed.
2.1. Biomass
Biomass is defined as organic material derived from plants, animals and wastes [6]. Virgin wood, energy crops, agricultural residues, food waste and industrial wastes are some examples of biomass [7-8]. By virtue of its definition, biomass types may vary significantly in their chemical and physical properties.
Woody biomass, collectively termed lignocelluloses, is composed primarily of different organic polymers: cellulose (40-45 %), hemicelluloses (15-45 %) and lignin (15-35 %) [9]. Other compounds, such as acids, salts, proteins and minerals, are also present in the range of 1-10 %. The polymers, in turn, consist of carbon, oxygen and hydrogen. In this work biomass is considered as lignocellulosic material.
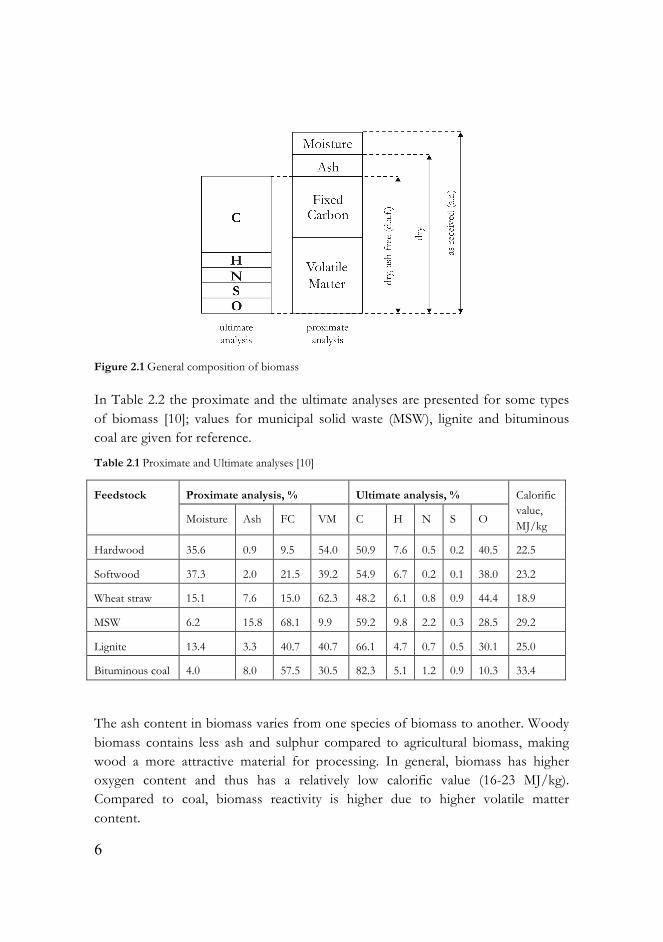
Biomass is usually characterised by proximate and ultimate analyses (Figure 2.1). The proximate analysis includes moisture and ash contents, the fixed carbon (FC) and volatile matter (VM) content. Elemental analysis of carbon C, hydrogen H, nitrogen N, sulphur S and oxygen O is termed ultimate analysis.
6
Figure 2.1 General composition of biomass
In Table 2.2 the proximate and the ultimate analyses are presented for some types of biomass [10]; values for municipal solid waste (MSW), lignite and bituminous coal are given for reference.
Table 2.1 Proximate and Ultimate analyses [10]
Proximate analysis, % Ultimate analysis, % Feedstock
Moisture Ash FC VM C H N S O
Calorific value, MJ/kg
Hardwood 35.6 0.9 9.5 54.0 50.9 7.6 0.5 0.2 40.5 22.5
Softwood 37.3 2.0 21.5 39.2 54.9 6.7 0.2 0.1 38.0 23.2
Wheat straw 15.1 7.6 15.0 62.3 48.2 6.1 0.8 0.9 44.4 18.9
MSW 6.2 15.8 68.1 9.9 59.2 9.8 2.2 0.3 28.5 29.2
Lignite 13.4 3.3 40.7 40.7 66.1 4.7 0.7 0.5 30.1 25.0
Bituminous coal 4.0 8.0 57.5 30.5 82.3 5.1 1.2 0.9 10.3 33.4
The ash content in biomass varies from one species of biomass to another. Woody biomass contains less ash and sulphur compared to agricultural biomass, making wood a more attractive material for processing. In general, biomass has higher oxygen content and thus has a relatively low calorific value (16-23 MJ/kg). Compared to coal, biomass reactivity is higher due to higher volatile matter content.
7
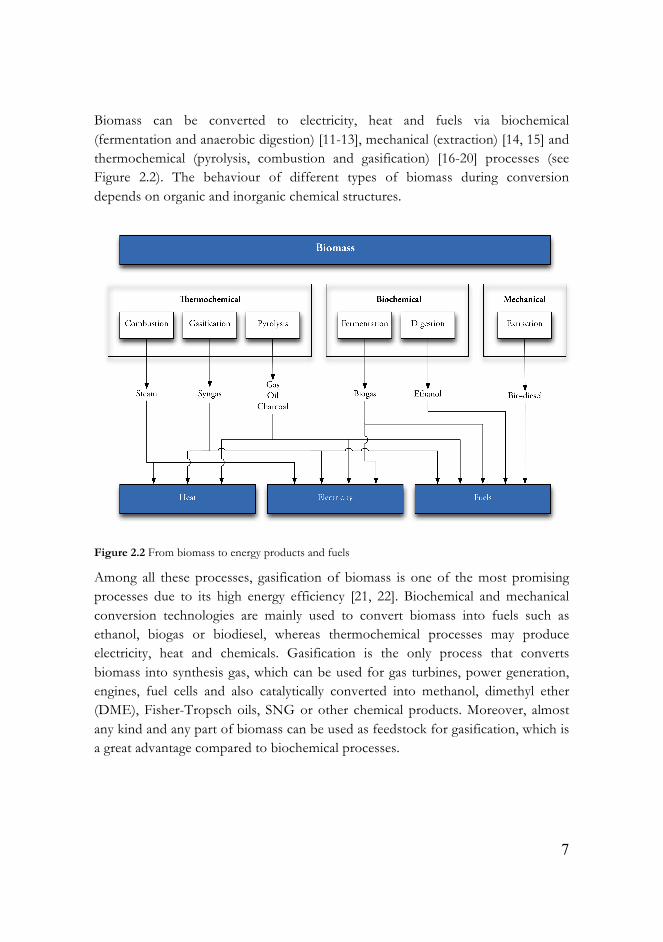
Biomass can be converted to electricity, heat and fuels via biochemical (fermentation and anaerobic digestion) [11-13], mechanical (extraction) [14, 15] and thermochemical (pyrolysis, combustion and gasification) [16-20] processes (see Figure 2.2). The behaviour of different types of biomass during conversion depends on organic and inorganic chemical structures.
Figure 2.2 From biomass to energy products and fuels
Among all these processes, gasification of biomass is one of the most promising processes due to its high energy efficiency [21, 22]. Biochemical and mechanical conversion technologies are mainly used to convert biomass into fuels such as ethanol, biogas or biodiesel, whereas thermochemical processes may produce electricity, heat and chemicals. Gasification is the only process that converts biomass into synthesis gas, which can be used for gas turbines, power generation, engines, fuel cells and also catalytically converted into methanol, dimethyl ether (DME), Fisher-Tropsch oils, SNG or other chemical products. Moreover, almost any kind and any part of biomass can be used as feedstock for gasification, which is a great advantage compared to biochemical processes.
8
2.2 Biomass conversion - gasification
2.2.1 Biomass gasification
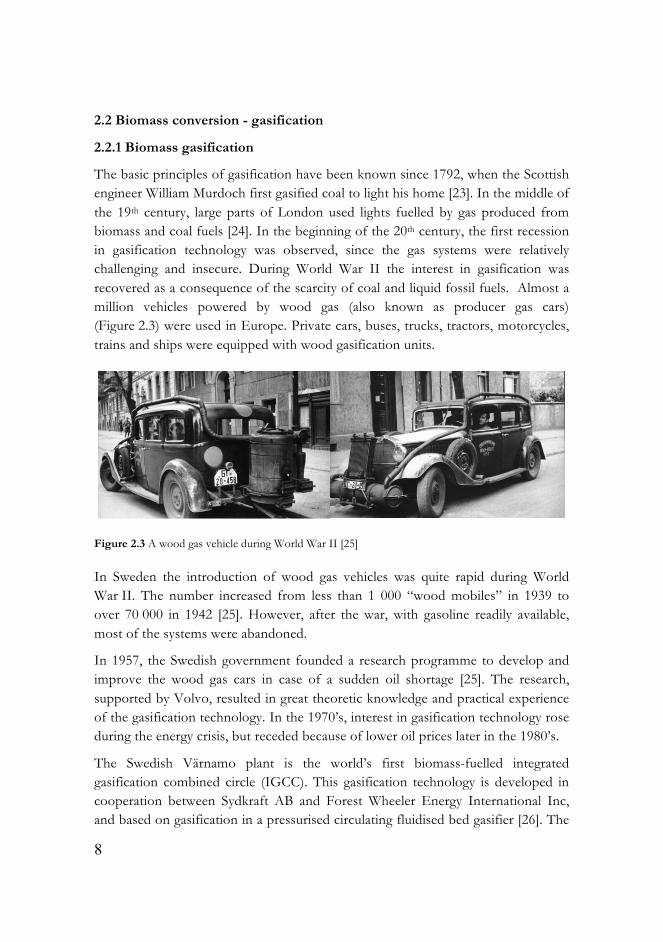
The basic principles of gasification have been known since 1792, when the Scottish engineer William Murdoch first gasified coal to light his home [23]. In the middle of the 19th century, large parts of London used lights fuelled by gas produced from biomass and coal fuels [24]. In the beginning of the 20th century, the first recession in gasification technology was observed, since the gas systems were relatively challenging and insecure. During World War II the interest in gasification was recovered as a consequence of the scarcity of coal and liquid fossil fuels. Almost a million vehicles powered by wood gas (also known as producer gas cars) (Figure 2.3) were used in Europe. Private cars, buses, trucks, tractors, motorcycles, trains and ships were equipped with wood gasification units.
Figure 2.3 A wood gas vehicle during World War II [25]
In Sweden the introduction of wood gas vehicles was quite rapid during World War II. The number increased from less than 1 000 “wood mobiles” in 1939 to over 70 000 in 1942 [25]. However, after the war, with gasoline readily available, most of the systems were abandoned.
In 1957, the Swedish government founded a research programme to develop and improve the wood gas cars in case of a sudden oil shortage [25]. The research, supported by Volvo, resulted in great theoretic knowledge and practical experience of the gasification technology. In the 1970’s, interest in gasification technology rose during the energy crisis, but receded because of lower oil prices later in the 1980’s.
The Swedish Värnamo plant is the world’s first biomass-fuelled integrated gasification combined circle (IGCC). This gasification technology is developed in cooperation between Sydkraft AB and Forest Wheeler Energy International Inc, and based on gasification in a pressurised circulating fluidised bed gasifier [26]. The
9
plant was constructed during 1991-1993 and between 1996 and 1999 the gasifier was operated for 8 500 hours, producing 6 MW electricity and 9 MW heat.
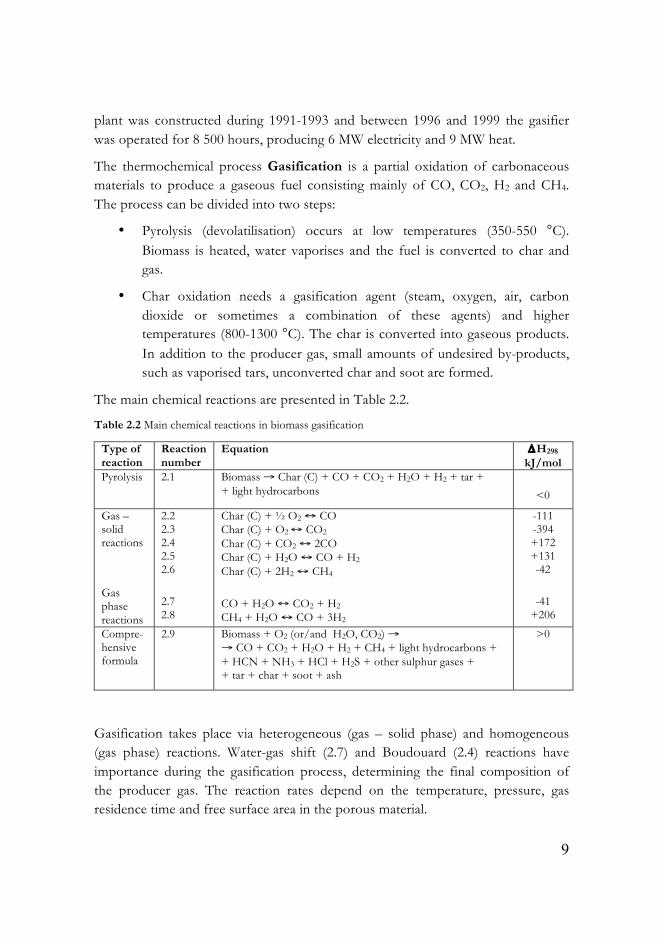
The thermochemical process Gasification is a partial oxidation of carbonaceous materials to produce a gaseous fuel consisting mainly of CO, CO2, H2 and CH4. The process can be divided into two steps:
• Pyrolysis (devolatilisation) occurs at low temperatures (350-550 °C). Biomass is heated, water vaporises and the fuel is converted to char and gas.
• Char oxidation needs a gasification agent (steam, oxygen, air, carbon dioxide or sometimes a combination of these agents) and higher temperatures (800-1300 °C). The char is converted into gaseous products. In addition to the producer gas, small amounts of undesired by-products, such as vaporised tars, unconverted char and soot are formed.
The main chemical reactions are presented in Table 2.2. Table 2.2 Main chemical reactions in biomass gasification
Type of reaction
Reaction number
Equation ΔH298 kJ/mol
Pyrolysis 2.1 Biomass → Char (C) + CO + CO2 + H2O + H2 + tar + + light hydrocarbons
<0 Gas – solid reactions Gas phase reactions
2.2 2.3 2.4 2.5 2.6 2.7 2.8
Char (C) + ½ O2 ↔ CO Char (C) + O2 ↔ CO2 Char (C) + CO2 ↔ 2CO Char (C) + H2O ↔ CO + H2 Char (C) + 2H2 ↔ CH4
CO + H2O ↔ CO2 + H2 CH4 + H2O ↔ CO + 3H2
-111 -394 +172 +131 -42
-41 +206
Compre-hensive formula
2.9 Biomass + O2 (or/and H2O, CO2) → → CO + CO2 + H2O + H2 + CH4 + light hydrocarbons + + HCN + NH3 + HCl + H2S + other sulphur gases + + tar + char + soot + ash
>0
Gasification takes place via heterogeneous (gas – solid phase) and homogeneous (gas phase) reactions. Water-gas shift (2.7) and Boudouard (2.4) reactions have importance during the gasification process, determining the final composition of the producer gas. The reaction rates depend on the temperature, pressure, gas residence time and free surface area in the porous material.
10
The amount of oxygen added is usually expressed as an equivalence ratio (ER) or lambda (λ), meaning the ratio between the actual oxygen inlet and the stoichiometric oxygen needed for total combustion of the fuel. In biomass gasification the ER is usually between 0.20 and 0.35.
2.2.2 Gasifier designs
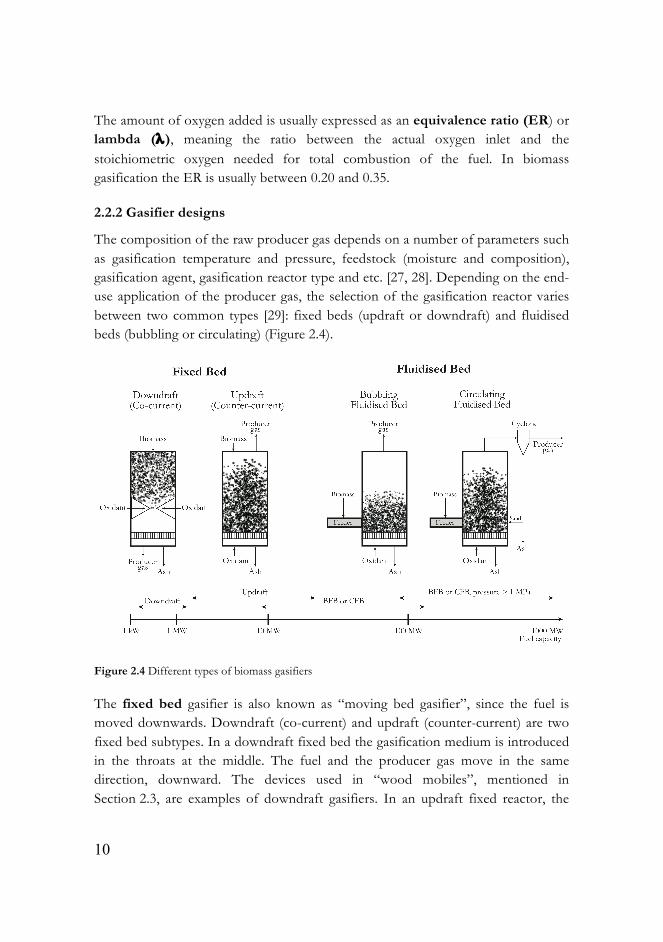
The composition of the raw producer gas depends on a number of parameters such as gasification temperature and pressure, feedstock (moisture and composition), gasification agent, gasification reactor type and etc. [27, 28]. Depending on the end-use application of the producer gas, the selection of the gasification reactor varies between two common types [29]: fixed beds (updraft or downdraft) and fluidised beds (bubbling or circulating) (Figure 2.4).
Figure 2.4 Different types of biomass gasifiers
The fixed bed gasifier is also known as “moving bed gasifier”, since the fuel is moved downwards. Downdraft (co-current) and updraft (counter-current) are two fixed bed subtypes. In a downdraft fixed bed the gasification medium is introduced in the throats at the middle. The fuel and the producer gas move in the same direction, downward. The devices used in “wood mobiles”, mentioned in Section 2.3, are examples of downdraft gasifiers. In an updraft fixed reactor, the
11
gasifying agent is added at the bottom. The downward-moving feedstock is first dried by producer gas, then pyrolysed, and finally, the remaining char is gasified.
In a fluidised bed the drying, pyrolysis and gasification take place in a fluid bed. The principle of fluidisation, the foundation of the fluidised bed, is described in the upcoming Section 2.5. The fluidised beds are subdivided into two groups: bubbling fluidised bed (BFB) and circulating fluidised bed (CFB), depending on the velocity of the fluidisation medium in the gasifier. The gas velocity in the BFB is circa 1 m/s, while in the CFB it is between 3 and 10 m/s. Due to good mass and heat transfer, the fluidised beds are suitable for scaling up. Fluidised beds may have up to 1 000 MW fuel capacity, whereas fixed bed reactors are usually preferred for small-scale applications (up to 20 MW) (Figure 2.4).
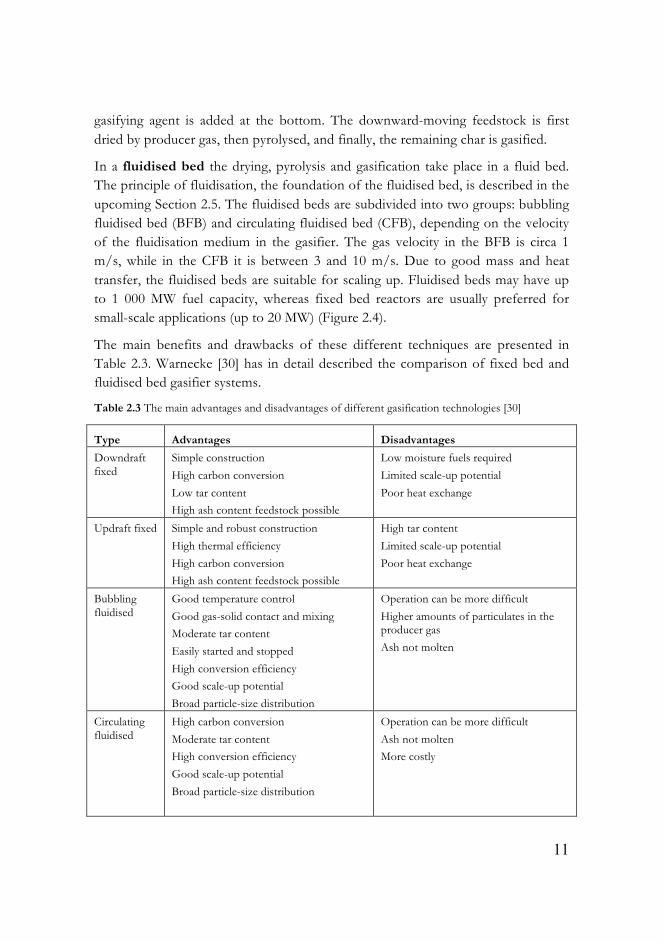
The main benefits and drawbacks of these different techniques are presented in Table 2.3. Warnecke [30] has in detail described the comparison of fixed bed and fluidised bed gasifier systems.
Table 2.3 The main advantages and disadvantages of different gasification technologies [30]
Type Advantages Disadvantages
Downdraft fixed
Simple construction
High carbon conversion
Low tar content High ash content feedstock possible
Low moisture fuels required
Limited scale-up potential
Poor heat exchange
Updraft fixed Simple and robust construction
High thermal efficiency
High carbon conversion High ash content feedstock possible
High tar content
Limited scale-up potential
Poor heat exchange
Bubbling fluidised
Good temperature control
Good gas-solid contact and mixing Moderate tar content
Easily started and stopped
High conversion efficiency Good scale-up potential
Broad particle-size distribution
Operation can be more difficult
Higher amounts of particulates in the producer gas
Ash not molten
Circulating fluidised
High carbon conversion
Moderate tar content High conversion efficiency
Good scale-up potential
Broad particle-size distribution
Operation can be more difficult
Ash not molten More costly
12
In the early 21st century, about 50 manufacturers in Europe, the US and Canada were offering ‘commercial’ gasification plants divided between:
75 % - downdraft type,
20 % - fluidised beds,
2.5 % - updraft beds and
2.5 % - other designs [31, 32].
The entrained gasifier is another type of gasification reactor, commonly used for coal gasification [33]. High temperatures (1 300 – 1 600 °C), high pressures (25-60 bar) and fine fuel particles (< 100 µm) are the main parameters for operating this reactor. Recently, entrained gasifiers have been tested for gasification of biomass [34].
2.2.3 The basic knowledge of fluidisation
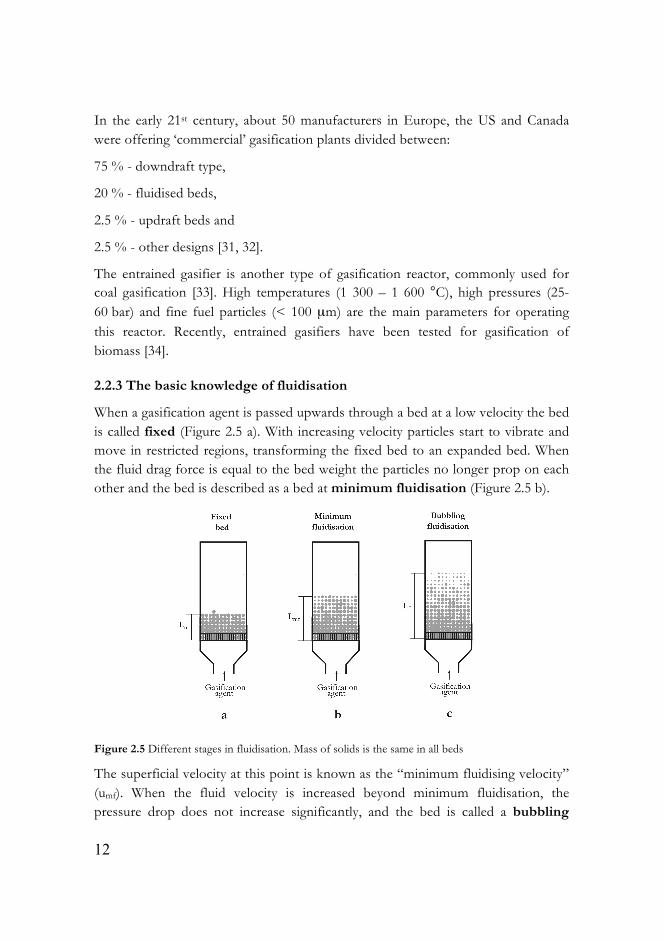
When a gasification agent is passed upwards through a bed at a low velocity the bed is called fixed (Figure 2.5 a). With increasing velocity particles start to vibrate and move in restricted regions, transforming the fixed bed to an expanded bed. When the fluid drag force is equal to the bed weight the particles no longer prop on each other and the bed is described as a bed at minimum fluidisation (Figure 2.5 b).
Figure 2.5 Different stages in fluidisation. Mass of solids is the same in all beds
The superficial velocity at this point is known as the “minimum fluidising velocity” (umf). When the fluid velocity is increased beyond minimum fluidisation, the pressure drop does not increase significantly, and the bed is called a bubbling

13
fluidised bed [35] (Figure 2.5 c). Commercial gaseous fluidised beds are usually operated at flow rate 5-20 times higher than at minimum fluidisation [36]
Fluidisation, in accordance with the aforesaid, will start when the total frictional force on the particles is equal the weight of the bed, and an important parameter is the fluid velocity in bed. The pressure drop over the bed can be written from the static component of Bernoulli’s equation:
(2.10)
where Lmf - bed height at minimum fluidisation [m]
ρbulk - density of the bulk bed material [kg/m3]
g - gravitation constant, 9.82 [m/s2]
εmp - bed porosity at minimum fluidisation [-]
ρs- - density of the bed material [kg/m3]
ρg - density of gas [kg/m3]
Ergun’s equation [37], including a viscous energy loss, proportional to the fluid velocity and an inertial loss (kinetic energy), proportional to the velocity squared, may be used for expressing the pressure loss during one-dimensional flow in the fixed bed:
(2.11)
where µ - viscosity of gas [kg/m·s]
uc - superficial gas velocity [m/s]
d - diameter of particle [m]
ϕ - sphericity of particle [-]
ε - porosity [-]
Assuming that Ergun’s equation is also valid at the transition from fixed to fluidised bed and substituting ε = εmf, uc = umf, equations (2.10) and (2.11) may be combined into:
14
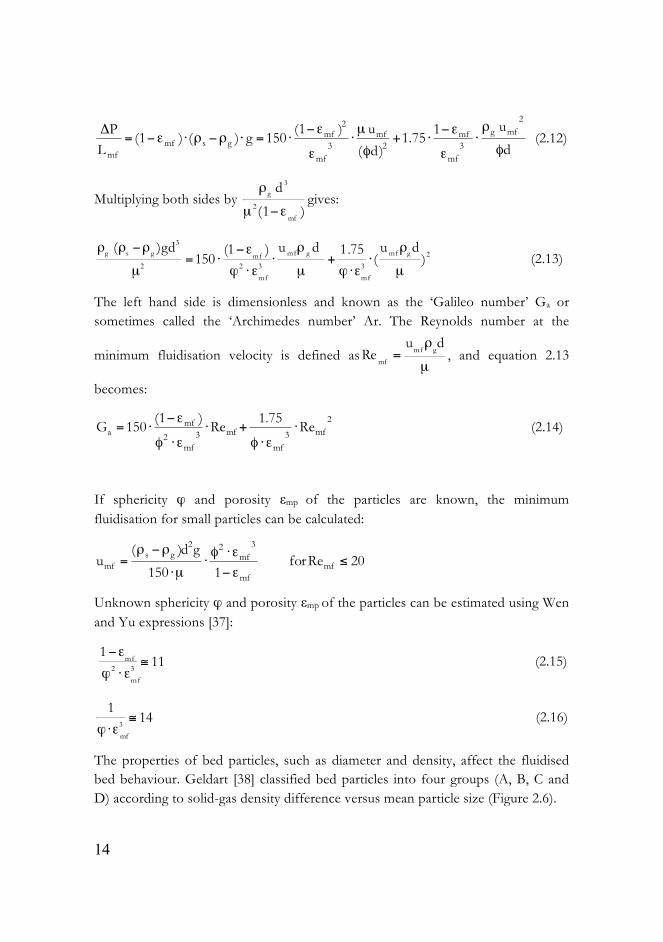
(2.12)
Multiplying both sides by gives:
(2.13)
The left hand side is dimensionless and known as the ‘Galileo number’ Ga or sometimes called the ‘Archimedes number’ Ar. The Reynolds number at the
minimum fluidisation velocity is defined as , and equation 2.13
becomes:
(2.14)
If sphericity ϕ and porosity εmp of the particles are known, the minimum fluidisation for small particles can be calculated:
Unknown sphericity ϕ and porosity εmp of the particles can be estimated using Wen and Yu expressions [37]:
(2.15)
(2.16)
The properties of bed particles, such as diameter and density, affect the fluidised bed behaviour. Geldart [38] classified bed particles into four groups (A, B, C and D) according to solid-gas density difference versus mean particle size (Figure 2.6).
15
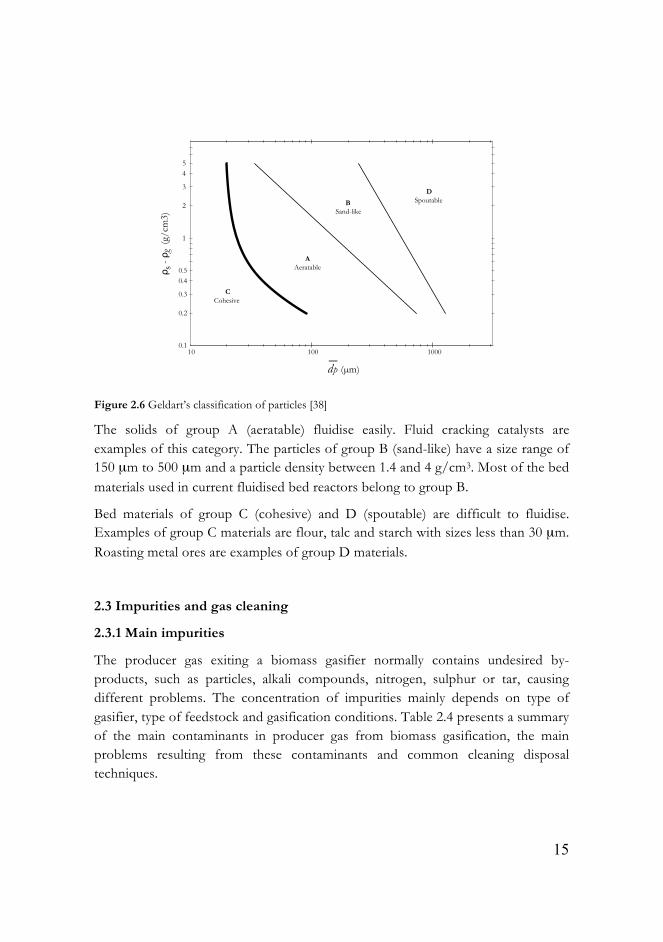
Figure 2.6 Geldart’s classification of particles [38]
The solids of group A (aeratable) fluidise easily. Fluid cracking catalysts are examples of this category. The particles of group B (sand-like) have a size range of 150 µm to 500 µm and a particle density between 1.4 and 4 g/cm3. Most of the bed materials used in current fluidised bed reactors belong to group B.
Bed materials of group C (cohesive) and D (spoutable) are difficult to fluidise. Examples of group C materials are flour, talc and starch with sizes less than 30 µm. Roasting metal ores are examples of group D materials.
2.3 Impurities and gas cleaning
2.3.1 Main impurities
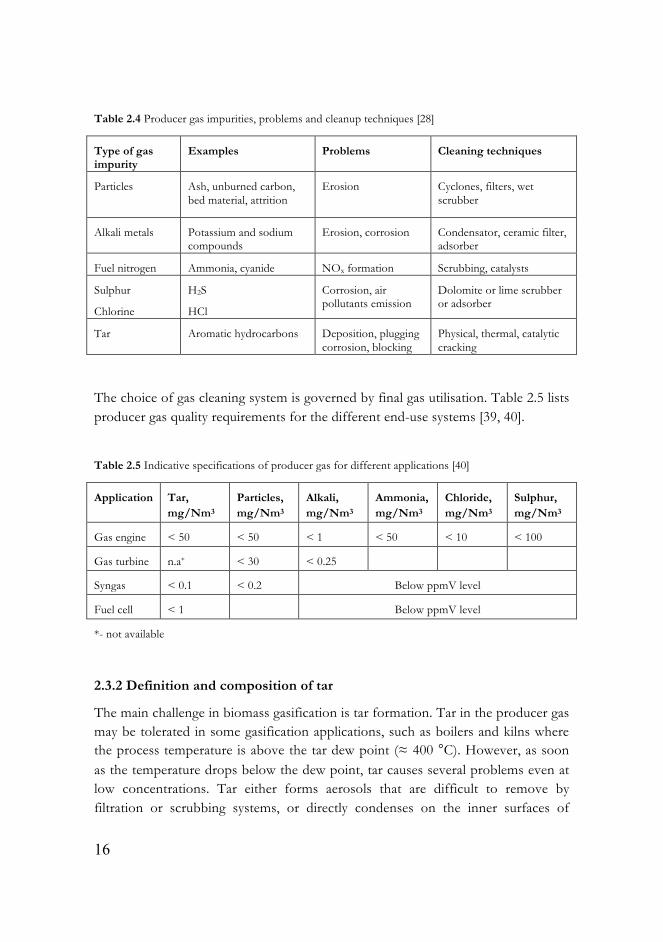
The producer gas exiting a biomass gasifier normally contains undesired by-products, such as particles, alkali compounds, nitrogen, sulphur or tar, causing different problems. The concentration of impurities mainly depends on type of gasifier, type of feedstock and gasification conditions. Table 2.4 presents a summary of the main contaminants in producer gas from biomass gasification, the main problems resulting from these contaminants and common cleaning disposal techniques.
16
Table 2.4 Producer gas impurities, problems and cleanup techniques [28]
Type of gas impurity
Examples Problems Cleaning techniques
Particles Ash, unburned carbon, bed material, attrition
Erosion Cyclones, filters, wet scrubber
Alkali metals Potassium and sodium compounds
Erosion, corrosion Condensator, ceramic filter, adsorber
Fuel nitrogen Ammonia, cyanide NOx formation Scrubbing, catalysts
Sulphur
Chlorine
H2S
HCl
Corrosion, air pollutants emission
Dolomite or lime scrubber or adsorber
Tar Aromatic hydrocarbons Deposition, plugging corrosion, blocking
Physical, thermal, catalytic cracking
The choice of gas cleaning system is governed by final gas utilisation. Table 2.5 lists producer gas quality requirements for the different end-use systems [39, 40].
Table 2.5 Indicative specifications of producer gas for different applications [40]
Application Tar, mg/Nm3
Particles, mg/Nm3
Alkali, mg/Nm3
Ammonia, mg/Nm3
Chloride, mg/Nm3
Sulphur, mg/Nm3
Gas engine < 50 < 50 < 1 < 50 < 10 < 100
Gas turbine n.a* < 30 < 0.25
Syngas < 0.1 < 0.2 Below ppmV level
Fuel cell < 1 Below ppmV level
*- not available
2.3.2 Definition and composition of tar
The main challenge in biomass gasification is tar formation. Tar in the producer gas may be tolerated in some gasification applications, such as boilers and kilns where the process temperature is above the tar dew point (≈ 400 °C). However, as soon as the temperature drops below the dew point, tar causes several problems even at low concentrations. Tar either forms aerosols that are difficult to remove by filtration or scrubbing systems, or directly condenses on the inner surfaces of

17
equipments resulting in blocking and fouling of engines and turbines, also plugging of filters and pipes (Figure 2.7), corrosion and catalyst deactivation.
Figure 2.7 Plugging of piping and fouling of equipment [41]
Due to its physical properties, tar is described as a dark, oily and viscous substance. Different definitions, suggested by various research groups, are available for tar characterisation according to chemical structure; this is due to the complexity of tar.
The most widespread definition of tar is “a complex mixture of condensable hydrocarbons, which includes single rings to 5-ring aromatic compounds along with other oxygen-containing hydrocarbons and complex polycyclic aromatic hydrocarbons (PAHs)” [42]
According to Milne and Evans [43], tar is defined as “the organics produced under thermal or partial-oxidation regimes of any organic material and generally assumed to be largely aromatics”.
In conformity with the EU/IEA/US-Doe meeting held in Brussels in 1998, the definition of tar is “all organic contaminants with a molecular weight larger than benzene” [44].
At KTH, tar is defined according to the Brussels meeting. Although benzene is not classified as a tar component, it might be an originator for carbon deposition in downstream catalytic processes. Therefore it is analysed and investigated separately.
Tar derives from the organic part of biomass through a series of complex thermochemical reactions, such as chemolysis, oxidation, depolymerisation, polymerisation and cycloaddition. Yu et al. [45] examined tar formation during
18
cellulose, hemicellulose and lignin gasification in an entrained-flow reactor. The results indicated a significantly higher tar yield formed by lignin decomposition than by cellulose and hemicellulose decomposition. Moreover, at the gasification temperature of 800 °C a remarkable difference between the tar compositions was observed. The main components, besides PAH, after lignin decomposition were phenols and their derivatives. Benzene, toluene, ethylbenzene, xylene isomers (BTEX) and miscellaneous hydrocarbons, consisting primarily of ethers, esters and furans, were the main products of gasification of cellulose and hemicelluloses. Quality and quantity of tar depends, besides fuel properties, on the gasification process parameters (temperature, pressure, oxidising media, type of gasifier, etc).
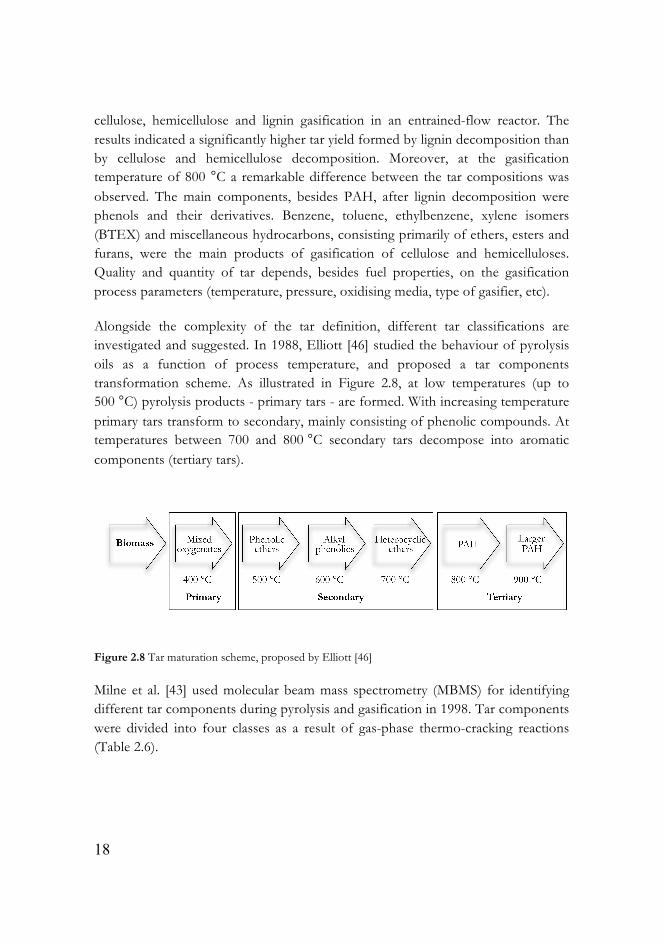
Alongside the complexity of the tar definition, different tar classifications are investigated and suggested. In 1988, Elliott [46] studied the behaviour of pyrolysis oils as a function of process temperature, and proposed a tar components transformation scheme. As illustrated in Figure 2.8, at low temperatures (up to 500 °C) pyrolysis products - primary tars - are formed. With increasing temperature primary tars transform to secondary, mainly consisting of phenolic compounds. At temperatures between 700 and 800 °C secondary tars decompose into aromatic components (tertiary tars).
Figure 2.8 Tar maturation scheme, proposed by Elliott [46]
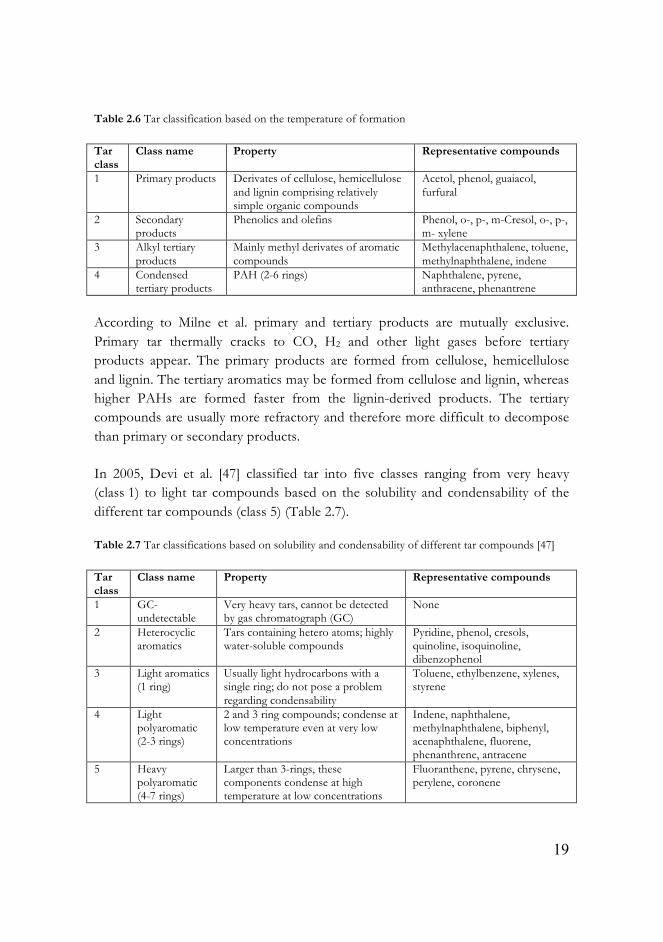
Milne et al. [43] used molecular beam mass spectrometry (MBMS) for identifying different tar components during pyrolysis and gasification in 1998. Tar components were divided into four classes as a result of gas-phase thermo-cracking reactions (Table 2.6).
19
Table 2.6 Tar classification based on the temperature of formation
Tar class
Class name Property Representative compounds
1 Primary products Derivates of cellulose, hemicellulose and lignin comprising relatively simple organic compounds
Acetol, phenol, guaiacol, furfural
2 Secondary products
Phenolics and olefins Phenol, o-, p-, m-Cresol, o-, p-, m- xylene
3 Alkyl tertiary products
Mainly methyl derivates of aromatic compounds
Methylacenaphthalene, toluene, methylnaphthalene, indene
4 Condensed tertiary products
PAH (2-6 rings) Naphthalene, pyrene, anthracene, phenantrene
According to Milne et al. primary and tertiary products are mutually exclusive. Primary tar thermally cracks to CO, H2 and other light gases before tertiary products appear. The primary products are formed from cellulose, hemicellulose and lignin. The tertiary aromatics may be formed from cellulose and lignin, whereas higher PAHs are formed faster from the lignin-derived products. The tertiary compounds are usually more refractory and therefore more difficult to decompose than primary or secondary products.
In 2005, Devi et al. [47] classified tar into five classes ranging from very heavy (class 1) to light tar compounds based on the solubility and condensability of the different tar compounds (class 5) (Table 2.7).
Table 2.7 Tar classifications based on solubility and condensability of different tar compounds [47]
Tar class
Class name Property Representative compounds
1 GC-undetectable
Very heavy tars, cannot be detected by gas chromatograph (GC)
None
2 Heterocyclic aromatics
Tars containing hetero atoms; highly water-soluble compounds
Pyridine, phenol, cresols, quinoline, isoquinoline, dibenzophenol
3 Light aromatics (1 ring)
Usually light hydrocarbons with a single ring; do not pose a problem regarding condensability
Toluene, ethylbenzene, xylenes, styrene
4 Light polyaromatic (2-3 rings)
2 and 3 ring compounds; condense at low temperature even at very low concentrations
Indene, naphthalene, methylnaphthalene, biphenyl, acenaphthalene, fluorene, phenanthrene, antracene
5 Heavy polyaromatic (4-7 rings)
Larger than 3-rings, these components condense at high temperature at low concentrations
Fluoranthene, pyrene, chrysene, perylene, coronene
20
2.3.3 Tar sampling and analysis
Over the last decades, several research groups have developed off-line and on-line methods for sampling and analysis of tar. Traditional off-line methods are tar protocol [44] and solid phase adsorption (SPA) methods [48]. During recent years on-line methods have been developed and are still under investigation.
The tar protocol method is based on tar condensation in an organic solvent. The sampling set consists of six bottles, known as “Petersen columns”, placed in a styrox box. The first five bottles are filled with iso-propanol solution and the remaining bottle is empty. Bottles 1, 2 and 4 are heated to +35 °C and bottles 3, 5 and 6 are cooled down to -20 °C. The producer gas passes through a filter followed by the bottles for collection of moisture and tars into the iso-propanol solution. The samples, after careful evaporation of the solvent and condensed water, are analysed gravimetrically.
The SPA method was developed at KTH and is based on tar adsorption on a solid material. According to this method, a gas sample of 100 ml is manually drawn through a solid phase extraction (SPE) tube during one minute to collect tar components. Subsequently, the aromatic fraction is eluted using dichloromethane, and the phenolic fraction is extracted using dichloromethane: acetonitrile (1:1). Collected samples are analysed using a Varian CP 3800 gas chromatograph.
The method is calibrated for 10 phenolic and 18 aromatic tar components. Tar compounds with molecular mass between 78 and 300 g/mol may be chromatographically analysed. The SPA method is quite easy and relatively fast in comparison to the tar protocol method.
While off-line methods for tar analysis are widely used in practice, online methods are still being developed. Online measurement of benzene-toluene-xylene (BTX) is currently available by means of micro-gas chromatography with a thermal
conductivity detector (μGC-TCD). Naphthalene, fluoranthene and pyrene may be measured by laser-induced fluorescence (LIF) [49-51]. Other examples of on-line determination of tar are:
• The flame ionisation detector (FID) tar analyser [52]
• The photo ionisation detector (PID) tar analyser examined at Royal University of Technology (KTH) [53, 54]

21
2.3.4 Tar removal technologies
Different classifications are feasible for existing tar removal technologies.
The methods may be divided into wet and dry technologies. The wet method includes scrubbers, cooling towers, demisters and etc. Some examples of dry method are fabric, ceramic or metallic filters and electrostatic precipitation (ESP).
Tar decomposition may be performed by physical, thermal and catalytic techniques. Physical processes include scrubbers (wet, water and Venturi), filters, cyclones and ESP. Besides the primary purpose of these apparatuses – particle capture in the producer gas, the processes are also effective for tar removal. Construction, operating cost and usage of water or oil prevent extensive application of these processes. In thermal processes, a high temperature (1100 – 1200 °C) is required for efficient and fast thermal cracking of tar. Catalytic processes have been of interest since the middle of the 1980’s, and have some advantages over physical and thermal processes, mostly in view of cost investments.
The tar removal methods may also be separated into primary (in the gasifier itself) and secondary (downstream the gasifier in a secondary reactor) methods [55]. Some researchers subdivide the primary catalytic methods into two groups: catalytic material used as bed material inside the gasification reactor and catalyst located in the freeboard of the gasifier [56, 57]. Catalytic tar decomposition in the secondary bed has received much attention recently.
In catalytic and physical processes, when high temperatures are applied, the process may preferably be described as thermo-catalytic and thermal cracking. The main reactions are shown below:
Thermal cracking: CnHm ↔ CxHy + H2 (2.17)
Catalytic steam reforming: CnHm + nH2O ↔ (n + )H2 + nCO (2.18)
Catalytic dry reforming: CnHm + nCO2 ↔ H2 + 2nCO (2.19)
CnHm represents tar, and CxHy represents hydrocarbons with smaller carbon number than CnHm.
22
2.3.5 Catalysts in biomass gasification
An effective tar cracking catalyst should be: inexpensive, strong, abundant, easily regenerated and resistant to deactivation (carbon fouling and sintering) [58].
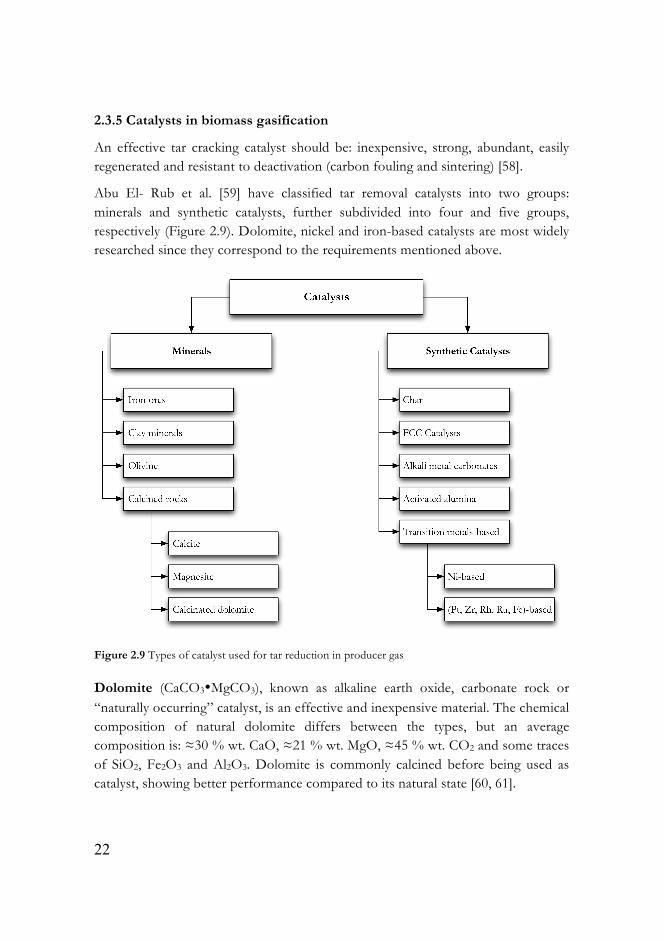
Abu El- Rub et al. [59] have classified tar removal catalysts into two groups: minerals and synthetic catalysts, further subdivided into four and five groups, respectively (Figure 2.9). Dolomite, nickel and iron-based catalysts are most widely researched since they correspond to the requirements mentioned above.
Figure 2.9 Types of catalyst used for tar reduction in producer gas
Dolomite (CaCO3•MgCO3), known as alkaline earth oxide, carbonate rock or “naturally occurring” catalyst, is an effective and inexpensive material. The chemical composition of natural dolomite differs between the types, but an average composition is: ≈30 % wt. CaO, ≈21 % wt. MgO, ≈45 % wt. CO2 and some traces of SiO2, Fe2O3 and Al2O3. Dolomite is commonly calcined before being used as catalyst, showing better performance compared to its natural state [60, 61].

23
Calcined dolomite may be used as primary catalyst (mixed with biomass) or in a secondary bed. In the late 1980’s and early 1990’s many research groups investigated dolomites for tar cracking in the gas produced during pyrolysis or gasification processes. Most of the research on dolomite has been done in Sweden, (TPS AB and KTH), Spain (Universities of Madrid and of Saragossa) and Finland (VTT Energy) [60-70]. In some cases, when the biomass fuel contains high levels of chlorine, the use of calcined dolomite for tar cracking is impossible, due to calcium chlorine (CaCl2) production causing catalyst depletion. Moreover, calcined dolomite is very soft and quickly erodes in a fluidised bed with high turbulence [64].
Nickel-based materials have long been known as effective steam-reforming catalysts [71]. Typically, these catalysts are supported on materials such as α-alumina, magnesia, calcined zirconia and magnesium-aluminium oxide (spinel). In the early 1980’s Ni-based materials were examined as potential catalysts for gas cleaning in biomass gasification [72-75] and recently determined to be the most effective catalyst. However, the main disadvantages of using a steam-reforming catalyst are rapid deactivation due to carbon fouling [76], sulphur poisoning [77, 78], sintering of nickel [79] and cost.
Iron is the second most abundant metal (after aluminium) and the fourth most abundant element in the Earth’s crust. Iron is usually found in its oxidised forms such as hematite (Fe2O3), magnetite (Fe3O4) or limonite (FeOOH).
Iron in its various oxidation states is a well-known catalyst for many different reactions in several industrial processes [80], some of them presented in Table 2.8. Iron-based catalysts are attractive due to their lower price (compared to noble metal-based catalysts) and availability.
Table 2.8 Examples of industrial processes catalysed by iron-based materials
Process Reaction number
Main reactions Conditions Iron content
Ammonia synthesis
2.20 3H2 + N2 ↔ 2NH3 450-500 °C 300 atm
78-82 % Fe2O3
Methanol oxidation
2.21 CH3OH ↔ HCHO + H2 600 – 700 °C 1 atm
17 % Fe2O3
Water-gas shift
2.7 CO + H2O ↔ CO2 + H2 350 – 500 °C 20 – 30 atm
90 % Fe2O3
Fischer-Tropsch
2.22 CO + 2H2 ↔ ( )CnH2n + H2O
310 – 450 °C 1 atm
74 % Fe2O3

24
Cypres et al. [81, 82] studied the influence of iron oxides (magnetite and hematite) during coal pyrolysis. Throughout the tests a reduction of hematite to magnetite by means of hydrogen and carbon monoxide was observed in the temperature range of 400 – 500 °C. At a higher temperature, 600 °C, magnetite was reduced to wustite. There is no information about tar component behaviour during the pyrolysis, perhaps due to lack of knowledge in the tar sampling and analysis field.
Several studies [69, 83-85] investigated iron-containing materials such as olivine, dolomite or limestone for tar mitigation in the producer gas during pyrolysis or gasification. Orio et al. [66] examined four different dolomites (Norte, Chilches, Málaga and Sevilla) in a downstream catalytic reactor. Norte dolomite with the highest iron content showed the best tar conversion (95 %) compared to the dolomite with the lowest iron concentration (Sevilla type). Nordgreen et al. [86, 87] concluded that iron materials kept in their metallic state have higher catalytic tar cracking capacity than their oxidised forms.
Char is a synthetic, non-metallic material, produced from coal or biomass during pyrolysis. Since pyrolysis is part of a gasification process (see Section 2.2.1), char is formed inside the gasifier constantly; however, gases produced during the thermochemical process simultaneously oxidise char. Heating rate of pyrolysis and temperature are two factors that influence the char properties.
Char was noticed to have good capacity for tar alleviation [88-90]. Abu El-Rub et al. [88] used phenol and naphthalene as model tar compounds. Operating temperature during their tests in the reactor was 700 and 900 °C. Biomass char ability for tar mitigation was compared with different catalysts and, additionally, with an inert material. At 700 °C char capacity for phenol decomposition was higher than olivine and sand (inert), but lower than nickel and dolomite capacities. At 900 °C, when naphthalene was examined, char showed better properties for tar mitigation than dolomite, olivine and sand, but worse than nickel.
Alkali metals (mostly Na and K) are highly reactive elements. The metal carbonates or alkali metals, supported on materials such as alumina, are often used as primary catalysts: directly added to biomass by dry mixing or wet impregnation [91-94]. Alkali metals were noticed to catalyse gasification reactions. The catalysts, transferred together with biomass inside the gasifier, are difficult to recover, and a regeneration step is needed which incurs costly investments. Alkali metals may also be used as secondary catalysts, but the catalytic activity is lower compared to metals directly impregnated into biomass [91]. Still, the major drawback of using alkali
25
metals as catalysts in biomass gasification is that catalyst activity declines at high temperatures (>700 °C) due to melting and particle agglomeration.
Biomass ash, including alkali and alkaline earth metals, plays a catalytic role due to alkali content [88, 94]. Abu El-Rub et al. [88] studied ash for naphthalene conversion in a fixed bed reactor at the temperature of 900 °C. Naphthalene concentration decreased by 74 % when biomass ash was used as catalyst. Simultaneously, high levels of ash cause agglomeration problems in the gasifier bed.
2.4 Petroleum coke
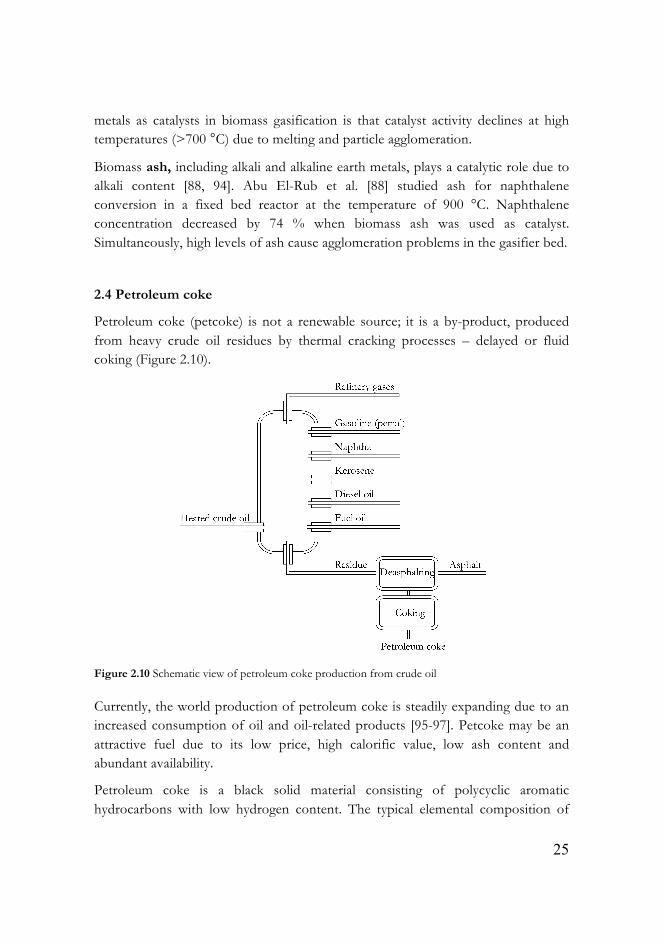
Petroleum coke (petcoke) is not a renewable source; it is a by-product, produced from heavy crude oil residues by thermal cracking processes – delayed or fluid coking (Figure 2.10).
Figure 2.10 Schematic view of petroleum coke production from crude oil
Currently, the world production of petroleum coke is steadily expanding due to an increased consumption of oil and oil-related products [95-97]. Petcoke may be an attractive fuel due to its low price, high calorific value, low ash content and abundant availability.
Petroleum coke is a black solid material consisting of polycyclic aromatic hydrocarbons with low hydrogen content. The typical elemental composition of

26
petcoke depends on the crude oil origin, but usually it is composed of C: 91 – 99.5 %, H: 0.035 – 4 %, S: 0.5 – 8 %, (N+O): 1.3 – 3.8 %, the rest being metals [98]. From 1 tonne of crude oil approximately 31 kg of petcoke is produced [99].
The main non-energy applications of petcoke are the manufacture of carbon anodes for the aluminium smelting industry, graphite electrodes for steel production and also nonferrous industries [98].
Around 75 % of the world’s petroleum coke is used in the energy sector (mostly in North America) [100]. In the past, petroleum coke has often been combusted as fuel in boilers for heat and power production. However, the current increasing use of natural gas has decreased the demand for petcoke [101]. Therefore, new alternatives for utilisation of petroleum coke are of interest. Gasification may be an effective option for converting petcoke into syngas [102]. High temperatures are required, due to the high fixed carbon content [103]; therefore it is preferable to convert petcoke in combination with some additional fuel, such as biomass.
27
3. EXPERIMENTAL
This chapter includes a detailed description of the ABFB test ring and the TGA used for some kinetic studies. Feedstock properties, bed material used in the fluidised bed and catalysts tested for tar mitigation are presented. The methods used during the experiments for tar, gas and catalyst analysis are also discussed.
3.1 Experimental setups
All gasification experiments in Papers I-IV were performed in a 5 kW laboratory-scale atmospheric fluidised bed gasification system, developed by KTH in cooperation with Termiska Processer i Studsvik AB (TPS) [95]. Additionally, a thermogravimetric analyser (TGA) was used in Paper IV in order to determine kinetics of petroleum coke – biomass reactions.
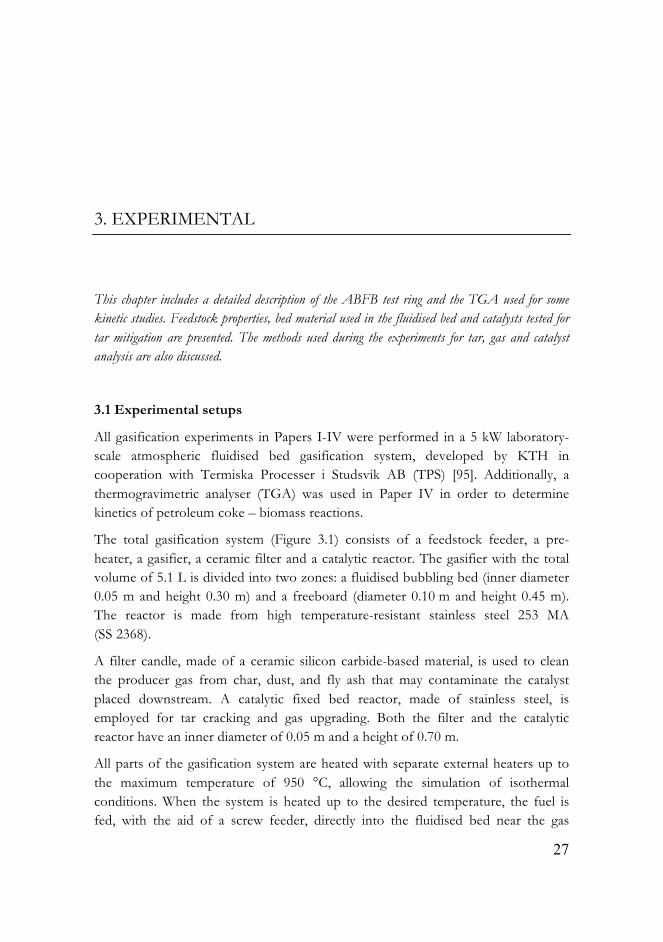
The total gasification system (Figure 3.1) consists of a feedstock feeder, a pre-heater, a gasifier, a ceramic filter and a catalytic reactor. The gasifier with the total volume of 5.1 L is divided into two zones: a fluidised bubbling bed (inner diameter 0.05 m and height 0.30 m) and a freeboard (diameter 0.10 m and height 0.45 m). The reactor is made from high temperature-resistant stainless steel 253 MA (SS 2368).
A filter candle, made of a ceramic silicon carbide-based material, is used to clean the producer gas from char, dust, and fly ash that may contaminate the catalyst placed downstream. A catalytic fixed bed reactor, made of stainless steel, is employed for tar cracking and gas upgrading. Both the filter and the catalytic reactor have an inner diameter of 0.05 m and a height of 0.70 m.
All parts of the gasification system are heated with separate external heaters up to the maximum temperature of 950 °C, allowing the simulation of isothermal conditions. When the system is heated up to the desired temperature, the fuel is fed, with the aid of a screw feeder, directly into the fluidised bed near the gas

28
distribution plate at the bottom. The fuel hopper is provided with nitrogen purge and a cooling system to prevent hot gases from entering the feeder and making the fuel sticky.
Figure 3.1 Schematic view of atmospheric fluidised bed reactor system (SP- sample point)
Nitrogen is used as the main fluidising agent and oxygen, steam or air, mixed into the nitrogen, may be used as an oxidising agent. Before entering the reactor, the fluidisation and oxidation media are pre-heated to 650 °C. The feeding rate is regulated trough the engine frequency of the electrical motor driving the screw and in this work it is in the range of 3.5 - 4.5 g/min at the actual frequency.
The temperature in the gasifier is measured by K-type thermocouples installed in six places along the reactor. The pressure is measured at the points close to the distribution plate, permitting a better control of the fluidisation conditions inside the gasifier. K-type thermocouples are also placed inside the filter and the catalytic bed. The temperature and the pressure are monitored and controlled by LabVIEW 5.1 software, developed by National Instruments (US).
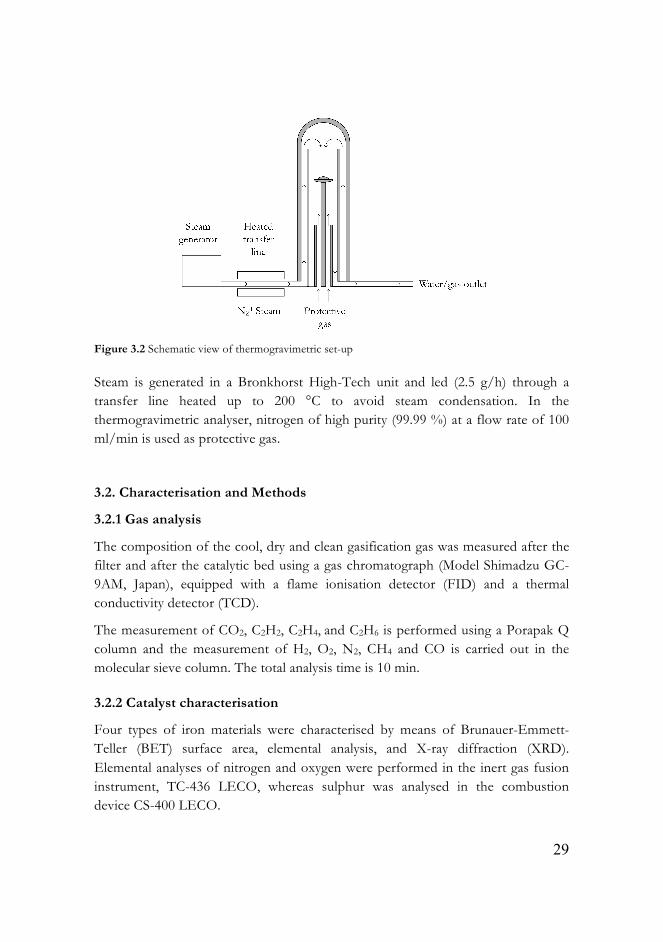
Thermogravimetric experiments were carried out using a Netzsch STA 449 F3 Jupiter apparatus, equipped with an electrical steam furnace with a maximum working temperature of 1 250 °C. A schematic view of the thermogravimetric system is presented in Figure 3.2
29
Figure 3.2 Schematic view of thermogravimetric set-up
Steam is generated in a Bronkhorst High-Tech unit and led (2.5 g/h) through a transfer line heated up to 200 °C to avoid steam condensation. In the thermogravimetric analyser, nitrogen of high purity (99.99 %) at a flow rate of 100 ml/min is used as protective gas.
3.2. Characterisation and Methods
3.2.1 Gas analysis
The composition of the cool, dry and clean gasification gas was measured after the filter and after the catalytic bed using a gas chromatograph (Model Shimadzu GC-9AM, Japan), equipped with a flame ionisation detector (FID) and a thermal conductivity detector (TCD).
The measurement of CO2, C2H2, C2H4, and C2H6 is performed using a Porapak Q column and the measurement of H2, O2, N2, CH4 and CO is carried out in the molecular sieve column. The total analysis time is 10 min.
3.2.2 Catalyst characterisation
Four types of iron materials were characterised by means of Brunauer-Emmett-Teller (BET) surface area, elemental analysis, and X-ray diffraction (XRD). Elemental analyses of nitrogen and oxygen were performed in the inert gas fusion instrument, TC-436 LECO, whereas sulphur was analysed in the combustion device CS-400 LECO.
30
3.2.3 Tar sampling and analysis
The tar sampling and analysis were performed using a solid phase adsorption (SPA) method due to its simplicity, reliability and quickness (see Section 2.3.3)
3.2.4 Filter matter characterisation
After each experiment, when the system had been cooled to room temperature, the solid matter from the filter was carefully gathered and later used for supplementary analysis. A scanning electron microscope (SEM), Zeiss Ultra 55, was used for morphology investigation; thermogravimetric analysis, described in section 3.1, was applied to characterise the physical and chemical structure of the filter matter; and metals in the sample were determined by inductively coupled plasma-atomic spectrometry.
3.3 Materials
3.3.1 Feedstock
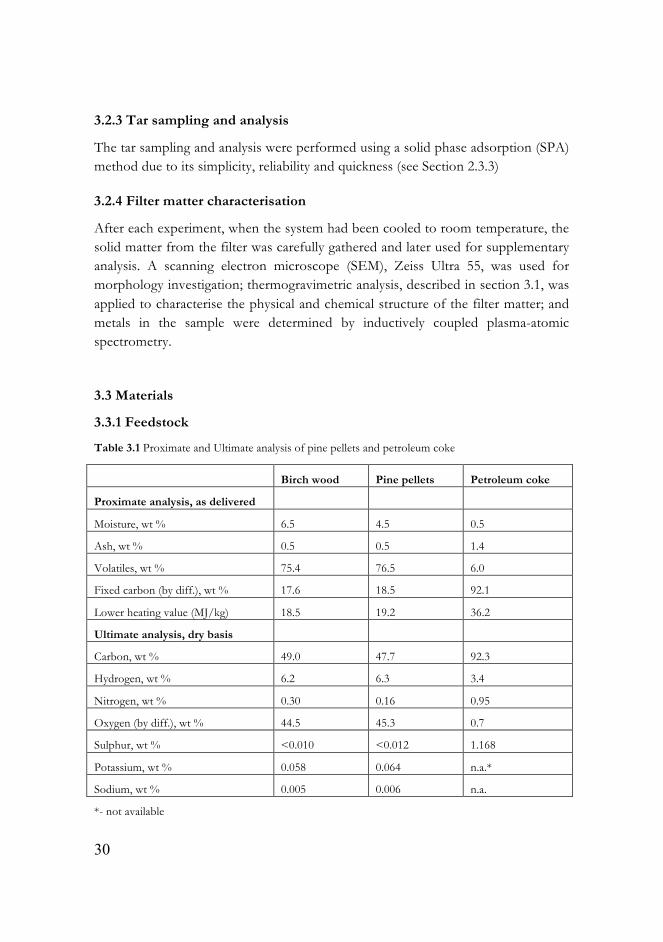
Table 3.1 Proximate and Ultimate analysis of pine pellets and petroleum coke
Birch wood Pine pellets Petroleum coke
Proximate analysis, as delivered
Moisture, wt % 6.5 4.5 0.5
Ash, wt % 0.5 0.5 1.4
Volatiles, wt % 75.4 76.5 6.0
Fixed carbon (by diff.), wt % 17.6 18.5 92.1
Lower heating value (MJ/kg) 18.5 19.2 36.2
Ultimate analysis, dry basis
Carbon, wt % 49.0 47.7 92.3
Hydrogen, wt % 6.2 6.3 3.4
Nitrogen, wt % 0.30 0.16 0.95
Oxygen (by diff.), wt % 44.5 45.3 0.7
Sulphur, wt % <0.010 <0.012 1.168
Potassium, wt % 0.058 0.064 n.a.*
Sodium, wt % 0.005 0.006 n.a.
*- not available
31
Swedish birch wood with a particle size of 1-1.5 mm, pine pellets (1.5-2 mm) and also ground and sieved petroleum coke (1-1.5 mm) provided by Statoil, Norway were used as feedstock for the experiments. The results of ultimate and proximate analyses are listed in Table 3.1.
Pine pellets were used in the study presented in Paper I. Swedish birch was used as feedstock in Papers II and III. Petroleum coke, pine pellets and different blends of them were tested in the research presented in Paper IV.
At a first glance, the petroleum coke seems to have better properties compared to birch and pine pellets, such as higher heating value and higher carbon content. However, petcoke also contains significantly more sulphur.
3.3.2 Bed material
The bed material in the fluidised bed was 350 g α-alumina (aluminium oxide) with a particle size of 63-125 µm and a density of 3 960 kg/m3. Al2O3 was chosen due to its high density, low specific surface area and low porosity. According to the Geldart classification, described in Section 2.2.3, this material belongs to group B resulting in good particle mixing in a fluidised bed.
3.3.3 Iron-based catalysts
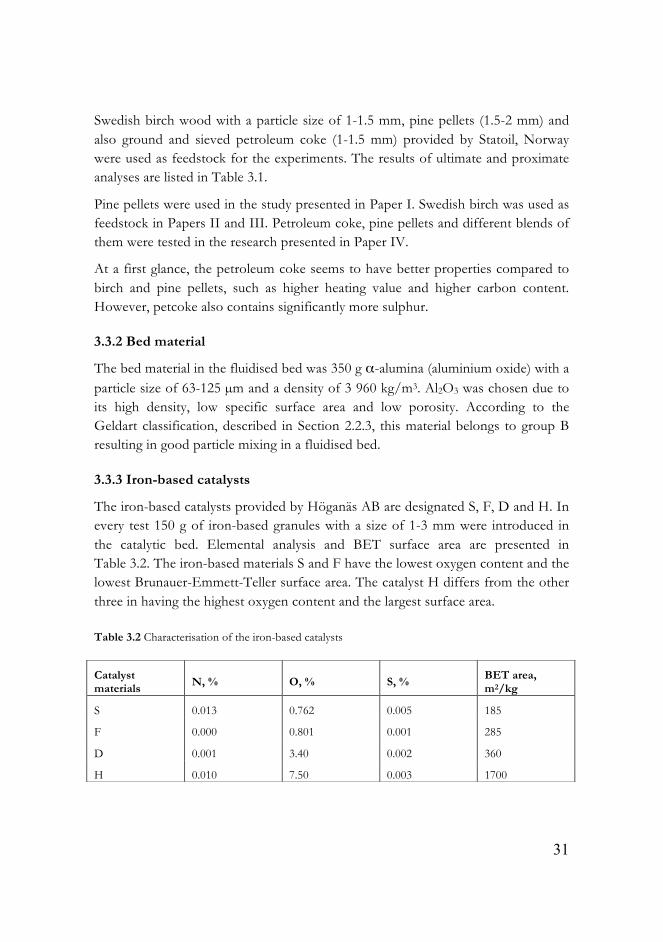
The iron-based catalysts provided by Höganäs AB are designated S, F, D and H. In every test 150 g of iron-based granules with a size of 1-3 mm were introduced in the catalytic bed. Elemental analysis and BET surface area are presented in Table 3.2. The iron-based materials S and F have the lowest oxygen content and the lowest Brunauer-Emmett-Teller surface area. The catalyst H differs from the other three in having the highest oxygen content and the largest surface area.
Table 3.2 Characterisation of the iron-based catalysts
Catalyst materials N, % O, % S, % BET area,
m2/kg
S 0.013 0.762 0.005 185
F 0.000 0.801 0.001 285
D 0.001 3.40 0.002 360
H 0.010 7.50 0.003 1700

32
33
4. EXPERIMENTAL THEORY
Some basics of fluidisation were described in Section 2.2.3. In this chapter the main parameter in the ABFB – gas velocity for different gasification temperatures is calculated. The Ellingham diagram to predict and control the iron materials state is plotted as well.
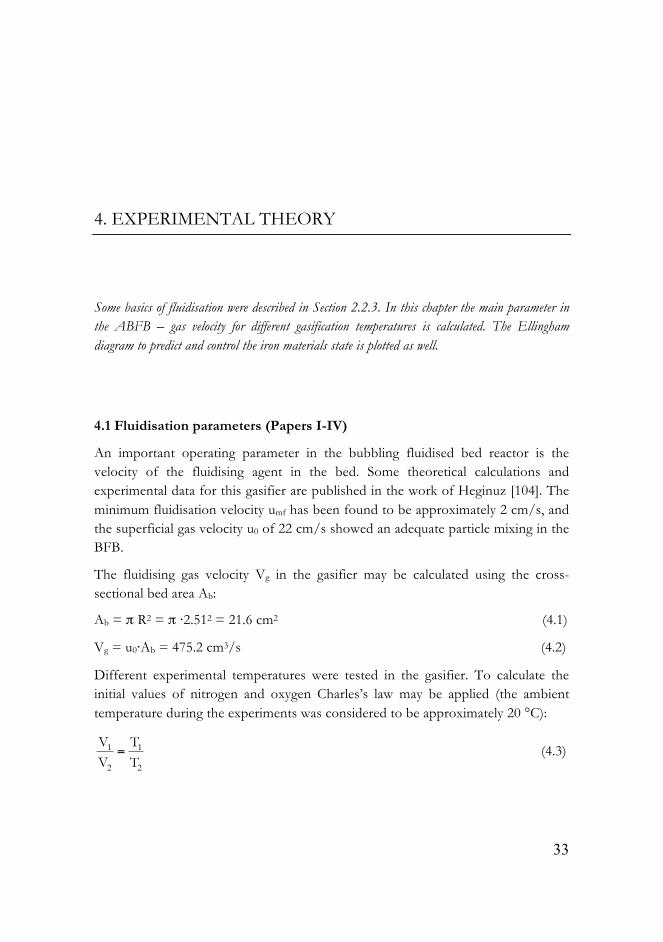
4.1 Fluidisation parameters (Papers I-IV)
An important operating parameter in the bubbling fluidised bed reactor is the velocity of the fluidising agent in the bed. Some theoretical calculations and experimental data for this gasifier are published in the work of Heginuz [104]. The minimum fluidisation velocity umf has been found to be approximately 2 cm/s, and the superficial gas velocity u0 of 22 cm/s showed an adequate particle mixing in the BFB.
The fluidising gas velocity Vg in the gasifier may be calculated using the cross-sectional bed area Ab:
Ab = π R2 = π ⋅2.512 = 21.6 cm2 (4.1)
Vg = u0⋅Ab = 475.2 cm3/s (4.2)
Different experimental temperatures were tested in the gasifier. To calculate the initial values of nitrogen and oxygen Charles’s law may be applied (the ambient temperature during the experiments was considered to be approximately 20 °C):
(4.3)
34
For instance, at the gasification temperature of 800 °C the total volume of nitrogen and oxygen should be:
(4.4)
The oxygen supply was 0.65-0.85 l/min, resulting in an equivalence ratio (lambda) of approximately between 0.15 and 0.25 (see Section 2.2.1).
4.2 Ellingham diagram (Papers II-III)
In metallurgy, an Ellingham diagram (compound stability dependence on temperature) is used to predict the conditions under which an ore may be reduced to its metal state [105]. The same diagrams may be applied in the gasification process when using metallic iron as tar cracking catalyst to control its state.
The Ellingham diagram is based on thermodynamics and is a plot of the Gibbs free energy change (ΔG) versus temperature (equation 4.5)
€
ΔG = ΔH−TΔS = −RTlnK(T) (4.5)
where ΔH - the enthalpy [KJ/mol]
T - absolute temperature [K]
ΔS - entropy [J/mol]
K - chemical equilibrium constant [-]
R - gas constant, 8.314 [J/(K ⋅ mol)]
The values for enthalpy and entropy for different elements and compounds may be found in various textbooks, e.g. in Kubaschewski et al. [106].
Iron-based materials present in metallic form may be oxided by CO2 to different oxides such as wustite (FeO), magnetite (Fe3O4) or hematite (Fe2O3), expressed by the following equations:
Fe (s) + CO2 (g) ↔ FeO (s) + CO (g) (4.6)
3FeO (s) + CO2 (g) ↔ Fe3O4 (s) + CO (g) (4.7)
2Fe3O4 (s) + CO2 (g) ↔ 3Fe2O3 (s) + CO (g) (4.8)
35
In this case, the Gibbs free energy change may be calculated as
€
ΔG = −RTln(PCO
PCO2
) (4.9)
The logarithmic ratio between the partial pressures of carbon monoxide and carbon
dioxide
€
log(PCO
PCO2
) is often called the oxygen potential.
The Bouduard reaction CO2 (g) + C (s) ↔ 2CO (g) (2.4) may be applied to prevent carbon precipitation on the surface of metal catalysts.
The possibility of iron carbide formation is also taken in to account, according to the next equation:
3Fe (s) + 2CO (g) ↔ Fe3C (s) + CO2 (g) (4.10)
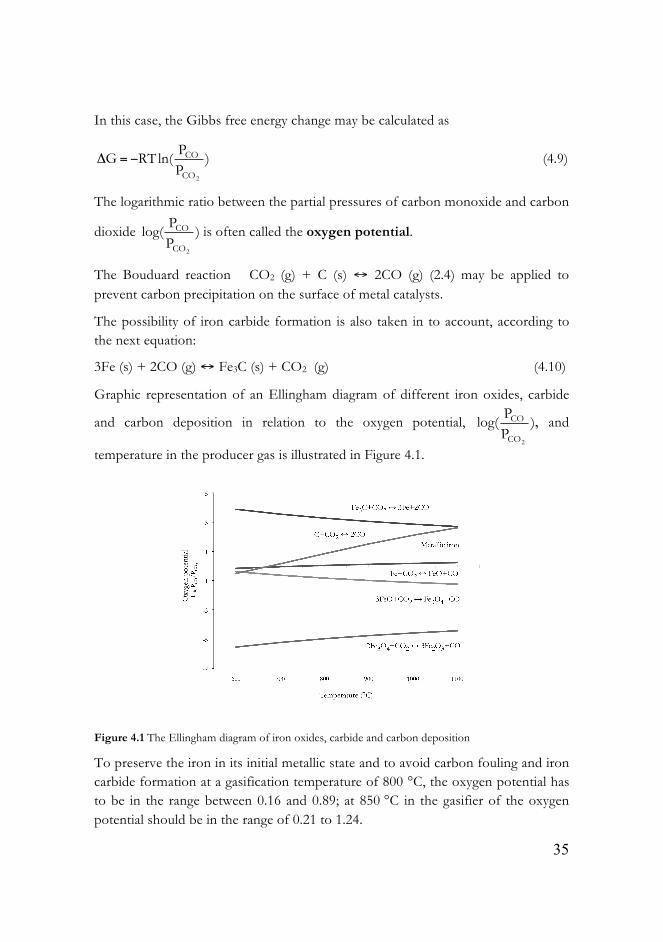
Graphic representation of an Ellingham diagram of different iron oxides, carbide
and carbon deposition in relation to the oxygen potential,
€
log(PCO
PCO2
), and
temperature in the producer gas is illustrated in Figure 4.1.
Figure 4.1 The Ellingham diagram of iron oxides, carbide and carbon deposition
To preserve the iron in its initial metallic state and to avoid carbon fouling and iron carbide formation at a gasification temperature of 800 °C, the oxygen potential has to be in the range between 0.16 and 0.89; at 850 °C in the gasifier of the oxygen potential should be in the range of 0.21 to 1.24.

36
37
5. RESULTS
The main experimental results obtained during the work are presented. The chapter is subdivided into three sections. Tar mitigation in the gasifier, filter and catalytic bed are described in the first two sections. Co-gasification of petroleum coke and biomass is presented in section 5.3.
5.1 Improvements of experimental procedure in the gasification process (Paper I)
In a previous series of tests an unsteady-state process in the gasification system was observed: the tar concentration in the producer gas entering the catalytic bed decreased over time, the gas composition varied and the internal temperature in the filter decreased over time.
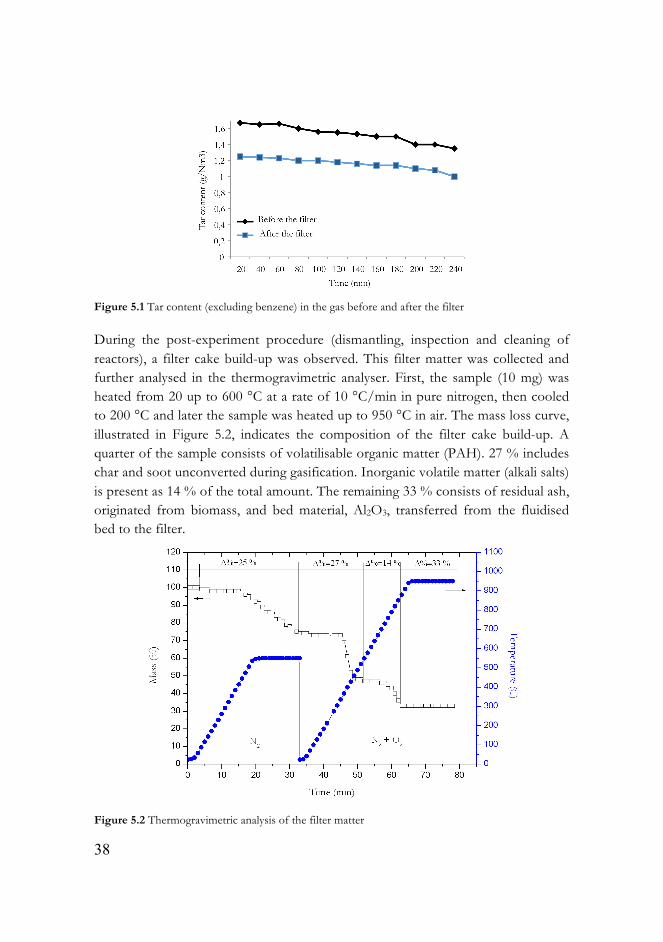
To improve the experimental procedure, a new tar sampling point between the gasifier and the filter was introduced. The gasifier and the filter were operated at 800 °C. Tar values sampled after the gasifier and after the filter during a 4-hour gasification test are presented in Figure 5.1.
According to Figure 5.1, the tar decomposition commences in the gasification reactor itself. The total tar (excluding benzene) decreases by 18 % (from 1.7 to 1.4 g/Nm3) after 240 minutes in the sampling point located directly after the gasifier. The tar concentration in the gas after the filter displays the same trend as after the gasifier: a decrease of 23 % (from 1.3 to 1.0 g/Nm3) over time within the 4-hour span.
A difference of approximately 20-25 % between the total tar before and after the filter, illustrated in Figure 5.1, indicates some reactions occurring in the filter.
38
Figure 5.1 Tar content (excluding benzene) in the gas before and after the filter
During the post-experiment procedure (dismantling, inspection and cleaning of reactors), a filter cake build-up was observed. This filter matter was collected and further analysed in the thermogravimetric analyser. First, the sample (10 mg) was heated from 20 up to 600 °C at a rate of 10 °C/min in pure nitrogen, then cooled to 200 °C and later the sample was heated up to 950 °C in air. The mass loss curve, illustrated in Figure 5.2, indicates the composition of the filter cake build-up. A quarter of the sample consists of volatilisable organic matter (PAH). 27 % includes char and soot unconverted during gasification. Inorganic volatile matter (alkali salts) is present as 14 % of the total amount. The remaining 33 % consists of residual ash, originated from biomass, and bed material, Al2O3, transferred from the fluidised bed to the filter.
Figure 5.2 Thermogravimetric analysis of the filter matter
39
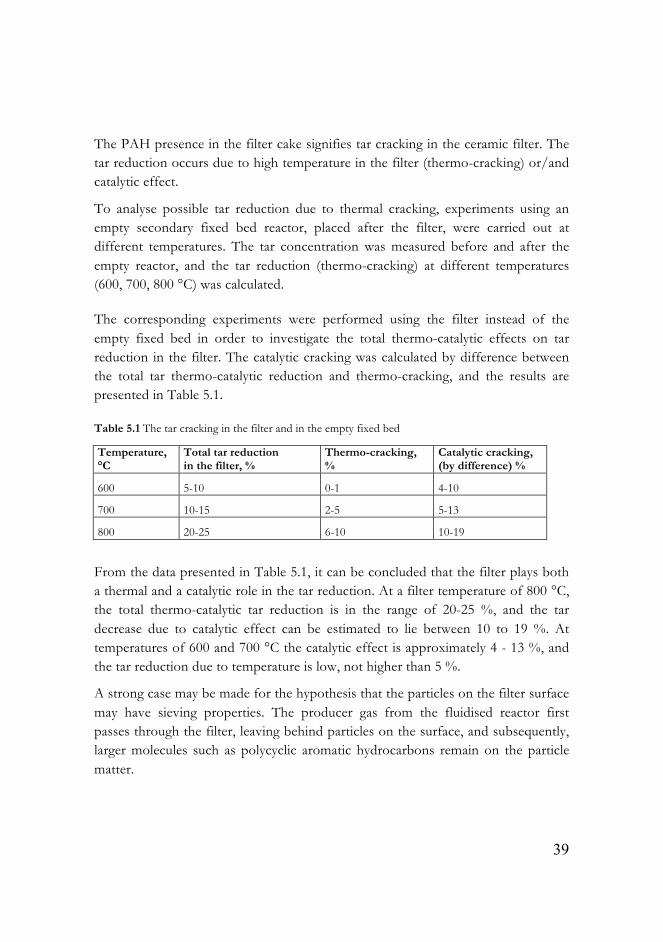
The PAH presence in the filter cake signifies tar cracking in the ceramic filter. The tar reduction occurs due to high temperature in the filter (thermo-cracking) or/and catalytic effect.
To analyse possible tar reduction due to thermal cracking, experiments using an empty secondary fixed bed reactor, placed after the filter, were carried out at different temperatures. The tar concentration was measured before and after the empty reactor, and the tar reduction (thermo-cracking) at different temperatures (600, 700, 800 °C) was calculated.
The corresponding experiments were performed using the filter instead of the empty fixed bed in order to investigate the total thermo-catalytic effects on tar reduction in the filter. The catalytic cracking was calculated by difference between the total tar thermo-catalytic reduction and thermo-cracking, and the results are presented in Table 5.1.
Table 5.1 The tar cracking in the filter and in the empty fixed bed
Temperature, °C
Total tar reduction in the filter, %
Thermo-cracking, %
Catalytic cracking, (by difference) %
600 5-10 0-1 4-10
700 10-15 2-5 5-13
800 20-25 6-10 10-19
From the data presented in Table 5.1, it can be concluded that the filter plays both a thermal and a catalytic role in the tar reduction. At a filter temperature of 800 °C, the total thermo-catalytic tar reduction is in the range of 20-25 %, and the tar decrease due to catalytic effect can be estimated to lie between 10 to 19 %. At temperatures of 600 and 700 °C the catalytic effect is approximately 4 - 13 %, and the tar reduction due to temperature is low, not higher than 5 %.
A strong case may be made for the hypothesis that the particles on the filter surface may have sieving properties. The producer gas from the fluidised reactor first passes through the filter, leaving behind particles on the surface, and subsequently, larger molecules such as polycyclic aromatic hydrocarbons remain on the particle matter.
40
5.2 Iron-based materials as tar breakdown catalysts (Papers II & III)
In this study, two series of experiments were carried out at the gasification temperatures of 850 and 800 °C. Iron-based granules were tested for tar breakdown in the producer gas, and the temperature in the downstream catalytic bed was afterwards lowered in 50 °C intervals, starting at 850 °C and ending at 700 °C. For easier perception the two series are indicated as series A and B:
Series A – experiments conducted at 850 °C in the gasifier
Series B – experiments conducted at gasification temperatures of 800 °C
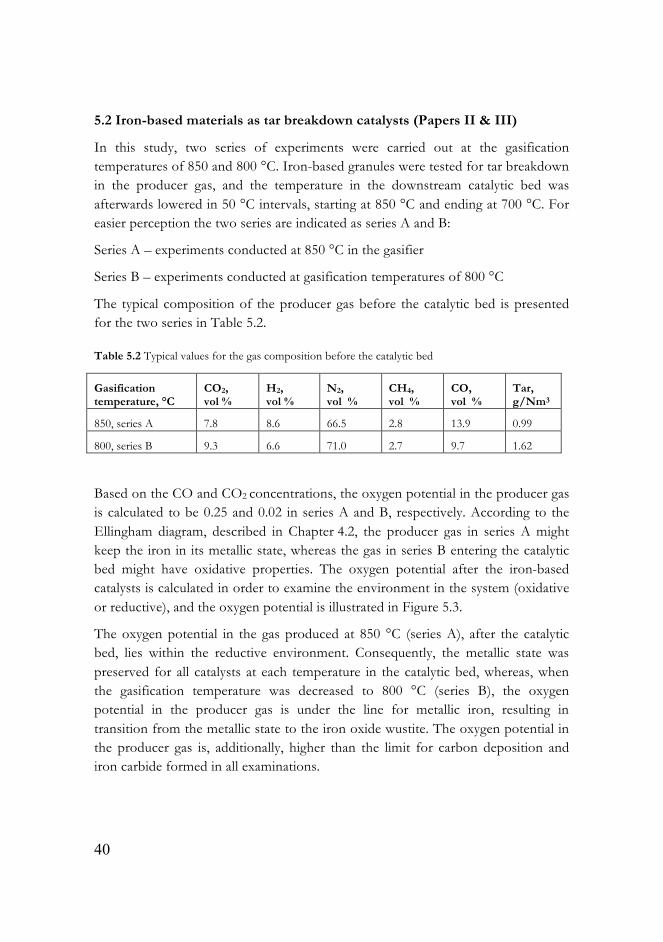
The typical composition of the producer gas before the catalytic bed is presented for the two series in Table 5.2.
Table 5.2 Typical values for the gas composition before the catalytic bed
Gasification temperature, °C
CO2, vol %
H2, vol %
N2, vol %
CH4, vol %
CO, vol %
Tar, g/Nm3
850, series A 7.8 8.6 66.5 2.8 13.9 0.99
800, series B 9.3 6.6 71.0 2.7 9.7 1.62
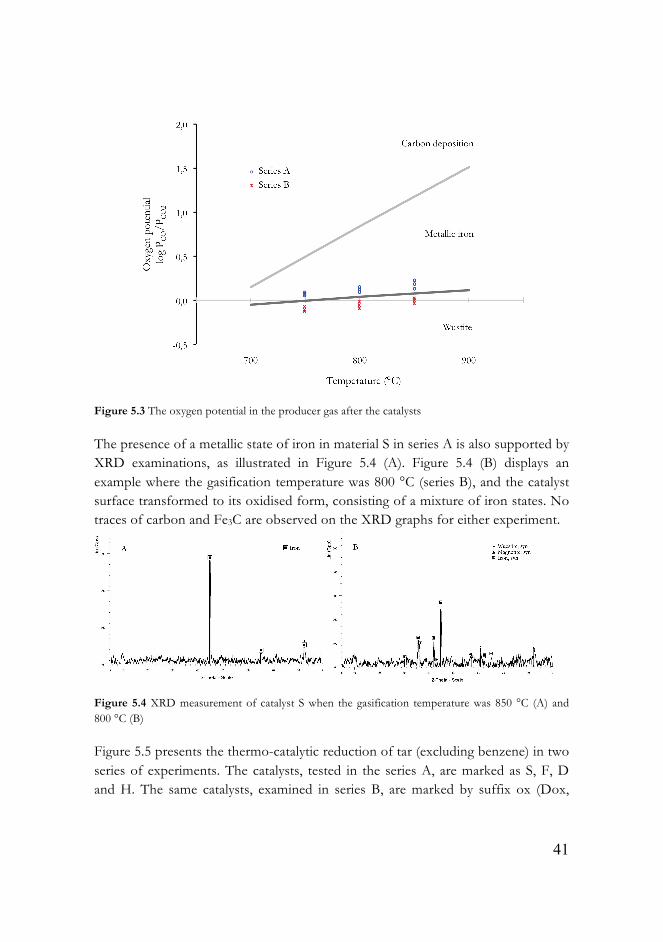
Based on the CO and CO2 concentrations, the oxygen potential in the producer gas is calculated to be 0.25 and 0.02 in series A and B, respectively. According to the Ellingham diagram, described in Chapter 4.2, the producer gas in series A might keep the iron in its metallic state, whereas the gas in series B entering the catalytic bed might have oxidative properties. The oxygen potential after the iron-based catalysts is calculated in order to examine the environment in the system (oxidative or reductive), and the oxygen potential is illustrated in Figure 5.3.
The oxygen potential in the gas produced at 850 °C (series A), after the catalytic bed, lies within the reductive environment. Consequently, the metallic state was preserved for all catalysts at each temperature in the catalytic bed, whereas, when the gasification temperature was decreased to 800 °C (series B), the oxygen potential in the producer gas is under the line for metallic iron, resulting in transition from the metallic state to the iron oxide wustite. The oxygen potential in the producer gas is, additionally, higher than the limit for carbon deposition and iron carbide formed in all examinations.
41
Figure 5.3 The oxygen potential in the producer gas after the catalysts
The presence of a metallic state of iron in material S in series A is also supported by XRD examinations, as illustrated in Figure 5.4 (A). Figure 5.4 (B) displays an example where the gasification temperature was 800 °C (series B), and the catalyst surface transformed to its oxidised form, consisting of a mixture of iron states. No traces of carbon and Fe3C are observed on the XRD graphs for either experiment.
Figure 5.4 XRD measurement of catalyst S when the gasification temperature was 850 °C (A) and 800 °C (B)
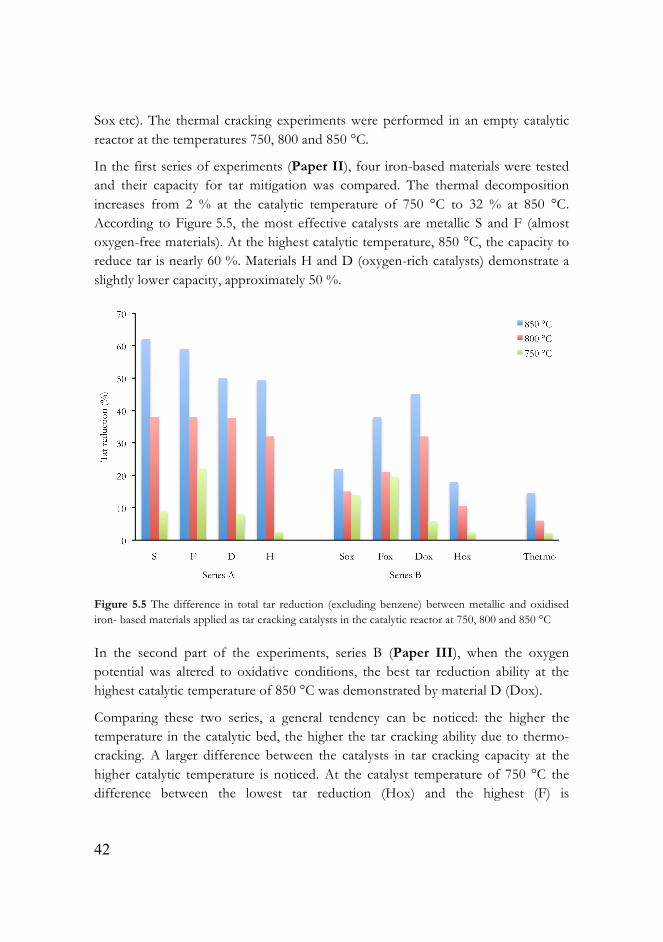
Figure 5.5 presents the thermo-catalytic reduction of tar (excluding benzene) in two series of experiments. The catalysts, tested in the series A, are marked as S, F, D and H. The same catalysts, examined in series B, are marked by suffix ox (Dox,
42
Sox etc). The thermal cracking experiments were performed in an empty catalytic reactor at the temperatures 750, 800 and 850 °C.
In the first series of experiments (Paper II), four iron-based materials were tested and their capacity for tar mitigation was compared. The thermal decomposition increases from 2 % at the catalytic temperature of 750 °C to 32 % at 850 °C. According to Figure 5.5, the most effective catalysts are metallic S and F (almost oxygen-free materials). At the highest catalytic temperature, 850 °C, the capacity to reduce tar is nearly 60 %. Materials H and D (oxygen-rich catalysts) demonstrate a slightly lower capacity, approximately 50 %.
Figure 5.5 The difference in total tar reduction (excluding benzene) between metallic and oxidised iron- based materials applied as tar cracking catalysts in the catalytic reactor at 750, 800 and 850 °C
In the second part of the experiments, series B (Paper III), when the oxygen potential was altered to oxidative conditions, the best tar reduction ability at the highest catalytic temperature of 850 °C was demonstrated by material D (Dox).
Comparing these two series, a general tendency can be noticed: the higher the temperature in the catalytic bed, the higher the tar cracking ability due to thermo- cracking. A larger difference between the catalysts in tar cracking capacity at the higher catalytic temperature is noticed. At the catalyst temperature of 750 °C the difference between the lowest tar reduction (Hox) and the highest (F) is
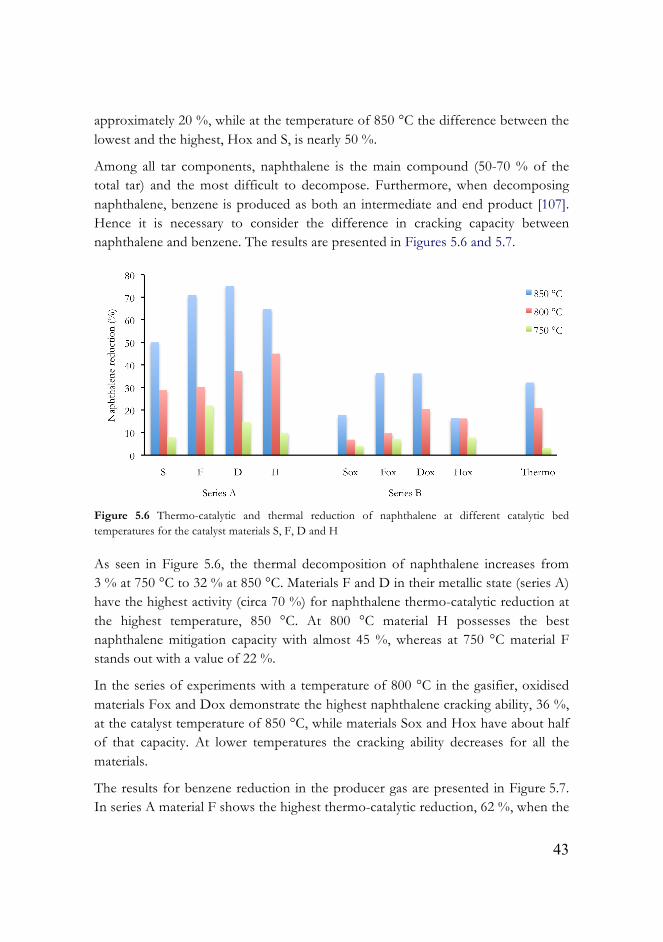
43
approximately 20 %, while at the temperature of 850 °C the difference between the lowest and the highest, Hox and S, is nearly 50 %.
Among all tar components, naphthalene is the main compound (50-70 % of the total tar) and the most difficult to decompose. Furthermore, when decomposing naphthalene, benzene is produced as both an intermediate and end product [107]. Hence it is necessary to consider the difference in cracking capacity between naphthalene and benzene. The results are presented in Figures 5.6 and 5.7.
Figure 5.6 Thermo-catalytic and thermal reduction of naphthalene at different catalytic bed temperatures for the catalyst materials S, F, D and H
As seen in Figure 5.6, the thermal decomposition of naphthalene increases from 3 % at 750 °C to 32 % at 850 °C. Materials F and D in their metallic state (series A) have the highest activity (circa 70 %) for naphthalene thermo-catalytic reduction at the highest temperature, 850 °C. At 800 °C material H possesses the best naphthalene mitigation capacity with almost 45 %, whereas at 750 °C material F stands out with a value of 22 %.
In the series of experiments with a temperature of 800 °C in the gasifier, oxidised materials Fox and Dox demonstrate the highest naphthalene cracking ability, 36 %, at the catalyst temperature of 850 °C, while materials Sox and Hox have about half of that capacity. At lower temperatures the cracking ability decreases for all the materials.
The results for benzene reduction in the producer gas are presented in Figure 5.7. In series A material F shows the highest thermo-catalytic reduction, 62 %, when the
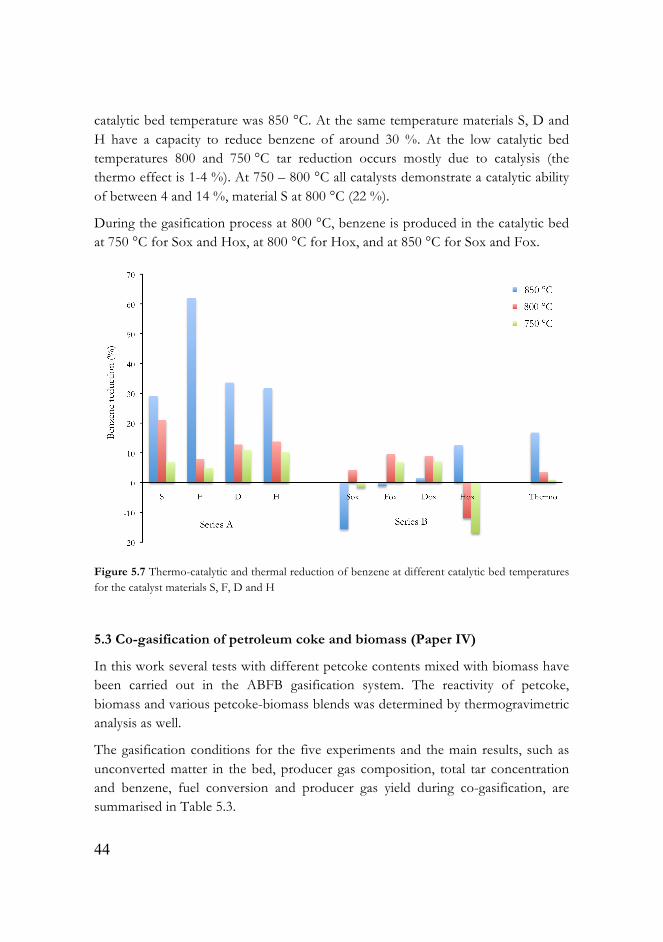
44
catalytic bed temperature was 850 °C. At the same temperature materials S, D and H have a capacity to reduce benzene of around 30 %. At the low catalytic bed temperatures 800 and 750 °C tar reduction occurs mostly due to catalysis (the thermo effect is 1-4 %). At 750 – 800 °C all catalysts demonstrate a catalytic ability of between 4 and 14 %, material S at 800 °C (22 %).
During the gasification process at 800 °C, benzene is produced in the catalytic bed at 750 °C for Sox and Hox, at 800 °C for Hox, and at 850 °C for Sox and Fox.
Figure 5.7 Thermo-catalytic and thermal reduction of benzene at different catalytic bed temperatures for the catalyst materials S, F, D and H
5.3 Co-gasification of petroleum coke and biomass (Paper IV)
In this work several tests with different petcoke contents mixed with biomass have been carried out in the ABFB gasification system. The reactivity of petcoke, biomass and various petcoke-biomass blends was determined by thermogravimetric analysis as well.
The gasification conditions for the five experiments and the main results, such as unconverted matter in the bed, producer gas composition, total tar concentration and benzene, fuel conversion and producer gas yield during co-gasification, are summarised in Table 5.3.
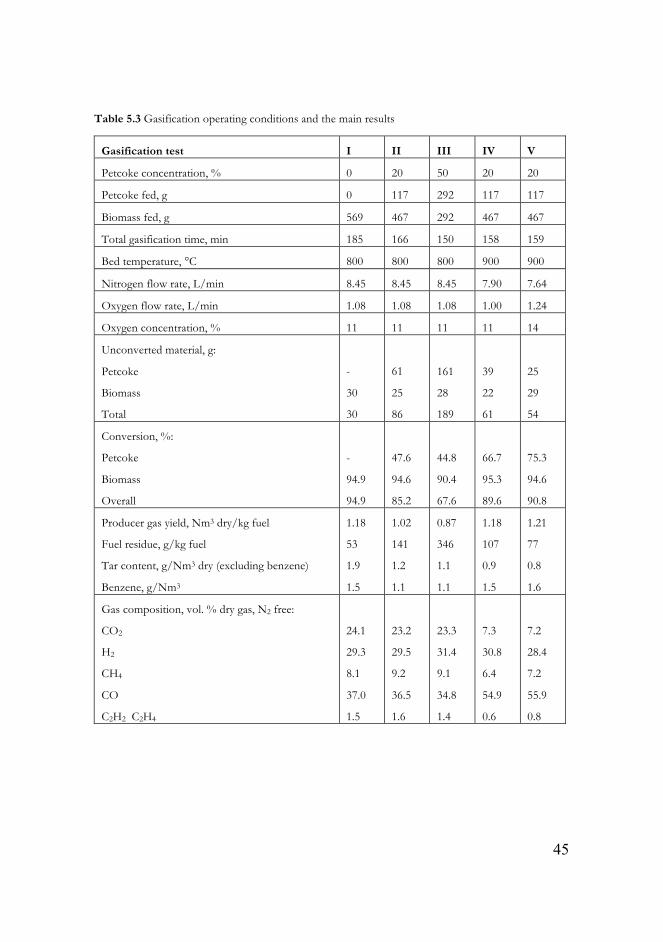
45
Table 5.3 Gasification operating conditions and the main results
Gasification test I II III IV V
Petcoke concentration, % 0 20 50 20 20
Petcoke fed, g 0 117 292 117 117
Biomass fed, g 569 467 292 467 467
Total gasification time, min 185 166 150 158 159
Bed temperature, °C 800 800 800 900 900
Nitrogen flow rate, L/min 8.45 8.45 8.45 7.90 7.64
Oxygen flow rate, L/min 1.08 1.08 1.08 1.00 1.24
Oxygen concentration, % 11 11 11 11 14
Unconverted material, g:
Petcoke
Biomass
Total
-
30
30
61
25
86
161
28
189
39
22
61
25
29
54
Conversion, %:
Petcoke
Biomass
Overall
-
94.9
94.9
47.6
94.6
85.2
44.8
90.4
67.6
66.7
95.3
89.6
75.3
94.6
90.8
Producer gas yield, Nm3 dry/kg fuel
Fuel residue, g/kg fuel
Tar content, g/Nm3 dry (excluding benzene)
Benzene, g/Nm3
1.18
53
1.9
1.5
1.02
141
1.2
1.1
0.87
346
1.1
1.1
1.18
107
0.9
1.5
1.21
77
0.8
1.6
Gas composition, vol. % dry gas, N2 free:
CO2
H2
CH4
CO
C2H2 C2H4
24.1
29.3
8.1
37.0
1.5
23.2
29.5
9.2
36.5
1.6
23.3
31.4
9.1
34.8
1.4
7.3
30.8
6.4
54.9
0.6
7.2
28.4
7.2
55.9
0.8
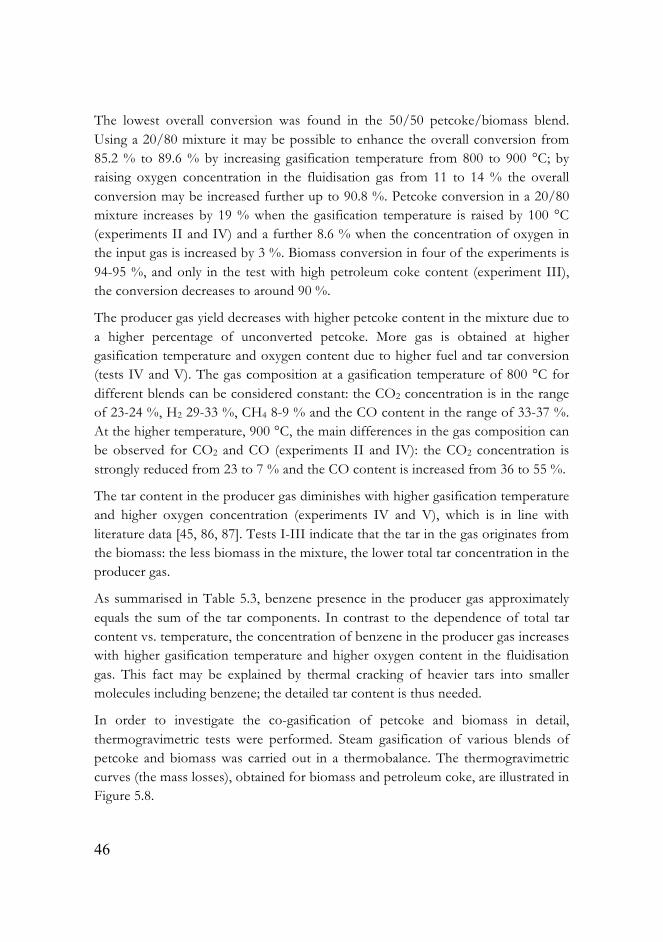
46
The lowest overall conversion was found in the 50/50 petcoke/biomass blend. Using a 20/80 mixture it may be possible to enhance the overall conversion from 85.2 % to 89.6 % by increasing gasification temperature from 800 to 900 °C; by raising oxygen concentration in the fluidisation gas from 11 to 14 % the overall conversion may be increased further up to 90.8 %. Petcoke conversion in a 20/80 mixture increases by 19 % when the gasification temperature is raised by 100 °C (experiments II and IV) and a further 8.6 % when the concentration of oxygen in the input gas is increased by 3 %. Biomass conversion in four of the experiments is 94-95 %, and only in the test with high petroleum coke content (experiment III), the conversion decreases to around 90 %.
The producer gas yield decreases with higher petcoke content in the mixture due to a higher percentage of unconverted petcoke. More gas is obtained at higher gasification temperature and oxygen content due to higher fuel and tar conversion (tests IV and V). The gas composition at a gasification temperature of 800 °C for different blends can be considered constant: the CO2 concentration is in the range of 23-24 %, H2 29-33 %, CH4 8-9 % and the CO content in the range of 33-37 %. At the higher temperature, 900 °C, the main differences in the gas composition can be observed for CO2 and CO (experiments II and IV): the CO2 concentration is strongly reduced from 23 to 7 % and the CO content is increased from 36 to 55 %.
The tar content in the producer gas diminishes with higher gasification temperature and higher oxygen concentration (experiments IV and V), which is in line with literature data [45, 86, 87]. Tests I-III indicate that the tar in the gas originates from the biomass: the less biomass in the mixture, the lower total tar concentration in the producer gas.
As summarised in Table 5.3, benzene presence in the producer gas approximately equals the sum of the tar components. In contrast to the dependence of total tar content vs. temperature, the concentration of benzene in the producer gas increases with higher gasification temperature and higher oxygen content in the fluidisation gas. This fact may be explained by thermal cracking of heavier tars into smaller molecules including benzene; the detailed tar content is thus needed.
In order to investigate the co-gasification of petcoke and biomass in detail, thermogravimetric tests were performed. Steam gasification of various blends of petcoke and biomass was carried out in a thermobalance. The thermogravimetric curves (the mass losses), obtained for biomass and petroleum coke, are illustrated in Figure 5.8.
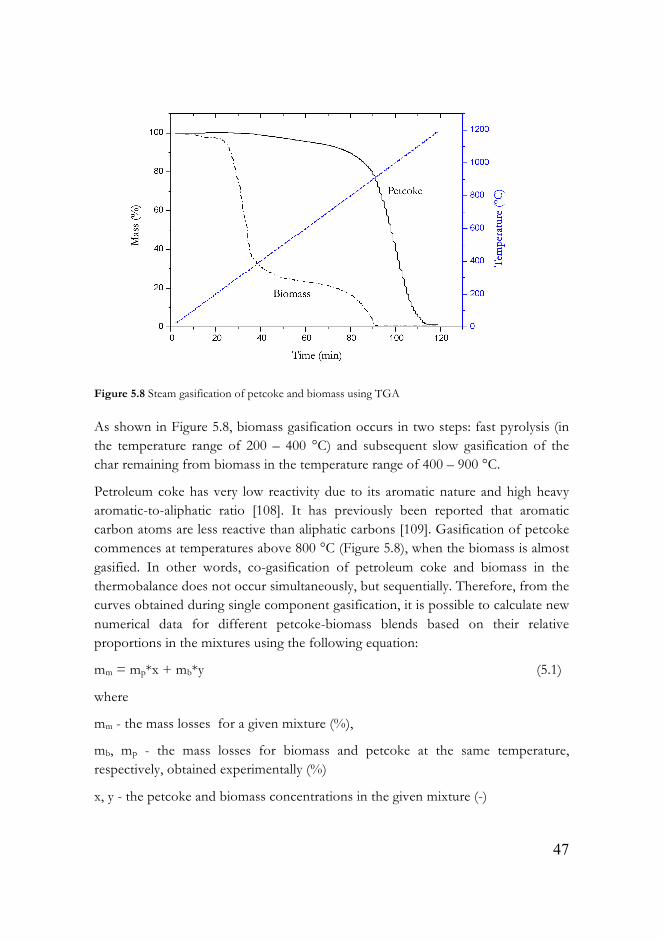
47
Figure 5.8 Steam gasification of petcoke and biomass using TGA
As shown in Figure 5.8, biomass gasification occurs in two steps: fast pyrolysis (in the temperature range of 200 – 400 °C) and subsequent slow gasification of the char remaining from biomass in the temperature range of 400 – 900 °C.
Petroleum coke has very low reactivity due to its aromatic nature and high heavy aromatic-to-aliphatic ratio [108]. It has previously been reported that aromatic carbon atoms are less reactive than aliphatic carbons [109]. Gasification of petcoke commences at temperatures above 800 °C (Figure 5.8), when the biomass is almost gasified. In other words, co-gasification of petroleum coke and biomass in the thermobalance does not occur simultaneously, but sequentially. Therefore, from the curves obtained during single component gasification, it is possible to calculate new numerical data for different petcoke-biomass blends based on their relative proportions in the mixtures using the following equation:
mm = mp*x + mb*y (5.1)
where mm - the mass losses for a given mixture (%),
mb, mp - the mass losses for biomass and petcoke at the same temperature,
respectively, obtained experimentally (%)
x, y - the petcoke and biomass concentrations in the given mixture (-)
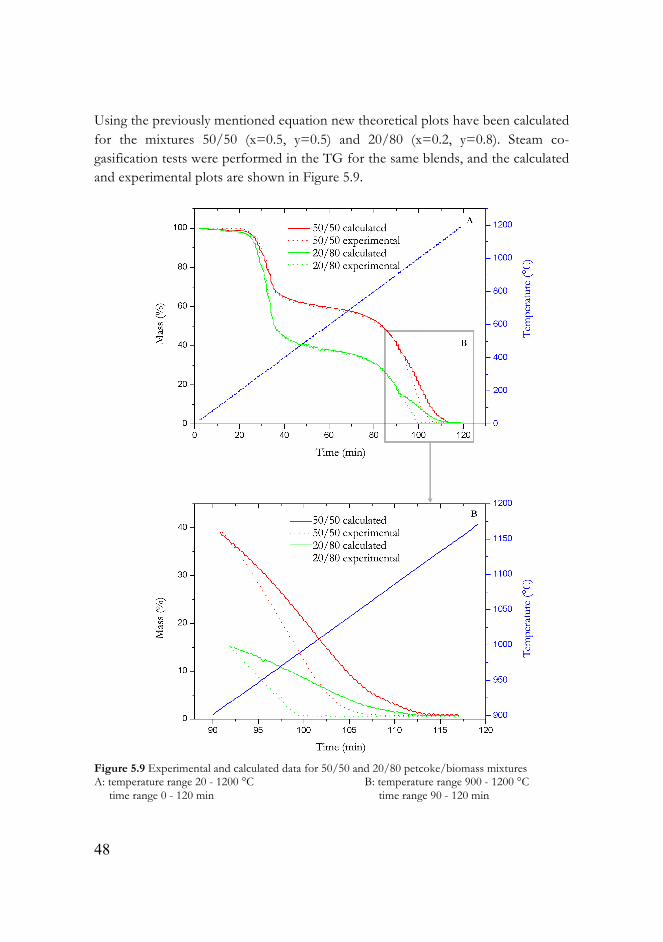
48
Using the previously mentioned equation new theoretical plots have been calculated for the mixtures 50/50 (x=0.5, y=0.5) and 20/80 (x=0.2, y=0.8). Steam co-gasification tests were performed in the TG for the same blends, and the calculated and experimental plots are shown in Figure 5.9.
Figure 5.9 Experimental and calculated data for 50/50 and 20/80 petcoke/biomass mixtures A: temperature range 20 - 1200 °C B: temperature range 900 - 1200 °C time range 0 - 120 min time range 90 - 120 min
49
Figure 5.9 A illustrates an excellent correlation between calculated and experimental data for the mixtures (50/50, 20/80) up to 900 °C (90 minutes). After 90 minutes a difference between the theoretical and experimental values may be noticed (Figure 5.9 B): gasification of the 50/50 blend ends 6 minutes earlier than calculated, for the 20/80 mixture the difference between experimental and theoretical gasification completion is 13 minutes. In Figure 5.9 this is summarised, the more biomass in the mixture, the higher the difference between calculated and experimental values, the less time/lower temperature needed to complete the co-gasification process. In other words, the more ash in the mixture with petcoke, the faster complete gasification is achieved.

50
51
6. DISCUSSION
In this chapter tar mitigation, starting in the gasifier, continued in the candle filter and terminated in the downstream catalytic tar cracker bed, is explored. The roles of biomass ash and char during gasification of biomass and co-gasification of petroleum coke and biomass as well iron-based materials for tar cracking are discussed.
6.1 Char and ash influence on tar concentration (Papers I & IV)
A gasification process is a complex procedure, and several different factors influence the gas quality and quantity. Except for well-known initial parameters affecting the producer gas quality, such as feedstock type and gasification parameters (gasifier type, oxidising media, temperature, pressure, etc.), there are other variables during the process that make gas quality inconsistent over time.
In section 5.1 the tar reduction in the fluidised bed reactor during a gasification test is described (Paper I). A possible explanation for this phenomenon may be char and ash accumulation in the bed of the gasifier. After each gasification test, char and ash in the range of 1-2 % of the total biomass, fed to the gasifier, was found in the reactor bed together with the sand. It may, however, be difficult to quantify the effects of char and ash inside the reactor on tar concentration in the present study, due to the continuous char formation and its simultaneous consumption by oxidation. Also important to consider is that part of the ash and char, produced from biomass during the thermochemical process, moves to the filter. Nevertheless, both ash and char probably play an important role in the observed tar mitigation in the gas produced by biomass gasification.
Several studies have been conducted [88, 110] in regards to the char and ash influence on tar content in the gas, produced by pyrolysis or gasification. Naphthalene mitigation in a bench-scale tube flow reactor over sand and char,
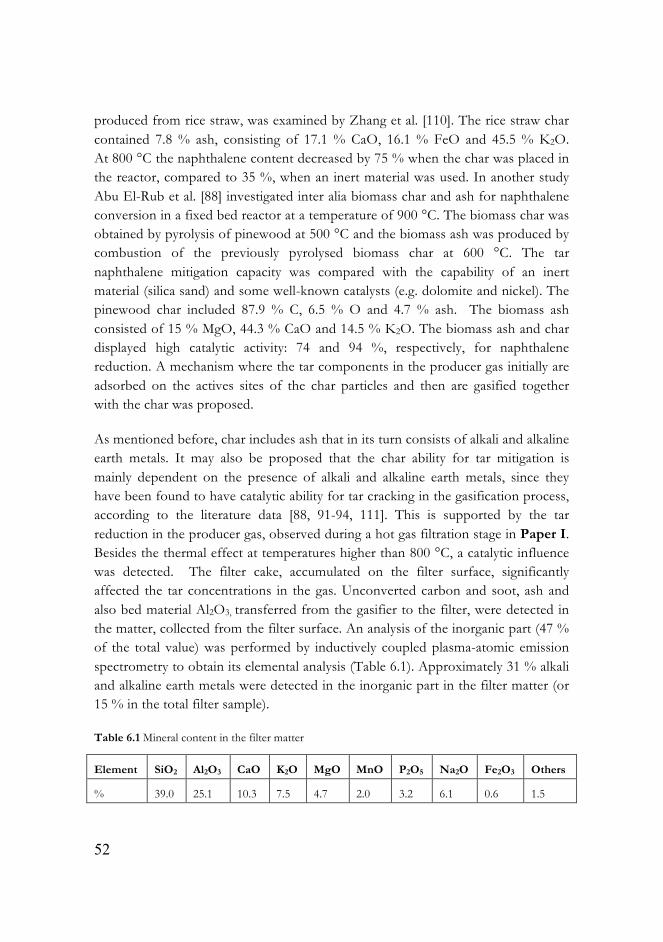
52
produced from rice straw, was examined by Zhang et al. [110]. The rice straw char contained 7.8 % ash, consisting of 17.1 % CaO, 16.1 % FeO and 45.5 % K2O. At 800 °C the naphthalene content decreased by 75 % when the char was placed in the reactor, compared to 35 %, when an inert material was used. In another study Abu El-Rub et al. [88] investigated inter alia biomass char and ash for naphthalene conversion in a fixed bed reactor at a temperature of 900 °C. The biomass char was obtained by pyrolysis of pinewood at 500 °C and the biomass ash was produced by combustion of the previously pyrolysed biomass char at 600 °C. The tar naphthalene mitigation capacity was compared with the capability of an inert material (silica sand) and some well-known catalysts (e.g. dolomite and nickel). The pinewood char included 87.9 % C, 6.5 % O and 4.7 % ash. The biomass ash consisted of 15 % MgO, 44.3 % CaO and 14.5 % K2O. The biomass ash and char displayed high catalytic activity: 74 and 94 %, respectively, for naphthalene reduction. A mechanism where the tar components in the producer gas initially are adsorbed on the actives sites of the char particles and then are gasified together with the char was proposed.
As mentioned before, char includes ash that in its turn consists of alkali and alkaline earth metals. It may also be proposed that the char ability for tar mitigation is mainly dependent on the presence of alkali and alkaline earth metals, since they have been found to have catalytic ability for tar cracking in the gasification process, according to the literature data [88, 91-94, 111]. This is supported by the tar reduction in the producer gas, observed during a hot gas filtration stage in Paper I. Besides the thermal effect at temperatures higher than 800 °C, a catalytic influence was detected. The filter cake, accumulated on the filter surface, significantly affected the tar concentrations in the gas. Unconverted carbon and soot, ash and also bed material Al2O3, transferred from the gasifier to the filter, were detected in the matter, collected from the filter surface. An analysis of the inorganic part (47 % of the total value) was performed by inductively coupled plasma-atomic emission spectrometry to obtain its elemental analysis (Table 6.1). Approximately 31 % alkali and alkaline earth metals were detected in the inorganic part in the filter matter (or 15 % in the total filter sample).
Table 6.1 Mineral content in the filter matter
Element SiO2 Al2O3 CaO K2O MgO MnO P2O5 Na2O Fe2O3 Others
% 39.0 25.1 10.3 7.5 4.7 2.0 3.2 6.1 0.6 1.5
53
The catalytic property of biomass ash/alkali and alkaline metals content was further identified and investigated in steam co-gasification of petroleum coke and biomass in Paper IV. According to the experimental results and the activation energy, calculated using an Arrhenius equation, a synergetic effect between petroleum coke and biomass was concluded. Petroleum coke mixed with biomass showed remarkably higher reactivity than pure petcoke most likely due to the higher ash content, using biomass. The activation energy Ea was calculated to be 121.5 kJ/mol for pure petcoke steam gasification, whereas for the 50/50 and the 20/80 mixtures lower values of 96.3 and 83.5 kJ/mol, respectively, were observed. This catalytic effect of the mineral content in the carbonaceous material on the petroleum coke reactivity has previously also been noted in a work by Harris et al. [112].
The new knowledge, gained in the present work, facilitates an increased understanding of tar variability in a system, providing with possible explanations for tar inconsistencies in the producer gas, as reported by others in the literature [47, 113 and 114]. For instance, Rapagna et al. [113] investigated a ceramic filter placed in a fluidised gasifier freeboard, operated at a temperature of circa 810 °C. Almond shells with a particle size of 1 mm were used as feedstock, and olivine was used as the bed material. Two series of experiments were conducted: an Al2O3-based ceramic filter candle was tested during 6 hours, and the same filter with an additional integrated catalyst was examined during three consecutive tests, with an overall gasification time of 20 hours. In the last series, a consistent decrease of total tar during three experiments was observed: in the beginning of the experiments the tar concentration was 0.24 g/Nm3, after 8 hours tar concentration was reduced by 37 %, and after the following 8 hours tar content was down to 0.12 g/Nm3. The char and ash accumulation in the bed and/or filter cake formation may be an explanation for the tar mitigation, observed in the study of Rapagna et al.
Other examples of tar inconsistencies are, for instance, illustrated in the studies of Devi et al. [47] and Yu et al. [114]. In both studies, different catalysts for tar mitigation and several temperatures in the secondary catalytic bed were examined. The general trend was as expected: the lower the temperature in the catalytic bed, the higher the tar content in the gas after the catalytic bed. However, at some temperatures the tar concentrations deviated from the linear behaviour. There was, however, not enough information about the experimental procedure with regards to temperature and whether it was changed during the tests, or if the experiments were performed separately from each other. The tar inconsistencies may be explained by possible mitigation, occurring in the reactors before the secondary catalytic bed, for instance, in the gasifier or the filter.
54
6.2 Iron-based materials for tar mitigation (Papers II & III)
Iron-based materials, used for tar cracking in gas, produced from biomass via thermochemical processes may, in general, be divided in two groups: iron, included in natural catalysts, such as dolomite and olivine, and materials, obtained from iron-making processes, e.g. iron pellets. Many studies have examined the first group [66, 69, 83-85], and little research exists on materials, predominantly consisting of iron. In papers II and III the tar removal ability of four iron-based materials, provided by Höganäs AB, in a secondary bed reactor was investigated. The granules were in their metallic form, and the main differences between the materials were the oxygen content and specific BET area.
Some general trends, in conformity with literature, were observed. The total tar cracking capability for all catalysts, increased at higher catalytic temperatures [43, 86, 87, 88]. The reactions due to tar thermal cracking were proportional to the reaction temperatures: the higher temperature in the catalytic bed, the higher the thermal effect. At a temperature in the empty catalytic bed of 850 °C the tar mitigation due to thermal cracking was almost 15 %, whereas at 750 °C only 2 %.
Furthermore, the catalysts in their metallic states (gasification temperature 850 °C), in general, exhibited a better tar cracking capacity than their corresponding oxides (gasification temperature 800 °C). This is in agreement with the studies by Nordgreen et al. [86, 87], demonstrating that iron oxides have lower tar cracking capacity than metallic iron. The metallic catalysts S and F at 850 °C in the catalytic bed had a total tar cracking ability of more than 60 %, whereas the oxidised catalyst H (Hox) had a capacity of 18 % at the same catalytic temperature.
In the present work metallic iron with relative low concentration of oxygen (maximum 7.5 %) was used. A lower activity in tar decomposition was observed for the materials with higher oxygen content, i.e. materials H and D with oxygen concentrations of 3.4 and 7.5 %, respectively, at the gasification temperature of 850 °C when all materials were kept in their initial state, compared to materials S and F with oxygen content of 0.8 % (Paper II).
The results in total tar reduction for the oxides were more irregular, and therefore difficult to interpret (Paper III). The irregularity in results was, seemingly, due to formation of different mixtures of oxides for the various iron-based materials. An example was the unexpected relatively high tar cracking capacity for material Dox. At the temperatures of 800 and 850 °C Dox possessed the highest total tar reduction ability of the four catalysts. An explanation may be related to the high
55
oxygen concentration in the materials after their oxidation, where the oxygen may be highly mobile facilitating oxidation of the tar at the surface.
The iron-based materials F and D in their initial metallic state had twice the naphthalene cracking capacity of the corresponding oxidised states. The catalysts H and D, in contrast, with the lowest total tar reduction capacity, demonstrated the highest naphthalene decomposition at the temperatures of 800 – 850 °C (Paper II). A clear systematic picture was not feasible due to the lack of comprehensible results. However, in view of the study by Devi et al. [107], where naphthalene breakdown over a pre-treated olivine catalyst was investigated, the naphthalene decomposition was proposed to occur through a complex reaction network with several side-reactions, forming for instance, indene, toluene, acenaphthalene, crysene and other PAHs. Even though high naphthalene decomposition was observed, the total tar reduction may be low due to the formation of other tar compounds from naphthalene.
Similarly, a catalyst may reduce the total tar concentration, but still contains considerable amount of aromatics in form of benzene. A result of increased and also alternating benzene content was observed in Paper III. Also in this case, the observed result may be explained in the context of naphthalene decomposition, producing benzene both an intermediate and as an end product [107]. Nevertheless, an incomplete tar cracking ending up in large amount of benzene may be explained either by different tar cracking capacities at different applied temperatures, different initial tar compositions or a too short operational time. Since benzene, generally, is not considered as a tar, it has profound effect on downstream compounds and in most cases need to be removed before the gas utilisation.

56
57
7. CONCLUSIONS
Biomass has the potential to meet energy demands in the future. Thermochemical conversion of biomass by means of gasification enables replacement of fossil fuel, reducing CO2 emissions and increasing fuel flexibility. Among the different gasification technologies available at present, the fluidised bed technology shows the best balance between the advantages and disadvantages compared to, e.g. fixed bed gasifiers.
Although gasification is a mature technology, it has yet to be fully commercialised. Tar elimination is one of the largest technical barriers to overcome. In the major part of the work, presented in this thesis, the challenge of tar destruction has been addressed. A 5 kWt laboratory scale, atmospheric bubbling fluidised bed reactor was used to perform all gasification experiments. In addition, a thermo gravimetrical analyser was used for some kinetics investigations. The following conclusions may be drawn from the results achieved in the thesis:
• The operating conditions were found to have large impact on the tar concentration in the gasification system. Understanding the gasification procedure behaviour facilitated a deeper insight of tar variability in the producer gas. The experimental procedure was improved to obtain more reliable experimental data. The results in this study led to elucidation of some ambiguous results found in the reference literature.
• Different iron-based materials were tested for tar mitigation in the gas. The gasification conditions were found to play an important role in the catalyst state. By changing the temperature in the gasifier from 850 to 800 °C, the iron-based materials changed their state from the initial metallic to oxidised. The results show that materials kept in their metallic states possess a greater capacity for decomposing tars in the producer gas in comparison to the oxidised forms. Some differences in tar reduction
58
between different types of iron granules were observed, possibly due to oxygen content and specific area.
• Co-gasification tests of petroleum coke and biomass in different proportions were examined in the ABFB and the TGA. A synergetic effect between biomass and petroleum coke was observed and proven by kinetic calculation. The effect was explained by alkali and alkaline-earth metals present in the biomass ash, concluding that co-gasification of petroleum coke may be a feasible option.
59
8. FUTURE WORK
Over the duration of the research investigations, a deeper knowledge about the gasification system behaviour was gained. Based on the results and the experience achieved from this work, some recommendations for future research may be given:
• Due to unstable tar concentration in the producer gas during the gasification process, quick and simple tar sampling and analysing methods are preferable for more accurate results. In laboratory-scale equipment short-time off-line methods, such as solid phase adsorption or solid phase micro extraction, may be applied. In a real industrial process on-line methods are to be preferred.
• The current gasification system allows further investigations to be carried out on the separate reactors. For instance, examination of different types of feedstock and bed materials in the gasifier, manufacture and analysis of catalysts in the secondary bed for tar removal and gas upgrading. The redevelopment of the current gas cleaning step by integration of a tar eliminating catalyst, for example iron, to the high-temperature filter candle, would in the future reduce the new plant investment costs and simplify a flow sheet of the biomass gasification process.
• When analysing the research that has been carried out during the past last decades, no significant improvements of biomass gasification are to be noticed. The past and present investigations focus on solving individual problems occurring during the process, for example, removal of tar, sulphur, alkali metals or chlorine. When woody biomass (“clean” and “easy”) is used as feedstock, the only (but sizeable) challenge to overcome is tar formation. In case of the agricultural waste gasification, the additional challenge of ash is introduced and etc.

60
In the future, waste gasification may become an important alternative, portending complex problems during gasification in currently used reactors. For this reason, a revolutionary new gasification technique that focuses on production of not only tar-free, but higher quality energy-rich gas, may be a solution for full commercialisation of this process.
The work in this thesis sheds light on the understanding of the gasification process and initiated further ideas for the development of a new gasification technology.
61
ACKNOWLEDGEMENTS
It is time to put an end to this PhD journey. The completion of this work would not be possible without guidance and support of organisations, companies and individuals.
Firstly, the Swedish Energy Agency (Energimyndigheten), Göteborg Energy and Höganäs AB are gratefully acknowledged for financial support. I would like to thank my supervisors, both present and former, Professor Klas Engvall and Associate Professor Krister Sjöström for giving me the opportunity to work in the “Gasification group”, for their guidance and support.
I would like to express my gratitude to all my colleagues that work or have worked at Chemical Technology, KTH and friends. Special thanks to Dr. Thomas Nordgreen for introducing me to the “lilla” gasifier, being a nice officemate, teaching me Swedish and friendship; Dr. Mozhgan Ahmadi Svensson for being my next nice officemate, friend and for giving me support when I needed it; Claes Brage for introducing me to the famous SPA tar sampling and analysis procedure; Christen Rosén, Mikael Lundgren, Lic. Eng. Lars-Peter Wiktorsson and Associate Professor Truls Liliedahl for technical support and advice. I would like to thank my Italian colleague and dear friend Dr. Mariarosa Brundu for struggling together with me with the gasifier, breathing tar and listening to “104 comma 7” in the lab. Thanks also to Professor Per Alvfors and Dr. Christina Hörnell for reviewing my thesis and improving the linguistic quality.
Îãðрîìíîå ñïàñèáî ìîèì ðрîäèòåëÿì Íèíå Íåìàíîâîé (Àêñåíîâîé) è Ëåîíèäó Íåìàíîâó, à òàêæå ìîåé äîðрîãîé è ëþюáèìîé ñåñòðрåíêå Ëþюáå çà âåðрó â ìåíÿ, ïîääåðрæêó è ëþюáîâü.
Till slut skulle jag vilja tacka Mario, för all tid, hjälp, stöd och tålamod. Nu börjar ett nytt liv!
Stockholm, September 2014 - Vera Nemanova

62

63
REFERENCES
[1] Key world energy statistics 2013, International Energy Agency (IEA), Accessed: September 2014
[2] Swedish Energy Agency, Energy in Sweden 2013, Eskilstuna, Sweden, Accessed: September 2014
[3] G. Berndes, M. Hoogwijk, R. van den Broek, The contribution of biomass in the future global energy supply: a review of 17 studies, Biomass & Bioenergy 25 (2003) 1 – 28
[4] D. O. Hall, F. Rosillo-Calle, R. H. Williams, J. Woods, Biomass for energy: supply prospects, Renewable energy - sources for fuels and electricity (1993) 593-651
[5] A. Kumar, D. D. Jones, M. A. Hanna, Thermochemical biomass gasification: A review of the current status of the technology, Energies 2 (2003) 556-581
[6] M. Balat, G. Ayar, Biomass energy in the world, use of biomass and potential trends, Energy Sources 27 (2005) 931–940
[7] A. Demirbas, Ed. Biofuels: Securing the Planet’s future energy needs. Springer London (2009)
[8] S. V. Vassilev, D. Baxter, L. K. Andersen, C. G. Vassileva, An overview of the chemical composition of biomass, Fuel 89 (2010) 913–933
[9] A. Limayem, S. C. Ricke, Lignocellulosic biomass for bioethanol production: Current perspectives, potential issues and future prospects, Progress in Energy and Combustion Science 38 (2012) 449-467
[10] ECN. BIODAT – Biomass Database, http://biodat.eu Accessed: September 2014
[11] Y. Lin, S. Tanaka, Ethanol fermentation from biomass resources: current state and prospects, Applied Microbiology and Biotechnology 69 (2006) 627–642
64
[12] Z. Khan, A. Dwivedi, Fermentation of biomass for production of ethanol: a review, Universal Journal of Environmental Research and Technology 3 (2013) 1-13
[13] J. H. Park, S. H. Kim, H. D. Park, D. J. Lim, J. J. Yoon, Feasibility of anaerobic digestion from bioethanol fermentation residue, Bioresource Technology 141 (2013) 177-183
[14] P. McKendry, Energy production from biomass (part 2): conversion technologies, Bioresource Technology 83 (2002) 47-54
[15] M. Balat, Potential alternatives to edible oils for biodiesel production – a review of current work, Energy Conversion and Management 52 (2011) 1479-1492
[16] A. V. Bridgwater, Catalysis in thermal biomass conversion, Applied Catalysis A: General 116 (1994) 5-47
[17] A. V. Bridgwater, Review of fast pyrolysis of biomass and product upgrading, Biomass & Bioenergy 38 (2012) 68-94
[18] B. Piriou, G. Vaitilingom, B. Veyssiere, B. Cuq, X. Rouau, Potential direct use of solid biomass in internal combustion engines, Progress in Energy and Combustion Science 39 (2013) 169-188
[19] R. Zanzi, K. Sjöström, E. Björnbom, Rapid pyrolysis of agricultural residues at high temperature, Biomass & Bioenergy 23 (2002) 357-366
[20] S. Czernik, A. V. Bridgwater, Overview of applications of biomass fast pyrolysis oil, Energy & Fuels 18 (2004) 590-598
[21] A. V. Bridgwater Renewable fuels and chemicals by thermal processing of biomass, Chemical Engineering Journal 91 (2003) 87-102
[22] A. Bauen, Biomass gasification, Reference Module in Earth Systems and Environmental Sciences, from Encyclopaedia of Energy (2004) 213-221
[23] M. Brower, Cool Energy: Renewable solutions to environmental problems, 4th printing (1998)
[24] H. E. Stassen, Small-scale biomass gasifiers for heat and power: A global review (1995)
[25] Low-Tech Magazine http://www.lowtechmagazine.com/2010/01/wood-gas-cars.html Accessed: September 2014
[26] Värnamoverket – En demonstrationsanläggning för el- och värmeproduktion ur biobränsle, baserat på trycksatt förgasning, Ed. K. Ståhl, Berlings Skogs, Trelleborg, Sweden (2000)
65
[27] J. Corella, J-M Toledo, G. Molina Biomass gasification with pure steam in fluidised bed: 12 variables that affect the effectiveness of the biomass gasifier, International Journal of Oil, Gas and Coal Technology 1 (2008) 194-207
[28] A.V. Bridgwater, The technical and economic feasibility of biomass gasification for power generation, Fuel 74 (1995) 631-653
[29] Wood gas as engine fuel, FAO Forestry paper 72, Food and Agriculture Organization of the United Nations (1986)
[30] R. Warnecke, Gasification of biomass: comparison of fixed bed and fluidized bed gasifier, Biomass & Bioenergy 18 (2000) 489-497
[31] M. Puig-Arnavat, J. C. Bruno, A. Coronas, Review and analysis of biomass gasification models, Renewable and Sustainable Energy Reviews 14 (2010) 2841–2851
[32] K. Maniatis, Progress in biomass gasification: an overview, Report, European Commission (2001)
[33] H. Watanabe, M. Otaka, Numerical simulation of coal gasification in entrained flow coal gasifier, Fuel 85 (2006) 1935-1943
[34] J. Zhou, Q. Chen, H. Zhao, X. Cao, Q. Mei, Z. Luo, K. Cen, Biomass-oxygen gasification in a high-temperature entrained-flow gasifier, Biotenology Advances 27 (2009) 606-611
[35] D. Kunii, O. Levenspiel, Fluidization Engineering, second edition, Butterworth-Heinemann, Boston (1991) Chapter 1
[36] R. G. Holdich, Fundamentals of particle technology (2002) Chapter 7
[37] R. K. Niven, Physical insight into the Ergun and Wen & Yu equations for fluid flow in packed and fluidised beds, Chemical Engineering Science 57 (2002) 527 – 534
[38] D. Geldart, Gas fluidization technology, John Wiley & Sons, Chichester (1986)
[39] P. Hasler, T. Nussbaumer, Gas cleaning for IC engine application from fixed bed biomass gasification, Biomass & Bioenergy 16 (19999) 385-395
[40] H. A. M. Knoef, Ed. Handbook Biomass Gasification, Biomass Technology Group, The Netherlands (2005)
[41] Thersites www.thersites.nl, Accessed: September 2014
[42] C. F. Palma, Modelling of tar formation and evolution for biomass gasification: A review, Applied Energy 111 (2013) 129-141
[43] T. A. Milne, R. J. Evans, Biomass gasifier “tars”: their nature, formation and conversion, Report No. NREL/TP-570-25357, NREL: Golden, CO (1998)
66
[44] K. Maniatis, A. A. C. M. Beenackers, Tar Protocols. IEA Bioenergy Gasification Task, Biomass & Bioenergy 18 (2000) 1–4
[45] H. Yu, Z. Zhang, Z. Li, D. Chen, Characteristics of tar formation during cellulose, hemicellulose and lignin gasification, Fuel 118 (2014) 250-256
[46] D. C. Elliott, Relation of reaction time and temperature to chemical composition of pyrolysis oils, Pyrolysis oils from biomass, Edited by E. J. Soltes and T. A. Milne (1998)
[47] L. Devi, K. J. Ptasinski, F. J. J. G. Janssen, S. V. B. van Paase, P. C. A. Bergman, J. H. A. Kiel. Catalytic decomposition of biomass tars: use of dolomite and untreated olivine Renewable Energy 30 (2005) 565–587
[48] C. Brage, Q. Yu, G. Chen, K. Sjöström, Use of amino phase adsorbent for biomass tar sampling and separation, Fuel 76 (1997) 137–142
[49] S. Karellas, J. Karl, Analysis of the product gas from biomass gasification by means of laser spectroscopy, Optics and Lasers in Engineering 45 (2007) 935 – 946
[50] R. Sun, N. Zobel, Y. Neubauer, C. Cardenas Chavez, F. Behrendt, Analysis of gas-phase polycyclic aromatic hydrocarbon mixtures by laser-induced fluorescence, Optics and Lasers in Engineering 48 (2010) 1231–1237
[51] C. Baumhakl, S. Karellas, Tar analysis from biomass gasification by means of online fluorescence spectroscopy, Optics and Lasers in Engineering 49 (2011) 885–891
[52] C. G. Blanco, J. S. Canga, A. Dominguez, M. J. Iglesias, M. D. Guillen, Flame ionization detection relative response factors of some polycyclic aromatic compounds: Determination of the main components of the coal tar pitch volatile fraction, Journal of Chromatography A 607 (1992) 295-302
[53] M. Ahmadi, C. Brage, K. Sjöström, K. Engvall, H. Knoef, B. van de Beld, Development of an on-line tar measurement method based on photo ionization technique, Catalysis Today 176 (2011) 250–252
[54] M. Ahmadi, H. Knoef, B. van de Beld, T Liliedahl, K. Engvall, Development of a PID based on-line tar measurement method – Proof of concept, Fuel 113 (2013) 113–121
[55] L. Devi, K. J. Ptasinski, F. J. J. G. Janssen, A review of the primary measures for tar elimination in biomass gasification processes, Biomass & Bioenergy 24 (2003) 125-140
[56] M. Nacken, L. Ma, S. Heidenreich, G. V. Baron, Performance of a catalytically activated ceramic hot gas filter for catalytic tar removal from biomass gasification gas, Applied Catalysis B: Environmental 88 (2007) 292-298
67
[57] S. Rapagna, K. Gallucci, M. Di Marcello, P. U. Foscolo, M. Nacken, S. Heidenreich, In situ catalytic ceramic candle filtration for tar reforming and particulate abatement in a fluidized-bed biomass gasifier, Energy & Fuels 23 (2009) 3804-3809
[58] D. Sutton, B. Kelleher, J. R. H. Ross, Review of literature on catalysts for biomass gasification, Fuel Processing Technology 73 (2001) 155-173
[59] Z. Abu El-Rub, E. A. Bramer, G. Brem, Review of catalysts for tar elimination in biomass gasification processes, Industrial & Engineering Chemistry Research 43 (2004) 6911-6919
[60] C. Ekström, N. Lindman, R. Pettersson, Catalytic conversion of tars, carbon black and methane from pyrolysis/gasification of biomass, Fundamentals of thermochemical biomass conversion, R.P. Overend, T. A. Milne, L. K. Mudge, (Eds), Elsevier Applied Science Publishers Ltd, London (1985) 601-618
[61] K. Sjöström, G. Taralas, L. Liinanki, Sala dolomite-catalysed conversion of tar from biomass pyrolysis. Research in Thermochemical Biomass Conversion, A. V. Bridgwater, J. L. Kuester, Eds., Elsevier Applied Science: London (1988) 974-986
[62] H. Aldén, B-G. Espenäs, E. Rensfelt, Conversion of tar in pyrolysis gas from wood using a fixed dolomite bed, Research in Thermochemical Biomass Conversion, A. V. Bridgwater, J. L. Kuester, Eds., Elsevier Applied Science, London (1988) 987-1001
[63] J. Corella, J. Herguido, J. Gonzalez-Saiz, J. F. Alday, J. L. Rodriguez-Trujillo, Fluidised bed steam gasification of biomass with dolomite and with a commercial FCC catalyst, Research in Thermochemical Biomass Conversion, A. V. Bridgwater, J. L. Kuester, Eds., Elsevier Applied Science, London (1988) 754-765
[64] J. Delgado, M. P. Aznar, J. Corella, Calcined dolomite, magnesite, and calcite for cleaning hot gas from a fluidized bed biomass gasifier with steam: Life and usefulness, Industrial & Engineering Chemistry Research 35 (1996) 3637-3643
[65] A. Olivares, M. P. Aznar, M. A. Caballero, J. Gil, E. Frances, J. Corella, Biomass gasification: Produced gas upgrading by in-bed use of dolomite, Industrial & Engineering Chemistry Research 36 (1997) 5220-5226
[66] A. Orio, J. Corella, I. Narvaez, Performance of different dolomites on hot raw gas cleaning from biomass gasification with air, Industrial & Engineering Chemistry Research 36 (1997) 3800-3808
[67] J. Gil, A. Caballero, J. A. Martin, M. P. Aznar, J. Corella, Biomass gasification with air in a fluidised bed: Effect of the in-bed use of dolomite under different operation conditions, Industrial & Engineering Chemistry Research 38 (1999) 4226-4235

68
[68] J. Corella, M. P. Aznar, J. Gil, A. Caballero, Biomass gasification in fluidised bed: Where to locate the dolomite to improve gasification, Energy & Fuels 13 (1999) 1122-1127
[69] P. Simell, J. K. Leppälahti, J. B. Bredenberg, Catalytic purification of tarry fuel gas with carbonate rocks and ferrous materials, Fuel 71 (1992) 689-694
[70] P. Simell, E. Kurkela, P. Stålberg, J. Hepola, Catalytic hot gas cleaning of gasification gas, Catalysis Today 27 (1996) 55-62
[71] J. R. Rostrup-Nielsen, J. B. Hansen, Chapter 4 – Steam Reforming for Fuel Cells, Fuel Cells (2011) 49-71
[72] P. Corte, C. Lacoste, J. P. Traverse, Gasification and catalytic conversion of biomass by flash pyrolysis, Journal of Analytical and Applied Pyrolysis 7 (1985) 323-335
[73] K. Higashiyama, A. Tomita, Y. Tamai, Action of nickel catalyst during steam gasification of bituminous brown coals, Fuel 64 (1985) 1157-1162
[74] C. R. F. Lund, Staged carbon gasification with nickel catalysts, Carbon 25 (1987) 337-341
[75] E. G. Baker, L. K. Mudge, M. D. Brown, Steam gasification of biomass with nickel secondary catalysts, Industrial & Engineering Chemistry Research 26 (1987) 1335-1339
[76] J. Ozaki, M. Takei, K. Takakusagi, N. Takahashi, Carbon deposition on a Ni/Al2O3 catalyst in low-temperature gasification using C6 hydrocarbons as surrogate biomass tar, Fuel Processing Technology 102 (2012) 30-34
[77] J. Hepola, P. Simell, Sulphur poisoning of nickel-based hot gas cleaning catalysts in synthetic gasification gas: I. Effect of different process parameters, Applied Catalysis B: Environmental 14 (1997) 287-303
[78] J. Hepola, P. Simell, Sulphur poisoning of nickel-based hot gas cleaning catalysts in synthetic gasification gas: II. Chemisorption of hydrogen sulphide, Applied Catalysis B: Environmental 14 (1997) 305-321
[79] C. Courson, L. Udron, D. Swierczynski, C. Petit, A. Kiennemann, Hydrogen production from biomass gasification on nickel catalysts. Tests for dry reforming of methane, Catalysis Today 76 (202) 75-86
[80] C. H. Bartholomew, R. J. Farrauto, Fundamentals of industrial catalytic process, Second Edition (2006)
[81] R. Cypres, C. Soudan - Moinet, Pyrolysis of coal and iron oxides mixture 1. Influence of iron oxides on the pyrolysis of coal, Fuel 59 (1980) 48-54

69
[82] R. Cypres, C. Soudan – Moinet, Pyrolysis of coal and iron oxides mixture 2. Reduction of iron oxides, Fuel 60 (1981) 33-39
[83] G. Hu, S. Xu, S. Li, C. Xiao, S. Liu, Steam gasification of apricot stones with olivine and dolomite as downstream catalysts, Fuel Processing Technology 87 (2006) 375-382
[84] S. Rapagna, N. Jand, A. Kiennemann, P. U. Foscolo, Steam-gasification of biomass in a fluidised-bed of olivine particles, Biomass & Bioenergy 19 (2000) 187- 197
[85] L. Devi, M. Craje, P. Thune, K. J. A. Ptasinski, F. J. J. G. Janssen, Olivine as tar removal catalyst for biomass gasifiers: Catalyst characterisation, Applied Catalysis A: 294 (2005) 68-79
[86] T. Nordgreen, T. Liliedahl, K. Sjöström, Elemental iron as a tar breakdown catalyst in conjunction with atmospheric fluidised bed gasification of biomass: a thermodynamic study, Energy & Fuels 20 (2006) 890-895
[87] T. Nordgreen, T. Liliedahl, K. Sjöström, Metallic iron as a tar breakdown catalyst related to atmospheric, fluidised bed gasification of biomass, Fuel 85 (2006) 689-694
[88] Z. Abu El-Rub, E. A. Bramer, G. Brem, Experimental comparison of biomass chars with other catalysts for tar reduction, Fuel 87 (2008) 2243–2252
[89] S. K. Chembukulam, A. S. Dandge, N. L. K. Rao, K. Seshagiri, R. Vaidyeswaran, Smokeless fuels from carbonized sawdust, Industrial & Engineering Chemistry. Product Research and Development 20 (1981) 714-719
[90] K. S. Seshardi, A. Shamsi, Effect of temperature, pressure, and carrier gas on the cracking of coal tar over a char-dolomite mixure and calcined dolomite in a fixed bed reactor, Industrial & Engineering Chemistry Research 37 (1998) 3830-3837
[91] L. K. Mudge, E. G. Baker, D. H. Mitchell, M. D. Brown, Catalytic steam gasification of biomass for methanol and methane production, Journal of Solar Energy Engineering 107 (1985) 88-92
[92] J. M. Encinar, F.J. Beltran, A. Ramiro, J. F. Gonzalez, Pyrolysis/gasification of agricultural residues by carbon dioxide in the presence of different additives: influence of variables, Fuel Processing Technology 55 (1998) 219–233
[93] S. C. Gebhard, D. Wang, R. P. Overend, M. A. Paisley, Catalytic conditioning of synthesis gas produced by biomass gasification, Biomass & Bioenergy 7 (1994) 307-313
[94] W. B. Hauserman, High-yield hydrogen production by catalytic gasification of coal, International Journal of Hydrogen Energy 19 (1994) 413-419

70
[95] X. Liu, Z. Zhou, Q. Hu, Z. Dai, F. Wang, Experimental study on co-gasification of coal liquefaction residue and petroleum coke, Energy & Fuels 25 (2011) 3377–3381
[96] J. H. Zou, Z. J. Zhou, F. C. Wang, W. Zhang, Z. H. Dai, H. F. Liu, Z. H. Yu, Modelling reaction kinetics of petroleum coke gasification with CO2, Chemical Engineering and Processing 46 (2007) 630-636
[97] J. H. Zou, B. Yang, K. Gong, S. Wu, Z. J. Zhou, F. C. Wang, Z. H. Yu, Effect of mechanochemical treatment on petroleum coke – CO2 gasification, Fuel 87 (2008) 622-627
[98] Petroleum coke production, Market and Forecast in the CIS, April 2012, 17th edition (revised), report
[99] A. Bayram, A Muezzinoglu, R. Seyfioglu, Presence and control of polycyclic aromatic hydrocarbons in petroleum coke drying and calcination plants, Fuel Processing Technology 60 (1999) 111-118
[100] E. J. Akpabio, O. W. Obot, Optimizing utilization of petroleum coke in Nigerian metallurgical industry, Journal of Minerals and Materials Characterization and Engineering 10 (2011) 267-278
[101] E. Furimsky, Gasification of oil sand coke: Review, Fuel Process Technology 56 (1998) 263-290
[102] M. Malekshahian, J. M. Hill, Effect of pyrolysis and CO2 gasification pressure on the surface area and pore size distribution of petroleum coke, Energy & Fuels 25 (2011) 5250–5256
[103] X. Zhan, J. Jia, Z. Zhou, F. Wang, Influence of blending methods on the co-gasification reactivity of petroleum coke and lignite, Energy Conversion and Management 52 (2011) 1810–1814
[104] E. Heginuz, B. Gregertsen, V. Sorvari, P. Vriesman, K. Sjöström, Studies on solid fuel pyrolysis and fluidisation in a laboratory-scale, atmospheric, fluidized bed reactor, Finnish-Swedish Flame Days, Proceedings (1996)
[105] Gaskell D. R., Introduction to metallurgical thermodynamics, McGraw-Hill Book Company, Scripta Publishing Company, Washington, D.C. (1973)
[106] O. Kubaschewski, C. B. Alcock, P. J. Spencer, Materials Thermochemistry, 6th Edition, Pergamon Press, Ltd., Oxford, U.K (1993) 258-323
[107] L. Devi, K. J. Ptasinski, F. J. J. G. Janssen, Decomposition of naphthalene as a biomass tar over pretreated olivine: effect of gas composition, kinetic approach and reaction scheme, Industrial & Engineering Chemistry Research 44 (2005) 9096–9104

71
[108] A. Bayram, A Muezzinoglu, R. Seyfioglu, Presence and control of polycyclic aromatic hydrocarbons in petroleum coke drying and calcination plants, Fuel Processing Technology 60 (1999) 111-118
[109] L. Lu, C. Kong, V. Sahajwalla, D. Harris, Char structural ordering during pyrolysis and combustion and its influence on char reactivity, Fuel 81 (2002) 1215-1225
[110] Y. Zhang, Y. Luo, W. Wu, S. Zhao, Y. Long, Heterogeneous cracking reaction of tar over biomass char, using naphthalene as model biomass tar, Energy & Fuels 28 (2014) 3129-3137
[111] S. G. Chen, R. T. Yang, Mechanism of alkali and alkaline earth catalyzed gasification of graphite by CO2 and H2O studied by electron microscopy, Journal of Catalysis 138 (1992) 12-23
[112] D. J. Harris, I. W. Smith, Intrinsic reactivity of petroleum coke and brown coal char to carbon dioxide, stem and oxygen, Twenty-third Symposium International on Combustion/ The Combustion Institute (1990) 1185-1190
[113] S. Rapagna, K. Gallucci, M. Di Marcello, P. U. Foscolo, M. Nacken, S. Heidenreich, M. Matt, First Al2O3 based catalytic filter candles operating in the fluidized bed gasifier freeboard, Fuel 97 (2012) 718-724
[114] Q.-Z. Yu, C. Brage, T. Nordgreen, K. Sjöström, Effects of Chinese dolomites on tar cracking in gasification of birch, Fuel 88 (2009)1922-1926