Embed Size (px)
Citation preview

STRATEGIES TO USE BIOFUEL VALUE CHAIN POTENTIAL
IN SUBSAHARAN AFRICA TO RESPOND TO GLOBAL CHANGE
Enhancing low-productivity Farming in Tanzania and linking to SMEs
Biomass production and consumption patterns in Tanzania
- FINAL REPORT -
Contribution of the Wuppertal Institute to Better-iS project (Output 2, 4 and 5)
Wuppertal, 30. November 2012

Biomass production and consumption patterns in Tanzania
Page 2
Contact:
Katrin Bienge
Research Fellow
Research Group 4: Sustainable Production and Consumption
P.O. Box 100480, 42004 Wuppertal
Phone: +49 (0)202/2492-191
Fax: +49 (0)202/2492-138
Authors:
Katrin Bienge
Katharina Kennedy
Julia Pfaff
Dr. Justus von Geibler
Contributions by:
Monika Wirges
Akamewane Kingsly
Navina Manirjo

Final Better-iS Report of Wuppertal Institute
Page 3
Biomass production and consumption patterns in Tanzania
Content
1 Introduction ______________________________________________________ 8
2 Tanzania: Country overview ________________________________________ 11
3 Overview of biofuel production and consumption worldwide ____________ 16
4 Woody biomass production and consumption ________________________ 20 4.1 Status quo and trends: Forest resources and other woody biomass _________ 20
4.1.1 National situation of forest resources, production and trade __________ 20 4.1.2 Woody biomass outside forests _______________________________ 27 4.1.3 Additional forest products ____________________________________ 27
4.2 Regional distribution and utilisation of forest resources ___________________ 28 4.3 Focus biofuels from forest resources and other woody biomass ____________ 31
4.3.1 Focus charcoal ____________________________________________ 37 4.3.2 Focus biofuels from wood residues _____________________________ 40
4.4 Focus CO2 -emissions from deforestation and wood fuels _________________ 41
5 Energy production and consumption in Tanzania ______________________ 44
6 Agricultural biomass production and consumption ____________________ 51 6.1 Status quo and trends: agricultural biomass ____________________________ 51
6.1.1 National balances of production and consumption including trade _____ 51 6.1.2 Crop production in Tanzania __________________________________ 56 6.1.3 Regional differentiation of crop production: snapshot of case
study regions ______________________________________________ 69 6.1.4 Livestock keeping __________________________________________ 72 6.1.5 Consumption of agricultural biomass ___________________________ 75
6.2 Focus Biofuels from agricultural biomass ______________________________ 76 6.2.1 Land availability and suitable crops ____________________________ 76 6.2.2 Biofuels from agricultural crops ________________________________ 77 6.2.3 Biofuels from agricultural residues _____________________________ 89

Biomass production and consumption patterns in Tanzania
Page 4
6.2.4 Biofuels value chain potential for smallholders ____________________ 94 6.2.5 SWOT analyses of biofuels and bioenergy in Tanzania _____________ 98
7 Overview of biomass consumption in 2010, 2020, 2030 ________________ 101 7.1 Trends of woody biomass production and consumption __________________ 101 7.2 Trends of agricultural biomass production and consumption ______________ 103
8 Biomass Cascading: An option for Tanzania? ________________________ 106
9 Conclusions ____________________________________________________ 113
References ________________________________________________________ 117
Appendix A: Further detailed data and information _______________________ 126 Forest and agriculture definitions from FAO (2006) _________________________ 126 Agro-ecological zones in Tanzania ______________________________________ 128 Main problems within agro-ecological zones _______________________________ 130 FAO Commodity Balance, crop primary equivalent, 1999 - 2009 _______________ 131 FAO Commodity Balance, livestock and fish primary equivalent, 1999 - 2009 _____ 133 Existing policies targeting the forest, agriculture and energy sector with
relevance to biofuels ____________________________________________ 134 Value chain approach ________________________________________________ 137
Appendix B: Scientific summary reports _______________________________ 139
Appendix C: Educational summary report ______________________________ 140
Final Better-iS Report of Wuppertal Institute
Page 5
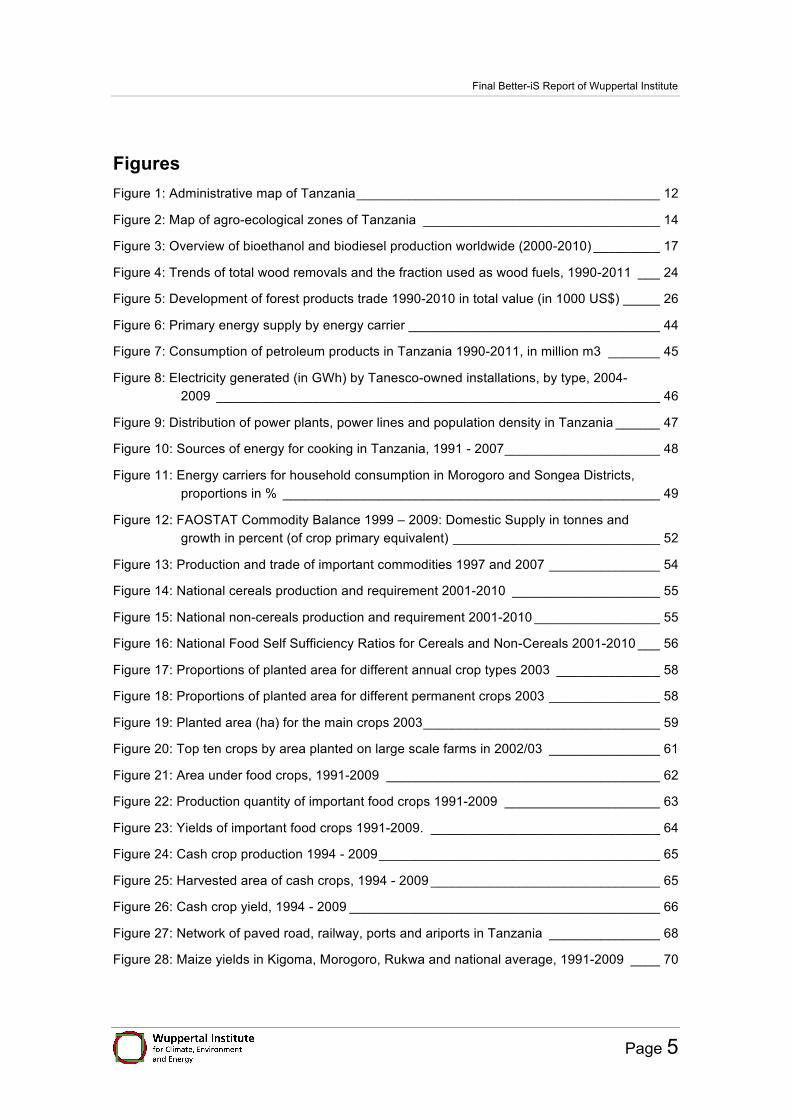
Figures Figure 1: Administrative map of Tanzania _________________________________________ 12
Figure 2: Map of agro-ecological zones of Tanzania ________________________________ 14
Figure 3: Overview of bioethanol and biodiesel production worldwide (2000-2010) _________ 17
Figure 4: Trends of total wood removals and the fraction used as wood fuels, 1990-2011 ___ 24
Figure 5: Development of forest products trade 1990-2010 in total value (in 1000 US$) _____ 26
Figure 6: Primary energy supply by energy carrier __________________________________ 44
Figure 7: Consumption of petroleum products in Tanzania 1990-2011, in million m3 _______ 45
Figure 8: Electricity generated (in GWh) by Tanesco-owned installations, by type, 2004-2009 ____________________________________________________________ 46
Figure 9: Distribution of power plants, power lines and population density in Tanzania ______ 47
Figure 10: Sources of energy for cooking in Tanzania, 1991 - 2007 _____________________ 48
Figure 11: Energy carriers for household consumption in Morogoro and Songea Districts, proportions in % ___________________________________________________ 49
Figure 12: FAOSTAT Commodity Balance 1999 – 2009: Domestic Supply in tonnes and growth in percent (of crop primary equivalent) ____________________________ 52
Figure 13: Production and trade of important commodities 1997 and 2007 _______________ 54
Figure 14: National cereals production and requirement 2001-2010 ____________________ 55
Figure 15: National non-cereals production and requirement 2001-2010 _________________ 55
Figure 16: National Food Self Sufficiency Ratios for Cereals and Non-Cereals 2001-2010 ___ 56
Figure 17: Proportions of planted area for different annual crop types 2003 ______________ 58
Figure 18: Proportions of planted area for different permanent crops 2003 _______________ 58
Figure 19: Planted area (ha) for the main crops 2003 ________________________________ 59
Figure 20: Top ten crops by area planted on large scale farms in 2002/03 _______________ 61
Figure 21: Area under food crops, 1991-2009 _____________________________________ 62
Figure 22: Production quantity of important food crops 1991-2009 _____________________ 63
Figure 23: Yields of important food crops 1991-2009. _______________________________ 64
Figure 24: Cash crop production 1994 - 2009 ______________________________________ 65
Figure 25: Harvested area of cash crops, 1994 - 2009 _______________________________ 65
Figure 26: Cash crop yield, 1994 - 2009 __________________________________________ 66
Figure 27: Network of paved road, railway, ports and ariports in Tanzania _______________ 68
Figure 28: Maize yields in Kigoma, Morogoro, Rukwa and national average, 1991-2009 ____ 70

Biomass production and consumption patterns in Tanzania
Page 6
Figure 29: Food Self Sufficiency ratios for Kigoma, Morogoro, Rukwa and Shinyanga 2001-2010 ________________________________________________________ 70
Figure 30: Contribution of different species to total livestock __________________________ 72
Figure 31: Sugar (refined equivalent) production and trade 1997-2007, in tonnes __________ 78
Figure 32: Expected ethanol yields in litre per hectare for sugar and starch crops in Tanzania _________________________________________________________ 79
Figure 33: Palm oil production, import and export 1998 – 2008, in tonnes ________________ 84
Figure 34: Development of forest area, agricultural area* and wood removals 1990-2010 __ 101
Figure 35: Crop areas and population prospects of Tanzania up to 2030 _______________ 102
Figure 36: Estimated production and consumption in Tanzania up to 2030 ______________ 104
Figure 37: Example of biomass pathways and utilisation options ______________________ 106
Figure 38: Multiple use of renewable resources I: Use of by-products __________________ 107
Figure 39: Multiple use of renewable resources II: Parallel use of all plant parts __________ 108
Figure 40: Multiple use of renewable resources III: Cascading use ____________________ 108
Figure 41: The value chain “construction and refurbishment with wood” ________________ 139
Tables Table 1: Overview of Tanzanias country area, 2009 _________________________________ 13 Table 2: Agro-ecological zones of the Better-iS case study regions _____________________ 15 Table 3: Overview of biofuel types and main feedstocks per region _____________________ 19 Table 4: Extent and characteristics of forest and other wooded land (for definitions of
categories see Appendix) ____________________________________________ 21 Table 5: Forest volumes in Tanzania ____________________________________________ 22 Table 6: Wood removals and production __________________________________________ 23 Table 7: Trade of forest products 2002, 2007, 2009 _________________________________ 25 Table 8: Regional distribution of forest resources ___________________________________ 28 Table 9: Regions most affected by deforestation and reasons for pressure on forests ______ 29 Table 10: Comparison of different charcoal conversion factors ________________________ 31 Table 11: Net calorific values of various biomass and fossil fuels common in sub Saharan
Africa ____________________________________________________________ 32 Table 12: Consumers and sources of wood fuel ____________________________________ 35 Table 13: General wood fuel situation in Tanzania Mainland __________________________ 36 Table 14: Forest renewability in Morogoro and Songea ______________________________ 37

Final Better-iS Report of Wuppertal Institute
Page 7
Table 15: Emissions and removals due to land use changes (forestry + land use) in Tanzania (Gg) in 1990 ______________________________________________ 42
Table 16: Emission rates (g/kg dry matter) during charcoal production & use of wood fuels ____________________________________________________________ 43
Table 17: FAO Commodity Balance, crop, livestock and fishery, 2009 __________________ 53 Table 18: Utilisation of crop land in 2003 _________________________________________ 57 Table 19: Regional food security as reported during 2003 census ______________________ 71 Table 20: Trends in annual production of meat, milk and eggs (in tonnes) ________________ 73 Table 21: Potential feedstock for different types of biofuels ___________________________ 77 Table 22: Land availability for sugar cane production in Tanzania ______________________ 81 Table 23: Potential sugar production _____________________________________________ 81 Table 24: Palm oil balance 2005 ________________________________________________ 84 Table 25: Land suitability for palm oil production in Tanzania __________________________ 85 Table 26: Potential palm oil production ___________________________________________ 86 Table 27: Livestock populations, dung production and theoretical energy potential 2000-
2008 ____________________________________________________________ 90 Table 28: Theoretical annual energy potential of main crop residues sources (average
2000- 2008) _______________________________________________________ 92 Table 29: SWOT liquid biofuels from palm oil, jatropha, sugar cane ____________________ 99 Table 30: SWOT Bioenergy from Agricultural Residues _____________________________ 100 Table 31: Calculated forest area if deforestation would continue at a rate of 403,328.5 ha
per year _________________________________________________________ 102 Table 32: Overview of modelled data of food consumption, production and crop area in
2010, 2020 and 2030 ______________________________________________ 105 Table 33: Use of wooden raw materials in Germany and their (potential) utilisation _______ 109 Table 34: Estimations for waste wood quantities in the categories A I to A IV as defined in
the German Waste Wood Ordinance (reference year 2004) ________________ 110 Table 35: FAO classification of tree containing ecosystems __________________________ 126 Table 36: Seven agro-ecological zones and their characteristics ______________________ 128 Table 37: Main problems within agro-ecological zones ______________________________ 130 Table 38: FAO Commodity Balance, crop primary equivalent, 1999 - 2009 ______________ 131 Table 39: Overview of current policies with relevance to Better-iS project (selection) ______ 134
Biomass production and consumption patterns in Tanzania
Page 8
1 Introduction
Background
The limited availability of fertile land / forest land and limited potentials to increase its productivity requires an efficient use of agricultural biomass and forest resources. Con-sidering the increasing demand for biomass for bioenergy, food and feed provision as well as material use (for e.g. building material or textiles), land use competition will in-crease in the future. The potential of improved efficiency of traditional fuel wood use (e.g. for cooking) has been documented in a number of cases including Sub-Saharan countries such as Tanzania. However, the development of future biofuel demand is uncertain and raises many questions for key actors, e.g. for farmers, regional organisa-tions, local authorities. Knowledge about implications of an improved efficiency in the traditional fuel wood use for the future demand of forest resources is limited in these countries.
The project „Better iS“ aims at identifying the potentials to enhance living conditions along biofuel value chains in Tanzania. The opportunities of biofuel production and consumption are discussed as adaptation strategies to climate change, world market development and growing energy demand. Based on the identification of strengths and weaknesses of the different development options, partaking in biofuel value chains could be a way out of poverty for small-scale farming.
Within the project, the Wuppertal Institute for Climate, Environment and Energy ana-lysed data on energy and biomass production and consumption patterns in sub-Saharan case study regions including analysis and assessment of trade balance (im-port, export) and competing biomass uses (food, material, energy), in order to identify relevant trends. The trend analysis of current biomass and land use patterns and anal-ysis of the potential of efficiency i.e. in traditional fuel wood use in the light of expecta-tions on future timber demand in Tanzania aims at an improved decision-making base in the development of strategies and policies for sustainable production and use of bi-omass. To increase resource efficiency, biomass cascading1 is one option explored in the project. If biomass cascading in this context is a suitable option for Tanzania has been discussed.
Scope and role of the paper
This final report presents the results of the project´s “output 2” (“Biomass production and consumption patterns”), and contribution to “output 4.1” (Sustainability Indicator Set) and “output 5” (Better-iS Information System). 1 The concept of cascading describes the strategy of utilising biomass products or their components in a
preferably comprehensive way within the economic system by a sequence of multiple material uses and - at the end of their life cycle - energetic uses. In this way, biomass cascading can provide an op-portunity to mitigate the actual and foreseeable future competition between biomass for material and energetic use as well as its use for feed and food.

Final Better-iS Report of Wuppertal Institute
Page 9
Guiding research questions for this work have been the following:
1. What current biomass production and consumption patterns (agriculture, forestry) exist in Tanzania at national / regional level and case study regions?
2. What are current implications and developments of the biofuel market focusing on key biofuel value chains exist in Tanzania at national / regional level and case study regions (energy consumption patterns, competing biomass uses)?
3. What biogenic resources and residues are appropriate to cascading in Tanzania in an economically and ecological reasonable manner?
This paper summarizes the results and, specifically,
• analyses the status quo and trends of biomass production and consumption patterns in Tanzania at national and regional level with special emphasis on the case-study regions
• identifies competing uses of biomass, energy consumption patterns, cascading options
• develops a trend scenario of biomass production and consumption patterns up to 2030
The term “biofuel” as used in this paper includes liquid biofuels such as ethanol, plant oil and biodiesel, but also solid fuels such as wood and charcoal and gaseous fuels such as biogas from agricultural residues. Specific attention have been given to the following biofuel and bioenergy value chains that have been selected within the Better-iS project: Wood / charcoal; jatropha; palm oil; sugar cane and agricultural residues.
Methods and data availability
In order to assess woody and agricultural biomass production and consumption in Tanzania a literature review, workshops and expert interviews were conducted. The approach comprised three methodological steps.
Step 1: Collecting data on forest and agriculture resources and biomass use in Tanza-nia based on primary statistics and further available data sources, including the analy-sis and assessment of trade balances. The paper is based on best available data for national and regional level. Local partners were involved for data mining based on data request. However most of the ministries visited for data have no reliable databases where people can access data easily. Those with somehow reliable databases and information/data for past years are hardly available. In case the information is availa-ble, in most situations it is not in continuous trends. Data on land use, particularly forest areas in each region are not available. The major reason is because there is no forest inventory that has been done so far to cover all the forest areas in the country. Most of the forest areas in all the regions have not been properly surveyed. In some ministries the mechanisms for accessing data are not very much clear. Due to data availability

Biomass production and consumption patterns in Tanzania
Page 10
the international statistics have been used and expanded with national and regional information.
Step 2: Analysing woody and agricultural biomass production and consumption pat-terns and trends on the national as well as regional level based on collected data and with additional information from two stakeholder workshops and six expert interviews. The stakeholder workshops were held in Bagamoyo, Tanzania in December 2010 and after one year in December 2011. The interviews were conducted in December 2010 in Morogoro and Dar es Salaam, Tanzania. Based on presentation of preliminary re-search results and an interview guide the six experts from university, research institute and ministry were asked for further data and comments on biomass use in Tanzania. The interviews have been summarized. Further an integration of top-down (IFPRI sce-nario) and bottom-up approach (integration of selected case study regions and biofuel value chains) has been applied. Two SWOT-analyses of (1) liquid biofuels from palm oil, jatropha, sugar cane and (2) bioenergy from agricultural residues have been con-ducted.
Step 3: Analysing collected information of step 1 and 2, developing and summarizing strategies for a sustainable and efficient wood and agricultural biomass use in Tanza-nia (incl. discussion of cascading).
Structure of this report:
The remaining part of the final report starts with a short country overview of Tanzania (Chapter 2) and biofuel production and consumption patterns worldwide (Chapter 3). In chapter 4 woody biomass production and consumption patterns are described in detail, with a special focus on wood fuels. A short overview of energy production and con-sumption in Tanzania follows in chapter 5. In chapter 6 the production and consump-tion of agricultural biomass is discussed, especially crop and biofuel production. In chapter 7 an overview of the use and production of woody and agricultural biomass up to 2030 is given. At the end of the report the concept of biomass cascading is present-ed in chapter 8 as a possible option for Tanzania and the conclusions are outlined in Chapter 9.
The Appendix comprises:
• further detailed data and information • Scientific summary reports (von Geibler / Bienge 2010, Bienge et al. submitted) • Educational summary report (factsheets for Better-iS Information System)
Final Better-iS Report of Wuppertal Institute
Page 11
2 Tanzania: Country overview In this chapter a short overview of the geography of Tanzania as well as the climate is given and the agro-ecological zones of the including Better-iS case study regions are described.
Geography
The United Republic of Tanzania is a country in Sub-Saharan Africa with a total area of about 945,000 km2 (URT 2011). It is divided into 26 regions (as shown in Figure 1). Its official capital is Dodoma, while Dar es Salaam is the major commercial city. Tanzania includes a coastline of the Indian Ocean to the east of about 800 km with the three ma-jor islands Mafia, Pemba and Zanzibar (Unguja). Lake Victoria lies to the northwest and forms part of the border to Kenya and Uganda. The peak of Kilimanjaro is situated in the northeast. Lake Tanganyika and Lake Nyasa to the west form part of the border to the Democratic Republic of Congo, Zambia, Malawi and Burundi. Furthermore, Tan-zania borders Rwanda to the west as well as Mozambique to the south. Along the coastline the geography is characterized by plains, to the north and south by highlands and the center by a central plateau (Agrawala et al. 2003). Better-iS case study regions are Kigoma, Rukwa, Morogoro and Shinyanga (see chapter 6.1.3).
Tanzania key facts (URT 2011; UN 2010, FAOSTAT 2012)
Country area (2009): about 94 million ha
Population (2010, estimated): 45 million
Rate of population change (2010): + 3,1 % annually
Population living below poverty line (2007): 33.4% (21.8% in urban areas, 37.4% in rural areas)
Official Capital: Dodoma
Major city: Dar es Salaam
National Language: Kiswahili (English also widely used)
Official currency: Tanzanian Shilling
GDP per capita (2010): 551 US$
Importance of agriculture: 25% of GDP and 75% of labor force
Governmental form: Republic since 1962 (current president: Jakaya Mrisho Kikwete)

Biomass production and consumption patterns in Tanzania
Page 12
Figure 1: Administrative map of Tanzania
Source: URT 2011
In 2002 (latest population census) Tanzania’s total population was about 34 million. Shinyaga had a population density of 55.1 persons per square kilometer (about 2.8 million total), Kigoma 45.2 (1.7 million), Morogoro 24.8 (1.8 million) and Rukwa 16.6 persons per km2 (1.1 million) (Madulu 2002, also see Table 13). In 2010 Tanzania’s total population was estimated to have risen to about 45 million (UN 2010). The by far most densely populated region with about 3 million is Dar es Salaam, the population is further concentrated on the islands Zanzibar and Pemba, the regions adjoining Lake Victoria, Shinyanga and the Kilimanjaro, Tanga and Mtwara region. The rest of the country has a population density lower than 52 persons per km2 (URT 2011).
In 2010, with 48 % share of GDP (gross domestic product) the services sector ac-counted for the biggest part of the GDP, followed by agriculture, forestry and hunting (26 %) and industry and construction (24 %). Fishing accounted for 2 % of the GDP (URT 2011). Estimates suggest that Tanzania’s economy grew by 6.4 % in 2011, driv-en by 7.6 % growth in the service sector, 8.1 % growth in industry and construction and 4.3 % growth in agriculture, hunting and forestry (AfDB et al. 2012). Even though the agricultural sector accounts for about a quarter of the GDP, it employs about three-quarters of Tanzania’s labor force (AfDB et al. 2012).

Final Better-iS Report of Wuppertal Institute
Page 13
Over 80% of the population live in rural areas and depend on agriculture. On average 33.4% of the Tanzanian are living below poverty line of US$1 per day2 in 2007. Where-as in urban areas the share was 21.8% and in rural areas 37.4%3 (UN MDG Statistics 2012). Nearly 75% of poor people are working in farming / livestock / fishing / forest sector (based on activity of head of household, URT 2009b: 6).
Land availability
The land area (without other land) is almost equally used for forest (33.8 million ha) and agriculture (35.5 million ha). Most of agricultural area is used as permanent mead-ows and pastures. The cultivated land (arable land and permanent crops) amounts for about 11.5 million ha.
Table 1: Overview of Tanzanias country area, 2009
2009 in 1000 ha Country area 94730
Inland water 6150 Land area 88580
Forest area 33831 Other land 19249 Agricultural area 35500
Permanent crops 1500 Permanent meadows and pastures 24000 Arable land 10000
Source: FAOSTAT 2012
Climate and agro-ecological zones
As Tanzania is located just south of the equator, it has a tropical climate with distinct wet and dry seasons. Temperatures and rainfall vary with altitude, with high altitudes receiving more precipitation. Rainfall occurs uni- or bimodal, but unregularly throughout the years resulting sometimes in droughts or floods. Savannah vegetation covers about 90 % of the country mainly consisting of grasses, brushes, shrubs and scattered trees (URT 1999). 2 “Following the release of new poverty estimates by the World Bank in 2008 (Ravallion, Chen and San-
graula, 2008), extreme poverty is monitored using a threshold of US$1.25 a day in 2005 prices”, but the formulation of indicators of MDG Goal 1 has remained the same (referring to one dollar a day). (ILO 2011: 3).
3 The Poverty and Human Development Report of Tanzania (URT 2009) presents similar data but uses different measures: basic need poverty line and food poverty line. „Individuals are considered poor when their consumption is less than the ‘basic needs poverty line’. This indicator is based on the cost of a basket of food plus non-food items. Housing, consumer durables and telecommunications are not included, nor are health and education expenses.“ Poverty headcount in 2007 was 33.6% (Tanzania Mainland), 16.4% (Dar es Salaam), 24.1% (other urban), and 37.6% (Rural areas) (URT 2009b: 2).

Biomass production and consumption patterns in Tanzania
Page 14
Tanzania can be divided into seven agro-ecological zones: coast, arid lands, semi arid lands, plateau, northern highlands, southern and western highlands, and alluvial plains (URT 1999, URT 2007e, see Appendix Table 36). About 61 % of the land area is cov-ered by dryland (arid, semi arid zones and dry sub humid areas) (URT 1999, see Fig-ure 2).
Figure 2: Map of agro-ecological zones of Tanzania
Source: de Pauw 1994
In Table 2 the agro-ecological zones for the Better-iS case study regions are de-scribed. As rainfall and altitude influences the agro-ecological zones, they vary be-tween and within the regions. Biomass production is related to the zones because crops have different water, nutrient, temperature and light requirements so that they are better suited to some zones than to others.

Final Better-iS Report of Wuppertal Institute
Page 15
Table 2: Agro-ecological zones of the Better-iS case study regions
Region Area Zone Soil and topography Altitude (m)
Rainfall (mm/year)
Shin
yang
a
Shinyanga Semi arid lands
Undulating plains, with rocky hills and low scraps. Well drained soils with low fertility. Black cracking soils
1000-1500
Unimodal, unreliable 500-800
Serengeti Arid lands Volcanic ash and sediments. Soils variable in texture and very suscep-tible to water erosion
1300-1800
Unimodal, unreliable 500-600
Kig
oma
Kigoma Plateaux Western wide sandy plains and rift valley scraps. Flooded swamps of Malagarasi and Ugalla rivers have clay soils with high fertility sands in the north
800-1500
Unimodal 800-1000
Along shore of lake Tanganyika
Southern and western highlands
North-south ridges separated by swampy valleys, loam and clay soils of low fertility in hills, with alluvium and ponded clays in the valleys
100- 1800
Bimodal 1000-2000
Mor
ogor
o
Broad ridge from Morogoro to Lake Nyasa
Southern and western highlands
Undulating plains to dissected hills and mountains.
1200-1500
Unimodal, reliable, Local rain shadows 800-1400
Morogoro except Kilombero and Wami Basins and Uluguru Mts.
Semi arid lands
Flat or undulating plains with rocky hills, moderate fertile loams and clays, infertile sand soils in center
200-600 Unimodal 600-800
Southern Morogoro Plateau Western wide sandy plains and rift valley scarps
800-1500
Unimodal, very reliable 900-1300
Uluguru Mountain in Morogoro
Northern Highlands
Granite steep mountainside to highland plateau. Soils are deep, arable and moderately fertile on upper slopes, shallow and stony on steep slopes
1000-2000
Bimodal, very reliable 1000-2000
Kilombero
Alluvial plains Central clay plain with alluvial fans east and west
Unimodal, very reliable 900-1300
Wami Alluvial plains Moderately alkaline black soils in East, alluvial fans with well drained black loam in West
Unimodal 600-1800
Rukwa North and Centre Plateau Western wide sandy plains and rift valley scarps
800-1500
Unimodal 800-1000
Source data: URT 1999, URT 2007e

Biomass production and consumption patterns in Tanzania
Page 16
3 Overview of biofuel production and consumption worldwide The worldwide trend towards energetic biomass use, especially towards transport bio-fuels in the USA, Brazil and the European Union (UNEP 2009) leads to changes in bi-omass production and consumption patterns. In general direct competition between the uses of biomass as food, feed, material or fuel, as well as indirect competition for (po-tential) crop area can have environmental and the socioeconomic impacts (UNEP 2009, REN21 2011, Leopoldina 2012, Bringezu et al. 2007 and 2008). Thus, research stresses the necessity to develop an overall integrated biomass strategy (Bringezu et al. 2007).
Biofuels are a specific form of the renewable energies used as combustible material for the transport. There exist three different generations of biofuels indicating their availa-bility and technology level. Whereas first generation biofuels are dominant today, 2nd and3rd generation - or so called “advanced biofuels” - are still under development ((UNEP 2009):
• 1rst generation: produced commercially by the use of conventional technology, plants originally used as foodstuff -> bioethanol, biodiesel, vegetable oil, biogas.
• 2nd generation: produced on the basis of non-food sources (e.g. waste bio-mass, stalks of wheat, wood). Production technology is called "biomass to liq-uid" (BtL), using thermo-chemical conversion and fermentation -> e.g. bio hy-drogen, bio methanol
• 3rd generation: produced on the basis of algae with same technologies as 2nd generation (-> algae fuel). Little experiences with production process and not yet on the market. (UNEP 2009)
Biofuels are used commonly for transport, in some parts also used in shipping. Biofuels in the aviation sector are tested. The most dominant forms of biofuels are bioethanol and biodiesel. (UNEP 2009, REN21 2011).
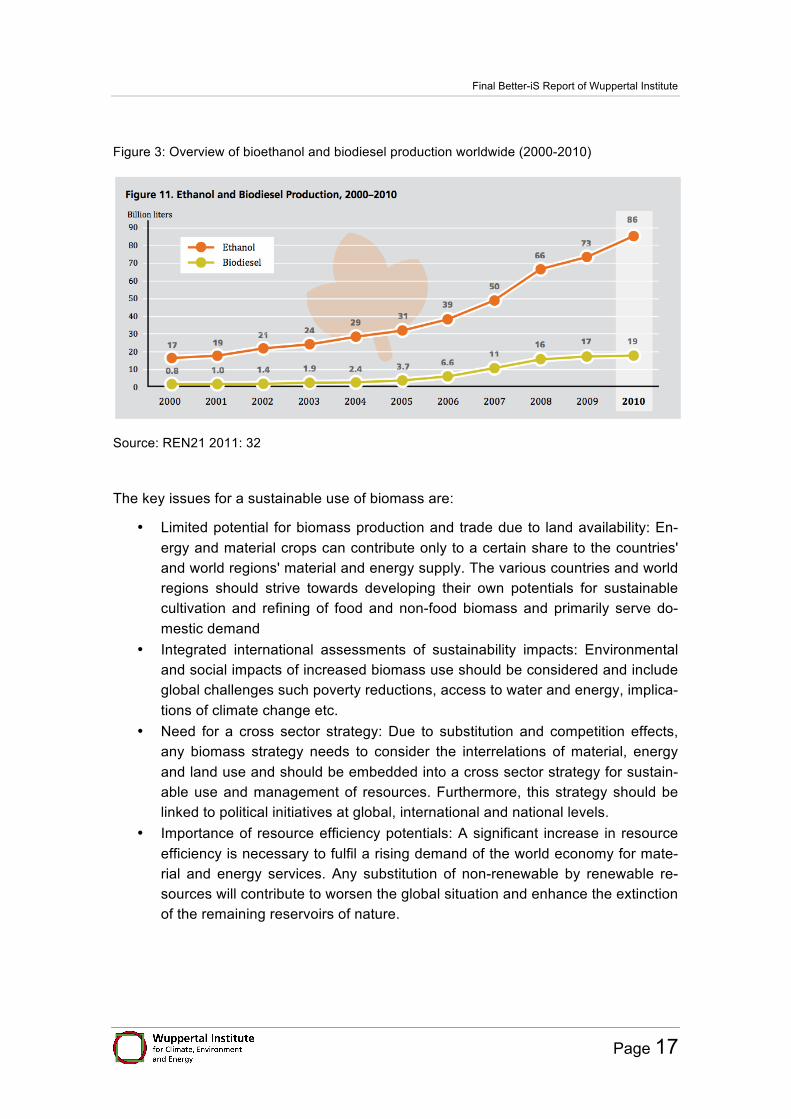
Bioethanol is mainly produced of maize (>50%) and sugar cane (>33%) already since the 70s. In the beginning years there production was little, only a few thousand litres per year. In 2000 the prodcution increased to 17 billion litres per year (see Figure 3). In 2010 the production amounted to 86 billion litres. The most important production coun-tries worldwide are the USA (mainly maize) and Brazil (mainly sugar cane).
Biodiesel is based on raw materials as vegetable oils or animal fat and is produced since the 90s. In 2000 the prodcution increased to 0.8 billion litres per year. In 2010 the production amounted to 19 billion litres. The TOP10 production countries produce 75% of all biodiesel, important production regions are within the EU, esp. in Germany with a total production of 2,9 billion litres.
Final Better-iS Report of Wuppertal Institute
Page 17
Figure 3: Overview of bioethanol and biodiesel production worldwide (2000-2010)
Source: REN21 2011: 32
The key issues for a sustainable use of biomass are:
• Limited potential for biomass production and trade due to land availability: En-ergy and material crops can contribute only to a certain share to the countries' and world regions' material and energy supply. The various countries and world regions should strive towards developing their own potentials for sustainable cultivation and refining of food and non-food biomass and primarily serve do-mestic demand
• Integrated international assessments of sustainability impacts: Environmental and social impacts of increased biomass use should be considered and include global challenges such poverty reductions, access to water and energy, implica-tions of climate change etc.
• Need for a cross sector strategy: Due to substitution and competition effects, any biomass strategy needs to consider the interrelations of material, energy and land use and should be embedded into a cross sector strategy for sustain-able use and management of resources. Furthermore, this strategy should be linked to political initiatives at global, international and national levels.
• Importance of resource efficiency potentials: A significant increase in resource efficiency is necessary to fulfil a rising demand of the world economy for mate-rial and energy services. Any substitution of non-renewable by renewable re-sources will contribute to worsen the global situation and enhance the extinction of the remaining reservoirs of nature.
Biomass production and consumption patterns in Tanzania
Page 18
Ecological and social impact of biofuels:
• The development of global agricultural yields is important for satisfying the de-mand for food or biomass with current cultivated land. Considering the influence of water availability, climate change, environmental restrictions, the yield devel-opment is limited.
• The global increase in population leads to rising food demands and changes in consumption patterns. Biofuels intensify the usage competition of cultivated land and leads to rising food prices and pressure on resources. Land grabbing as a consequence endangers local community rights.
• Changes in land use have effects on direct and indirect emissions of green-house gas (e.g. due to lower carbon content of the soil).
• High use of biomass, changes in soil quality and increasing cultivated land have effects on biodiversity, soil quality and ground water.
• Increasing cultivation of energy plants leads to high usage of fertilizer. This shows effects on water quality (e.g. nitrogen and phosphor contents, saliniza-tion of the ground water) and produces usage competition with food production
• Endangered biodiversity by transformation of ecosystems, monoculture, pollu-tion of water and ground by fertilizers and pesticides.
• Socio-economic problems regarding food and income security, property of land and water shortage.

Final Better-iS Report of Wuppertal Institute
Page 19
Table 3: Overview of biofuel types and main feedstocks per region
Biofuel Basic technology
Main feedstocks (per region) *TOP production countries 2007 and main raw materials **TOP production country 2010 Utilization / Use
First generation biofuels Plant oils 1) As transport fuel: Either adaptation of
motors to the use of plant oils; or modifi-cation of plant oils to be used in conven-tional motors 2) For generation of electricity and heat in decentralised power resp. CHP sta-tions
1) Rapeseed oil, sunflower, and other oil plants, waste, vegetable oil 2) Rapeseed oil, palm oil, jatropha, and other oil plants
Rather on local / regional level: pilot study
Biodiesel Transesterification of oil and fats to provide fatty acid methyl ester (FAME) and use as transport fuel
• Europe (15%*): Rapeseed*, sun-flower, soy
• USA: Soy, sunflower • Canada: Soy, rapeseed (Canola) • South- and Central-America: Soy,
palm, jatropha, castor • Africa: Palm, soy, sunflower,
jatropha • Asia: Palm, soy, rapeseed, sun-
flower, jatropha
Global dominat-ing biofuel (in-cluding bioetha-nol)
Bioethanol Fermentation (sugar); hydrolysis and fermentation (starch); use as transport fuel
• USA (43%*, > 50%**): Corn • Brazil (32%*, > 33%**): Sugar cane • Other South- and Central-America:
Sugar cane, cassava • Europe: Cereals, sugar beets • Canada: Maize, cereals, cassava; • Africa: Sugar cane, maize
Global dominat-ing biofuel (in-cluding bio-diesel)
Biogas Fermentation of biomass used either in decentralised systems or via supply into the gas pipeline system (as purified biomethane); 1) For generation of electricity and heat in power resp. CHP stations 2) As transport fuel: either 100% biogas fuel or blending with natural gas used as fuel
Energy crops (e.g. maize, miscanthus, short rotation wood, multiple cropping systems); biodegradable waste mate-rials, including from animal sewage
Rather on local / regional level: pilot study
2nd generation Bioethanol Breakdown of cellulosic biomass in
several steps incl. hydrolysis and finally fermentation to bioethanol
Ligno-cellulosic biomass like stalks of wheat, corn stover and wood; special-energy-or-biomass crops (e.g. miscan-thus); sugar cane begasse
Developmental stage of the technology; construction of biofuel plants (e.g. Canada, Germany, Fin-land, Nether-land, Sweden, USA); Important actor for devel-opment of “ad-vanced biofu-els”: Aerospace industry
Biodiesel (range of “designer”-biofuels such as biohydro-gen, bio-methanol, DMF, Bio-DME. mixed alcohols)
Gasification of low-moisture biomass (<20% water content) provides “syngas” with CO, H2, CH4 hydrocarbons) from which liquid fuels and base chemicals are derived
Ligno-cellulosic biomass like wood, straw, and secondary raw materials like waste plastics
3rd generation Biodiesel, aviation fuels, Bio-ethanol, Biobutanol
Bioreactors for ethanol (production can be linked to sequestering carbon dioxide from power plants); Transesterification and pyrolysis for biodiesel, other tech-nologies under development
Marine macro-algae micro-algae in ponds or bioreactors
Test phase
Source: UNEP 2009, REN 2011

Biomass production and consumption patterns in Tanzania
Page 20
4 Woody biomass production and consumption Woody biomass is one of the most important energy sources in Tanzania. In this chap-ter the forest resources of Tanzania and wood products are described. Furthermore wood fuel consumption is described with a focus on the use of charcoal, as it is the main use for woody biomass.
4.1 Status quo and trends: Forest resources and other woody biomass
In this section detailed information on Tanzania’s forests production and consumption patterns are given. Wood use is shown and the regional differences are discussed.
4.1.1 National situation of forest resources, production and trade
Tanzania had a total of 35 million ha of forest area and 13 million ha of other wooded land (see Appendix for definitions) in 2005 (FAO 2010b). According to Mwampamba (2007), Tanzania’s forests consist of 13 million ha of forest reserves, 2 million ha of national parks and around 20 million ha (i.e. 57 % of the total forest area) of forest on public land. Zahabu (2008) mentions 16 million ha of reserved forests (according to the Forest Act (URT 2002) “Forest reserve” means a forest area, either for production of timber and other forest produce or for the protection of forests and important water catchments, controlled under the Forests Ordinance and declared by the Minister. In addition, declared forests under village managements are also recognized as forest reserves.“ (Zahabu 2008: 1)). Further more he mentions 2 million ha of national parks and 16 million ha (47 % of all forestland) unprotected forests on General Land (all pub-lic land which is not reserved or village land, including unused village land (Zahabu 2008: 1)).
More than 90 % of Tanzania’s forested area is covered by savannah woodlands with a varying degree of tree cover. Very common are the so-called “Miombo woodlands”, where Miombo is a local name for the Brachystegia trees that dominate these wood-lands, often being co-dominant with species such as Julbernardia and Acacia (Wiskerke 2008). Depending on forest cover Miombo woodlands are forests or other wooded land.
Only 0.4 % of the forests were under private ownership, while the remaining forest area as well as all the other wooded land was publicly owned. 70.7 % of the forest was des-ignated for production, 5.6 % (2 million ha) for the conservation of biodiversity and 37.7 % for multiple purposes. No specific function was designated to the other wooded land. In 2010 the forest has been reduced to 33 million ha of forest area, with no relevant change in use (FAO 2010b).
The area of forest and other wooded land has decreased over the last decades. The woodland (incl. forest area and other wooded land) decrease was particularly strong in the other wooded land category, which lost 6,564,000 ha (minus 36 %) of its area in 20

Final Better-iS Report of Wuppertal Institute
Page 21
years. The decrease of forest during the same period was even stronger: 8,067,000 ha of forest area have been lost (FAO 2010a). In 1990 forests covered 47 % (41,495 ha) of the land area. Until 2010 the forest area had been reduced to 38 % of total land area (33,428 ha).
Table 4 shows the change in the area of forests and woodlands over the period from 1990 to 2010. According to the FAO (2010c), Tanzania is amongst the 10 countries with the largest annual loss of forest area worldwide, having lost 403,000 ha or 1.13 % of the national forest area every year between 2000 and 2010 (FAO 2010c: 21).
Table 4: Extent and characteristics of forest and other wooded land (for definitions of categories see Appendix)
FRA 2010 categories Area (1000 hectares) Area change
1990-2010 1990 2000 2005 2010 Forest (naturally regenerated) 41 345 37 262 35 215 33 188 - 8 157 - 19.7 %
Plantation 150 200 230 240 + 90 + 60 % Other wooded land 18 183 14 901 13 260 11 619 - 6 564 - 36 % Other land 28 902 36 217 39 875 43 533 + 14 631 + 50.6 %
Source: FAO 2010b
Annual deforestation is in the order of 130,000 – 500,000 ha (Ajayi et al. 2008; Mwam-pamba 2007; Wiskerke 2008; FAO 2010b). There is some debate whether the expan-sion of land used for agriculture and animal husbandry or the collection of wood fuel is the main factor, especially since these activities often go hand in hand (FOSA 2003; Mwampamba 2007; Wiskerke 2008). The effects of wood fuel use on forest resources will be discussed in detail in chapter 4.3.
According to Zahabu (2008), the deforestation mainly takes place in the forests on pub-lic or general land, as access to these forests is unrestricted and they are “character-ized by insecure land tenure, shifting cultivation, annual wild fires, harvesting of wood fuels, poles and timber, and heavy pressure for conversion to other competing land uses, such as agriculture, livestock grazing, settlements and industrial development.” (Zahabu 2008: 1) However, disturbance and deterioration was also noted inside forest reserves, due to activities such as illegal mining, pit sawing, illegal harvesting for build-ing materials and collection of firewood and medicinal forest products (Zahabu 2008).
The biomass content and growth rates of any forest or woodland are strongly variable, depending on site conditions and disturbance regimes. Several estimations of standing stock volumes or weights and mean annual growth (mean annual increment = mai) exist for the Miombo woodlands of Tanzania. Luoga et al. (2002) investigated standing stock volumes in eastern Tanzania. They found a range from around 47 m3/ha in a pro-tected forest reserve to only 16.7 m3/ha in a forest on communal land. Mean annual increment was estimated at 4.35 m3/ha/year, while annual wood removal was higher at

Biomass production and consumption patterns in Tanzania
Page 22
6.38 m3/ha, thus leading to a degradation of public forests and pressure on the forest reserves (Luoga et al. 2002). Malimbwi et al. (2002) found standing stocks in the Kitu-langalo and Mbwewe areas, two charcoal supply areas for the Dar es Salaam region, to range from 0.3 m3/ha by the roadside to 34.6 m3/ha at a distance of 15 km from the road. They calculated a much lower mean annual increment of 2.4 m3/ha/year
(Malimbwi et al. 2002). At Miombo woodlands in Zambia, standing stocks of up to 91.5 t of biomass per ha (77.7 m3/ha) were measured and mean annual increments for for-est patches of different age and regeneration/disturbance situations ranged from 0.2 to 3.9 t/ha/year (0.17-3.3 m3/ha/year) (Chidumayo et al. 2002). To convert tonnes of wood into m3, a conversion factor of 0.85 is used (World Bank 2009).
The FAO assumes an average growing stock volume of 37 m3/ha for forest and 10 m3/ha for shrubs and thickets (other wooded land category in Tanzania). Regarding standing stock volumes those statistical data do not reflect situation in Tanzania be-cause they are calculated values. Based on these assumptions, they arrive at the fol-lowing volumes:
Table 5: Forest volumes in Tanzania
Forest Resource Assessment categories
Volume (million cubic meters over bark)
1990 2000 2005 2010 Total growing stock in forest 1 535 1 386 1 311 1 237
Total growing stock in other wooded land 182 149 132 116 Source: FAO 2010b
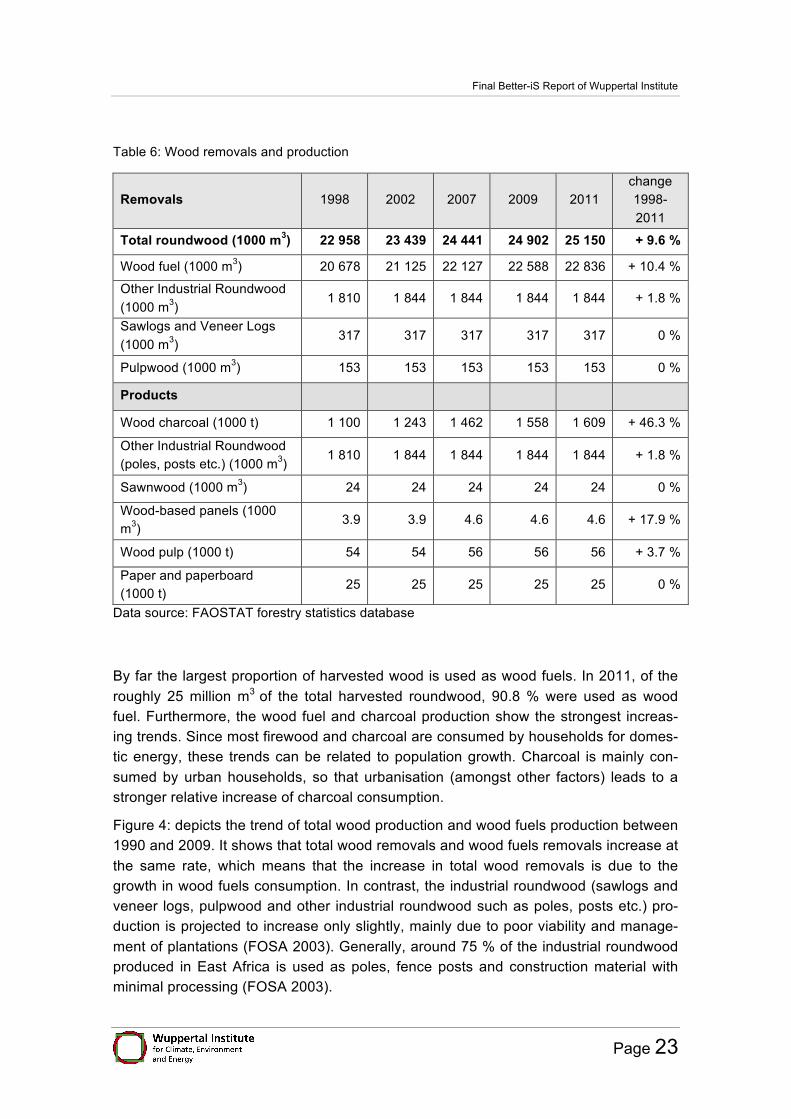
Detailed data on the quantities of wood harvested and the resulting production of dif-ferent wood products can be obtained from the FAOSTAT database. Table 6 gives an overview of production quantities of some important wood products over roughly the last decade.
Final Better-iS Report of Wuppertal Institute
Page 23
Table 6: Wood removals and production
Removals 1998 2002 2007 2009 2011 change 1998-2011
Total roundwood (1000 m3) 22 958 23 439 24 441 24 902 25 150 + 9.6 %
Wood fuel (1000 m3) 20 678 21 125 22 127 22 588 22 836 + 10.4 %
Other Industrial Roundwood (1000 m3)
1 810 1 844 1 844 1 844 1 844 + 1.8 %
Sawlogs and Veneer Logs (1000 m3)
317 317 317 317 317 0 %
Pulpwood (1000 m3) 153 153 153 153 153 0 %
Products
Wood charcoal (1000 t) 1 100 1 243 1 462 1 558 1 609 + 46.3 %
Other Industrial Roundwood (poles, posts etc.) (1000 m3)
1 810 1 844 1 844 1 844 1 844 + 1.8 %
Sawnwood (1000 m3) 24 24 24 24 24 0 %
Wood-based panels (1000 m3)
3.9 3.9 4.6 4.6 4.6 + 17.9 %
Wood pulp (1000 t) 54 54 56 56 56 + 3.7 %
Paper and paperboard (1000 t)
25 25 25 25 25 0 %
Data source: FAOSTAT forestry statistics database
By far the largest proportion of harvested wood is used as wood fuels. In 2011, of the roughly 25 million m3 of the total harvested roundwood, 90.8 % were used as wood fuel. Furthermore, the wood fuel and charcoal production show the strongest increas-ing trends. Since most firewood and charcoal are consumed by households for domes-tic energy, these trends can be related to population growth. Charcoal is mainly con-sumed by urban households, so that urbanisation (amongst other factors) leads to a stronger relative increase of charcoal consumption.
Figure 4: depicts the trend of total wood production and wood fuels production between 1990 and 2009. It shows that total wood removals and wood fuels removals increase at the same rate, which means that the increase in total wood removals is due to the growth in wood fuels consumption. In contrast, the industrial roundwood (sawlogs and veneer logs, pulpwood and other industrial roundwood such as poles, posts etc.) pro-duction is projected to increase only slightly, mainly due to poor viability and manage-ment of plantations (FOSA 2003). Generally, around 75 % of the industrial roundwood produced in East Africa is used as poles, fence posts and construction material with minimal processing (FOSA 2003).

Biomass production and consumption patterns in Tanzania
Page 24
Figure 4: Trends of total wood removals and the fraction used as wood fuels, 1990-2011
Data source: FAOSTAT forestry statistics database
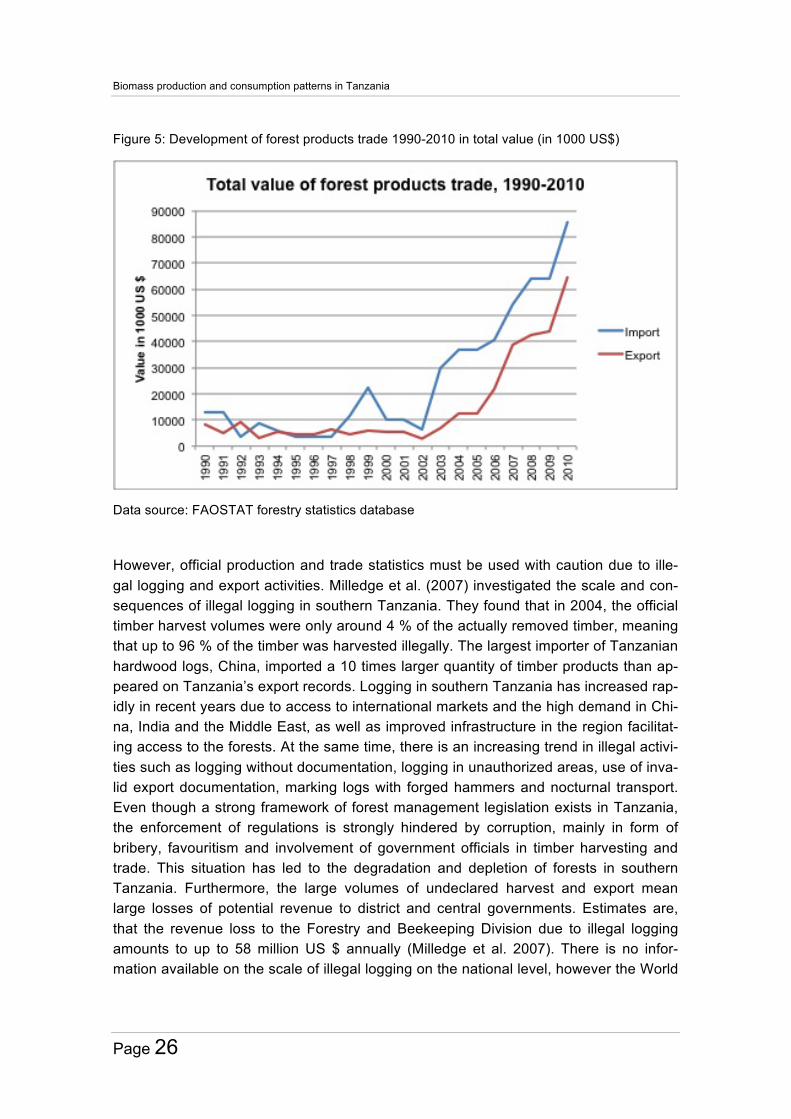
When comparing production figures (Table 6) to trade statistics and resulting domestic supply (Table 7) it becomes clear that production and consumption of wood fuels, in-dustrial roundwood and wood pulp mainly take place within the country. Exports are dominated by products that require only little processing like industrial roundwood and sawnwood, while imports are mainly of processed products such as paper, wood pan-els and fibreboard. The import value (as well as the import quantity) are strongly domi-nated by paper and paperboard including newsprint, while the export value is generat-ed mainly by paper and paper board, sawnwood, and industrial roundwood. Further-more, Table 7 shows an increase in traded volumes/ mass of wood products over time. This increase in trade can be seen more clearly when looking at the sum of the values of traded wood products: Figure 5: shows the total value of all traded wood products from 1990 to 2009. From 2002 onwards, there has been a strong increase in both ex-port and import value.

Final Better-iS Report of Wuppertal Institute
Page 25
Table 7: Trade of forest products 2002, 2007, 2009
Product 2002 2007 2009 Import
Wood fuel (m3) 3 13 13 Wood charcoal (t) 7 11 100 Other Industrial Roundwood / Industrial roundwood (m3) 127 4 791 234 Sawnwood (m3) 48 2 668 3 896 Wood-based panels (m3) 1 283 17 539 23 081 Fibreboard (m3) 472 12 434 12 850 Wood pulp (t) 296 175 130 Paper and paperboard (t) 10 631 50 342 60 923
Export Wood fuel (m3) 19 200 200 Wood charcoal (t) 41 223 223 Other Industrial Roundwood / Industrial roundwood (m3) 10 066 23 638 5 403 Sawnwood (m3) 964 36 434 21 906 Wood-based panels (m3) 764 589 594 Fibreboard (m3) 325 101 101 Wood pulp (t) 10 51 51 Paper and paperboard (t) 897 61 171 26 863
Domestic Supply (Production + Imports - Exports) Wood fuel (m3) 21 124 742 22 127 013 22 587 598 Wood charcoal (t) 1 243 464 1 461 888 1 558 201 Other Industrial Roundwood / Industrial roundwood (m3) 1 834 061 1 825 153 1 838 831 Sawnwood (m3) 23 084 -9 766 5 990 Wood-based panels (m3) 4 423 21 582 27 119 Fibreboard (m3) 2 147 14 333 14 749 Wood pulp (t) 54 286 56 124 56 079 Paper and paperboard (t) 34 734 14 171 59 060
Data source: FAOSTAT forestry statistics database
Biomass production and consumption patterns in Tanzania
Page 26
Figure 5: Development of forest products trade 1990-2010 in total value (in 1000 US$)
Data source: FAOSTAT forestry statistics database
However, official production and trade statistics must be used with caution due to ille-gal logging and export activities. Milledge et al. (2007) investigated the scale and con-sequences of illegal logging in southern Tanzania. They found that in 2004, the official timber harvest volumes were only around 4 % of the actually removed timber, meaning that up to 96 % of the timber was harvested illegally. The largest importer of Tanzanian hardwood logs, China, imported a 10 times larger quantity of timber products than ap-peared on Tanzania’s export records. Logging in southern Tanzania has increased rap-idly in recent years due to access to international markets and the high demand in Chi-na, India and the Middle East, as well as improved infrastructure in the region facilitat-ing access to the forests. At the same time, there is an increasing trend in illegal activi-ties such as logging without documentation, logging in unauthorized areas, use of inva-lid export documentation, marking logs with forged hammers and nocturnal transport. Even though a strong framework of forest management legislation exists in Tanzania, the enforcement of regulations is strongly hindered by corruption, mainly in form of bribery, favouritism and involvement of government officials in timber harvesting and trade. This situation has led to the degradation and depletion of forests in southern Tanzania. Furthermore, the large volumes of undeclared harvest and export mean large losses of potential revenue to district and central governments. Estimates are, that the revenue loss to the Forestry and Beekeeping Division due to illegal logging amounts to up to 58 million US $ annually (Milledge et al. 2007). There is no infor-mation available on the scale of illegal logging on the national level, however the World

Final Better-iS Report of Wuppertal Institute
Page 27
Bank states that “due to ineffective control and management of natural forests, harvest-ing is mostly carried out illegally“ (The World Bank 2005: 24).
4.1.2 Woody biomass outside forests
In addition to forests and woodlands, woody biomass also exists on farmland. 13 % of smallholder households were found to plant some trees on their land, mainly on field boundaries (46 %) but also scattered on the fields (31 %) and in plantation or coppice (23 %). The number of trees planted by smallholders at the time of the census in 2003 was around 120 million, mainly Eucalyptus and Pinus. The main purpose of planting trees was to obtain planks/ timber (45 %), then for wood fuel (20%), shade (19%), and poles (9%). Very few trees are planted for the production of charcoal, to harvest medi-cines and for other purposes. The largest number of trees was planted in Iringa, fol-lowed by Mbeya, Kagera and Ruvuma (URT 2006).
4.1.3 Additional forest products
Important non-timber forest products include medicinal plants and edible plants such as fruits, leaves, roots, tubers and mushrooms, some of which are traded locally. Some edible plants, as well as termites and grasshoppers, are an important source of food for the rural poor in periods of food shortages. Furthermore, there is significant production of honey (138,000 t per year) and beeswax (9,200 t per year). Most of the honey and beeswax are consumed and traded locally, with small quantities of honey exported mainly to the Near East and the United Arab Emirates and small quantities of beeswax exported to Germany, Japan and the U.K. Furthermore, gum arabic4 is won from Aca-cia woodlands, some of which is also exported (EC-FAO 1999).
The non-timber forest products represent important alternative sources of livelihood especially in the dry land areas. They contribute to poverty alleviation by providing in-come and foreign exchange earnings as well as food, improved nutrition and medicine. Farmers in some communities in Miombo woodlands derive up to 58 % of their cash income from the sale of honey, charcoal, firewood, wild fruits and vegetables (CIFOR, 1999, EC-FAO 1999).
Furthermore, Tanzania has an estimated area of 127,000 ha of bamboo forests. Bam-boo contributes to poverty alleviation in rural areas due to it’s multipurpose use, for ex-ample as material for baskets or as bamboo juice / liquor, which can be produced and traded by rural people (EC-FAO 1999).
4 Gum Arabic is a substance won from the sap of acacia trees and is used for various purposes, for exam-
ple as a food additive (as thickening agent, emulsifier, stabilizing agent), in artists paints, in cosmetics and as lickable adhesive on stamps and cigarette papers.

Biomass production and consumption patterns in Tanzania
Page 28
4.2 Regional distribution and utilisation of forest resources
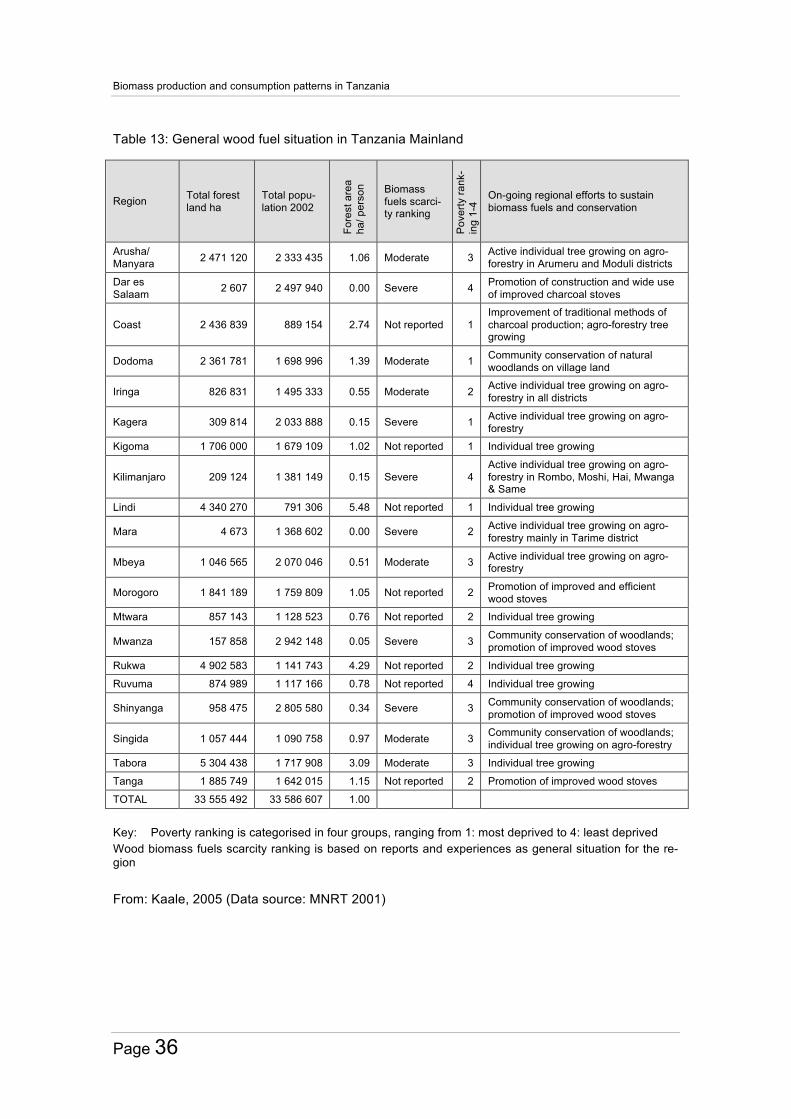
Detailed and up-to-date regional-level data on forest production and wood products trade is not available. The FAOSTAT database only offers data for the national level (as is presented in chapter 4.1.1). The only set of comprehensive regional data on for-est resources found was that presented by Kaale (2005), focussing on wood fuels (see Table 12 and Table 13).
The distribution of forest resources across Tanzania is uneven. Based on data of 2001, the region with the largest forest area is Tabora, followed by Rukwa and Lindi. These three regions in southern and eastern Tanzania are also the regions with the largest forest area per person, albeit in opposite order (see Table 8). As to be expected in an urban area, Dar es Salaam has the smallest forest area of all regions. Wood resources are also scarce in the regions bordering Lake Victoria, namely Mara, Mwanza and Ka-gera as well as in Kilimanjaro region (Kaale 2005).
Table 8: Regional distribution of forest resources
Region Forest area in 1000 ha Forest area ha per person Regions with large forest resources Tabora 5 304 3.09 Rukwa 4 903 4.29 Lindi 4 340 5.48 Regions with scarce forest resources Dar es Salaam 2.6 0.00 Mara 4.7 0.00 Mwanza 158 0.05 Kilimanjaro 209 0.15 Kagera 310 0.15
From: Kaale, 2005 (Data source: MNRT 2001)
At the Better-iS stakeholder workshop held in Bagamoyo, Tanzania in December 2010, stakeholders were asked which regions are most affected by pressure on forest re-sources and deforestation and for which reasons. Table 9 summarizes the responses by listing the regions mentioned by stakeholders, recording how many stakeholders mentioned a specific region, and the reasons for deforestation provided by the stake-holders. Most stakeholders mentioned several regions.

Final Better-iS Report of Wuppertal Institute
Page 29
Table 9: Regions most affected by deforestation and reasons for pressure on forests
Region Times mentioned Reasons of deforestation/ degradation
Shinyanga 5 • Climatic conditions: drought • High population density • Large number of livestock
Dodoma 4 • Drought • Pressure from livestock
Singida 3 • Drought Kilimanjaro 2 • High population density, trees used for energy purposes
• pastoralism Kigoma 2 • Food producing region, affected by refugees who cut
down trees for energy purposes and to clear land for culti-vation
Arusha 2 • Pressure from livestock Manyara 1 • Pressure from livestock Mwanza 1 • Drought Rukwa 1 • Food producing region, affected by refugees who cut
down trees for energy purposes and to clear land for culti-vation
Mbeya 1 • Tea curing industry using wood fuel Dar es Salaam 1 • Increasing population size and domestic energy demand Coast 1 • Wood fuel demand in Dar es Salaam, easy transportation Morogoro 1 • Proximity to Dar es Salaam (= main market for charcoal) Semi-arid central regions
1 • Fragile ecosystems
Source: Stakeholder statements at Better-iS workshop, December 2010.
It becomes clear that the reasons for pressure on forest resources vary strongly with region. In the regions of the central highlands, drought and pastoralism/ pressure from livestock are mentioned as main reasons for deforestation (see chapter 6.1.4 for more information on conflicts associated with livestock). In some of the densely populated northern regions (such as Kilimanjaro and Shinyanga), high population density and the associated large demand for wood fuels are also important drivers. In Kigoma and Rukwa, the two regions bordering the Democratic Republic of Congo, the influx of ref-ugees is putting additional pressure on forest resources. In Dar es Salaam and the sur-rounding regions Coast and Mororgoro, the charcoal demand of the capital is the main driver for deforestation or forest degradation.
A study by the World Bank (2005) found a negative correlation between forest area and road density in the different regions. This finding is in accordance with observa-tions by Milledge et al. (2007), who noted a rapid increase in illegal and legal logging

Biomass production and consumption patterns in Tanzania
Page 30
activities in southern Tanzania in response to infrastructure improvements facilitating access to the forests.
Furthermore, the distance to centres of demand plays an important role with regard to the rates of deforestation and forest degradation. Ahrends et al. (2010) studied the spatial and temporal distribution of forest degradation around the city of Dar es Sa-laam. They found that three waves of degradation exist around Dar es Salaam, the extent of which was measured along a transect stretching south from Dar es Salaam in 1991 and again in 2005. Within the innermost wave, the extraction of low-value wood for charcoal is dominant, which is mainly used as cooking fuel by Dar es Salaam resi-dents. In 1991, this activity was dominant within a distance of 20 km of Dar es Salaam (extended charcoal production within 50 km). In 2005, charcoal production had become dominant within a 50 km belt from Dar (extended charcoal production within 170 km). The zone where charcoal production is dominant had thus moved 2 km per year.
The second wave of degradation is characterised by the extraction of low- and medi-um-value timber used for construction purposes in Dar es Salaam as well as for export. In 1991, this middle wave was dominant within a belt of 20-50 km from Dar es Salaam, extending outwards up to 100 km. In 2005, low- and medium-value timber extraction dominated at 50-170 km distance from Dar, thus the outer boundary of this zone had moved 120 km over 14 years. The outermost wave of degradation is driven by the ex-traction of high-value timber, which is also used for construction purposes in Dar es Salaam and for export. In 1991, this zone started at 50 km distance from Dar; in 2005 it started at 170 km distance and extended to at least 220 km and possibly beyond (the study only sampled up to 220 km distance). Thus, the innermost boundary of the high-value timber extraction zone had moved around 9 km per year (Ahrends et al. 2010).
This systematic depletion of forest radiating outwards from Dar es Salaam is strongly reflected in tree density and species richness. In 2005, 25 trees per ha were measured within a 20 km radius from Dar es Salaam, thus forests were practically removed. With-in a 20-50 km radius, 99 trees per ha were counted and forest canopies were no longer closed. At a radius of ≥200 km, 193 trees per ha were found. Accordingly, the number of different tree species and aboveground stored carbon in live trees was also found to decrease with proximity to Dar es Salaam. Considering the trend of rising demand for timber and charcoal, Ahrends et al. (2010) predicted a total depletion of high-value tim-ber within a 220 km radius from Dar es Salaam by 2010; also the wave of charcoal ex-traction is expected to continue moving outwards (Ahrends et al. 2010). This prediction is supported by statements of stakeholders made at the Better-iS workshop held in December 2010, who mentioned Morogoro as an important supply region of charcoal to Dar es Salaam. The distance from Dar es Salaam to the border of Morogoro region is around 140 km following the main road.

Final Better-iS Report of Wuppertal Institute
Page 31
4.3 Focus biofuels from forest resources and other woody biomass
90 – 97 % of the total wood production is used as wood fuels (firewood and charcoal) (FAOSTAT 2005; Kaale 2005). However, it is difficult to obtain reliable data on the ac-tual consumption levels of wood fuels:
Table 10: Comparison of different charcoal conversion factors
Kaale (2005) FAO (2004)
World Bank (2009) FAO (2010)
Base year 2003 2003 2009 2010 Roundwood in million m3
44.8 used for energy
29 34.3 For charcoal: 8.5
36.6
Wood fuel - 21.3 million m3 of firewood and roughly 1.3 million t of charcoal
1 million t 22.6 million m3 of firewood and 1.6 million t of charcoal
Charcoal conversion factor
- 6 10 10 (conversion factor t in m3 is 0.85)
10
Sources: Kaale 2005, FAO 2004, FAOSTAT, World Bank 2009
According to Kaale (2005), 44.8 million m3 of solid round wood were used for energy generation in 2003 (1 - 1.5 m3 per capita). Frey (2002) uses a conversion factor of around 7 (t of charcoal to t of wood) for his business as usual scenario and a factor of around 5 for the scenario with improved kilns. Lusambo (2009) states that 36 million m3 of wood fuels were used.
FAO estimates for the same year are lower at 21.3 million m3 of firewood and roughly 1.3 million t of charcoal. To calculate the roundwood equivalent of charcoal and convert t into m3, the FAOSTAT uses a factor of 6, which would mean that 7.7 million m3 of wood were used for charcoal, adding up to a total volume of 29 million m3 of solid roundwood used as wood fuels in 2003. The conversion factor of 6 assumes use of a brick kiln and a moisture content of the wood of 15 %. In Tanzania however, the use of earth kilns is more common, for which a conversion factor of 10 (at 15 % moisture) is given (FAO 2004). Under these conditions, 13 million m3 of wood would have been needed to produce 1.3 million t of charcoal, resulting in a total of 34.3 million m3 of wood consumed as wood fuels in 2003.
The World Bank (2009) uses a ratio of 10:1 between t of wood and t of charcoal, as-suming the efficiency of traditional kilns used to convert wood to charcoal is 8 – 12 % (see chapter 4.3.1). The conversion factor used to convert t to m3 is 0.85. For 2009, the World Bank estimates that 1 million t of charcoal where consumed in Tanzania, which corresponds to 8.5 million m3 of wood used for charcoal alone using those conversion factors.
The latest FAOSTAT data are for 2010, when 22.6 million m3 of firewood and 1.6 mil-lion t of charcoal were used, adding up to a total wood fuel use of 36.6 million m3 (using the conversion factor of 10) (FAOSTAT, FAO 2004).

Biomass production and consumption patterns in Tanzania
Page 32
Comparing the properties of firewood and charcoal as household fuels
The combustion properties of wood fuels are determined by many factors, such as moisture content, energy content, mass, volume and density (FAO 2004).
The moisture content of wood fuels depends on the time of harvesting, the location, type and duration of storage and the fuel preparation. While freshly harvested wood has a moisture content of 50 % or more, air-dried wood normally contains between 12 and 20 % moisture (FAO 2004). The moisture content is critical to the amount of heat, which can be derived from wood fuels. The higher the moisture content, the more en-ergy is consumed by vaporization of the water, which means that less energy is re-leased as heat. The net calorific value describes this energy content, which is left after the water has evaporated (FAO 2004; Serup et al. 2005). Completely dry wood has a net calorific value of around 18.5 MJ/kg, whereas at a moisture content of 88 %, the net calorific value becomes zero: all energy is used to vaporize the water (FAO 2004). ng burning (Serup et al. 2005).
Table 11 provides an overview of the net calorific values of wood, charcoal and other biomass and fossil fuels. Wood fuel should preferably have as low a moisture content as possible, desirably around 20 % and below, because at higher moisture contents it burns with much lower efficiency and smoke formation increases, which poses a threat to health and causes a buildup of tar and soot in the chimney during burning (Serup et al. 2005).
Table 11: Net calorific values of various biomass and fossil fuels common in sub Saharan Africa
* Based on the following assumptions: moisture content of air-dry wood = 15 % (wet basis), moisture content of charcoal = 5 % (wet basis). 1.5 m3=1 t air-dry wood, 6.67 m3 of wood (air-dry) [4.45 t] required to make 1 t charcoal (6.67 kg wood for 1 kg charcoal) Source: Government of Malawi 2009
Charcoal is produced from wood by burning it in kilns in the absence of oxygen, a pro-cess called pyrolysis or carbonization. During this process thermo-chemical reactions take place, which drive out various volatile gases and liquids, such as methanol and
Material Energy Value* Units Molasses 10.0 MJ/Kg Agro-residues 12.5 MJ/Kg Animal dung 13.5 MJ/Kg Firewood (air dry) 15.5 MJ/Kg Charcoal 29.0 MJ/Kg Coal 29.0 MJ/Kg Ethanol 23.0 MJ/l
29.1 MJ/Kg Paraffin/ Kerosene 36.3 MJ/l
43.2 MJ/Kg Liquefied petroleum gas (LPG) 45.0 MJ/Kg
Final Better-iS Report of Wuppertal Institute
Page 33
tar, and leave charcoal. Charcoal has a high fixed carbon content of around 65 – 70 % and an energy content or net calorific value about twice as high as that of firewood. The heat needed for pyrolysis is generated by burning some of the wood: about 10 – 20 % of the wood input is sacrificed for this purpose. Another 60 % of the initial weight is turned into gases and lost to the atmosphere, leaving only 20 – 30 % of the original biomass actually being turned into charcoal (Seboka 2009). Two variables determine the efficiency of charcoal production: the conversion efficiency is the ratio between the weight of charcoal output and the air-dry wood input. Traditional earth kilns have an efficiency of 8 -12 % (World Bank 2009), which means that only 8-12 % of the wood biomass is turned into charcoal. Brick kilns can reach an efficiency of around 30 % (Seboka 2009). The energy efficiency of carbonization can be derived by dividing the net calorific value of the charcoal output by the net calorific value of the biomass input. For a brick kiln, the typical energy efficiency is 65 % (at 15 % moisture content of the wood being converted) (Seboka 2009).
The traditional, inefficient production method practiced in Tanzania and other develop-ing countries means more than 50 % of the heating value contained in the original wood is lost in the production process. Thus, charcoal users consume more wood than direct fire wood users. However, if more efficient charcoal production methods and end uses (improved stoves etc.) were used, the net effect would be positive due to the higher energy content of charcoal (Seboka 2009).
Even though charcoal is at present an inefficient way to use wood fuel from an energy perspective, it has a range of properties which make it the preferred option: • Increased energy content/ lower weight: Since the net calorific value of charcoal is
twice that of firewood, much less weight has to be transported for the same energy yield. This means transportation costs are lower and transportation is easier, which is an important factor in a country like Tanzania, where transportation infrastructure connecting rural areas and urban centers is poor (Seboka 2009, Seidl 2008).
• User friendliness: Charcoal burns evenly and for a long time and thus needs less attendance when cooking compared to firewood. It produces less smoke and nox-ious fumes and is easier to handle due to its smaller size (Seboka 2009, Seidl 2008).
• Easy storage: Since charcoal takes up less room than firewood it can be stored in bags or containers for transport or sale more easily. Since it is not susceptible to degradation by fungi or insects, it can be stored over longer time periods (Seboka 2009).
However, be it charcoal or firewood, the thermal energy yield which can be derived from these energy sources is not only dependent on the calorific value of the fuel but also on the application technique. For example, a three stone-stove commonly used in Tanzania has a far lower thermal energy yield than a modern efficient stove where en-ergy loss is limited.

Biomass production and consumption patterns in Tanzania
Page 34
The bulk of wood fuels are used to generate domestic energy for purposes such as cooking and heating and are collected from natural forests and farmland. Kaale (2005) undertook a detailed analysis on consumers and sources of wood fuels, which is sum-marized in Table 12. Generally, the consumption of wood fuels is as follows:
• 55.7 % as firewood for household cooking and heating • 39.7 % converted to charcoal for use in urban households • 2.9 % in rural industries • 1.6 % for the processing of agricultural crops
Kaale (2005) estimates the national annual allowable wood from the forest resources of Tanzania to be around 67 million m3 of solid wood, while the average demand of wood fuels and other industrial wood products in 2003 was estimated at around 50 mil-lion m3. For 2009, Lusambo (2009) estimates the annual wood fuel consumption to be around 36 million m3 against an annual allowable (sustainable) utilization of 24 million m3 of wood. Kaale (2005) defines deforestation as “progressive removal of trees from wooded land without requisite regeneration“ (p. vi) and estimates the annual deforesta-tion rate being caused by unsustainable charcoal production at over 400,000 ha, while deforestation being caused by cutting firewood for tobacco curing and brick burning is around 20,000 ha per year. According to the World Bank (2009), the loss of 100,000 – 125,000 ha of forest area per year can be attributed to the charcoal sector.
Whether or not supply and demand of wood fuel are balanced on the national scale, the uneven distribution of forest resources and population means that over half of the Tanzanian regions are experiencing acute scarcity of wood fuel, which is contributing to environmental degradation and lowering of living standards. This is particularly sig-nificant for woodlands surrounding urban centres. Table 13 provides an overview of the wood fuel situation in the different regions.

Final Better-iS Report of Wuppertal Institute
Page 35
Table 12: Consumers and sources of wood fuel
Consumers
Estimated annual
firewood consumption
m3 in 2003
Main sources of firewood and other bio-mass fuels to the consumers
Economics
Farm
land
Unr
eser
ved
Fore
sts
Fore
st
Res
erve
s
Gam
e R
eser
ves
Fore
st
indu
strie
s re
sidu
es
Agr
icul
ture
re
sidu
es
Cow
dun
g
Free
co
llect
ion
Pur
chas
ed
Households domestic use In rural areas as firewood
25 000 000 xxxx xxx x x xx x xxxx x
In urban areas as charcoal
17 800 000 x xxxx xxx xx xxxx xx
Sub total 42 800 000
Rural industries Brick burning 344 000 x xxxx xx x xx xxxx
Fish smoking 425 000 xxxx xx x xxxx xx
Bread baking 150 000 x xxxx xx x xx xxxx
Salt production
350 000 xxxx x xxxx xx
Lime production
4 400 xxxx xx xx xxxx
Pottery 20 000 x xxxx x x x x xxxx xx
Processing beeswax
1 000 xxxx xx x xxxx
Beer brewing No data xx xxxx
Smithery (use char-coal)
No data xxxx x xx xxxx
Sub total 1 294 400
Agriculture Tobacco curing
630 000 xx xxxx xxx x xxxx
Tea drying 108 000 xxxx xxx x xxxx Sub total 738 000 Total 44 832 400 Key: xxxx Main source – preference number one xxx Secondary source – preference number two based on accessibility xx Complimentary source based on availability x Used rarely depending on availability or scarcity of fuelwood
Source: Kaale, 2005 (Data source: MNRT 2001)
Biomass production and consumption patterns in Tanzania
Page 36
Table 13: General wood fuel situation in Tanzania Mainland
Region Total forest land ha
Total popu-lation 2002
Fore
st a
rea
ha/ p
erso
n Biomass fuels scarci-ty ranking
Pov
erty
rank
-in
g 1-
4 On-going regional efforts to sustain
biomass fuels and conservation
Arusha/ Manyara 2 471 120 2 333 435 1.06 Moderate 3 Active individual tree growing on agro-
forestry in Arumeru and Moduli districts
Dar es Salaam 2 607 2 497 940 0.00 Severe 4 Promotion of construction and wide use
of improved charcoal stoves
Coast 2 436 839 889 154 2.74 Not reported 1 Improvement of traditional methods of charcoal production; agro-forestry tree growing
Dodoma 2 361 781 1 698 996 1.39 Moderate 1 Community conservation of natural woodlands on village land
Iringa 826 831 1 495 333 0.55 Moderate 2 Active individual tree growing on agro-forestry in all districts
Kagera 309 814 2 033 888 0.15 Severe 1 Active individual tree growing on agro-forestry
Kigoma 1 706 000 1 679 109 1.02 Not reported 1 Individual tree growing
Kilimanjaro 209 124 1 381 149 0.15 Severe 4 Active individual tree growing on agro-forestry in Rombo, Moshi, Hai, Mwanga & Same
Lindi 4 340 270 791 306 5.48 Not reported 1 Individual tree growing
Mara 4 673 1 368 602 0.00 Severe 2 Active individual tree growing on agro-forestry mainly in Tarime district
Mbeya 1 046 565 2 070 046 0.51 Moderate 3 Active individual tree growing on agro-forestry
Morogoro 1 841 189 1 759 809 1.05 Not reported 2 Promotion of improved and efficient wood stoves
Mtwara 857 143 1 128 523 0.76 Not reported 2 Individual tree growing
Mwanza 157 858 2 942 148 0.05 Severe 3 Community conservation of woodlands; promotion of improved wood stoves
Rukwa 4 902 583 1 141 743 4.29 Not reported 2 Individual tree growing
Ruvuma 874 989 1 117 166 0.78 Not reported 4 Individual tree growing
Shinyanga 958 475 2 805 580 0.34 Severe 3 Community conservation of woodlands; promotion of improved wood stoves
Singida 1 057 444 1 090 758 0.97 Moderate 3 Community conservation of woodlands; individual tree growing on agro-forestry
Tabora 5 304 438 1 717 908 3.09 Moderate 3 Individual tree growing
Tanga 1 885 749 1 642 015 1.15 Not reported 2 Promotion of improved wood stoves
TOTAL 33 555 492 33 586 607 1.00 Key: Poverty ranking is categorised in four groups, ranging from 1: most deprived to 4: least deprived Wood biomass fuels scarcity ranking is based on reports and experiences as general situation for the re-gion From: Kaale, 2005 (Data source: MNRT 2001)

Final Better-iS Report of Wuppertal Institute
Page 37
Lusambo (2009) compared wood fuel consumption with wood fuel growth in the dis-tricts of Morogoro (Morogoro Region) and Songea (Ruvuma Region). While in Morogo-ro 90 % of the annual wood fuel consumption is compensated by regrowth, in Songea this is only 19 % (see Table 14).
Table 14: Forest renewability in Morogoro and Songea
District Total wood fuel
consumption (TC) (m3/year)
Total sustainable wood fuel growth (SG)
(m3/year)
Renewability index
(SG/TC)
Morogoro 506 906 455 189 0.90
Songea 446 839 82 894 0.19
Pooled 914 701 538 083 0.59
Data Source: Lusambo 2009
Consumption and availability of household energy in Miombo woodlands in the same districts (Morogoro and Songea) were also studied. 91.4 % of households are using wood fuels (firewood and charcoal) at a rate of 5.8 ± 0.2 m3/household/year (1.16 ± 0.2 m3/capita/year) (Lusambo 2009). In detail:
• 80 – 83 % of households use firewood as a source of fuel at a rate of 7.16 - 7.44 kg/household/day
• 56 – 60 % of households use charcoal as a source of fuel at a rate of 3.44 – 3.56 kg/household/day
Lusambo concluded that on average, household wood fuel consumption is responsible for 45 % of total deforestation in the country. Of that
• (0.0685 – 0.3307) x 10-4 ha/household/day gross deforestation is attributable to firewood consumption
• (1.2 - 4.8) x 10-4 ha/household/day gross deforestation is attributable to char-coal consumption
4.3.1 Focus charcoal
The production and consumption of charcoal are particularly significant in terms of pressure on forest resources. Since the efficiency of kilns used to convert wood to charcoal is usually low (8 - 12 % for traditional earth kilns, up to 23 % for improved kilns (World Bank 2009)), charcoal consumption uses 4 - 6 times as much wood per kg as firewood consumption (Mwampamba 2007). Mwampamba (2007) developed sever-al scenarios to determine the forest area needed to meet future charcoal demand based on current levels of production and consumption. In a median scenario, all public forests could be depleted by the year 2048. The factors with the greatest influence on

Biomass production and consumption patterns in Tanzania
Page 38
the outcome of the different scenarios were proportion of forest regeneration and kiln efficiency, i.e. the production techniques and management.
Consumption pattern of charcoal
There are several estimates of the level of charcoal consumption in Tanzania. Accord-ing to the World Bank (2009), the total annual charcoal consumption is currently around 1 million t; FAOSTAT estimates 1.6 million t for 2010. Mwampamba (2007) es-timates the mean consumption of charcoal by urban households for cooking at 140 kg of charcoal per person and year. The city of Dar es Salaam alone is responsible for 30 - 50 % of the national charcoal consumption (Mwampamba 2007, World Bank 2009), equivalent to 500,000 t in 2009 (World Bank 2009).
Frey (2002) studied the wood demand in the city of Dar es Salaam, which is to 94 % due to charcoal consumption. He estimates, that in 2000, 314,000 t of charcoal were consumed. In a business-as-usual scenario, 720,000 t will be consumed in 2020, which corresponds to 5.1 million t of wood. In a scenario where improved kilns for charcoal production and improved stoves for cooking with charcoal are used, the consumption of charcoal could be reduced to 390,000 t in 2020, corresponding to 2 million t of wood.
The rapid population growth coupled with urbanization leads to increased charcoal consumption, since charcoal is the main energy carrier for urban households (Mwam-pamba 2007). Furthermore, as prices for fossil fuel based energy carriers such as LPG (liquefied petroleum gas), natural gas and also electricity rise, more people choose to use charcoal, leading to a further increase of consumption levels. Between 2001-2007, the proportion of households in Dar es Salaam using charcoal rose from 47 % to 71 %, while the use of LPG dropped from 43 % to 12 % (World Bank 2009, see Figure 10). According to FAO data, the production of charcoal has increased by 41.6 % between 1998 and 2009 (see Table 6). Even though regarding the unit price, other fuels like LPG are competitive or even cheaper, charcoal has the advantage of widespread availability and the possibility to purchase in very small amounts, which is particularly important for households with low and unreliable income (World Bank 2009). Further-more, the initial investment for a traditional charcoal stove is much lower than for stoves using LPG, kerosene or electricity. However, with increasing depletion of forest resources, charcoal prices are also increasing. According to Ahrends et al. (2010) charcoal prices in Dar as Salaam rose from US$ 0.18 per kg in 1997 to US$ 0.27 per kg in 2007, reflecting increasing scarcity of forest resources in the vicinity of the city and thus rising transportation costs.
Economic and value chain structure of charcoal sector
The contribution of the charcoal sector to the wider economy is estimated at around 650 million US$ per year, providing employment and income for several 100,000 peo-ple. The majority of charcoal is harvested from public forests on village land or on farm-land being cleared for agriculture. Some of the wood for charcoal is also harvested from forest reserves under government licenses. Most small-scale producers and trad-

Final Better-iS Report of Wuppertal Institute
Page 39
ers are members of poorer households with limited income alternatives. Also, the ma-jority of producers only occasionally engage in charcoal production at times of financial stress. Once produced, the charcoal is sold to small and large-scale transporters, some of the latter also being wholesalers. The wholesalers sell the charcoal on to small-scale retailers, often women, who sell it in urban centres. Across the value chain, the largest proportion (50 %) of profits goes to large-scale transporters and wholesal-ers. Producers receive around a third of the market price on average, while small-scale retailers receive the smallest share of around 17 % (World Bank 2009).
Depending on the distance and mode of transport (trucks, pick ups, bicycles, animals, push carts), the transport costs can contribute up to 60-70 % to the final price of char-coal. A problem associated with charcoal transports from an efficiency point of view is the breakage of charcoal during packaging and transport, which causes a loss of around 20 %. These fine broken charcoal particles could be used to produce bri-quettes; this is however rarely done in African countries (Seidl 2008).
The charcoal sector is largely informal. This means, that the costs of government li-censes for harvest as well as duties and fees for transportation and trading are avoided by the majority of charcoal traders. Only around 20 % of the charcoal sold in Dar es Salaam is believed to be licensed and taxed. For local and national governments, this corresponds to a loss of 100 million US$ of taxes and levies per year. The World Bank (2009) states that “the charcoal trade is dominated by a small number of powerful and politically connected entrepreneurs who are able to use their influence to further avoid and evade payments of fees and obtaining of licenses” (World Bank 2009: vi).
Factors undermining sustainable use of wood resources and efficiency im-provements in the charcoal sector
The informal nature and profit distribution of the charcoal sector have important impli-cations regarding the potential of efficiency improvements in the production and con-sumption of charcoal and the sustainable management of forest resources.
Since most of the wood for the production of charcoal is harvested without payment of licenses, meaning that the wood resource is free, there is little incentive for producers to invest in more efficient kilns for the conversion of wood to charcoal, as these invest-ments do not pay off (Seboka 2009, World Bank 2009). Experience from several Afri-can countries has shown that the dissemination of improved kilns is strongly hampered when the wood is free (Seboka 2009, Seidl 2008). Furthermore, since producers only receive a small fraction of the market price of charcoal, their capacity for investments in more efficient kiln technology, forest management or the establishment of plantations is limited (World Bank 2009). Another factor is the insecure legal status of charcoal pro-duction. Bans on charcoal production in the past led to charcoal producers being driven underground. This legal environment is not conducive to charcoal producers investing in improved kilns or forest regeneration and also makes it difficult to control the produc-tion process (Mwampamba 2007).

Biomass production and consumption patterns in Tanzania
Page 40
The illegal harvest of wood at no cost and the evasion of fees and taxes mean that the market price of charcoal does not represent the real value of the resource (World Bank 2009). In most African countries, charcoal is under-priced by more than 20-50 % (Sepp 2008). Low consumer prices mean that there are no sufficient incentives for invest-ments in more efficient stoves or switching to other fuels. On the contrary, as the prices of other fuels rise, more people switch to charcoal, as described above (World Bank 2009). Most households burn the charcoal in traditional charcoal stoves, which are made out of metal without insulation, so that a large fraction of the heat can escape unused. The efficiency of these stoves is 10 – 25 %. Improved stoves contain the fire better, feature a ceramic liner as insulation and vents to control airflow. They reach an efficiency of 30 – 50 %, thus charcoal consumption is significantly reduced. However, they are more expensive than traditional stoves and payback times on the investment through savings on charcoal can be several months. With higher charcoal prices how-ever, the payback time would become shorter and thus the improved stove would be more attractive (Seidl 2008). Figures on the market penetration of improved stoves range from 20 – 40 % (World Bank 2009).
Most African governments neglect wood fuels in their energy policies, instead focus-sing all their attention and budgets on “modern” energy such as electricity (Seboka 2009). This was confirmed for Tanzania by stakeholders at the Better-iS workshop held in Bagamoyo in 2010. Similarly, government spending on forest governance is low, prohibiting effective forest management and implementation of existing management policies (Seboka 2009, Experts of Better-iS stakeholder workshop 2010). Since market mechanisms do not provide enough incentive to realise efficiency potentials provided by improved kilns and stoves and to promote sustainable use of forest resources (Sepp 2008, Seboka 2009), a concerted effort of energy and forest policy would be needed to move the wood fuel sector towards sustainability.
4.3.2 Focus biofuels from wood residues
Theoretically, woody biomass, for example wood residues, can be used for the produc-tion of second-generation biofuels. Wood residues are derived from the logging of roundwood or the cultivation of plantations. However, since wood is the most important energy source in Tanzania, most of these residues are used for domestic energy and the amount of unused residues is marginal (MAFC 2009, OECD/IEA 2010). By-products from the processing of wood are used as feedstock for the pulp and paper industry and are therefore also not available for the production of second-generation biofuels (GTZ 2005, OECD/IEA 2010).
However, in specific locations, biofuel value chains based on wood residues may well be feasible. According to Sjølie (2012), East Africa’s largest sawmill Sao Hill Industries in Iringa, Tanzania, produces around 6920 tonnes of oven-dry off-cuts and slabs per year as residues of the sawmilling. As there are no residue buyers such as pulp mills in the area, the residues are dumped in landfills and periodically burned when space for more residues is needed. In 2008, trials were in progress to use those residues for the

Final Better-iS Report of Wuppertal Institute
Page 41
production of charcoal briquettes and charcoal powder. Charcoal briquettes are intend-ed to be used by households in Dar es Salaam, where they would be replacing char-coal from Miombo woodlands, the charcoal powder for utilisation as fuel by a cement mill in Mbeya, substituting imported coal from South Africa. Sjølie (2012) analysed greenhouse gas emissions over the life cycle of those charcoal briquettes and powder compared to charcoal from Miombo woodlands and coal from South Africa. According to her results, the substitution of imported coal with charcoal powder from sawmilling residues within the described scenario could reduce greenhouse gas emissions by 83-91 %; the substitution of charcoal from Miombo woodlands with charcoal briquettes from the sawmill could achieve a greenhouse gas reduction of 42-84 % (Sjølie 2012).
4.4 Focus CO2 -emissions from deforestation and wood fuels
The world’s forests play an important role in the global carbon cycle. Forests sequester carbon in their biomass and can reduce atmospheric CO2 concentrations, e.g. when their area or productivity increases. On the other hand, forests can act as a carbon source when biomass is burned or decomposed (Zahabu 2008, IPCC 2007a, FAO 2010). According to IPCC (2007b), deforestation, forest biomass decay and peat land degradation were the second largest emitter and responsible for 17,3 % (8.5 Gt CO2 e) of total global anthropogenic greenhouse gas emissions in 2004.
In 1990, total greenhouse gas emissions in Tanzania accounted for 64,885 Gg (CO2 e). The major emitter of greenhouse gases (87 % of all emissions) was the land use change and forestry sector, followed by the energy sector with 6 % and the agriculture sector with 5.7 %.
Taking the “Global Warming Potential” (GWP) with IPCC guidelines into account land use and forestry are the major emitters of greenhouse gases with 58 %, followed by agriculture with 29 % and energy with 12 % in 1990 (United Republic of Tanzania 2003). The major contributors for greenhouse gas emissions are: clearing of forest and grassland for permanent agriculture and livestock development, overgrazing and sa-vannah burning.
Conversions in land use lead to changes in the quantity of biomass. Because biomass consists of about 45 % carbon by weight, forest clearing leads to the release of carbon dioxide (CEEST 1999). In 1990, the land use and forestry sector was the major emitter with 56,664 Gg of CO2. At the same time this sector removed 3,745 Gg of CO2 from the atmosphere. The net emission was 52,919 Gg (United Republic of Tanzania 2003).
Clearing by burning also releases other greenhouse gases such as methane, carbon monoxide etc. into the air (CEEST 1999). Table 15 shows the greenhouse gas emis-sions and removals from forestry and land use in 1990.
Table 12 contains relatively old data because of a lack of studies that are up to date. According to annual change rates of -1 % of the forest area and the decline of carbon stock in living biomass (-24,000 tonnes) between 2000-2010 (FAO 2011), it becomes

Biomass production and consumption patterns in Tanzania
Page 42
clear that greenhouse gas emission must have increased due to the decline of forest area and loss of biomass. Because of the need of reliable data on soil organic carbon stocks and stock changes in terms of deforestation, degradation and changes in land use, a new FAO soil survey project was established (FAO 2012a). The FAO project should be able to provide reliable data in the future to allow the government to make informed decisions to reduce carbon emissions and increase carbon stocks (FAO 2012b).
Table 15: Emissions and removals due to land use changes (forestry + land use) in Tanzania (Gg) in 1990
Sectorial source or sink (-) activity CO2 CH4 NOx N2O CO
Forest clearing for agri-culture
• On-site burning • Decay of cleared biomass • Total
569.03 158.03
727.06
2.485 -
2.485
0.617 -
0.617
0.017 -
0.017
27.158 -
27.158
Abandon-ment of managed lands
• Wooded grasslands • Tropical open forests • Total
-1 353 -577.50
-1 939.50
- - -
- - -
- - -
- - -
Manage-ment of forests
• Wood exploited informally (wood fuel, clearing for ag-riculture)
• Plantation forests • Natural forest subject to
human activity (shifting cultivation)
• Village woodlot, and urban tree planting
• Total
55 937.51
-1 351.35 -363.32
-99.10
54122.75
-
- -
-
-
-
- -
-
-
-
- -
-
-
-
- -
-
- Others • Shifting cultivation
• Man-made flooded lands • Total
- -
-
0.715 0.404
1.119
0.138 -
0.138
0.005 -
0.005
4.173 -
4.173 Total 52 919.30 3.064 0.755 0.022 31.331
Source: CEEST 1999
Besides the greenhouse gas emissions from deforestation and land use change, there are additional emissions in the energy sector from using wood fuels (firewood and charcoal). The energy sector is important because 89 – 90 % of energy consumption is biomass, mainly firewood and charcoal (small amounts of plant and animal waste) (AfDB/OECD 2004).
90 – 97 % of the total wood production in Tanzania is for the supply of wood fuels (FAOSTAT 2005; Kaale 2005; The World Bank 2009). As already mentioned (see chapter 3.2), about 55 % of wood fuels are used as firewood for cooking and heating in households. Approximately 40 % of timber is converted to charcoal for urban house-holds (Kaale 2005).

Final Better-iS Report of Wuppertal Institute
Page 43
Furthermore production and use of charcoal and fuel wood in Tanzania is inefficient because of traditional and out-dated conversion technologies (see chapter 3.3). Using traditional charcoal production methods means that less than 15 % of original wood biomass is turned into charcoal (World Bank 2009). Table 13 shows the emission rates by using and burning wood fuels.
Table 16: Emission rates (g/kg dry matter) during charcoal production & use of wood fuels
CO2 CO CH4 NOx
Fuel wood 1 500 70 4.5 1.0
Charcoal (production) 1 593 254 39 0.073
Charcoal (consumption) 2 740 230 8 3.9 Source: Sitoe (2008), cited in Seboka (2009)
With increasing greenhouse gas emissions5 the climate volatility in Tanzania could in-crease “(…) with agricultural productivity expected to become increasingly volatile as well. For agriculture‐dependant developing countries, where poverty is sensitive to food production and food production is sensitive to climate (as is the case in Tanzania), ris-ing climate volatility could have important implications for poverty vulnerability.” (Ah-med et al. 2009: 17)
5 „All the models agree that the average January‐June growing season temperatures in the ear-ly 21st Century are going to be higher than in the 20th Century should greenhouse gas concen-trations continue to rise.” (Ahmed et al. 2009: 4)

Biomass production and consumption patterns in Tanzania
Page 44
5 Energy production and consumption in Tanzania Energy consumption in Tanzania is split between the following energy carriers (from AfDB/OECD 2004, Lusambo 2009, MEM 2010b):
• 89 - 90 % biomass (mainly firewood and charcoal, small amounts of plant and animal wastes)
• 8 – 8.2 % petroleum (imported)
• 1.2 - 2 % electricity (mainly from natural gas and hydropower)
• 0.8 % coal and renewable sources (like solar energy)
Van Eijck et al. (2008) estimate the proportion of biomass energy to be 97 % of the total energy consumed. The average annual growth of energy consumption over the period 1999 - 2004 was 4.7 % per year (van Eijck et al. 2008). According to IEA Statis-tics, national energy consumption was 18.28 million toe6 in 2009. Other sources give higher estimates of 22 million toe, which is equivalent to 0.7 toe/capita/year (Lusambo 2009). The primary energy supply by energy carrier is depicted in Figure 6.
Figure 6: Primary energy supply by energy carrier
From: OECD/IEA 2010, Source: IEA Statistics, 2009
According to estimates by the Ministry of Energy and Minerals, 1.7 million tonnes of petroleum products were consumed in Tanzania in 2008 (MEM 2010b). In 2010, con-sumption reached 1.98 million m3 according to data provided by EWURA, the Tanzani-an Energy and Water Utilities Regulatory Authority.
Figure 7 provides an overview of the development of petroleum products consumption over the last 20 years. 6 toe = tonne of oil equivalent. The amount of energy released by burning one tonne of crude oil.
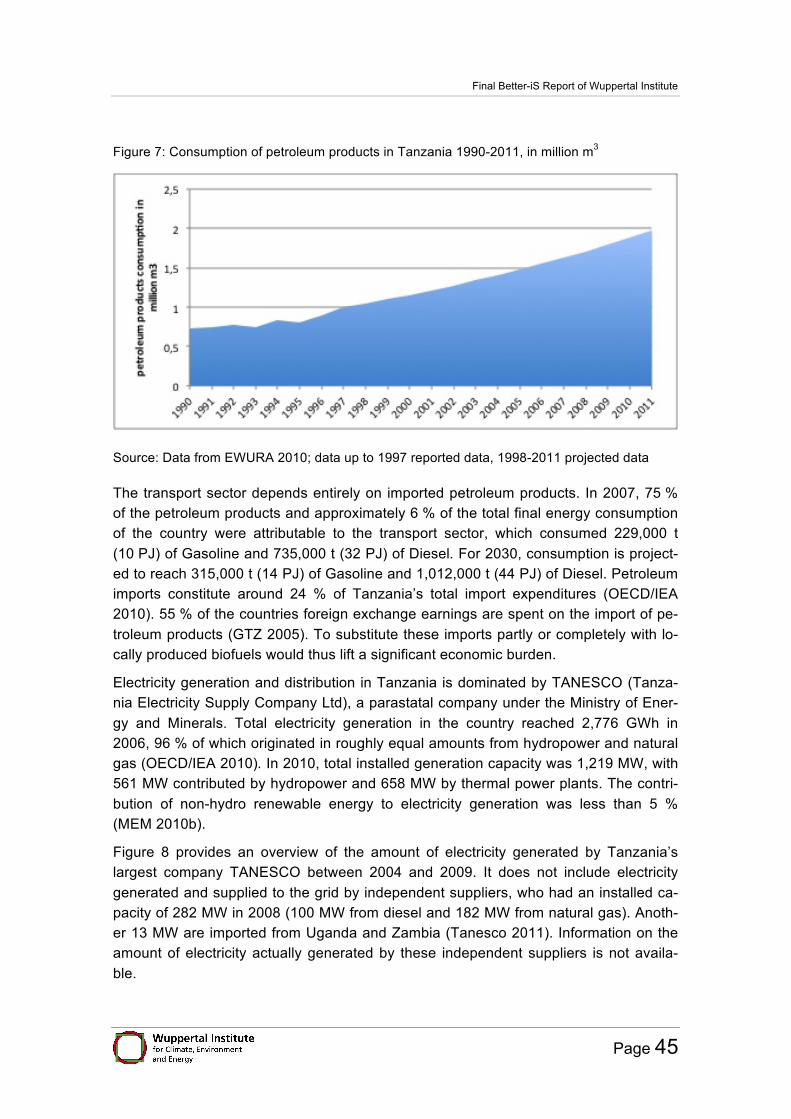
Final Better-iS Report of Wuppertal Institute
Page 45
Figure 7: Consumption of petroleum products in Tanzania 1990-2011, in million m3
Source: Data from EWURA 2010; data up to 1997 reported data, 1998-2011 projected data
The transport sector depends entirely on imported petroleum products. In 2007, 75 % of the petroleum products and approximately 6 % of the total final energy consumption of the country were attributable to the transport sector, which consumed 229,000 t (10 PJ) of Gasoline and 735,000 t (32 PJ) of Diesel. For 2030, consumption is project-ed to reach 315,000 t (14 PJ) of Gasoline and 1,012,000 t (44 PJ) of Diesel. Petroleum imports constitute around 24 % of Tanzania’s total import expenditures (OECD/IEA 2010). 55 % of the countries foreign exchange earnings are spent on the import of pe-troleum products (GTZ 2005). To substitute these imports partly or completely with lo-cally produced biofuels would thus lift a significant economic burden.
Electricity generation and distribution in Tanzania is dominated by TANESCO (Tanza-nia Electricity Supply Company Ltd), a parastatal company under the Ministry of Ener-gy and Minerals. Total electricity generation in the country reached 2,776 GWh in 2006, 96 % of which originated in roughly equal amounts from hydropower and natural gas (OECD/IEA 2010). In 2010, total installed generation capacity was 1,219 MW, with 561 MW contributed by hydropower and 658 MW by thermal power plants. The contri-bution of non-hydro renewable energy to electricity generation was less than 5 % (MEM 2010b).
Figure 8 provides an overview of the amount of electricity generated by Tanzania’s largest company TANESCO between 2004 and 2009. It does not include electricity generated and supplied to the grid by independent suppliers, who had an installed ca-pacity of 282 MW in 2008 (100 MW from diesel and 182 MW from natural gas). Anoth-er 13 MW are imported from Uganda and Zambia (Tanesco 2011). Information on the amount of electricity actually generated by these independent suppliers is not availa-ble.

Biomass production and consumption patterns in Tanzania
Page 46
Figure 8: Electricity generated (in GWh) by Tanesco-owned installations, by type, 2004-2009
Source: Data from Tanesco 2010
While on the national scale, around 14 % of the population have access to the electrici-ty grid (MEM 2010b); the rural electrification rate is only 1 % (urban electrification: 39 %). Regional electrification rates vary between 2 - 56 % (Lusambo 2009). According to the Ministry of Energy and Minerals, the electricity demand is expected to triple by 2020 (MEM 2010b). An important development potential lies in rural electrification on the basis of biomass.
Figure 9 shows the distribution of power plants and power lines in Tanzania, as well as the population density. According to this map, especially the less densely populated regions in southern, western and central Tanzania largely lack electricity supply. In these regions, only the cities possess isolated thermal power stations, whereas grids into the rural areas appear to be non-existent. This is true for Rukwa and Kigoma re-gions in western Tanzania. Morogoro region on the other hand appears to be at least partly connected to the national grid and possesses a large hydropower plant, so elec-trification rates are likely to be higher than in the other two regions mentioned.
According to AICD (2010), the development of the power sector in Tanzania is lagging behind most other African countries. The main problems are low access to power sup-ply, low power consumption and poor reliability of supply. Power outages occur fre-quently and represent a significant economic burden. Many companies therefore rely on own power generation, which increases production costs. The costs of maintaining emergency power supply are also high. The national power company TANESCO is operating inefficiently, hidden costs are high due to distribution losses, under-pricing and collection losses. Consequently, revenues generated by TANESCO barely cover operational costs, so that capital investments have to be subsidised by the public sec-tor or by donors (AICD 2010).

Final Better-iS Report of Wuppertal Institute
Page 47
Figure 9: Distribution of power plants, power lines and population density in Tanzania
Source: AICD 2011; population 2005 estimate
Other fuel sources and their use
In urban areas, where a number of different fuels are available, the choice of fuel is closely related to income and education level. In Dar es Salaam, firewood users were found to have the lowest income and education levels, while charcoal and kerosene users are generally low-middle-income households and a majority has completed sec-ondary school. LPG users were the group with the highest income level. However, charcoal is often used as part of a mix of energy sources even by higher income households. Besides low cost, the widespread availability of charcoal and the possibil-ity to frequently purchase small amounts are also important factors for its use (World Bank 2009). Figure 10 shows the development of the use of different fuels in Tanzania from 1991 to 2007. In Dar es Salaam charcoal is the main energy source for cooking while in the rural areas and Mainland Tanzania firewood is almost the only source. The use of paraffin/kerosene and electricity has decreased from 1991 to 2007 in all areas, especially in Dar es Salaam. While the use of firewood as an alternative source to
!
!
!

Biomass production and consumption patterns in Tanzania
Page 48
charcoal has increased in Dar in that period, the use of charcoal has increased in Mainland Tanzania.
Figure 10: Sources of energy for cooking in Tanzania, 1991 - 2007
Source: World Bank 2009
Lusambo (2009) studied consumption and availability of household energy in Miombo woodlands of Eastern and Southern Tanzania, namely in the Districts of Morogoro (Morogoro Region) and Songea (Ruvuma Region). (0.0685 – 0.3307) x 10-4 ha/household/day gross deforestation is attributable to firewood consumption. The total energy consumption in the studied regions is 1.2005 ± 0.04 toe/household/year. The proportion of different energy carriers is as follows:
CHAPTER 2 THE CHARCOAL SECTOR IN TANZANIA — AN OVERVIEW
Charcoal Use and Consumption Patterns
Charcoal is the main energy source for Tanzania’s urban population. Although electricity and gas are the principal energy sources among wealthier households, these households still use considerable quantities of charcoal. Most public and private
urban institutions in Tanzania (such as bars, restaurants, schools, and hospitals) also use signifi cant quantities of charcoal as their principal source of energy for cooking. Across the whole country, only 10 percent of the population uses electricity as their primary energy source. Household energy use patterns over the recent years are presented below in fi gure 2.1.
SOCIOECONOMIC CONSIDERATIONS
4
FIGURE 2.1 SOURCES OF ENERGY FOR COOKING IN TANZANIA, 1991 TO 2007
0%
20%
40%
60%
80%
100%
91 /92 00 /01 2007 91 /92 00 /01 2007 91 /92 00 /01 2007 91 /92 00 /01 2007
Dar es Salaam Other urban areas Rural areas Mainland Tanzania
Electricity Paraffin /Kerosene Charcoal Firewood Other
Source: Government of Tanzania 2008: Household Budget Survey 2006/07

Final Better-iS Report of Wuppertal Institute
Page 49
Figure 11: Energy carriers for household consumption in Morogoro and Songea Districts, pro-portions in %
Source: Own figure using data from Lusambo 2009
One factor, which determines the consumption pattern, is the availability of different fuel sources at different locations. Not all households have access to all energy sources. The accessibility by household for the different energy sources for cooking and heating purposes is:
§ Firewood: available to 80-83 % of households
§ Charcoal: available to 56-60 % of households
§ Crop residues: available to 17 % of households
§ Electricity: available to 14.6 % of households
§ Kerosene: available to 83 % of households
§ Natural gas: available to 0.2 % of households
§ Solar: available to 0.2 % of households
As was mentioned already, besides accessibility, the fuel choice is also determined by household income and education level. Lusambo (2009) found that the location of the household, residence ownership and dwelling category are further significant factors influencing fuel choice. His results further suggest, that access to electricity has the largest potential effect in reducing the use of wood fuels. If household accessibility to electricity were increased by 10 %, the share of firewood in the total fuel mix would be reduced by 2.78 %. A 10 % increase of household income in comparison will only re-duce the share of firewood in the total fuel mix by 0.55 %; improved housing (to mod-ern house) by 10 % will reduce the share of firewood in the total fuel mix by 1.10 % (Lusambo 2009).

Biomass production and consumption patterns in Tanzania
Page 50
Another significant problem in relation to household’s energy consumption in Tanzania is fuel poverty. According to the definition that households that spend more than 10 % of their income on energy are fuel poor, Lusambo (2009) found 72 % of Tanzanian households to be fuel poor. His results show that
§ 21 % of households spend between 10-20 % of their income on energy
§ 47 % of households spend between 20-80 % of their income on energy
§ 4 % of households spend more than 80 % of their income on energy

Final Better-iS Report of Wuppertal Institute
Page 51
6 Agricultural biomass production and consumption The status quo and trends of agricultural biomass patterns with a balance of produc-tion, exports, imports and consumption is given in the following. Crop production and crop area of the different crops as well as the regional agricultural difficulties are pre-sented. A main focus is set on the production of liquid biofuels. The biofuel value chain from sugar cane, palm oil, jatropha and agricultural residues is regarded and potentials for smallholders are shown. Furthermore results of SWOT analyses are presented.
6.1 Status quo and trends: agricultural biomass
In this section agricultural production and consumption on national as well as regional level is described. An overview of the agro-ecological zones of the four case study re-gions is shown in Table 2.
6.1.1 National balances of production and consumption including trade
Data on the consumption of agricultural biomass in Tanzania is scarce, and therefore the creation of a national balance of production and consumption, including imports and exports, is difficult. A broad overview can be obtained through commodity balanc-es produced by FAOSTAT. These balances present production, trade, domestic supply and different uses of the commodities (consumption). In Figure 12 below, only aggre-gate categories of crops are displayed in order to provide a complete overview. The commodities “include the equivalents of their derived products falling in the same commodity group, but exclude the equivalents of by-products and derived commodi-ties, which through processing, change their nature and become part of different com-modity groups.“ (FAOSTAT 2010) For example, wine is included in the alcoholic bev-erages category rather than the fruits category.
These commodity balances provide a useful overview of agricultural products, howev-er, they do not capture all agricultural biomass, which also includes by-products and residues such as stalks, leaves, husks, shells etc., which can be of high importance in the context of biofuels and energy generated from biomass.
Figure 12 provides an overview of domestic supply of different crops in Tanzania. Do-mestic supply equals production + imports + stock variation – imports. Table 38 gives the whole data set (FAOSTAT 2012, see Appendix). Within 1999-2009 domestic sup-ply of crops has been growing.

Biomass production and consumption patterns in Tanzania
Page 52
Figure 12: FAOSTAT Commodity Balance 1999 – 2009: Domestic Supply in tonnes and growth in percent (of crop primary equivalent)
Data Source: FAOSTAT 2012
Total production amounted 2,780,343 t, total exports amounted 57,384 t, total imports amounted 147,743 t and stock variation amounted 39,131 t in 2009. This resulted in domestic supply of 2,910,014 t in 2009 (crop primary equivalent). The commodities with the largest positive domestic supply contributing to this are cereals, starchy roots, fruits, and sugar crops (see FAOSTAT 2012). This has important implications when considering potential biofuels development options from sugar cane (ethanol) and oil crops (straight vegetable oil or biodiesel), as a competition with food uses seems likely under these conditions.
0
500000
1000000
1500000
2000000
2500000
3000000
3500000
Vegetables
Vegetable Oils
Sugarcrops
Sugar & Sweeteners Starchy Roots
Pulses
Oilcrops
Fruits - Excluding Wine Cereals - Excluding Beer Alcoholic Beverages
Growth in%
26,06
43,30
137,44
98,94
31,06
22,91
55,04
86,78
92,69
45,21

Final Better-iS Report of Wuppertal Institute
Page 53
Table 17: FAO Commodity Balance, crop, livestock and fishery, 2009
Item (all in 1000 t): 2009
Pro-duc-tion Import
stock varia-tion
Ex-port
Do-mes-tic Sup-ply
differ-ence produc-tion-supply*
food supply feed seed
pro-cess-ing
other util
waste
Alcoholic Beverages
2.758 21 0 8 2.771 -13 2.732 0 127 468 0 39
Cereals - Excluding Beer
5.252 1.016 280 73 6.475 -1.223 4.556 723 26 387 7 594
Fruits - Excluding Wine
4.534 33 0 5 4.562 -28 3.354 13 58 600 0 807
Oilcrops 1.344 29 29 100 1.302 42 502 0 0 0 91 84
Pulses 1.084 7 27 113 1.005 79 857 20 0 0 0 70
Spices 20 0 0 9 12 9 11 0 0 0 0 0 Starchy Roots
8.036 26 0 19 8.042 -7 7.038 570 139 0 47 249
Stimulants 108 1 -7 96 5 102 5 0 46 0 0 1 Sugar & Sweeten-ers
307 120 0 7 419 -113 416 0 0 3 0 0
Sugar-crops
2.370 0 0 0 2.370 0 4 0 0 2.300
0 20
Treenuts 101 1 40 118 24 77 23 0 0 0 0 1 Vegetable Oils
153 219 25 14 383 -230 292 0 0 0 92 0
Vegetables 1.738 5 0 13 1.730 8 1.499 0 0 0 0 235
Animal Fats
39 1 0 0 40 -1 40 0 0 0 0 0
Aquatic Products, Other
108 0 0 10 98 10 0 0 0 0 98 0
Eggs 33 0 0 0 33 0 28 0 4 0 0 1 Fish, Sea-food
342 7 0 100 249 93 248 1 0 0 0 0
Meat 417 2 0 1 419 -2 419 0 0 0 0 0 Milk - Ex-cluding Butter
1.710 24 0 0 1.734 -23 1.665 0 0 0 0 68
Offals 54 0 0 0 54 0 54 0 0 0 0 0
Source: FAOSTAT 2012

Biomass production and consumption patterns in Tanzania
Page 54
Figure 13: Production and trade of important commodities 1997 and 2007
Source: Data from FAOSTAT 2011
Another striking aspect is the large amount of agricultural commodities, which goes to waste, 2,687,000 t in total in 2007. The largest part of commodities going to waste comes from fruits, followed by starchy roots and cereals. The waste category refers mainly to losses occurring during transport and storage. According to the FAO, „Distri-bution wastes tend to be considerable in countries with hot humid climate, difficult transportation and inadequate storage or processing facilities. This applies to the more perishable foodstuffs, and especially to those which have to be transported or stored for a long time in a tropical climate.“ (FAOSTAT 2011b, Glossary, Waste).
The Tanzanian Ministry of Agriculture, Food Security and Cooperatives (n.d.) provides balances of food production versus consumption, since the knowledge of this balance is important in terms of food security. Figure 14 and Figure 15 show these balances for cereals and non-cereals and their development over the last decade. As to be ex-pected when considering population growth, the demand for both cereals and non-cereals has risen steadily. The production of food has also risen, although less steadi-ly. Furthermore, the production of non-cereal crops shows a steeper increasing trend than the production of cereals.

Final Better-iS Report of Wuppertal Institute
Page 55
Figure 14: National cereals production and requirement 2001-2010
Data source: URT, MAFC n.d.
Figure 15: National non-cereals production and requirement 2001-2010
Data Source: URT, MAFC n.d.

Biomass production and consumption patterns in Tanzania
Page 56
Self sufficiency ratios are another way of expressing the balance of food production and consumption. Here, production is expressed as a percentage of requirement. 100 % means production and demand are identical. Self sufficiency is assumed at val-ues between 100 and 119 %. Values below 100 % describe a food deficit and values above 120 % indicate a surplus. The surplus is set from 120 % rather then 100 % to allow for some loss of food from the region due to trade (personal communication Car-olin Kilemebe). Figure 16 shows self sufficiency ratios for cereals and non-cereals over the last decade. While the self sufficiency ratio for cereals has fluctuated around 85 % without a major trend, the ratio for non cereals has increased from 112 % in 2001/02 to 142 % in 2009/10. Correspondingly, the FAOSTAT commodity balance (see Appendix Table 38) shows significant net imports of cereals and net exports of starchy roots (such as potatoes/ sweet potatoes) and pulses.
Figure 16: National Food Self Sufficiency Ratios for Cereals and Non-Cereals 2001-2010
Data Source: URT, MAFC n.d.
6.1.2 Crop production in Tanzania
Smallholder production
Agriculture in Tanzania is dominated by smallholder farming. About 85 % of the total agricultural land is used by smallholders operating between 0.2 and 2.0 ha and tradi-tional agro-pastoralists keeping an average of 50 cattle (MAFC 2001). Almost 12 Mio ha of land are allocated to smallholders through customary rights or official titles, equivalent to an average area of 2.4 ha per household (URT 2006). At the time of the Agricultural Sample Census conducted during the 2002/03 season, there were roughly

Final Better-iS Report of Wuppertal Institute
Page 57
4.9 Mio agricultural households in Tanzania. Of these, 64 % only grew crops, 35 % grew crops and kept livestock and 1 % only kept livestock (URT 2006).
The area of land allocated to smallholders has remained relatively stable at around 12 mio. ha over the period from 1994 to 2003, but the utilisation of this land has in-creased by a drastic 186 % in the same period. In 2003, 46 % of households reported insufficiency of land. This development indicates that there is significant pressure on the land resources, probably fuelled by population growth. The land pressure was most severe in the regions of Arusha and Kilimajaro, where 77 % and 70 % of households respectively reported insufficiency of land. The least pressure on land was in Ruvuma and Lindi (24 % and 26 % of households with insufficient land resources). The level of land ownership through official titles is very low among smallholder farmers (URT 2006).
In 2003, around 9.5 mio. ha of land were used for crop cultivation (URT 2006). Table 18 gives a broad overview of the land use for crop cultivation, whereas Figure 17 and Figure 18 depict the shares of the most important annual and permanent crops respec-tively.
Table 18: Utilisation of crop land in 2003
Type of crops Area in ha 2003 % of planted area Annual crops 6 545 987 69 Annual-permanent mix 997 796 10 Permanent crops 1 295 050 14 Fallow 682 757 7 Total 9 521 590 100
Source: Tanzania Agriculture Sample Census 2003 (URT 2006)
Annual crops are dominant in smallholder farming systems, mainly grown as monocul-ture (more than two thirds) but also in mixed crop systems. Staple crops for subsist-ence such as cereals (mainly maize, rice, sorghum) roots and tubers (such as cassava and potatoes) and pulses (predominantly beans) occupy around 87 % of the planted area. Annual cash crops are of minor importance at the national level, although in some regions they occupy larger areas (URT 2006).

Biomass production and consumption patterns in Tanzania
Page 58
Figure 17: Proportions of planted area for different annual crop types 2003
Source: Tanzania Agriculture Sample Census 2003 (URT 2006)
Permanent crops occupied around 14 % of the planted area in 2003. There are signifi-cant regional differences in the distribution of theses crops: In coastal areas, cashew nut and coconut are important crops, whereas in the highland areas, banana and cof-fee dominate (URT 2006).
Figure 18: Proportions of planted area for different permanent crops 2003
Source: Tanzania Agriculture Sample Census 2003 (URT 2006)

Final Better-iS Report of Wuppertal Institute
Page 59
The 10 most important individual crops (by planted area) are maize, cassava, beans, rice (paddy) cashew nuts, groundnuts (peanuts), cotton, bananas, coffee and sweet potatoes (see Figure 19).
Figure 19: Planted area (ha) for the main crops 2003
Source: Tanzania Agriculture Sample Census 2003 (URT 2006)
Crop cultivation by smallholders in Tanzania is largely rain-fed and characterised by low inputs of mineral fertilizers and other agrochemicals (Ajayi et al. 2008; URT 2006). Water is a limiting factor for crop production in many areas of Tanzania. In 2003, of the land cultivated by smallholders, only 168,430 ha (2.7 %) of land under annual crops and 183,793 ha (14 %) of land under permanent crops was irrigated. Over the last decade, the irrigated area has remained unchanged. The use of fertilizer is similarly uncommon: In 2003, 87 % of the planted area was without any application of fertilizers. When fertilizers are used, it is most commonly farm yard manure, however, this is de-pendent on livestock keeping. Manure was applied on 18 % of the planted area; rough-ly 7 % was fertilized with inorganic fertilizers and 3 % with compost (some of these dif-ferent types of fertilizers were applied on the same area). The total area with fertilizer application has declined over the last years, both for manure and inorganic fertilizers. The main reason for this is the high cost of fertilizers. The use of pesticides is even less common than inorganic fertilizers and irrigation. Generally, the use of modern (and capital intensive) inputs such as inorganic fertilizers, pesticides, improved seeds and

Biomass production and consumption patterns in Tanzania
Page 60
irrigation is proportionally highest for fruit and vegetables and other cash crops but is not widespread for staple crops (URT 2006).
The use of machinery, ploughs, carts and hired labour is also low. The hand hoe is the main cultivation tool, which is a major limitation on the maximum area that can be farmed per household (MAFC 2001). In some regions, soil preparation by oxen plough-ing is also common. Only 4 % of smallholder households reported the use of tractors. Most households do some agro-processing, most commonly the grinding of maize to flour. This is usually done by machine (which is in most cases not owned by the farm-ing households themselves) or by hand. Almost all of this processing is done for home consumption rather than for selling the processed product (URT 2006).
Around 70 % of crop growing households sell some of their crops. The main problems experienced with the marketing of crops are the low prices offered as well as problems related to market access such as the distance to the market being too far and the transport cost being too high, the lack of transport or buyers and a lack of market in-formation. However, when asked for the main reasons for not selling crops, most households stated that they did not produce enough to have a surplus to sell (URT 2006).
Large scale farming
Within the National Sample Census of Agriculture conducted in 2002/03, a large scale farm is defined as a farm that either:
• Operates at least 20 ha for crop, vegetable, fruit or tree production, or • Keeps at least 50 cattle, 100 goats, sheep or pigs or 1000 chickens, ducks, tur-
keys or rabbits, or • operates 0.5 ha of intensive greenhouse horticulture production or fish farming
production units.
Further definition criteria are that production is mainly for the market, operation is con-tinuous, machinery is applied and the farm has at least one employee (URT 2006b).
Large scale farms covered an area of 1.1 million ha in 2002/03, representing only 9 % of the total area allocated to farms in Tanzania. The average area per farm was 912 ha. Compared to 1994/95 census data, the area occupied by large scale farms has decreased by 22 %, the average size of the farms by 32 %. 85 % of large scale farms in Tanzania are privately operated, the remaining 15 % belong to government or para-statal organisations. In contrast to smallholders, 98 % of large scale farms hold official land titles (URT 2006b).
As with smallholder farming, crop farming is also dominant in large scale farms: 48 % of large scale farm area was allocated to crop production only, 38 % to livestock only and 14 % to crop and livestock mixed systems. However, 14 % of the land allocated to large scale farms was not used. When looking at the land actually used in 2002/03, the dominant land use was pasture, followed by permanent crops and temporary crops.

Final Better-iS Report of Wuppertal Institute
Page 61
Livestock farms are on average much larger (1,713 ha per farm) than crop farms (752 ha per farm) (URT 2006b).
Figure 20 provides an overview of the most important crops in terms of planted area. It can be seen that cash crops dominate, although maize, beans and rice also play an important role in large scale farming.
Figure 20: Top ten crops by area planted on large scale farms in 2002/03
Source: Data from URT 2006b
Levels of irrigation were low in 2002/03: only 14 % of the crop growing area on large scale farms was irrigated. 31 % of farms had erosion control or water harvesting facili-ties. Use of agricultural machinery is much more common on large scale farms com-pared to small scale farms. In most cases, these machines are owned by the farms, although renting also takes place, especially of harvesters, trucks and large tractors (URT 2006b).
89 % of large scale farms reported selling crops. Most of them also reported marketing problems, mainly due to low prices. High transport costs and lack of market information were also conceived as significant problems (URT 2006b). 44 % of the farms pro-cessed their crops to increase the sale value. Of these crop processing farms, 45 % produced by-products, most commonly bran (for example from milling flour), but also cake (for example from pressing oil seeds), husks and juice. 80 % of the farms also reported using these by-products, although unfortunately little detail is given on this use. The only specified uses are as animal feed (24 %), selling of by-products (18 %), and on farm factory processing (3 %). The remaining 35 % of by-product use remain unspecified (URT 2006b).

Biomass production and consumption patterns in Tanzania
Page 62
25 % of the large scale farms provide services to outgrower farmers. The most com-mon service rendered to outgrowers was crop processing, followed by extension ser-vices, cultivation, crop marketing and livestock marketing (URT 2006b).
The regions with the largest areas (> 85,000 ha) of large scale farms are Tanga, Morogoro, Kagera, Iringa and Kilimanjaro. More than half of the total land occupied by large scale farms is situated in these five regions. The regions with the smallest areas occupied by large scale farms are Dar es Salaam, Singida, Shinyanga, Tabora and Dodoma (URT 2006b).
Food staple crops
For the most important food crops, detailed time series data is available on planted area, production quantities and yields for almost the last 20 years. When looking at the development of the area planted in food crops (see Figure 21), it can be noticed, that all crops show an increase of planted area over time, although the steepness of this increasing trend varies between the different crops. The area cultivated with maize, by far the most important crop in Tanzania, has grown by one third between 1991/92 and 2008/09. Pulses, the second most important food crop (by planted area) in 2008/09, have more than tripled their planted area in the same period. The area planted with cassava has shown an unsteady development but has also grown and was almost twice as big in 2008/09 as in 1991/92.
Figure 21: Area under food crops, 1991-2009
Data source: URT, MAFC n.d.; MAFC 2010

Final Better-iS Report of Wuppertal Institute
Page 63
As to be expected, the production quantities of food crops correlate with the planted area and thus also show an overall rising trend. Again, maize is the most important crop, followed by cassava. The next most important food crops by production quantity are potatoes, pulses, bananas, rice and sorghum. Only small quantities of millets and wheat are produced.
Figure 22: Production quantity of important food crops 1991-2009
Source: URT, MAFC n.d.; MAFC 2010
In contrast to planted area and production quantities, the yields do not show an in-creasing trend (see Figure 23). The average yield (red line) of all food crops has re-mained constant or even shows a very slight decreasing trend (black dashed line). However, the different crops show different trends: for example, maize, cassava, ba-nana and rice all show slightly decreasing trends, whereas potatoes and pulses have rising trends and the yields of sorghum have fluctuated around a constant value. Ac-cording to the Sample Census report of 2003, the low and declining fertilizer use and the lack of irrigation are the main reason for the low and in case of most cereal crops even declining yields. Furthermore, the different trends in yields for different crops re-late in part to the nitrogen requirements of the different crops. Cereals require high lev-els of nitrogen, thus the decrease and for large parts the total lack of fertilizer use neg-atively affect cereal yields. Pulses on the other hand fix nitrogen in the soil and are thus less dependent on fertilizer inputs (URT 2006).
Both yields (Figure 23) and production quantities (Figure 22) show a very pronounced positive spike for the crop years 2001/02 and 2002/03 for more than half of the crops.
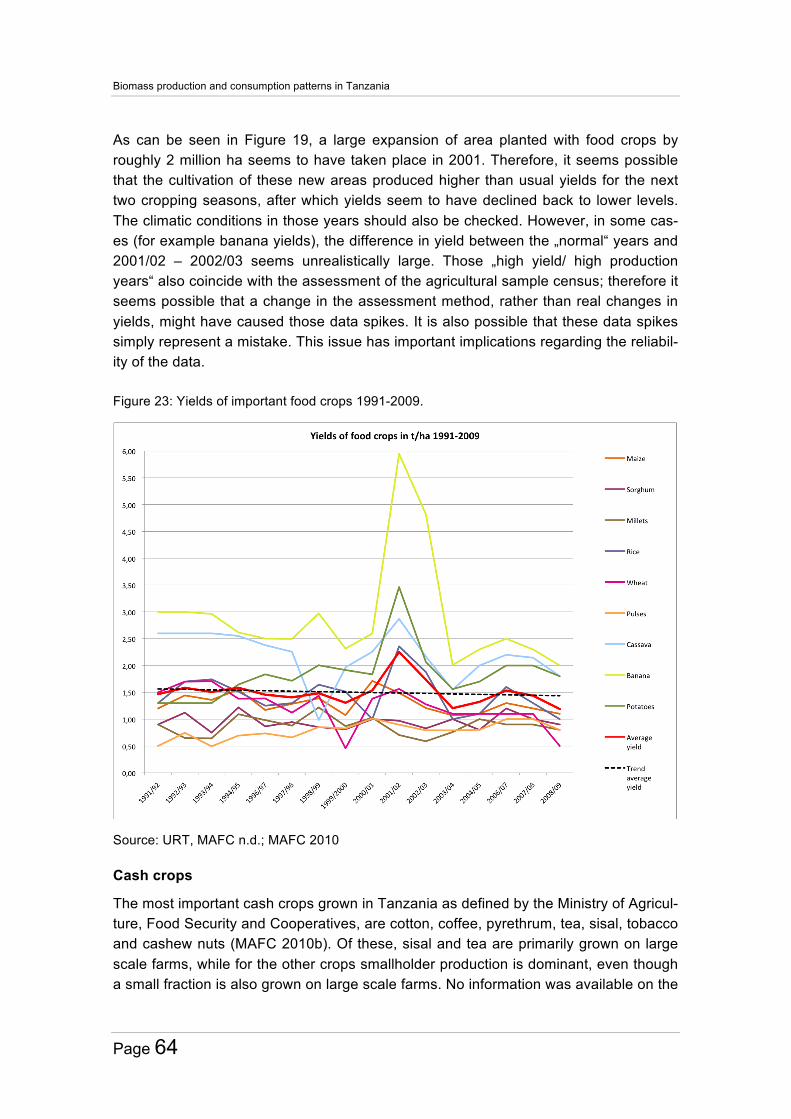
Biomass production and consumption patterns in Tanzania
Page 64
As can be seen in Figure 19, a large expansion of area planted with food crops by roughly 2 million ha seems to have taken place in 2001. Therefore, it seems possible that the cultivation of these new areas produced higher than usual yields for the next two cropping seasons, after which yields seem to have declined back to lower levels. The climatic conditions in those years should also be checked. However, in some cas-es (for example banana yields), the difference in yield between the „normal“ years and 2001/02 – 2002/03 seems unrealistically large. Those „high yield/ high production years“ also coincide with the assessment of the agricultural sample census; therefore it seems possible that a change in the assessment method, rather than real changes in yields, might have caused those data spikes. It is also possible that these data spikes simply represent a mistake. This issue has important implications regarding the reliabil-ity of the data.
Figure 23: Yields of important food crops 1991-2009.
Source: URT, MAFC n.d.; MAFC 2010
Cash crops
The most important cash crops grown in Tanzania as defined by the Ministry of Agricul-ture, Food Security and Cooperatives, are cotton, coffee, pyrethrum, tea, sisal, tobacco and cashew nuts (MAFC 2010b). Of these, sisal and tea are primarily grown on large scale farms, while for the other crops smallholder production is dominant, even though a small fraction is also grown on large scale farms. No information was available on the

Final Better-iS Report of Wuppertal Institute
Page 65
dominant production form of pyrethrum. The following figures provide an overview of production, harvested area and yields of these cash crops.
Figure 24: Cash crop production 1994 - 2009
Data source: FAOSTAT 2011
Figure 25: Harvested area of cash crops, 1994 - 2009
Data source: FAOSTAT 2011

Biomass production and consumption patterns in Tanzania
Page 66
Figure 26: Cash crop yield, 1994 - 2009
Data source: FAOSTAT 2011
When comparing area, production and yields of cash crops depicted here with those of the most important food crops, it becomes clear that cash crops are of low significance in terms of land use, although some of them are important sources of income and ex-port revenue. In contrast to food crops, increases in planted area and production quan-tities have been relatively moderate for cash crops. The average yield shows a slight increasing trend, possibly due to the fact that inputs such as fertilizer and irrigation tend to be applied to cash crops rather than food crops (URT 2006).
While the crops listed here are the main cash crops produced primarily for export, many of the food crops are also produced primarily for sale, both for local markets and for export. These include for example fruit and vegetables, oilcrops or sugar cane.
Structural problems in Tanzanian agriculture: Low productivity
The main challenge for crop cultivation in Tanzania today is low productivity. This is particularly relevant for smallholder farmers and the production of food crops, and thus for the largest part of agricultural production, but to a lesser extent also affects large scale farms and some cash crops. The many reasons for low productivity in Tanzania’s agriculture mentioned in literature are: lack of irrigation, low fertilizer use (URT 2006), tillage-based farming practices which reduce soil fertility, poor control of plant diseases, low level of public investment into agriculture, poor availability of credit, poor infrastruc-ture and lack of markets inhibiting efficient marketing (FAO 2010).
Experts from the Sokoine University of Agriculture (SUA) and the Ministry of Agriculture Food Security and Cooperatives (MAFC), who were interviewed in December 2010, were also asked about the reasons for low productivity in Tanzania’s agriculture. In
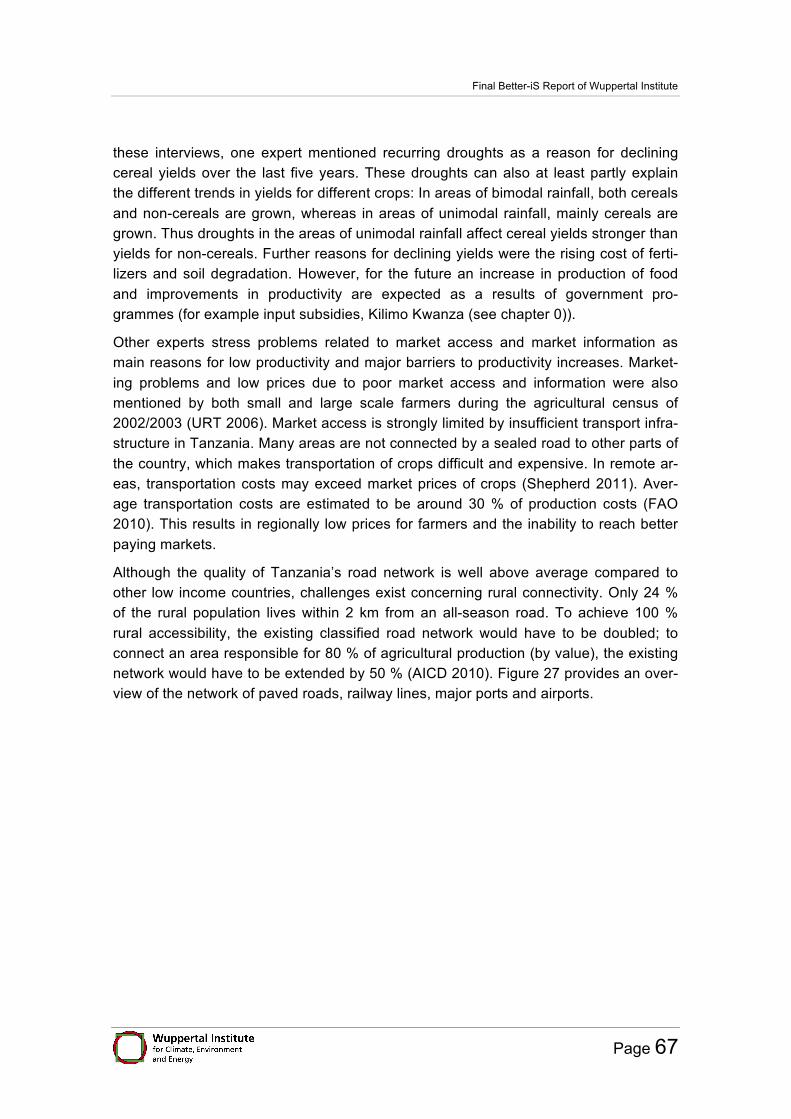
Final Better-iS Report of Wuppertal Institute
Page 67
these interviews, one expert mentioned recurring droughts as a reason for declining cereal yields over the last five years. These droughts can also at least partly explain the different trends in yields for different crops: In areas of bimodal rainfall, both cereals and non-cereals are grown, whereas in areas of unimodal rainfall, mainly cereals are grown. Thus droughts in the areas of unimodal rainfall affect cereal yields stronger than yields for non-cereals. Further reasons for declining yields were the rising cost of ferti-lizers and soil degradation. However, for the future an increase in production of food and improvements in productivity are expected as a results of government pro-grammes (for example input subsidies, Kilimo Kwanza (see chapter 0)).
Other experts stress problems related to market access and market information as main reasons for low productivity and major barriers to productivity increases. Market-ing problems and low prices due to poor market access and information were also mentioned by both small and large scale farmers during the agricultural census of 2002/2003 (URT 2006). Market access is strongly limited by insufficient transport infra-structure in Tanzania. Many areas are not connected by a sealed road to other parts of the country, which makes transportation of crops difficult and expensive. In remote ar-eas, transportation costs may exceed market prices of crops (Shepherd 2011). Aver-age transportation costs are estimated to be around 30 % of production costs (FAO 2010). This results in regionally low prices for farmers and the inability to reach better paying markets.
Although the quality of Tanzania’s road network is well above average compared to other low income countries, challenges exist concerning rural connectivity. Only 24 % of the rural population lives within 2 km from an all-season road. To achieve 100 % rural accessibility, the existing classified road network would have to be doubled; to connect an area responsible for 80 % of agricultural production (by value), the existing network would have to be extended by 50 % (AICD 2010). Figure 27 provides an over-view of the network of paved roads, railway lines, major ports and airports.

Biomass production and consumption patterns in Tanzania
Page 68
Figure 27: Network of paved road, railway, ports and ariports in Tanzania
Source: AICD 2011; population 2005 estimate
Market information is another crucial factor for farmers to be able to fetch good prices. With access to up to date market information, farmers have a stronger negotiating posi-tion in price negotiations with traders, they can in theory plan their production to better meet market demand, decide where and when to market their crops, if storing their crops might be needed to achieve better prices at a later time or if switching to different crops might be more profitable. Traders can also benefit from market information, as they can identify which markets are most profitable for certain crops a certain times or make decisions about storage (Shepherd 2011).
The fact that in many cases no standard weights or measures are used in the trade of crops also makes it difficult for farmers to assure that they are getting fair prices. All together, the problems of marketing and achieving good prices mean that most farmers do not make enough profit to be able to invest and improve their farming techniques, which according to the interviewed experts is a major barrier to increasing productivity in smallholder farming. Further significant problems with regard to productivity are a shortage of good quality seeds and a strong focus on risk mitigation rather than maxim-ised efficiency in smallholder farming.
!

Final Better-iS Report of Wuppertal Institute
Page 69
6.1.3 Regional differentiation of crop production: snapshot of case study re-gions
To support data collected within Output 3 of the Better-iS project, Kigoma, Rukwa and Morogoro were chosen as case study regions. Additionally, Shinyanga region was in-cluded as example of a region with drier climate, higher population density and recur-ring food deficits.
Kigoma and Rukwa are situated on the western border of Tanzania (see Figure 1). They both are predominantly rural and remote regions in terms of connectivity with ma-jor centres and infrastructure. Figure 9 shows that both Kigoma and Rukwa are poorly connected to the national electricity grid. There are only few paved roads (see Figure 27). The road network is particularly poor in Rukwa: The 2003 agricultural census found that for agricultural households in Rukwa, the mean distance to a tarmac road was 185.2 km (URT 2007); in Kigoma Region, this mean distance was 87 km (URT 2007b). Morogoro is also a predominantly rural region situated in central Tanzania. However, the region is proximal to Dar es Salaam and an important supply region of food and charcoal to the capital. Infrastructure connectivity in Morogoro is much better than in the other two case study regions both in terms of electricity and road network (see Figure 9 and Figure 27). The mean distance for agricultural households to get to a tarmac road in Morogoro was 69.8 km in 2003 (URT 2007c). Shinyanga is situated in northern Tanzania and is relatively well connected to electricity and road networks, with the mean distance for agricultural households to a tarmac road being 68 km in 2003 (URT 2007d).
Kigoma and Rukwa regions were mentioned as important food producing regions by experts at the Better-iS-Stakeholder workshop held in Bagamoyo (December 2010). Like on the national level, maize is the most important crop (in terms of planted area) in all case study regions. However, yields vary: as is shown in Figure 28, Rukwa has seen the highest yields in the past decades, followed by Kigoma; both regions have yields higher than the national average. Yields in Morogoro were subject to strong fluc-tuations, but have mainly been above the national average since the year 2000. Shinyanga has the lowest average yields of the case study regions with strong fluctua-tions and very low yields from 2002/03 to 2004/05. Information on the agroecological zones of the case study regions are shown in Table 2.
Food self sufficiency ratios (SSR) for the four case study regions show a similar pattern as the maize yields. For the last ten years, Rukwa region has produced a surplus of food (SSR > 120), Kigoma and Morogoro were self sufficient for most years (SSR 100-120) and Shinyanga was mainly in the deficit range (SSR < 100) (see Figure 29).
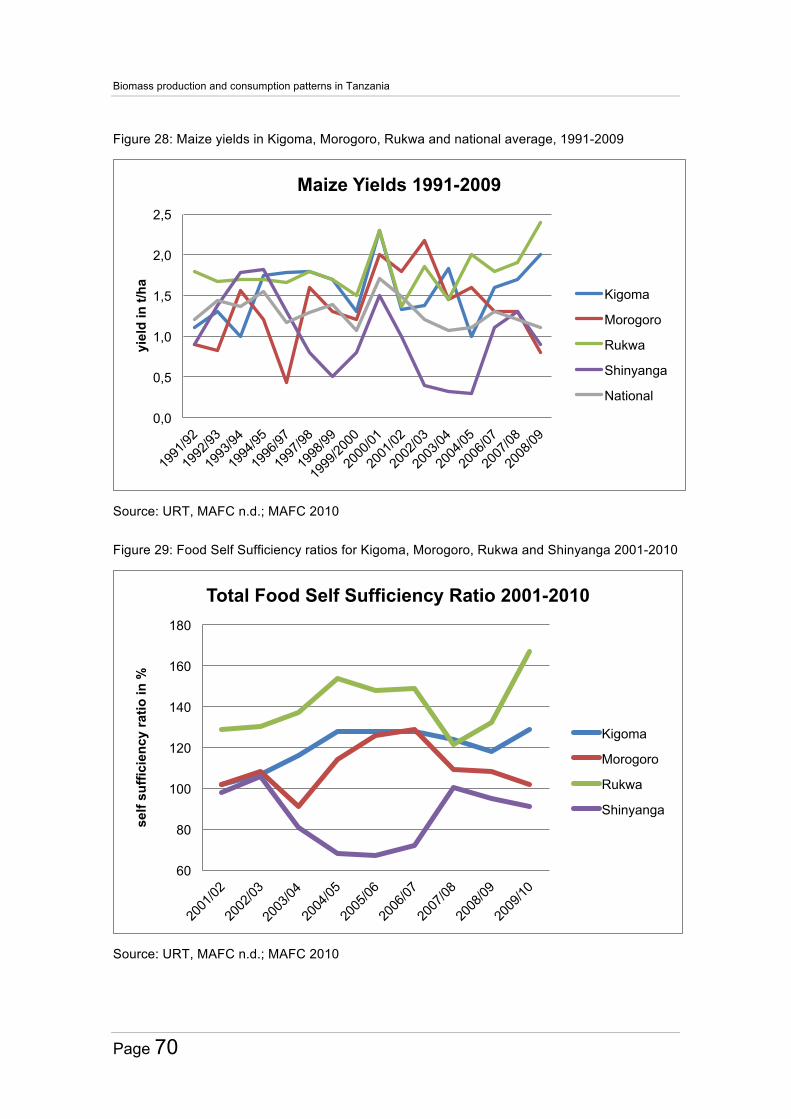
Biomass production and consumption patterns in Tanzania
Page 70
Figure 28: Maize yields in Kigoma, Morogoro, Rukwa and national average, 1991-2009
Source: URT, MAFC n.d.; MAFC 2010
Figure 29: Food Self Sufficiency ratios for Kigoma, Morogoro, Rukwa and Shinyanga 2001-2010
Source: URT, MAFC n.d.; MAFC 2010
0,0
0,5
1,0
1,5
2,0
2,5
yiel
d in
t/ha
Maize Yields 1991-2009
Kigoma
Morogoro
Rukwa
Shinyanga
National
60
80
100
120
140
160
180
self
suffi
cien
cy ra
tio in
%
Total Food Self Sufficiency Ratio 2001-2010
Kigoma
Morogoro
Rukwa
Shinyanga

Final Better-iS Report of Wuppertal Institute
Page 71
However, production quantities and theoretical food self sufficiency are not the only factors influencing food security in a region. Trade can compensate food deficits, pro-vided people are able to buy food. Thus, information on poverty levels, food prices and trade structures are needed to derive conclusions about regional food security. During the 2003 agricultural census, households were interviewed regarding their food securi-ty over the course of the preceding year. Table 19 presents some results for the case study regions. During the assessed year, Kigoma suffered least from food shortages, with 85.1 % of households reporting that they never or seldom experienced food short-ages and 7.3 % often or always experiencing problems to satisfy the household`s food requirements. In Shinyanga, problems with food security were more pronounced: 68.8 % of households never or seldom experienced problems and 24.9 % of house-holds often or always had problems satisfying their food needs.
Table 19: Regional food security as reported during 2003 census
Frequency of food shortages Results as percentage of household
Kigoma Rukwa Morogoro Shinyanga
Never 63.4 % 48 % 37.2 % 33.3 %
Seldom 21.7 % 32.4 % 34.8 % 35.5 %
Sometimes 7.6 % 6.9 % 8.1 % 6.4 %
Often 3.4 % 7.7 % 11.2 % 14.6 %
Always 3.9 % 4.9 % 8.7 % 10.3 % Source: URT 2007, 2007b, c, d
In its 2012 food security assessment report (URT 2012), the Tanzanian government found that in Rukwa and Kigoma the food supply was generally secure, as both regions were producing a surplus of food (SSR > 120). Morogoro was found to be self sufficient (SSR 100-120) and in Shinyanga a food deficit was noted (SSR < 100). These 2012 findings are in accordance with the longer term trends depicted in Figure 29. However, the 2012 report emphasises the variations in food security on inter and intra regional levels as well as on the district level. Localised food crop failures of varying magnitudes were observed in some districts. The main reason for this spatial food security pattern is variations in rainfall, as the predominantly rain fed crop production systems respond strongly to insufficient rainfall. High food prices in 2012 were also mentioned as a fac-tor which aggravates the food security situation (URT 2012).
Both local infrastructure connectivity and the food security situation need to be taken into account when assessing the potential of biofuel value chains in specific regions. When regional food shortages are already a problem, the possible negative effects of biofuels such as land use competition and price effects on food crops must be consid-ered particularly carefully. Poor infrastructure can restrict market access of biofuels and thus make export unfeasible.
Biomass production and consumption patterns in Tanzania
Page 72
6.1.4 Livestock keeping
Traditional small-scale farmers dominate the structure of livestock keeping in Tanzania. Approximately 99 % of the livestock belongs to these traditional farmers with commer-cial ranches and dairy farms constituting the remaining 1 % (FAO/AGAL 2005). Out of the 4.9 million agricultural households, about 36 % keep livestock (35 % are engaged in both crop and livestock production while 1 % are purely livestock keepers) (Njombe/ Msanga 2009).
With Tanzania being a low-income agricultural economy, livestock is an important eco-nomic factor contributing around 12 % to GDP. The main species of livestock kept in Tanzania are approximately 18.5 million cattle, 13.1 million goats and 3.6 million sheep, 1.2 million pigs and 53 million poultry (Njombe/Msanga 2009). In the last two decades the productivity levels have not significantly increased, while the animal num-bers and therewith the output amounts of milk, meat and eggs have been growing (FAO/AGAL 2005).
Figure 30: Contribution of different species to total livestock
Data source: FAOSTAT 2010
Pastoralism is concentrated in the northern plains that are unsuitable for crop produc-tion due to soil and climatic conditions, while livestock production on large scale farms is mainly concentrated in the Coast region followed by the regions of Kagera and Morogoro (FAO/AGAL 2005).

Final Better-iS Report of Wuppertal Institute
Page 73
Table 20: Trends in annual production of meat, milk and eggs (in tonnes)
Product in tonnes Year 1980 1990 2000 2010
Meat (Total) 178 724 272 862 338 570 420 436
Cattle meat 123 715 195 200 230 000 291 608
Chicken meat 15 450 24 000 41 820 48 500
Goat meat 15 332 21 484 29 400 32 520
Pig meat 4 404 8 960 12 600 14 000
Sheep meat 10 222 9 817 10 200 12 096
Eggs (Total) 28 455 31 160 35 410 39 380
Milk (Total) 417 679 596 840 805 600 1 758 000
Data source: FAOSTAT 2012a
When asked for already existing land use competition and conflicts, several experts mentioned conflicts between pastoralists and crop-growers in some areas of Tanzania. Problems appear to arise due to land degradation, expansion of agricultural areas and land tenure conflicts. Furthermore, land use conflicts tend to be highly region-specific. According to Malley et al. (2008), media reports have documented conflicts between pastoralists and farmers in Rukwa valley (Rukwa region), Kilosa district (Morogoro re-gion), Morogoro region, Usangu plain (Mbeya region) and Mbinga (Ruvuma region). Stakeholders mentioned Kilimanjaro, Shinyanga, Dodoma, Arusha and Manyara as regions where forest degradation due to livestock keeping takes place (see Table 9, chapter 4.2), which also points to a potential for conflicts. One expert mentioned the Kilombero valley (Morogoro region), the catchment of the Ruaha dam (Morogoro, Do-doma, Iringa) and Shinyanga region as areas affected by environmental degradation due to livestock grazing.
Malley et al. (2008) undertook detailed investigations of the nature and causes of land use conflicts in the Usangu Plains, Mbeya region, in south-western Tanzania. They found that the root of the problems is land and water shortage, caused by farming and grazing practices that lead to reduced soil fertility and expansion of crop cultivation, as well as increased rainfall variability and reduced rainfall duration (shorter wet season). These factors lead to degradation of land and water resources, amplified by increased population density due to population growth and immigration of farmers and pastoral-ists. During household surveys in the study area, 76 % of respondents (farmers, pas-toralists and agro-pastoralist) stated that they experienced shortage of land. All re-spondents experienced water shortage. Conflicts over land and water resources was reported by 69 % of respondents. Associations between degradation and shortage of

Biomass production and consumption patterns in Tanzania
Page 74
resources and the occurrence of conflicts was proven to be statistically significant (Mal-ley et al. 2008).
The group of farmers experienced most frequent conflicts with pastoralists (91 %), but also with other farmers (82 %) and agro-pastoralist (78 %). The problems with pastoral-ists from the farmers’ perspective were mainly crop, furrow and canal damage by cattle entering the fields. Conflicts between farmers were mainly about access to irrigation water and the boundaries of farm land. Pastoralists and Agro-pastoralists also mention cattle entering fields and damaging crops and canals as one major cause of conflicts and furthermore complained that farmers cause damage to the limbs of cattle in such incidences and poison crop residues to kill cattle. Another important source of conflict especially for pastoralists are grazing-farmland disputes, as farmers invade grazing land for cultivation. Here, tenure and policy issues are relevant, as land use rights for crop production are usually recognized, whereas land use rights for pastoral activities frequently lack recognition. Pastoralists and Agro-pastoralists furthermore experience conflicts with government departments, as part of the grazing areas they depend on during the dry season have become a protected game reserve where grazing is no longer allowed. Ethnicity was also reported as influential factor in resource conflicts, where higher ethnic diversity led to higher frequency of conflicts (Malley et al. 2008).
Conflicts between pastoralists and farmers frequently occur when pastoralists are allo-cated poor pastures with lack of water sources, when farms block livestock corridors to water sources, when pastoralists are prevented from grazing crop residues and sharing water sources with irrigation and domestic uses, and when farmers encroach into des-ignated grazing areas. Due to the marginality of the grazing land, some pastoralists depend on crop residues and shared water resources during the dry season, which can lead to damage to crops and irrigation structures and conflicts with farmers. This situa-tion is aggravated by the fact that pastoralists are in many cases excluded from their traditional dry-season grazing areas, which have become wildlife protection areas (Mal-ley et al. 2008). Malley et al. also stress that the livelihood needs of pastoralists have been largely ignored by agricultural policy and village land allocation. In national policy, the focus is on improvements in stationary dairy farming and beef cattle ranches, whereas traditional pastoralists practices are seen as outdated and do not receive support (Malley et al. 2008).
However, different perspectives on the role of pastoralists in Tanzania exist. Nelson (2009) shows that in northern Tanzania, traditional grazing land management by pas-toralist Maasai communities plays an important role in the conservation of pasture and water resources and contributes to wildlife conservation in the area, as wildlife which is protected in the northern reserves such as the Serengeti national park and the Ngorongoro conservation area also depends on land outside the protected areas man-aged by pastoralists. Thus, pastoralists contribute to wildlife conservation and the pro-tection of an important tourism resource which generates significant economic value every year. However, increased pressure on communal grazing areas due to popula-tion growth, immigration from the densely populated highlands and a growing demand
Final Better-iS Report of Wuppertal Institute
Page 75
of land for tourism and other investments has led to the abandonment of customary land management practices such as the reservation of dry season pastures (Nelson 2009). This abandonment of customary practices can lead to overuse and thus degra-dation of fragile semi-arid areas.
Nelson (2009) stresses the importance of maintaining large communally managed grazing areas, as a fragmentation into smaller individually owned parcels of land would inhibit the movement of livestock (and wildlife) over large areas, which is important for the conservation of pastures in semi-arid areas. Although Tanzania’s land tenure laws (the Land Act and Village Land Act, passed in 1999) enable such communal land man-agement, there is a threat for pastures that are only seasonally used to be perceived as unused. Unused community lands fall under the definition of “general lands” under the Land Act and can thus be allocated to investors or other uses by the Ministry of Lands (Nelson 2009), which creates considerable insecurity for traditional pastoralists. Furthermore, pastoralists have lost and continue losing land to state protected areas for wildlife conservation and tourism. This insecure land tenure has led to pastoralists farming in wildlife habitats and using grazing land traditionally reserved for the dry sea-son more permanently to prevent further loss of land (Nelson 2009), which is likely to lead to degradation of that land.
There is also some large scale commercial livestock farming in Tanzania, although as mentioned above, the contribution to total livestock farming is small: in 2002/03, 502 large scale farms reared livestock on the Tanzanian mainland, compared to 1.7 million smallholders. In terms of numbers of livestock heads, chicken are the most important type of livestock kept by large scale farmers, however in terms of livestock units, cattle are most important, followed by chickens and small numbers of goats, pigs and sheep. Coast, Kagera and Morogoro are the most important regions for large scale livestock keeping (URT 2006b).
6.1.5 Consumption of agricultural biomass
Material uses of crops
The agricultural products in Tanzania are mainly food crops and used as such. in sec-tion 6.1.1 shows an overview of these products and their main uses. It shows that in total two thirds of the listed agricultural products is directly used as food (FAOSTAT 2010). The amount is probably even higher as some food, e.g. cereals and sugar crops which can be processed to flour or sugar fall into the category processing instead of food. Other important uses of these crops are as animal feed and a small amount is also kept back as seeds. Other uses are not described in detail, but these amounts are small compared to those used for food.
Cash crops (see section 6.1.2) such as cotton, coffee, pyrethrum or tea which are mainly exported are also produced in Tanzania. However, compared to the food crops their amount is relatively small (about 500 000 t in 2009 (FAOSTAT 2011)).

Biomass production and consumption patterns in Tanzania
Page 76
6.2 Focus Biofuels from agricultural biomass
Biofuels have a big potential in Tanzania. In this section different biofuel crops (sugar cane, palm oil, jatropha, and agricultural residues) are discussed and existing initiatives in Tanzania described. A SWOT (strengths, weaknesses, opportunities and threats) analysis at the end of the chapter summarizes the main conclusions.
6.2.1 Land availability and suitable crops
There are different information about (potential) land availability in Tanzania. The Tan-zania Investments Centre (TIC) estimates that there are 44 million ha of potentially ar-able land in the country, of which 10.2 million ha are currently under cultivation, thus leaving 33.8 million ha of land potentially available for the cultivation of biofuels feed-stock (TIC 2006). An FAO assessment of 1995 estimates that 55.2 million ha are suit-able for rain-fed agriculture in Tanzania, of which 10.8 million ha are currently used for crop production, leaving 44.4 million ha of potentially available land (GTZ 2005). How-ever, these estimates of „unused land“ are difficult to verify; some of this might be land with low rainfall and / or poor soil fertility under low-intensity land uses such as trans-humant pastoralism or shifting cultivation (Sulle et al. 2009). Furthermore, as stated in chapter 3.1.2, most small scale farmers do not hold official titles for their land; custom-ary land rights may or may not be recognized. The status of biofuel projects in terms of land use is as follows (status 2009):
• 4 million ha of land have been requested by investors for biofuel projects (mainly for cultivation of jatropha, sugar cane and oil palm)
• 640,000 ha of land have been allocated so far
• of these, 100,000 ha have been granted to investors with formal rights of occu-pancy
A number of crops and biomass streams have been identified as potentially suitable for the production of biofuels and other forms of energy (gas, electricity) in Tanzania. Ta-ble 21 provides an overview of crops and biomass mentioned in the literature.

Final Better-iS Report of Wuppertal Institute
Page 77
Table 21: Potential feedstock for different types of biofuels
Oil crops for biodiesel / plant oil
Sugar / starch crops for bioethanol
Agricultural residues for biogas, electricity, 2nd gen-
eration biofuels
Jatropha curcas
Oil palm
(Sunflower, Cotton, Coconut, Castor bean, Croton mi-crostachys, Cashew nut oil)
Sugar cane
Sweet sorghum
Maize, Cassava
Bagasse from sugar cane
Sisal waste
Animal dung
(straw, stalks, wastes, cobs, husks, shells from maize, rice, sorghum, cotton, millet, oil palm, wheat, groundnut, maize, rice, coffee, coconut, oil seeds, oil palm fibres)
From: GTZ 2005, Kaale 2005, MAFC 2009, OECD/IEA 2010, Sulle and Nelson 2009
Present initiatives and investments focus almost exclusively on jatropha, palm oil, sug-ar cane and agricultural residues, so these crops / residues will be described in more detail.
6.2.2 Biofuels from agricultural crops
Sugar cane for ethanol production
• Sugar cane is one of the most important food and commercial crops in Tanzania. It is cultivated throughout the country but production concentrates in the districts of Morogoro, Kilimanjaro and Manyara. Large scale irrigated plantations, covering about 17,800 ha of the planted area produce nearly two thirds of the total output (URT 2012a, FAL 2007). The approximately 11,000 small-scale sugar cane out-growers also supply significant amounts of sugar cane using mainly rain-fed agricul-ture techniques (European Commission 2008; URT 2006). In 2008, smallholders grew sugar cane on 25,789 ha, attaining average yields of 8.67 t/ha (URT 2012a). Compared to these numbers the sugar estates realize higher yields with up to 100 t/ha. The range in productivity arise from the fact that estates use higher inputs of fertilizer, irrigation and machinery and apply modern management structures. On average the yield, with a total harvest of 2,750,000 tonnes of sugar cane produced on about 43,500 ha, was about 63.2 t/ha in Tanzania 2010 (FAOSTAT 2012; URT 2012a).
• The domestic sugar consumption currently amounts to 12 kg per person per year, equivalent to a total demand of more than 340,000 tonnes (Wolter 2008), while the sugar production was about 288,832 tonnes in 2010. Therewith, Tanzania is still a net importer of sugar. Despite these facts Tanzania exports small amounts of sugar
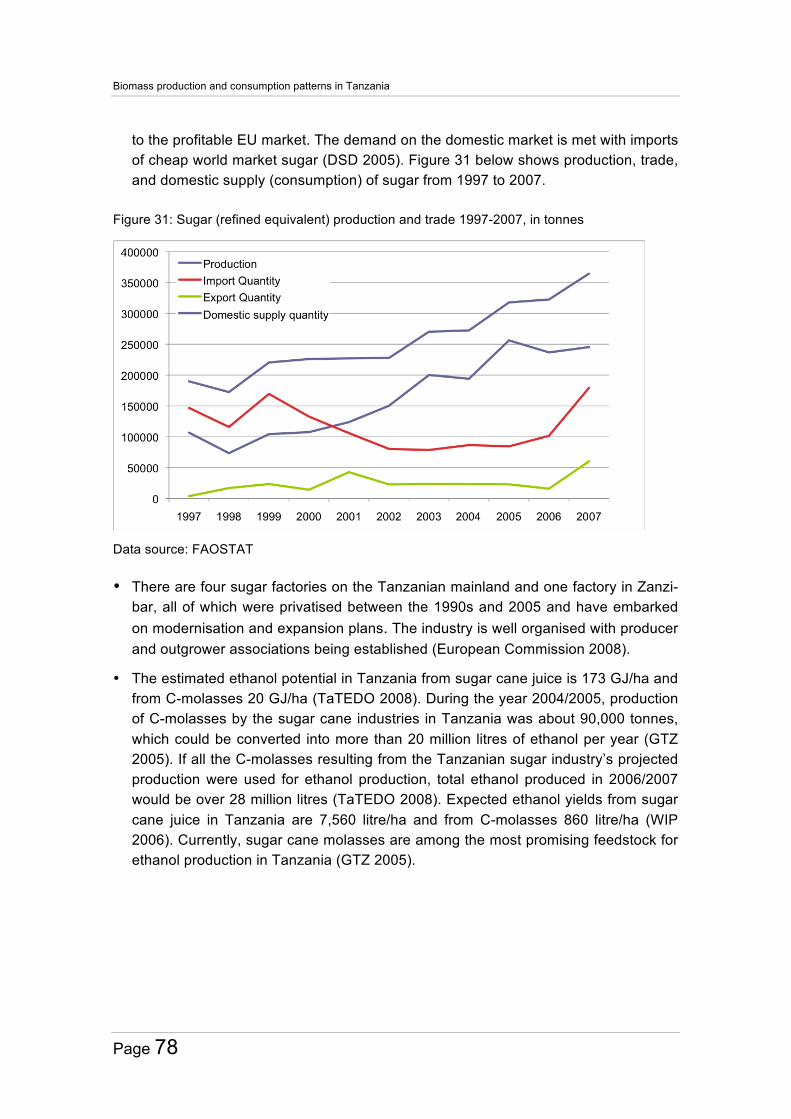
Biomass production and consumption patterns in Tanzania
Page 78
to the profitable EU market. The demand on the domestic market is met with imports of cheap world market sugar (DSD 2005). Figure 31 below shows production, trade, and domestic supply (consumption) of sugar from 1997 to 2007.
Figure 31: Sugar (refined equivalent) production and trade 1997-2007, in tonnes
Data source: FAOSTAT
• There are four sugar factories on the Tanzanian mainland and one factory in Zanzi-bar, all of which were privatised between the 1990s and 2005 and have embarked on modernisation and expansion plans. The industry is well organised with producer and outgrower associations being established (European Commission 2008).
• The estimated ethanol potential in Tanzania from sugar cane juice is 173 GJ/ha and from C-molasses 20 GJ/ha (TaTEDO 2008). During the year 2004/2005, production of C-molasses by the sugar cane industries in Tanzania was about 90,000 tonnes, which could be converted into more than 20 million litres of ethanol per year (GTZ 2005). If all the C-molasses resulting from the Tanzanian sugar industry’s projected production were used for ethanol production, total ethanol produced in 2006/2007 would be over 28 million litres (TaTEDO 2008). Expected ethanol yields from sugar cane juice in Tanzania are 7,560 litre/ha and from C-molasses 860 litre/ha (WIP 2006). Currently, sugar cane molasses are among the most promising feedstock for ethanol production in Tanzania (GTZ 2005).

Final Better-iS Report of Wuppertal Institute
Page 79
Figure 32: Expected ethanol yields in litre per hectare for sugar and starch crops in Tanzania
Data source: GTZ 2005 based on FAOSTAT (Crop yields used in ethanol yield calculations are averages of annual yields reported by the FAO for the period 1999-2004)
Existing initiatives: Between 2006 and 2009 the Swedish energy company SEKAB had planned the implementation of a large-scale project for ethanol production in Tan-zania. The initiative aimed to grow sugar cane for ethanol production on 400,000 hec-tares, to demonstrate commercial viability (SEKAB 2007). Initially SEKAB (2007) in-tended to grow sugar cane in monoculture mainly in the coastal environment near Bagamoyo. But because the area inhabits endangered species the plans had to be modified. A remaining 17,000 hectares should have been cultivated in the Bagamoyo region whereas 400,000 hectares of sugar cane should have been grown in the Rufiji area (Benjaminsen et al. 2009). As the annual rainfall ranges between 800 mm and 1000 mm in these regions, irrigation would have been needed to provide an additional 700 or 800 mm of water per annum in order to get economically viable yields (COMPETE 2009). Hence the project would have required large quantities of water in both regions (Benjaminsen et al. 2009). In February 2009 it was reported that, due to the political and economic burden, the investment from SEKAB in Tanzania would be terminated (Ness et al. 2009). Hereafter, the company sold its ethanol production inter-ests in Tanzania to EcoEnergy in October 2009 (SEKAB 2009). EcoEnergy changed the original project design stating that they want to follow a more sustainable approach. Instead of producing ethanol for export they now plan to produce sugar for the Tanza-
!"#$%&'()$#*)+*,-(.#*/,/"#-)"-)+,-0,-",) ) )))
))
) ) 12)
!"#"$"#% &'()*(+,-%.'/%0(1,*'-%&/'234(+'*%('%5))(%6-)*2+*7%8)93+/):)*(;%
!
3) -%45&*) #$) (%6,*) ,-7) (/,*89) 8*#.() (%"/,5'&) $#*) 8#44&*8",') .*#7%8/"#-) #$) 5"#&/9,-#') 5:)8#-;&-/"#-,') $&*4&-/,/"#-) ,*&) 6*#<-) "-) +,-0,-",=) +9&(&) 8*#.() ,*&) 6*#<-) 4,"-':) $#*) $##7=)>%6,*8,-&) "() #-&) #$) /9&) 4#(/) $,;#%*,5'&) $&&7(/#8?) $#*) ',*6&@(8,'&) &/9,-#') .*#7%8/"#-=)A#4.,*&7) /#) /9&)#/9&*) $&&7(/#8?)#./"#-()8%**&-/':),;,"',5'&) "-)+,-0,-",B) (%6,*8,-&).*#;"7&()/9&)9"69&(/).#/&-/",'):"&'7)#$)&/9,-#').&*)9&8/,*&)#$)',-7)9,*;&(/&7B),()"''%(/*,/&7)"-)C"6%*&)D=2))
C"6%*&)D=2)EF.&8/&7)E/9,-#')G"&'7().&*)3*&,)H,*;&(/&7)$#*)>%6,*),-7)>/,*89)A*#.()"-)+,-0,-",)
#<=!
>## $#?>@A
$!> !?@ ?A?
<>A#
B><
=
#===
!===
$===
?===
>===
A===
<===
B===
A,((,;,
I,"0&
I"''&/
J#/,/#&(
>#*69%4
><&&/
J#/,/#&(
K9&,/
>%6,*)A,-&
LM%"8&N
>%6,*)A,-&
A@4#',((&(
-+(/);C1)4(,/)
)
A*#.):"&'7()%(&7)"-)&/9,-#'):"&'7)8,'8%',/"#-(),*&),;&*,6&()#$),--%,'):"&'7()*&.#*/&7)5:)/9&)C3O)L9//.PQQ$,#(/,/=$,#=#*6N)$#*)/9&).&*"#7)RSSS@DTTU)
))+9&*&)"(),)'#-6)9"(/#*:)#$)6*#<"-6)(%6,*8,-&),(),)8,(9)8*#.)"-)+,-0,-",),-7)/9&*&),..&,*()/#)5&)6*&,/).#/&-/",') $#*)&F.,-("#-) "-)(%6,*8,-&).*#7%8/"#-) "-)/9&)8#%-/*:=)V*#<"-6)8#-7"/"#-()"-).,*/()#$)+,-0,-",),*&);&*:)<&'')(%"/&7)/#).*#7%8/"#-)#$)(%6,*8,-&B),-7),;&*,6&)8,-&):"&'7() "-)/9&)8#%-/*:),*&)("6-"$"8,-/':)9"69&*)/9,-)/9&)<#*'7),;&*,6&)LC"6%*&)D=2N=)

Biomass production and consumption patterns in Tanzania
Page 80
nian market. It is still planned to produce ethanol but only from by-products and to re-place fossil fuels on the domestic market.
In Tanzania several studies have been carried out to evaluate the viability of producing ethanol from sugar cane as a fuel for vehicles and for the use within the chemical in-dustry (GTZ 2005). Recently the Tanzanian sugar companies have actively investigat-ed the potential for the production of fuel ethanol from sugar cane (GTZ 2005). They have performed pre-feasibility studies for ethanol production, which indicate that etha-nol could be produced with a price range of 0.36-0.60 US$ per litre (WIP 2006).
Main strengths: Today detailed research and experience with converting sugar cane juice and C-molasses to ethanol exist and the conversion from bagasse to ethanol can be done very efficiently, resulting in lower production costs for ethanol from sugar cane than for ethanol from other feedstocks in Tanzania (GTZ 2005). Furthermore, the sugar industry in Tanzania has a long history of growing sugar cane as a cash crop and there appears to be great potential for expansion in sugar cane production in the country (WWF 2008). Furthermore, the sugar industry is not only well developed but also highly productive. The average cane yields in the country are significantly higher than the world average (GTZ 2005). Based on these preconditions ethanol could be produced in a carbon neutral manner, even when all petro-chemical inputs are considered (WWF 2008). Ethanol can be applied for domestic use within Tanzania and help to reduce dependence on wood fuel and charcoal as well as fossil fuels (DSD 2005).
Main weaknesses: The production and processing of sugar cane requires high inputs of water, the plant alone requires an ample supply of 1200 to 1500 mm of water per annum (Tarimo/ Takamuru 1998). Hence the introduction of sugar cane as energy crop can have possible negative impacts on local and regional hydrological balance. Also due to the high water requirements irrigation systems are frequently needed to expand the production, leading to higher operation costs (WWF 2008). Further environmental risks can arise from the conversion to ethanol, because during the transformation pro-cess significant volumes of liquid pollutants with high biological and chemical oxygen demands can be emitted (LARRRI/ JOLIT 2008).
Besides these possible negative effects on the ecosystem and for the surrounding communities, planting additional sugar cane for ethanol production requires huge land resources. Although Tanzania is often presented as possessing abundant land suitable for biofuel production (TaTEDO 2008) in reality land availability is not as liberal as por-trayed. Indeed, the areas so far identified for ethanol production from sugar cane are often fairly densely populated and partly already used by small-scale farmers, also of-ten most of these farmers do not have official land rights (LARRRI/ JOLIT 2008). Ac-cording to the FAO Bioenergy and Food Security Analysis (BEFS), only around 203,000 ha are suitable for sugar cane production under low input, rain-fed, tillage based agriculture usually practiced by smallholders in Tanzania. With higher levels of inputs (irrigation, agrochemicals, machines, modern cultivars), 224,000 ha are suitable. If conservation agriculture combined with high inputs was used for sugar cane cultiva-

Final Better-iS Report of Wuppertal Institute
Page 81
tion, 2,488,000 ha could theoretically be cultivated. The suitable areas are mainly con-centrated in Tanga, Coast region and Morogoro. However, when looking at the areas actually available for production (the “new” areas which are not already under crop production, taken up by settlements or under environmental protection), these numbers shrink drastically to around 23,000 ha under low input tillage agriculture (status quo of smallholder production techniques) and 883,000 ha under high input conservation agri-culture (maximum-yield scenario). These suitable and available areas mainly lie in the northern coastal regions. In this assessment of areas available for expansion of pro-duction, areas under pastoral use are not assessed and excluded. Thus, some of this area is probably actually used and real land availability is lower (FAO 2010).
Another approach is to look at those areas already under crop production which are suitable for sugar cane production and where intensification through improved man-agement practices is possible. A potential problem with this approach is that sugar cane could replace food crops on already cultivated land. Of this area already under crop cultivation, 143,000 ha are suitable for sugar can production under low input till-age systems and 1,051,000 ha under high input conservation agriculture (FAO 2010).
Table 22: Land availability for sugar cane production in Tanzania
Agricultural sys-tem
Theoretically suitable area
Available “new” land (expansion)
Land already under pro-duction (intensification)
Tillage, low input 202 673 ha 22 663 ha 143 171 ha Tillage, high input 223 848 ha 17 342 ha 156 027 ha Conservation, low input
2 468 877 ha 876 578 ha 1 048 435 ha
Conservation, high input 2 487 957 ha 882 921 ha 1 051 191 ha
Data source: FAO 2010
The FAO estimates the maximum attainable sugar yields for low input tillage agricul-ture to be 3 t/ha and for high input conservation agriculture to be 13.9 t/ha (FAO 2010). This yields the following sugar cane production potentials under the different scenarios described above:
Table 23: Potential sugar production
Agricultural system
Maximum attainable
yield
On available “new” land (expansion)
On land already under production (intensifica-
tion) Tillage, low input 3 t/ha 25 757 t 242 587 t Conservation, high input 13.9 t/ha 6 873 068 t 9 203 518 t
Data source: FAO 2010

Biomass production and consumption patterns in Tanzania
Page 82
The FAO BEFS Analysis comes to the conclusion, that there is only limited land suita-bility in Tanzania for the cultivation of sugar cane under typical smallholder production systems characterized by tillage, low input levels and reliance on natural rainfall sys-tems (FAO 2010). In most areas, sugar cane cultivation requires irrigation and there-fore investments, which limits its’ potential as a smallholder crop. However, ethanol produced from sugar cane is a competitive biofuel option in Tanzania, but it requires a large-scale industrial set-up. The resulting biofuel value chain is likely to stimulate eco-nomic growth but may contribute little or not at all to poverty reduction, unless invest-ments into increasing yields from smallholders and involving them in feedstock produc-tion are made (FAO 2010).
If using and growing sugar cane to produce ethanol becomes more attractive it may also result in reduction of sugar production for food purposes, putting local food securi-ty at risk and causing shortages and increased prices rather than decreasing poverty (WWF 2008). Until Tanzania becomes self-sufficient in sugar, it will be difficult to justify ethanol production from crystalline sugar. Hence c-molasses, the by-product of sugar production, is likely to be the only sugar cane feedstock used for ethanol production (GTZ 2005).
Conservation agriculture and assumptions of the FAO-BEFS Analysis
Conservation agriculture is an agricultural management practice which aims to con-serve and improve soil productivity by enhancing natural biological processes. Im-portant principles of conservation agriculture are:
§ Minimum mechanical soil disturbance (no tillage) § Permanent organic soil cover (e.g. maintaining crop residues on soil surface) § Diversified crop rotations (annual crops) or plant associations (perennial crops)
Agrochemical and organic inputs may be applied, but only at levels where they do not disrupt biological soil processes. If practised properly, conservation agriculture can improve yields (through improved soil quality) while reducing costs, labour require-ments and adverse effects on the environment. Conservation agriculture practices are not new in Tanzania, but are not applied on a wide scale. As mentioned above, typical smallholder production systems in Tanzania are characterized by tillage, low input levels and reliance on natural rainfall systems (FAO 2010).
In its assessments of land suitability and maximum attainable yield, the FAO-BEFS Analysis compares four different agricultural systems: conservation and tillage agricul-ture, and low and high input levels for both of these systems. Low input systems are characterized by typical subsistence production based on hand labour with traditional tools and no or very low inputs such as agrochemicals or irrigation. High input systems on the other hand are capital-intensive management systems with complete mechani-zation, use of agrochemicals, use of modern crop cultivars, potentially irrigation etc.. Both conservation and tillage agriculture can be operated with low or high inputs (FAO 2010).

Final Better-iS Report of Wuppertal Institute
Page 83
Palm oil
• has been grown in Tanzania for decades as food crop for edible oil. Palm oil is re-cently also used for local soap production (Sulle et al. 2009). Palm fibres are used for mats, ropes etc. (EC-FAO 1999).
• is grown largely by smallholder farmers in Kigoma, Mbeya and Tanga Regions (Sulle et al. 2009).
• data in palm oil production, area and yields presented by national statistics are much higher than FAO statistics: National statistic presents data for 2003, when smallholders produced oil palm fruit on 15,757 ha, yielding an average of 3.2 t/ha, with a high regional variation of the yield between 0.1 t/ha and 30.1 t/ha (United Re-public of Tanzania 2006). The FAO estimates 1.2 million ha in Tanzania are suitable for palm oil production. However, the harvested area of oil palm has remained con-stant at 4,500 ha over the last decade and slightly increased in 2010 to 4,800ha. The yields of oil palm fruit have increased slightly, from 58,000 t in 1998 to 65,000 t in 2008 (corresponding to a yield of 14.4 t of oil palm fruit per ha; constant at this level since 2002) (FAOSTAT 2010). This estimate is much higher than that of the national census 2003 of the United Republic of Tanzania with a 3.5 times higher ar-ea and a 4.5 times higher yield.
• Presently production is not sufficient to meet the demand for food oil: raw palm oil is imported from Indonesia and Malaysia (Sulle et al. 2009). In 2007, only 2 % of the domestic supply was provided by local production, the rest was imported (FAOSTAT 2010). Production, import, export and the resulting domestic supply of palm oil be-tween 1998 and 2008 are shown in Figure 33.

Biomass production and consumption patterns in Tanzania
Page 84
Figure 33: Palm oil production, import and export 1998 – 2008, in tonnes
Data source: FAOSTAT
Table 24: Palm oil balance 2005
Balance 2005 Palm Oil Palmkernel Oil Palmkernels
Production 6 000 t 4 000 t 8 000 t
Import 266 000 t 1 000 t 0
Export 2 000 t 0 0
Domestic Supply 271 000 t 5 000 t 8 000 t
Processing No data No data 8 000 t
Other utilisation 151 000 t 0 0
Food 120 000 t 5 000 t No data Data source: FAOSTAT
• The currently practiced processing of palm oil fruit and kernels is inefficient: only 40 % of oil is extracted due to poor quality of the grinding machines (modern ma-chines can extract 80 % of the oil). The national average oil yield is 1,500 l per ha. Furthermore, the locally processed palm oil does not meet international quality standards due to poor hygiene in the production process (Sulle et al. 2009).
Existing Initiatives: The Tanzanian-Belgian company FELISA Ltd. is promoting culti-vation of hybrid oil palm in the Kigoma Region. They have acquired almost 5,000 ha of land (General Land that was already allocated to the Tanzania Investments Centre) for

Final Better-iS Report of Wuppertal Institute
Page 85
an oil palm plantation and are also cooperating with local smallholder farmer’s groups by supplying them with improved seed varieties and training on agronomic practices developed by FELISA to improve yields. FELISA is targeting production of 10,000 ha of oil palm in the region, with around half of this expected to come from smallholder out-growers. So far, only crude palm oil is produced but with the intention of biodiesel pro-duction in the future (Practical Action Consulting 2009, Sulle et al. 2009).
Main strengths: Of the available oil crops, oil palm has the highest potential yields of up to 6,000 l/ha/yr, although present average yields in Tanzania are 4 times lower at 1,500 l/ha/yr. For biodiesel from palm oil, a potential yield of 186 GJ/ha was estimated (GTZ 2005).
Main weaknesses: So far, palm oil production is well below demand for palm oil as food. Production (area and yield) would have to be extended significantly to produce palm oil in excess of the demand for food oil, so that biodiesel or pure plant oil for transport/ energetic uses could be produced without competing with food. However, increased oil yields are possible by improving farming practises and extraction technol-ogy. Oil palm requires a lot of water and grows best in riverine lowland areas or under irrigation. Therefore, large scale oil palm production comprises risks of water scarcity and competition with other crops for land with high water availability, which is not abundant in Tanzania.
According to the FAO Bioenergy and Food Security Analysis (2010), there is only lim-ited land suitability in Tanzania for the cultivation of oil palm under typical smallholder production systems characterized by tillage, low input levels and reliance on natural rainfall systems. In most areas, oil palm cultivation would require irrigation and there-fore investments, which limits its’ potential as a smallholder crop. The same study states that biodiesel production from palm oil is not economically viable in Tanzania and comprises a high risk of competing with or compromising palm oil uses for food (FAO 2010).
Table 25: Land suitability for palm oil production in Tanzania
Agricultural sys-tem
Theoretically suitable area
Available “new” land (expansion)
Land already under pro-duction (intensification)
Tillage, low input
169 868 ha 15 025 ha 126 032 ha
Tillage, high input
220 750 ha 16 973 ha 160 759 ha
Conservation, low input 1 580 385 ha 436 178 ha 811 455 ha
Conservation, high input 1 767 434 ha 500 826 ha 887 950 ha
Data source: FAO 2010

Biomass production and consumption patterns in Tanzania
Page 86
Most of the area which is suitable under typical smallholder tillage low input systems is located in Tanga. Under improved agricultural practices, some areas in Coast, Mwanza and Dar es Salaam regions also become suitable. Generally, most of the suitable area is in the same region which is also suitable for sugar cane (FAO 2010). Table 26 shows potential production quantities of palm oil (in tonnes) on available “new” land not cultivated so far and on land already under crop cultivation for the low input tillage sys-tem compared to the high input conservation agriculture system.
Table 26: Potential palm oil production
Agricultural system On available “new” land (expansion)
On land already under production (intensification)
Tillage, low input 13 594 t 121 522 t
Conservation, high input 2 712 074 t 5 094 252 t
Data source: FAO 2010
Jatropha Oil
• Jatropha curcas plants have traditionally been used as hedges and grave markers in Tanzania without commercial use of the seeds (Sulle et al. 2009, van Eijck et al. 2008).
• Jatropha produces lower yields than other oil crops at less than 2,000 l/ha/yr (1,600 kg/ha/yr) (GTZ 2005), although like with every crop, yields are strongly dependant on soil quality and water availability.
• Jatropha is a resilient plant able to grow on marginal land in semi-arid to arid areas and withstands long drought periods. It grows well on marginal lands with more than 600 mm of rainfall per year as well as in areas where the rainfall is only 250 mm, but the humidity of the air is very high. In India, Jatropha has been used for rehabilita-tion of degraded land successfully (GTZ 2005).
• Several companies and NGOs encourage communities to grow jatropha on margin-al land. So far, Jatropha oil is used for soap production and in small quantities as lamp oil (van Eijck et al. 2008). Jatropha oil is too expensive to replace woodfuel for domestic energy and at present, petroleum diesel is cheaper than Jatropha oil. However, there is potential to use Jatropha oil/ biodiesel as a blend for use in diesel engines especially in remote regions where petroleum prices are higher due to transportation costs (Wiskerke 2008). Jatropha oil can also be used for decentral-ized electricity generation or as kerosene replacement for lighting (van Eijck et al. 2008, Wiskerke 2008).
Existing Initiatives: The NGOs TaTEDO and KAKUTE have piloted rural electrifica-tion in Monduli District, where jatropha oil is used for domestic lighting and milling ma-

Final Better-iS Report of Wuppertal Institute
Page 87
chines powered by a diesel engine using jatropha oil (Martin et al. 2009, Sulle et al. 2009). Furthermore, alternative income opportunities for women were generated through collection and pressing of jatropha seeds, soap production and selling jatropha seedlings (Sulle et al. 2009).
Diligent Tanzania Ltd. is one of the few companies already producing jatropha oil for biofuels. In 2009, they were producing 600-800 l per month with an installed capacity of 1,500 l per month. The company does not own any plantation land but works exclusive-ly with contracted outgrowers across northern Tanzania. So far around 5,000 farmers have been contracted and the planted area is expected to reach 10,000 ha in 2010. Smallholders plant jatropha as farm hedges, on contours and on degraded land. Since jatropha seeds earn lower prices than other food and cash crops, jatropha is generally not planted on land previously used for other crops (Sulle et al. 2009). Diligent is also planning to produce and market charcoal from jatropha seedcakes (Diligent Tanzania Ltd. n.d.).
Main strengths: Since jatropha can be grown on marginal land and as hedges or shade trees, competition with food crops may not be an issue. The plant can withstand droughts, which might make it able to cope with more irregular rainfall patterns and increased droughts expected to result from climate change better than other crops. Several companies are promoting jatropha production through outgrower schemes, which is likely to benefit local communities and farmers by generating income opportu-nities, agricultural development and market access for smallholders.
Main weaknesses: There is some doubt if jatropha oil for domestic energy or as a transport fuel will be competitive with traditional biomass and fossil fuels (GTZ 2005, Sulle et al. 2009, van Eijck et al. 2008, Wiskerke 2008). In 2005, jatropha oil sold at 2 US$ per litre and the largest profits were made with jatropha soap (GTZ 2005). It is unclear if sufficiently high yields and economies of scale can be achieved to produce jatropha biofuel at a competitive price, especially if the production is to take place on marginal lands by smallholders. Like all crops, jatropha grows better on fertile land with higher water availability. Anna Segerstedt et al. (2010) came to the conclusion that jatropha cultivation may be feasible only for the own consumption and that only when produced on a large scale with high yields and not for export as the production costs are too high to compete with other vegetable oils on the global market. Large scale investors have acquired relatively fertile land in climatically favourable locations mainly close to the coast for jatropha production in large plantations (Martin et al. 2009, Sulle et al. 2009). In some cases, this has resulted in village land being transferred to gen-eral land. Sun Biofuel has acquired 8,211 ha of land from 12 villages in Kisaware Dis-trict. Sulle and Nelson (2009) found that the process and result of the land allocation was poorly understood by the villagers and that compensation payments were well be-low the value of the land. Furthermore, promises were made to the villages regarding social service provision, employment and other forms of benefits but these promises never entered any official contracts. Similar problems are also described in relation to

Biomass production and consumption patterns in Tanzania
Page 88
land acquisitions by BioShape for jatropha production in Kilwa district and by SEKAB BT for sugar cane production in Rufiji District. Thus, there are concerns about „land grabbing“ by biofuels companies resulting in lost access to land and resources for vil-lagers (Sulle et al. 2009).
A recent field study on the agronomy and economic viability of jatropha planted by smallholders in Kenya found that many of the claims made about jatropha, such as wide adaptability to diverse climatic zones and soil types, short gestation period, easy multiplication, drought tolerance, not competing with food production, and pest and disease resistance did not hold true. Instead, the study found that jatropha yields were extremely low with generally uneconomical costs of production both for jatropha grown in monoculture and in intercropped plantations. Only when jatropha was planted as a hedge with very low inputs some profit could be generated after 7 to 8 years. The study also found, that jatropha is not a wasteland crop, that it does not provide good yields on marginal land under low rainfall conditions and that it is susceptible to a number of pests and diseases. The authors conclude that it is not advisable at this stage for small scale farmers to grow jatropha as a biofuels crop and that the potential of large scale commercial biodiesel production from jatropha is very limited. However, there is some potential for jatropa grown as a hedge plant and for oilseed production used locally for various bioenergy and related products (oil, bio-charcoal, fertilizer, biogas feedstock). In general, much more research into the agronomy and economics of jatropha as an oil crop is needed (GTZ 2009).
The FAO Bioenergy and Food Security Analysis (2010) sees potential for low cost bio-diesel production based on jatropha supplied by smallholder outgrowers, which could induce economic growth and target poverty reduction. However, the study also acknowledges the risks associated with this crop due to uncertainties about its’ agro-nomic requirements and performance and concludes that more research is needed before jatropha becomes a realistic option (FAO 2010).
Other potential biofuels feedstocks
The FAO Bioenergy and Food Security Analysis (2010) sees ethanol production from cassava as the most promising pro-poor biofuel development option. This is because the land suitability for this crop under typical smallholder production systems is good throughout Tanzania, which allows extensive smallholder inclusion and low-cost com-petitive ethanol production. According to the study, a cassava-based biofuel industry in Tanzania would lead to economic growth and poverty reduction (FAO 2010).
Final Better-iS Report of Wuppertal Institute
Page 89
6.2.3 Biofuels from agricultural residues
Agricultural residues include all leaves, straw and husks left in the field after harvest (field residues), hulls and shells removed during processing of crops at the mills (pro-cessing residues), as well as animal dung (Yevich/Logan 2002). The main agricultural residues in Tanzania are coffee husks, rice husks, sisal wastes, bagasse from sugar industries, cashew nut husks, maize cobs, coconut shells and animal dung.
Animal Dung
• Tanzania is endowed with millions of livestock which produce huge quantities of waste material. In theory these could be utilized as substrate for the biogas genera-tion. The theoretical energy potential has been estimated to be as high as 94,170,906 GJ per year (Table 27). But in reality only very small amounts of dung can be made available, due to the free-range structure of the livestock sector. Fur-thermore, the amounts of dung available vary between different regions in Tanza-nia as well as during different seasons of the year as the dung production of fully-grown animals is proportional to the quantity of food they eat. Besides, manure has potential value for non-energy applications for example as fertilizer or building ma-terial (Rosillo-Calle 2007).
• Today animal dung is already used directly as source for domestic energy in villages with acute scarcity of woody biomass fuels like in Mara, Mwanza, Shinyanga and Arusha (Kaale 2005). But animal dung is regarded as a poor fuel and people tend to shift to other fuels whenever possible (Rosillo-Calle 2007). Furthermore, the wide-spread use of cow dung and agricultural residues for energy instead of soil enrich-ment has contributed to lowering the agricultural production in the regions with se-vere firewood scarcity (Kaale 2005).
Existing initiatives: Tanzania is a leader in biogas technologies in the eastern African region. Over the last three decades, 4,000 domestic-size biogas plants have been in-stalled in Tanzania (AFREPREN/FWD 2008) including options for energy production from animal dung. An example are family-sized biogas digesters for households with stall-fed cattle in the Rungwe district. These digesters run on dung and provide biogas for cooking stoves and fertilizer as by-product (Martin et al. 2009; Mwakaje 2008). But most small-scale biogas projects face manifold problems like availability of financing options, quality of construction material or availability of knowledge, manpower and material for maintenance and repairs (Amigun et al. 2008). Another frequent cause of failure is the inadequate dung supply to maintain the microorganisms (UNDP 2009).

Biomass production and consumption patterns in Tanzania
Page 90
Table 27: Livestock populations, dung production and theoretical energy potential 2000- 2008
Livestock Average
population (2000-2008)
Dung production coefficient 1 : (Dry
weight kg/head/day)
Average an-nual dung
production in tonnes
Energy Con-tent GJ/t coef-ficient 2 (oven
dry)
Annual dung energy content
in GJ/year
Chicken 30 434 778 0.1 1 110 868 12.25 13 608 133
Cattle 17 523 579 3.0 1 918 832 16.75 32 140 436
Goats 12 402 378 0.5 2 263 434 15.9 35 988 601
Pigs 454 778 0.7 116 196 14.0 1 626 744
Sheep 3 724 300 0.5 679 685 15.9 10 806 992
Total 6 089 015 94 170 906
1 The displayed dung production coefficients are the average of the coefficients used in the cited literature, taking into account the production of fresh dung per animal, the dry matter con-tent and seasonal factors.
2 The energy content coefficients are the average of the coefficients used in the cited literature. Note: The coefficients are predominantly based on developing country dung production rates and may therefore slightly vary within different regions in Tanzania.
Data source: Calculations based on FAOSTAT 2010; Rosillo-Calle 2007, based on Tavlor/ Weiss 1982; Amoo-Gottfried/ Hall 1999; Senelwa/ Hall 1993
Main strengths: The biogas technology is seen as being particularly suitable to rural areas in Tanzania as it relies on a simple, well-known process and its own leftovers can be used for fertilization purposes (ACP-EU Energy Facility). The installation re-quires a relatively limited level of investment compared to other energy technologies. Nevertheless, many examples show that the technology is still too expensive and com-plicated to be successfully used long term (UNDP 2009).
Main weaknesses: While feedlots provide the most effective ways of collecting dung, most of the livestock farming in Tanzania is free-range. The practicality of large scale utilisation of animal manure in Tanzania is therefore a major challenge. Biogas projects need a steady stream of preferably wet dung to function. Collecting dung and moving it to the digesters proves to be problematic. Especially small-scale farmers with small herds are not able to get sufficient feedstock to feed biodigesters and ensure a steady generation for lighting and cooking (Cooper/Laing 2007).
Crop Residues
• Tanzania has considerable biomass resources in form of residues from harvesting and processing of agricultural crops. These residues could potentially be used to generate electricity and heat for industrial and domestic purposes. Although bio-mass co-generation technology is not new to Tanzania, so far only limited amounts

Final Better-iS Report of Wuppertal Institute
Page 91
of residues are being used for modern energy applications (United Republic of Tan-zania 2003). To increase the use of these residues information and knowledge on availability, competing uses and extraction of residues from agriculture and forestry systems as well as on the dumping of waste and cascade uses are needed (WBGU 2009).
• The actual potential of agricultural residues for energy production in Tanzania is not well documented (GTZ 2005) and data on residues is in most cases lacking (Otieno/Awange 2006). Mwihava/Mbise (2003) estimate that 15 million tonnes of crop residues and 1.1 million tonnes of forest residues per annum would be availa-ble. Calculations of the theoretical residue potential, which are based on crop pro-duction data of the years 2000 to 2008, result in a much lower residue potential of 5.2 million tonnes (see Table 28). The availability of these residues varies between the regions, because crop production and utilization patterns differ strongly in differ-ent areas, Large annual amounts of residues occur in the regions with private es-tates and intensive smallholder farming such as Manyara, Arusha, Kilimanjaro, Iringa, Tanga, and Kagera (GTZ 2005).
• To determine the available potential of agricultural residues for energy uses infor-mation and data on current uses of these residues are required. Typically residues can be used as fodder, fertilizer, building material or fuel. In northern Tanzania in the highlands of Mount Kilimanjaro and Mount Meru crop residues including banana, maize and other cereals are for example commonly used by farmers as cattle fodder especially in the dry season to supplement forage (FAO 2005). Likewise cereal resi-dues like rice husks are frequently used to meet household energy demands (Yevich/ Logan 2002). But so far only limited information is available on the actual quantities that are utilized and are therewith not available for energy generation (GTZ 2005).
• So far only few of these residues are used energetically, although wood fuel scarci-ty has led to an increasing amount of residues directly used as cooking fuel. There is some use of rice husks (replacing firewood for brick burning), maize cobs and coconut shells (domestic energy) (Kaale 2005). The modern use of bioenergy has generally been limited to those industries where process residues are available on site, such as timber mills, sugar factories and recently also at sisal factories. But especially in the sugar industry conversion efficiencies have been fairly low (John-son/Matsika 2006). The demand for steam as well as electricity for processing crops and products seems to be a precondition for the use of residues for cogener-ation in Tanzania (Gwang’ombe 2004).
• Besides the direct use of agricultural residues for electricity and heat generation, residues can also be compressed to briquettes which can then be used as charcoal replacements. Cereal straw, coconut husks and shells, rice husks, cotton stalks, coffee husks, bagasse and other residues are all suitable for briquetting. However, unlike wood these residues cannot be carbonised using simple earth mound or pit

Biomass production and consumption patterns in Tanzania
Page 92
kilns - appropriate charring devices such as retorts or metal kilns must be used (Seboka 2009). Nevertheless, the demands regarding investments, technology and infrastructure development are still lower compared to technologies that generate electricity with agricultural residues.
Table 28: Theoretical annual energy potential of main crop residues sources (average 2000- 2008)
Crop
Annual Quantity of Crop Produc-
tion in tonnes (2000-2008)
Field Residues
Process Residues
RPR1 (Residue to
Product Ratio)
Annual Quantity of Crop Residue Production in tonnes (2000-
2008)3
Residue2 energy value (LHV GJ/t)
Residue energy
potential ( TJ/yr)
Rice 1 094 084 straw 1.75 1 914 647 16.02 30672.6 husks 0.27 292 120 19.33 5646.7 Wheat 80 100 straw 1.75 140 175 12.38 1735.4 Millet 209 012 stalks 1.75 365 771 12.38 4528.2 Maize 29 334 stalks 2.00 58 668 5.25 308.0 cobs 0.26 7 627 16.28 124.2 husks 0.20 5 867 Sugar cane
2 010 556 tops & leaves
0.30 603 167 17.41 10501.1
bagasse 0.29 583 061 18.10 10553.4 Coconut 370 000 shells 0.12 44 400 18.09 803.2 husks 0.42 155 030 18.62 2886.7 Oil Palm 64 778 fibre 0.14 9 069 11.34 102.8 shells 0.07 4 211 8.20 34.5 bunches 0.23 14 899 8.16 121.6 Coffee 47 078 husks 0.20 9 416 12.38 116.6 Sisal 26 189 pulp 900 000 Cash-ewnut 92 421 husks 0.47 43 438 15.66 680.2 TOTAL 4 023 552 5 151 566 68815.2 1& 2 Conversion factors used: Bhattacharya et al. 1993; Strehler/Stutzle 1987; Webb 1979 3 Sisal waste data for the year 1990 in GTZ 2005 Data source: Calculations based on FAOSTAT 2010, Koopmans/Koppejan 1998 Bhattacharya et al. 1993; Strehler/Stutzle 1987; Webb 1979
Existing initiatives: Most sugar factories in Tanzania generate steam and electricity from residues to power the sugar production plants. During the sugar cane processing, cane stalks are shredded and crushed to extract the cane juice while bagasse, the fi-brous outer residue, is used to produce energy. Biomass based cogeneration with ba-gasse in sugar factories in Tanzania is about 99 GWh per year today which is 3.5 % of the national electricity generation (Gwang’ombe 2004). Until 2008, laws governing the power sector in Tanzania did not allow factories the production electricity as a com-mercial commodity (Otieno/Awange 2006). But with the ongoing power sector reforms, independent power producers are allowed to sell electricity to the national electricity company TANESCO and directly to the consumers. With the availability of advanced

Final Better-iS Report of Wuppertal Institute
Page 93
co-generation technologies, sugar factories can harness the on-site bagasse resource to go beyond meeting their own energy requirements and produce surplus electricity for sale to the national grid or directly to consumers (Gwang’ombe 2004).
Since 2005 the first biogas plant using waste from sisal for electricity generation is run-ning at the Katani Ltd. estate in the Tanga region (UNIDO). With the current production methods only 2 to 4 % of the actual sisal plant is recovered as fibre. The remaining 96 to 98% have so far been discarded as waste, which until now decompose on piles in the open air and producing large amounts of methane emissions which are known for their negative effects on the environment. The project demonstrates that using sisal waste as energy feedstock could increase the sustainability and economic viability of the sisal processing by providing cheaper and cleaner energy. The produced biogas is used to run a 150 kW electricity generator (UNIDO). So far the electricity is used to power the processing machinery but it is planned to use the excess electricity to supply close out-growers/smallholders homes and to use the process heat for drying fibre. Furthermore organic fertilizer is produced as a by-product but due to logistical prob-lems it is not yet utilized on the fields.
At present, the Appropriate Rural Technology Institute (ARTI) is conducting a project funded by the World Bank, which aims at training and equipping villagers, including existing charcoal producers in the rural areas surrounding Dar es Salaam, to produce charcoal briquettes from agricultural residues and other dry biomass. The focus of the training is on the construction and use of suitable kilns as well as charcoal briquetting techniques. The goal is to halt deforestation and to produce more sustainable charcoal while maintaining income opportunities for the rural population (ARTI 2011, ESMAP 2011).
Main strengths: Crop residues could be used as feedstock for sustainable decentral-ised energy generation in Tanzania. With transport costs being a critical factor crop residues are best used close to the source of raw materials, which is usually in the ru-ral areas. Therewith, the residues could play a particularly important role in the rural energy and electrification efforts by supplying electricity and heat to the rural communi-ties who so far lack access to modern energy services. The exploitation of this energy potential could reduce the fuel wood and fossil fuels use in the rural areas (Otieno/ Awange 2006). Furthermore, the use of crop residues for energy purposes entails far fewer risks for land use compared to energy crops grown on agricultural land in order to produce liquid fuels (WBGU 2009). Another advantage when using crop residues as feedstock is the reduction of methane emissions that are released if residues decom-pose in the open air. And the by-products from the energy conversion process like ash and sludge can be used as organic fertilizer to improve soil fertility and yields (WBGU 2009).
Main weaknesses: Removing crop residues from the agriculture- or forestry-based ecosystems, can have negative effects on soil fertility, nutrient cycle and hydrologic balance. Therefore, it is important to take the role of residues in the current system into
Biomass production and consumption patterns in Tanzania
Page 94
consideration before removing large quantities for energy generation. Alongside the environmental risks the economic viability is of concern when using agricultural resi-dues for energy purposes. In a country like Tanzania, where provision of capital can be problematic, the investment costs for medium scale energy plants are high. Small scale options such as family-sized biogas digesters are another option, if enough residues are available all year round. But technical, financial and social barriers are important aspects that need to be considered when thinking about small scale solutions as past biogas programmes in Tanzania experienced multiple problems and have often been unsuccessful due to these factors.
2nd Generation Biofuels: Some agricultural residues and by-products can be used for the production of second-generation biofuels for transport. A study by OECD and IEA (2010) estimates the amount of potentially available residues for second-generation biofuel production using crop production quantities and typical ratios of residue to main product. According to this study, 9,942,000 t DM/yr are available from primary residues such as straw, stalks and wastes from maize, rice, sorghum, cotton, millet, oil palm, wheat, sisal and groundnuts and 1,293,000 t DM/yr from secondary residues such as maize cobs, husks of rice, coffee and coconut, shells of oil seeds, coconuts and groundnuts, oil palm fibres and sugar cane bagasse. Assuming that all of these resi-dues are suitable and that 100 % is used for the production of second-generation bio-fuels, this production would exceed the current transport fuel demand in Tanzania. However, agricultural residues are also used as fertilizer, forage and for heating and cooking. There is no accurate data on the availability of unused agricultural residues. Furthermore, not all types of residues are considered suitable. In Morogoro, sisal wastes, rice husks and bagasse and molasses from sugar cane occur in large enough volumes for the production of second-generation biofuels. Obstacles to second-generation biofuel production in Tanzania include the poor infrastructure, which makes transportation difficult and expensive, a shortage of skilled labour and the lack of re-search and development activities in relation to biofuels (OECD/ IEA 2010).
6.2.4 Biofuels value chain potential for smallholders
Having given an overview of the different crops and residues available for the produc-tion of liquid biofuels and bioenergy in Tanzania, it is important to look at the implica-tions of the different options for rural smallholders and the local population in general. If biofuel value chains are to contribute to rural development and poverty alleviation, there must be opportunities for the rural population to partake in these value chains.
Biofuel feedstocks production models
Biofuels production can be carried out under a range of production models. In the fol-lowing, the production models that are currently practiced or emerging in Tanzania are briefly portrayed, considering their implications for smallholders.

Final Better-iS Report of Wuppertal Institute
Page 95
1. Large scale plantations owned by investors: In this production model biofuel companies own the land and run large plantations for the production of biofuel feed-stocks. Involvement of the rural population is limited to employment. In Tanzania, the foreign-owned companies SEKAB BT, Bioshape, FELISA and Sun Biofuels have ac-quired large areas for plantations (Sulle et al. 2009).
This production model entails a number of advantages for the investors:
• financial and asset security (e.g. to acquire bank loans)
• reliability of feedstock supply, price and quality
• efficiency through economies of scale
• advantages for marketing: it is easier to assure that the product meets market re-quirements, for example in terms of quality or certification standards
• sometimes this production model is the only option, for example in areas with low population density and/or lack of established agricultural capacity
Potential disadvantages:
• potential loss of land and resources for smallholders through land acquisition by bio-fuel companies
• issues with labour wages and rights, job losses due to mechanisation
• land clearing, biodiversity losses
• competition with food crops
2. Contract farmers and independent suppliers: In this production model smallhold-ers own the land and biofuels companies acquire their feedstocks through outgrower schemes with local farmers. Examples of projects that rely exclusively on outgrowers are those by Diligent Tanzani Ltd. and Prokon BV, both of which have contracted out-growers for the production of jatropha seeds (Sulle et al. 2009).
Advantages:
• Loss of land and livelihoods of smallholders can be avoided
• Opportunity for diversification, use of marginal land (jatropha is often grown as hedges, on contours and on marginal land)
• Financial and technical support from companies for smallholders in outgrower schemes can promote better agricultural practices and improve yields
• Income opportunities for smallholders (Sulle et al. 2009)
Potential disadvantages for companies and smallholders:
• Smallholders can increase prices or disrupt supply

Biomass production and consumption patterns in Tanzania
Page 96
• Some crops are less suitable for smallholders, example sugar cane: This crop re-quires substantial investments in processing machinery and technology which are difficult to finance for smallholders. The quality of cane decreases quickly after cut-ting, therefore short transport distances are important.
• In cases where large scale mills or ethanol production plants are single buyers in a region, small-scale suppliers may not receive fair prices
3. Hybrid models: Large plantations and small scale farmers outgrower schemes can be combined, which offers an opportunity to balance trade-offs between the interests of smallholders, investors, and national economic development. This can mean, that a company splits their supply between their own company-owned plantation and con-tracted farmers in the region, which is a common business model in Tanzania used for example by the Kilombero Sugar Company and by FELISA (to produce palm oil). An example of a more innovative business model is provided by SEKAB (although these plans have now been abandoned, see chapter on sugar cane, existing initiatives): the company had planned to establish a sugar cane plantation consisting of connected block farms managed by individual farmers and owned by the farmers association un-der a supply contract with SEKAB. So while the farmers would essentially be outgrow-ers, their farms would connect up to one big plantation allowing efficiencies of scale in production and harvesting (Sulle et al. 2009). Similar business models could potentially also be developed without involvement of biofuels companies through community co-operatives or similar arrangements. FAO (2010) modelling results show that outgrower schemes involving small-scale farmers are most effective for poverty alleviation. They suggest mixed small- and large-scale production systems as a good option for biofuels production, although there are indications that these mixed systems may reduce the profitability of biofuels and the reliability of feedstock supply.
Land rights and local livelihoods
Production models relying on contracted and independent smallholder suppliers are most promising from a local livelihoods and land access perspective. These production models offer opportunities for agricultural diversification and the use of marginal land.
However, most companies investing in biofuels in Tanzania are seeking to acquire large areas of land, which can have a number of consequences:
• If general land that is not used by local communities is acquired, negative impacts may be minimal. On the contrary, these investments may create employment oppor-tunities and new agricultural production opportunities if smallholders are included.
• If village land is acquired, several risks exist:
- The village may lose access to land used for livestock grazing and forest-based activities, which is likely to have major impacts on the livelihoods of the most vul-nerable groups
- Permanent loss of natural resources to the village

Final Better-iS Report of Wuppertal Institute
Page 97
- The current compensation process is problematic: appropriate pricing of land is difficult, villagers are often not aware of their rights,; in the past compensation payments have in some cases gone to district councils rather than villages (Sulle et al. 2009).
Government policy and guidelines on biofuel production to address these issues are still under development. A first draft was issued in 2008.
Opportunities in biofuels processing, storage, distribution und service
To maximize benefits for rural smallholders and the local population in general, in-volvement should not be restricted to the growing of feedstocks but also include oppor-tunities in later phases of biofuel value chains.
This is most challenging in the generation of bioethanol and the refining of plant oil to biodiesel, since these are capital- and technology-intensive operations. Furthermore, large scale production of liquid biofuels for export may contribute very little to local de-velopment. Instead or additionally, it may be beneficial to look at locally adapted prod-ucts and applications. One example is the production of jatropha oil to power multifunc-tion-platforms. These are portable engines that can run on unrefined plant oil (or bio-diesel). They can be used to run electricity generators for off-grid electricity in rural ar-eas or to directly power machines or appliances, for example to grind grain or to press oil (Vermeulen et al. 2009). In this scenario, every step of the value chain, from produc-tion of jatropha seeds over milling/oil extraction to distribution and end uses can take place in the local community. Corresponding pilot projects have been initiated by the NGOs TaTEDO and KAKUTE in Tanzania (Martin et al. 2009, Sulle et al. 2009).
Access to markets
As was already elaborated in chapter 6.1.2, marketing problems due to poor infrastruc-ture are a significant problem for farmers in some parts of the country. This will be the case for biofuel crops as well. High transportation costs are likely to limit feasibility and economic viability of biofuels production in some regions. Thus, planning for biofuels value chains must be regionally adapted: in some regions, production for export might be feasible whereas in other regions, only production for local use will be viable.
Biofuels and Food Security
Food security is an important concern in Tanzania. Biofuel production could lead to a competition with food crops, making them less available. In chapter 6.1.1 Tanzania’s self sufficiency ratios are shown and in chapter 6.1.3 food security in the case study regions is discussed. The most important food security crops in Tanzania are maize, cassava and rice (FAO 2010). As oil prices influence the biofuel and the agricultural market, lower oil prices could lead to Tanzania relying even more on imports for do-mestic needs (FAO 2010). Food prices also have a strong impact on the food security of households (FAO 2010).

Biomass production and consumption patterns in Tanzania
Page 98
Low food crop yields are the main problem that lead to food insecurity in Tanzania (FAO 2010). Higher yields and an increase in agricultural area are necessary to pre-vent competition with biofuels. Food production might even increase slightly, if most farmers would not switch from food crops to biofuels but rather reduce the amount of traditional export crops instead (FAO 2010). It is important that biofuel policies and regulations are implemented and low yields in the agricultural sector are addressed.
6.2.5 SWOT analyses of biofuels and bioenergy in Tanzania
Against the backdrop of high and rising oil prices, issues of energy security and climate change, the production of biofuels is often presented as promising economic opportuni-ty especially for developing countries. International investors show strong interest for biofuel investments in Africa due to the low cost of land and labour in the region. Fur-thermore, the development of a local biofuels industry has the potential to contribute to rural development and poverty alleviation and to provide sustainable energy to the rural poor. Replacing traditional wood fuels and costly imported fossil fuels with locally pro-duced biofuels can bring further economic and environmental benefits.
On the other hand, there are concerns about “land grabbing” by biofuels companies developing large plantations, limiting land access for the local population. Further con-cerns address the issue of competition with food crops, which can threaten food securi-ty in developing countries. Competition for water resources is also a relevant issue, which can limit the social, environmental and economic sustainability of biofuels. The following SWOT analysis for liquid biofuels summarizes the results of this chapter re-garding biofuels from jatropha, palm oil and sugar cane and considering the goals of rural development and smallholder involvement. A second SWOT analysis focuses on bioenergy from agricultural residues.

Final Better-iS Report of Wuppertal Institute
Page 99
Table 29: SWOT liquid biofuels from palm oil, jatropha, sugar cane
Strength • Palm oil: has been grown by smallholders for decades, suitable crop for outgrower schemes, high potential yields
• Jatropha: potential as hedge plant and on marginal land (although there are doubts about the viability of the latter): minimizes risk of competition with food crops; resilient plant
• Sugar cane: large scale plantations and smallholder cultivation as well as factories already exist, productive (high yields) and well organised industry, C-molasses can be used for ethanol production without competition with food uses
Weakness • Palm oil: at present, domestic production far below demand for food oil; large amounts imported, production would have to be increased significantly to produce surplus and prevent competition with food uses; oil palm re-quires a lot of water
• Jatropha: little experience and knowledge about jatropha as commercial oil crop, conflicting reports about agronomic needs and economic perfor-mance, lower yields than other oil crops, unclear if production at competitive price (in relation to other fuels) is possible; more research needed
• Sugar cane: domestic production not sufficient to meet demand for crystal-line sugar, therefore ethanol production from cane juice would compete with food use, high water demand of sugar cultivation and processing, pro-cessing requires significant investment, therefore equitable involvement of rural population in this phase difficult
Opportunity • Substitute costly oil imports (1.3 – 1.6 billion US $ per year, 25 % of foreign exchange earnings)
• New sustainable energy sources • New source of agricultural income and economic growth in rural areas • Palm oil: opportunity to increase oil yields by improving farming practices
and modernizing extraction equipment • Jatropha: potential to use pure plant oil for local decentralized energy ap-
plications; potential for poverty reduction as smallholder crop • Sugar cane: potentially efficient and low cost biofuel
Threat • water scarcity and deforestation, biodiversity loss • negative impacts on price and availability of food crops • „land grabbing“, leading to loss of access to and rights over customary land
of local communities • potential agronomic and ecological threats: lack of specific studies on influ-
ence of different biofuel crops on soil and environment (esp. for jatropha) • Palm oil: competition with use as oil for food and other uses (soap); • Palm oil & sugar cane: large scale expansion of production comprises
risks of water scarcity and competition with other crops for land with high water availability (not abundant in Tanzania!); low availability of suitable land
• Jatropha: risks of poor viability, economic threat for smallholders

Biomass production and consumption patterns in Tanzania
Page 100
Table 30: SWOT Bioenergy from Agricultural Residues
Strength • Very small risk of land-use competition • Large amounts of residues and waste material available in the country due
to agro-based economy • Social acceptance of agro-processing and energy generation from biomass • Mature technology for different scale levels available and experience with
these technologies already existing in Tanzania • Environmental and financial benefits as the need of residue-disposal is be-
ing omitted and when using biogas technology organic fertilizer is available as a by product
Weakness • Seasonality and variability of available crop residues • Loss of agricultural residues as fertilizer • There are already a few systems in Tanzania using residues but there is no
reliable data and information on the local availability and sustainable use of agricultural residues
Opportunity • Existence of conducive environment to facilitate empowerment and in-creased opportunities for private sector participation (e.g. National Energy Policy [2003]; Electricity Act [2008])
• Modern and clean energy services as well as new source of agricultural in-come and economic growth opportunities for rural areas, as residues are normally processed near the production sites
• Positive effects on rural electrification and opportunity of partly meeting the rapidly increasing energy demand
• Existence of a large population without access to modern energy forms, which presents a potential for untapped modern energy market
• Diversification of energy supply sources and reduction of wood fuel use Threats • Low consumer incomes and negative impacts on price and availability of
residues for other uses • Insufficient credit facilities for small-scale projects and low educational level
of farmers • Social and technical barriers • Climate change could have negative impacts on crop production and hence
the availability of residues

Final Better-iS Report of Wuppertal Institute
Page 101
7 Overview of biomass consumption in 2010, 2020, 2030 This section summarizes the important trends of biomass production and consumption patterns in Tanzania, especially with regard to sustainability. These trends are im-portant to be able to identify the key challenges awaiting Tanzania with regard to sus-tainable biomass use in the future, including risks and opportunities associated with the development of a biofuels sector.
7.1 Trends of woody biomass production and consumption
Wood is the most important energy resource. Based on current developments this is not expected to change in the near future – on the contrary, current trends point to strong increases in the consumption of wood fuels, especially charcoal (see chapter 4). The following figure shows how the wood removal has increased in the period from 1990 to 2010 resulting in a decreasing forest area.
Figure 34: Development of forest area, agricultural area* and wood removals 1990-2010
*Agricultural area consists of cropped area, fallow and permanent meadows and pastures. Meadows and pastures are assumed to be at a constant value of 24 mio ha., thus increase in agricultural area is solely due to cropped area.
Source: FAOSTAT 2012; FAO 2010b

Biomass production and consumption patterns in Tanzania
Page 102
If deforestation would continue at this rate only about 60 % of the forest area of 1990 would still be left in 2030. Table 31 shows the resulting forest area if a deforestation rate of 403,328.5 ha/year was kept up. At this rate there would be no forest area left in 2093, but with a growing population the deforestation rate might even increase in the future. Mwampamba (2007) even estimated (in a median scenario) that to meet future charcoal demand all public forests could be depleted by the year 2048 .
Table 31: Calculated forest area if deforestation would continue at a rate of 403,328.5 ha per year
Year Forest area in 1000 ha Change in area since 1990
1990 41 495
2010 33 428 - 19 %
2020 29 395 - 29 %
2030 25 362 -39 %
Source: deforestation rate from FAO 2010b
Even though the agricultural area has increased only slightly in the period from 1990 to 2010, it can be expected that this area will increase further as the population grows. Figure 35 shows the expected population growth from 2000 to 2030 as well as the ex-pected increase in crop area.
Figure 35: Crop areas and population prospects of Tanzania up to 2030

Final Better-iS Report of Wuppertal Institute
Page 103
Data Source: UN 2010; IFPRI 2012
Not only wood fuel consumption but also the increase in crop area can be a threat to Tanzania’s forested area. As the population of Tanzania will grow to about twice its size in 2030 (UN 2010) the demand for agricultural products as well as fuels will grow too. Forest area might then be converted into agricultural land for livestock and crops, further accelerating deforestation. Furthermore climatic conditions, especially drought, can also be a factor affecting the forest area in some regions (see section 4). Important drivers decreasing the forest are: use of wood fuels, increased area for crops and live-stock (population growth), urbanization (charcoal consumption), logging for export.
Wood fuels (charcoal and fire wood) are the main energy resources consumed in Tan-zania. Using these fuels accelerates forest degradation and GHG emissions arise (Se-boka 2009). Additionally it also reduces the CO2 fixation as the forest area decreases. Compared to other fuels, e.g. ethanol, kerosene or LPG fire wood has a low energy value. The energy value of charcoal is twice as high but conversion efficiencies vary strongly. In urban areas charcoal is prefered to fire wood. With the traditionally ineffi-cient conversion of wood to charcoal in Tanzania charcoal users consume more wood than they would by directly using fire wood. At present charcoal is inefficient but has large short term efficiency potentials. Strategies to increase the sustainability of char-coal are:
• Sustainable forest management and afforestation/plantations to increase wood supply
• Increasing efficiency in production through improved kilns
• Increasing efficiency in consumption through improved stoves
• Exploring further options; such as briquetting of charcoal dust (from transporta-tion), production of charcoal briquettes from organic waste, agricultural residues or sawmilling residues
An other possibility to slow down the deforestation trend is the use of other energy car-riers. As especially in rural areas other fuels or electricity are almost not available, a higher access to electricity has the potential to decrease the consumption of wood fuels. According to the Ministry of Energy and Minerals, the electricity demand is ex-pected to triple by 2020 (MEM 2010b). The use of improved stoves could also reduce the necessary amount of wood. Higher yields in agriculture are a possibility to stop crop area from rising. Community forest management involving the local population could help to slow the deforestation trend down too (Zahabu 2008, Skutsch 2009).
7.2 Trends of agricultural biomass production and consumption
Due to the population growth biomass production, especially food production will have to be increased in the future to ensure self sufficiency. In the period of 2001 to 2010

Biomass production and consumption patterns in Tanzania
Page 104
self sufficiency was reached for non-cereals, but not for cereals (see section 6.1.1). For both categories a trend for an increasing production can be detected (URT, MAFC n.d.). The data for the period up to 2030 modelled by IFPRI also shows an increase in production. Figure 36 shows that the non-cereal production will increase strongly, while the cereal production only shows a slight increase. The meat production is also ex-pected to rise, poultry and beef production especially. The production in all case study regions will increase accordingly (data not shown), with a slightly higher rate in Shinyaga than in Kigoma and a bit lower but similar rates in Morogoro and Rukwa (IFPRI 2012).
Figure 36 also shows the consumption modelled by IFPRI using economic demand functions. It shows that the calculated production and consumption are close together. While non-cereal consumption could be satisfied with Tanzanian products, cereal con-sumption is higher than its production in Tanzania in this scenario too. The meat con-sumption and production equal each other.
Figure 36: Estimated production and consumption in Tanzania up to 2030
Data Source: IFPRI 2012
Land use trends show that crop area in Tanzania will increase. As can be seen in Fig-ure 35 and Table 32 the area used for crop production, especially for non-cereal pro-duction is assumed to increase at a continuous rate on national as on regional level. With a rising livestock number the area needed for food production will increase even more, indicating a trend towards a change in land use. In Table 32 an overview of the

Final Better-iS Report of Wuppertal Institute
Page 105
values for food consumption, food production and crop area modelled by IFPRI for the years 2010, 2020 and 2030 is given.
Table 32: Overview of modelled data of food consumption, production and crop area in 2010, 2020 and 2030
Year food consumption in 1000 tonnes
food production in 1000 tonnes
crop area in 1000 ha
2010 21 871 22 621 8 956
2020 25 619 25 861 10 115
2030 29 640 29 321 11 271
Source data: IFPRI 2012

Biomass production and consumption patterns in Tanzania
Page 106
8 Biomass Cascading: An option for Tanzania? As has been described in the previous chapters, three main biomass raw materials can be used for energetic purposes: wood, agricultural crops and residues. These materials stem from either forests / forestry, agriculture or processing industries and can be transformed through various paths to solid, liquid or gaseous energy carriers for heat, power generation and fuel. However, most of these raw materials also have other po-tential uses, for example as food, animal feed or renewable materials. Figure 37 gives an overview of various biomass pathways and utilisation options.
Figure 37: Example of biomass pathways and utilisation options
Source: Own figure, adapted from Bringezu et al. 2007
The fact that many different uses (food, feed, material, energy) can be derived from the same raw materials creates the potential of competition between these uses: palm oil for example can be used as food or as liquid biofuel; wood can be used as timber or as wood fuel; bagasse from sugar cane processing can be used for heat and electricity cogeneration, as animal feed or as a source of fibre for the production of paper or boards (Encyclopaedia Britannica 2012). These competing uses can also generate land use competition and impact negatively on land availability and food prices, which will affect socially disadvantaged groups most severely. Thus, new and more efficient ways of using renewable resources are needed. The cascading use of biomass is one of such opportunities for resource efficiency.
The cascading concept describes the multiple material use of the same resource, which can potentially include a final energetic use. Through repeated use of the bio-

Final Better-iS Report of Wuppertal Institute
Page 107
mass, efficiency can be improved; competition between different uses of biomass and pressure on land use can be reduced. The term cascading use (of biomass) is used in various ways and contexts in science and public discussions. A literature review high-lighted a range of key words related to cascading e.g. ”multi-functional biomass sys-tems“, ”renewable cascading“, “multiple use“, “circular economy“, ”multi product use“, ”product- or material recycling“ etc.. Dornburg (2004) gives a general definition of biomass cascading as sequential biomass use for different utilisations, i.e. material use, material recycling and energy recovery. In this way, it is a specific form of multiple biomass use. According to Dornburg, there are basically three options of multiple bio-mass use, of which only the third option visualises “cascading use”:
1. Multiple use I - by-products use: Several parts of the plant are used differently in contrast to the main product (see Figure 38).
Figure 38: Multiple use of renewable resources I: Use of by-products
Source: Arnold et al. 2009
The use of by-products from processing of biomass is very common and contributes to improving the resource efficiency of the biomass use, as several parts of the resource are used. Examples of by-product use include the utilisation of glycerine, which results from biodiesel production, or the production of wood pellets for heating from sawdust and other sawmilling wastes.
2. Multiple use II - parallel use: Processed parts of the plant are separated into prod-ucts for energetic or material use (see Figure 39).
Parallel use of plant parts describes the utilisation of different parts of a plant for differ-ent applications. An example of the application of this concept is a biorefinery. Biore-fineries can process biomass into a variety of materials, such as materials for chemical industries, foodstuffs and animal feed, as well as energy carriers such as fuels, heat or electricity (Kamm and Kamm 2003).

Biomass production and consumption patterns in Tanzania
Page 108
Figure 39: Multiple use of renewable resources II: Parallel use of all plant parts
Source: Arnold et al. 2009
3. Multiple use III – cascading use: The same biomass raw material is first used in a material application (potentially several times) and subsequently energetically (see Figure 40).
Figure 40: Multiple use of renewable resources III: Cascading use
Source: Arnold et al. 2009
Based on the above definition of Dornburg (2004) and aiming at high levels of value generated from the biomass, we understand the principle of cascading use ”as sequen-tial use of identical biogenetic raw materials first for (possibly repeated) high-value ma-terial utilisation and second for high-value energetic use”. The difference of cascading use compared to other forms of multiple use introduced above, is that the same bio-genic raw material is used several times for different applications, whereas in other forms of multiple use, different parts of a resource are used for different applications. The multiple material use of biomass (products) is enabled through different strategies such as reuse, repair, reconditioning, remanufacturing, recycling or upcycling.
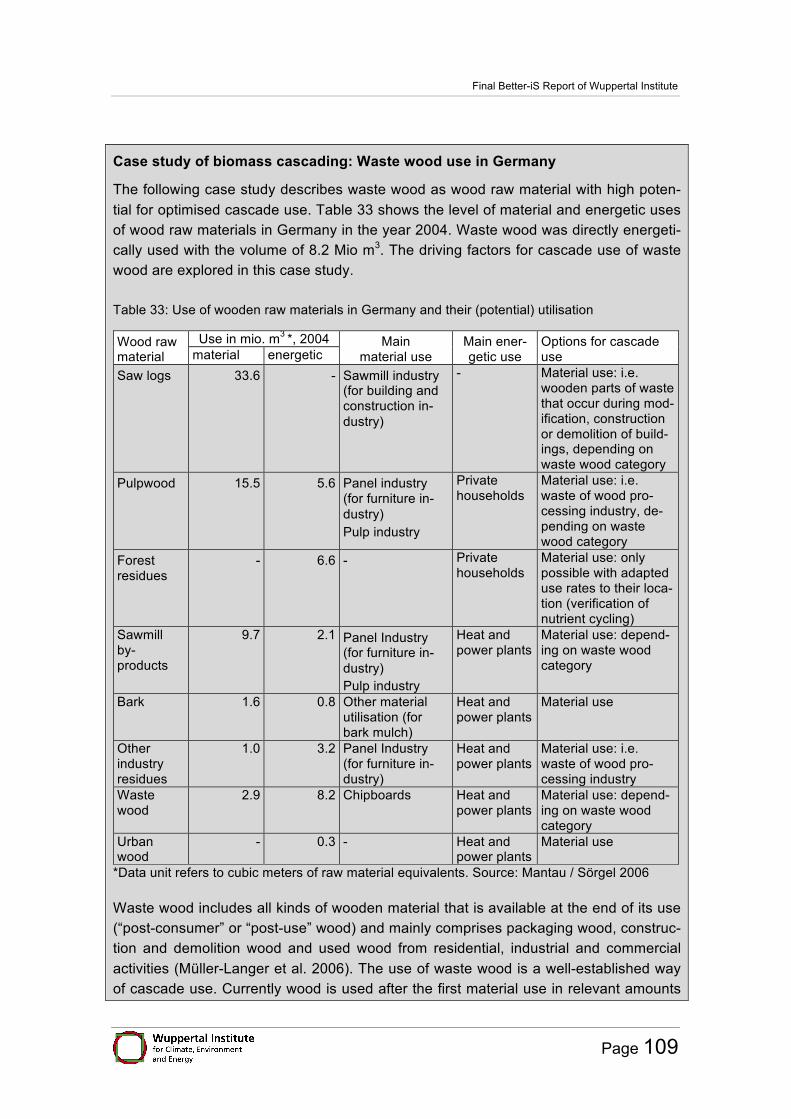
Final Better-iS Report of Wuppertal Institute
Page 109
Case study of biomass cascading: Waste wood use in Germany
The following case study describes waste wood as wood raw material with high poten-tial for optimised cascade use. Table 33 shows the level of material and energetic uses of wood raw materials in Germany in the year 2004. Waste wood was directly energeti-cally used with the volume of 8.2 Mio m3. The driving factors for cascade use of waste wood are explored in this case study.
Table 33: Use of wooden raw materials in Germany and their (potential) utilisation
Wood raw material
Use in mio. m3 *, 2004 Main material use
Main ener-getic use
Options for cascade use material energetic
Saw logs 33.6 - Sawmill industry (for building and construction in-dustry)
- Material use: i.e. wooden parts of waste that occur during mod-ification, construction or demolition of build-ings, depending on waste wood category
Pulpwood 15.5 5.6 Panel industry (for furniture in-dustry) Pulp industry
Private households
Material use: i.e. waste of wood pro-cessing industry, de-pending on waste wood category
Forest residues
- 6.6 - Private households
Material use: only possible with adapted use rates to their loca-tion (verification of nutrient cycling)
Sawmill by-products
9.7 2.1 Panel Industry (for furniture in-dustry) Pulp industry
Heat and power plants
Material use: depend-ing on waste wood category
Bark 1.6 0.8 Other material utilisation (for bark mulch)
Heat and power plants
Material use
Other industry residues
1.0 3.2 Panel Industry (for furniture in-dustry)
Heat and power plants
Material use: i.e. waste of wood pro-cessing industry
Waste wood
2.9 8.2 Chipboards Heat and power plants
Material use: depend-ing on waste wood category
Urban wood
- 0.3 - Heat and power plants
Material use
*Data unit refers to cubic meters of raw material equivalents. Source: Mantau / Sörgel 2006
Waste wood includes all kinds of wooden material that is available at the end of its use (“post-consumer” or “post-use” wood) and mainly comprises packaging wood, construc-tion and demolition wood and used wood from residential, industrial and commercial activities (Müller-Langer et al. 2006). The use of waste wood is a well-established way of cascade use. Currently wood is used after the first material use in relevant amounts

Biomass production and consumption patterns in Tanzania
Page 110
in form of waste wood generally for energetic use – partially with one or further material uses (see Table 34). The German Ordinance on the Management of Waste Wood entered into force in 2003. The Ordinance laid down specific requirements for the recycling and energy recovery as well as for the disposal of waste wood on the basis of the Closed Substance Cycle and Waste Management Act. The Waste Wood Ordinance defines wood waste as waste from industry wood residues and post-use wood. ”After wooden raw materials have fulfilled primary function they can be reintroduced into the economic cycle (BVSE 2005: 2). The Ordinance does not require prior material use (Bayerisches Landesamt für Umwelt 2005) but defines the circumstances under which waste wood needs to be thermally utilised. However, the owner of waste decides about the utilisation of waste wood (Dehoust et al. 2006: 144). Crucial for cascading use are previous manufacturing and processing of wood products and their wood preservation and design (e.g. paint, varnish, glue, other substances). The Wood Waste Ordinance mainly advises panel production made of waste wood from categories A I, A II und A III but within the limits of toxic substances. Estimations of the annual quantity of waste wood in Germany range from about 5 to 8 mio t (Müller-Langer et al. 2006, BVSE 2005, Weimar / Mantau 2008). Table 34 shows these estimations disaggregated for different waste wood categories.
Table 34: Estimations for waste wood quantities in the categories A I to A IV as defined in the German Waste Wood Ordinance (reference year 2004)
Category Definition
Quantity estimation by Müller-Langer
et al. 2006 Weimar / Man-
tau 2005 mio. t % mio. t %
A I Waste wood in its natural state or only mechanically worked which, during use, was at most insignificantly contaminated with substances harmful to wood.
1.923 36 1.112 17
A II Bonded, painted, coated, lacquered or otherwise treated waste wood with no halogenated organic compounds in the coating and no wood preservatives.
2.422 45 2.265 35
A III Waste wood with halogenated organic compounds in the coating, with no wood preservatives.
0.331 6 2.050 31
A IV Waste wood treated with wood preservatives, such as railway sleepers, telephone masts, hop poles, vine poles as well as other waste wood which, due to its contamina-tion, cannot be assigned to waste wood categories A I, A II or A III, with the exception of waste wood containing PCBs.
0.727 13 1.094 17
Total 5.4 100 6.5 100
Sources: Müller-Langer et al., 2006, Weimar / Mantau, 2005 in Müller-Langer et al., 2006
According to Mantau and Sörgel (2006: 18) about 74 % of waste wood (4.7 mio t) have been energetically used in Germany in 2004, the remaining 26 % have been used for substance recycling, mainly for panel production. There is a secondhand market for used wood products but the quantities are low. Substance recycling is feasible if the material is in good shape (Erbreich 2004). Reusable systems exist e.g. in the packag-ing sector for pallets (Müller-Langer et al. 2006).

Final Better-iS Report of Wuppertal Institute
Page 111
The quantity of waste wood used for substance recycling depends on a number of is-sues, e.g. on promotion of bioenergy through energy policy (decreases the amount of material biomass use) or the market development of the building sector and consump-tion patterns of households. Furthermore, the product and process development is im-portant for wood quality, reusability and life cycle of products.
For Germany, cascading use of waste wood was found to have the potential of en-hancing sustainability and decreasing competition between various uses of wood re-sources (Arnold et al. 2009). Through cascading, existing wood resources can be used more efficiently, which means that less wood is needed in total. Potentially positive ef-fects with regard to sustainability include:
• Reduction of resource and land area demand to supply renewable resources (Arnold et al. 2009; Bringezu et al. 2009) as well as reduction of competition between ener-getic and material use (Bringezu et al. 2008).
• Release of CO2 which is bound in wood products is delayed by having one or sev-eral material use cycle(s) before wood is used energetically (Deutscher Forst-wirtschaftsrat 2007, cited in EPEA 2009).
• If fossil energy carriers are substituted by energetically used wood, CO2-emissions can be saved (Bundesamt für Umwelt Schweiz 2008 cited in EPEA 2009). Further-more, wood products can replace other building materials with less advantageous CO2-balances (Albrecht et al. 2008; Bundesamt für Umwelt Schweiz 2008 cited in EPEA 2009). Through cascading use, these substitution effects are combined, so that CO2 reduction can be maximized (Bringezu et al. 2009).
• Possibly additional employment and value added due to repeated material use be-fore energetic use of renewable resources (Pöyry 2006; Knoll and Rupp 2007).
However, positive sustainability effects do not occur automatically with cascading use. Material recycling can induce increased transports for collection and processing of ma-terials, and preparation of material for recycling may consume energy and resources. Therefore, detailed assessments of different systems of cascading use are necessary before sustainability effects can be judged reliably.
Whether the concept of biomass cascading is suitable for enhancing the sustainability of biomass use in Tanzania is difficult to tell at this stage, as very little information on material uses of biomass is available. In terms of wood, more than 90 % of wood re-sources are directly used energetically at present, which leaves less than 10 % used as material such as poles, sawnwood, boards, pulp, paper etc.. Information on the utili-sation of waste wood (wood which has already been used in a material use cycle, ra-ther than wood processing wastes) in Tanzania could not be identified, therefore it is unknown whether cascading use of wood already exists in Tanzania or what the poten-tial is. Considering that wood is by far the most important energy carrier in Tanzania, it

Biomass production and consumption patterns in Tanzania
Page 112
seems likely that the energetic use of wood which has previously been used for other purposes (such as furniture, construction, fences etc.) already takes place at least in some areas.
Because material use of wood represents only a relatively small proportion of total wood consumption in Tanzania, sustainability gains from increased cascading use can also be expected to be relatively small. In the short term, efficiency increases in the production and consumption of woodfuels as well as the provision of alternative, more sustainable energy carriers are of high priority if a more sustainable utilisation of wood resources is supposed to be established. However, the potential of cascading use in Tanzania should be explored, as this strategy might well be suitable to additionally in-crease the efficiency of biomass use in the future. Furthermore, it should be explored which other biomass resources (apart from wood) might be suitable for cascading use.

Final Better-iS Report of Wuppertal Institute
Page 113
9 Conclusions Challenges for sustainable biomass use
In summary, the main problems associated with woody and agricultural biomass pro-duction and consumption in Tanzania are:
• Apparent unsustainable use of wood consumption patterns: More than 90% of roundwood removal is directly used as wood fuel. The increasing demand of wood fuels and agricultural products due to population growth leads to defor-estation, degradation, CO2 emissions, and expansion of agricultural land.
• Reasons for pressure on forest resources vary strongly with region: There are regional scarcities of wood. Over half of the regions experiencing acute wood fuel scarcity.
• High amount of wood fuel conversion to charcoal based on inefficient charcoal production. However, charcoal is the preferred wood fuel consumption due to user friendliness, easy access and compared to firewood higher energy content (and thus lower weight). The charcoal sector employs several 100,000 people in the country (largely informal).
• Low fuel/energy availability especially in rural regions: With rising fuel prices and a low electrification rate the trend towards wood based fuels is likely to con-tinue in the near future. Wood fuel issues are often neglected in governmental energy policies.
• Unsustainable forest management, especially illegal logging connected with the harvest of wood at no cost.
• Low agricultural productivity: To satisfy the growing food demand low produc-tivity and land pressure is an issue. However, today smallholder farming is dom-inant (cultivating about 85% of land with 0.2-2.0 ha plots)
• Impact of climate change and increasing greenhouse gas emissions: Increasing climate volatility and thus volatile agricultural productivity resulting in implica-tions for poverty vulnerability (because Tanzania is an agriculture-dependent developing country with poverty that is sensitive to food productivity)
With respect to biofuels, an integrated strategy for optimised biofuel value chains in Tanzania should consider the following specific challenges:
• A major concern when increasing the agricultural production of biofuels is en-suring that competing land uses do not lead to a lack of food crops. Agricultural biomass is needed for the production of energy, as material as well as for food. These competing uses all have to be taken into consideration.
Biomass production and consumption patterns in Tanzania
Page 114
• Biofuel production requires an increase in agricultural area if productivity is not enhanced. The increase of agricultural land use can lead to a loss of land ac-cess for the local population due to “land grabbing“ by large companies. Also forest area is turned into agricultural area leading to further deforestation.
• Inconsistent data on land availability in Tanzania ranges from 33.8 - 44.4 million ha theoretically suitable land (including land expansion and intensification strat-egies).
• There is limited land suitability for sugar cane and oil palm. Jatropha has poten-tial for low cost biodiesel production. Cassava has been analysed as the most promising pro-poor biofuel development option under smallholder conditions in Tanzania. There is energy potential of agricultural residues from commercial crop sector.
• As the population of Tanzania will grow to about twice its size in 2030 the food and energy demand will increase as well.
• Socio-economic problems regarding food and income security, property of land and water shortage
Integrated strategies towards sustainable biomass use and use of biofuel value chain potential
These interrelated challenges of biomass use highlight the need for development and implementation of an integrated strategy to use the biofuel value chain potential in Tanzania more effectively. Basic questions to be addressed in an integrated strategy are:
1. How to take the growing food demand due to population growth as well as the growing energy demand into account?
2. How to reduce wood fuel use and/or accomplish an efficient and sustainable wood fuel production?
3. How to ensure that increasing biofuel production does not decrease the com-peting biomass uses for food and material and does not compete for the area with the forest land and the local population
4. How to create synergies between food and biofuels production?
In most regions efforts for sustainable use and conservation are made by individual tree growing in agro-forestry, community conservation of woodlands and the promotion of improved wood and charcoal stoves (Kaale 2005). The experts and stakeholders agreed that this was insufficient. There are different measures concerning sustainable use of woody and agricultural biomass in Tanzania discussed and partly implemented, they include the following important issues.

Final Better-iS Report of Wuppertal Institute
Page 115
(a) Improving yields in agriculture
One possibility to stop the expansion of crop area and to lower the pressure on forest areas despite population growth is to improve agricultural yields while preserving soil, water resource, and biodiversity. For the future, improvements in food crop productivity are expected as a result of government programmes (e.g. Kilimo Kwanza 2009). Con-servation agriculture and other improved farming practices could be applied increasing-ly to do this. However, considering the water availability, climate change, and environ-mental restrictions the yield development is limited.
(b) Increasing fuel/energy availability and efficiency
Another possibility to slow down the deforestation trend is to switch to other energy carriers. As especially in rural areas other fuels or electricity are rarely available, im-proved access to e.g. electricity has the potential to decrease the consumption of wood fuels (Lusambo 2009).
The production and consumption of charcoal are particularly significant in terms of pressure on forest resources. Since the efficiency of kilns used to convert wood to charcoal in Tanzania is usually low (8 to 12 % for traditional earth kilns, up to 23 % for improved kilns (World Bank 2009)), charcoal consumes four to six times as much wood per kg as firewood (Mwampamba 2007). Furthermore, the efficiency of traditional char-coal stoves is also low at 10 to 25 %, while improved stoves can reach an efficiency of 30 to 50 %. However, they are more expensive than traditional stoves and payback times on the investment through savings on charcoal can be several months (Seidl 2008). Figures on the market penetration of improved stoves range from 20 to 40 % (World Bank 2009).
A problem associated with charcoal transports from an efficiency point of view is the breakage of charcoal during packaging and transport, which causes a loss of around 20 %. These fine broken charcoal particles could be used to produce briquettes; this is however rarely done in African countries (Seidl 2008).
(c) Sustainable forest management and decreasing of illegal logging
Most African governments do not consider wood fuels sufficiently in their energy poli-cies, more attention is given to “modern” energy such as electricity (Seboka 2009). Government spending on forest governance is low, prohibiting effective forest man-agement and implementation of existing management policies (Seboka 2009; Experts of Better-iS stakeholder workshop 2010). Furthermore, the enforcement of the existing framework of forest management legislation in Tanzania is strongly hindered by corrup-tion (Milledge et al. 2007). Since market mechanisms do not provide enough incentive to realize efficiency potentials provided by improved kilns and stoves and to promote sustainable use of forest resources (Sepp 2008; Seboka 2009), a concerted effort of energy and forest policy would be needed to move the wood fuel sector towards sus-
Biomass production and consumption patterns in Tanzania
Page 116
tainability. The effectiveness of current approaches e.g. community forest management and REDD7 is not yet proved (Ahrends et al. 2010).
(d) Informed biofuel sector support
Based on an integrated long-term biomass strategy sustainable biofuel production and consumption could be supported. The conditions for biofuels investors to contribute to capital provision and capacity building have to be improved. One of the challenges is to take different land and biomass uses into account and make sure that all relevant stakeholder interests are considered. Creating synergies between food and biofuel production with cascading use could be a solution but needs further research.
Outlook
With growing energy demand and cheap energy carrier, rising fuel prices and a low electrification rate, the trend towards unsustainable use of wood fuels will continue in the near future. The worldwide trend towards energetic biomass use leads to changes in biomass production and consumption for other uses. In Tanzania, the current bio-mass production and consumption patterns have to change to become more sustaina-ble and efficient, as the unsustainable use of woody and agricultural biomass in the country leads to different stages of forest conversion to the point of deforestation.
A number of measures for a sustainability strategy have already been suggested, but an stronger effort for their implementation as well as the formulation of a harmonised biomass strategy is still missing. Especially the inefficient conversion of wood to char-coal has a high short-term improvement potential. Consequently, the participatory de-velopment and implementation of proactive measures especially towards more sus-tainable woody biomass use requires attention.
The development of an integrated biomass strategy requires a good data base. For Tanzania, national and regional data need to be improved to have a data base which is current, reliable and available for longer period of time. If statistical data are missing, the integration of expert and stakeholder knowledge is a promising approach to get an appropriate picture of current biomass production and consumption patterns. But still data on these patterns, for example with respect to the time series, should to be im-proved as sound basis of an integrated biomass strategy.
7 “Reducing Emissions from Deforestation and forest Degradation” (REDD) is an policy instrument within the United Na-tions Framework Convention on Climate Change. The programme was created to reduce emissions from deforestation and forest degradation in developing countries by further strengthening ongoing efforts, facilitating transfer of technology, ex-ploring further options and mobilizing resources. The idea is to include emission reductions from reduced deforestation in a post-2012 climate regime, that provides compensation for reducing emissions from deforestation in developing countries.

Final Better-iS Report of Wuppertal Institute
Page 117
References ACP-EU Energy Facility: Position paper on Biofuels for the ACP-EU Energy Facility. AfDB, OECD, UNDP, UNECA (2012): African Economic Outlook Tanzania Country note. -
http://www.africaneconomicoutlook.org/en/countries/east-africa/tanzania/ (Accessed 27 Au-gust 2012
AfDB/OECD (2004): African Economic Outlook: Tanzania. - http://www.oecd.org AFREPREN/FWD (2008): Scaling up Bio-fuels in East Africa: Background Paper for the Interna-
tional Conference on Scaling-Up Renewables in Africa, Nairobi. Agrawala, S., Moehner, A., Hemp, A., van Aalst, M., Hitz, S., Smith, J., Meena, H., Mwakifwam-
ba, S. M., Hyera, T., Mwaipopo, O. U. (2003): Development and climate change in Tanzania: focus on Mount Kilimanjaro. Special Issue on Climate Change - Linking Climate change Re-sponses with Development Planning: Some Case Studies, OECD Papers, Vol. 4 (1)
Ahmed, S. A., Noah S. Diffenbaugh Thomas W. Hertel David B. Lobell Navin Ramankutty Ana R. Rios Pedram Rowhani (2009): Climate Volatility and Poverty Vulnerability in Tanzania. Policy Research Working Paper 5117, URL: http://www-wds.worldbank.org/external/default/WDSContentServer/WDSP/IB/2009/11/09/000158349_20091109085100/Rendered/PDF/WPS5117.pdf
Ahrends, A., Burgess, N.D., Milledge, S.A.H., Bulling, M.T., Fisher, B., Smart, J.C.R., Clarke, G.P., Mhoro, B.E. and Lewis, S.L. (2010): Predictable waves of sequential forest degrada-tion and biodiversity loss spreading from an African city. Proceedings of the National Acad-emy of Science of USA, Vol. 107 (33), p. 14556–14561.
AICD (African Infrastructure Country Diagnostic) (2010): Tanzania’s Infrastructure: A Continen-tal Perspective. The World Bank, Washington.
AICD (African Infrastructure Country Diagnostic) (2011): Tanzania Interactive Infrastructure Atlas. Africa Infrastructure Knowledge Program 2011, http://www.infrastructureafrica.org/library/doc/692/tanzania-interactive-atlas (Accessed 27 June 2012)
Ajayi, O.C., Akinnifesi, F.K., Sileshi, G., Chakeredza, S., Mn’gomba, S., Ajayi, O., Nyoka, I., Chineke, T. (2008): Local solutions to global problems: the potential of agroforestry for cli-mate change adaptation and mitigation in southern Africa. - Invited paper presented at the Tropical Forests and Climate Change Adaptation (TroFCCA) Regional meeting “Knowledge and Action on Forests for Climate Change Adaptation in Africa”, November 18-20, Accra, Ghana. ICRAF
Albrecht, S., Rüter, S., Welling, J., Knauf, M., Mantau, U., Braune, A., Baitz, M., Weimar, H., Sörgel, S., Kreissig, J., Deimling, J., Hellwig, S. (2008): Verbundprojekt ÖkoPot - Ökologische Potenziale durch Holznutzung gezielt fördern. Endbericht. BMBF Förderschwerpunkt Nachhaltige Waldwirtschaft, Erschließung von Wertschöpfungspotenzi-alen entlang der Forst- und Holzkette, Universität Hamburg, Fachbereich Biologie, Zentrum Holzwirtschaft, Universität Stuttgart, Lehrstuhl für Bauphysik, Knauf Consulting, PE Interna-tional, December 2008.
Amigun,B., Sigamoney, R., and von Blottnitz, H. (2008): Commercialisation of biofuel industry in Africa: A review. - Renewable and Sustainable Energy Reviews, Volume 12, Issue 3, Pages 690-711
Amoo-Gottfried, K., Hall, D. O. (1999): A biomass energy flow chart for Sierra Leone. In: Bio-mass and Bioenergy 16 (1999) 361-376, London.
Arnold, K., Bienge, K., v. Geibler, J., Ritthoff, M., Targiel, T., Zeiss, C., Meinel, U., Kristof, K., Bringezu, S. (2009): Klimaschutz und optimierter Ausbau erneuerbarer Energien durch Kaskadennutzung von Biomasse. Wuppertal Report Nr. 5, Wuppertal Institut, Wuppertal.
ARTI (Appropriate Rural Technology Institute) (2011): Waste to Wealth. http://arti-africa.org/projects/waste-to-wealth/ (Accessed 22 September 2011).
Bayerisches Landesamt für Umwelt (2005): Abfallratgeber Bayern. Altholz. Augsburg. Beukering van, P., G. Kahyarara, E. Massey, S. di Prima, S. Hess, V. Makundi, K. van der
Leeuw (2007): Optimization of the Charcoal Chain in Tanzania – A Gap Analysis. Poverty

Biomass production and consumption patterns in Tanzania
Page 118
Reduction and Environmental Management (PREM), Institute for Environmental Studies. Vri-je Universiteit, Amsterdam.
Bhattacharya, S. C., Pham, H. L., Shrestha, R. M./ Vu, Q .V. (1993): CO2 emissions due to fos-sil and traditional fuels, residues and wastes in Asia, AIT Workshop on Global Warming Is-sues in Asia, 8-10 September 1992, AIT, Bangkok, Thailand.
Bringezu, S., H. Schütz, K. Arnold, K. Bienge, S. Borbonus, M. Fischedick, J. von Geibler, K. Kristof, S.Ramesohl, M. Ritthoff, H. Schlippe, M. Frondel, R. Janßen-Timmen, C. Vance (2008): Nutzungskonkurrenzen bei Biomasse - Auswirkungen der verstärkten Nutzung von Biomasse im Energiebereich auf die stoffliche Nutzung in der Biomasse verarbeitenden In-dustrie und deren Wettbewerbsfähigkeit durch staatlich induzierte Förderprogramme. Wup-pertal Institut für Klima, Umwelt, Energie GmbH und Rheinisch-Westfälisches Institut für Wirtschaftsforschung für das Bundesministerium für Wirtschaft und Technologie.
Bringezu, S., Ramesohl, S., Arnold, K., Fischedick, M., von Geibler, J., Liedtke, C., Schütz, H. (2007): What we know and what we should know - Towards a sustainable biomass strategy. A discussion paper of the Wuppertal Institute. No. 163 · June 2007. ISSN 0949-5266.
Bringezu, S., Schütz, H., O’Brien, M.; Kauppi, l., Howarth, R.W., McNeely, J. (2009): Assessing Biofuels. UNEP, Paris.
Bringezu, S.; Schütz, H.; Arnold, K. Bienge, K.; Borbonus, S.; Fischedick, M.; von Geibler, J.; Kristof, K.; Ramesohl, S.; Ritthoff, M.; Schlippe, H. (2008): Nutzungskonkurrenz bei Bio-masse. Auswirkungen der verstärkten Nutzung von Biomasse im Energiebereich auf die stoffliche Nutzung in der Biomasse verarbeitenden Industrie und deren Wettbew-erbsfähigkeit durch staatlich induzierte Förderprogramme. Wuppertal Institut für Klima, Um-welt, Energie GmbH; Rheinisch-Westfälische Institut für Wirtschaftsforschung (Hg.), Wup-pertal / Essen
Broadhead, J., Bahdon, J. & Whiteman, A. (2001): Past trends and future prospects for the utili-zation of wood energy, Annex 2, Woodfuel consumption modelling and results. Working Pa-per GFSOS/WP/05, Rome, FAO Protection.
BVSE (Hg.) (2005): Altholz-Recycling. Bonn. CEEST – The Centre for Energy, Environment, Science and Technology (1999): Climate
Change Mitigation in Southern Africa. Tanzania Country Study, Tanzania Chidumayo, E.N., Masialeti, I., Ntalasha, H., Kalumiana, O.S. (2002): Individual partner report,
University of Zambia report. In: INCO_DEV: International Cooperation with Developing Countries (1998-2002) Contract number: ERBIC18CT980278 FINAL REPORT: Charcoal Potential in Southern Africa CHAPOSA. http://sei-international.org/publications?pid=1313 (Accessed 24 May 2011).
CIFOR (1999): Managing Miombo woodlands to benefit African communities. CIFOR Annual Report P.18.
COMPETE (2009): Good Practice Assessment for Bioenergy Projects, Good Practice Assess-ment for Bioenergy Projects, KwaZulu-Natal.
Cooper, C. J., Laing, C. A. (2007): A macro analysis of crop residue and animal wastes as a potential energy source in Africa, Johannesburg.
de Pauw, E. (1984): Soils, Physiography and Agroecological Zones of Tanzania, CMEW Pro-ject, MALD, Dar es Salaam
Dehoust, G., Buchert, M., Ferenz, J., Hermann, A., Jenseit, W., Schulze, F., Giegrich, J., Feh-renbach, H. (2006): Ermittlung von relevanten Stoffen bzw. Materialien für eine stoffstromo-rientierte ressourcenschonende Abfallwirtschaft. Endbericht. Teilvorhaben des Projekts „Fortentwicklung der Kreislaufwirtschaft zu einer nachhaltigen Stoffstrom- und Ressourcen-politik (FKZ 90531411), Darmstadt.
Deutscher Forstwirtschaftsrat: Holz gegen Klimawandel. Pressemitteilung, Bonn, 2007 Diligent Tanzania Ltd. (n.d.): http://www.diligent-tanzania.com/index.php?id=28 (Accessed
March 2010). Doornbosch, R., Steenblick, R. (2007): Biofuels: Is the Cure Worse than the Disease? Round
Table on Sustainable Development, Organisation for Economic Co-operation and Develop-ment, OECD, Paris
Dornburg, V. (2004): Multifunctional biomass systems. Utrecht: Universiteit Utrecht, ISBN: 90-393-3854-X

Final Better-iS Report of Wuppertal Institute
Page 119
DSD Dutch Sustainable Development Group (2005): Feasibility study on an effective and sus-tainable bio-ethanol production program by Least Developed Countries as alternative to cane sugar export, Netherlands.
EC-FAO (eds) (1999): The Status of Non-Timber Forest Products in Tanzania. Data Collection and Analysis for Sustainable Forest Management in ACP Countries - Linking National and International Efforts. By Forestry and Beekeeping Division, EC-FAO PARTNERSHIP PROGRAMME (1998-2000) http://www.fao.org/documents/advanced_s_result.asp?QueryString=tanzania&search=Search
Encyclopædia Britannica (2012): Bagasse. Encyclopædia Britannica Online. Encyclopædia Bri-tannica Inc., 2012. http://www.britannica.com/EBchecked/topic/48728/bagasse (Accessed 21 June 2012).
EPEA - Environmental Protection Encouragement Agency (Hrsg.) (2009): “CO2-Speicherung und Wertschöpfung – Holznutzung in einer Kaskade“ in Zusammenarbeit mit dem Verband der Deutschen Holzwerkstoffindustrie e.V. (VHI), Gießen und dem Fraunhofer Institut für Holzforschung (Wilhelm-Klauditz-Institut WKI), Braunschweig. Hamburg.
Erbreich, M. (2004): Die Aufbereitung und Wiederverwendung von Altholz zur Herstellung von Mitteldichten Faserplatten (MDF). Hamburg.
ESMAP (Energy Sector Management Assistance Program) (2011): Project To Help Tanzanians Turn Crop Waste To Wealth. http://www.esmap.org/esmap/node/1250 (Accessed 22 Sep-tember 2011)
European Commission (2008): Draft Commission Decision on the Annual Action Programme 2008 on Accompanying Measures on Sugar in favour of Tanzania to be financed under Arti-cle 21.060300 of the general budget of the European Communities.
FAL (Federal Agricultural Research Centre Institute of Farm Economics) (2007): The future competitiveness of sugar beet production in the EU in comparison to sugar cane production in developing countries. Braunschweig.
FAO (Food and Agricultural Organisation of the United Nations) (2004): Unified Bioenergy ter-minology.
FAO (Food and Agricultural Organisation of the United Nations) (2006): Global Forest Re-sources Assessment 2005. Progress towards sustainable forest management. FAO FORESTRY PAPER 147. http://www.fao.org/forestry/fra/fra2005/en/
FAO (Food and Agricultural Organisation of the United Nations) (2010): Bioenergy and Food Security, The BEFS Analysis for Tanzania. The Bioenergy and Food Security Project Food and Agriculture Organization of the United Nations, Rome.
FAO (Food and Agricultural Organisation of the United Nations) (2010b): Global Forest Re-sources Assessment 2010, Country Report United Republic of Tanzania. Rome. http://www.fao.org/forestry/fra/67090/en/tza/ (Accessed 06 July 2012).
FAO (Food and Agricultural Organisation of the United Nations) (2010c): Global Forest Re-sources Assessment 2010. Main Report. FAO FORESTRY PAPER 163, Rome http://www.fao.org/forestry/fra/fra2010/en/
FAO (Food and Agricultural Organisation of the United Nations) (2011): State of the World’s Forests, Rome. http://www.fao.org/docrep/013/i2000e/i2000e.pdf
FAO (Food and Agricultural Organisation of the United Nations) (2012a): Soil carbon monitoring using surveys and modelling. General description and application un the United Republic of Tanzania. FAO Forestey Paper No. 168, Rome. http://www.fao.org/docrep/015/i2793e/i2793e00.htm
FAO (Food and Agricultural Organisation of the United Nations) (2012b): FAO helps Tanzania monitor carbon stocks. Soil carbon assessment is key to reducing emissions. http://www.fao.org/news/story/en/item/142972/icode/ ( Accessed 17 July 2012).
FAO AGAL (2005): Livestock Sector Brief: United Republic of Tanzania. FAOSTAT (2009): http://faostat.fao.org (Accessed December 2009). FAOSTAT (2010): http://faostat.fao.org (Accessed June 2010). FAOSTAT (2011): ResourceStat: Land http://faostat.fao.org (Accessed May 2011).

Biomass production and consumption patterns in Tanzania
Page 120
FAOSTAT (2011b): Glossary: Waste. http://faostat.fao.org/site/379/DesktopDefault.aspx?PageID=379 (Accessed September 2011).
FAOSTAT (2012): Forestry, ForesSTAT; http://faostat.fao.org/site/626/default.aspx#ancor Re-sources, Land http://faostat.fao.org/site/377/default.aspx#ancor (Accessed July 2012).
FAOSTAT (2012a): http://faostat.fao.org (Accessed July 2012). FOSA Forestry outlook study for Africa (2003): Subregional Report East Africa. Frey, B., Neubauer, M. (2002): Energy Supply for Three Cities in Southern Africa. - Universität
Stuttgart, Institut für Energiewirtschaft und Rationelle Energieanwendung, Forschungsber-icht, Band 90.
GEXIS (ed.) (2008): Global Market Study on Jatropha – Final Report. Prepared for the World Wide Fund for Nature (WWF), London.
Government of Malawi (2009): Malawi Biomass energy strategy. GTZ (Deutsche Gesellschaft für Technische Zusammenarbeit) (German Technical Cooperation)
(2005): Liquid Biofuels for Transportation in Tanzania, Potential and Implications for Sus-tainable Agriculture and Energy in the 21st Century. Study commissioned by the GTZ, Esch-born.
GTZ (Deutsche Gesellschaft für Technische Zusammenarbeit) (German Technical Cooperation) (2009): Jatropha Reality Check: A field assessment of the agronomic and economic viability of Jatropha and other oilseed crops in Kenya. Study conducted by Endelevu Energy, World Agroforestry Centre and Kenya Forestry Research Institute, commissioned and published by the GTZ, Eschborn.
Gwang’ombe, F. (2004): Renewable Energy Technologies in Tanzania: Biomass-. Based Co-generation. Africa Energy Policy Research Network, Nairobi.
Hoogeveen, J. & Ruhinduka, R. (2009). Poverty reduction in Tanzania since 2001: Good inten-tions, few results. Paper commissioned by the Research and Analysis Working Group (un-published).
IFPRI (International Food Policy Research Institute) (2012): Modelling data received by email from Siwa Msangi on 13 July 2012
ILO (2011): Towards decent work: monitoring millennium development goal employment indica-tors in sub-Saharan Africa / edited by Theo Sparreboom and Alana Albee. International La-bour Office, Geneva.
IPCC (Intergovernmental Panel on Climate Change) (2007a): Foresty. In: Climate Change 2007: Mitigation of Climate Change. Contribution of Working Group III to the Fourth As-sessment Report of the Intergovernmental Panel on Climate Change. S. 541 – 584.
IPCC (Intergovernmental Panel on Climate Change) (2007b): Climate Change 2007: Synthesis Report. Summary for Policymakers. http://www.ipcc.ch/pdf/assessment-report/ar4/syr/ar4_syr_spm.pdf.
Johnson, F. X., Matsika, E. (2006): Bio-energy trade and regional development: the case of bio-ethanol in southern Africa. In: Energy for Sustainable Development, Volume X No. 1, March 2006.
Kaale, B.K. (2005): Baseline Study on Biomass Energy Conservation in Tanzania. SADC Pro-gramme for Biomass Energy Conservation (Pro BEC). Ministry of Energy and Minerals.
Kamm, B. und Kamm, M. (2004): Biorefinery – Systems. Chemical and Biochemical Engineer-ing Quarterly, Vol. 18 (1), S. 1–6.
Kilimo Kwanza (2009): http://www.tzonline.org/pdf/tenpillarsofkilimokwanza.pdf Knoll, M. und Rupp, J. (2007): Stoffliche oder Energetische Nutzung? – Nutzungskonkurrenz
um die Ressource Holz. Verbundvorhaben im BMBF-Förderschwerpunkt „Forschung für eine nachhaltige Waldwirtschaft“, Papierreihe des „Holzwende 2020 plus“-Projekts, Institut für Zukunftsstudien und Technologiebewertung, Berlin.
Koopmans, A., Koppejan J. (1998): Agricultural and forest residues – generation, utilization and availability. Paper presented at the Regional Consultation on Modern Applications of Bio-mass Energy, 6-10 January 1997, Kuala Lumpur, Malaysia.
LARRRI, JOLIT (Land Rights Research and Resources Institute (LARRRI) and Joint Oxfam Livelihood Initiative for Tanzania (JOLIT) (2008): The agrofuel industry in Tanzania: A critical enquiry into challenges and opportunities, Dar es Salaam.
Final Better-iS Report of Wuppertal Institute
Page 121
Leopoldina - Nationale Akademie der Wissenschaften Leopoldina (2012): Bioenergie – Möglichkeiten und Grenzen. Halle (Saale) www.leopoldina.org/uploads/tx_leopublication/201207_Stellungnahme_Bioenergie_kurz_de_en_final_02.pdf
Luoga, E.J.; Witkowski, E.T.F.; Balkwill, K. (2002): Harvested and standing wood stocks in pro-tected and communal miombo woodlands of eastern Tanzania. Forest Ecology and Man-agement, Vol. 164 (1-3), p- 15-30.
Lusambo, L.P. (2009): Households’ wood fuels: The leading forest resources devastator in Tan-zania. Policy brief submitted to the Ministry of Natural Resources and Tourism, Forestry and Beekeeping Division; United Republic of Tanzania
Lyimo, B. M. (2006): Energy and sustainable development in Tanzana. Helio International. Sus-tainable Energy Watch 2005/2006, Dar es Salaam.
Madulu, N.F. (2002): Population distribution and density in Tanzania: Experiences from 2002 population and housing census, University of Dar es Salaam, Institute of Resource Assess-ment
MAFC (Ministry of Agriculture, Food Security and Cooperatives, Tanzania) (2001): Agricultural Sector Development Strategy. http://www.kilimo.go.tz/publications/eng/ASDS%20Documents.pdf
MAFC (Ministry of Agriculture, Food Security and Cooperatives) (2009): “Tanzania Government Perspectives on Biofuels”, paper presented to the Roundtable Sustainable Biofuels in Nairo-bi, Kenya, 23-24 March 2009. http://cgse.epfl.ch/page79684.html
MAFC (Ministry of Agriculture, Food Security and Cooperatives) (2010): Agricultural Statistics, Agriculture Basic Data 1996/97-2002/03, Food Crops Production. http://www.kilimo.go.tz/agricultural%20statistics/angricultural%20statistics.htm (Accessed 28 September 2010).
MAFC (Ministry of Agriculture, Food Security and Cooperatives) (2010b): Agricultural Statistics, Agriculture Basic Data 1998/99-2004/05, Cash Crops Production, Area and Yield. http://www.agriculture.go.tz/agricultural%20statistics/angricultural%20statistics.htm (Ac-cessed 08 June 2011).
Malimbwi, R.E., Misana, S., Monela, G., Jambiya, G., Nduwamungu, J. (2002): Individual part-ner report, Sokoine University of Agriculture, Tanzania partner report. In: INCO_DEV: Inter-national Cooperation with Developing Countries (1998-2002) Contract number: ERBIC18CT980278 FINAL REPORT: Charcoal Potential in Southern Africa CHAPOSA. http://sei-international.org/publications?pid=1313. (Accessed 24 May 2011).
Malley, Z.J.U., Taeb, M., Matsumoto, T., Takeya, H. (2008): Linking perceived land and water resources degradation, scarcity and livelihood conflicts in southwestern Tanzania: implica-tions for sustainable rural livelihood. Environment, Development and Sustainability, Vol. 10, p. 349-372.
Mantau, U. und Sörgel, C. (2006): Holzrohstoffbilanz Deutschland - Bestandsaufnahme 2004 - Ergebnis-bericht. Hamburg
Martin, M., Mwakaje, A.G., Eklund, M. (2009). Biofuel development initiatives in Tanzania: de-velopment activities, scales of production and conditions for implementation and utilization. – Journal of Cleaner Production 17 (Suppl.1), S69-S76
MEM (Ministry of Energy and Minerals) (2008): The Petroleum Act 2008. http://www.mem.go.tz/modules/documents/index.php?&direction=0&order=&directory=Energy%20Sector (Accessed 25 May 2011)
MEM (Ministry of Energy and Minerals) (2010): Guidelines for sustainable liquid biofuels devel-opment in Tanzania. http://www.mem.go.tz/news_events/view_news_item.php?id=61&intVariationID=1&szTitle=Current (Accessed 25 May 2011).
MEM (Ministry of Energy and Minerals) (2010b): Overview of Energy Sector. http://www.mem.go.tz/energy/index.php (Accessed 06 June 2011).
Milledge, S.A.H., Gelvas, I. K. and Ahrends, A. (2007). Forestry, Governance and National De-velopment: Lessons Learned from a Logging Boom in Southern Tanzania. An Overview. TRAFFIC East/Southern Africa / Tanzania Development Partners Group / Ministry of Natural Resources of Tourism, Dar es Salaam, Tanzania. 16pp.

Biomass production and consumption patterns in Tanzania
Page 122
Müller-Langer, F., Schneider, S., Witt, J., Thrän, D., Baur, F., Koch, M. (2006): Monitoring zur Wirkung der Biomasseverordnung. Zwischenbericht. Leipzig
Mwakaje, A.G. (2008): Dairy farming and biogas use in Rungwe district, South-west Tanzania: A study of opportunities and constraints.- Renewable and Sustainable Energy Reviews, Vol-ume 12, Issue 8, Pages 2240-2252
Mwampamba, T.H. (2007): Has the woodfuel crisis returned? Urban charcoal consumption in Tanzania and its implications to present and future forest availability. - Energy Policy 35 (8), 4221-4234.
Mwihava, N. C. X., Mbise H. A. (2003): Status of Power Sub-sector Reforms and Promotion of Renewable Energy and Energy Efficiency Partnership, Renewables and Energy for Rural Development Group. AFREPREN/FWD, NORAD /Sida
Ness, B. et al. 2009): The African Land-Grab: Creating Equitable Governance Strategies through Codes-of-Conduct and Certification Schemes. Panel 2, Allocation & Access, Re-source Allocation, Wednesday, 2 December 2009, Lund.
Njombe, A. P., Msanga, Y. N. (2009): Livestock and diary industry development in Tanzania. Department of Livestock production and Marketing Infrastructure Development Ministry of Livestock Development.
OECD/IEA (2010): Sustainable Production of Second-Generation Biofuels - Potential and per-spectives in major economies and developing countries. Information Paper by A. Eisentraut. http://www.oecd.org/dataoecd/17/12/44567743.pdf
Otieno, H. O., Awange, J. L. (2006): Energy resources in east Africa: opportunities and chal-lenges, Belin & Heidelberg.
Population Division of the Department of Economic and Social Affairs of the United Nations Secretariat, World Population Prospects: The 2008 Revision, http://esa.un.org/unpp, Friday, January 08, 2010; 5:15:38 AM.
Pöyry (2006): Value Added and Employment in PPI and Energy Alternative (Präsentation für CEPI). Pöyry Forest Industry Consulting, Oy & Antti Rytkönen, Dezember 2006.
Practical Action Consulting (ed.) (2009): Small-Scale Bioenergy Initiatives: Brief description and preliminary lessons on livelihood impacts from case studies in Asia, Latin America and Afri-ca. Prepared for PISCES and FAO by Practical Action Consulting, January 2009. http://www.fao.org/documents/advanced_s_result.asp?QueryString=tanzania+energy&search=Search
REN21 (Renewable Energy Policy Netwirk for the 21st Century) (2011): Renewables 2011. Global Status Report. http://www.ren21.net/Portals/97/documents/GSR/REN21_GSR2011.pdf
Rosillo-Calle, F. (ed.) (2007): Biomass Assessment Handbook - Bioenergy for a Sustainable Environment, London.
Sarwatt, S., Mollel, E. (2006): Country Pasture/Forage Resource Profiles: United Republic of Tanzania. - http://www.fao.org/ag/AGP/AGPC/doc/Counprof/tanzania/
Seboka, Y. (2009): Charcoal production: Opportunities and Barriers for Improving Efficiency and Sustainability. In: UNDP/UNEP/UNEP Risoe Centre (2009): Bio-Carbon opportunities in Eastern Africa and Southern Africa: Harnessing Carbon Finance to Promote Sustainable Forestry, Agro‐Forestry and Bio‐Energy. UNDP New York, p. 102-126.
Segerstedt, A., Bobert J., Fasse, A., Hoffmann, H., Kabir, H., Sieber, S., Uckert, G. (2010): Potential of Sustainable Jatropha Oil Production in Tanzania: an Economic Land Evaluation Approach. Paper presented at the 117th EAAE Seminar: Climate change, food security and resilience of food and agricultural systems in developing countries: Mitigation and adaptation options. November 25-27, University of Hohenheim, Germany
Seidl, A. (2008): Charcoal in Africa: Importance, Problems and Possible Solution Strategies. GTZ, Eschborn
SEKAB (2007): SEKAB BioEnergy Tanzania Ltd, Company profile, Dar es Salaam. Senelwa, K. A., Hall, D. O. (1993): Biomass energy flow chart for Kenya. In: Biomass and Bio-
energy, Vol. 4, No. 1 pp. 35-48, London. Sepp, S. (2008): Shaping Charcoal Policies: Context, Process and Instruments as Exemplified
by Country Cases. GTZ.
Final Better-iS Report of Wuppertal Institute
Page 123
Serup, H., Kofman, P.D., Falster, H., Gamborg, C., Gundersen, P., Hansen, L., Heding, N., Jakobson, H.H., Nikolaisen, L., Thomsen, I.M., O’Caroll, J. (2005): Wood for Energy Produc-tion, Irish edition. COFORD, Dublin.
Shepherd, A.W. (2011): Understanding and using market information. Marketing Extension Guide. FAO, Rome.
Sjølie, H.K. (2012): Reducing greenhouse gas emissions from households and industry by the use of charcoal from sawmill residues in Tanzania. Journal of Cleaner Production, Vol. 27, p. 109-117.
Skutsch, M.M., Zahabu, E., Karky, B.S. (2009): Community forest management under REDD: policy conditions for equitable governance, XIII World Forestry Congress, Buenos Aires 18-23 October 2009
Strehler, A., Stutzle, W. (1987): Biomass Residues. - In: Biomass Regenerable Energy, Edited by Hall, D.O. and Overend, R.P.
Sulle, E. and Nelson, F. (2009): Biofuels, Land Access and Rural Livelihoods in Tanzania. IIED, London.
Tarimo, J. P., Takamuru, Y. T. (1998): Sugarcane production, processing and marketing in Tan-zania. African Study Monographs,19(1): pp. 1-11.
TaTEDO (2008): Liquid biofuels: pertinent issues, smallholder farmers and biofuels develop-ment in Tanzania, Dar es Salaam. http://www.tatedo.org/news/biofuels.htm (Accessed June 2010).
Tavlor, T. B., Weiss S. (1982): Worldwide Data Related to Potentials of Renewable Energy. The Centre for Energy and Environmental Studies, Princeton.
The World Bank (2002): The 2002 World Bank development indicators CD-Rom. The World Bank, Washington DC
The World Bank (2005): Study on Growth and Environment Links for Preparation of Country Economic Memorandum (CEM). Part 2: Uncaptured Growth Potential – Forestry, Wildlife and Marine Fisheries. http://www-wds.worldbank.org/external/default/main?menuPK=64187510&pagePK=64193027&piPK=64187937&theSitePK=523679&menuPK=64154159&searchMenuPK=64258545&theSitePK=523679&entityID=000310607_20071129165121&searchMenuPK=64258545&theSitePK=523679 (Accessed 23 May 2011).
The World Bank (2009): Environmental Crisis or Development Opportunity? Transforming the charcoal sector in Tanzania - A Policy Note.
The World Bank (2010): Tanzania Data at-a-Glance. Accessed 08.01.2010. http://web.worldbank.org/WBSITE/EXTERNAL/COUNTRIES/AFRICAEXT/TANZANIAEXTN/0,,menuPK:287361~pagePK:141132~piPK:141109~theSitePK:258799,00.html
TIC - Tanzania Investment Centre (2006): Investment Opportunities Agriculture Sector. http://www.tic.co.tz/ (Accessed March 2010).
UN (United Nations Department of Economic and Social Affairs/Population Division) (2010): World Population Prospects: The 2010, Volume II: Demographic Profiles
UN MDG Statistics (2012): Millenium Development Goals Indicators, URL: http://unstats.un.org/unsd/mdg/Search.aspx?q=poverty%20tanzania
UNDP (2004): The Human development Reports, United Nations Development Programme, New York. http://hdr.undp.org/statistics/
UNDP (2009): Bio-carbon opportunities in eastern & sothern Africa, Harnessing Carbon Finance to Promote Sustainable Forestry, Agro-Forestry and Bio-Energy. New York.
UNEP (United Nations Environment Programme) (2009): Towards sustainable production and use of resources: Assessing Biofuels http://www.unep.org/pdf/Assessing_Biofuels-full_report-Web.pdf.
UNIDO: Electricity, Heat and Fertilizer from Sisal- Biogas and Waste. http://www.unido.org/index.php?id=6464 (Accessed June 2010).
United Republic of Tanzania (2003): Initial national communication under the United Nations Framework Convention on Climate Change (UNFCCC). Vice presidents´s office, Dar es Sa-laam.
United Republic of Tanzania, Ministry of Agriculture, Food Security and Cooperatives (n.d.): Food Crop Production Forecast Reports.

Biomass production and consumption patterns in Tanzania
Page 124
URT (2009b): Brief 4: An Analysis of Household Income and Expenditure in Tanzania URT (United Republic of Tanzania) (1999): Proposed national action programme to combat
desertification. Vice President’s office URT (United Republic of Tanzania) (2006): National Sample Census of Agriculture 2002 / 2003:
Small Holder Agriculture. Volume II: CROP SECTOR - NATIONAL REPORT. National Bu-reau of Statistics, Ministry of Agriculture and Food Security, Ministry of Water and Livestock Development, Ministry of Cooperatives and Marketing, Presidents Office, Regional Admin-istration and Local Government, Ministry of Finance and Economic Affairs – Zanzibar.
URT (United Republic of Tanzania) (2006b): National Sample Census of Agriculture 2002 / 2003: Large scale farm report combined. National Bureau of Statistics, Ministry of Agriculture and Food Security, Ministry of Water and Livestock Development, Ministry of Cooperatives and Marketing, Presidents Office, Regional Administration and Local Government, Ministry of Finance and Economic Affairs – Zanzibar.
URT (United Republic of Tanzania) (2006c): Agricultural Sector Development Programme (ASDP). Support through basket fund. Government Programme Document.
URT (United Republic of Tanzania) (2007): National Sample Census of Agriculture 2002 / 2003: Volume Vi: Regional Report: Rukwa Region. National Bureau of Statistics, Ministry of Agri-culture and Food Security, Ministry of Water and Livestock Development, Ministry of Coop-eratives and Marketing, Presidents Office, Regional Administration and Local Government, Ministry of Finance and Economic Affairs – Zanzibar. http://www.agriculture.go.tz/agricultural%20statistics/angricultural%20statistics.htm
URT (United Republic of Tanzania) (2007b): National Sample Census of Agriculture 2002 / 2003: Volume Vp: Regional Report: Kigoma Region. National Bureau of Statistics, Ministry of Agriculture and Food Security, Ministry of Water and Livestock Development, Ministry of Cooperatives and Marketing, Presidents Office, Regional Administration and Local Govern-ment, Ministry of Finance and Economic Affairs – Zanzibar. http://www.agriculture.go.tz/agricultural%20statistics/angricultural%20statistics.htm
URT (United Republic of Tanzania) (2007c): National Sample Census of Agriculture 2002 / 2003: Volume Ve: Regional Report: Morogoro Region. National Bureau of Statistics, Ministry of Agriculture and Food Security, Ministry of Water and Livestock Development, Ministry of Cooperatives and Marketing, Presidents Office, Regional Administration and Local Govern-ment, Ministry of Finance and Economic Affairs – Zanzibar. http://www.agriculture.go.tz/agricultural%20statistics/angricultural%20statistics.htm
URT (United Republic of Tanzania) (2007d): National Sample Census of Agriculture 2002 / 2003: Volume Vq: Regional Report: Shinyanga Region. National Bureau of Statistics, Minis-try of Agriculture and Food Security, Ministry of Water and Livestock Development, Ministry of Cooperatives and Marketing, Presidents Office, Regional Administration and Local Gov-ernment, Ministry of Finance and Economic Affairs – Zanzibar. http://www.agriculture.go.tz/agricultural%20statistics/angricultural%20statistics.htm
URT (United Republic of Tanzania) (2007e): National Adaptation Programme of Action (NAPA), Vice President’s office, Division of Environment
URT (United Republic of Tanzania) (2009): Poverty and Human Development Report. URT (United Republic of Tanzania) (2011): Tanzania in Figures, National Bureau of Statistics,
Ministry of Finance URT (United Republic of Tanzania) (2012): Comprehensive Food Security and Nutrition As-
sessment Report of the April, 2012, Main (Masika) Season – Report. Coordinated by the Disaster Management Department - Prime Minister’s Office and The National Food Security Division - Ministry of Agriculture Food Security and Co-operatives, Dar es Salaam, Prepared by the Tanzania Food Security and Nutrition Analysis System - MUCHALI, Tanzania.
URT (United Republic of Tanzania) (2012a): NATIONAL SAMPLE CENSUS OF AGRICULTURE SMALL HOLDER AGRICULTIRE Volume II: CROP SECTOR – NATIONAL REPORT. Dar es Salaam.
Van Eijck, J., Romijn, H. (2008): Prospects for Jatropha biofuels in Tanzania: An analysis with Strategic Niche Management. – Energy Policy 36 (1), 311-325.
Vermeulen, S., Sulle, E., Fauveaud, S. (2009): Biofuels in Africa: growing small-scale opportuni-ties. IIED briefing: business models for sustainable development, November 2009.

Final Better-iS Report of Wuppertal Institute
Page 125
von Geibler, J. (2007): Biomassezertifizierung unter Wachstumsdruck: Wie wirksam sind Na-chhaltigkeitsstandards bei steigender Nachfrage? Diskussion am Beispiel der Wertschöpfungskette Palmöl. Biomass certification under growth pressure: how effective are sustainability standards in situations of increasing demand? Discussing the case of the palm oil value chain In: Wuppertal Paper 168. Wuppertal Institute, Wuppertal (in German with English abstract).
von Geibler, J., Kristof, K., Bienge, K. (2010): Sustainability assessment of entire forest value chains: Integrating stakeholder perspectives and indicators in decision support tools, in: Eco-logical Modelling, Vol. 221, 2206-2214.
WBGU (German Advisory Council on Global Change) (2009): World in Transition – Future Bio-energy and Sustainable Land Use, Berlin.
Webb, B. (1979): Technical Aspects of Agricultural and Agroindustrial Residues Utilization, Pro-ceedings of UNEP/ESCAP/FAO Workshop on Agricultural and Agroindustrial Residue Utili-zation in Asia and Pacific Region.
Weimar, H. und Mantau, U. (2008): Standorte der Holzwirtschaft. Altholz im Entsorgungsmarkt -Aufkommens- und Vermarktungsstruktur. Abschlussbericht. Universität Hamburg, Zentrum Holz-wirtschaft. Arbeitsbereich Ökonomie der Holz- und Forstwirtschaft. Hamburg.
WIP (2006): Opportunities for Biofuels in Tanzania Global Forum on Sustainable Energy –6th Meeting “Africa is energizing itself” 29 November –1 December 2006, Vienna, Austria Plena-ry V: Biofuels in Africa, Munich.
Wiskerke, W. (2008): Towards a sustainable biomass energy supply for rural households in semi-arid Shinyanga, Tanzania: A Cost/benefit analysis. Utrecht University, Masterarbeit.
Wolter (2008): Tanzania, The Challenge o Moving from Subsistence to Profit. Business for de-velopment. OECD, Paris.
WWF (2008): Scoping exercise (situation analysis) on the biofuels industry within and outside Tanzania. Final Draft report. Dar es Salaam.
Yevich, R., Logan, J. A. (2002): An assessment of biofuel use and burning of agricultural waste in the developing world. Submitted to Global Biogeochemical Cycles June 30, 2002. Cam-bridge, USA.
Zahabu, E. (2008): Sinks and Sources: A Strategy to Involve Forest Communities in Tanzania in Global Climate Policy. Dissertation to obtain the degree of doctor at the University of Twen-te. ISBN 978 90 365 2773 6.

Biomass production and consumption patterns in Tanzania
Page 126
Appendix A: Further detailed data and information
Forest and agriculture definitions from FAO (2006)
Forest: Forest Land spanning more than 0.5 hectares with trees higher than 5 metres and a canopy cover of more than 10 percent, or trees able to reach these thresholds in situ. It does not include land that is predominantly under agricultural or urban land use. Forest is determined both by the presence of trees and the absence of other predomi-nant land uses. The trees should be able to reach a minimum height of 5 metres in situ. Areas under reforestation that have not yet reached but are expected to reach a cano-py cover of 10 percent and a tree height of 5 m are included, as are temporarily un-stocked areas, resulting from human intervention or natural causes, which are ex-pected to regenerate.
Includes: areas with bamboo and palms provided that height and canopy cover criteria are met; forest roads, firebreaks and other small open areas; forest in national parks, nature reserves and other protected areas such as those of specific scientific, histori-cal, cultural or spiritual interest; windbreaks, shelterbelts and corridors of trees with an area of more than 0.5 ha and width of more than 20 m; plantations primarily used for forestry or protective purposes, such as rubber-wood plantations and cork oak stands.
Excludes: tree stands in agricultural production systems, for example in fruit plantations and agroforestry systems. The term also excludes trees in urban parks and gardens.
Other Wooded Land (OWL): Land not classified as forest, spanning more than 0.5 hectares; with trees higher than 5 m and a canopy cover of 5-10 percent, or trees able to reach these thresholds in situ; or with a combined cover of shrubs, bushes and trees above 10 percent. It does not include land that is predominantly under agricultural or urban land use.
Table 35: FAO classification of tree containing ecosystems
National Classes Forests OWL OL+ Inland Water
Wet Miombo Woodland 100%
Wet Seasonal Miombo Woodland 100%
Dry Miombo Woodland 67% 33%
Cleared Miombo Woodland 50% 50%
Coastal Forest Mosaic 100%
Semi-Arid Steppe 50% 50%
Semi-Arid Dry Steppe 33% 67%
Others 100%
OWL=Other Wooded Land; OL=Other Land Source: FAO 2010b

Final Better-iS Report of Wuppertal Institute
Page 127
Productive plantation (in forest/other wooded land): Forest/other wooded land of introduced species and in some cases native species, established through planting or seeding, mainly for production of wood or non- wood goods.
Includes: all stands of introduced species established for production of wood or non-wood goods.
May include: areas of native species characterized by few species, straight tree lines and/or even-aged stands.
Other utilization: Data refer to quantities of commodities used for non-food purposes, e.g. oil for soap. In order not to distort the picture of the national food pattern quantities of the commodity in question consumed mainly by tourists are included here (see also "Per capita supply"). In addition, this variable covers pet food. (Sources: FAO 1986, The ICS users' manual: Interlinked computer storage and processing system of food and agricultural commodity data. Rome)

Biomass production and consumption patterns in Tanzania
Page 128
Agro-ecological zones in Tanzania
Table 36: Seven agro-ecological zones and their characteristics
Zone Sub-Zone and areas Soils and Topography Altitude Rainfall
Growing season
1. COAST North: Tanga (except Lushoto);
South: Eastern Lindi and Mtwa-ra (except Ma-konde Plateau)
Infertile sands on gently rolling uplands
Alluvial soils in Rufuji
Sand and infertile soils
Fertile clays on uplands and river flood plains
Under 3000m
North: Bimodal, 750-1200mm
South: Unimod-al, 800-1200mm
North: Octo-ber-December and March-June
South: De-cember- April
2. ARID LANDS
North: Seren-geti, Ngorogoro Parks, Part of Masailand
Masai Steppe, Tarangire Park, Mkomazi Re-serve, Pangani and Eastern Dodoma
North: Volcanic ash and sediements. Soils variable in texture and very suspectible to water erosion
South: Rolling plains of low fertility.
Susceptible to water ero-sion. Pangani river flood plain with saline, alkaline soil
North: 1300- 1800m
South: 500-1500m
North: Unimodal, unreliable, 500-600mm
South: Unimodal and unreliable, 400-600mm
March-May
3. SEMI-ARID LANDS
Central Dodo-ma, Singida, Northern Iringa, some of Arusha, Shinyanga
Southern: Morogoro (ex-cept Kiliombero and Wami Ba-sins and Uluguru Mts).
Also Lindi and Southwest Mtwara
Central: Undulating plains with rocky hills and low scarps. Well drained soils with low fertility. Alluvial hardpan and saline soils in Eastern Rift Valley and lake Eyasi. Black cracking soils in Shinyanga.
Southern: Flat or undulating plains with rocky hills, mod-erate fertile loams and clays in South (Morogoro), infertile sand soils in center
Central: 1000-1500m
Southeast-ern 200- 600m
Central: Uni-modal and unre-liable, 500-800mm
Southeastern: Unimodal 600-800mm
December - March
4. PLATEAUX Western: Tabo-ra, Rukwa (North and Cen-ter), Mbeya
North: Kigoma, Part of Mara
Southern: Ruvuma and Southern Morogoro
Western: Wide sandy plains and Rift Valley scarps
Flooded swamps of Mala-garasi and Ugalla rivers have clay soil with high fertility
Southern: upland plains with rock hills. Clay soils of low to moderate fertility in south, infertile sands in North.
800- 1500m Western: Uni-modal, 800- 1000mm
Southern: Uni-modal, very reliable, 900-1300mm
November- April

Final Better-iS Report of Wuppertal Institute
Page 129
5. SOUTHERN AND WESTERN HIGHLANDS
Southern: A broad ridge of from N. Morogo-ro to N. Lake Nyasa, covering part of Iringa, Mbeya
Southwestern: Ufipa plateau in Sumbawanga
Western: Along the shore of Lake Tanganyi-ka in Kigoma and Kagera
Southern: Undulating plains to dissected hills and moun-tains. Moderately fertile clay soils with volcanic soils in Mbeya
Southwestern: Undulating plateau above Rift Valleys and sand soils of low fertility
Western: North-south ridges separated by swampy val-leys, loam and clay soils of low fertility in hills, with allu-vium and ponded clays in the valleys
Southern: 1200-1500m
Southwest: 1400- 2300m
Western: 100-1800m
Southern: Uni-modal, reliable, local rain shad-ows, 800- 1400mm
Southern: Uni-modal, reliable, 800- 1000m
Western: Bi-modal, 1000- 2000m
Northern: Dezember- April
Southwest-ern: Novem-ber- April
Western: October- December and Febru-ary-May
6. NORTHERN HIGHLANDS
Northern: foot of mt Kilimanjaro and Mt. Meru. Eastern Rift Valley to . Eyasi
Granite Mts Uluguru in Morogoro, Pare Mts in Kilimanja-ro and Usamba-ra Mts in Tanga, Tarime high-lands in Mara
Northern: Volcanic uplands, volcanic soils from lavas and ash. Deep fertile loams. Soils in dry areas prone to water erosion. Granite steep Mountain side to highland plateaux. Soils are deep, arable and moderately fertile on upper slopes, shallow and stony on steep slopes
Northern: 1000- 2500m
Granitic Mts: 1000- 2000m
Northern: Bi-modal, varies widely 1000- 2000mm
Granitic mts. Bimodal and very reliable 1000- 2000m
Northern: November- January and March-June
Granitic Mts. October- December and March- June
7. ALLUVIAL PLAINS
K-Kilombero (Morogoro)
R-Rufuji (Coast)
U-Usangu (Mbeya)
W-Wami (Morogoro)
K-Cental clay plain with alluvial fans east and west
R-Wide mangrove swamp delta, alluvial soils, sandy upstream, loamy down steam in floodplain
U-Seasonally Flooded clay soils in North, alluvial fans in South
W-Moderately alkaline black soils in East, alluvial fans with well drained black loam in West
K-Unimodal, very reliable, 900-1300mm
R-Unimodal, often inadequate 800-1200mm
U-Unimodal, 500- 800mm
W-Unimodal, 600- 1800mm
K-November-April
R- Decem-ber-April
U-December-March
W-December-March
Source: URT 2007e: 6

Biomass production and consumption patterns in Tanzania
Page 130
Main problems within agro-ecological zones
Table 37: Main problems within agro-ecological zones
AGROECOLOGICAL ZONE MAIN PROBLEM AREA: million ha
1. COAST: Tanga except Lushoto, Coast, DSM, East Lindi and Mtwara except Makonde Scarpment
• Infertile soils • Shifting cultivation • Bushfires • Deforestation • Water shortages • Soil erosion
6
2. ARID LANDS: Serengeti, Ngorongoro, Mkoma-zi, Pangani in Same, Eastern Dodoma
• Overgrazing • Unimodal and unreliable rainfall ranging from 400
to 600 mm/yr • Alkaline and saline soils in the Pangani river flood
plains • Soil erosion • Bushfires • Shifting cultivation • Deforestation • Water shortage
21.1
3. SEMI-ARID LANDS: Central Dodoma, Singida, North Iringa, some parts of Arusha, Shinyanga, Mwanza, Morogoro and except Kilombero, Wami basin, Uluguru Mts. Lindi and Southwest Mtwara
• Saline soils in eastern rift valley • Black cracking soils in Shinyanga • Infertile soils in Dodoma, Singida and Iringa • Unimodal and unrealible rainfall (500-600 mm/yr) • water shortage • Soil erosion • Poor farming practices • Shifting cultivation • Bushfires
4. PLATEAUX: Western Tabora, Rukwa, (North and Centre) Mbeya, North, Kig-oma and parts of Mara
• Deforestation • Bushfires • Uncontrolled grazing • Shifting cultivation • Soil erosion
32.7
5. SOUTHERN AND WESTERN HIGHLANDS: A broad ridge from Morogoro, North to Lake Nyasa covering parts of Morogoro, Iringa and Mbeya Ufipa Plateaux the shores of Lake Tanganyika in Kigama and Kagera
• Bushfires • Soil erosion • Uncontrolled grazing • Poor farming practices • Shifting cultivation • Deforestation • Poor mining practices
12.8
6. NORTHERN HIGHLANDS: Foot of Mt. Kilimanjaro and Me-ru, Eastern rift to Lake Eyasi, Uluguru mts in Morogoro, pare Ms, Granitic Mts in Tanga and Tarime
• Soils in dry areas are prone to water erosion • Poor farming practices • Deforestation • Bushfires • Shift cultivation
5.8
7. ALLUVIAL PAINS: Kilombero and Wami in Morogo-ro, Usangu in Mbeya, Rufiji in coast
• Overgrazing in the Usangu Plains • Poor farming systems • Bushfires • Deforestation
10.2

Final Better-iS Report of Wuppertal Institute
Page 131
Source: URT 1999: 20f
FAO Commodity Balance, crop primary equivalent, 1999 - 2009
Table 38: FAO Commodity Balance, crop primary equivalent, 1999 - 2009
Production quantity 1999 2000 2001 2002 2003 2004 2005 2006 2007 2008 2009
Alcoholic Beverag-es
202432
209108
226159
198705
136266
232725
243758
259154
309805
317625
275792
Cereals - Excluding Beer
377036
336251
424375
603627
373720
634000
498396
530136
585300
565569
525156
Fruits - Excluding Wine
191554
185246
203848
349220
315735
384695
332733
487431
427740
372719
453361
Oilcrops 67449 70047
88590
98011 101075
122812
126120
112934
118778
134152
134445
Pulses 80381 83974
82717
115925
109060
97736 94204
98484
101144
93838
108423
Starchy Roots 654325
615987
591442
728816
486226
668157
761334
822335
717993
745604
803550
Sugar & Sweeten-ers
14330 14730
16510
19945 24851
24106 31706
29323
30377
32559
30665
Sugarcrops 126890
135500
150000
175000
200000
200000
230000
245000
237000
237000
237000
Vegetable Oils 11525 12107
13231
12999 13666
16645 17735
15651
14310
14634
15319
Vegetables 119410
119342
120401
120468
139109
121303
112619
138386
152697
147361
173787
Export quantity 1999 2000 2001 2002 2003 2004 2005 2006 2007 2008 2009
Alcoholic Beverag-es
337 54 52 193 358 397 386 480 479 651 765
Cereals - Excluding Beer
4411 11165
13272
21035 35452
26011 13982
8553 32236
14134
7272
Fruits - Excluding Wine
125 331 357 295 367 308 297 327 475 706 495
Oilcrops 1251 1950 2288 3674 4095 4137 4616 3557 5771 7423 9987
Pulses 4086 1119 4884 5195 7659 5020 7287 4769 5195 12481
11304
Starchy Roots 35 777 841 116 252 178 487 342 1168 294 1885
Sugar & Sweeten-ers
2557 1567 4641 2512 2660 2605 2526 1802 6641 1107 734
Sugarcrops 10
Vegetable Oils 222 423 1539 559 329 402 649 1155 1839 3162 1380
Vegetables 774 356 846 1210 1933 900 801 678 2319 2925 1329
Import quantity 1999 2000 2001 2002 2003 2004 2005 2006 2007 2008 2009
Alcoholic Beverag-es
2739 940 784 683 624 804 1149 1357 1534 1843 2093
Cereals - Excluding Beer
26634 57708
64836
59025 79521
105661
65787
109100
94137
63601
101616
Fruits - Excluding Wine
633 431 512 615 750 770 1479 1836 2258 3932 3294
Oilcrops 260 606 890 726 1041 891 170 437 1641 3854 2864
Pulses 1111 869 2203 1455 998 1109 1995 1598 890 224 720

Biomass production and consumption patterns in Tanzania
Page 132
Starchy Roots 34 34 3795 835 29 53 40 83 110 740 2568
Sugar & Sweeten-ers
18541 14563
11887
9345 9310 10512 9710 11488
19978
8142 12010
Vegetable Oils 8365 14485
19527
17173 19793
18287 28137
47509
39282
24549
21852
Vegetables 388 217 714 702 838 966 812 910 662 559 533
Stock variation 1999 2000 2001 2002 2003 2004 2005 2006 2007 2008 2009
Alcoholic Beverag-es
15002 10002
10002
1 3 1
Cereals - Excluding Beer
52575 62403
1524 -10388
6
95497
-10995
7
49830
-7426 828 33988
27989
Fruits - Excluding Wine
50 200 200 -50000
50000
-4000
0
40000
Oilcrops -1001 -491 793 -7506 -3487 999 1298 1900 1853 1250 2900
Pulses -730 -170 30 -19180
-980 4460 1600 1150 12700
2650
Starchy Roots -1150
0
-10950
0
101000
20000 -4000
0
-4000
0
60000
20000
Sugar & Sweeten-ers
-3260 4347 2173 1630 1430 -1973 2173
Vegetable Oils 205 -620 -3459 1694 1638 1655 -156 -8196 3035 2878 2500
Vegetables 109 -151 -492 -61 799 - -12 12 -1 1 1
Domestic supply (Production+Import+Stock-Import) 1999 2000 2001 2002 2003 2004 2005 2006 2007 2008 2009
Alcoholic Bever-ages
219836 219996
236893
199196
136535
233133
244521
260030
310861
318817
277121
Cereals - Exclud-ing Beer
451834 445198
477464
537729
513286
603693
600031
623257
648029
649024
647488
Fruits - Excluding Wine
192112 185546
204203
299541
316117
385157
383915
448941
429523
415945
456160
Oilcrops 65457 68212
87986
87557 94534
120566
122972
111714
116501
131833
130222
Pulses 76676 83554
80066
93005 101419
98285 90512
96463
96839
94281
100488
Starchy Roots 654324 615244
582896
620035
587002
688032
720886
782075
776935
766050
804233
Sugar & Sweet-eners
27053 27725
28103
28951 33131
33444 38890
39010
41741
41768
41942
Sugarcrops 126890 135500
150000
175000
200000
200000
230000
245000
237000
236990
237000
Vegetable Oils 19872 25549
27759
31307 34768
36185 45066
53808
54788
38899
38291
Vegetables 119133 119051
119777
119899
138814
121370
112618
138632
151039
144996
172992
Source: FAOSTAT 2012 (Commodity Balance: Crop Primary Equivalent)

Final Better-iS Report of Wuppertal Institute
Page 133
FAO Commodity Balance, livestock and fish primary equivalent, 1999 - 2009
Domestic Supply 1999 2009
Animal Fats 17,777.00 40,276.00
Aquatic Products, Other 38,836.00 98,036.00
Eggs 37,100.00 33,319.00
Fish, Seafood 273,243.00 248,861.00
Meat 366,581.00 418,589.00
Milk - Excluding Butter 804,836.00 1,733,572.00
Offals 48,289.00 54,009.00
Export
Animal Fats 1.00 31.00 Aquatic Products, Other 4,023.00 10,450.00
Eggs 20.00 10.00
Fish, Seafood 36,846.00 99,968.00
Meat 326.00 528.00
Milk - Excluding Butter 136.00 382.00
Offals 0.00 40.00
Import
Animal Fats 4570.00 1415.00
Aquatic Products, Other 0.00 4.00
Eggs 445.00 379.00
Fish, Seafood 259.00 7029.00
Meat 667.00 2429.00
Milk - Excluding Butter 22772.00 23775.00
Offals 1.00 32.00
Production
Animal Fats 13208.00 38892.00
Aquatic Products, Other 42859.00 108482.00
Eggs 36675.00 32950.00
Fish, Seafood 310011.00 341800.00
Meat 366240.00 416687.00
Milk - Excluding Butter 782200.00 1710179.00
Offals 48288.00 54017.00
Source: FAOSTAT 2012

Biomass production and consumption patterns in Tanzania
Page 134
Existing policies targeting the forest, agriculture and energy sector with relevance to biofuels
Table 39 gives an overview of some important current policies in Tanzania which are relevant in the context of biomass production and consumption and biofuels develop-ments.
Table 39: Overview of current policies with relevance to Better-iS project (selection)
Policy Sector Goal Measures Kilimo Kwanza (Agricul-ture first) Issued 2009
Agricul-ture
To combat pov-erty through en-hanced agricul-tural productivity.
1. Political will to push agricultural transformation. 2. Enhanced financing for agriculture. 3. Institutional reorganization and management of
agriculture. 4. Paradigm shift to strategic agricultural produc-
tion. 5. Land availability for agriculture. 6. Incentives to stimulate investments in agricul-
ture. 7. Industrialization for agricultural transformation. 8. Science, technology and human resources to
support agricultural transformation. 9. Infrastructure Development to support agricul-
tural transformation. 10. Mobilization of Tanzanians to support and
participate in the implementation of KILIMO KWANZA
These measure include many different tasks, of which some with particular relevance to our re-search context are listed below: • Promote strategic production of priority crops:
- for food self sufficiency (maize, cassava, rice, legumes, fish, meat and dairy prod-ucts, wheat, bananas, potatoes, sorghum, millet)
- of crops that can transform agriculture, have growing market demand and employ-ment generation: cotton, sunflower, saf-flower, sesame, palm oil
- of labour intensive horticultural crops for foreign exchange earnings/economic growth: onions, mangoes, bananas, grapes, avocados, pineapples, tomatoes, vegeta-bles, spices
- of crops with high value addition potential such as bioenergy, fibres: sisal, sugarcane, oilseeds, sweet sorghum
• Analyse agricultural value chains, integrate pro-ducers and processors, expand agroprocessing • Improve land tenure, governance and manage-
ment, enforce land use planning, identify and valuate land for investments, promote joint ven-tures in land based investments

Final Better-iS Report of Wuppertal Institute
Page 135
• Increase production and utilization of fertilizers, improved seeds, agrochemicals (including train-ing), promote production of agricultural machin-ery and implements, build irrigation schemes • Enhance trade and exports, market information
centres for farmers National Energy Policy 2003
Energy To create condi-tions for provision of safe, reliable, efficient, cost-effective and envi-ronmentally ap-propriate energy services to all sectors on a sus-tainable basis.
• Improve access to efficient, environmentally friendly energy through substantial share of re-newable energy • Increase private investments into energy sector • Enhance efficiency in energy provision • Promote regional energy trading through inter-
connections
Petroleum Act 2008 Issued 2008
Energy Legislate importa-tion, exportation, transformation, transportation, storage, distribu-tion, wholesale trade and retail sale of petroleum, petroleum prod-ucts and related activities
• Includes biofuels, biodiesel and bioethanol in the list of regulated petroleum products • States that “The Minister may, in consultation
with the Minister responsible for food and the Minister responsible for land, make regulations prescribing the use of food crops and the use of land for production of biofuel.” (The Petroleum Act 2008, p.29)
Guide-lines for sustaina-ble liquid biofuels develop-ment in Tanzania Issued 2011
Energy Guide interested stakeholders s.a. local and foreign investors/ devel-opers; set out minimum re-quirements to ensure biofuels development does not com-promise sustaina-bility criteria (bio-diversity conser-vation, GHG re-duction, food se-curity, land use rights, social well-being)
• The guidelines are only targeted at investors and do not contain a national strategy; some im-portant aspect are listed below • Biofuels investments are administered through
TIC (Tanzania Investment Centre) • Investors have to conduct Environmental and
Social Impact Assessment • TIC may only allocate areas with existing land
use plan to biofuels investors to avoid threats to other land uses: maximum area 20,000 ha for max. 25 yrs. • Outgrower schemes or hybrid models (plantation
+ outgrowers) are encouraged; Locals shall be shareholders in business (cash or land assets) • Biofuel production is supposed to contribute to
local economy, social wellbeing of employees and local population, give priority in employment to local community • 5 % of land acquired for biofuels shall be used
for food crop production with state of the art techniques • By-products from farms, plantations, processing
plants shall be used for production of electricity, organic fertilizer, animal feed, biogas production • 2 % of revenues shall be used to improve social

Biomass production and consumption patterns in Tanzania
Page 136
services, economy and environment in project area • Processing of biofuels shall be done in Tanzania • Transportation, distribution, infrastructure and
waste management shall be developed by the investor
ASDP/S (Agricul-tural Sec-tor Devel-opment Program/ Strategy)
Agricul-ture
Increase agricul-tural growth to 5% per year to stimu-late economic growth, reduce poverty, increase food security
The program aims to provide support to the agri-cultural sector on the national and district level, with particular weight on implementation at the district and field level. Key features are: • Sustained agricultural growth through transfor-
mation from subsistence to commercial farming • Transformation led by the private sector through
improved enabling environment • Development facilitation through increased pub-
lic/private partnerships and contract farming • Participatory planning and implementation
through District Agricultural Development Plans • Decentralization of service delivery responsibili-
ties • Mainstreaming of cross-cutting and cross-
sectoral issues, s.a. rural infrastructure, health, gender, education, environmental management etc.
The desired results are: • Enable farmers to have better access to and use
of agricultural knowledge, technologies, market-ing systems and infrastructure, to achieve higher productivity, profitability, and farm incomes • Promote private investment based on an im-
proved regulatory and policy environment. Source: Kilimo Kwanza 2009, MEM 2008, 2010, URT 2006c, MEM 2010b

Final Better-iS Report of Wuppertal Institute
Page 137
Value chain approach
Value chains combine key driving forces for ecological change, however, as the con-tinued destruction of key ecosystem services indicates, in many cases their develop-ment does not take negative effects on ecological systems into account. Consequently, methods and tools are needed to support decision makers in value chains to avoid and reduce negative impacts on environmental and social systems. Especially in Tanzania, where the main domestic energy resource is wood fuel, it is interesting to evaluate the opportunities and problems of biomass production and consumption and interlinkages in the chains. Therefore the research examines the existing biomass production and consumption patterns at national and regional level and focus on current implications and developments of the biofuel market.
In general, the value chain can be characterized as any activity necessary to get a product or service throughout different phases, from resource extraction, production and manufacturing, to consumption and finally disposal after use. Beside physical ma-terial flows, which can be assessed by material flow accounting or environmental life cycle assessments, the value chain perspective also includes other aspects such as information and monetary flows, power between actors involved as well as their posi-tion within socio-economic structures (e.g. judicial or cultural framework conditions). (see von Geibler et al. 2010)
The value chain approach not only involves the process-interlinked material and infor-mation flows as well as their spatial distribution, but also relationships between chain actors related to control and power. Those essentially influence the decision-making process.
Chain actors that exert a leading and coordinating position within the chain and are able to set parameters in the entire chain are called lead agents or lead firms. They have the capability to control and coordinate other parts of the value chain, which can also be shared between two or more actors.
Lead agents are an important driving force of methodological developments to influ-ence production and consumption systems as well as the ecological effects related to them. To improve product performance and to gain competitive advantages, lead ac-tors need to gain an improved understanding of the value chain and its broader sus-tainability impacts.
In the increasingly globalised economy, the growth and international dimension of pro-duction and consumption patterns form specific challenges for regulation. Within com-plex global production systems, single national states experience difficulties in manag-ing resource use across national borders: (inter-)governmental efforts are needed to stop unsustainable use of natural resources. Complementarily, the power of single val-ue chain actors can support initiatives to manage key sustainability challenges.

Biomass production and consumption patterns in Tanzania
Page 138
Figure 41: The value chain “construction and refurbishment with wood”
Source: adopted from von Geibler, 2007

Final Better-iS Report of Wuppertal Institute
Appendix B: Scientific summary reports
The following two papers reflect scientific summaries in the topics biofuel certification (and relevant sustainability indicators) and sustainability perspectives on woody bio-mass production and consumption patterns in Tanzania.
1) Geibler, J.v. & Bienge, K.: „Success factors for standards and certification schemes for biofuels: “Sustainable palm oil” from a small-scale farmer and de-velopment perspective“ presented at IFSA Workshop 3.3: Sustainable biofuel production in developing countries: "Green" energy as the key for develop-ment?, at 9th European IFSA Symposium, 4-7 July 2010 in Vienna, Austria, pp. 1511-1520
2) Bienge, K, Kennedy, K. von Geibler, J. (submitted): Sustainability perspectives on woody biomass production and consumption patterns in Tanzania, in: Spe-cial Issue in Regional Environmental Change “Bioenergy and Climate Change in the light of Food Security in Tanzania: Methods, Tools and Applications”

Final Better-iS Report of Wuppertal Institute
Appendix C: Educational summary report


![MURDOCH RESEARCH REPOSITORY...consumption [3]. Biomass and petroleum fuels accounted for 64% and 27% respectively of final energy consumption. About 65% of the country’s electricity](https://img.pdfslide.net/doc/110x75/5fafba368ab46f476b783a14/murdoch-research-repository-consumption-3-biomass-and-petroleum-fuels-accounted.jpg)