Embed Size (px)
Citation preview

Arnold Schwarzenegger Governor
BIOMASS RESOURCE ASSESSMENT IN CALIFORNIA
IN SUPPORT OF THE 2005 INTEGRATED ENERGY POLICY REPORT
Prepared for:
California Energy Commission Public Interest Energy Research Program
Prepared by: California Biomass Collaborative
D
RA
FT C
ON
SULT
AN
T R
EPO
RT
APRIL 2005
CEC-500-2005-066-D

ii
Prepared by: California Biomass Collaborative
Department of Biological and Agricultural Engineering 1 Shields Avenue University of California Davis, CA 95616 Bryan M. Jenkins, Executive Director Davis, California Contract No. 500-01-016 Prepared for:
California Energy Commission Public Interest Energy Research (PIER) Program
Valentino Tiangco Project Manager George Simons PIER Renewables Program Manager Ron Kukulka Acting Deputy Director ENERGY RESEARCH AND DEVELOPMENT
DIVISION Scott W. Matthews Acting Executive Director
DISCLAIMER This report was prepared as the result of work sponsored by the
California Energy Commission. It does not necessarily represent the views of the Energy Commission, its employees or the State of California. The Energy Commission, the State of California, its employees, contractors and subcontractors make no warrant, express or implied, and assume no legal liability for the information in this report; nor does any party represent that the uses of this information will not infringe upon privately owned rights. This report has not been approved or disapproved by the California Energy Commission nor has the California Energy Commission passed upon the accuracy or adequacy of the information in this report.

iii
Contributors
California Biomass Collaborative Staff Rizaldo E. Aldas Martha Gildart Gary C. Matteson Hugo I. von Bernath Robert B. Williams Limei Yan Peilin Yang Bryan M. Jenkins California Energy Commission Zhiqin Zhang Valentino Tiangco
Prab Sethi George Simons
California Department of Forestry and Fire Protection Mark Rosenberg James Spero Lian Duan

iv
1. Executive Summary1 This report provides an update to the previous biomass resource assessment published in February, 2004.2 This update incorporates new information developed by the California Department of Forestry and Fire Protection on gross and technically available forest resources including logging slash, in-forest thinning, mill residue, and shrubland biomass.3 The update also includes projections to 2005 of agricultural and municipal waste resources from 2002 and 2003 base year data included in the previous assessment. Agricultural biomass projections are based on population and historical production trends. Municipal waste projections are based largely on population trends. Specific details concerning the methodology used are available in the database.4
Biomass Resources in California The state’s biomass resource is large and diverse. The gross annual resource in 2005 is estimated at more than 86 million bone dry tons (BDT),5 and estimates suggest that of this, 34 million BDT per year are available for use on a sustainable basis.6 This latter value is a preliminary estimate based on technical and ecosystem limitations in resource acquisition and does not strictly define the fraction of biomass that is economically feasible to use. Of the gross annual resource, 25% is from agriculture, 31% from forestry, and 44% from municipal solid wastes. Supplementing the in-state biomass production is imported biomass in packaging and other materials accounted for in the waste stream. Landfill gas production exceeds 118 billion cubic feet per year (BCF/y) from more than 1 billion tons of waste in-place, with a potential recovery of 79 billion BCF/y. Biogas from waste-water treatment plants adds 16 - 18 BCF/y. Dedicated energy crops are not grown to any significant extent in the state presently, but might be produced in the future, particularly in association with reclamation of drainage and other impaired agricultural lands in the San Joaquin Valley. Dedicated crop production is not included in this 2005 resource update. By 2017, gross annual biomass production might approach 100 million BDT, with about 40 million BDT potentially available for use.
1 This report is based on an analysis conducted by the California Biomass Collaborative and contained in: California Biomass Collaborative, Biomass in California: challenges, opportunities, and potentials for sustainable management and development, PIER Collaborative Report, California Energy Commission, Sacramento, CA, April, 2005. 2 California Biomass Collaborative. 2004. An Assessment of biomass resources in California. PIER Consultant Report, California Energy Commission, Sacramento, CA, February 2004, http://biomass.ucdavis.edu. 3 California Department of Forestry and Fire Protection, Biomass potentials from California forest and shrublands including fuel reduction potentials to lessen wildfire threat, Draft PIER Consultant Report, Contract 500-04-004, February 2005. 4 available from http://faculty.engineering.ucdavis.edu/jenkins/CBC/UpdateFiles/ResourceUpdate.html 5 The bone dry ton is a standard industry designation for a ton of material at nominal zero moisture content. 6 The previous assessment for 2003 estimated 71 million gross and 26 million technically available BDT/y. Increases in estimated forest biomass account for most of the difference.

v
Potential power generation from biomass The gross biomass resource in the state, were it all to be used for power generation, would be sufficient to generate in excess of 10,700 MWe of electricity using current thermal and biological conversion technologies. About 2,100 MWe of this could come from agricultural biomass, 3,600 MWe from forestry, and 5,000 MWe from municipal wastes including landfill and sewage digester gas. Not all of the resource can, should, or will be used for power, and the technical potential is estimated to be substantially less at close to 4,700 MWe, sufficient to generate 35,000 GWh of electrical energy or roughly 12% of the current statewide demand of 283,000 GWh. With improved conversion efficiencies and growth in municipal, dedicated crop, and some agricultural resources, the state’s annual biomass production might be sufficient to support a potential incremental generation of 7,100 MWe by 2017. Without improving generating efficiencies, incremental potential in 2017 would be closer to 4,800 MWe. Electrical energy contributions could reach 60,000 GWh by 2017 or 18% of projected statewide consumption of 334,000 GWh, although generation is unlikely to reach this level without significant additional development support and clear market signals, such as long term contracting opportunities. These projections are therefore likely optimistic.
Biofuels and Bioproducts Other markets for biomass include transportation fuels and biobased products such as polymers, plastics, cleaners, solvents, lubricants, coatings, inks, agricultural chemicals, pesticides, insulation and construction composites, and other specialty applications. Biomass technologies will be applied across a range of scales from small distributed systems to large centralized facilities. Integration of production activities will lead to economic advantages. Federal emphasis on biorefinery development is intended to provide economic platforms for the production of a variety of higher value products and energy. Ethanol and biodiesel are produced commercially, although ethanol from cellulosic biomass is still developmental, and both biofuels benefit from federal subsidies intended to compensate for cost differentials compared with petroleum. Biogas and biomethane from anaerobic digestion systems can also serve as transportation fuels in addition to the current primary use in stationary power generation. Biomass can be used to produce hydrogen, and Fischer-Tropsch liquids produced by gasification can substitute for gasoline and diesel fuels, although commercial development has not yet occurred for biomass. Near-term energy production will deploy more conventional technologies and use starch, sugar, and oil crops for any substantive increase in liquid transportation fuels from biomass. The high value and environmental and energy security benefits encourage continued research and development. The production costs of all these fuels are presently higher than the direct production costs of fossil fuels, but as the market prices of the latter escalate, biomass conversion technologies improve, and externalities are addressed through policy (for example, renewable energy and carbon trading markets), biofuels will become more competitive. A more comprehensive assessment of potential quantities of biofuels from biomass in California has not yet been completed and so is not addressed here.
vi
Table of Contents 1. Executive Summary .................................................................................................. iv
Biomass Resources in California................................................................................ iv Potential power generation from biomass ................................................................... v Biofuels and Bioproducts ............................................................................................ v
List of Tables................................................................................................................ vii List of Figures..............................................................................................................viii 2. Biomass Resources in California................................................................................ 1
Agriculture.................................................................................................................. 4 Forestry .................................................................................................................... 10 Municipal wastes ...................................................................................................... 17 Dedicated biomass crops........................................................................................... 21 Future California biomass resource projections........................................................ 23
3. Potential Expansion of Electric Power Generation from Biomass ............................. 26 Potential generating capacity.................................................................................... 26 Cost of electricity from biomass ................................................................................ 31
4. Potential Development of Fuels and Products from Biomass .................................... 37 Ethanol ..................................................................................................................... 37 Biodiesel ................................................................................................................... 38 Biogas and biomethane ............................................................................................. 39 Fischer-Tropsch liquids ............................................................................................ 39 Hydrogen and Methanol............................................................................................ 40 Biobased products..................................................................................................... 40
5. Costs of Biomass Acquisition and Resource Supply ................................................. 41 Biomass acquisition costs.......................................................................................... 41 Impact of fuel cost on cost of energy.......................................................................... 43 Cumulative resource supply costs.............................................................................. 44
Appendix ...................................................................................................................... 46

vii
List of Tables Table 1. Estimates of annually available biomass in California, 2005............................. 2 Table 2. Estimated electricity generating potential from biomass in California, 2005
resource base. ........................................................................................................ 28 Table 3. Estimated costs of renewable electricity.......................................................... 35

viii
List of Figures Figure 1. Estimated gross biomass (BDT/y) by county in California, 2005..................... 3 Figure 2a. Estimated total agricultural biomass (gross BDT/y) in California, 2005. ........ 5 Figure 2b. Estimated orchard and vineyard biomass (gross BDT/y) in California, 2005.. 6 Figure 2c. Estimated field and seed crop biomass (gross BDT/y) in California, 2005 ..... 7 Figure 2d. Estimated vegetable crop biomass (gross BDT/y) in California, 2005............ 8 Figure 2e. Estimated total cattle manure (gross BDT/y) in California, 2005. .................. 9 Figure 3a. Estimated total forest biomass (gross BDT/y) in California, 2005. ............... 12 Figure 3b. Estimated logging slash (gross BDT/y) in California, 2005. ........................ 13 Figure 3c. Estimated forest thinning biomass (gross BDT/y) in California, 2005. ......... 14 Figure 3d. Estimated mill residue (gross BDT/y) in California, 2005............................ 15 Figure 3e. Estimated shrubland biomass (gross BDT/y) in California, 2005. ................ 16 Figure 4. Volume of timber harvest (billion board feet) on public and private lands in
California, 1978 – 2002......................................................................................... 17 Figure 5a. Estimated biomass (gross BDT/y) in landfilled MSW, 2005. ....................... 19 Figure 5b. Estimated biomass (gross BDT/y) in MSW diverted from landfill, 2005...... 20 Figure 6. Growth projections for biomass in California through 2017........................... 23 Figure 7. Projected waste disposal and methane generation from landfills, 2003-2017 . 24 Figure 8. Projected waste disposal and methane generation from landfills, 2003-2017,
assuming five percent per year reduction in per-capita waste disposal rates ........... 25 Figure 9. Projected waste disposal and methane generation from bioreactor landfills ... 25 Figure 10. Projected potential electric generating capacity from biomass. .................... 27 Figure 11. Projected annual biomass capacity additions (MWe/y) and generating capacity
(MWe) under existing RPS .................................................................................... 30 Figure 12. Annual biomass capacity additions (MWe/y) and generating capacity (MWe)
under an accelerated RPS ...................................................................................... 30 Figure 13. Levelized cost of energy (COE, $/kWh in constant 2004 dollars) for
electricity from biomass ........................................................................................ 32 Figure 14. Sensitivity of COE (2004 constant $/kWh).................................................. 32 Figure 15. Sensitivity of COE (2004 constant $/kWh) for tipping fees charged on waste
disposal ................................................................................................................. 34 Figure 16. Impact of heat price on the revenue requirements for electricity (COE, 2004
constant dollars) .................................................................................................... 36 Figure 17. Impact of conversion efficiency on the fuel cost contribution to cost of
electricity (COE) from biomass. ............................................................................ 43 Figure 18. Estimated overall statewide biomass resource cost curve, 2005 technical
resource base......................................................................................................... 44 Figure 19. In-forest thinnings biomass resource cost curve for a single site location in
California. ............................................................................................................. 45 Figure 20. Cumulative estimated least-cost statewide feedstock costs, 2005 technical
resource base. ........................................................................................................ 45 Figure A1. California counties. .................................................................................... 46

1
2. Biomass Resources in California The state’s biomass resource is large and diverse. The full extent to which it can be managed for the production of energy and products remains speculative, however, due to uncertainties concerning the gross magnitude of the resource, the quantity that can be used on a sustainable basis, and the costs of producing, acquiring, and converting the large number of biomass feedstocks available and those that will emerge in the future. The principal sources of biomass in California are agriculture, forestry, and municipal wastes. All three of these sources provide biomass as residues of other operations and activities. In addition to the primary commodities already produced, agriculture and forestry can also expand or shift into production of biomass commodities for new energy and biobased product development. The total or gross estimated statewide resource as of 2003 amounts to 86 million dry tons7 (Table 1), although the uncertainty of this estimate may be 10% or more. Biomass is a distributed resource with development opportunities across the entire state (Figure 1). The most concentrated sources are those associated with municipal waste collection and disposal, confined animal feeding operations (CAFO), food and agricultural processing, and forest products manufacturing. Not all of the biomass produced in the state can or should be used for industrial purposes. For example, not all agricultural crop or forest management residue should be harvested where it is needed to maintain soil fertility and tilth or for erosion control. Similarly, terrain limitations, environmental and ecosystem requirements, collection inefficiencies, and a number of other technical and social constraints limit the amount of biomass that can actually be used. For these reasons, amounts that can technically be supplied to utilization activities are substantially less than gross production (Table 1). Additional economic constraints further limit development. The latter are site specific and require detailed analyses for any proposed project. The combination of economies of scale for capital equipment, increasing feedstock acquisition cost as production capacity increases, and other effects often leads to an optimal facility size.8 Development of biomass power systems will for this reason occur over a wide capacity range from a few kilowatts to multi-megawatt units depending on location, resource availability, transportation and other infrastructure, conversion process, regulatory conditions, product, and market. Biofuels and bioproducts manufacturing will likewise develop over a wide range of sizes and capacity.
7 The value is higher than the 71 million dry tons estimated from 2002 data due to a reassessment of forest biomass by the California Department of Forestry and Fire Protection. The value is subject to further change as agricultural and municipal waste resource estimates are further updated. 8 Jenkins, B.M. 1997. A comment on the optimal sizing of a biomass utilization facility under constant and variable cost scaling. Biomass and Bioenergy 13(1/2):1-9.

2
Table 1. Estimates of annually available biomass in California, 2005. (Million dry tons/year except as noted) Gross(4) Technical(4)
Total Biomass 86.0 33.6
Possible Use by Thermal Conversion 69.3 28.9
Possible Use by Biochemical Conversion 16.7 4.6
Total Agricultural 21.6 9.6
Total Animal Manure 11.8 4.5
Total Cattle Manure 8.3 3.0
Milk Cow Manure 3.8 1.9
Total Orchard and Vine 2.6 1.8
Total Field and Seed 4.9 2.4
Total Vegetable 1.2 0.1
Total Food Processing 1.0 0.8
Total Forestry 26.8 14.3
Mill Residue 6.2 3.3
Forest Thinnings 7.7 4.1
Logging Slash 8.0 4.3
Chaparral 4.9 2.6
Total Municipal 37.6 9.7
Biosolids Landfilled 0.1 (2)
Biosolids Diverted 0.6 0.5
Total MSW Biomass Landfilled 18.5 (2)
Total MSW Biomass Diverted 18.4 9.2
Landfill gas 118 BCF/y (1) 79 BCF/y
Biogas from waste-water treatment plants (WWTP) 16 BCF/y(3) 11 BCF/y (1) Total landfill gas potential is 118 billion cubic feet per year (BCF/y) for an assumed composition of 50% methane from waste already in place. Diversion of MSW shown as landfilled will reduce future landfill gas potential. (2) assumed landfilled, resource available as landfill gas. (3)billion cubic feet per year of biogas (60% methane). (4)Gross resource refers to total estimated annual biomass produced. Technical resource refers to the amount that can potentially be supplied to utilization activities (see text).

3
Figure 1. Estimated gross biomass (BDT/y) by county in California, 2005. Shading indicates relative quantity in each county, increasing from light to dark.9
9 see Appendix for names of counties.

4
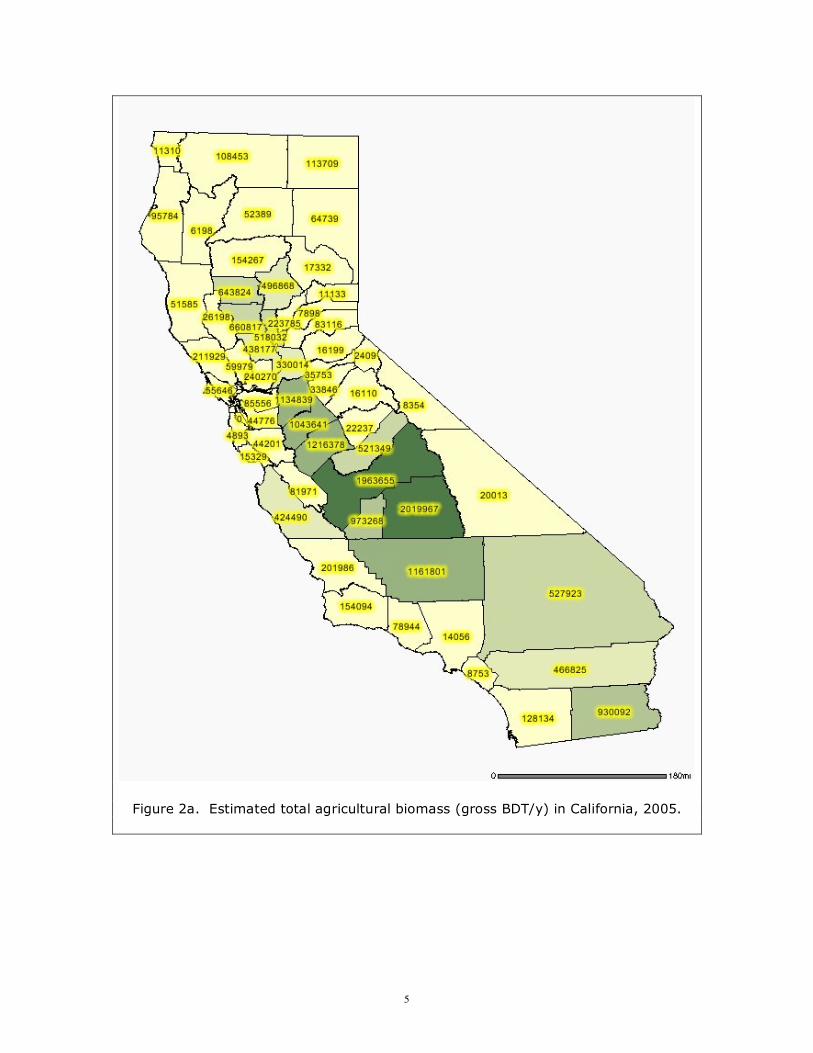
Agriculture California’s agriculture generates products worth more than $27 billion from 350 different crops.10 Five categories comprise the majority of agricultural biomass: orchard and vineyard prunings and removals, field and seed crop residues, vegetable crop residues, animal manures, and food processing wastes. Agricultural biomass is distributed throughout the state, but most heavily concentrated in the Central Valley (Figure 2a).
• Approximately 2.6 million tons per year (all values are reported on a dry basis) of woody biomass are produced annually as prunings and tree and vine removals from orchards and vineyards (Table 1, Figure 2b). Close to 1 million tons per year are currently used as fuel in direct combustion power plants, generally blended with other fuels such as urban wood and forest materials.
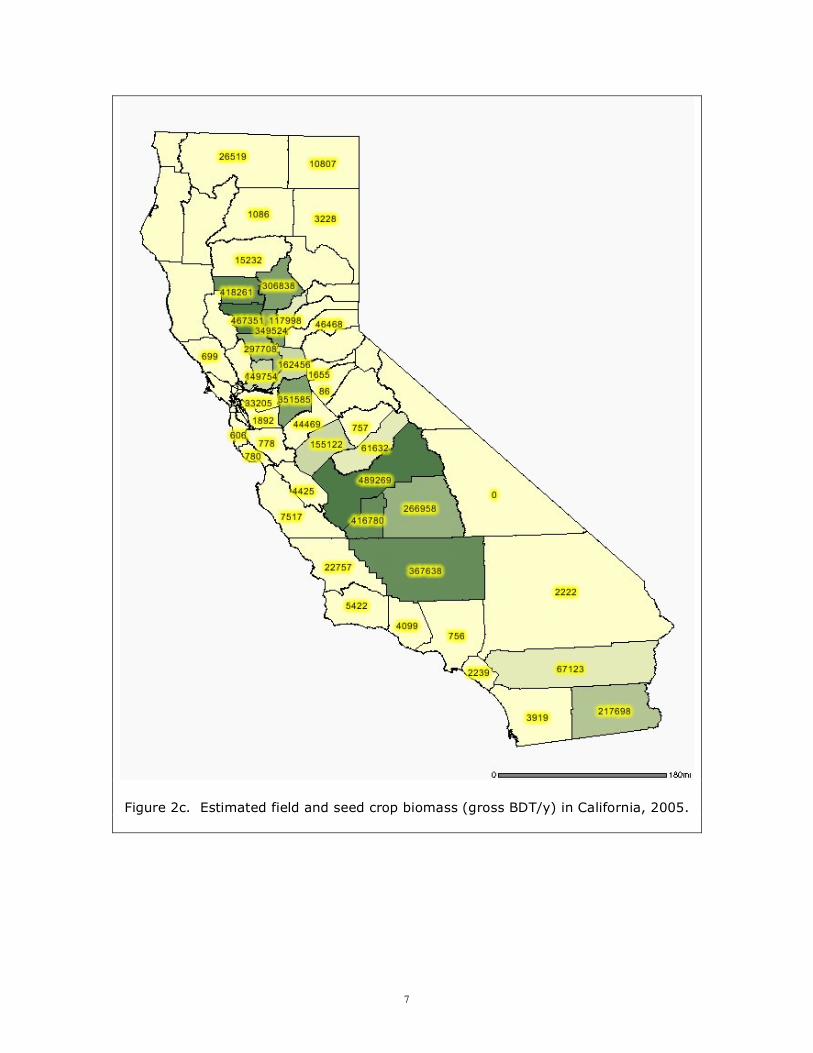
• California produces about 5 million tons per year of field crop residues, principally as cereal straws and corn stover (Figure 2c). These materials are not currently used for power generation due to problems with ash slagging and fouling in combustion systems. Other conversion approaches are developing.
• Statewide production of vegetable crop residues (Figure 2d) amounts to 1.2 million tons per year but these are not generally considered for off-field utilization and are commonly incorporated into the soil.
• The agricultural animal population in the state is close to 280 million including 230 million broiler chickens. Total cattle population exceeds 5 million, with 1.7 million milking cows, 740,000 beef cows, and 2.8 million other cows including heifers and non-lactating dairy cows. Total manure production from animals is close to 12 million tons per year, with 8 million tons per year from cattle (Figure 2e) and nearly half of that from milking cows in dairies. The Dairy Power Production Program is currently supporting efforts to use manure from approximately 33,000 milk cows.
• Food processing operations in the state produce a variety of biomass feedstocks including nut shells, fruit pits, rice hulls, cotton gin trash, meat processing residues, grape and tomato pomace, beet residue, cheese whey, beverage wastes, and waste water streams containing sugars and other degradable materials. Cheese whey and waste sugars are responsible for the current in-state ethanol production of 9 million gallons per year.11 Dry matter production is in excess of 1 million tons per year.12, 13 A number of food processing residues are already used for power generation. At least 250,000 tons per year are presently used for power generation, mainly from rice hulls and shells and pits.
10 California Department of Food and Agriculture Resource Directory, 2002, http://www.cdfa.ca.gov/card/card_new02.htm 11 MacDonald, T., G. Yowell, M. McCormack, M. Bouvier. 2003. Ethanol supply outlook for California. CEC 600-03-017F, California Energy Commission, Sacramento, CA. 12 California Biomass Collaborative. 2004. An Assessment of Biomass Resources in California. PIER Consultant Report, California Energy Commission, Sacramento, CA. 13 Matteson, G.C. 2005. Biomass resource assessment—food residues. Draft report, California Biomass Collaborative, University of California, Davis, CA.
5
Figure 2a. Estimated total agricultural biomass (gross BDT/y) in California, 2005.

6
Figure 2b. Estimated orchard and vineyard biomass (gross BDT/y) in California, 2005.
7
Figure 2c. Estimated field and seed crop biomass (gross BDT/y) in California, 2005.

8
Figure 2d. Estimated vegetable crop biomass (gross BDT/y) in California, 2005.

9
Figure 2e. Estimated total cattle manure (gross BDT/y) in California, 2005.

10
Forestry There are 40 million acres of forest lands in the state with an average standing tree biomass of 71 tons/acre.14 Of the total acreage, 46% is national forest. Other public forests constitute 12% while forest industry and other private forests make up 42%. Trees 10 inches in diameter and less account for 88% of the total number of trees but only 15% of the total wood volume. Gross non-merchantable standing forest and shrub biomass is currently estimated at 1.3 billion BDT.15 The four main categories of forestry biomass are logging slash, biomass from forest thinning (stand improvement and fuels reductions operations), mill residues, and shrub or chaparral (Figure 3a).16 Forest biomass resources were estimated as part of a recent fuels supply assessment by the California Department of Forestry and Fire Protection (CDFFP).17 Sawmill residues were estimated using a residue factor of 1.43 BDT/MBF18 developed from year 2003 timber harvest and residue production data.19
• Logging slash (Figure 3b) comprises branches, tops, and other materials removed from trees during timber harvest. Slash excludes the tree stem or “bole,” defined as from a one-foot stump to a four inch diameter top. Because the volume of slash is directly proportional to logging activity, slash has declined considerably in the state in recent years (Figure 4). Slash left on the ground after harvest can be a substantial source of surface fuels which can carry wildfire.
• Forest thinnings (Figure 3c) are non-merchantable components extracted during harvest activities and include understory brush, small diameter tree boles, and other material transported to the mill that cannot produce sawlogs. Thinning refers to silvicultural treatments designed to reduce crowding and enhance overall forest health and fire resistance. Thinning of forest and shrub lands by mechanical means (other than by prescribed fire) is often emphasized when the intent is to reduce the threat of catastrophic wildfire near houses or other vulnerable assets and where air quality is a concern. Thinning may or may not produce merchantable saw logs (close to half of which may end up as mill waste). The issue of mechanically thinning forests has been and remains controversial, but thinning is likely to increase, particularly in wildland-urban interface areas, due to
14 Shih, T.T. 2004. How much small wood do we have in California? Conference presentation, Smallwood 2004: Creating Solutions for Using Small Trees, Sacramento, CA, May 18-21, 2004. 15 California Department of Forestry and Fire Protection, Biomass potentials from California forest and shrublands including fuel reduction potentials to lessen wildfire threat, Draft PIER Consultant Report, Contract 500-04-004, February 2005. 16 Category definitions are adapted in part from California Biomass Collaborative, An assessment of biomass resources in California, PIER Consultant Report, California Energy Commission, Sacramento, CA, February 2004, and California Department of Forestry and Fire Protection, Biomass potentials from California forest and shrublands including fuel reduction potentials to lessen wildfire threat, Draft PIER Consultant Report, Contract 500-04-004, February 2005. 17 California Department of Forestry and Fire Protection, February 2005, op cit. 18 MBF = thousand board feet. 19 Yang, P. and B.M. Jenkins. 2005. Wood residue generation from sawmills in California. Draft report, California Biomass Collaborative, University of California, Davis, CA.
11
new federal legislation20 and increasing public concerns over the risk from wildfire. Estimates of the technical availability exclude forest reserves, stream management zones, coastal protection zones, coastal sage scrub habitats, national forest lands with slopes steeper than 35%, and private and other public forest lands with slopes steeper than 30%.
• Sawmill residues (Figure 3d) are a byproduct of the milling of sawlogs that consist generally of softwood tree boles with a diameter at breast height (dbh) of about ten inches. Sawmill and other forest products manufacturing operations generate a variety of wood residues including bark, sawdust, planer shavings, and trim ends. Resource quantities follow logging activity although imports and exports can also affect mill activity. Mill residue represents about half of saw log weight. A large fraction of this material is technically available for use, and about 1.3 million dry tons are already in use for power generation in the state21 with additional amounts used for landscape and other products. Much of the power generated is used on-site at the mill and is not exported to the grid.
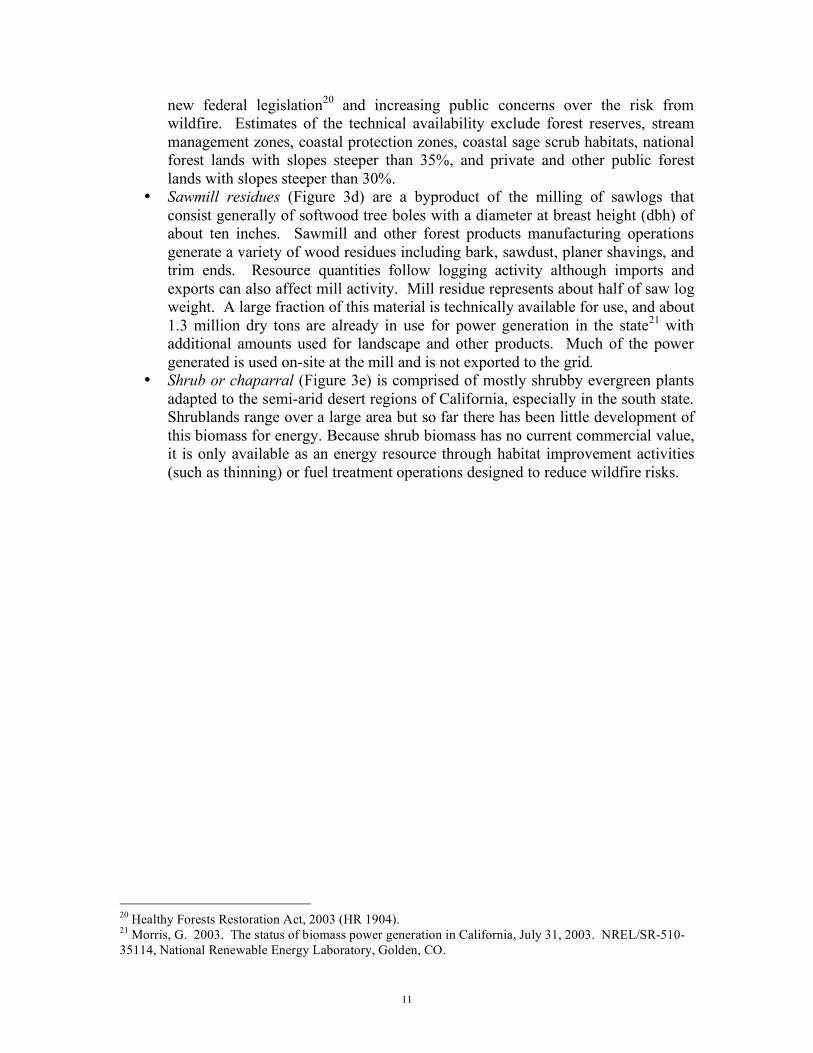
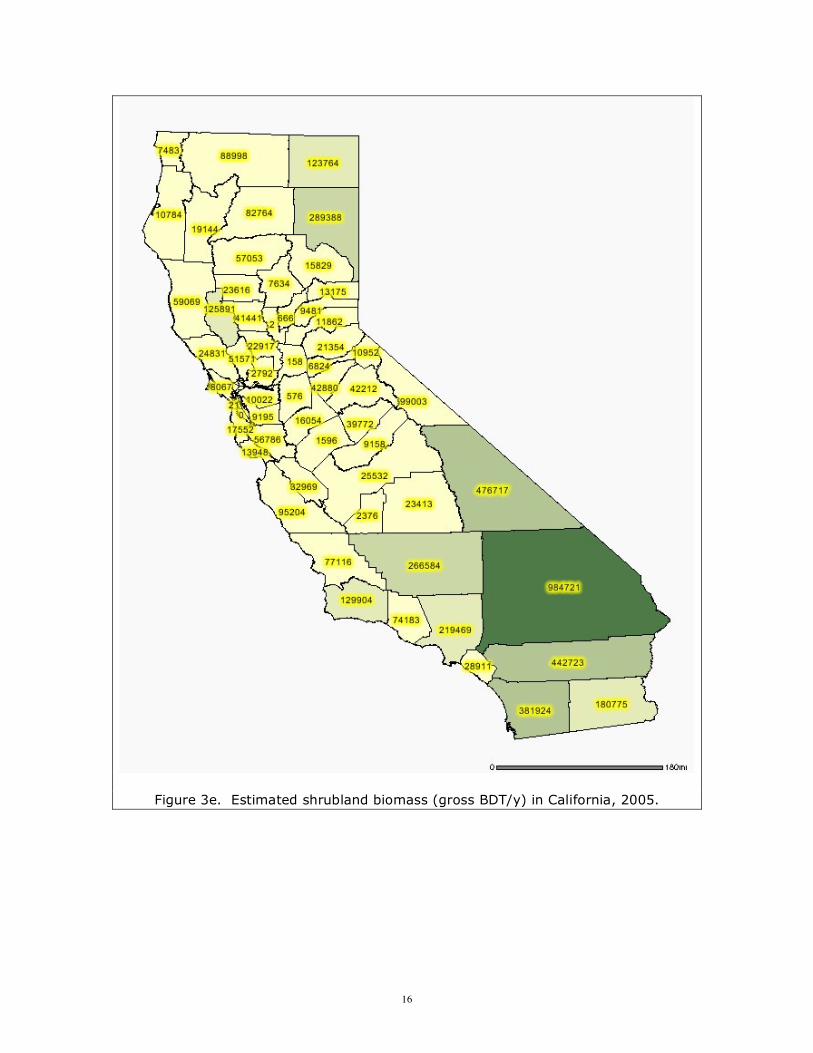
• Shrub or chaparral (Figure 3e) is comprised of mostly shrubby evergreen plants adapted to the semi-arid desert regions of California, especially in the south state. Shrublands range over a large area but so far there has been little development of this biomass for energy. Because shrub biomass has no current commercial value, it is only available as an energy resource through habitat improvement activities (such as thinning) or fuel treatment operations designed to reduce wildfire risks.
20 Healthy Forests Restoration Act, 2003 (HR 1904). 21 Morris, G. 2003. The status of biomass power generation in California, July 31, 2003. NREL/SR-510-35114, National Renewable Energy Laboratory, Golden, CO.

12
Figure 3a. Estimated total forest biomass (gross BDT/y) in California, 2005.

13
Figure 3b. Estimated logging slash (gross BDT/y) in California, 2005.

14
Figure 3c. Estimated forest thinning biomass (gross BDT/y) in California, 2005.

15
Figure 3d. Estimated mill residue (gross BDT/y) in California, 2005.
16
Figure 3e. Estimated shrubland biomass (gross BDT/y) in California, 2005.

17
0
1
2
3
4
5
1978 1982 1986 1990 1994 1998 2002
Year
Bil
lio
n B
oa
rd
Fe
et
Public Private Total
Figure 4. Volume of timber harvest (billion board feet) on public and private lands in
California, 1978 – 2002.22
Municipal wastes Californians produce more than two tons of municipal wastes per person per year. Municipal wastes, also referred to as post-consumer residues, include municipal solid wastes (MSW), municipal waste-water or sewage, and biosolids from waste-water treatment. Landfill gas generated from waste disposed in landfills and biogas from waste-water treatment are also included within this category.
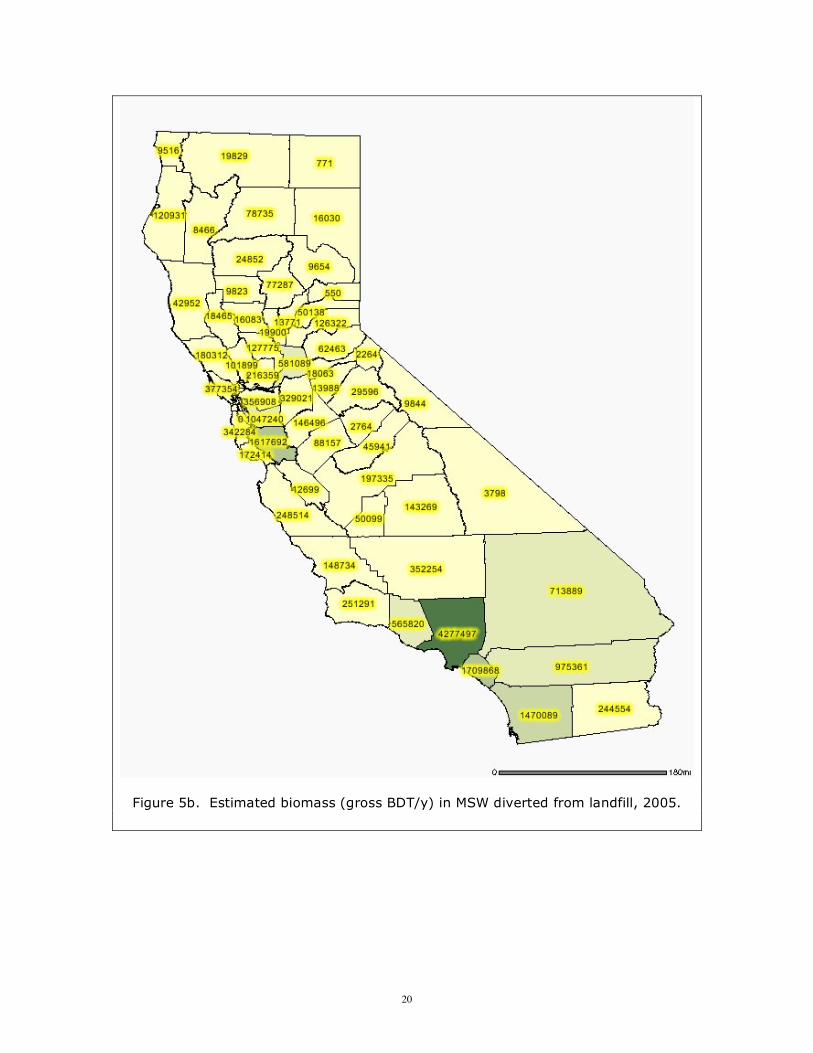
• MSW is the single largest resource for biomass in the state. The biomass component of MSW totals 38 million dry tons per year including construction and demolition wood residue, paper and cardboard, grass, landscape tree removals, other green waste, food waste, and other organics, but not plastics and tires although some fraction of these may be from biomass. The generation rate is roughly 1 dry ton of biomass in MSW per person per year in the state. The 1989 Integrated Waste Management Act (AB 939) mandated that local jurisdictions divert at least 50% of generated wastes from landfill by 2000. Currently the state is just under this fraction. Remaining wastes are disposed in landfills and three mass-burn incineration facilities. Diverted wastes are used for compost, alternative daily cover (although this also contributes to landfill), recycling, and
22 California Department of Forestry and Fire Protection, The Changing California, Forest and Range 2003 Assessment, October 2003. http://www.frap.cdf.ca.gov/assessment2003/Assessment_Summary/assessment_summary.html

18
energy. About 1.5 million dry tons per year of clean construction wood separated from the waste stream (referred to as urban woody biomass or urban wood fuel) is diverted to biomass direct combustion power plants.23 Demolition residues are not permitted due to contamination from painted wood.
• There are more than 3,000 waste disposal sites in the state, most of them now closed to further disposal but more than 230 are actively receiving waste. Total waste in-place exceeds 1 billion tons.24 The biomass portion of waste placed in landfills decomposes over time, albeit very slowly in conventional dry-tomb type landfills. The anaerobic conditions that largely prevail within the landfill result in the production of a methane-rich landfill gas that can be used for energy or chemical processing. The total landfill gas generation from more than 300 major landfills is estimated at between 118 and 156 billion cubic feet per year (BCF/y) for a methane concentration of 50%. The methane equivalent is 59 to 78 BCF/y. By comparison, natural gas consumption in the state is 6 BCF per day or 2,200 BCF/y. In the proper concentrations, methane is explosive in air. Methane is also a greenhouse gas having a global warming potential 21 times that of carbon dioxide. Emissions from landfills need to be controlled both for safety and environmental reasons. Landfill gas is already used for heat and power generation as well as being upgraded to pipeline quality. Landfill gas is also being used as transportation fuel. Even if the state acts to radically reduce future waste disposal, landfill gas will continue for decades to be produced from the waste disposed in previous years. Bioreactor landfills employing leachate recirculation and membrane covers have the potential to increase the rate of gas generation, as do high-rate in-vessel digesters. Proper design may allow storage of gas within the landfill to increase power generation capacity during peak electricity use hours. Gas storage can also be added to other digester systems to increase peaking capacity.
• More than 240 waste water treatment plants in the state treat sewage and other waste water prior to discharge. The organics in waste water are principally biogenic and some facilities use anaerobic digestion for sludge stabilization, producing a methane-rich biogas that can be used like landfill gas for energy or chemical processing. The total biogas resource from waste water treatment is currently 16 BCF/y for a methane concentration of 60%, or 9.6 BCF/y methane equivalent.
• Organic biosolids or sludge resulting from waste water treatment are another source of biomass. About 85% of biosolids are land applied or otherwise used. For example, biosolids have been used for NOx control in cement manufacturing,25 The remaining fraction of biosolids are landfilled.
23 Morris, G. 2003. The status of biomass power generation in California, July 31, 2003. NREL/SR-510-35114, National Renewable Energy Laboratory, Golden, CO. 24 as-received wet tons. 25 Battye, R., S. Walsh and J. Lee-Greco. 2000. NOx control technologies for the cement industry, Final Report, EPA Contract No. 68-D98-026, USEPA, Research Triangle Park, NC.

19
Figure 5a. Estimated biomass (gross BDT/y) in landfilled MSW, 2005.
20
Figure 5b. Estimated biomass (gross BDT/y) in MSW diverted from landfill, 2005.
21
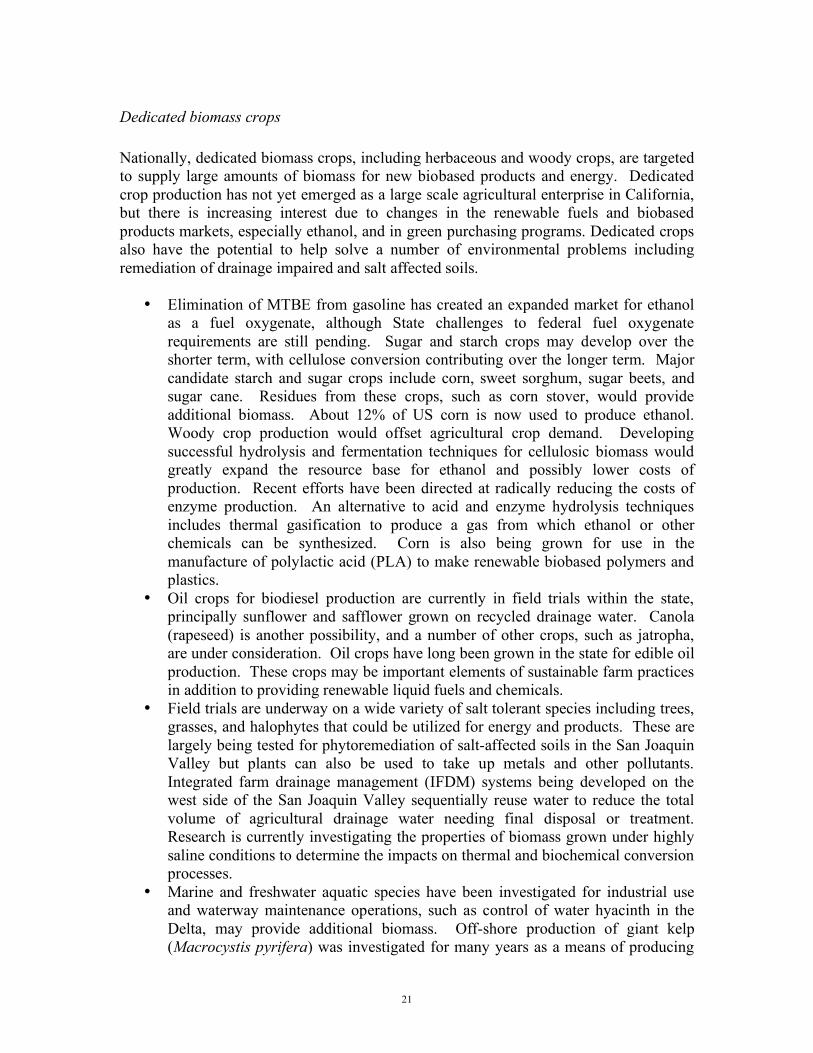
Dedicated biomass crops Nationally, dedicated biomass crops, including herbaceous and woody crops, are targeted to supply large amounts of biomass for new biobased products and energy. Dedicated crop production has not yet emerged as a large scale agricultural enterprise in California, but there is increasing interest due to changes in the renewable fuels and biobased products markets, especially ethanol, and in green purchasing programs. Dedicated crops also have the potential to help solve a number of environmental problems including remediation of drainage impaired and salt affected soils.
• Elimination of MTBE from gasoline has created an expanded market for ethanol as a fuel oxygenate, although State challenges to federal fuel oxygenate requirements are still pending. Sugar and starch crops may develop over the shorter term, with cellulose conversion contributing over the longer term. Major candidate starch and sugar crops include corn, sweet sorghum, sugar beets, and sugar cane. Residues from these crops, such as corn stover, would provide additional biomass. About 12% of US corn is now used to produce ethanol. Woody crop production would offset agricultural crop demand. Developing successful hydrolysis and fermentation techniques for cellulosic biomass would greatly expand the resource base for ethanol and possibly lower costs of production. Recent efforts have been directed at radically reducing the costs of enzyme production. An alternative to acid and enzyme hydrolysis techniques includes thermal gasification to produce a gas from which ethanol or other chemicals can be synthesized. Corn is also being grown for use in the manufacture of polylactic acid (PLA) to make renewable biobased polymers and plastics.
• Oil crops for biodiesel production are currently in field trials within the state, principally sunflower and safflower grown on recycled drainage water. Canola (rapeseed) is another possibility, and a number of other crops, such as jatropha, are under consideration. Oil crops have long been grown in the state for edible oil production. These crops may be important elements of sustainable farm practices in addition to providing renewable liquid fuels and chemicals.
• Field trials are underway on a wide variety of salt tolerant species including trees, grasses, and halophytes that could be utilized for energy and products. These are largely being tested for phytoremediation of salt-affected soils in the San Joaquin Valley but plants can also be used to take up metals and other pollutants. Integrated farm drainage management (IFDM) systems being developed on the west side of the San Joaquin Valley sequentially reuse water to reduce the total volume of agricultural drainage water needing final disposal or treatment. Research is currently investigating the properties of biomass grown under highly saline conditions to determine the impacts on thermal and biochemical conversion processes.
• Marine and freshwater aquatic species have been investigated for industrial use and waterway maintenance operations, such as control of water hyacinth in the Delta, may provide additional biomass. Off-shore production of giant kelp (Macrocystis pyrifera) was investigated for many years as a means of producing

22
renewable methane but has not been deployed commercially. Algae have been widely investigated for photobiological hydrogen production.
• A wide range of crops are being considered for energy and new biobased products. Production practices for terrestrial crops are in most cases similar to other agricultural crops, although in both woody and herbaceous (e.g. grasses) crop production, the end use for the biomass can influence the management and cultural inputs and the practices employed to optimize the production system. The design of the production system considers soil preparation and preservation, species and variety selection, planting, weed and pest control, nutrients and fertilization, water and irrigation, harvesting, and post-harvesting operations. Switchgrass (Panicum virgatum), poplar (Populus spp.), and willow (Salix spp.) are principal crops considered as part of the national biomass development program for the east and midwest US under rainfed conditions. Eucalyptus is currently grown in California and is one species used in IFDM systems.
Dedicated biomass crop yields are variable and depend on the crop type and the availability of water and other inputs. Net energy yields also need to be considered, as for the case of corn grown for ethanol (see section on biofuels). Water is likely to be a limiting resource. On more marginal lands with limited water, biomass yields might average 5 dry tons per acre per year or less. Much higher yields can be obtained under better conditions. The integration of biomass crop production into more conventional agriculture may assist in improving overall sustainability, especially in the San Joaquin Valley. Biomass crops could help in sustaining many rural and agricultural economies. For dedicated crops to become a substantial component of the biomass resource in the state within the time frame of the RPS (2017) will take a concerted research and development effort. There will increasingly be near-term opportunities for high value crops in niche markets. State incentives for renewable fuels and products, such as ethanol, biodiesel, other fuels, polymers, solvents, and lubricants could help revitalize many agricultural sectors. Reductions in federal supports to some agricultural commodities would also provide incentives for new crop development, including energy crops. One of the best opportunities for near-term dedicated crop development is on land retired from agriculture in the San Joaquin Valley. Agriculture in the valley relies on irrigation using both imported water as well as groundwater. Drainage systems that were integral to plans for agriculture on the west side of the valley through the state and federal water projects were never fully developed due to environmental and financial concerns. Discovery of wildfowl deformities and mortalities at the Kesterson reservoir in the early 1980’s led to restrictions on drainage from farm lands. Growers and local water districts are faced with identifying other drainage management options, including on-farm or regional management systems and land retirement. More than 100,000 acres have now been retired due to shallow groundwater tables and salt buildup from inadequate drainage, and 1.5 million acres are considered drainage impaired. Dedicated biomass crops could be used to help remediate these lands and provide much needed economic relief to farmers and local communities. Dedicated crops would serve as biological pumps, lowering groundwater tables and reducing waterlogging of the soil. Biomass

23
crops could be used to grow fuel for local power generation, reducing transportation costs and adding new capacity towards the goals of the RPS. Waste heat from power generation could also be used to purify drainage water, recovering clean water and extracting salts. The types of crops to plant, uses for the crops, irrigation requirements, and other impacts on the environmental quality of the valley, including air quality impacts, need further analysis. The production of biomass crops might, however, help overcome what has become a serious environmental and economic crisis for the state.
Future California biomass resource projections Biomass from agriculture, forestry, municipal wastes, and dedicated crops could increase from the current 86 million dry tons to 100 million dry tons per year by 2017 (Figure 6).26 Increases in MSW and animal wastes are projected to be responsible for about two-thirds of this 15 million ton growth, the rest projected to come mostly from dedicated crops. Biomass from conventional agricultural crops and from forestry will likely remain close to current estimated levels. The amount technically available may increase to more than 40 million dry tons per year by 2017 depending on contributions made by dedicated crops.
0
20
40
60
80
100
2005 2007 2009 2011 2013 2015 2017
Year
Re
so
urc
e (
Mil
lio
n B
DT
/y)
Gross Resource
Technical Resource
Figure 6. Growth projections for biomass in California through 2017. Does not include resource associated with landfill gas or biogas from waste water treatment facilities.
26 California Biomass Collaborative. 2004. op cit.

24
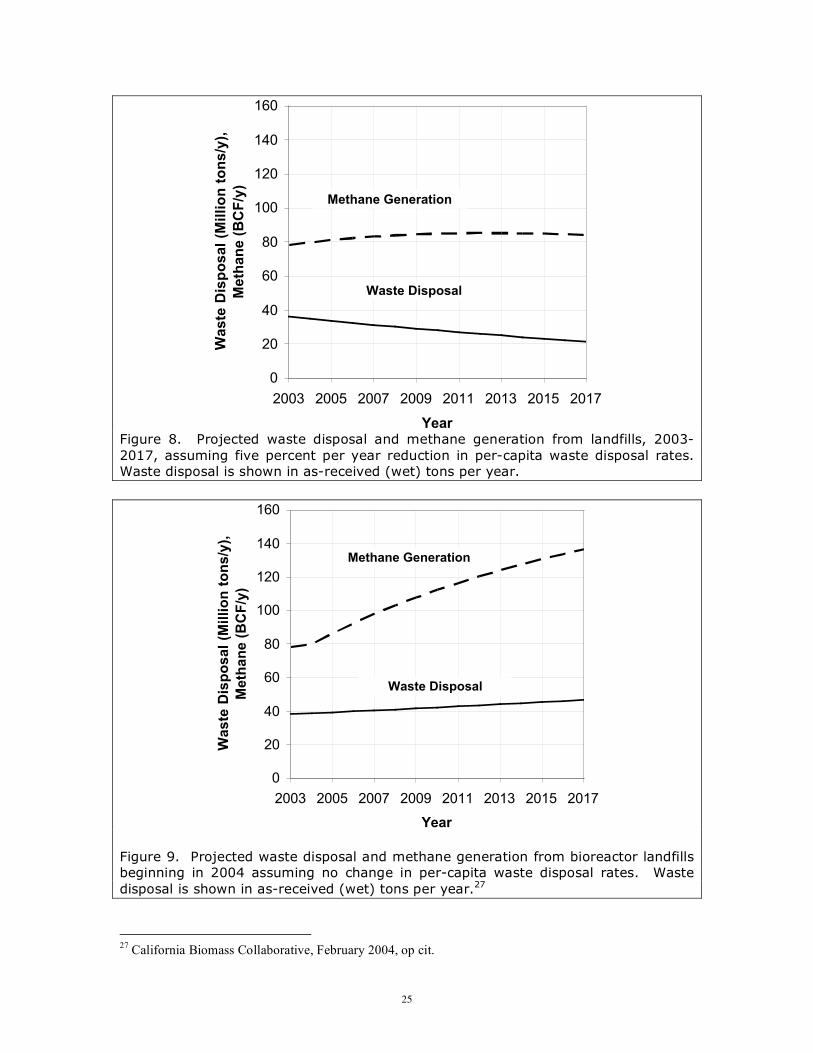
Biogas from waste-water treatment operations will increase with population, but is also subject to waste management practices adopted by industry. Reductions in food processing waste-water disposal through municipal waste-water systems, for example, would reduce organic loadings and hence gas production from municipal digesters. This might be compensated by the food industry deploying on-site digesters to help meet its own energy requirements. Increasing adoption of anaerobic technologies by municipalities in place of aerobic treatment will increase biogas production. Landfill gas will similarly increase with population (Figure 7) unless the state acts to further reduce waste disposal. Even with radical waste disposal reductions, however, landfill gas from waste already in landfills will continue to be an important resource through 2017 (Figure 8). An immediate shift to bioreactor landfills might increase landfill methane generation rates 30% by 2017 (Figure 9), although these systems are still largely developmental. Total biomass resource availability will remain high over the coming decades and identifying improved management strategies will become increasingly important.
0
20
40
60
80
100
120
140
160
2003 2005 2007 2009 2011 2013 2015 2017
Year
Wa
ste
Dis
po
sa
l (M
illi
on
to
ns
/y),
Me
tha
ne
(B
CF
/y)
Waste Disposal
Methane Generation
Figure 7. Projected waste disposal and methane generation from landfills, 2003-2017, assuming no change in per-capita waste disposal rates. Waste disposal is shown in as-received (wet) tons per year.
25
0
20
40
60
80
100
120
140
160
2003 2005 2007 2009 2011 2013 2015 2017
Year
Wa
ste
Dis
po
sa
l (M
illi
on
to
ns
/y),
Me
tha
ne
(B
CF
/y)
Waste Disposal
Methane Generation
Figure 8. Projected waste disposal and methane generation from landfills, 2003-2017, assuming five percent per year reduction in per-capita waste disposal rates. Waste disposal is shown in as-received (wet) tons per year.
0
20
40
60
80
100
120
140
160
2003 2005 2007 2009 2011 2013 2015 2017
Year
Wa
ste
Dis
po
sa
l (M
illi
on
to
ns
/y),
Me
tha
ne
(B
CF
/y)
Methane Generation
Waste Disposal
Figure 9. Projected waste disposal and methane generation from bioreactor landfills beginning in 2004 assuming no change in per-capita waste disposal rates. Waste disposal is shown in as-received (wet) tons per year.27
27 California Biomass Collaborative, February 2004, op cit.

26
3. Potential Expansion of Electric Power Generation from Biomass
Potential generating capacity The gross biomass resource in the state would be sufficient to generate in excess of 10,700 MWe of electricity with more than 2,100 MWe from agriculture, 3,600 MWe from forestry, and 5,000 MWe from municipal wastes including landfill and sewage digester gas (Table 2).28 Because not all of the biomass resource can or will be used for power generation, the current technical potential is substantially less, closer to 4,700 MWe. This capacity could generate about 35,000 GWh of electrical energy, or roughly 12% of the 283,000 GWh of electricity currently used in the state. Existing and near-term planned biomass grid generating capacity in California in 2005 was 969 MWe including solid-fueled combustion power plants and engines, boilers, and turbines operating on landfill gas, sewage digester gas, and biogas from animal manures (Table 2).29 Total biomass capacity is about 2% of statewide peak power capacity. In estimating the generating capacity, low moisture materials such as wood, paper and cardboard in MSW, and some field crop residues are more likely to be converted using thermal technologies, while high moisture materials such as dairy cattle manure, green waste, and food waste may more often be converted through anaerobic digestion or other biochemical systems. Moisture content is not the only factor to consider in selecting conversion technology, but it has a strong influence on whether to employ thermochemical or biochemical techniques. Improvements in both technology classes will lead to greater flexibility in fuel selection in the future. Co-firing with other fuels, such as natural gas and coal, also allows greater flexibility in fuel selection. Net thermal conversion efficiencies for combustion power plants using biomass are in the range of about 20 to 28%, the higher values being associated mostly with facilities using circulating fluidized bed technologies. Advancements in integrated gasification combined cycle systems should enable efficiencies of 35% and above. Bioconversion efficiencies depend on feedstock biodegradability and typically range from 13% to 22% when using newer, higher efficiency engines for generating electricity from biogas. Gas scrubbing and catalytic emission control devices added to comply with new air emission standards may cause net efficiencies to decline.
28 California Biomass Collaborative. 2005, updated biomass resource database. 29 Estimated gross installed capacity at the end of 2004 was 1,087 MWe, with 870 MWe net to the grid, see: Aldas, R.E. and M.C. Gildart. 2005. An assessment of biomass power generation in California: status and survey results. Draft California Biomass Collaborative/PIER Consultant Report, California Energy Commission, Sacramento, CA.
27
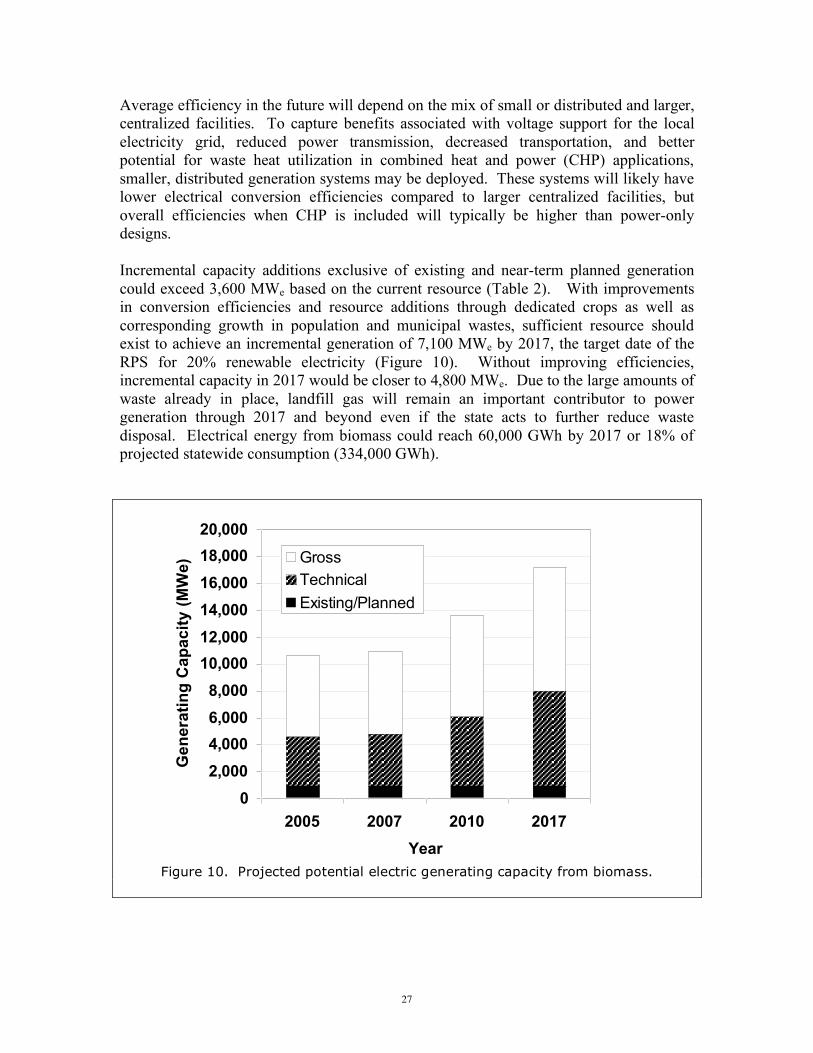
Average efficiency in the future will depend on the mix of small or distributed and larger, centralized facilities. To capture benefits associated with voltage support for the local electricity grid, reduced power transmission, decreased transportation, and better potential for waste heat utilization in combined heat and power (CHP) applications, smaller, distributed generation systems may be deployed. These systems will likely have lower electrical conversion efficiencies compared to larger centralized facilities, but overall efficiencies when CHP is included will typically be higher than power-only designs. Incremental capacity additions exclusive of existing and near-term planned generation could exceed 3,600 MWe based on the current resource (Table 2). With improvements in conversion efficiencies and resource additions through dedicated crops as well as corresponding growth in population and municipal wastes, sufficient resource should exist to achieve an incremental generation of 7,100 MWe by 2017, the target date of the RPS for 20% renewable electricity (Figure 10). Without improving efficiencies, incremental capacity in 2017 would be closer to 4,800 MWe. Due to the large amounts of waste already in place, landfill gas will remain an important contributor to power generation through 2017 and beyond even if the state acts to further reduce waste disposal. Electrical energy from biomass could reach 60,000 GWh by 2017 or 18% of projected statewide consumption (334,000 GWh).
0
2,000
4,000
6,000
8,000
10,000
12,000
14,000
16,000
18,000
20,000
2005 2007 2010 2017
Year
Ge
ne
rati
ng
Ca
pa
cit
y (
MW
e) Gross
Technical
Existing/Planned
Figure 10. Projected potential electric generating capacity from biomass.

28
Table 2. Estimated electricity generating potential from biomass in California, 2005 resource base.
MWe GWh MWe GWh
Gross Technical Gross Technical
Total Biomass 10,711 4,654 79,757 34,650 969 7,216 3,684 27,434
Possible Use by Thermal Conversion 8,536 3,671 63,561 27,337 644 4,796 3,027 22,541
Possible Use by Biochemical Conversion 2,175 982 16,196 7,313 325 2,420 657 4,893
Total Agricultural 2,144 1,021 15,964 7,605 141 1,051 880 6,554
Total Animal Manure 986 389 7,339 2,893 4 30 385 2,863
Total Cattle Manure 612 224 4,555 1,669 4 30 220 1,639
Milk Cow Manure 285 142 2,119 1,060 4 30 138 1,030
Total Orchard and Vine 346 242 2,573 1,801 93 694 149 1,108
Total Field and Seed 575 281 4,281 2,092 281 2,092
Total Vegetable 112 9 835 70 9 70
Total Food Processing 126 101 936 749 44 328 57 421
Total Forestry 3,628 1,934 27,013 14,404 268 1,996 1,666 12,408
Mill Residue 839 451 6,244 3,355
Logging Slash 1,079 575 8,035 4,285
Forest Thinning 1,088 583 8,103 4,345
Shrub 622 325 4,631 2,419
Total Municipal 4,940 1,698 36,780 12,641 560 4,170 1,138 8,472
Biosolids Landfilled(1) (1) (1) (1) (1) (1) (1) (1)
Biosolids Diverted 61 49 454 363 49 363
Total MSW Biomass Landfilled 1,926(1)
14,340(1) (1) (1) (1) (1)
Total MSW Biomass Diverted 2,142 1,071 15,952 7,976 239 1,780 832 6,197
Landfill Gas (LFGTE) 694 500 5,171 3,724 258 1,921 242 1,803
Biogas from waste-water treatment plants 116 78 863 578 63 469 15 109
Existing/Planned Net TechnicalPotential
MWe
Potential
GWh
(1) Included in LFGTE. Totals may not add due to rounding.

29
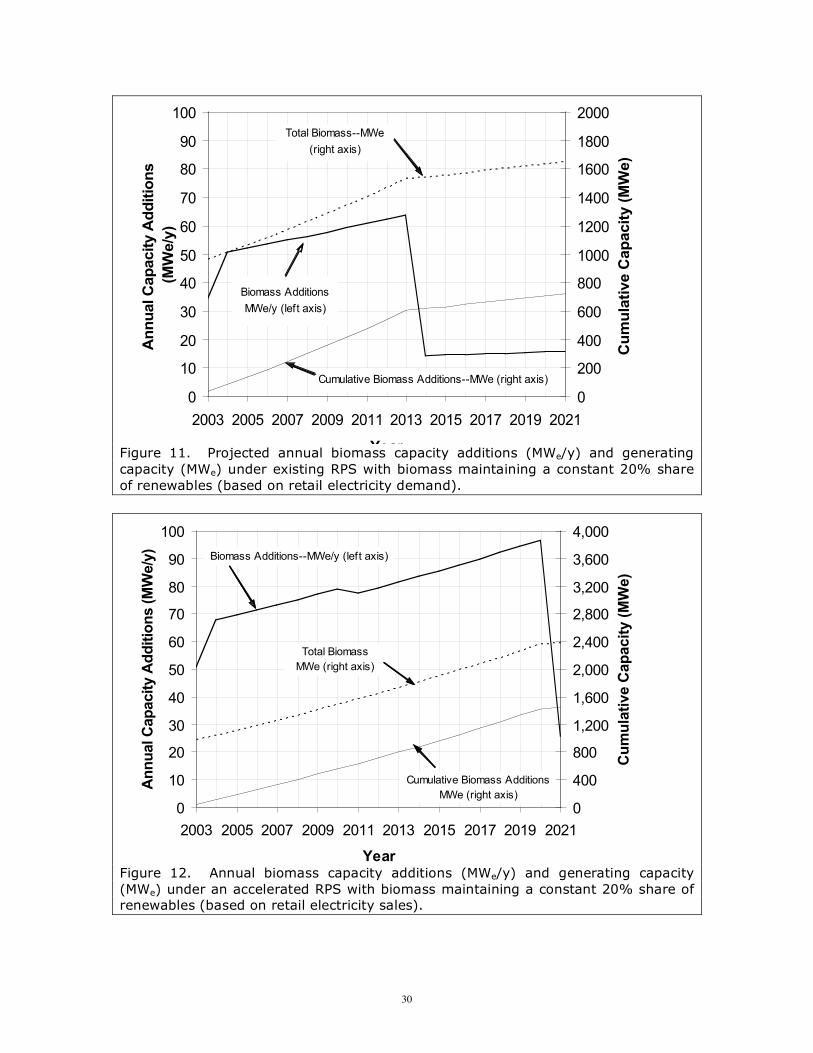
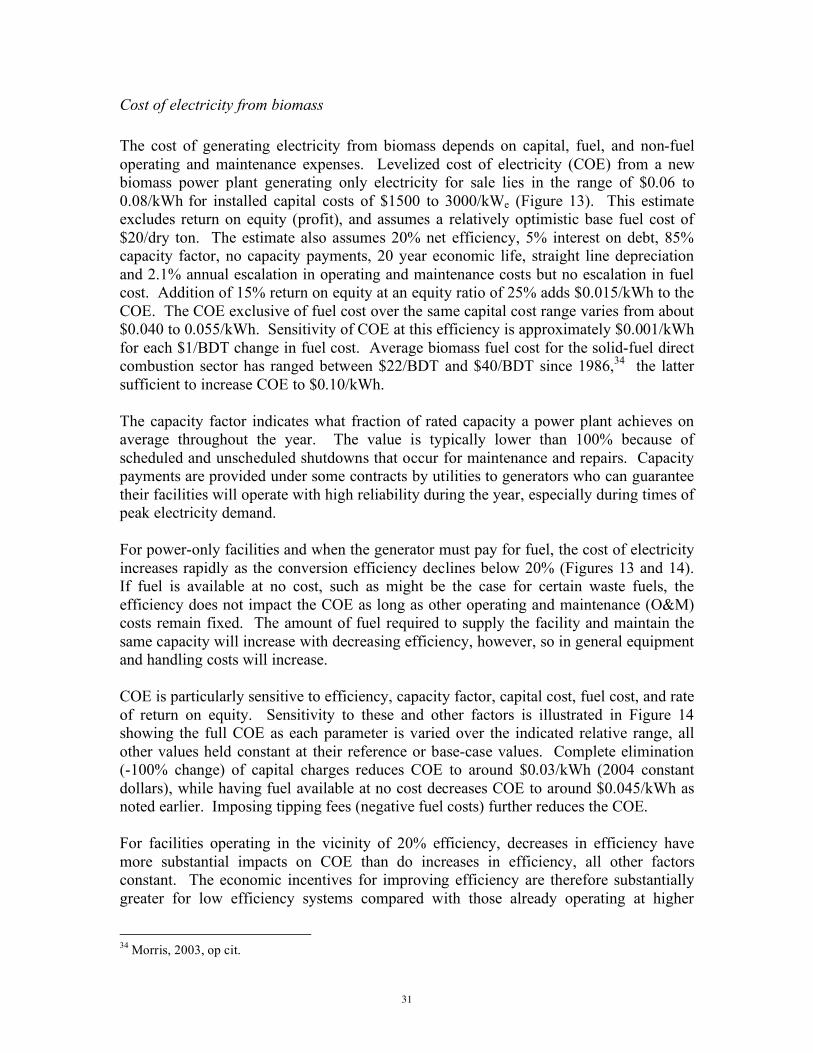
Currently, biomass accounts for 24% of California net renewable system power, and 20% of gross renewable system power.30 If in the future, biomass were to maintain a 20% share of net system power, then 660 MWe of biomass capacity would need to be added by 2017—an average of approximately 50 MWe per year assuming an average capacity factor of 85%.31 About a third of this could come from landfill gas and waste-water treatment facilities. To maintain a 20% share in each year, assuming other renewable additions remain on schedule, biomass additions would be needed as shown in Figure 11. The annual additions are projected based on retail electricity sales of 167,500 GWh in 2002 and 163,320 GWh in 2003,32 escalating thereafter at a rate equal to the mean population growth rate of 1.4% per year assuming per-capita electricity consumption remains constant.33 Capacity projections assume base-load facilities operating at an average 85% capacity factor. Renewable electricity is assumed to comprise 9% of sales in year 2001, increasing 1% per year beginning in 2002 until reaching 20%. Under these assumptions, the RPS goal could be achieved by 2013, prior to the required date in 2017. As additions at the level indicated will not occur through 2005, greater capacity additions will be needed in the latter part of the interval to sustain a 20% share. After meeting the RPS objective, an annual increment of 14-16 MWe/y would be needed to maintain biomass share if electricity demand continued to increase at the same rate and the RPS remained at a target level of 20%. If the state accelerates the implementation of the RPS to achieve 33% renewable electricity by 2020, annual capacity additions for biopower would need to increase more rapidly to maintain 20% share (Figure 12), with annual biomass additions ranging from 70 to 95 MWe per year and net cumulative additions through 2020 of 1,450 MWe. Under these assumptions, total biomass generating capacity would be 2,400 MWe. Although the actual share of biomass power under the RPS will be dictated by economic and market effects, sufficient resource is at least available to support development at a level equal to the current share. Such development would stimulate more intense competition for fuel and feedstock such as occurred during the growth stages of the biomass power industry in the early 1990s, although changes in waste management policy might open the market to large quantities of separated solid wastes. Given the current level of planned biomass development, additions of the magnitude projected are likely highly optimistic over at least the near term. Regardless of the actual annual additions, development of this kind will only occur when fuel or feedstock supplies can be assured and long term contracting is available for sales of facility output.
30California Energy Commission, 2003 Net system power calculation, Publication 300-04-001R. 31 A minimum average capacity factor of 69% can be estimated from the reported 2003 gross system power for biomass in California (CEC 300-04-001R) and the installed capacity of 924 MWe (California Biomass Collaborative, 2004). The actual capacity factor is higher due to self-generation not included in the gross system power calculation. 32 California Energy Commission, 2002 Net system power calculation, Publication 300-03-002, and 2003 Net system power calculation, Publication 300-04-001R. 33 California Energy Commission, 2003, Publication 100-03-014F.
30
0
10
20
30
40
50
60
70
80
90
100
2003 2005 2007 2009 2011 2013 2015 2017 2019 2021
Year
An
nu
al C
ap
acit
y A
dd
itio
ns
(MW
e/y
)
0
200
400
600
800
1000
1200
1400
1600
1800
2000
Cu
mu
lati
ve C
ap
acit
y (
MW
e)
Biomass Additions
MWe/y (left axis)
Total Biomass--MWe
(right axis)
Cumulative Biomass Additions--MWe (right axis)
Figure 11. Projected annual biomass capacity additions (MWe/y) and generating capacity (MWe) under existing RPS with biomass maintaining a constant 20% share of renewables (based on retail electricity demand).
0
10
20
30
40
50
60
70
80
90
100
2003 2005 2007 2009 2011 2013 2015 2017 2019 2021
Year
An
nu
al C
ap
acit
y A
dd
itio
ns (
MW
e/y
)
0
400
800
1,200
1,600
2,000
2,400
2,800
3,200
3,600
4,000
Cu
mu
lati
ve C
ap
acit
y (
MW
e)
Biomass Additions--MWe/y (left axis)
Total Biomass
MWe (right axis)
Cumulative Biomass Additions
MWe (right axis)
Figure 12. Annual biomass capacity additions (MWe/y) and generating capacity (MWe) under an accelerated RPS with biomass maintaining a constant 20% share of renewables (based on retail electricity sales).
31
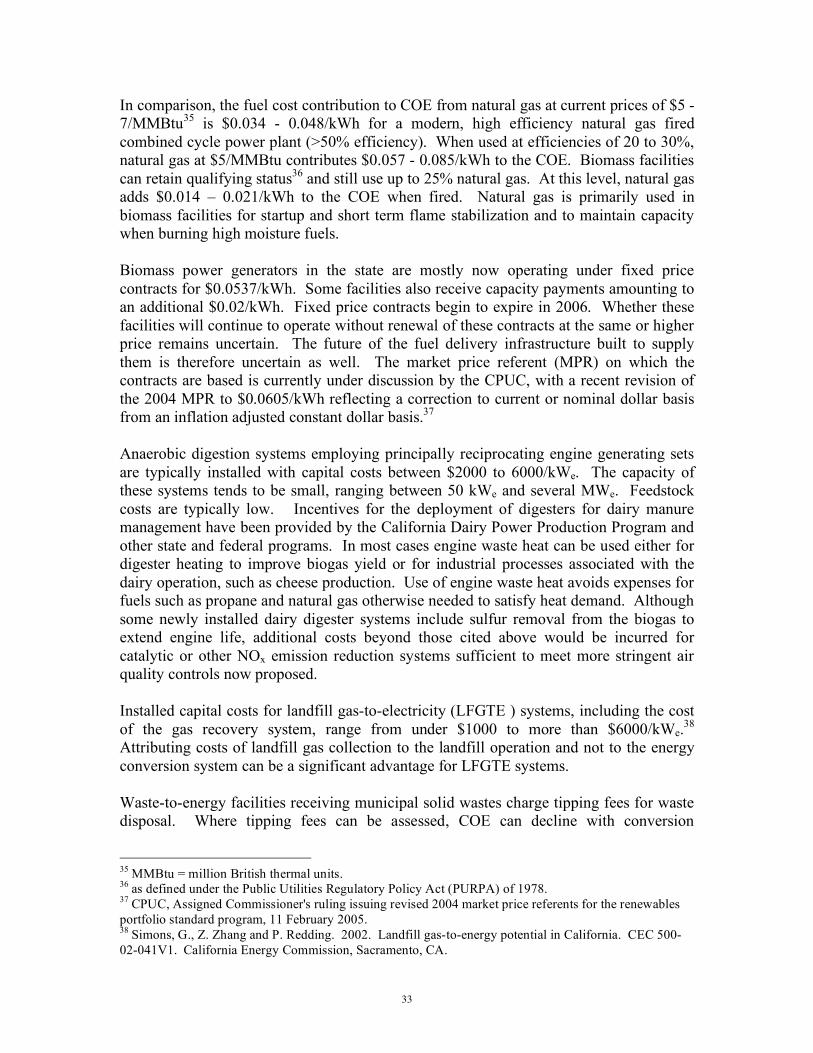
Cost of electricity from biomass The cost of generating electricity from biomass depends on capital, fuel, and non-fuel operating and maintenance expenses. Levelized cost of electricity (COE) from a new biomass power plant generating only electricity for sale lies in the range of $0.06 to 0.08/kWh for installed capital costs of $1500 to 3000/kWe (Figure 13). This estimate excludes return on equity (profit), and assumes a relatively optimistic base fuel cost of $20/dry ton. The estimate also assumes 20% net efficiency, 5% interest on debt, 85% capacity factor, no capacity payments, 20 year economic life, straight line depreciation and 2.1% annual escalation in operating and maintenance costs but no escalation in fuel cost. Addition of 15% return on equity at an equity ratio of 25% adds $0.015/kWh to the COE. The COE exclusive of fuel cost over the same capital cost range varies from about $0.040 to 0.055/kWh. Sensitivity of COE at this efficiency is approximately $0.001/kWh for each $1/BDT change in fuel cost. Average biomass fuel cost for the solid-fuel direct combustion sector has ranged between $22/BDT and $40/BDT since 1986,34 the latter sufficient to increase COE to $0.10/kWh. The capacity factor indicates what fraction of rated capacity a power plant achieves on average throughout the year. The value is typically lower than 100% because of scheduled and unscheduled shutdowns that occur for maintenance and repairs. Capacity payments are provided under some contracts by utilities to generators who can guarantee their facilities will operate with high reliability during the year, especially during times of peak electricity demand. For power-only facilities and when the generator must pay for fuel, the cost of electricity increases rapidly as the conversion efficiency declines below 20% (Figures 13 and 14). If fuel is available at no cost, such as might be the case for certain waste fuels, the efficiency does not impact the COE as long as other operating and maintenance (O&M) costs remain fixed. The amount of fuel required to supply the facility and maintain the same capacity will increase with decreasing efficiency, however, so in general equipment and handling costs will increase. COE is particularly sensitive to efficiency, capacity factor, capital cost, fuel cost, and rate of return on equity. Sensitivity to these and other factors is illustrated in Figure 14 showing the full COE as each parameter is varied over the indicated relative range, all other values held constant at their reference or base-case values. Complete elimination (-100% change) of capital charges reduces COE to around $0.03/kWh (2004 constant dollars), while having fuel available at no cost decreases COE to around $0.045/kWh as noted earlier. Imposing tipping fees (negative fuel costs) further reduces the COE. For facilities operating in the vicinity of 20% efficiency, decreases in efficiency have more substantial impacts on COE than do increases in efficiency, all other factors constant. The economic incentives for improving efficiency are therefore substantially greater for low efficiency systems compared with those already operating at higher
34 Morris, 2003, op cit.

32
efficiency. However, other benefits accrue from operating at higher efficiency, including generally lower environmental emissions per unit output and reduced fuel requirements for a given capacity.
0.00
0.02
0.04
0.06
0.08
0.10
0.12
0 1,000 2,000 3,000 4,000 5,000
Installed Capital Cost ($/kW)
CO
E (
$/k
Wh
)
20
%
30% 40% efficiency
Zero fuel cost
10
%
5%
Figure 13. Levelized cost of energy (COE, $/kWh in constant 2004 dollars) for electricity from biomass. Fuel cost = $20/dry ton except as indicated. Assumes no return on equity (no profit) and no capacity payments. With fixed O&M cost, COE for zero fuel cost is independent of efficiency at any capital cost. Addition of 15% rate of return for 25% equity adds $0.015/kWh to the cost of energy.
0.00
0.02
0.04
0.06
0.08
0.10
0.12
0.14
0.16
-200 -100 0 100 200 300
Relative Change (%)
CO
E (
$/
kW
h,
Co
nsta
nt)
Capital Cost
Fuel Cost
Debt Ratio
Debt Interest Rate
Cost of Equity
Net Efficiency
Capacity Factor
Figure 14. Sensitivity of COE (2004 constant $/kWh) to technical and financial factors for stand-alone power generation from biomass and assumptions as shown: Capital cost = $2,800/kWe Net Efficiency = 20% Capacity factor = 85% Fuel cost = $20/ton Debt ratio = 75% Debt interest = 5%/year Cost of equity = 15%/year Capacity payment = $166/kW-y PTC = $0.009/kWh Straight line depreciation General inflation = 2.1%/year One year debt reserve
33
In comparison, the fuel cost contribution to COE from natural gas at current prices of $5 - 7/MMBtu35 is $0.034 - 0.048/kWh for a modern, high efficiency natural gas fired combined cycle power plant (>50% efficiency). When used at efficiencies of 20 to 30%, natural gas at $5/MMBtu contributes $0.057 - 0.085/kWh to the COE. Biomass facilities can retain qualifying status36 and still use up to 25% natural gas. At this level, natural gas adds $0.014 – 0.021/kWh to the COE when fired. Natural gas is primarily used in biomass facilities for startup and short term flame stabilization and to maintain capacity when burning high moisture fuels. Biomass power generators in the state are mostly now operating under fixed price contracts for $0.0537/kWh. Some facilities also receive capacity payments amounting to an additional $0.02/kWh. Fixed price contracts begin to expire in 2006. Whether these facilities will continue to operate without renewal of these contracts at the same or higher price remains uncertain. The future of the fuel delivery infrastructure built to supply them is therefore uncertain as well. The market price referent (MPR) on which the contracts are based is currently under discussion by the CPUC, with a recent revision of the 2004 MPR to $0.0605/kWh reflecting a correction to current or nominal dollar basis from an inflation adjusted constant dollar basis.37 Anaerobic digestion systems employing principally reciprocating engine generating sets are typically installed with capital costs between $2000 to 6000/kWe. The capacity of these systems tends to be small, ranging between 50 kWe and several MWe. Feedstock costs are typically low. Incentives for the deployment of digesters for dairy manure management have been provided by the California Dairy Power Production Program and other state and federal programs. In most cases engine waste heat can be used either for digester heating to improve biogas yield or for industrial processes associated with the dairy operation, such as cheese production. Use of engine waste heat avoids expenses for fuels such as propane and natural gas otherwise needed to satisfy heat demand. Although some newly installed dairy digester systems include sulfur removal from the biogas to extend engine life, additional costs beyond those cited above would be incurred for catalytic or other NOx emission reduction systems sufficient to meet more stringent air quality controls now proposed. Installed capital costs for landfill gas-to-electricity (LFGTE ) systems, including the cost of the gas recovery system, range from under $1000 to more than $6000/kWe.38 Attributing costs of landfill gas collection to the landfill operation and not to the energy conversion system can be a significant advantage for LFGTE systems. Waste-to-energy facilities receiving municipal solid wastes charge tipping fees for waste disposal. Where tipping fees can be assessed, COE can decline with conversion
35 MMBtu = million British thermal units. 36 as defined under the Public Utilities Regulatory Policy Act (PURPA) of 1978. 37 CPUC, Assigned Commissioner's ruling issuing revised 2004 market price referents for the renewables portfolio standard program, 11 February 2005. 38 Simons, G., Z. Zhang and P. Redding. 2002. Landfill gas-to-energy potential in California. CEC 500-02-041V1. California Energy Commission, Sacramento, CA.
34
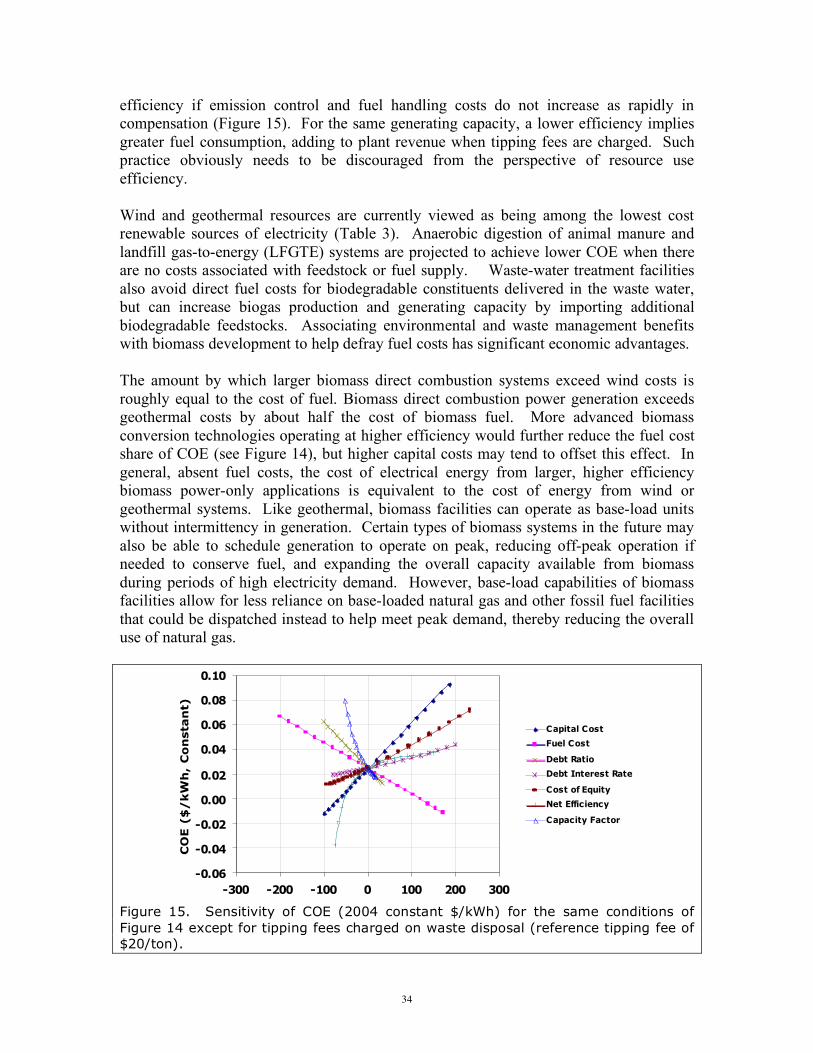
efficiency if emission control and fuel handling costs do not increase as rapidly in compensation (Figure 15). For the same generating capacity, a lower efficiency implies greater fuel consumption, adding to plant revenue when tipping fees are charged. Such practice obviously needs to be discouraged from the perspective of resource use efficiency. Wind and geothermal resources are currently viewed as being among the lowest cost renewable sources of electricity (Table 3). Anaerobic digestion of animal manure and landfill gas-to-energy (LFGTE) systems are projected to achieve lower COE when there are no costs associated with feedstock or fuel supply. Waste-water treatment facilities also avoid direct fuel costs for biodegradable constituents delivered in the waste water, but can increase biogas production and generating capacity by importing additional biodegradable feedstocks. Associating environmental and waste management benefits with biomass development to help defray fuel costs has significant economic advantages. The amount by which larger biomass direct combustion systems exceed wind costs is roughly equal to the cost of fuel. Biomass direct combustion power generation exceeds geothermal costs by about half the cost of biomass fuel. More advanced biomass conversion technologies operating at higher efficiency would further reduce the fuel cost share of COE (see Figure 14), but higher capital costs may tend to offset this effect. In general, absent fuel costs, the cost of electrical energy from larger, higher efficiency biomass power-only applications is equivalent to the cost of energy from wind or geothermal systems. Like geothermal, biomass facilities can operate as base-load units without intermittency in generation. Certain types of biomass systems in the future may also be able to schedule generation to operate on peak, reducing off-peak operation if needed to conserve fuel, and expanding the overall capacity available from biomass during periods of high electricity demand. However, base-load capabilities of biomass facilities allow for less reliance on base-loaded natural gas and other fossil fuel facilities that could be dispatched instead to help meet peak demand, thereby reducing the overall use of natural gas.
-0.06
-0.04
-0.02
0.00
0.02
0.04
0.06
0.08
0.10
-300 -200 -100 0 100 200 300
Relative Change (%)
CO
E (
$/
kW
h,
Co
nsta
nt)
Capital Cost
Fuel Cost
Debt Ratio
Debt Interest Rate
Cost of Equity
Net Efficiency
Capacity Factor
Figure 15. Sensitivity of COE (2004 constant $/kWh) for the same conditions of Figure 14 except for tipping fees charged on waste disposal (reference tipping fee of $20/ton).

35
Table 3. Estimated costs of renewable electricity.39
Resource Scale (MWe) Levelized COE(1)
(2003 constant $/kWh) Animal Manure Digestion(2) 0.1 (100 kWe) 0.043 Landfill gas 2 0.044 Wind 75 0.049 Geothermal(3) 50 0.054 Biomass Direct Combustion 20 0.066 Solar Thermal 100 0.120 Solar PV 0.003 (3 kWe) 0.230 (1) In 2005. Listed in order of increasing cost, excludes production tax credit and other incentives. (2) farmer or cooperative financed. COE is $0.069/kWh for developer financed. (3) average of geothermal flash ($0.053/kWh) and geothermal binary ($0.055/kWh). Valuing heat in biomass-fueled combined heat and power (CHP) systems can reduce the cost of electricity below costs for wind and geothermal. Direct combustion power generation from sawmill residues has long benefited from the on-site utilization of cogenerated heat in displacing natural gas, propane, and other fuels otherwise needed for kiln drying lumber. Matching power and heat applications is an important goal for improving economic competitiveness of biomass electricity systems. Distributed and smaller-scale generation systems have some advantage in this regard by having the potential to access a wider variety of heating and cooling applications. Integration of biomass conversion systems, such as in biorefinery concepts, may further improve economic feasibility due to better overall utilization of feedstock energy. Use of electricity at the site of generation (on-site power) also benefits from avoiding purchase of retail of electricity. Net-metering is advantageous in this regard, but is so far not available for all biomass generation classes, and as noted earlier, is currently scheduled to end in 2006 for dairy digester power systems. Cost of electricity from a CHP system with the same reference conditions as the stand-alone power generation facility of Figure 14 would decline to $0.0120/kWh were heat valued at the equivalent price of $7/MMBtu in substitution for natural gas, exclusive of the added capital costs of heat recovery and distribution (Figure 16). Power plant cogenerated heat does not necessarily serve in direct substitution for premium fuels like natural gas, but heat utilization, even at lower economic value, can result in significantly lower revenue requirements for cogenerated electricity. For the example above, cutting heat value in half to $3.50/MMBtu and increasing overall capital cost by 50% to accommodate heat recovery costs still results in a cost of electricity that is 13% below the stand-alone COE, $0.0577/kWh instead of $0.0665/kWh for the assumptions used. Reliability of the biomass generation system is a key factor in the success of CHP systems to ensure heat is available when needed.
39 California Energy Commission, 2003, Renewable resources development report, 500-03-080F, Sacramento, CA.

36
-0.08
-0.06
-0.04
-0.02
0.00
0.02
0.04
0.06
0.08
0 2 4 6 8 10 12 14 16
Value of Heat ($/MMBtu)
CO
E (
co
nsta
nt
$/
kW
h)
Figure 16. Impact of heat price on the revenue requirements for electricity (COE, 2004 constant dollars) from a combined heat and power facility (same conditions of Figure 14).

37
4. Potential Development of Fuels and Products from Biomass Biomass resources will not be used solely for electricity generation. Other developing markets will compete for feedstock or provide opportunities for integrated processing through biorefineries, including animal feed, erosion control, green or renewable chemicals such as solvents and lubricants, polymers and plastics, and fuels. Among the latter category are transportation fuels such as ethanol, biodiesel, biogas or biomethane, Fischer-Tropsch liquids, and hydrogen.
Ethanol Cost reductions in the manufacturing of ethanol from cellulosic biomass, either through improvements in enzyme manufacturing and fermentation technology, or through successful implementation of thermochemical conversion techniques could generate a market on the same scale as the power market with the capacity to accept large quantities of biomass. Current California demand for ethanol as a motor vehicle fuel oxygenate is approximately one billion gallons per year.40 In the near term, in-state ethanol production would more likely come from starch and sugar crops including corn and sweet sorghum. Using corn imported from the Midwest for the production of ethanol with fermentation residues used as animal feeds is also being considered. Sugar and starch crops would at the same time produce cellulosic biomass (e.g. sugar cane bagasse, corn stalks or stover) that could be used for power generation, ethanol production, and other uses. Lignin produced as a residue of cellulosic fermentation could also be used for power generation or for the production of fuels and chemicals through thermochemical processes. Ethanol accounted for 0.3 Quads41 or 0.4% of US energy production in 2003.42 By the end of 2004, ethanol production capacity exceeded 3.4 billion gallons per year, with another 0.7 billion gallons of capacity under construction. Over 90% is produced from corn grain. The current capacity amounts to 2.5 billion gallons of gasoline equivalent. The cost of ethanol production in the US is $0.40 to 0.50 per gallon of gasoline equivalent more than the cost of gasoline production, exclusive of any incentives or external benefits. Supporting the manufacturing of ethanol are federal subsidies including a federal fuel tax exemption of $0.51 per gallon ethanol under the American Jobs Creation Act of 200443 which replaced the previous tax credit, a small producer income tax credit, and annual incentive payments under the Bioenergy Program managed by USDA. Of some controversy has been the net energy benefit of ethanol production from corn grain, with some concluding that the fossil energy invested exceeds the equivalent energy obtained, in contrast to USDA estimates showing that mid-west corn ethanol production does achieve a net energy gain. If ethanol production increases in
40MacDonald, et al., 2003, op cit. 41 1 Quad = 1 quadrillion Btu = 1015 Btu. 42 Schnepf, R. 2005. Agriculture-based renewable energy production. Congressional Research Service Order Code RL32712, Library of Congress, Washington, D.C. 43 PL 108-357.

38
California, demand for natural gas used in processing ethanol is also likely to increase. The net energy benefits will need to be carefully considered. Ethanol from cellulosic biomass can potentially achieve substantially better net energy gains and lower cost, with a much larger resource base available compared to sugars and starch. The commercial technology to do so has not yet emerged, with acid and enzymatic hydrolysis processes limiting in their ability to economically produce the simple sugars for fermentation. Significant cost reductions have been achieved in the production of cellulase enzymes, and cellose-to-ethanol pilot facilities are in operation. The future commercialization of these technologies remains uncertain, however, and developing thermochemical technologies may offer alternative routes. The federal sugars platform program is aimed at the development of biorefineries employing biochemical technologies. A companion thermochemical platform supports research and development of mostly gasification-based biorefinery approaches to fuels production from synthesis gas. At an average yield of 70 gallons per ton, cellulosic resources could potentially support a production level of 1.5 billion gallons of ethanol in the state. To produce a similar level from corn grain alone would require 3 million acres, or somewhat more than a third of total irrigated agricultural acres in the state, with an input of 12 million acre-feet of water, but with production of another 10 to 15 million tons of residue biomass. Residual sugars, cheese whey, and other sources already support production of approximately 10 million gallons per year of fuel ethanol in the state, and development plans exist for much larger sugar- and starch-crop based facilities.44
Biodiesel Biodiesel is a renewable diesel fuel substitute that can be produced from vegetable oils and animal fats, including waste oil sources such as yellow grease. Straight vegetable oils are not commonly employed as fuels due to the higher viscosity and injector and engine coking compared with biodiesels produced via transesterification of oils with alcohols using alkaline catalysts. Enzymatic approaches to biodiesel production are also in development. The facile transesterification reactions unfortunately do not lead to substantial control over fuel properties, so tailoring biodiesel to specific diesel engine requirements is difficult. Fischer-Tropsch liquids produced via thermochemical routes offer potentially greater selectivity in this regard. Biodiesel exhibits low toxicity and biodegradability than diesel fuel, and has better lubricity compared with low-sulfur diesel. Combustion emissions are lower for almost all species with the exception of NOx for which small increases are generally observed compared with petroleum diesel. Higher NOx emission constitutes a regulatory problem at present for biodiesel in California. US biodiesel production was 30 million gallons in 2004, about 0.05% of diesel fuel used in the nation. California consumption was 4 million gallons in 2002.45 Biodiesel can be blended with petroleum diesel, and is typically sold as a 20% blend 44 MacDonald, et al., 2003, op cit. 45 California Energy Commission. 2003. Transportation fuels, technologies, and infrastructure assessment report, 100-03-013F.

39
(B20), but other blends are available including B2 blends in which small amounts of biodiesel are added to improve lubricity properties of low-sulfur diesel fuels. Current production costs for biodiesel from oil seeds are around $2.50/gallon or close to $20/MMBtu, with the largest share of the cost due to the cost of feedstock. A federal production excise tax credit for biodiesel in the equivalent amount of $1.00/gallon was enacted under PL 108-357, the American Jobs Creation Act of 2004. Biodiesel production also produces byproducts of oil seed meal and glycerol. Large scale biodiesel production would significantly increase the amounts of these materials in the market and drive down prices. Large scale production would also drive up demand for oil crops, increasing prices due to low elasticity of demand for food-grade oil. Nonetheless, opportunities exist for increasing biodiesel production in the state, including the use of oil crops in helping to manage saline drainage waters and remediate soils in the San Joaquin Valley. Net energy gains for biodiesel are greater than for ethanol, with a net energy ratio (output/input) of around 3.2 compared to 1.3 – 1.6 estimated by USDA for ethanol from corn.
Biogas and biomethane Anaerobic digestion, including that occurring in landfills, produces a methane rich biogas that is most commonly used for power generation as discussed previously. Biogas can also be used as a transportation fuel, similar to compressed natural gas. Several European countries are already using it to this purpose. CO2, the other major gas in biogas besides methane, can be removed to yield an enriched biomethane fuel substituting for natural gas. Sulfur can be removed, improving utilization for both transportation and stationary power generation, where catalysts employed for NOx control on engines require the use of low sulfur fuel.
Fischer-Tropsch liquids The production of synthesis gas or syngas containing CO and H2 by thermochemical routes offers substantial opportunities for making diesel and gasoline substitutes and hydrogen. The Fischer-Tropsch (FT) process is capable of producing liquid hydrocarbons from syngas generated by biomass, coal, natural gas, or other feedstocks. A system to make FT liquids would include gasification of the biomass, generally using oxygen blown reactors although other configurations are possible. The syngas, after suitable gas cleaning, is reformed and shifted to manipulate composition and then reacted over a catalyst to form higher molecular weight compounds, including substitutes for conventional gasoline and diesel fuels. FT liquids are free of sulfur and therefore allow the use of catalytic control of combustion emissions, especially NOx. FT systems are subject to significant economies of scale, and hence may be optimized for different technology configurations and sites.46 Near-term production costs for FT diesel, naptha, 46 Hamelinck, C.N., A.P.C. Faaij, H. den Uil and H. Boerrigter. 2004. Production of FT transportation fuels from biomass; technical options, process analysis and optimization, and development potential. Energy 29:1743-1771.

40
and kerosene based on European studies are estimated to be in the range of $14—16/MMBtu, with longer term prospects to reduce the cost to about $9/MMBtu.47 By comparison, crude oil at $50/bbl costs $8.62/MMBtu, while conventional diesel at $2.00/gallon is equivalent to $13.64/MMBtu although actual production costs are lower. Electricity at $0.05/kWh is $14.65/MMBtu. Power generation can be incorporated into the FT process facility to utilize byproduct gas and other residuals. Overall efficiencies are estimated for biomass to be in the range of 40-45%. FT facilities for biomass are conceptual at this time and subject to considerable research and development. The selectivity of these processes and the ability to utilize a diversity of feedstocks may make them attractive in comparison with other routes.
Hydrogen and Methanol Thermochemical conversion can also be used in the production of methanol and hydrogen. Methanol as a fuel has previously been investigated in California. Hydrogen has a number of advantages in comparison with other fuels, particularly for reduced greenhouse gas and on-road emissions reduction. Production costs for hydrogen via gasification of biomass are estimated at $8 - 11/MMBtu, with longer term development possibly reducing these costs to $6 - 7/MMBtu.48 Overall conversion efficiencies, including integrated power generation, are estimated at 52-61%.
Biobased products Biomass can also provide raw materials for a diversity of biobased products. Plastics from biomass are already in production using polylactic acid produced from corn, and numerous other products are in development. A number of attempts have been made to manufacture straw-board panels and similar building materials in the state, with limited success to date although several projects continue in development. Future production levels within the state for biobased products are difficult to project. Federal programs and incentives including biobased product procurement programs are aimed at increasing production levels and providing new markets for agricultural products.
47 Tijmensen, M.J.A., A.P.C. Faaij, C.N. Hamelinck and M.R.M. van Hardeveld. 2002. Exploration of the possibilities for production of Fischer Tropsch liquids and power via biomass gasification. Biomass and Bioenergy 23:129-152. 48 Hamelinck, C.N. and A.P.C. Faaij. 2002. Future prospects for production of methanol and hydrogen from biomass. Journal of Power Sources 111:1-22.

41
5. Costs of Biomass Acquisition and Resource Supply
Biomass acquisition costs One of the primary constraints facing the increasing utilization of biomass is the cost of fuel or feedstock acquisition. Technical resource estimates (Table 1) do not specifically incorporate economic factors although in reality they are cost sensitive. Forest biomass on steep terrains excluded from the technical resource estimates might, for example, be harvested at high cost as long as erosion control and other compensating measures deployed at great expense accomplished equal ecosystem or resource management objectives. There would be little economic merit to such activity for the purposes of biomass utilization. Estimates of the statewide economic resource potential can be derived from general cost assumptions, but improved estimates require additional detailed assessments. The optimal use of biomass implies a system integration that accounts for production, handling, conversion, product marketing, and environmental management over the full life cycle. For this reason, the economic feasibility is feedstock-, product-, and site- dependent. Exclusive of harvesting and downstream processing operations, production costs for agricultural and other biomass residues are typically allocated to the primary crop production system and not separately accounted. In contrast, dedicated crops grown for biomass assume full allocation of production costs, but may contribute other high value benefits, such as soil remediation, that can be used to offset high costs of production. Production costs for dedicated crops are quite variable and depend on species, production site, level of management, and resulting yield. Biomass already collected at a potential site of use, such as certain food processing wastes, sawmill residues, and municipal wastes at transfer and material recovery facilities may be available at little or no additional cost. Facilities using these feedstocks do not incur additional collection and transportation costs, although there are typically still expenses for handling, processing, and storage. Tipping fees are charged at most landfills and waste-to-energy facilities and are an important source of revenue. Continuing development of waste conversion processes could lead to greater resource competition and changes in tipping fees. Longer term supply contracting is an advantage for most facilities in securing financing and ensuring reliable operation. Collection costs for agricultural crop residues depend on the type of crop, yields, harvesting equipment, labor, in-field drying and other processing, harvesting losses, and nutrient export, the latter representing the nutrients taken off the field in the biomass that otherwise would have been retained and reincorporated into the soil. If not returned in the form of ash, sludge, or compost, nutrients will need to be replaced for the cropping system to be sustainable. Animal manure collection and handling costs are low for dairies where anaerobic digesters are integrated into on-farm waste management
42
operations, but high for pastured animals. In the latter case, manure collection is generally considered infeasible. Transportation costs may limit the size of facilities using more distributed biomass resources such as crop residues, dedicated crops, forest thinnings, and logging slash. The combination of increasing feedstock delivery costs offset by generally declining capital, operating, and product-marketing costs as the facility size increases can lead to an optimum facility size. Where collection and other feedstock acquisition costs are low or offset by tipping fees, such as in the case of urban wood fuels separated from municipal waste, longer transport distances are economically feasible. Due to the low density of some forms of biomass, especially straw bales, truck payload is frequently limited by volume and trucks do not carry the full weight allowed. In order to increase payload, the biomass can be densified, such as by making pellets. The cost of densification must be offset by reduced transportation costs, and is generally justified only for long hauls. However, densification may have other advantages in material handling and conversion, so transportation may not be the only determining factor. Densification is not used currently in the fuel supply infrastructure for existing biomass power plants. Bulk densities of wood chips are sufficiently high that trucks mostly operate near their weight limits. Most facilities using biomass require storage due to the seasonal feedstock production characteristics and to enhance reliability in the case of feedstock supply disruptions. Grains are commonly harvested during the summer and fall, whereas orchards are pruned in the winter and spring. Harvest windows may be quite short. Rice straw, for example, can typically be collected dry only during a six- to eight-week period during the fall. Equipment access to the field following the first rains is often restricted and reentry is generally possible only in the spring after the fields have dried. The process of over-wintering rice straw in the field is actually beneficial in leaching potassium and chlorine to improve combustion properties and recycle nutrient to the field,49 but unpredictable weather patterns lead to uncertainties in planning and risks for field preparation and planting in the spring.50 Orchard removals that supply a large fraction of current agricultural fuel used by the state’s biomass power sector occur throughout the year. The composition of MSW, including the fraction of green waste, fluctuates according to season, and much of food processing waste is highly seasonally dependent. Equipment access to forest lands can be limited by weather conditions both during winter and under extreme fire conditions during the summer. Wood and woody materials are mostly stored uncovered in piles or windrows. Herbaceous materials such as baled straw generally require covered storage over winter to reduce losses. Storage under permanent cover, such as in metal barns,
49 Jenkins, B.M., R.R. Bakker and J.B. Wei. 1996. On the properties of washed straw, Biomass and Bioenergy 10(4):177-200. 50Bakker, R.R. and B.M. Jenkins. 2003. Feasibility of collecting naturally leached rice straw for thermal conversion. Biomass and Bioenergy 25:597-614.

43
tends to be of lower overall cost due to reduced losses compared with tarps and other more temporary shelter,51 but system selection is scale specific.
Impact of fuel cost on cost of energy Feedstock-cost per unit product-output depends on the conversion process efficiency. Fuel contributions to the cost of electricity (COE) for existing solid-fueled biomass power plants purchasing fuel at $20 to 40/dry ton are in the range of $0.02 to 0.05/kWh (Figure 17). The impact of conversion efficiency on COE is a primary driver for research into advanced conversion systems. As noted earlier, at 20% efficiency, each $1/dry ton increment in the cost of fuel increases COE by roughly $0.001/kWh. For comparison, each $10/ton increment in the cost of feedstock to an ethanol production facility adds between $0.07 and 0.14/gallon to the cost of ethanol. Research and development efforts are targeting total production costs below $1.00/gallon, therefore maintaining high conversion efficiency and low feedstock cost are critical.
0.00
0.05
0.10
0.15
0.20
0 20 40 60 80 100
Fuel Cost ($/dry ton)
Co
ntr
ibu
tio
n t
o C
OE
($
/kW
h)
10%
20%
30%
40%
50%
Efficiency5%
Figure 17. Impact of conversion efficiency on the fuel cost contribution to cost of electricity (COE) from biomass.
51 Huisman, W., B.M. Jenkins and M.D. Summers. 2002. Cost evaluation of bale storage systems for rice straw. Proceedings Bioenergy 2002, Omnipress International, Madison, WI.

44
Cumulative resource supply costs Overall, an estimated 33 million tons of the current technical resource might be obtained at average costs below about $40/dry ton including short-haul transportation but excluding storage and processing (Figure 18). Beyond this value, costs begin to increase sharply. This does not mean that the existing solid-fueled biomass industry, using approximately 5 million BDT/y, is able to procure fuel at low cost. Each fuel type has an associated collection cost that can be allocated to the utilization activity. For any single facility, fuel cost might range from zero to $40/BDT or higher depending on the resource available. The average fuel costs of $22 to $40/BDT for the solid-fuel direct combustion sector mentioned earlier are based on an assortment of fuels ranging from sawmill residues to forest thinnings. An example for a single facility using forest thinnings was analyzed through a detailed geographic information system (GIS) model for Plumas County showing how cost varies within a specific fuel class as a function of amount delivered (Figure 19).52 Total feedstock expense to supply the statewide technical resource estimate of 34 million dry tons would exceed $950 million (Figure 20). Landfill gas and biogas from sewage treatment are not considered in this analysis. The resource supply ranking is based on a least cost sorting across all categories of biomass and is only useful for the purposes of estimating the total statewide potential costs.
0
10
20
30
40
50
60
70
80
0 10 20 30 40
Quantity (Million dry tons/y)
Cost
($
/d
ry t
on
)
Manure
s/Pro
cessin
g
Bio
solids/Shells/Pits
Orc
hard
Pru
nin
gs
Fie
ld C
rop R
esid
ues
Vegeta
ble
C
rop R
esid
ues
MSW
--D
ivert
ed
In-Fore
st
Shru
b/C
haparr
al
Dedic
ate
d C
rops
Mill
Resid
ues/M
anure
s
Figure 18. Estimated overall statewide biomass resource cost curve, 2005 technical
resource base (excludes storage and on-site processing and handling costs).
52 Chalmers, S., B. Hartsough, and M. De Lasaux. 2003. Develop a GIS-based tool for estimating supply curves for forest thinnings and residues to biomass facilities in California, Final Report, WRBEP Contract 55044.

45
0
20
40
60
80
100
120
140
0 1 2 3 4
Quantity (Million dry tons/y)
Co
st
($/d
ry t
on
)
Figure 19. In-forest thinnings biomass resource cost curve for a single site location in California.53
Figure 20. Cumulative estimated least-cost statewide feedstock costs, 2005 technical resource base.54
53 Chalmers, et al., 2003, op cit. 54 Based on California Biomass Collaborative, 2004, op cit.

46
Appendix
Figure A1. California counties.