Embed Size (px)
Citation preview
Biomechanical Quantification of the Dynamic Knee
Valgus using Inertial Sensor System MyoMotion®
Master Thesis
For the attainment of the academic degree
Master of Science (M.Sc.)
of the
Justus – Liebig – Universität Gießen / Technische Hochschule Mittelhessen
M.Sc. course of studies “Biomechanik – Motorik – Bewegungsanalyse“
Presented by:
Teufl Wolfgang
Matriculation number:
6077685
First reviewer:
Prof. Dr. Jörg Subke
Second reviewer:
Dr. Peter Konrad, Noraxon Inc.
Submitted on:

I
Table of contents
Table of contents ........................................................................................................................................................ I
List of Abbreviations ............................................................................................................................................... III
List of Figures ......................................................................................................................................................... IV
List of Tables ........................................................................................................................................................ VIII
List of Appendices .................................................................................................................................................. IX
Abstract .................................................................................................................................................................... X
1 Introduction ......................................................................................................................................................1
1.1 Hypothesis...............................................................................................................................................3
2 Fundamentals ...................................................................................................................................................4
2.1 The knee – anatomy, physiology and biomechanics .................................................................................4
2.2 Knee Valgus .......................................................................................................................................... 11
2.3 Possibilities of Quantification ................................................................................................................ 14
3 Materials & Methods ...................................................................................................................................... 16
3.1 Subjects ................................................................................................................................................. 16
3.2 Materials ............................................................................................................................................... 16
3.3 IMU Technology ................................................................................................................................... 17
3.4 Measurement location and setting .......................................................................................................... 21
3.5 Subject preparation ................................................................................................................................ 23
3.6 Test procedure ....................................................................................................................................... 25
3.7 Data acquisition ..................................................................................................................................... 29
3.8 Data analysis ......................................................................................................................................... 29
3.9 Statistical analysis ................................................................................................................................. 30
4 Results ............................................................................................................................................................ 32
4.1 General outcome ................................................................................................................................... 32
4.2 Symmetry of the lower extremity........................................................................................................... 39
4.3 Group differences .................................................................................................................................. 40

II
4.4 FPPA correlation ................................................................................................................................... 40
4.5 Leg Axis Score (LAS) ........................................................................................................................... 42
5 Discussion ...................................................................................................................................................... 46
5.1 Surface marker artifacts ......................................................................................................................... 46
5.2 Calibration position ............................................................................................................................... 49
5.3 Selection of test exercises ...................................................................................................................... 51
5.4 LAS ....................................................................................................................................................... 53
5.5 Selected Analysis Example .................................................................................................................... 58
5.6 Frontal Plane Projection Angle .............................................................................................................. 60
5.7 Limitations of the study ......................................................................................................................... 61
5.8 Hypothesis............................................................................................................................................. 64
6 Conclusion...................................................................................................................................................... 64
List of cited Literature ................................................................................................................................................ i
Eidesstaatliche Erklärung ......................................................................................................................................... vi
Appendix ................................................................................................................................................................ vii

III
List of Abbreviations
ACL anterior cruciate ligament
ACLR anterior cruciate ligament rupture
DKV dynamic knee valgus
DJ drop jump
FCL fibular collateral ligament
FPPA Frontal Plane Projection Angle
FS Full Squat
Fz Force along the Z axis
HfD Hop for Distance
IC Initial Contact
IMU Inertial Measurement Unit
KV knee valgus
LAS Leg Axis Score
LT left
Max maximum knee flexion
MM MyoMotion
MR3 MyoResearch 3
PCL posterior cruciate ligament
RT right
SLS Single Leg Squat
TCL tibial collateral ligament
IV
List of Figures
Figure 1: Results Markolf et al. Knee valgus movement and knee rotation .................................................................5
Figure 2: Results from Lafortune et al. Knee Abd/Add (left) and Int/Ext rotation (right) during gait ..........................6
Figure 3: Results from Kaiser et al. Knee Abd/Add (left) and Int/Ext Rotation (right) during simulated Loading
Response....................................................................................................................................................................7
Figure 4: Results from Shin et al. ...............................................................................................................................8
Figure 5: Results from Li et al ....................................................................................................................................8
Figure 6: Frontal plane knee angle according to Russel et al ..................................................................................... 10
Figure 7: Knee Abduction ........................................................................................................................................ 11
Figure 8: 2D frontal plane medial motion of the knee is called knee valgus .............................................................. 12
Figure 9: DKV as complex 3D motion ..................................................................................................................... 13
Figure 10: reference coordinate system (black), IMU coordinate system (blue), quaternion (red) ............................. 18
Figure 11: MM Sensor (left) and Receiver (right) ..................................................................................................... 19
Figure 12: Designation of the orientations ................................................................................................................ 19
Figure 13: Possible calibration position along neutral zero position .......................................................................... 20
Figure 14: 3D avatar from the measurement software MR3 ...................................................................................... 21
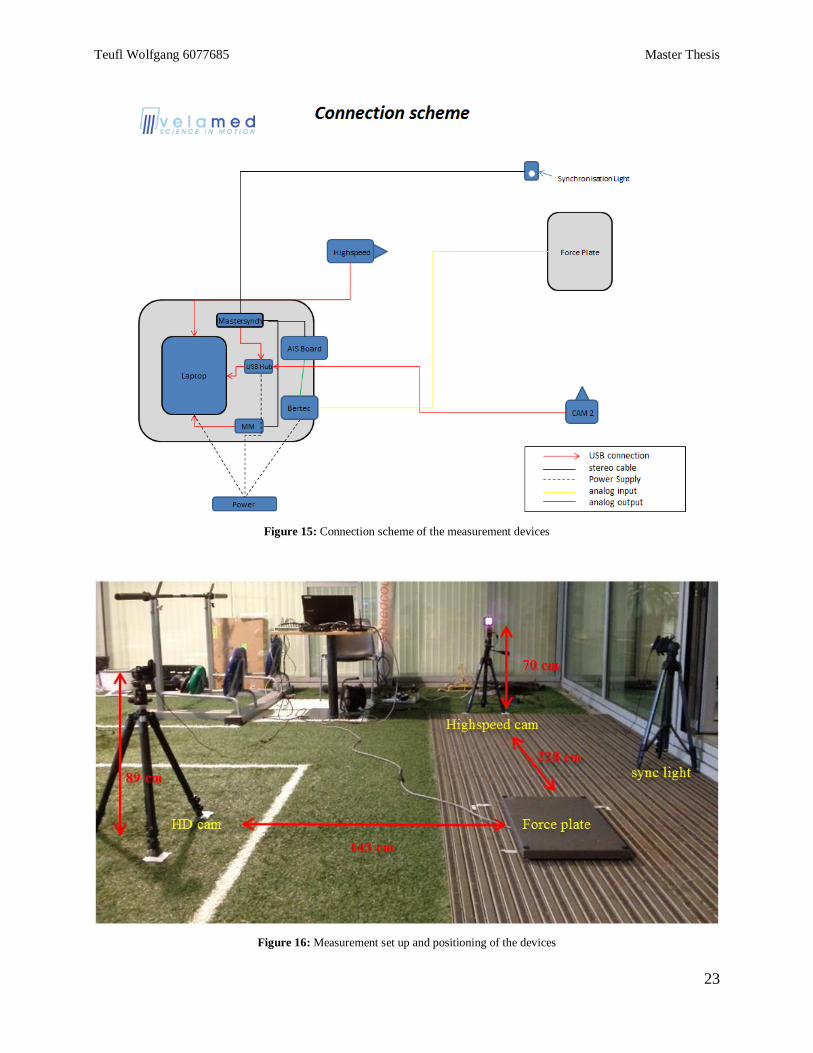
Figure 15: Connection scheme of the measurement devices ..................................................................................... 22
Figure 16: Measurement set up and positioning of the devices ................................................................................. 22
Figure 17: Measuring station .................................................................................................................................... 23
Figure 18: Sensor application lower limb ................................................................................................................. 24
Figure 19: Sensor application lower back ................................................................................................................. 25
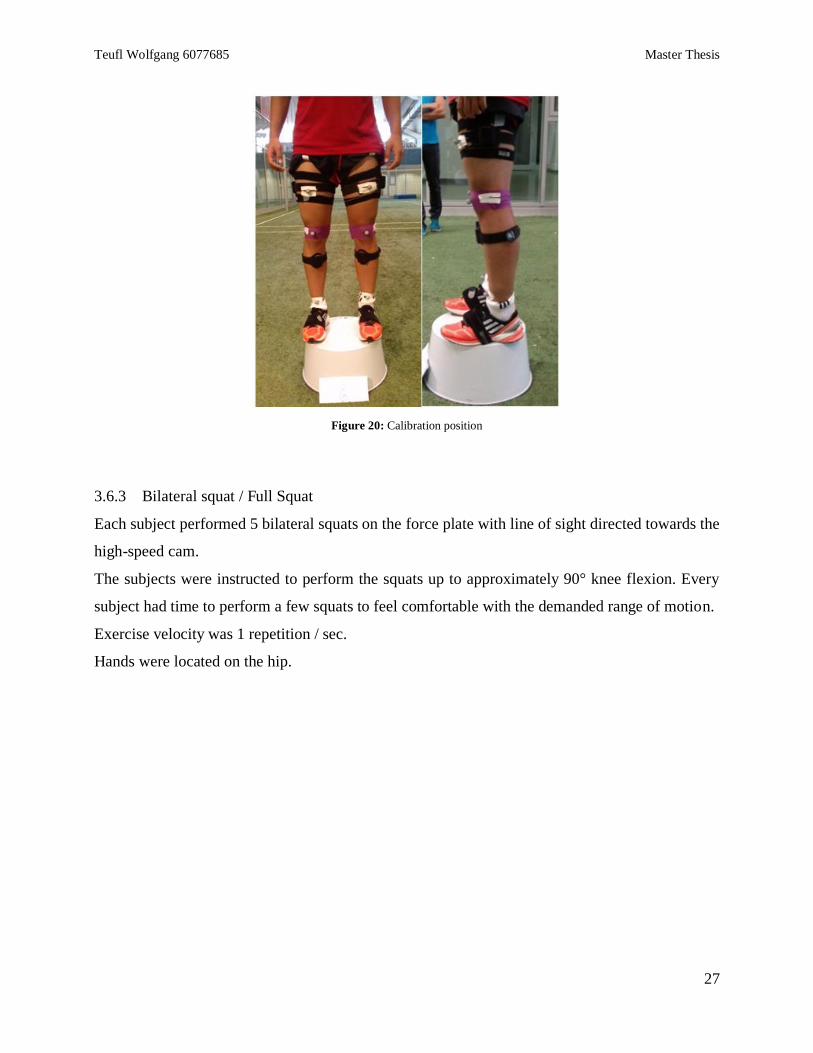
Figure 20: Calibration position ................................................................................................................................. 26
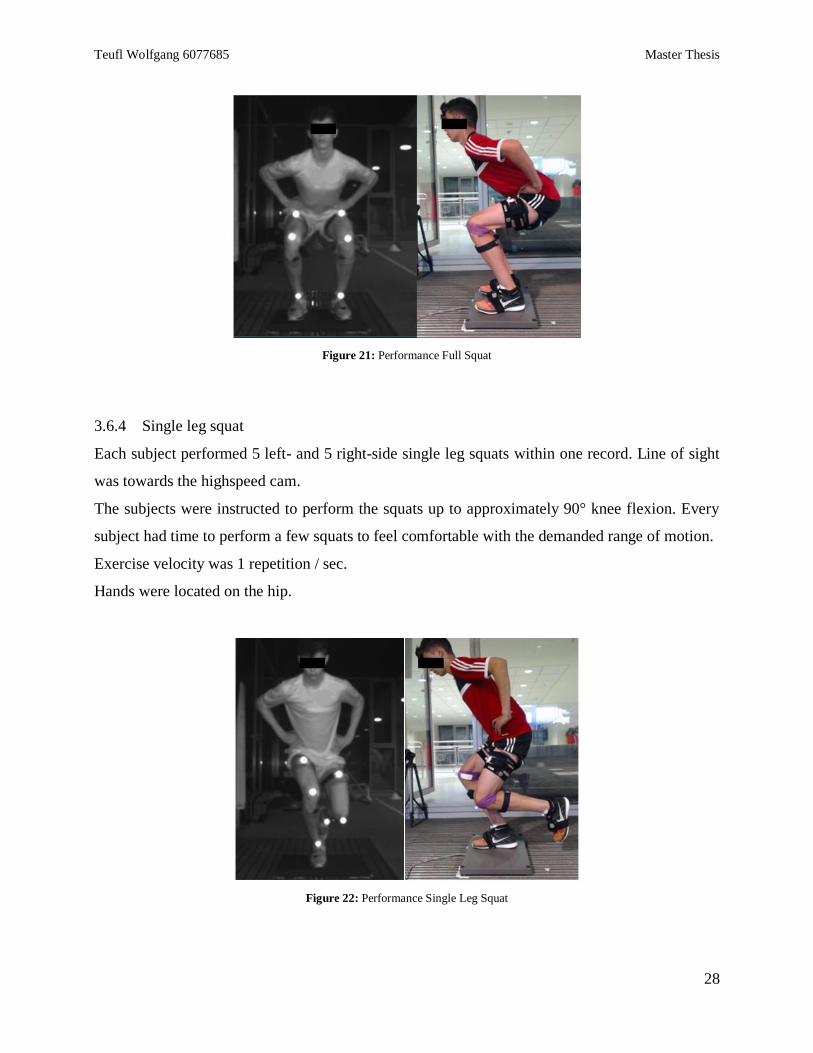
Figure 21: Performance Full Squat ........................................................................................................................... 27
Figure 22: Performance Single Leg Squat ................................................................................................................ 27
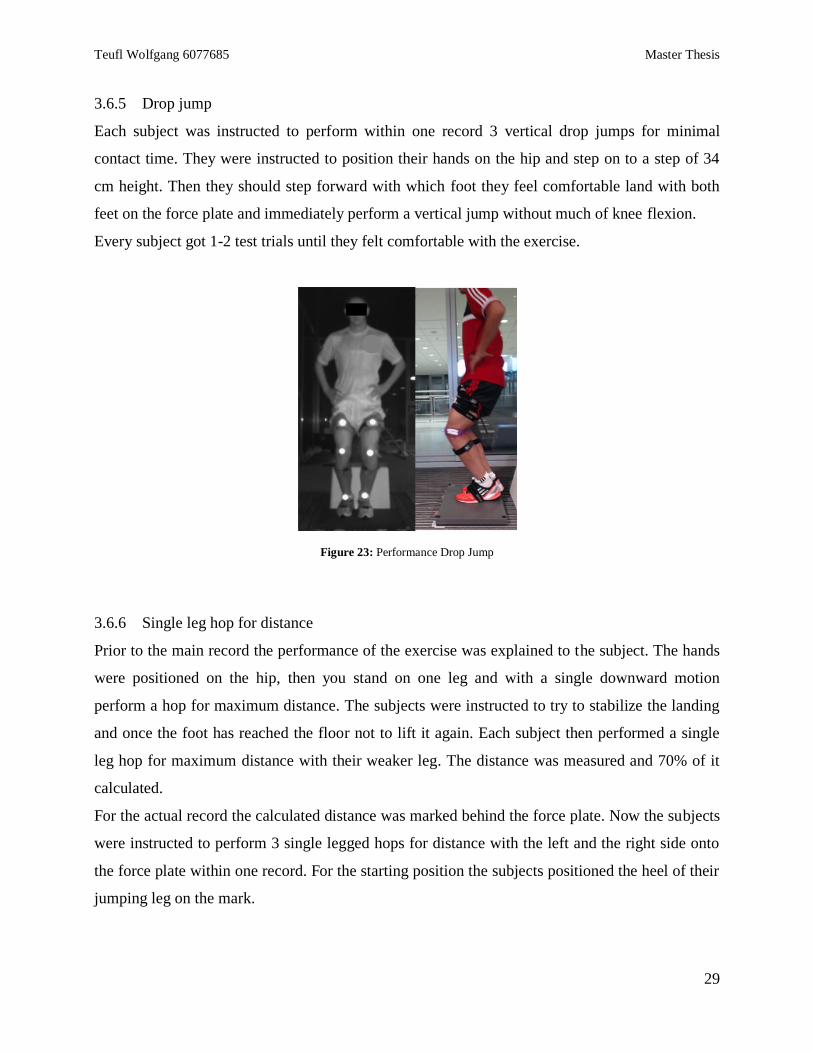
Figure 23: Performance Drop Jump .......................................................................................................................... 28
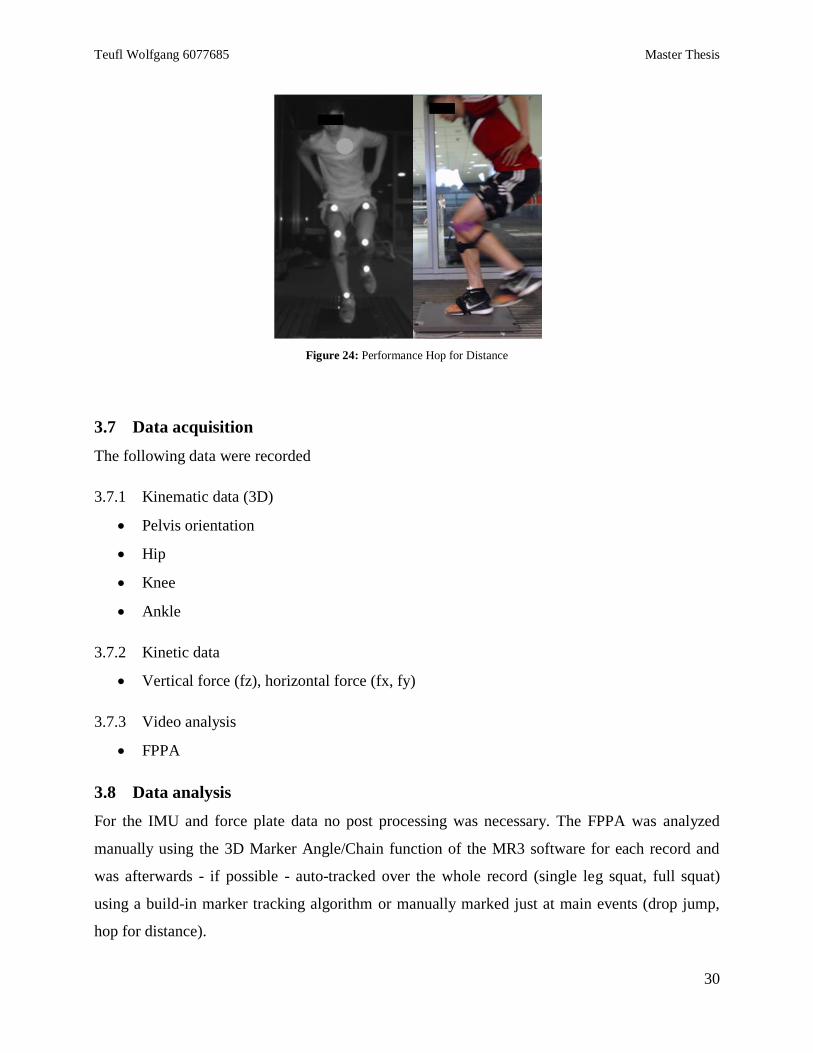
Figure 24: Performance Hop for Distance ................................................................................................................ 29
Figure 25: LT vs RT average hip flexion / abduction (left) and knee flexion / abduction (right) for FS; +/- 1 SD in
time normalized movement cycle ............................................................................................................................. 33
Figure 26: LT vs RT average hip flexion / abduction (left) and knee flexion / abduction (right) for SLS; +/- 1 SD in
time normalized movement cycle ............................................................................................................................. 34
Figure 27: Average pelvis roll LT (left) vs RT (right); +/- 1 SD in time normalized movement cycle ....................... 35
Figure 28: LT vs RT average knee flexion / abduction / rotation for Drop Jump from IC to Max; +/- 1 SD in time
normalized movement cycle ..................................................................................................................................... 37
Figure 29: LT vs RT Pelvis roll (above) and Fz (below); +/- 1 SD in time normalized movement cycle .................. 39
Figure 30: Linear regression for LT FPPA vs LT hip abduction and knee abduction in Full Squat ............................ 43
Figure 31: Linear regression for LT FPPA vs LT hip rotation................................................................................... 44
Figure 32: Data from Benoit et al; walking task (left) and cutting task (right) ........................................................... 47

V
Figure 33: knee abd(-)/add(+) and internal(+)/external(-) rotation during the step up task; fluoroscopy (solid black
line), the most accurate skin-marker cluster (dotted black line), the least accurate skin-marker cluster (dashed black
line), and the best overall skin-marker cluster (gray solid line)12 ............................................................................. 48
Figure 34: Fixation of the thigh sensor using a synthetic plate and extra straps ......................................................... 49
Figure 35: Calibration position of two different subjects. After the calibration both present the neutral zero position
of all joint angle data ................................................................................................................................................ 50
Figure 36: Calibration position of two different subjects; sagittal plane .................................................................... 50
Figure 37: Video and 3D avatar of a Single Leg Squat at Max of a random subject .................................................. 52
Figure 38: Video and 3D avatar of a HfD at Max of the same subject....................................................................... 52
Figure 39: Linear regression LT (left) and RT (right) pelvis roll vs hip abduction; SLS ............................................ 55
Figure 40: Linear regression RT FPPA vs RT pelvis roll; SLS ................................................................................. 56
Figure 41: Video and 3D avatar for one SLS at Max of subject 7 ............................................................................. 58
Figure 42: Video and 3D avatar for one SLS at Max of subject 5 ............................................................................. 59
Figure 43: FPPA of two SLS at Max for subject 4; position 1 (left), position 2 (right) .............................................. 60
Figure 44: Force plate used in the study, height 7.5mm ............................................................................................ 63
Figure 45: Force Vector Video Overlay of a SLS at Max ......................................................................................... 63
Figure 46: LT Hip Flexion Full Squat all subjects ................................................................................................... vii
Figure 47: RT Hip Flexion Full Squat all subjects ................................................................................................... vii
Figure 48: LT Hip Abduction Full Squat all subjects ............................................................................................. viii
Figure 49: RT Hip Abduction Full Squat all subjects.............................................................................................. viii
Figure 50: LT Hip Rotation – out Full Squat all subjects .......................................................................................... ix
Figure 51: RT Hip Rotation – out Full Squat all subjects .......................................................................................... ix
Figure 52: LT Knee Flexion Full Squat all subjects ....................................................................................................x
Figure 53: RT Knee Flexion Full Squat all subjects ....................................................................................................x
Figure 54: LT Knee Rotation – out Full Squat all subjects ........................................................................................ xi
Figure 55: RT Knee Rotation – out Full Squat all subjects ....................................................................................... xi
Figure 56: LT Knee Abduction Full Squat all subjects ............................................................................................ xii
Figure 57: RT Knee Abduction Full Squat all subjects ............................................................................................ xii
Figure 58: LT Ankle Inversion Full Squat all subjects ............................................................................................ xiii
Figure 59: RT Ankle Inversion Full Squat all subjects ............................................................................................ xiii
Figure 60: LT Hip Flexion Single Leg Squat all subjects .........................................................................................xiv
Figure 61: RT Hip Flexion Single Leg Squat all subjects ........................................................................................xiv
Figure 62: LT Hip Abduction Single Leg Squat all subjects ..................................................................................... xv
Figure 63: RT Hip Abduction Single Leg Squat all subjects ..................................................................................... xv
Figure 64: LT Hip Rotation – out Single Leg Squat all subjects ..............................................................................xvi
Figure 65: RT Hip Rotation – out Single Leg Squat all subjects ..............................................................................xvi
Figure 66: LT Knee Flexion Single Leg Squat all subjects .................................................................................... xvii
Figure 67: RT Knee Flexion Single Leg Squat all subjects .................................................................................... xvii

VI
Figure 68: LT Knee Rotation – out Single Leg Squat all subjects ......................................................................... xviii
Figure 69: RT Knee Rotation – out Single Leg Squat all subjects ......................................................................... xviii
Figure 70: LT Knee Abduction Single Leg Squat all subjects ..................................................................................xix
Figure 71: RT Knee Abduction Single Leg Squat all subjects ..................................................................................xix
Figure 72: LT Ankle Inversion Single Leg Squat all subjects ................................................................................... xx
Figure 73: RT Ankle Inversion Single Leg Squat all subjects ................................................................................... xx
Figure 74: LT Hip Flexion Drop Jump all subjects ..................................................................................................xxi
Figure 75: RT Hip Flexion Drop Jump all subjects ..................................................................................................xxi
Figure 76: LT Hip Abduction Drop Jump all subjects ........................................................................................... xxii
Figure 77: RT Hip Abduction Drop Jump all subjects ........................................................................................... xxii
Figure 78: LT Hip Rotation – out Drop Jump all subjects ..................................................................................... xxiii
Figure 79: RT Hip Rotation – out Drop Jump all subjects .................................................................................... xxiii
Figure 80: LT Knee Flexion Drop Jump all subjects .............................................................................................. xxiv
Figure 81: RT Knee Flexion Drop Jump all subjects ............................................................................................. xxiv
Figure 82: LT Knee Rotation – out Drop Jump all subjects .................................................................................... xxv
Figure 83: RT Knee Rotation – ou Drop Jump all subjects .................................................................................... xxv
Figure 84: LT Knee Abduction Drop Jump all subjects ......................................................................................... xxvi
Figure 85: RT Knee Abduction Drop Jump all subjects ......................................................................................... xxvi
Figure 86: LT Ankle Inversion Drop Jump all subjects.........................................................................................xxvii
Figure 87: RT Ankle Inversion Drop Jump all subjects ........................................................................................xxvii
Figure 88: LT Hip Flexion Hop for Distance all subjects .................................................................................... xxviii
Figure 89: RT Hip Flexion Hop for Distance all subjects ................................................................................... xxviii
Figure 90: LT Hip Abduction Hop for Distance all subjects .................................................................................. xxix
Figure 91: RT Hip Abduction Hop for Distance all subjects .................................................................................. xxix
Figure 92: LT Hip Rotation – out Hop for Distance all subjects ............................................................................. xxx
Figure 93: RT Hip Rotation – out Hop for Distance all subjects ............................................................................. xxx
Figure 94: LT Knee Flexion Hop for Distance all subjects .................................................................................... xxxi
Figure 95: RT Knee Flexion Hop for Distance all subjects .................................................................................... xxxi
Figure 96: LT Knee Rotation – out Hop for Distance all subjects .........................................................................xxxii
Figure 97: RT Knee Rotation – out Hop for Distance all subjects ........................................................................xxxii
Figure 98: LT Knee Abduction Hop for Distance all subjects ............................................................................. xxxiii
Figure 99: RT Knee Abduction Hop for Distance all subjects ............................................................................. xxxiii
Figure 100: LT Ankle Inversion Hop for Distance all subjects ............................................................................ xxxiv
Figure 101: RT Ankle Inversion Hop for Distance all subjects ............................................................................ xxxiv
Figure 102: Linear regression for LT FPPA vs LT knee rotation - out ................................................................. xxxv
Figure 103: Linear regression for LT FPPA vs LT hip rotation - out.................................................................... xxxv
Figure 104: Linear regression for LT FPPA vs LT ankle inversion ...................................................................... xxxvi
Figure 105: Linear regression for LT FPPA vs LT hip abduction ........................................................................ xxxvi
VII
Figure 106: Linear regression for RT FPPA vs RT hip rotation - out .................................................................. xxxvii
Figure 107: Linear regression for RT FPPA vs RT knee rotation - out ................................................................ xxxvii
Figure 108: Linear regression for RT FPPA vs RT knee abduction ....................................................................xxxviii
Figure 109: Linear regression for RT FPPA vs RT ankle inversion ...................................................................xxxviii
Figure 110: Linear regression for LT FPPA vs LT hip abduction ........................................................................ xxxix
Figure 111: Linear regression for LT FPPA vs LT hip rotation - out.................................................................... xxxix
Figure 112: Linear regression for LT FPPA vs LT knee rotation - out ...................................................................... xl
Figure 113: Linear regression for LT FPPA vs LT knee abduction ........................................................................... xl
Figure 114: Linear regression for LT FPPA vs LT ankle inversion .......................................................................... xli
Figure 115: Linear regression for RT FPPA vs RT hip abduction ............................................................................ xli
Figure 116: Linear regression for RT FPPA vs RT hip rotation - out ...................................................................... xlii
Figure 117: Linear regression for RT FPPA vs RT knee rotation - out .................................................................... xlii
Figure 118: Linear regression for RT FPPA vs RT knee abduction ........................................................................ xliii
Figure 119: Linear regression for RT FPPA vs RT ankle inversion ....................................................................... xliii
Figure 120: Linear regression for LT FPPA vs LT hip abduction .......................................................................... xliv
Figure 121: Linear regression for LT FPPA vs LT hip rotation - out...................................................................... xliv
Figure 122: Linear regression for LT FPPA vs LT knee rotation - out .....................................................................xlv
Figure 123: Linear regression for LT FPPA vs LT knee abduction ..........................................................................xlv
Figure 124: Linear regression for LT FPPA vs LT ankle inversion ........................................................................ xlvi
Figure 125: Linear regression for RT FPPA vs RT hip abduction .......................................................................... xlvi
Figure 126: Linear regression for RT FPPA vs RT hip rotation - out .................................................................... xlvii
Figure 127: Linear regression for RT FPPA vs RT knee rotation - out .................................................................. xlvii
Figure 128: Linear regression for RT FPPA vs RT knee abduction ...................................................................... xlviii
Figure 129: Linear regression for RT FPPA vs RT ankle inversion ..................................................................... xlviii
Figure 130: Linear regression for LT FPPA vs LT hip abduction .......................................................................... xlix
Figure 131: Linear regression for LT FPPA vs LT hip rotation - out...................................................................... xlix
Figure 132: Linear regression for LT FPPA vs LT knee rotation - out ........................................................................ l
Figure 133: Linear regression for LT FPPA vs LT knee abduction ............................................................................. l
Figure 134: Linear regression for LT FPPA vs LT ankle inversion ............................................................................ li
Figure 135: Linear regression for RT FPPA vs RT hip abduction .............................................................................. li
Figure 136: Linear regression for RT FPPA vs RT hip rotation - out ........................................................................ lii
Figure 137: Linear regression for RT FPPA vs RT knee rotation - out ...................................................................... lii
Figure 138: Linear regression for RT FPPA vs RT knee abduction .......................................................................... liii
Figure 139: Linear regression for RT FPPA vs RT ankle inversion ......................................................................... liii
VIII
List of Tables
Table 1: Subject information .................................................................................................................................... 16
Table 2: Descriptive statistics of all angle data in Full Squat at max knee flexion position for all subjects ................ 32
Table 3: Descriptive statistics of all angle data in Single Leg Squat at max knee flexion position for all subjects ..... 34
Table 4: Descriptive statistics of all angle data in drop jump at IC (left) and Max (right) for all subjects .................. 36
Table 5: Descriptive statistics of all angle data in hop for distance at IC (left) and Max (right) for all subjects ......... 38
Table 6: Comparison of selected 3D kinematics, FPPA and Fz between left and right side differences; significant
values are marked with an asterisk ........................................................................................................................... 40
Table 7: Spearman correlation LT FPPA vs LT anatomical angles (left) and RT FPPA vs RT anatomical angles
(right) for FS ............................................................................................................................................................ 41
Table 8: Pearson correlation LT FPPA vs LT anatomical angles (left) and RT FPPA vs RT anatomical angles for
SLS .......................................................................................................................................................................... 41
Table 9: Spearman correlation LT FPPA vs LT anatomical angles (left) and RT FPPA vs RT anatomical angles for
DJ ............................................................................................................................................................................ 42
Table 10: Spearman correlation LT FPPA vs LT anatomical angles (left) and RT FPPA vs RT anatomical angles for
HfD ......................................................................................................................................................................... 42
Table 11: Spearman correlation RT LAS vs RT FPPA and LT LAS vs LT FPPA for SLS........................................ 45
Table 12: Spearman correlation RT LAS vs RT FPPA and LT LAS vs LT FPPA for DJ .......................................... 45
Table 13: Kinematic data of all subjects; SLS (left) and HfD (right). Consider the differences in Hip Abduction and
Pelvis Roll ............................................................................................................................................................... 53
Table 14: Average anatomical angles of the frontal plane for HfD at IC (left) and Max (right) ................................. 57
Table 15: Average anatomical angles of the transversal plane for HfD at IC (left) and Max (right)........................... 57
Table 16: Changes in ROM from IC to Max for average HfD .................................................................................. 57
Table 17: Kinematic data from one SLS at Max of a random subject (left) and the excluded subject (right) ............. 58
Table 18: LAS and FPPA for one SLS at Max for subject 7 and 5 ............................................................................ 59
Table 19: 3D kinematic data of two SLS (position 1 / position 2) at Max for subject 4 ............................................. 61
IX
List of Appendices
I Full Squat – Anatomical Angles ........................................................................................................................... vii
II Single Leg Squat – Anatomical Angles ................................................................................................................xiv
III Drop Jump – Anatomical Angles ........................................................................................................................xxi
IV Hop for Distance – Anatomical Angles ......................................................................................................... xxviii
V. Linear regression FPPA vs IMU kinematics .................................................................................................... xxxv
V.I Full Squat ...................................................................................................................................................... xxxv
V.II Single Leg Squat.......................................................................................................................................... xxxix
V.III Drop Jump.................................................................................................................................................... xliv
V.IV Hop for Distance .......................................................................................................................................... xlix
VI. Technical Specifications ................................................................................................................................... liv
VI.I - MyoMotion ................................................................................................................................................... liv
VI.II – Force Plate ................................................................................................................................................... lv
VI.III – AIS Board .................................................................................................................................................. lvi
VI.IV – Analog & Digital Amplifier AM 6800....................................................................................................... lvii
VI.V – Highspeed Camera “Optitrack“ ................................................................................................................. lviii
VI.VI – HD Webcam “Logitech C920” ................................................................................................................... lix
X
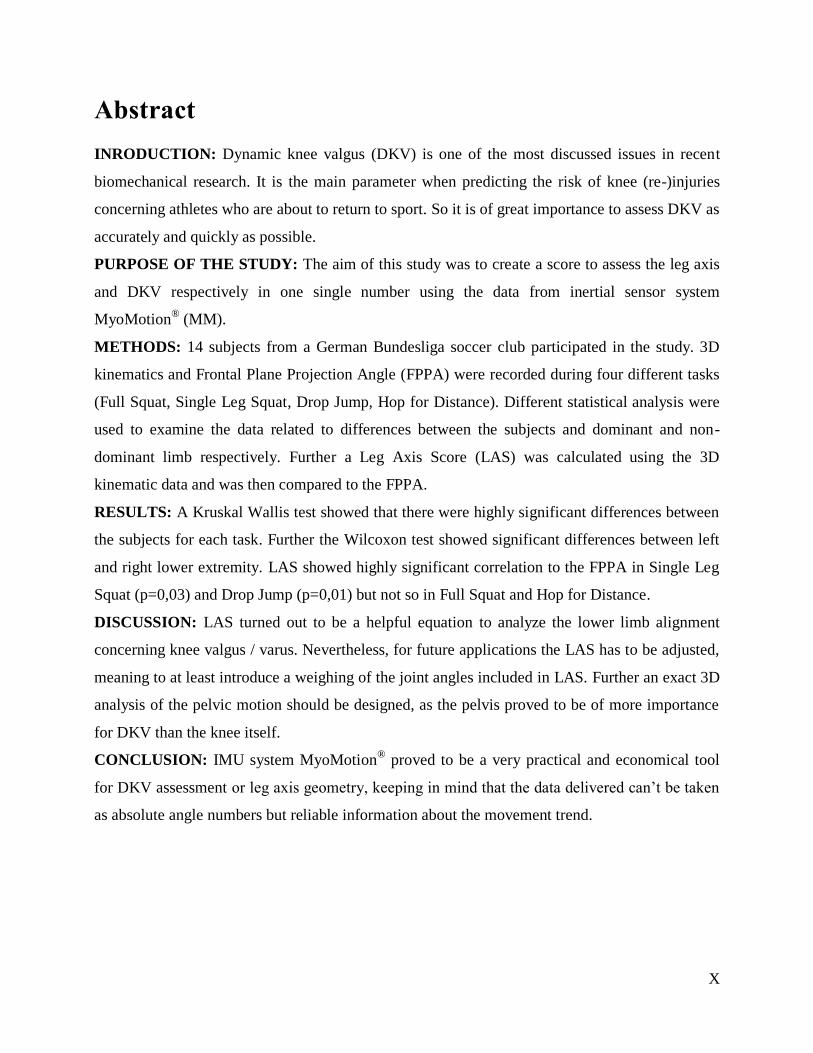
Abstract
INRODUCTION: Dynamic knee valgus (DKV) is one of the most discussed issues in recent
biomechanical research. It is the main parameter when predicting the risk of knee (re-)injuries
concerning athletes who are about to return to sport. So it is of great importance to assess DKV as
accurately and quickly as possible.
PURPOSE OF THE STUDY: The aim of this study was to create a score to assess the leg axis
and DKV respectively in one single number using the data from inertial sensor system
MyoMotion® (MM).
METHODS: 14 subjects from a German Bundesliga soccer club participated in the study. 3D
kinematics and Frontal Plane Projection Angle (FPPA) were recorded during four different tasks
(Full Squat, Single Leg Squat, Drop Jump, Hop for Distance). Different statistical analysis were
used to examine the data related to differences between the subjects and dominant and non-
dominant limb respectively. Further a Leg Axis Score (LAS) was calculated using the 3D
kinematic data and was then compared to the FPPA.
RESULTS: A Kruskal Wallis test showed that there were highly significant differences between
the subjects for each task. Further the Wilcoxon test showed significant differences between left
and right lower extremity. LAS showed highly significant correlation to the FPPA in Single Leg
Squat (p=0,03) and Drop Jump (p=0,01) but not so in Full Squat and Hop for Distance.
DISCUSSION: LAS turned out to be a helpful equation to analyze the lower limb alignment
concerning knee valgus / varus. Nevertheless, for future applications the LAS has to be adjusted,
meaning to at least introduce a weighing of the joint angles included in LAS. Further an exact 3D
analysis of the pelvic motion should be designed, as the pelvis proved to be of more importance
for DKV than the knee itself.
CONCLUSION: IMU system MyoMotion® proved to be a very practical and economical tool
for DKV assessment or leg axis geometry, keeping in mind that the data delivered can’t be taken
as absolute angle numbers but reliable information about the movement trend.
Teufl Wolfgang 6077685 Master Thesis
1
1 Introduction
One of the biggest issues in recent medical literature is the injury risk concerning young athletes.
Many known researchers have intensively examined this area in the past few years1,2,3
. Most of
them were primary concerned with high school athletes4.
They mainly focused on biomechanical injury mechanisms, rehabilitation programs from early on
up to the return to sport level5 and screening tests for better prediction of biomechanical risk
factors6.
Due to enormous medical social system costs7 in the US prediction of knee injury risk becomes
more and more important.
The knee is known to be the most affected joint of the lower extremity when it comes to non-
contact injuries in sport8. And one of the most mentioned factors of knee injury risk is the weak
leg axis alignment, often referred to as dynamic knee valgus (DKV)9. According to the findings
of Hewett et al.10
and others DKV originates not only in the knee joint but is a complex 3
dimensional occurrence concerning all joints of the lower limb and most probably the whole
body.
To quickly assess the knee injury risk of for example a soccer cadre, it is important to have a tool
with which the measurement is quickly and easily assembled.
For this purpose the Inertial Sensor System MyoMotion® was used. Inertial Measurement Units
(IMU) have the big advantage of being laboratory unbound.
However, it is essential to be familiar with the basics of anatomy and physiology of the human
knee to know what is to be expected when interpreting the 3D kinematics delivered from IMU.
Like 3D motion capture infrared camera systems IMU is also a surface marker system.
1 Hewett et al. 1996
2 Hewett et al. 2005
3 Hewett E. T.,* PhD, Lindenfeld Thomas N., MD, Riccobene Jennifer V., Noyes Frank R., MD 1999
4 Ford et al. 2003
5 Myer et al. 2012
6 Boling et al. 2009
7 Hewett E. T.,* PhD, Lindenfeld Thomas N., MD, Riccobene Jennifer V., Noyes Frank R., MD 1999
8 Powers 2010, p.42
9 Hewett et al. 2005
10 Hewett et al. 2005
Teufl Wolfgang 6077685 Master Thesis
2
The kinematic data from surface marker systems are affected by soft tissue artifacts1,2
. It is
inevitable to get a hint of the IMU data reliability. For it is not to be expected that the 3D
kinematic data match the absolute underlying bone movement but as long as a repeatable pattern
is existent interpretation is possible.
For this purpose bone pin studies3 deliver valid and reliable data showing clearly a difference
between skin mounted marker systems and actual bone movement. Nevertheless they show
evidence that the surface marker systems deliver a repeatable pattern (see discussion).
In the chapters “Fundamentals” and “Discussion”, this issue will be closely discussed.
DKV is a complex 3D movement. For quick assessment of injury risk or over all leg axis
alignment it is important to extract the most concerning kinematic data and set them off against
each other, delivering a definite score.
There is one relevant score yet concerning the present issue. “The Landing Error Scoring
System” includes whole body movement analyzing the quality of jumping tasks45,
.
The aim of this study is to validate the possibilities of using a fully mobile 3D inertial sensor
system for the analysis of the leg geometry, especially the DKV as an acknowledged injury risk
predictor of young athletes during different basic and advanced tasks. The second focus to
develop an easy to calculate score from the IMU kinematic data to classify the leg axis/DKV.
1 Akbarshahi et al. 2010
2 M. Sangeux, F. Marin, F. Charleux, L. Dürselen, M.C. Ho Ba Tho 2006
3 Benoit et al. 2006
4 Padua et al. 2009
5 Padua et al. 2015
Teufl Wolfgang 6077685 Master Thesis
3
1.1 Hypothesis
1.1.1 Hypothesis 1
H1.1:
There is a correlation between the 3D kinematic data delivered from the IMU system and the
FPPA from the left and right side respectively.
H0:
There is no correlation between the 3D kinematic data delivered from the IMU system and the
FPPA from the left and right side respectively.
1.1.2 Hypothesis 2
H1: There can be developed a score to calculate the dimension of the dynamic knee valgus.
The result of this score shows a positive correlation with the FPPA.
H0: There can’t be developed a score to calculate the dimension of the dynamic knee valgus.
The result of this score shows no positive correlation with the FPPA.
Teufl Wolfgang 6077685 Master Thesis
4
2 Fundamentals
2.1 The knee – anatomy, physiology and biomechanics
It is eminent to know the main facts about the probably mostly discussed human joint of recent
research.
While the proximal femur end is secured in the acetabulum of the pelvis with the most solid
ligaments in the human body (e.g: lig. Iliotibale) and strong muscles (e.g: M. gluteus maximus),
the distal end is connected to the tibia only through soft tissue restraints1.
The knee possesses the theoretical potential to perform 3 dimensional motions. But in reality only
the motions in the sagittal and transversal plane can be arbitrarily performed. Movement in the
frontal plane reaches only small values according to physiology because it is restricted through
four ligaments (ACL, PCL, TCL, FCL) 2,3
.
Further one has to consider if examining the frontal plane of the knee that because of the structure
of the tibia plateau the physiology shows a valgus position in the frontal plane of about 10-12°4.
With these basic facts in mind it is now important to ponder what actually can be expected from
the knee when it comes down to different demands.
Therefore Markolf et al5 examined cadaveric knees (mean age 32.2 years) with support of a
mechanical fixture which allowed to produce up to 500 N axial force on the tibia during a passive
flexion – extension cycle. They examined knee rotation, knee valgus/varus, tibial anterior
displacement and ACL torques first with intact ACL later with removed ACL.
In the following figure 1 the results from knee rotation and knee valgus/varus are shown.
1 Schünke et al. 2005
2 Platzer 2013
3 Debrunner und Schweizerische Arbeitsgemeinschaft für Osteosynthesefragen 1971
4 Rondinelli et al. 2008
5 Markolf et al. 2014
Teufl Wolfgang 6077685 Master Thesis
5
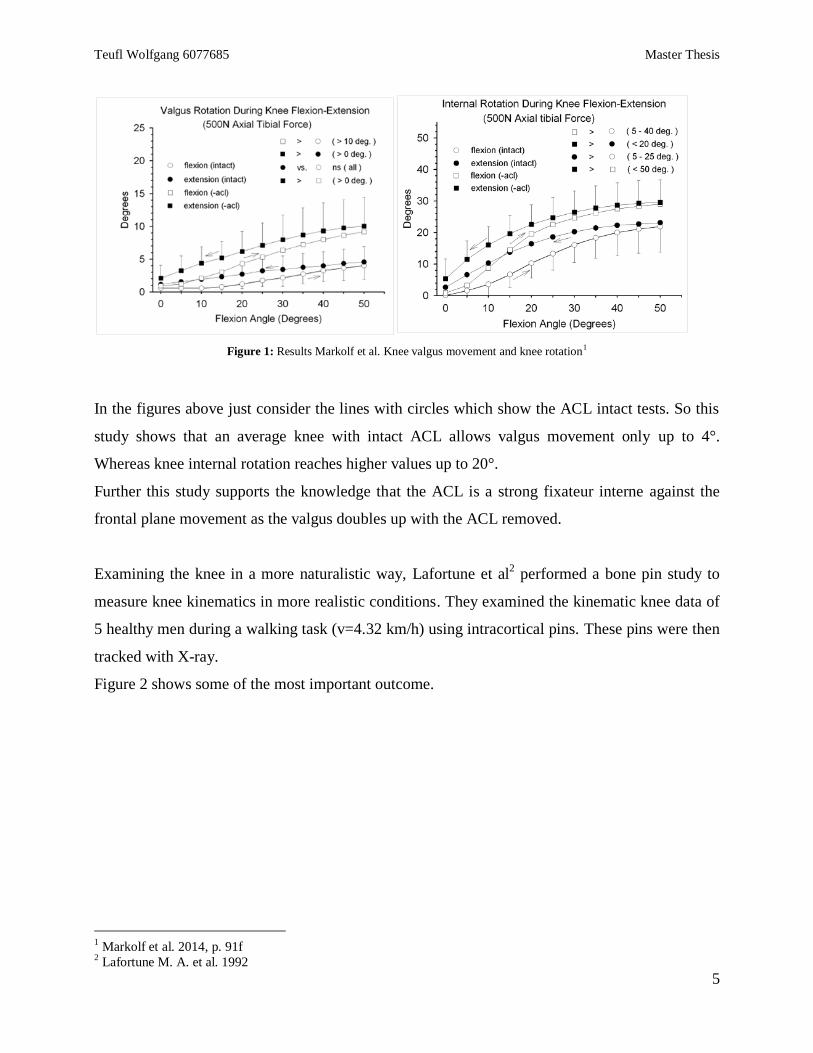
Figure 1: Results Markolf et al. Knee valgus movement and knee rotation1
In the figures above just consider the lines with circles which show the ACL intact tests. So this
study shows that an average knee with intact ACL allows valgus movement only up to 4°.
Whereas knee internal rotation reaches higher values up to 20°.
Further this study supports the knowledge that the ACL is a strong fixateur interne against the
frontal plane movement as the valgus doubles up with the ACL removed.
Examining the knee in a more naturalistic way, Lafortune et al2 performed a bone pin study to
measure knee kinematics in more realistic conditions. They examined the kinematic knee data of
5 healthy men during a walking task (v=4.32 km/h) using intracortical pins. These pins were then
tracked with X-ray.
Figure 2 shows some of the most important outcome.
1 Markolf et al. 2014, p. 91f
2 Lafortune M. A. et al. 1992
Teufl Wolfgang 6077685 Master Thesis
6
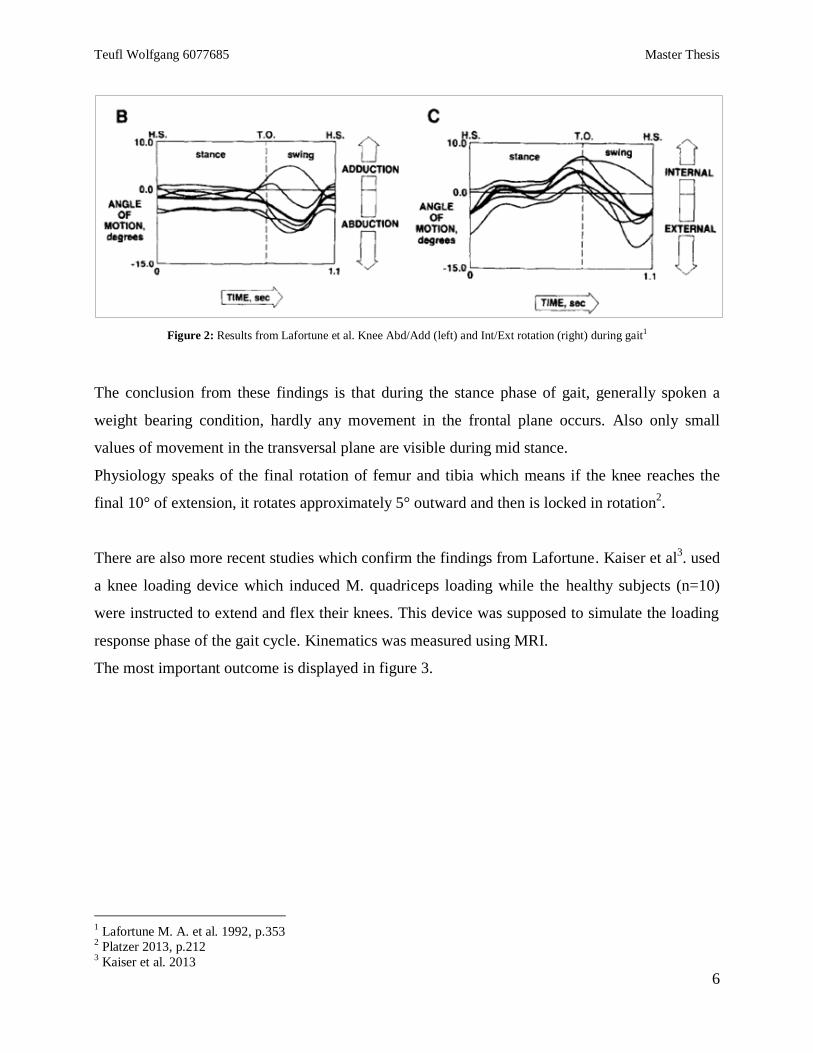
Figure 2: Results from Lafortune et al. Knee Abd/Add (left) and Int/Ext rotation (right) during gait1
The conclusion from these findings is that during the stance phase of gait, generally spoken a
weight bearing condition, hardly any movement in the frontal plane occurs. Also only small
values of movement in the transversal plane are visible during mid stance.
Physiology speaks of the final rotation of femur and tibia which means if the knee reaches the
final 10° of extension, it rotates approximately 5° outward and then is locked in rotation2.
There are also more recent studies which confirm the findings from Lafortune. Kaiser et al3. used
a knee loading device which induced M. quadriceps loading while the healthy subjects (n=10)
were instructed to extend and flex their knees. This device was supposed to simulate the loading
response phase of the gait cycle. Kinematics was measured using MRI.
The most important outcome is displayed in figure 3.
1 Lafortune M. A. et al. 1992, p.353
2 Platzer 2013, p.212
3 Kaiser et al. 2013
Teufl Wolfgang 6077685 Master Thesis
7
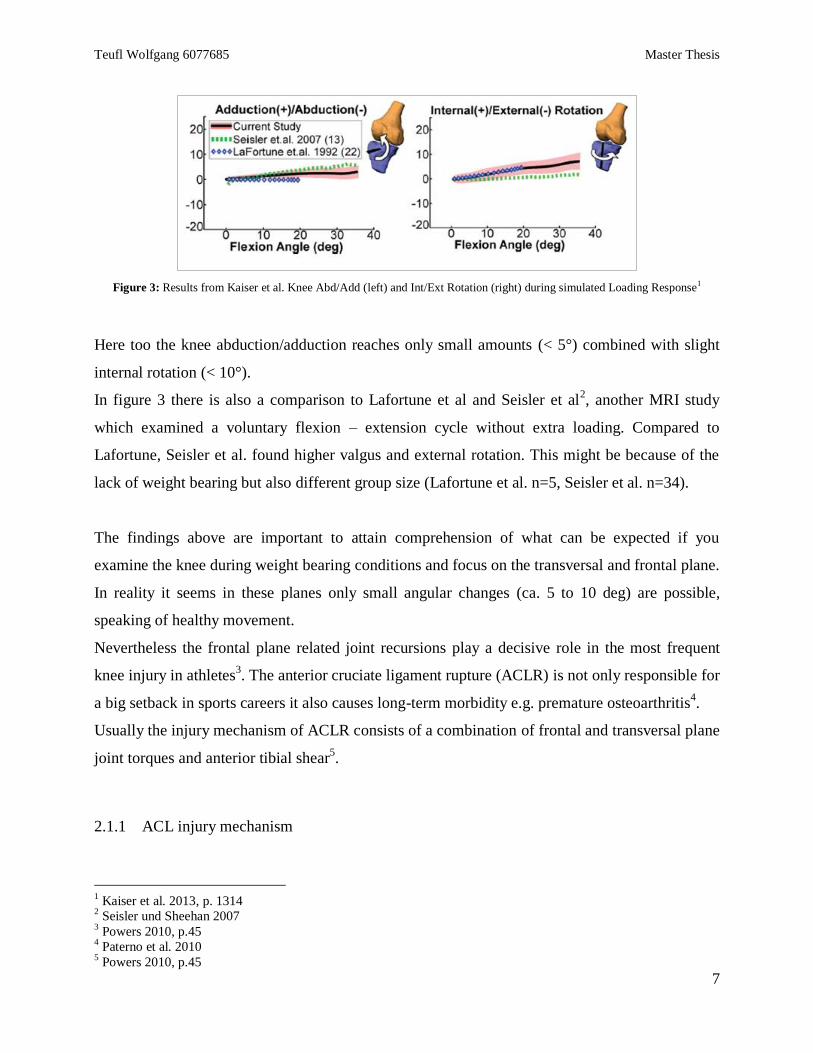
Figure 3: Results from Kaiser et al. Knee Abd/Add (left) and Int/Ext Rotation (right) during simulated Loading Response1
Here too the knee abduction/adduction reaches only small amounts (< 5°) combined with slight
internal rotation (< 10°).
In figure 3 there is also a comparison to Lafortune et al and Seisler et al2, another MRI study
which examined a voluntary flexion – extension cycle without extra loading. Compared to
Lafortune, Seisler et al. found higher valgus and external rotation. This might be because of the
lack of weight bearing but also different group size (Lafortune et al. n=5, Seisler et al. n=34).
The findings above are important to attain comprehension of what can be expected if you
examine the knee during weight bearing conditions and focus on the transversal and frontal plane.
In reality it seems in these planes only small angular changes (ca. 5 to 10 deg) are possible,
speaking of healthy movement.
Nevertheless the frontal plane related joint recursions play a decisive role in the most frequent
knee injury in athletes3. The anterior cruciate ligament rupture (ACLR) is not only responsible for
a big setback in sports careers it also causes long-term morbidity e.g. premature osteoarthritis4.
Usually the injury mechanism of ACLR consists of a combination of frontal and transversal plane
joint torques and anterior tibial shear5.
2.1.1 ACL injury mechanism
1 Kaiser et al. 2013, p. 1314
2 Seisler und Sheehan 2007
3 Powers 2010, p.45
4 Paterno et al. 2010
5 Powers 2010, p.45
Teufl Wolfgang 6077685 Master Thesis
8
Kanamori et al1 shows in a cadaveric knee study (n=12) that internal rotation torque combined
with valgus torque leads to an increased ACL strain and anterior tibial dislocation during flexion
– extension cycle respectively.
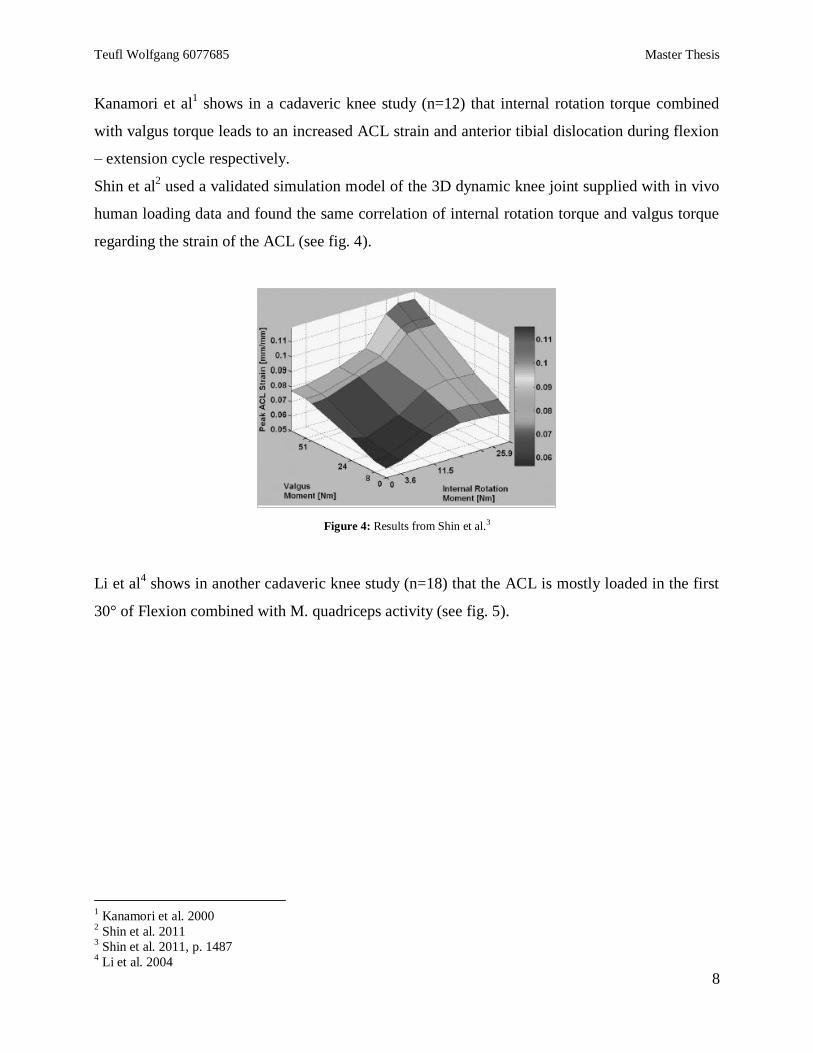
Shin et al2 used a validated simulation model of the 3D dynamic knee joint supplied with in vivo
human loading data and found the same correlation of internal rotation torque and valgus torque
regarding the strain of the ACL (see fig. 4).
Figure 4: Results from Shin et al.3
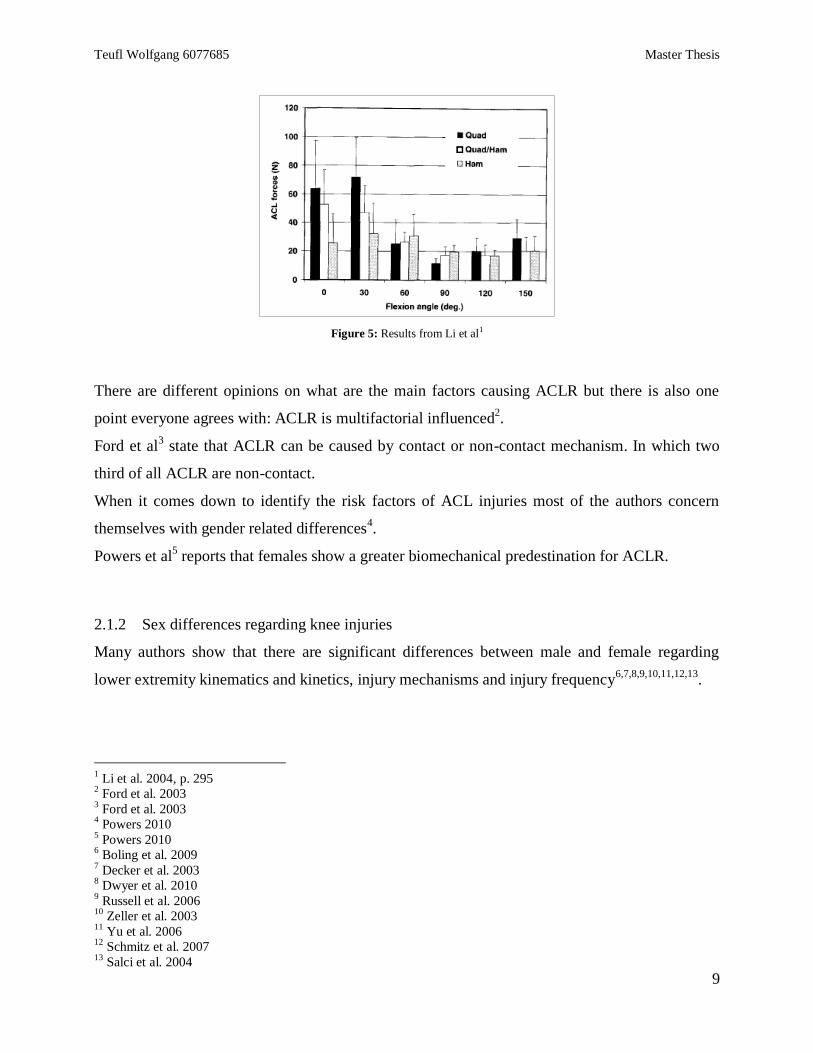
Li et al4 shows in another cadaveric knee study (n=18) that the ACL is mostly loaded in the first
30° of Flexion combined with M. quadriceps activity (see fig. 5).
1 Kanamori et al. 2000
2 Shin et al. 2011
3 Shin et al. 2011, p. 1487
4 Li et al. 2004
Teufl Wolfgang 6077685 Master Thesis
9
Figure 5: Results from Li et al1
There are different opinions on what are the main factors causing ACLR but there is also one
point everyone agrees with: ACLR is multifactorial influenced2.
Ford et al3 state that ACLR can be caused by contact or non-contact mechanism. In which two
third of all ACLR are non-contact.
When it comes down to identify the risk factors of ACL injuries most of the authors concern
themselves with gender related differences4.
Powers et al5 reports that females show a greater biomechanical predestination for ACLR.
2.1.2 Sex differences regarding knee injuries
Many authors show that there are significant differences between male and female regarding
lower extremity kinematics and kinetics, injury mechanisms and injury frequency6,7,8,9,10,11,12,13
.
1 Li et al. 2004, p. 295
2 Ford et al. 2003
3 Ford et al. 2003
4 Powers 2010
5 Powers 2010
6 Boling et al. 2009
7 Decker et al. 2003
8 Dwyer et al. 2010
9 Russell et al. 2006
10 Zeller et al. 2003
11 Yu et al. 2006
12 Schmitz et al. 2007
13 Salci et al. 2004
Teufl Wolfgang 6077685 Master Thesis
10
According to Russel et al1 women are 2 to 4 times more likely to suffer from ACLR than male
participating in the same sport. Also he reports that female athletes sustain 3 times more likely an
ACLR from non-contact mechanism rather than contact mechanism.
Myer et al2 reports similar findings with women suffering non-contact ACLR 4 to 6 times more
likely than their male counterparts.
There are different explanation models why women suffer more likely from knee injuries.
There are a few possible explanations. The reason could be different movement strategies
concerning weight shifting, muscle activation or an overall different posture or lower limb
alignment.
In any case authors focused on the examination of differences in 3D kinematics of the lower
limb3,4
, lower limb kinetics5 and electromyography
6,7.
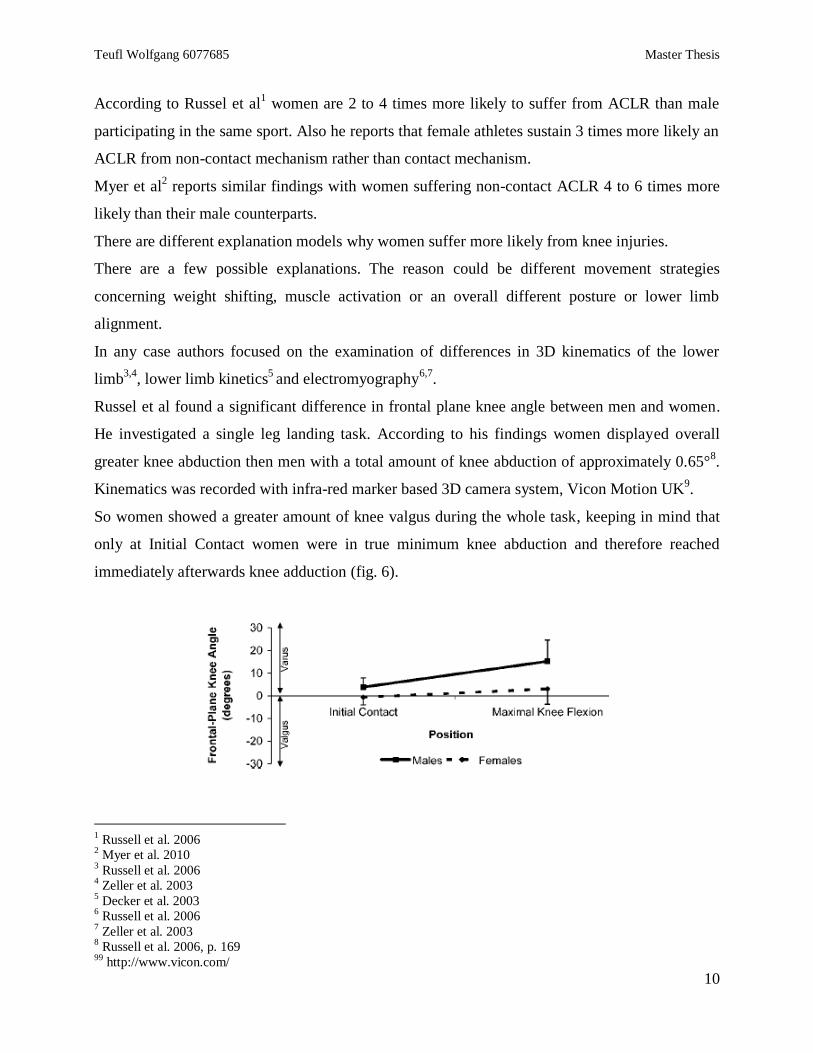
Russel et al found a significant difference in frontal plane knee angle between men and women.
He investigated a single leg landing task. According to his findings women displayed overall
greater knee abduction then men with a total amount of knee abduction of approximately 0.65°8.
Kinematics was recorded with infra-red marker based 3D camera system, Vicon Motion UK9.
So women showed a greater amount of knee valgus during the whole task, keeping in mind that
only at Initial Contact women were in true minimum knee abduction and therefore reached
immediately afterwards knee adduction (fig. 6).
1 Russell et al. 2006
2 Myer et al. 2010
3 Russell et al. 2006
4 Zeller et al. 2003
5 Decker et al. 2003
6 Russell et al. 2006
7 Zeller et al. 2003
8 Russell et al. 2006, p. 169
99 http://www.vicon.com/
Teufl Wolfgang 6077685 Master Thesis
11
Figure 6: Frontal plane knee angle according to Russel et al1
The difference in the overall lower limb frontal plane alignment could be a reason why females
tend to suffer more from ACLR.
This study also examined the role of the M. gluteus medius. Russel et al found no significant
differences in the activation of the M. gluteus medius between women and men2.
Zeller et al3 gave an interesting possible explanation why female show higher knee abduction
compared to male. They assumed that women showed a greater amount of knee abduction while
still standing straight on a single leg because the female pelvis is anatomically wider and
therefore changes the angel of the femur with respect to the tibia.
According to the findings mentioned above one can conclude that there is a difference between
female and male in movement strategies at least when it comes down to landing tasks and single
legged exercises. And further that with female you can find more distinct outcomes regarding
knee valgus/varus.
Also the recent literature seems to focus mostly on the examination of female subjects, the
present study deals with male participants only.
2.2 Knee Valgus
There is one terminus which all the authors refer to when narrowing down the problem of the
ACLR risk factors. The knee valgus (KV).
First of all the difference between three terms has to be clarified: knee valgus, knee abduction and
dynamic knee valgus (DKV).
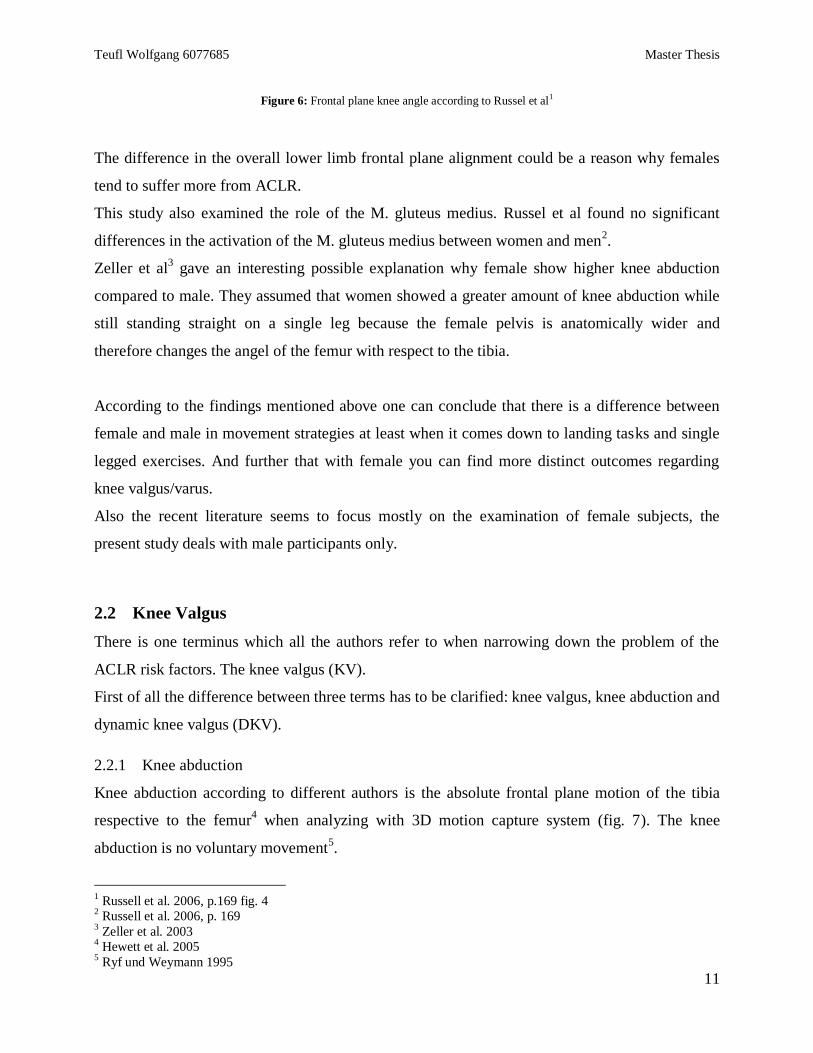
2.2.1 Knee abduction
Knee abduction according to different authors is the absolute frontal plane motion of the tibia
respective to the femur4 when analyzing with 3D motion capture system (fig. 7). The knee
abduction is no voluntary movement5.
1 Russell et al. 2006, p.169 fig. 4
2 Russell et al. 2006, p. 169
3 Zeller et al. 2003
4 Hewett et al. 2005
5 Ryf und Weymann 1995
Teufl Wolfgang 6077685 Master Thesis
12
Figure 7: Knee Abduction1
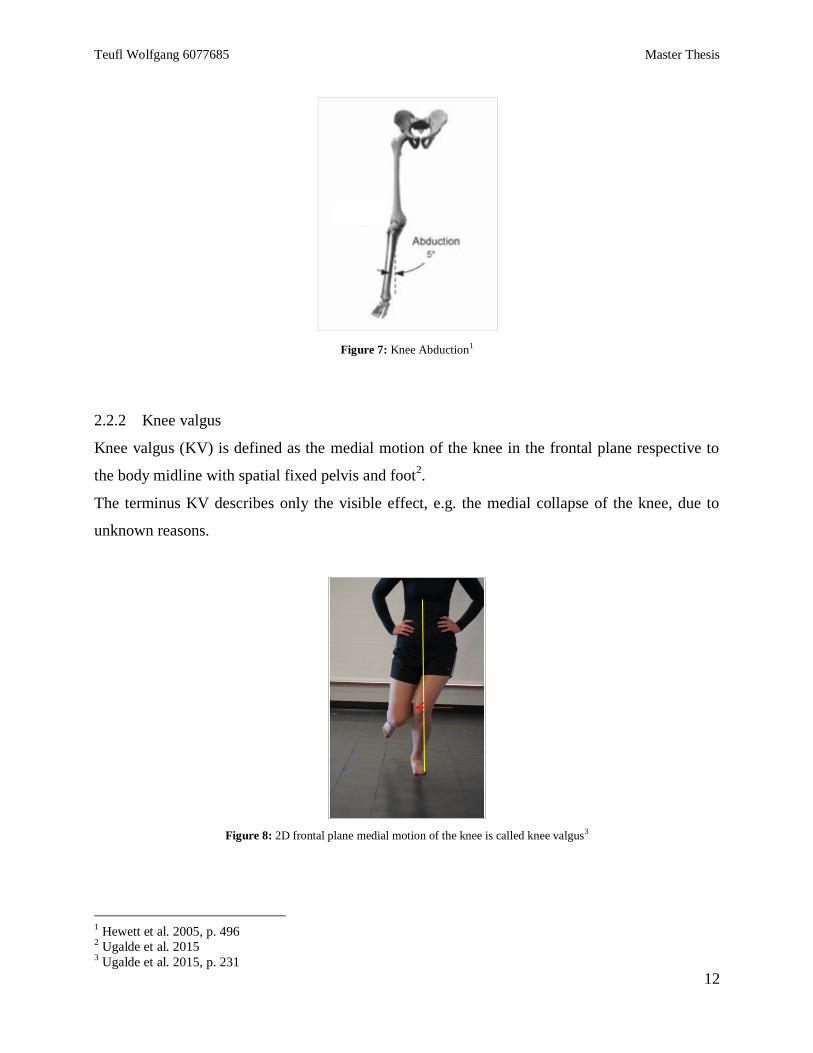
2.2.2 Knee valgus
Knee valgus (KV) is defined as the medial motion of the knee in the frontal plane respective to
the body midline with spatial fixed pelvis and foot2.
The terminus KV describes only the visible effect, e.g. the medial collapse of the knee, due to
unknown reasons.
Figure 8: 2D frontal plane medial motion of the knee is called knee valgus3
1 Hewett et al. 2005, p. 496
2 Ugalde et al. 2015
3 Ugalde et al. 2015, p. 231
Teufl Wolfgang 6077685 Master Thesis
13
2.2.3 Dynamic knee valgus
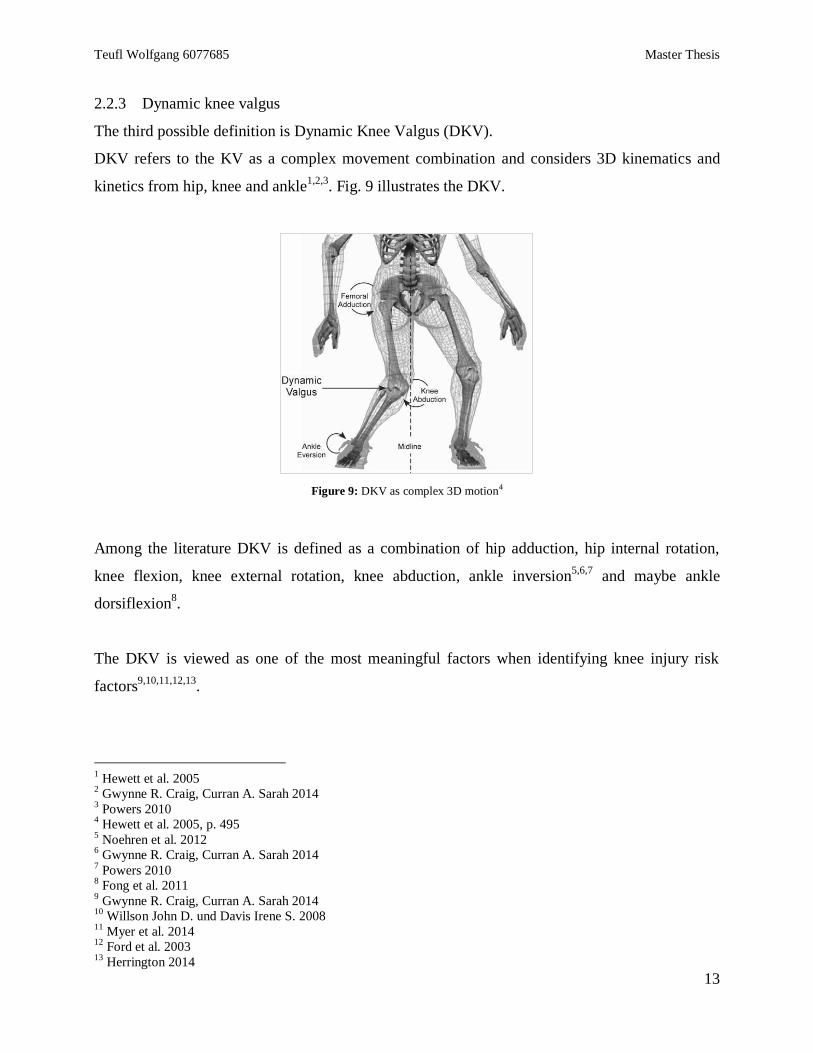
The third possible definition is Dynamic Knee Valgus (DKV).
DKV refers to the KV as a complex movement combination and considers 3D kinematics and
kinetics from hip, knee and ankle1,2,3
. Fig. 9 illustrates the DKV.
Figure 9: DKV as complex 3D motion4
Among the literature DKV is defined as a combination of hip adduction, hip internal rotation,
knee flexion, knee external rotation, knee abduction, ankle inversion5,6,7
and maybe ankle
dorsiflexion8.
The DKV is viewed as one of the most meaningful factors when identifying knee injury risk
factors9,10,11,12,13
.
1 Hewett et al. 2005
2 Gwynne R. Craig, Curran A. Sarah 2014
3 Powers 2010
4 Hewett et al. 2005, p. 495
5 Noehren et al. 2012
6 Gwynne R. Craig, Curran A. Sarah 2014
7 Powers 2010
8 Fong et al. 2011
9 Gwynne R. Craig, Curran A. Sarah 2014
10 Willson John D. und Davis Irene S. 2008
11 Myer et al. 2014
12 Ford et al. 2003
13 Herrington 2014

Teufl Wolfgang 6077685 Master Thesis
14
Every knee injury requires surgical or non-operative treatment or in many cases both, and
therefore is a big financial burden for the medical social system.
Hewett et al.1 estimates a total cost of $17 000 per patient after ACLR in the USA. With 2200
ACLR’s each year in collegiate athletes this would mean an overall amount of $37 million. In
this calculation only females are considered.
Nevertheless these are enormous amounts of money the health care system has to spend on the
rehabilitation of injuries that might have been prevented.
This leads to one of the important aims of recent medical research: the prediction and prevention
of knee injuries.
2.3 Possibilities of Quantification
There are many different methods how the researchers try to identify injury risk factors.
In the following section there will be an overview of different measurement systems used to
analyze dynamic human movement and their possible advantages and disadvantages.
2.3.1 MRI, Fluoroscopy
These systems are often used to examine small movements, quasi-static movements or simulated
movement2,3,4. They deliver high accuracy
5 and valid absolute values. A disadvantage lies clearly
in the flexibility of the systems. It is difficult to analyze real dynamic movement which require
greater space, like jumping tasks.
2.3.2 3D Motion Capture System
Marker based 3D Motion Capture systems are the Gold Standard when considering human
motion analysis and therefore they are used in most of the studies regarding the analysis of the
1 Hewett E. T.,* PhD, Lindenfeld Thomas N., MD, Riccobene Jennifer V., Noyes Frank R., MD 1999
2 Kuo et al. 2011
3 Noehren et al. 2012
4 Kaiser et al. 2013
5 Moro-oka et al. 2007
Teufl Wolfgang 6077685 Master Thesis
15
lower extremity1,2,3,4 ,5
. They deliver valid and reliable data but they are also laboratory bound,
require long term preparation and post-processing and also suffer from soft tissue artifacts6.
2.3.3 Video Analysis
Video Analysis is one of the most basic methods of movement analysis. It is cheap, one can go
outside for field testing and it is easy to execute. So this method is often used to analyze bigger
amounts of subjects7,8,9,10
.
In case of analyzing the DKV Wilson et al. define the Frontal Plane Projection Angle (FPPA)11
.
Keeping in mind that this is only a 2D consideration of the movement. Correlation with 3D data
has been examined in different studies12,13,14
delivering different opinions concerning the strength
of the correlation.
2.3.4 Inertial Measurement System
A relatively new system approach are Inertial measurement systems and only a minor amount of
studies are published using this technology as a human motion analysis tool.15,16,17
.
It is independent from external cameras and calibrated spaces and can therefore be used in field
studies.
The function of an Inertial Measurement Unit (IMU) will be described in a later section.
2.3.5 Additional Measurement Systems
Additional kinetic data mostly received from force plates used to calculate joint loadings (inverse
dynamic).18,1
.
1 Myers et al. 2012
2 Ekegren et al. 2009
3 Hewett et al. 2005
4 Georgoulis 2003
5 Boling et al. 2009
6 Leardini et al. 2005
7 Herrington 2014
8 Gwynne R. Craig, Curran A. Sarah 2014
9 Ugalde et al. 2015
10 Hewett et al. 2009
11 Willson John D. und Davis Irene S. 2008
12 Willson John D. und Davis Irene S. 2008
13 Ekegren et al. 2009
14 Gwynne R. Craig, Curran A. Sarah 2014
15 Kawano et al.
16 Glen Cooper, Ian Sheret, Louise McMillian, Konstantinos Siliverdis, Ning Sha, Diana Hodgins, Laurence Kenney,
David Howard 17
Dejnabadi et al. 2005 18
Decker et al. 2003

Teufl Wolfgang 6077685 Master Thesis
16
With all these possibilities of measurement systems in mind the question remains which
movements are the most suitable to get the most reliable information for example of the geometry
of the leg axis of professional athletes.
To simulate the demands of highly accelerated sports like soccer, football, the studied literature
mainly focusses on landing tasks like jumps. The most common test is the vertical drop jump
(VDJ)2,3,4
.
1 Noyes 2005
2 Hewett et al. 2007
3 Kristianslund und Krosshaug 2013
4 Hewett et al. 2006
Teufl Wolfgang 6077685 Master Thesis
17
3 Materials & Methods
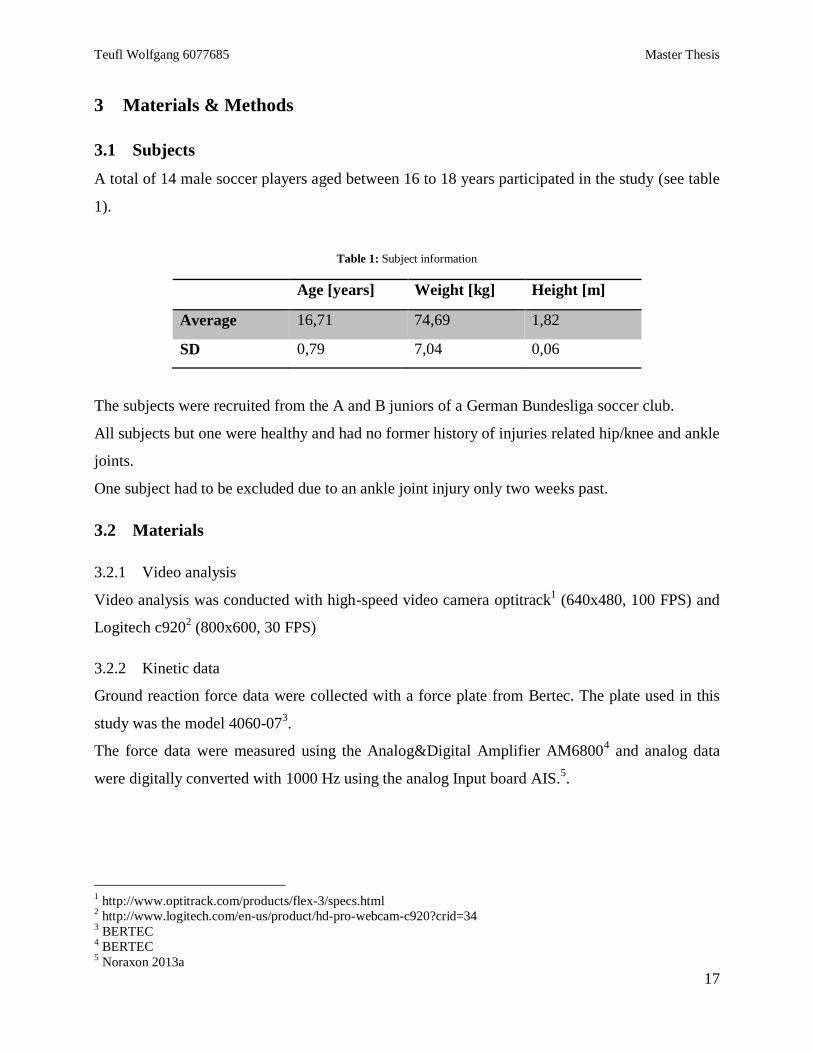
3.1 Subjects
A total of 14 male soccer players aged between 16 to 18 years participated in the study (see table
1).
Table 1: Subject information
Age [years] Weight [kg] Height [m]
Average 16,71 74,69 1,82
SD 0,79 7,04 0,06
The subjects were recruited from the A and B juniors of a German Bundesliga soccer club.
All subjects but one were healthy and had no former history of injuries related hip/knee and ankle
joints.
One subject had to be excluded due to an ankle joint injury only two weeks past.
3.2 Materials
3.2.1 Video analysis
Video analysis was conducted with high-speed video camera optitrack1 (640x480, 100 FPS) and
Logitech c9202 (800x600, 30 FPS)
3.2.2 Kinetic data
Ground reaction force data were collected with a force plate from Bertec. The plate used in this
study was the model 4060-073.
The force data were measured using the Analog&Digital Amplifier AM68004 and analog data
were digitally converted with 1000 Hz using the analog Input board AIS.5.
1 http://www.optitrack.com/products/flex-3/specs.html
2 http://www.logitech.com/en-us/product/hd-pro-webcam-c920?crid=34
3 BERTEC
4 BERTEC
5 Noraxon 2013a
Teufl Wolfgang 6077685 Master Thesis
18
3.2.3 3D kinematics
3D kinematics was measured using the inertial sensor system MyoMotion®1
. 8 sensors were
applied to the subjects measuring the movement of the lower extremity, pelvis and lower back at
a sampling rate of 100 Hz.
3.2.4 Measurement software
The records were recorded and analyzed using the measurement software MyoResearch
3®(MR3). Software version 3.8.1.
3.2.5 Further materials
Test Laptop: Acer2 Aspire VN7-791G-70M4
USB Hub Targus ACP70US3
MyoMotion Receiver
6 retroreflective Markers
MyoSync®4
synchronization tool
Synchronization Light
Stepper 20 cm height, stepper 34cm height
See further information of technical specification in the appendix VI.
3.3 IMU Technology
3.3.1 Generally set up
An Inertial Sensor Measurement Unit consists of mainly three sensor types. An accelerometer, a
gyroscope and a magnetometer. The combination of these three parts allows the system to
measure at least 6 degrees of freedom.
With an accelerometer, velocity and distance of an object can be calculated. In a 3 dimensional
setting there must be 3 accelerometers mounted orthogonally together5.
A gyroscope measures angular displacements and/or angular velocity. To measure 3 dimensional
motions three orthogonally mounted gyroscopes are needed.
1 Noraxon 2013b
2 http://www.acer.de/ac/de/DE/content/home
3 http://www.targus.com/de/targus-universal-usb-3_0-superspeed-dual-video-docking-station-de-acp70eu
4 Noraxon 2013c
5 Oberländer 2015
Teufl Wolfgang 6077685 Master Thesis
19
Magnetometers within an IMU serve the same purpose as they do in a compass, locating the
north pole of the earth. In case of the IMU they are used to define the position of each unit to a
reference unit.
3.3.2 Mathematical calculation
The mathematically approach to calculate 3D joint angles is mainly based upon the principal of
rotation matrices as known for example from the robotic field. The basic units used in this
approach are the so called quaternions.
Simply said quaternions are 4x1 matrices consisting of a scalar and a vectorial part. They are
used in mathematics to describe rotations and translations of rigid bodies.
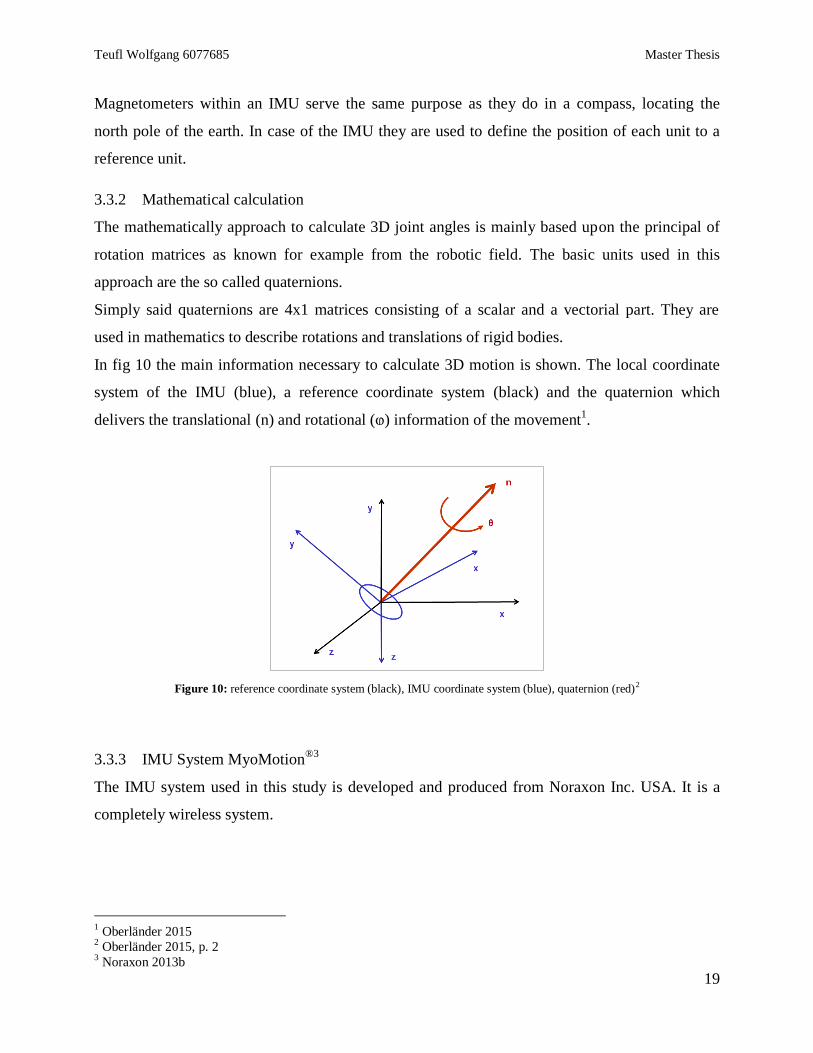
In fig 10 the main information necessary to calculate 3D motion is shown. The local coordinate
system of the IMU (blue), a reference coordinate system (black) and the quaternion which
delivers the translational (n) and rotational (ⱷ) information of the movement1.
Figure 10: reference coordinate system (black), IMU coordinate system (blue), quaternion (red)2
3.3.3 IMU System MyoMotion®3
The IMU system used in this study is developed and produced from Noraxon Inc. USA. It is a
completely wireless system.
1 Oberländer 2015
2 Oberländer 2015, p. 2
3 Noraxon 2013b
Teufl Wolfgang 6077685 Master Thesis
20
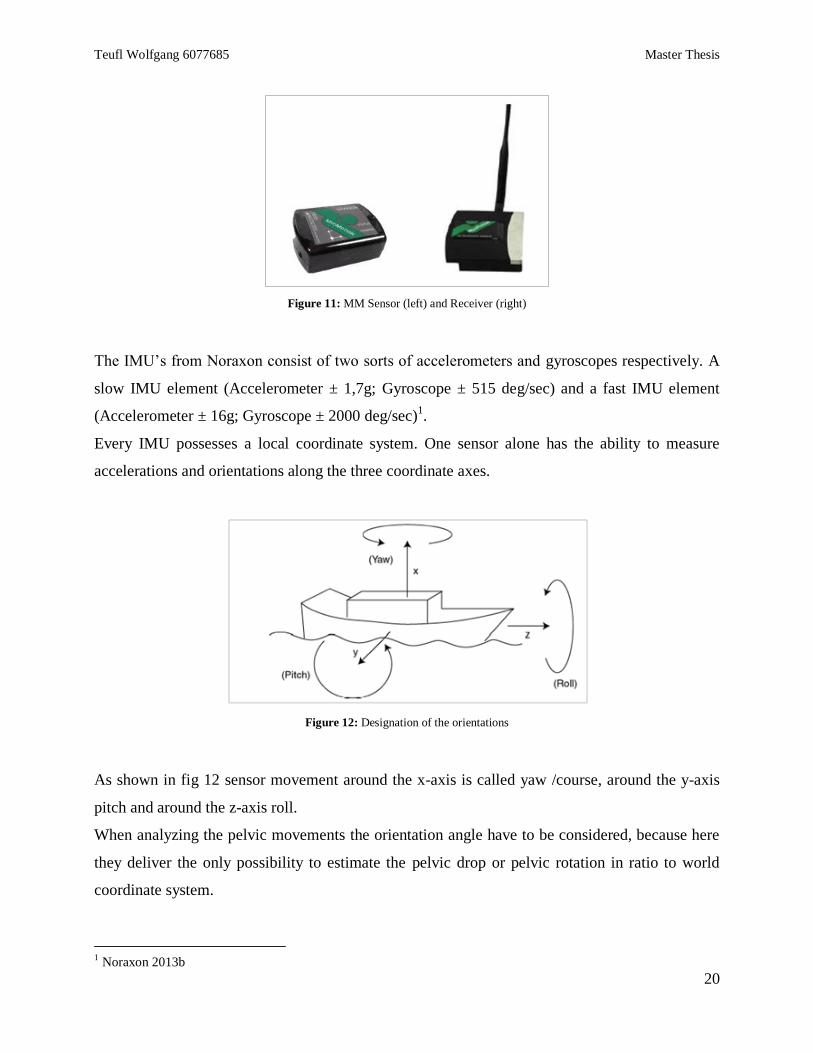
Figure 11: MM Sensor (left) and Receiver (right)
The IMU’s from Noraxon consist of two sorts of accelerometers and gyroscopes respectively. A
slow IMU element (Accelerometer ± 1,7g; Gyroscope ± 515 deg/sec) and a fast IMU element
(Accelerometer ± 16g; Gyroscope ± 2000 deg/sec)1.
Every IMU possesses a local coordinate system. One sensor alone has the ability to measure
accelerations and orientations along the three coordinate axes.
Figure 12: Designation of the orientations
As shown in fig 12 sensor movement around the x-axis is called yaw /course, around the y-axis
pitch and around the z-axis roll.
When analyzing the pelvic movements the orientation angle have to be considered, because here
they deliver the only possibility to estimate the pelvic drop or pelvic rotation in ratio to world
coordinate system.
1 Noraxon 2013b
Teufl Wolfgang 6077685 Master Thesis
21
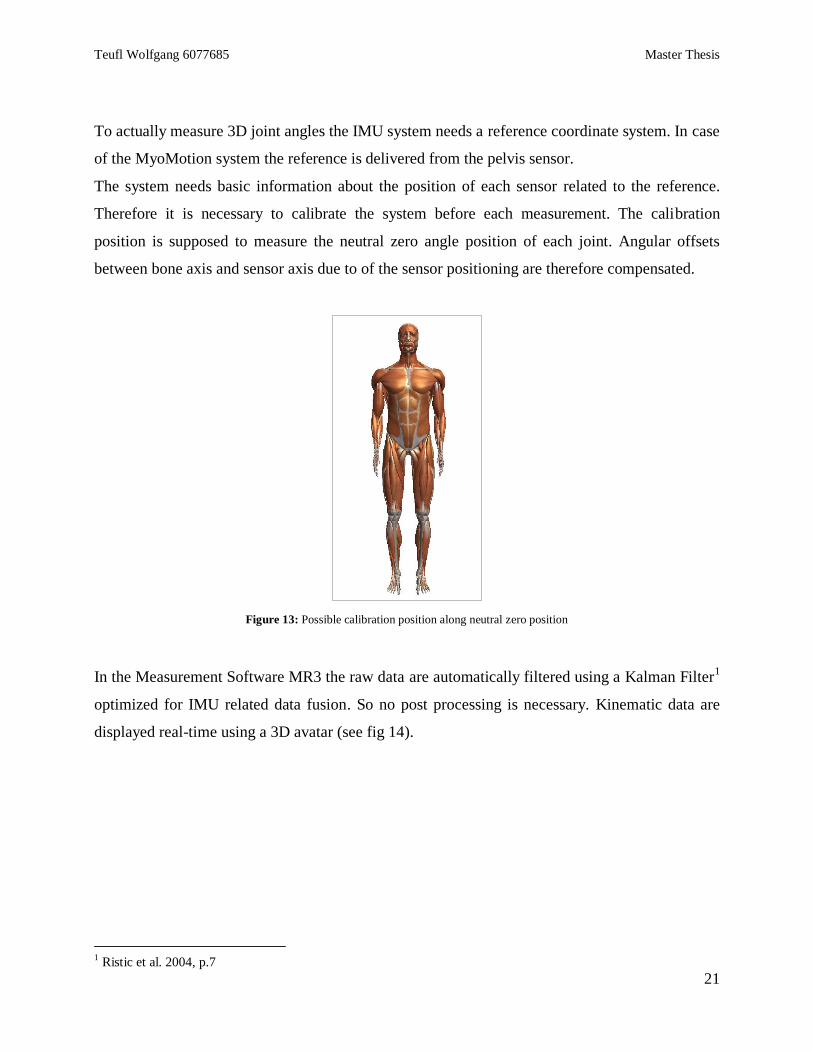
To actually measure 3D joint angles the IMU system needs a reference coordinate system. In case
of the MyoMotion system the reference is delivered from the pelvis sensor.
The system needs basic information about the position of each sensor related to the reference.
Therefore it is necessary to calibrate the system before each measurement. The calibration
position is supposed to measure the neutral zero angle position of each joint. Angular offsets
between bone axis and sensor axis due to of the sensor positioning are therefore compensated.
Figure 13: Possible calibration position along neutral zero position
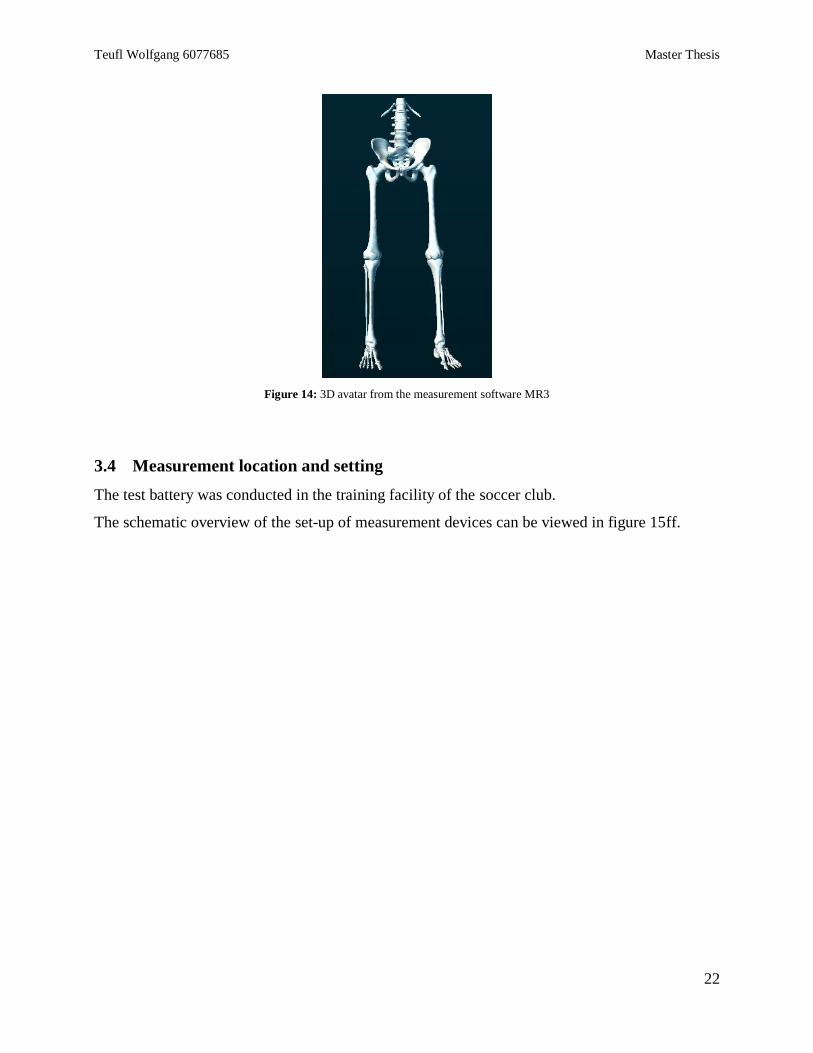
In the Measurement Software MR3 the raw data are automatically filtered using a Kalman Filter1
optimized for IMU related data fusion. So no post processing is necessary. Kinematic data are
displayed real-time using a 3D avatar (see fig 14).
1 Ristic et al. 2004, p.7
Teufl Wolfgang 6077685 Master Thesis
22
Figure 14: 3D avatar from the measurement software MR3
3.4 Measurement location and setting
The test battery was conducted in the training facility of the soccer club.
The schematic overview of the set-up of measurement devices can be viewed in figure 15ff.
Teufl Wolfgang 6077685 Master Thesis
23
Figure 15: Connection scheme of the measurement devices
Figure 16: Measurement set up and positioning of the devices
Teufl Wolfgang 6077685 Master Thesis
24
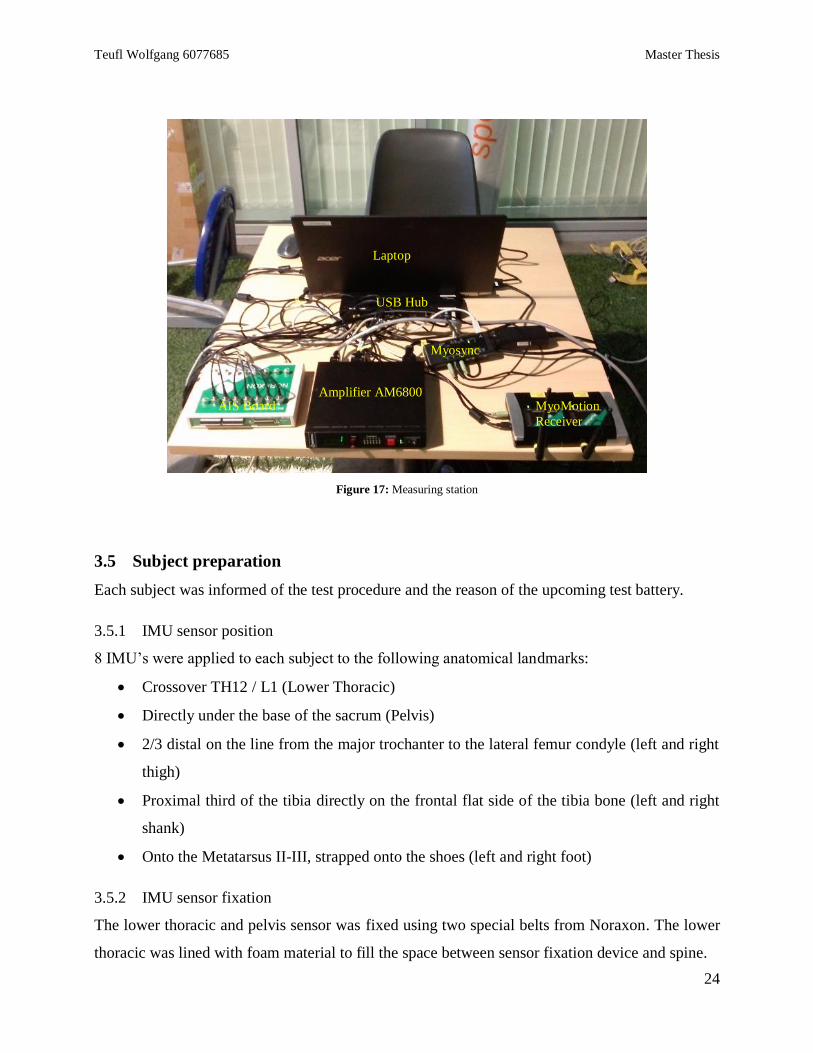
Figure 17: Measuring station
3.5 Subject preparation
Each subject was informed of the test procedure and the reason of the upcoming test battery.
3.5.1 IMU sensor position
8 IMU’s were applied to each subject to the following anatomical landmarks:
Crossover TH12 / L1 (Lower Thoracic)
Directly under the base of the sacrum (Pelvis)
2/3 distal on the line from the major trochanter to the lateral femur condyle (left and right
thigh)
Proximal third of the tibia directly on the frontal flat side of the tibia bone (left and right
shank)
Onto the Metatarsus II-III, strapped onto the shoes (left and right foot)
3.5.2 IMU sensor fixation
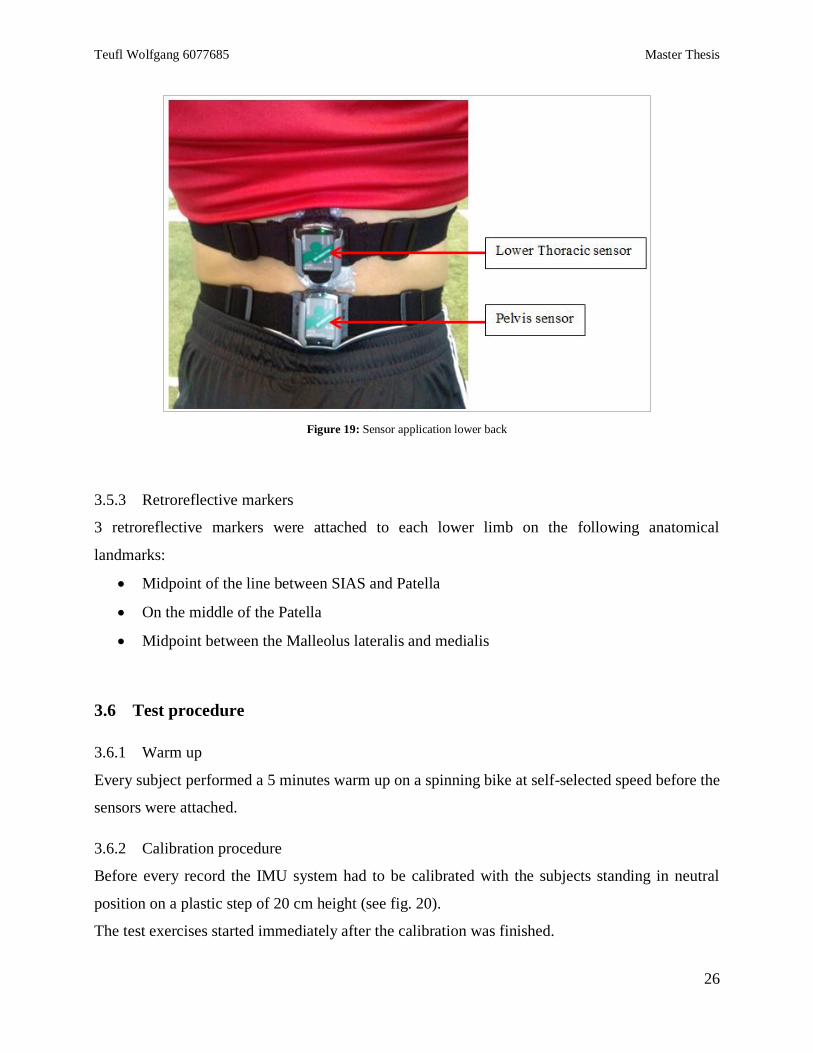
The lower thoracic and pelvis sensor was fixed using two special belts from Noraxon. The lower
thoracic was lined with foam material to fill the space between sensor fixation device and spine.
Laptop
Amplifier AM6800 AIS Board MyoMotion
Receiver
Myosync
USB Hub
Teufl Wolfgang 6077685 Master Thesis
25
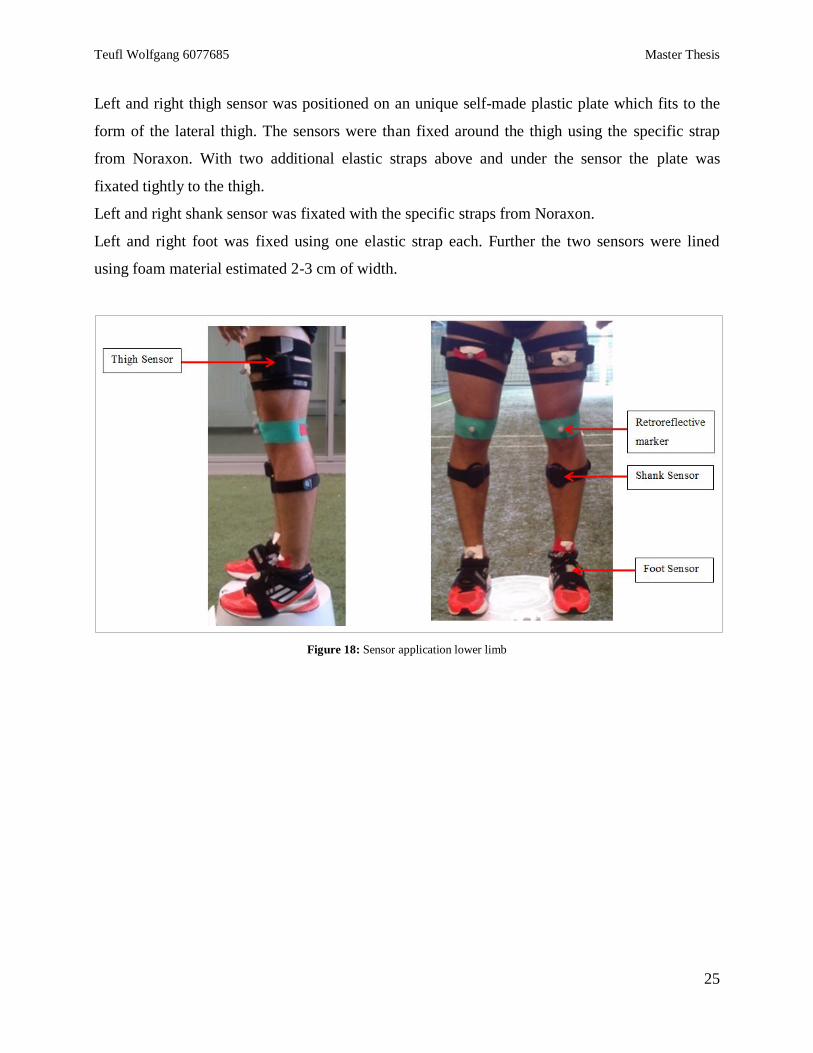
Left and right thigh sensor was positioned on an unique self-made plastic plate which fits to the
form of the lateral thigh. The sensors were than fixed around the thigh using the specific strap
from Noraxon. With two additional elastic straps above and under the sensor the plate was
fixated tightly to the thigh.
Left and right shank sensor was fixated with the specific straps from Noraxon.
Left and right foot was fixed using one elastic strap each. Further the two sensors were lined
using foam material estimated 2-3 cm of width.
Figure 18: Sensor application lower limb
Teufl Wolfgang 6077685 Master Thesis
26
Figure 19: Sensor application lower back
3.5.3 Retroreflective markers
3 retroreflective markers were attached to each lower limb on the following anatomical
landmarks:
Midpoint of the line between SIAS and Patella
On the middle of the Patella
Midpoint between the Malleolus lateralis and medialis
3.6 Test procedure
3.6.1 Warm up
Every subject performed a 5 minutes warm up on a spinning bike at self-selected speed before the
sensors were attached.
3.6.2 Calibration procedure
Before every record the IMU system had to be calibrated with the subjects standing in neutral
position on a plastic step of 20 cm height (see fig. 20).
The test exercises started immediately after the calibration was finished.
Teufl Wolfgang 6077685 Master Thesis
27
Figure 20: Calibration position
3.6.3 Bilateral squat / Full Squat
Each subject performed 5 bilateral squats on the force plate with line of sight directed towards the
high-speed cam.
The subjects were instructed to perform the squats up to approximately 90° knee flexion. Every
subject had time to perform a few squats to feel comfortable with the demanded range of motion.
Exercise velocity was 1 repetition / sec.
Hands were located on the hip.
Teufl Wolfgang 6077685 Master Thesis
28
Figure 21: Performance Full Squat
3.6.4 Single leg squat
Each subject performed 5 left- and 5 right-side single leg squats within one record. Line of sight
was towards the highspeed cam.
The subjects were instructed to perform the squats up to approximately 90° knee flexion. Every
subject had time to perform a few squats to feel comfortable with the demanded range of motion.
Exercise velocity was 1 repetition / sec.
Hands were located on the hip.
Figure 22: Performance Single Leg Squat
Teufl Wolfgang 6077685 Master Thesis
29
3.6.5 Drop jump
Each subject was instructed to perform within one record 3 vertical drop jumps for minimal
contact time. They were instructed to position their hands on the hip and step on to a step of 34
cm height. Then they should step forward with which foot they feel comfortable land with both
feet on the force plate and immediately perform a vertical jump without much of knee flexion.
Every subject got 1-2 test trials until they felt comfortable with the exercise.
Figure 23: Performance Drop Jump
3.6.6 Single leg hop for distance
Prior to the main record the performance of the exercise was explained to the subject. The hands
were positioned on the hip, then you stand on one leg and with a single downward motion
perform a hop for maximum distance. The subjects were instructed to try to stabilize the landing
and once the foot has reached the floor not to lift it again. Each subject then performed a single
leg hop for maximum distance with their weaker leg. The distance was measured and 70% of it
calculated.
For the actual record the calculated distance was marked behind the force plate. Now the subjects
were instructed to perform 3 single legged hops for distance with the left and the right side onto
the force plate within one record. For the starting position the subjects positioned the heel of their
jumping leg on the mark.
Teufl Wolfgang 6077685 Master Thesis
30
Figure 24: Performance Hop for Distance
3.7 Data acquisition
The following data were recorded
3.7.1 Kinematic data (3D)
Pelvis orientation
Hip
Knee
Ankle
3.7.2 Kinetic data
Vertical force (fz), horizontal force (fx, fy)
3.7.3 Video analysis
FPPA
3.8 Data analysis
For the IMU and force plate data no post processing was necessary. The FPPA was analyzed
manually using the 3D Marker Angle/Chain function of the MR3 software for each record and
was afterwards - if possible - auto-tracked over the whole record (single leg squat, full squat)
using a build-in marker tracking algorithm or manually marked just at main events (drop jump,
hop for distance).
Teufl Wolfgang 6077685 Master Thesis
31
Event markers were manually set in each record. Force plate data was used to determine initial
contact:
Full squat Markers at maximum knee flexion
Single leg squat Markers at maximum knee flexion
Drop jump Markers at Initial contact (IC) and first maximum knee flexion (Max) after
IC
Hop for distance Markers at Initial contact (IC) and first maximum knee flexion (Max)
after IC
Then the data were exported to SPSS for statistical analysis.
Kinematics, kinetics and FPPA diagrams were produced in MR3. Further diagrams were
conducted in SPSS.
3.9 Statistical analysis
All statistical analyses were conducted in IBM SPSS Statistics 211.
Most of the data lack normal distribution therefore non parametric tests were used.
The Wilcoxon test was used to compare left and right lower extremity kinematics and FPPA at
maximum knee flexion for FS and SLS and at IC and maximum knee flexion for DJ and HfD.
Alpha error was set at 0.05.
The Kruskal Wallis test was used to find differences in the kinematic data, kinetic data and FPPA
between the subjects for each test. The analysis was conducted at the same point as the Wilcoxon
test. Alpha criterion was set 0.05. Post hoc analysis was performed to identify exactly which
subjects performed significantly different.
Spearman correlation was used to find correlations between the FPPA and 3D kinematic data
during an average Full Squat, Single Leg Squat (left and right), Drop Jump and Hop for Distance
(left and right).
Except for SLS which showed normal distribution and therefore correlation coefficient was
calculated using Pearson correlation.
3.9.1 Leg Axis Score (LAS) development
The idea was to produce an easy calculation to classify the leg axis geometry and assess the
DKV. Therefore a comparison of varus vs valgus components within a simple division was
1 http://www-01.ibm.com/software/de/analytics/spss/
Teufl Wolfgang 6077685 Master Thesis
32
designed. First for the identification of varus and valgus components respective, the spearman
correlation was used. Movements which showed significant correlation with the FPPA where
checked for direction using linear regression and the r²-value. This procedure was performed for
Full Squat, Drop Jump and Single Leg Squat.
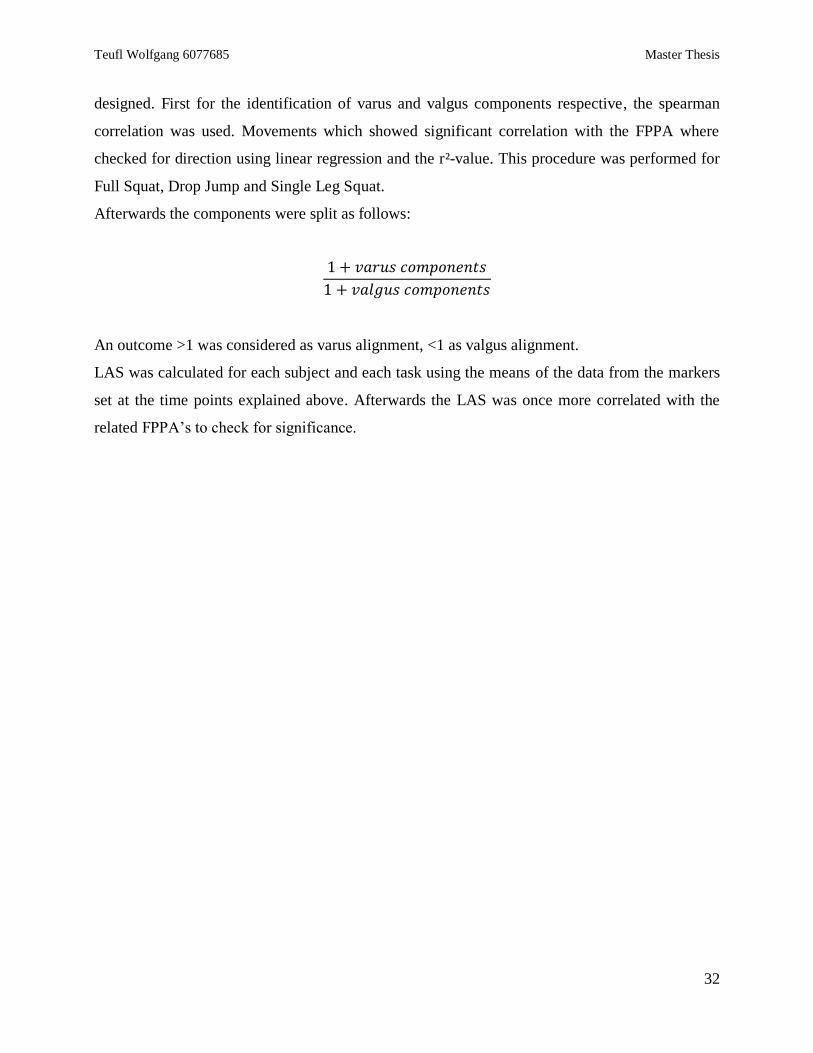
Afterwards the components were split as follows:
1 + 𝑣𝑎𝑟𝑢𝑠 𝑐𝑜𝑚𝑝𝑜𝑛𝑒𝑛𝑡𝑠
1 + 𝑣𝑎𝑙𝑔𝑢𝑠 𝑐𝑜𝑚𝑝𝑜𝑛𝑒𝑛𝑡𝑠
An outcome >1 was considered as varus alignment, <1 as valgus alignment.
LAS was calculated for each subject and each task using the means of the data from the markers
set at the time points explained above. Afterwards the LAS was once more correlated with the
related FPPA’s to check for significance.

Teufl Wolfgang 6077685 Master Thesis
33
4 Results
4.1 General outcome
The overall outcome of the four tasks can be viewed in the following part.
4.1.1 Full Squat
In the table below the descriptive statistics are presented for all subjects at the analysis marker
position “maximum knee flexion”. N = 65 because of 5 full squats for 13 subjects.
Table 2: Descriptive statistics of all angle data in Full Squat at max knee flexion position for all subjects
In figure 25 are presented a few of the most interesting kinematic angles.
Teufl Wolfgang 6077685 Master Thesis
34
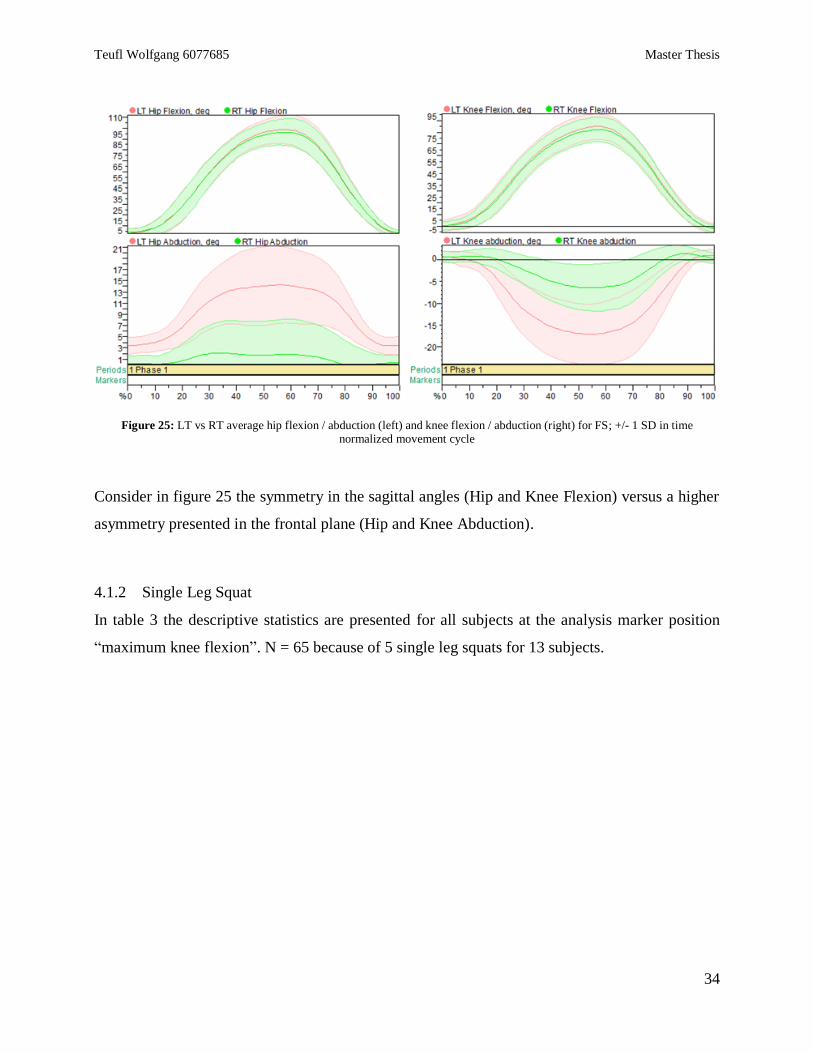
Figure 25: LT vs RT average hip flexion / abduction (left) and knee flexion / abduction (right) for FS; +/- 1 SD in time normalized movement cycle
Consider in figure 25 the symmetry in the sagittal angles (Hip and Knee Flexion) versus a higher
asymmetry presented in the frontal plane (Hip and Knee Abduction).
4.1.2 Single Leg Squat
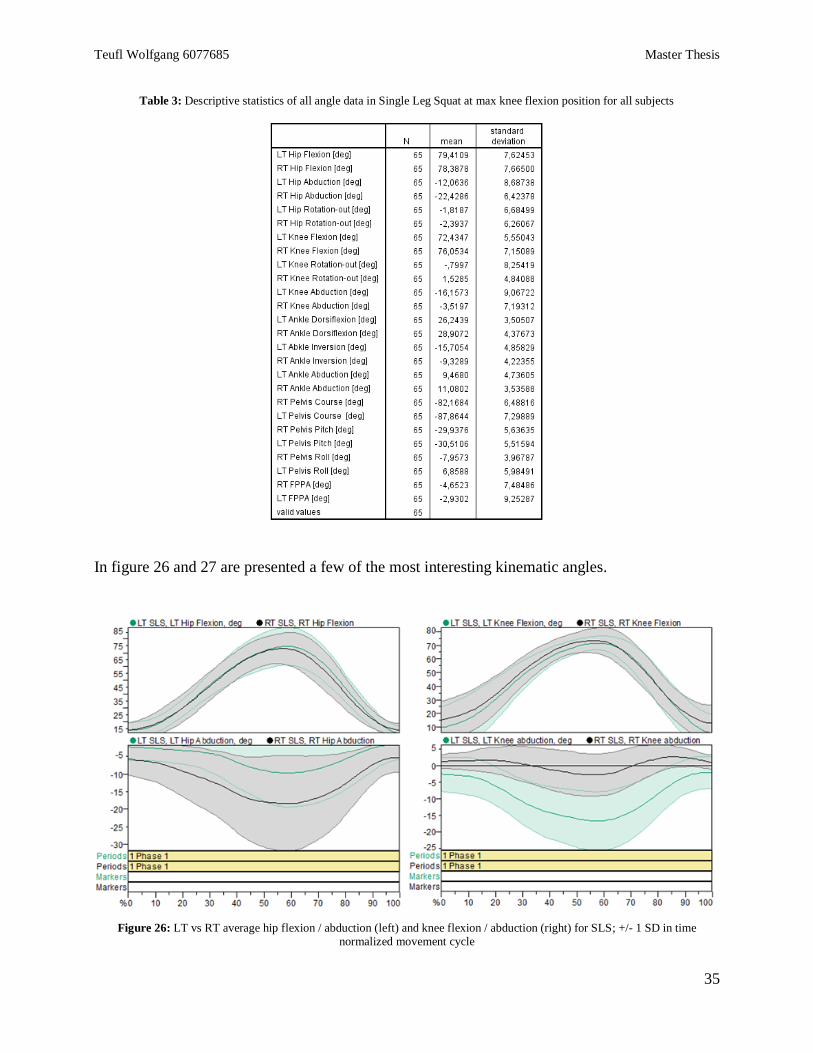
In table 3 the descriptive statistics are presented for all subjects at the analysis marker position
“maximum knee flexion”. N = 65 because of 5 single leg squats for 13 subjects.
Teufl Wolfgang 6077685 Master Thesis
35
Table 3: Descriptive statistics of all angle data in Single Leg Squat at max knee flexion position for all subjects
In figure 26 and 27 are presented a few of the most interesting kinematic angles.
Figure 26: LT vs RT average hip flexion / abduction (left) and knee flexion / abduction (right) for SLS; +/- 1 SD in time normalized movement cycle
Teufl Wolfgang 6077685 Master Thesis
36
Consider in figure 26 the symmetry in the sagittal angles (Hip and Knee Flexion) versus a higher
asymmetry presented in the frontal plane (Hip and Knee Abduction).
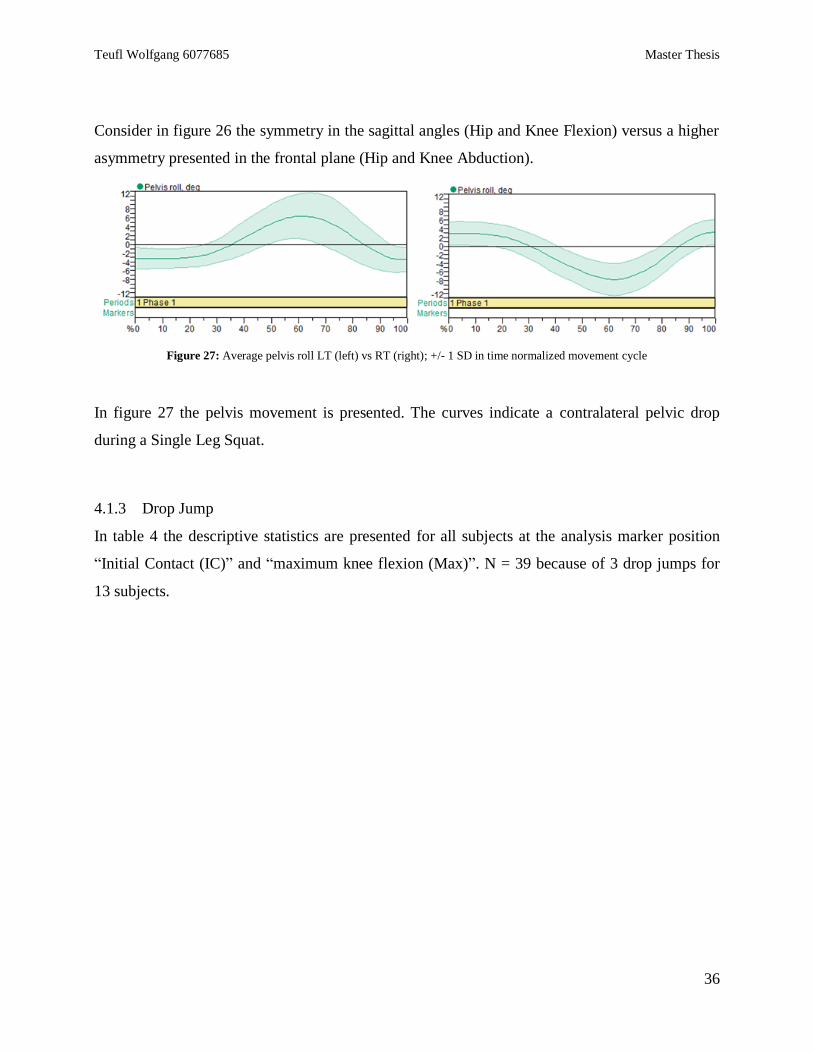
Figure 27: Average pelvis roll LT (left) vs RT (right); +/- 1 SD in time normalized movement cycle
In figure 27 the pelvis movement is presented. The curves indicate a contralateral pelvic drop
during a Single Leg Squat.
4.1.3 Drop Jump
In table 4 the descriptive statistics are presented for all subjects at the analysis marker position
“Initial Contact (IC)” and “maximum knee flexion (Max)”. N = 39 because of 3 drop jumps for
13 subjects.
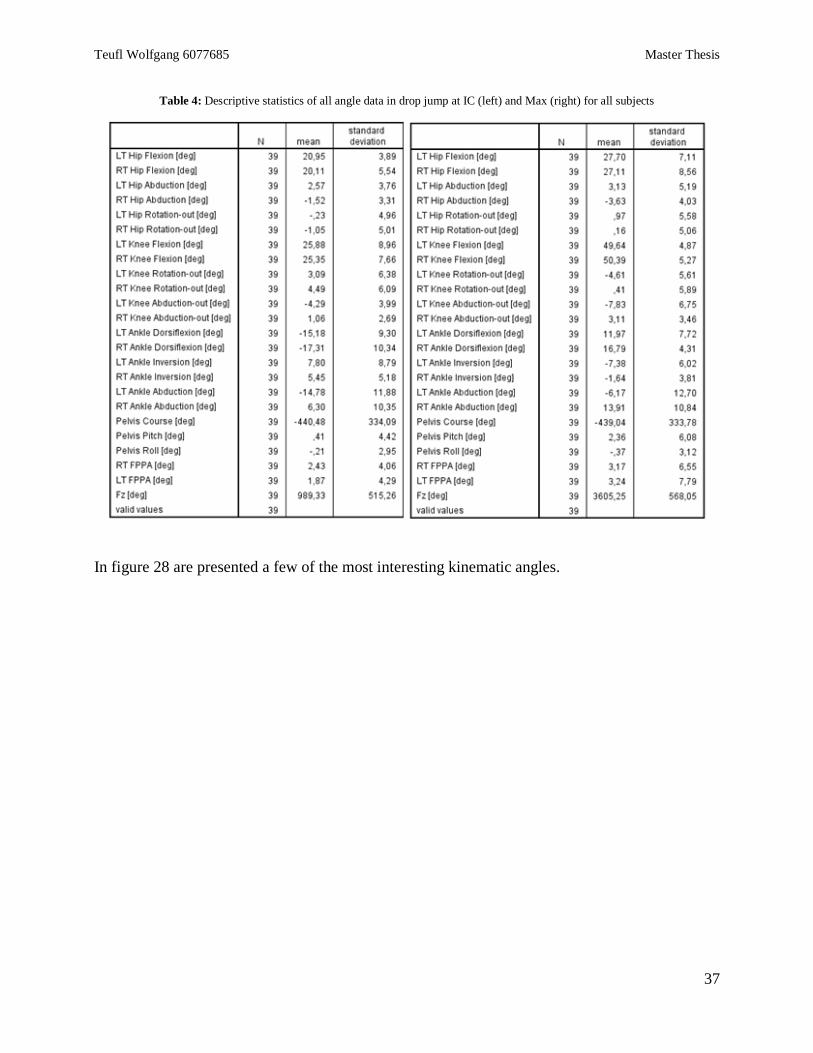
Teufl Wolfgang 6077685 Master Thesis
37
Table 4: Descriptive statistics of all angle data in drop jump at IC (left) and Max (right) for all subjects
In figure 28 are presented a few of the most interesting kinematic angles.
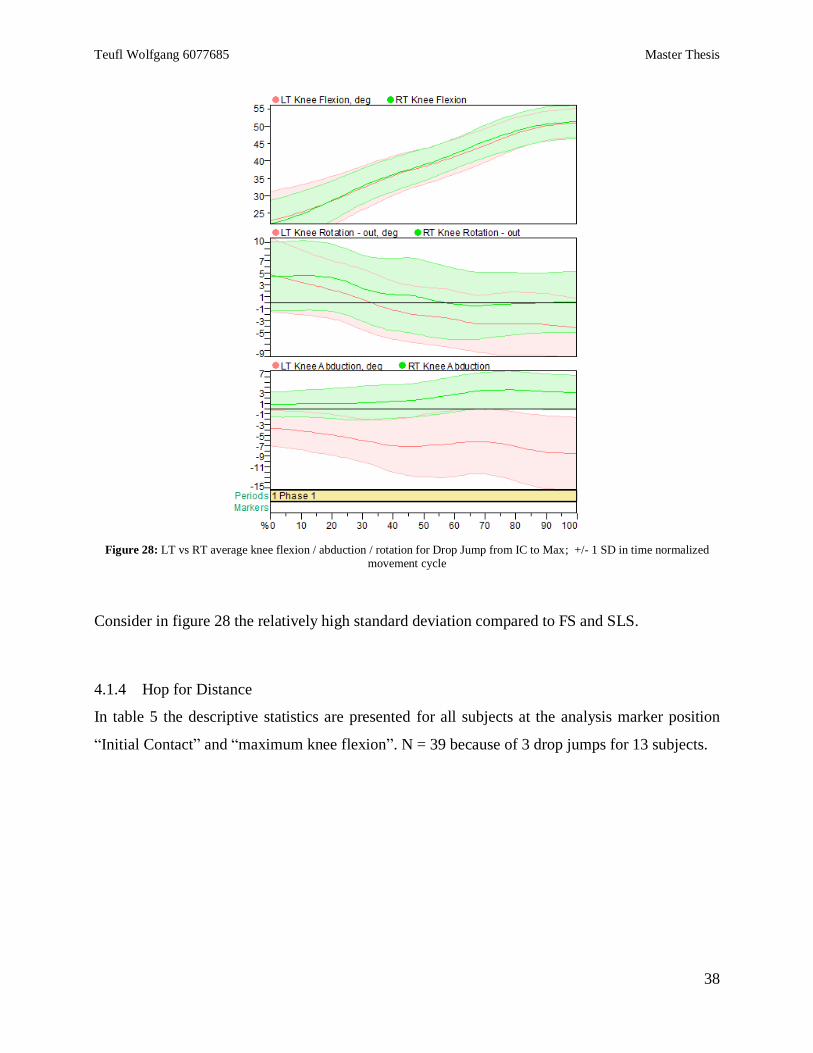
Teufl Wolfgang 6077685 Master Thesis
38
Figure 28: LT vs RT average knee flexion / abduction / rotation for Drop Jump from IC to Max; +/- 1 SD in time normalized movement cycle
Consider in figure 28 the relatively high standard deviation compared to FS and SLS.
4.1.4 Hop for Distance
In table 5 the descriptive statistics are presented for all subjects at the analysis marker position
“Initial Contact” and “maximum knee flexion”. N = 39 because of 3 drop jumps for 13 subjects.
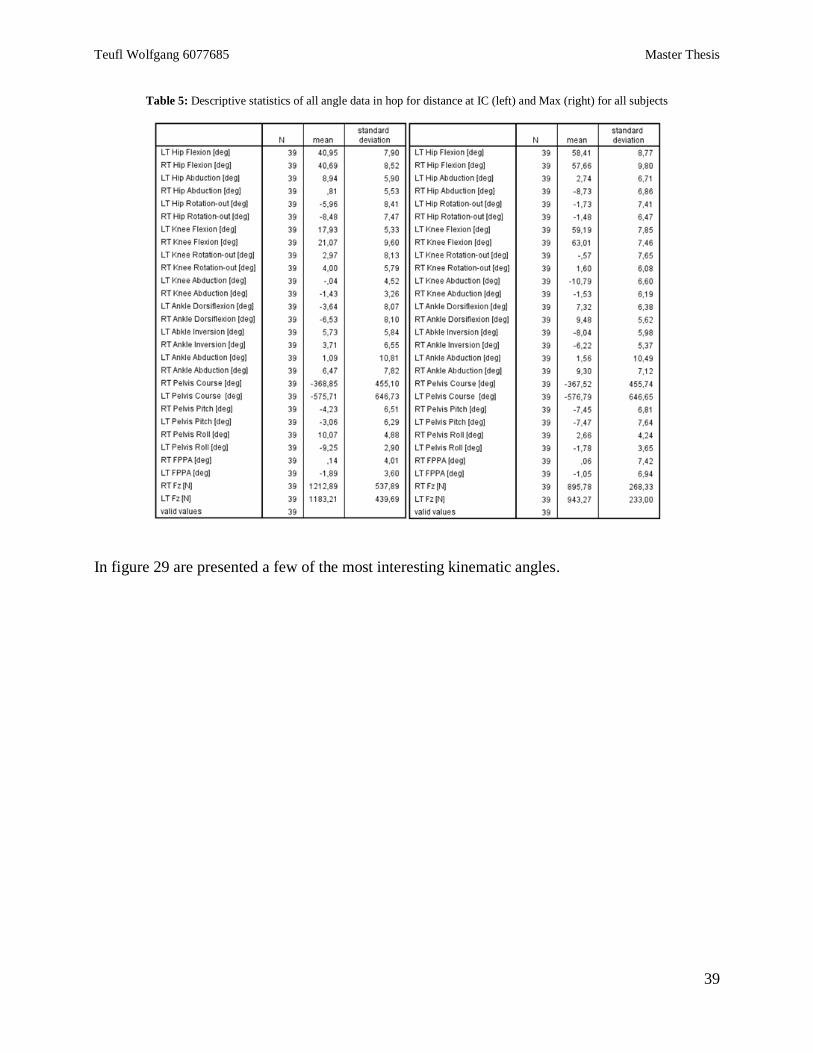
Teufl Wolfgang 6077685 Master Thesis
39
Table 5: Descriptive statistics of all angle data in hop for distance at IC (left) and Max (right) for all subjects
In figure 29 are presented a few of the most interesting kinematic angles.
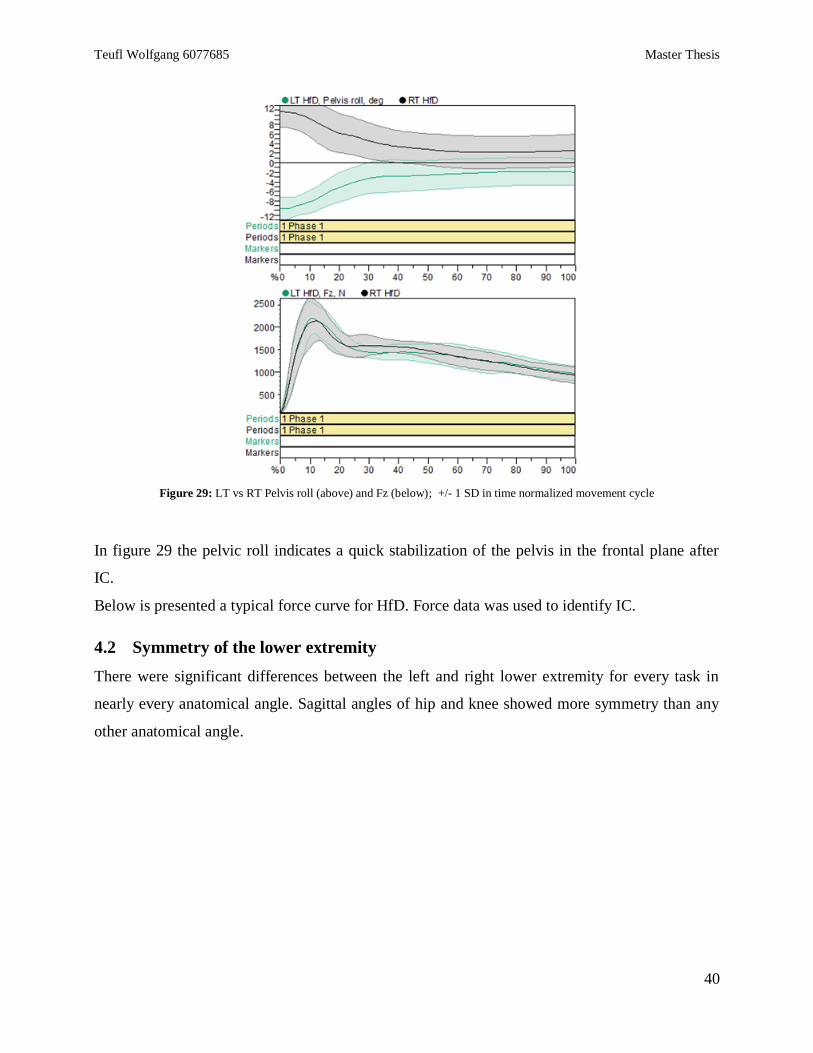
Teufl Wolfgang 6077685 Master Thesis
40
Figure 29: LT vs RT Pelvis roll (above) and Fz (below); +/- 1 SD in time normalized movement cycle
In figure 29 the pelvic roll indicates a quick stabilization of the pelvis in the frontal plane after
IC.
Below is presented a typical force curve for HfD. Force data was used to identify IC.
4.2 Symmetry of the lower extremity
There were significant differences between the left and right lower extremity for every task in
nearly every anatomical angle. Sagittal angles of hip and knee showed more symmetry than any
other anatomical angle.
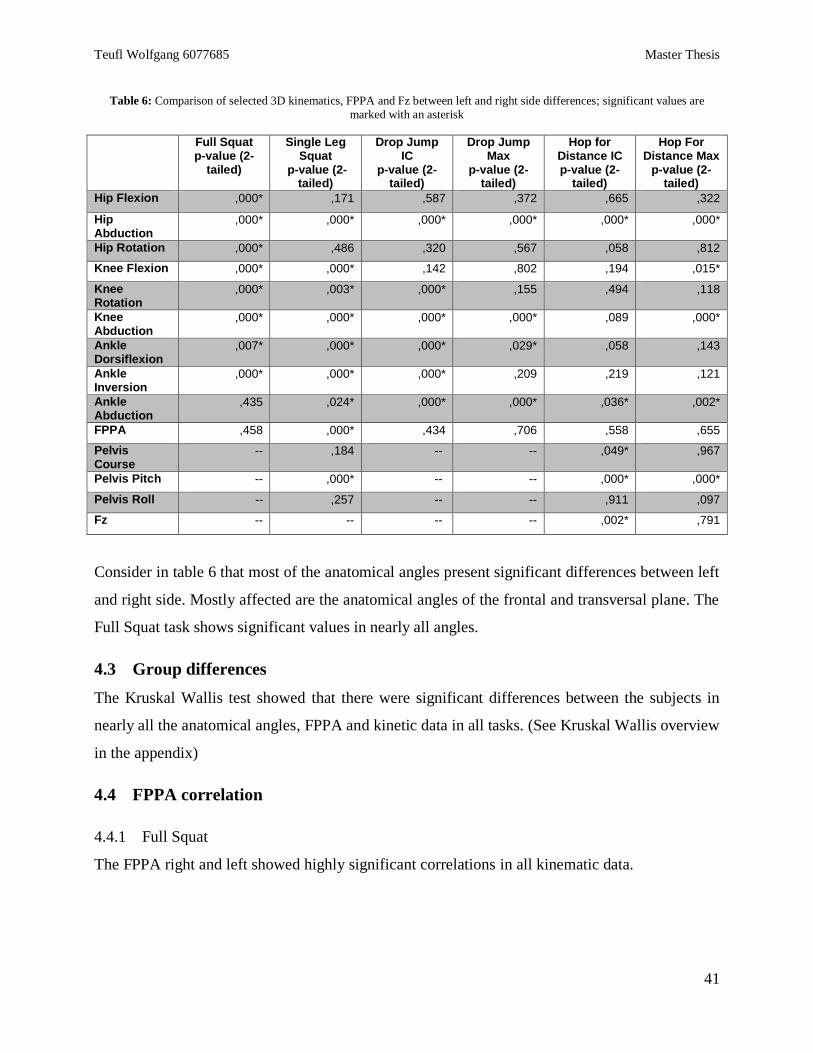
Teufl Wolfgang 6077685 Master Thesis
41
Table 6: Comparison of selected 3D kinematics, FPPA and Fz between left and right side differences; significant values are
marked with an asterisk
Full Squat p-value (2-
tailed)
Single Leg Squat
p-value (2-tailed)
Drop Jump IC
p-value (2-tailed)
Drop Jump Max
p-value (2-tailed)
Hop for Distance IC p-value (2-
tailed)
Hop For Distance Max
p-value (2-tailed)
Hip Flexion ,000* ,171 ,587 ,372 ,665 ,322
Hip Abduction
,000* ,000* ,000* ,000* ,000* ,000*
Hip Rotation ,000* ,486 ,320 ,567 ,058 ,812
Knee Flexion ,000* ,000* ,142 ,802 ,194 ,015*
Knee Rotation
,000* ,003* ,000* ,155 ,494 ,118
Knee Abduction
,000* ,000* ,000* ,000* ,089 ,000*
Ankle Dorsiflexion
,007* ,000* ,000* ,029* ,058 ,143
Ankle Inversion
,000* ,000* ,000* ,209 ,219 ,121
Ankle Abduction
,435 ,024* ,000* ,000* ,036* ,002*
FPPA ,458 ,000* ,434 ,706 ,558 ,655
Pelvis Course
-- ,184 -- -- ,049* ,967
Pelvis Pitch -- ,000* -- -- ,000* ,000*
Pelvis Roll -- ,257 -- -- ,911 ,097
Fz -- -- -- -- ,002* ,791
Consider in table 6 that most of the anatomical angles present significant differences between left
and right side. Mostly affected are the anatomical angles of the frontal and transversal plane. The
Full Squat task shows significant values in nearly all angles.
4.3 Group differences
The Kruskal Wallis test showed that there were significant differences between the subjects in
nearly all the anatomical angles, FPPA and kinetic data in all tasks. (See Kruskal Wallis overview
in the appendix)
4.4 FPPA correlation
4.4.1 Full Squat
The FPPA right and left showed highly significant correlations in all kinematic data.
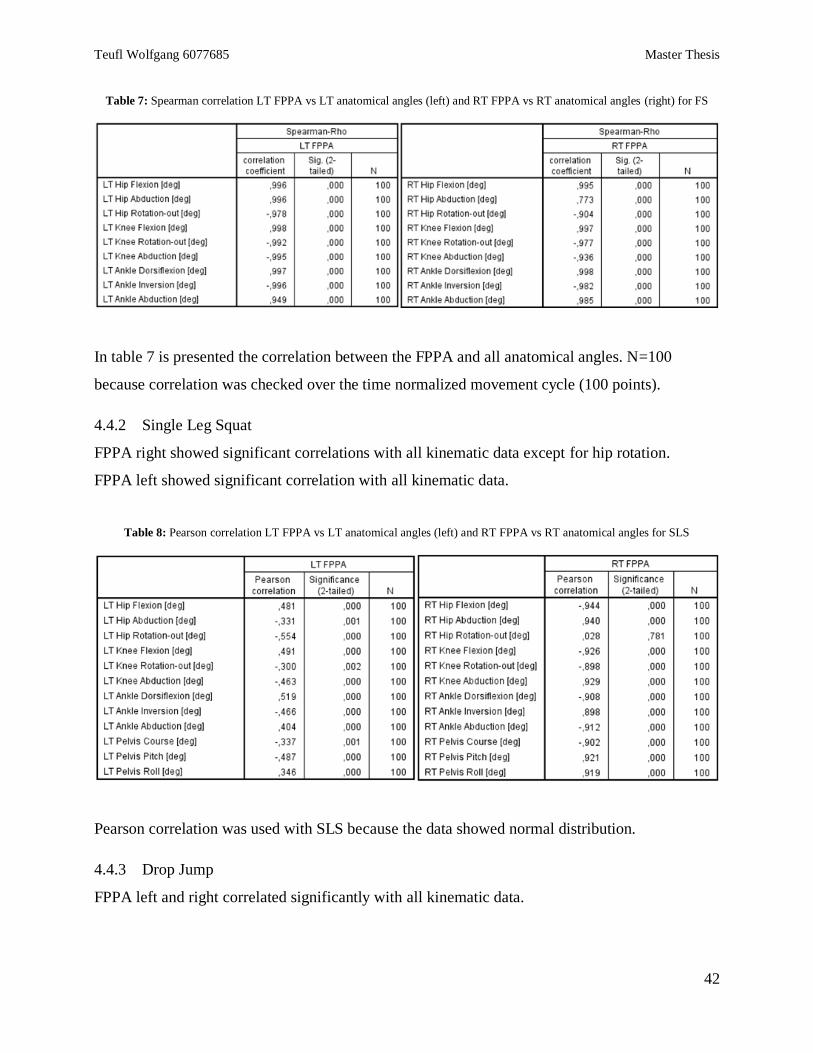
Teufl Wolfgang 6077685 Master Thesis
42
Table 7: Spearman correlation LT FPPA vs LT anatomical angles (left) and RT FPPA vs RT anatomical angles (right) for FS
In table 7 is presented the correlation between the FPPA and all anatomical angles. N=100
because correlation was checked over the time normalized movement cycle (100 points).
4.4.2 Single Leg Squat
FPPA right showed significant correlations with all kinematic data except for hip rotation.
FPPA left showed significant correlation with all kinematic data.
Table 8: Pearson correlation LT FPPA vs LT anatomical angles (left) and RT FPPA vs RT anatomical angles for SLS
Pearson correlation was used with SLS because the data showed normal distribution.
4.4.3 Drop Jump
FPPA left and right correlated significantly with all kinematic data.
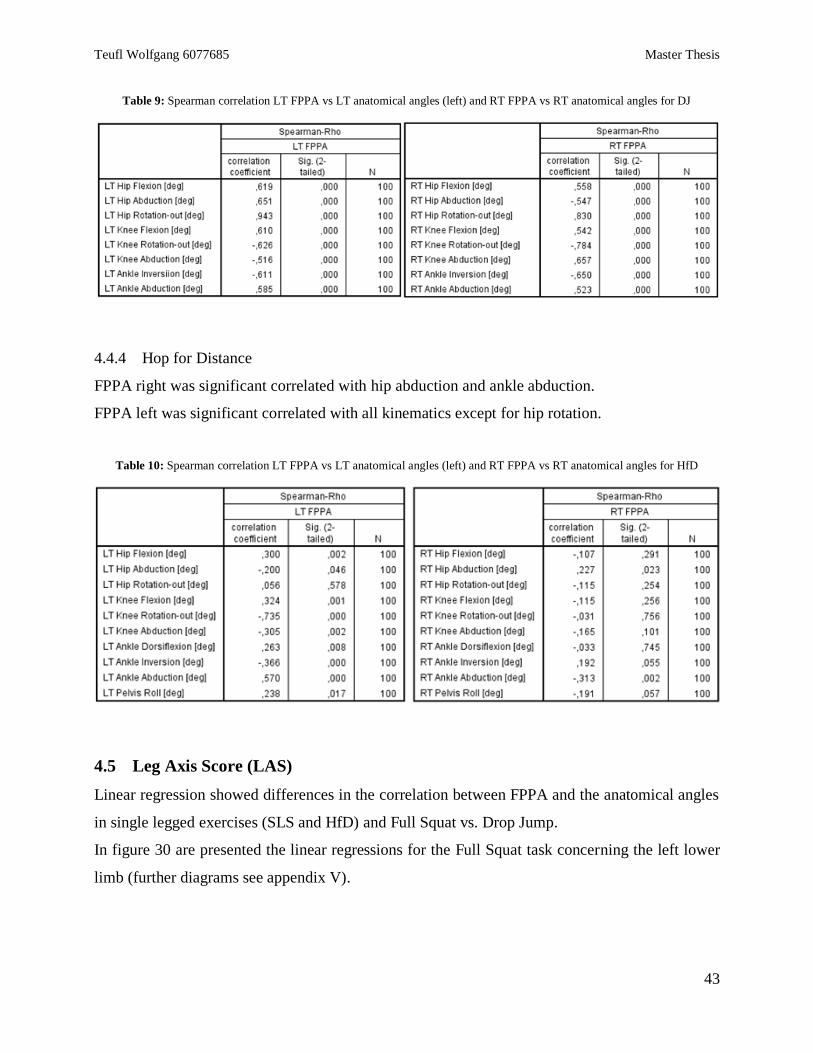
Teufl Wolfgang 6077685 Master Thesis
43
Table 9: Spearman correlation LT FPPA vs LT anatomical angles (left) and RT FPPA vs RT anatomical angles for DJ
4.4.4 Hop for Distance
FPPA right was significant correlated with hip abduction and ankle abduction.
FPPA left was significant correlated with all kinematics except for hip rotation.
Table 10: Spearman correlation LT FPPA vs LT anatomical angles (left) and RT FPPA vs RT anatomical angles for HfD
4.5 Leg Axis Score (LAS)
Linear regression showed differences in the correlation between FPPA and the anatomical angles
in single legged exercises (SLS and HfD) and Full Squat vs. Drop Jump.
In figure 30 are presented the linear regressions for the Full Squat task concerning the left lower
limb (further diagrams see appendix V).
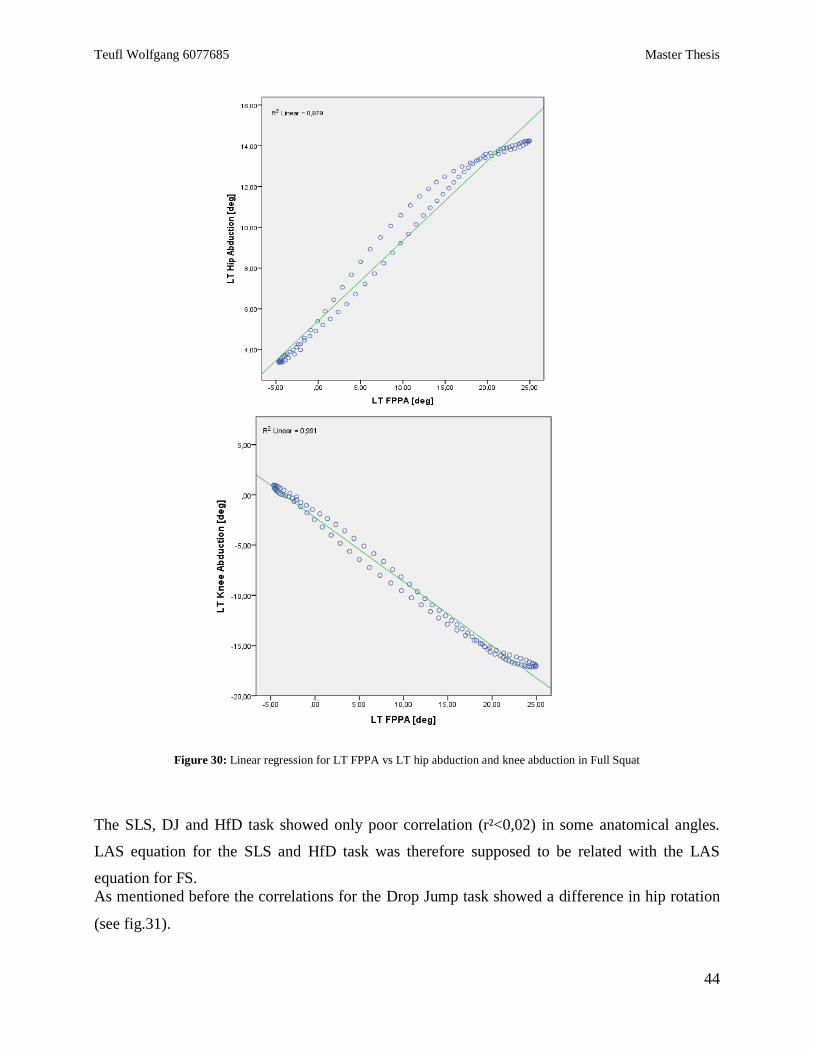
Teufl Wolfgang 6077685 Master Thesis
44
Figure 30: Linear regression for LT FPPA vs LT hip abduction and knee abduction in Full Squat
The SLS, DJ and HfD task showed only poor correlation (r²<0,02) in some anatomical angles.
LAS equation for the SLS and HfD task was therefore supposed to be related with the LAS
equation for FS.
As mentioned before the correlations for the Drop Jump task showed a difference in hip rotation
(see fig.31).
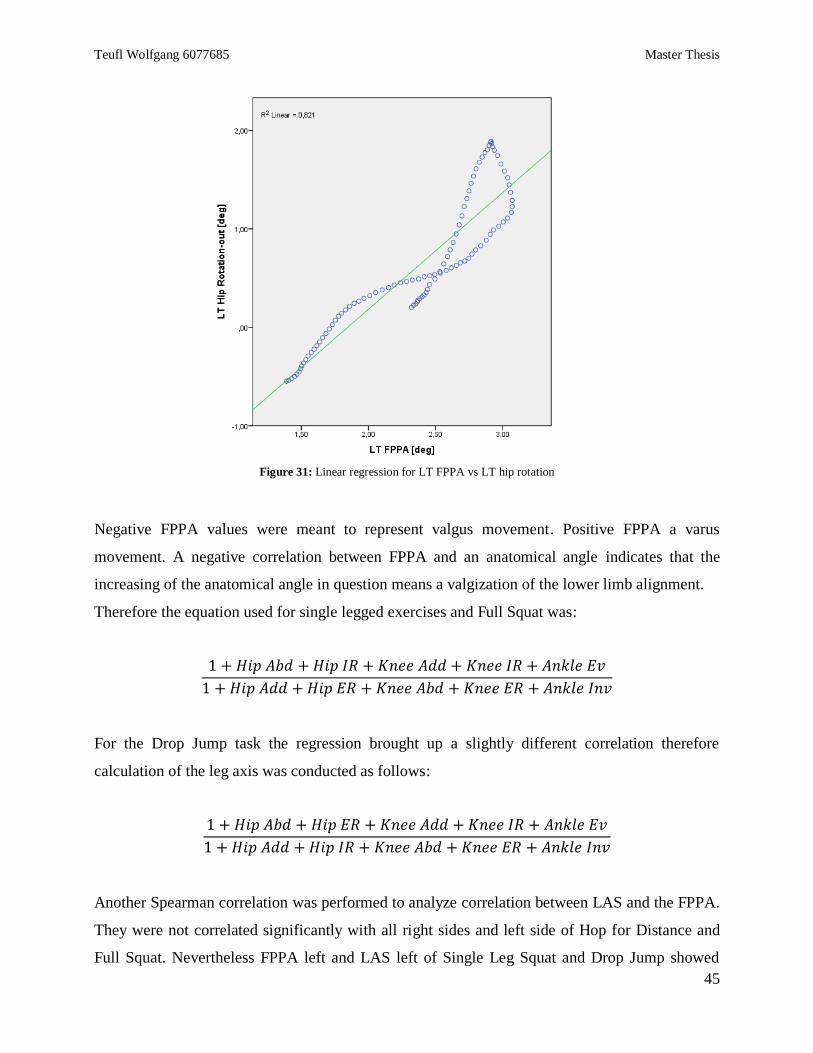
Teufl Wolfgang 6077685 Master Thesis
45
Figure 31: Linear regression for LT FPPA vs LT hip rotation
Negative FPPA values were meant to represent valgus movement. Positive FPPA a varus
movement. A negative correlation between FPPA and an anatomical angle indicates that the
increasing of the anatomical angle in question means a valgization of the lower limb alignment.
Therefore the equation used for single legged exercises and Full Squat was:
1 + 𝐻𝑖𝑝 𝐴𝑏𝑑 + 𝐻𝑖𝑝 𝐼𝑅 + 𝐾𝑛𝑒𝑒 𝐴𝑑𝑑 + 𝐾𝑛𝑒𝑒 𝐼𝑅 + 𝐴𝑛𝑘𝑙𝑒 𝐸𝑣
1 + 𝐻𝑖𝑝 𝐴𝑑𝑑 + 𝐻𝑖𝑝 𝐸𝑅 + 𝐾𝑛𝑒𝑒 𝐴𝑏𝑑 + 𝐾𝑛𝑒𝑒 𝐸𝑅 + 𝐴𝑛𝑘𝑙𝑒 𝐼𝑛𝑣
For the Drop Jump task the regression brought up a slightly different correlation therefore
calculation of the leg axis was conducted as follows:
1 + 𝐻𝑖𝑝 𝐴𝑏𝑑 + 𝐻𝑖𝑝 𝐸𝑅 + 𝐾𝑛𝑒𝑒 𝐴𝑑𝑑 + 𝐾𝑛𝑒𝑒 𝐼𝑅 + 𝐴𝑛𝑘𝑙𝑒 𝐸𝑣
1 + 𝐻𝑖𝑝 𝐴𝑑𝑑 + 𝐻𝑖𝑝 𝐼𝑅 + 𝐾𝑛𝑒𝑒 𝐴𝑏𝑑 + 𝐾𝑛𝑒𝑒 𝐸𝑅 + 𝐴𝑛𝑘𝑙𝑒 𝐼𝑛𝑣
Another Spearman correlation was performed to analyze correlation between LAS and the FPPA.
They were not correlated significantly with all right sides and left side of Hop for Distance and
Full Squat. Nevertheless FPPA left and LAS left of Single Leg Squat and Drop Jump showed
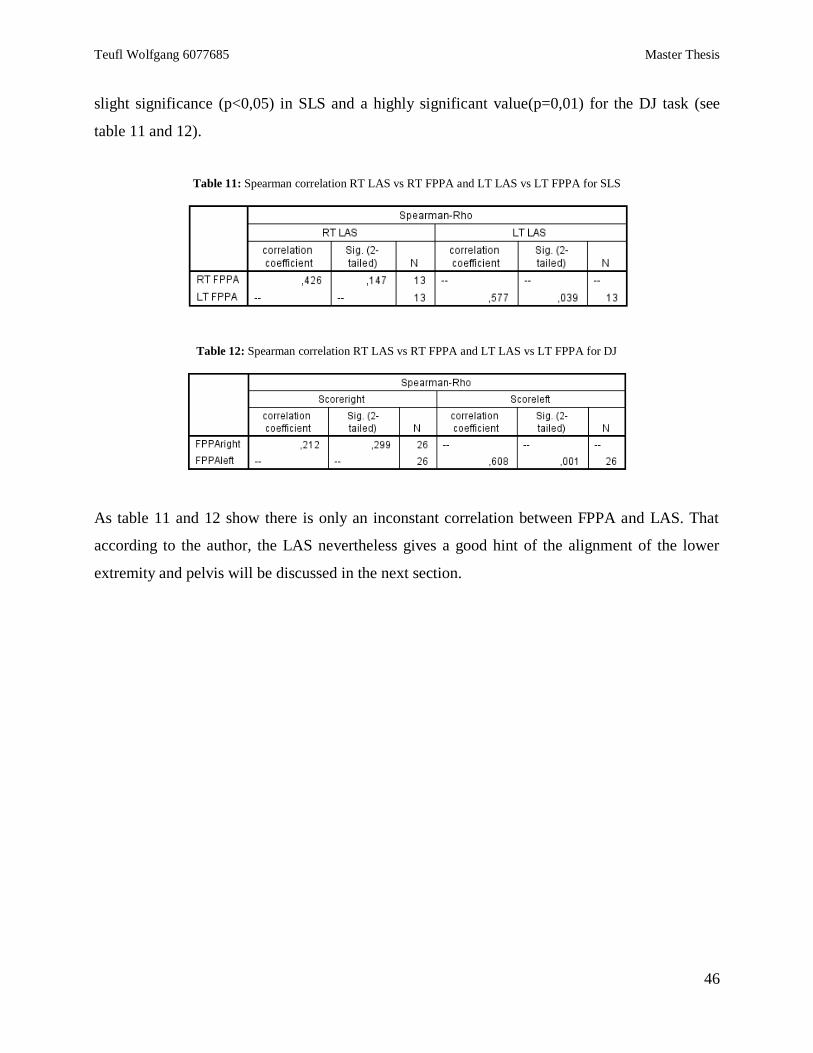
Teufl Wolfgang 6077685 Master Thesis
46
slight significance (p<0,05) in SLS and a highly significant value(p=0,01) for the DJ task (see
table 11 and 12).
Table 11: Spearman correlation RT LAS vs RT FPPA and LT LAS vs LT FPPA for SLS
Table 12: Spearman correlation RT LAS vs RT FPPA and LT LAS vs LT FPPA for DJ
As table 11 and 12 show there is only an inconstant correlation between FPPA and LAS. That
according to the author, the LAS nevertheless gives a good hint of the alignment of the lower
extremity and pelvis will be discussed in the next section.
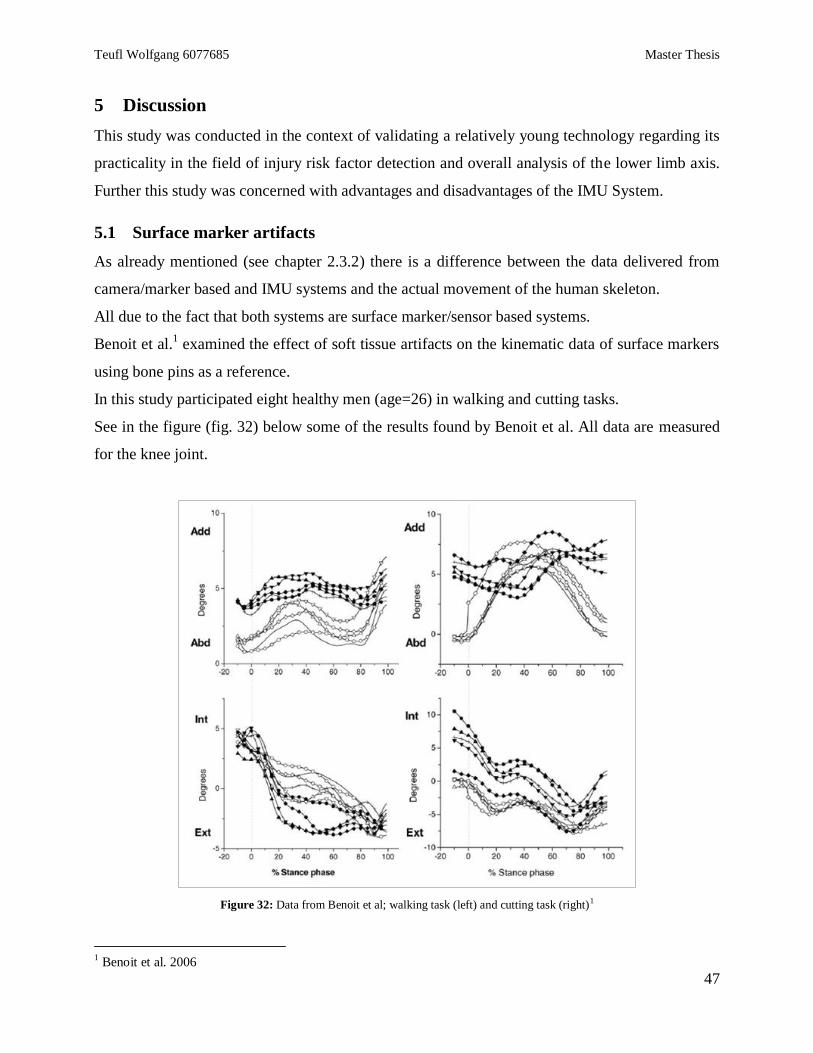
Teufl Wolfgang 6077685 Master Thesis
47
5 Discussion
This study was conducted in the context of validating a relatively young technology regarding its
practicality in the field of injury risk factor detection and overall analysis of the lower limb axis.
Further this study was concerned with advantages and disadvantages of the IMU System.
5.1 Surface marker artifacts
As already mentioned (see chapter 2.3.2) there is a difference between the data delivered from
camera/marker based and IMU systems and the actual movement of the human skeleton.
All due to the fact that both systems are surface marker/sensor based systems.
Benoit et al.1 examined the effect of soft tissue artifacts on the kinematic data of surface markers
using bone pins as a reference.
In this study participated eight healthy men (age=26) in walking and cutting tasks.
See in the figure (fig. 32) below some of the results found by Benoit et al. All data are measured
for the knee joint.
Figure 32: Data from Benoit et al; walking task (left) and cutting task (right)1
1 Benoit et al. 2006
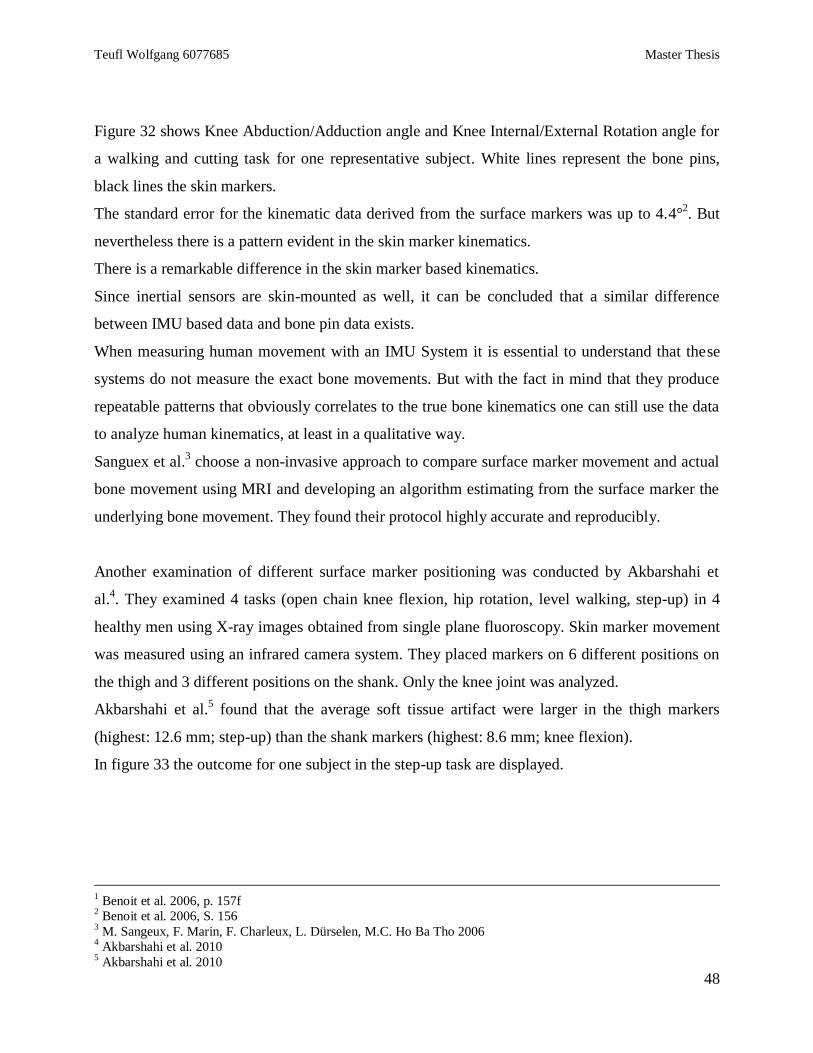
Teufl Wolfgang 6077685 Master Thesis
48
Figure 32 shows Knee Abduction/Adduction angle and Knee Internal/External Rotation angle for
a walking and cutting task for one representative subject. White lines represent the bone pins,
black lines the skin markers.
The standard error for the kinematic data derived from the surface markers was up to 4.4°2. But
nevertheless there is a pattern evident in the skin marker kinematics.
There is a remarkable difference in the skin marker based kinematics.
Since inertial sensors are skin-mounted as well, it can be concluded that a similar difference
between IMU based data and bone pin data exists.
When measuring human movement with an IMU System it is essential to understand that these
systems do not measure the exact bone movements. But with the fact in mind that they produce
repeatable patterns that obviously correlates to the true bone kinematics one can still use the data
to analyze human kinematics, at least in a qualitative way.
Sanguex et al.3 choose a non-invasive approach to compare surface marker movement and actual
bone movement using MRI and developing an algorithm estimating from the surface marker the
underlying bone movement. They found their protocol highly accurate and reproducibly.
Another examination of different surface marker positioning was conducted by Akbarshahi et
al.4. They examined 4 tasks (open chain knee flexion, hip rotation, level walking, step-up) in 4
healthy men using X-ray images obtained from single plane fluoroscopy. Skin marker movement
was measured using an infrared camera system. They placed markers on 6 different positions on
the thigh and 3 different positions on the shank. Only the knee joint was analyzed.
Akbarshahi et al.5 found that the average soft tissue artifact were larger in the thigh markers
(highest: 12.6 mm; step-up) than the shank markers (highest: 8.6 mm; knee flexion).
In figure 33 the outcome for one subject in the step-up task are displayed.
1 Benoit et al. 2006, p. 157f
2 Benoit et al. 2006, S. 156
3 M. Sangeux, F. Marin, F. Charleux, L. Dürselen, M.C. Ho Ba Tho 2006
4 Akbarshahi et al. 2010
5 Akbarshahi et al. 2010
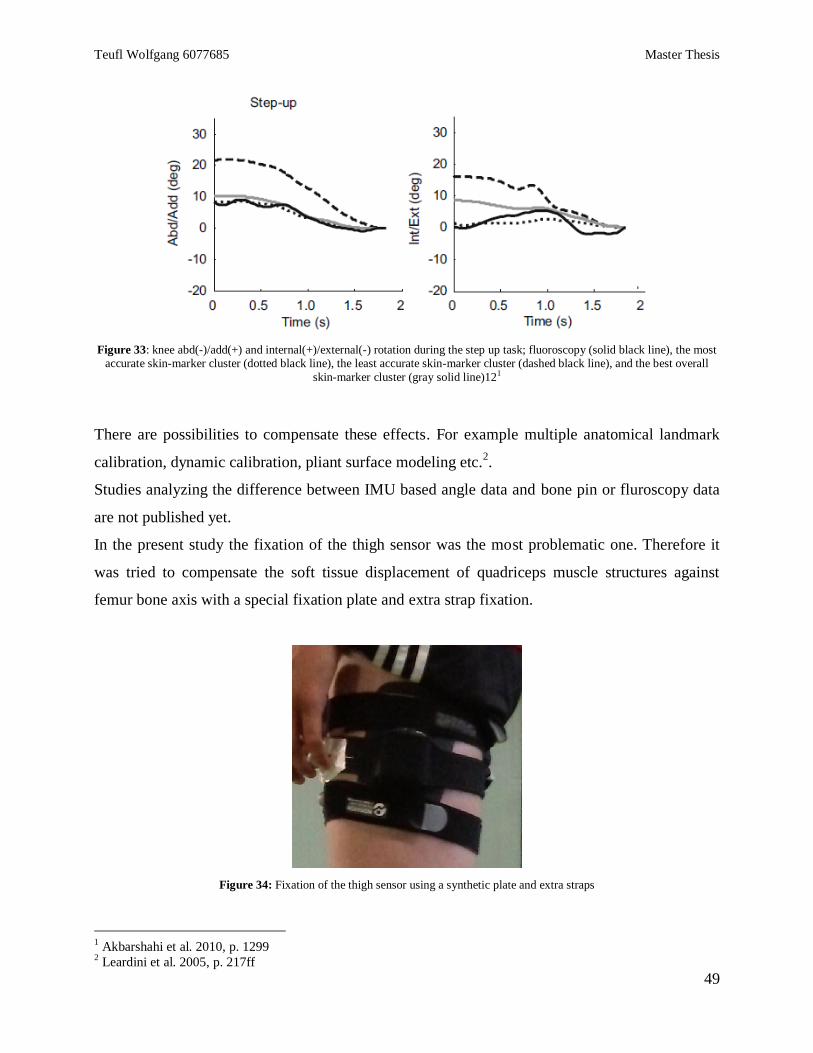
Teufl Wolfgang 6077685 Master Thesis
49
Figure 33: knee abd(-)/add(+) and internal(+)/external(-) rotation during the step up task; fluoroscopy (solid black line), the most accurate skin-marker cluster (dotted black line), the least accurate skin-marker cluster (dashed black line), and the best overall
skin-marker cluster (gray solid line)121
There are possibilities to compensate these effects. For example multiple anatomical landmark
calibration, dynamic calibration, pliant surface modeling etc.2.
Studies analyzing the difference between IMU based angle data and bone pin or fluroscopy data
are not published yet.
In the present study the fixation of the thigh sensor was the most problematic one. Therefore it
was tried to compensate the soft tissue displacement of quadriceps muscle structures against
femur bone axis with a special fixation plate and extra strap fixation.
Figure 34: Fixation of the thigh sensor using a synthetic plate and extra straps
1 Akbarshahi et al. 2010, p. 1299
2 Leardini et al. 2005, p. 217ff
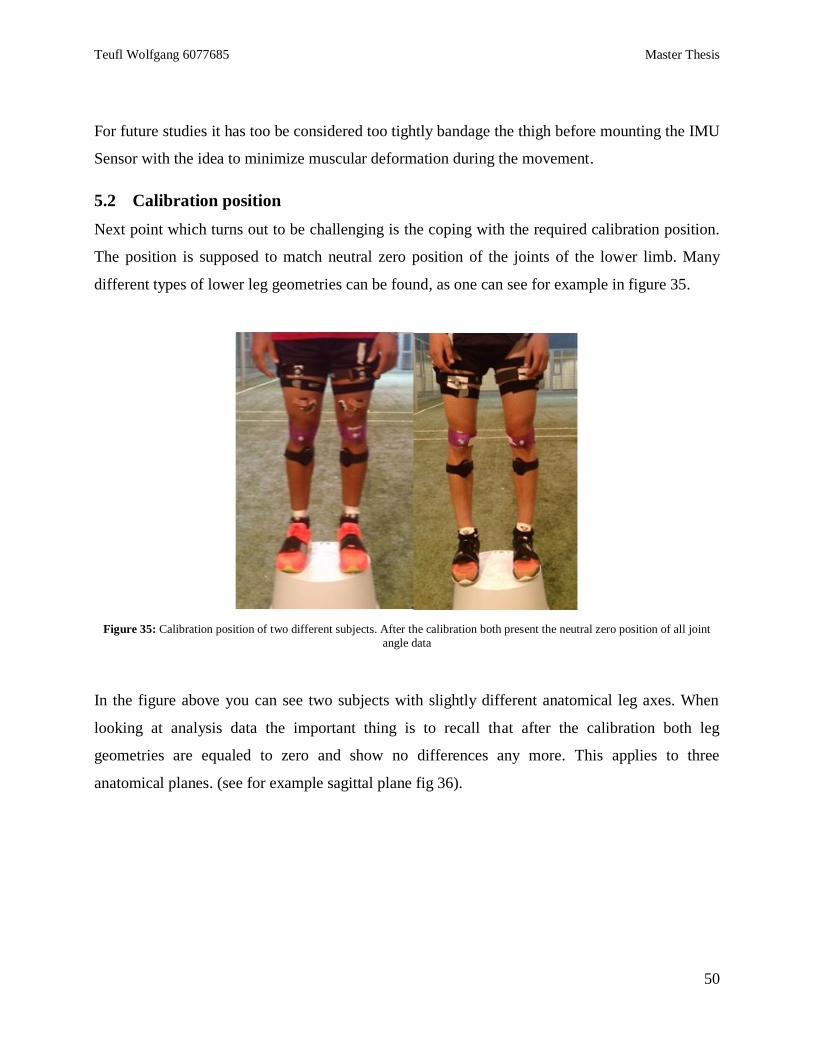
Teufl Wolfgang 6077685 Master Thesis
50
For future studies it has too be considered too tightly bandage the thigh before mounting the IMU
Sensor with the idea to minimize muscular deformation during the movement.
5.2 Calibration position
Next point which turns out to be challenging is the coping with the required calibration position.
The position is supposed to match neutral zero position of the joints of the lower limb. Many
different types of lower leg geometries can be found, as one can see for example in figure 35.
Figure 35: Calibration position of two different subjects. After the calibration both present the neutral zero position of all joint
angle data
In the figure above you can see two subjects with slightly different anatomical leg axes. When
looking at analysis data the important thing is to recall that after the calibration both leg
geometries are equaled to zero and show no differences any more. This applies to three
anatomical planes. (see for example sagittal plane fig 36).
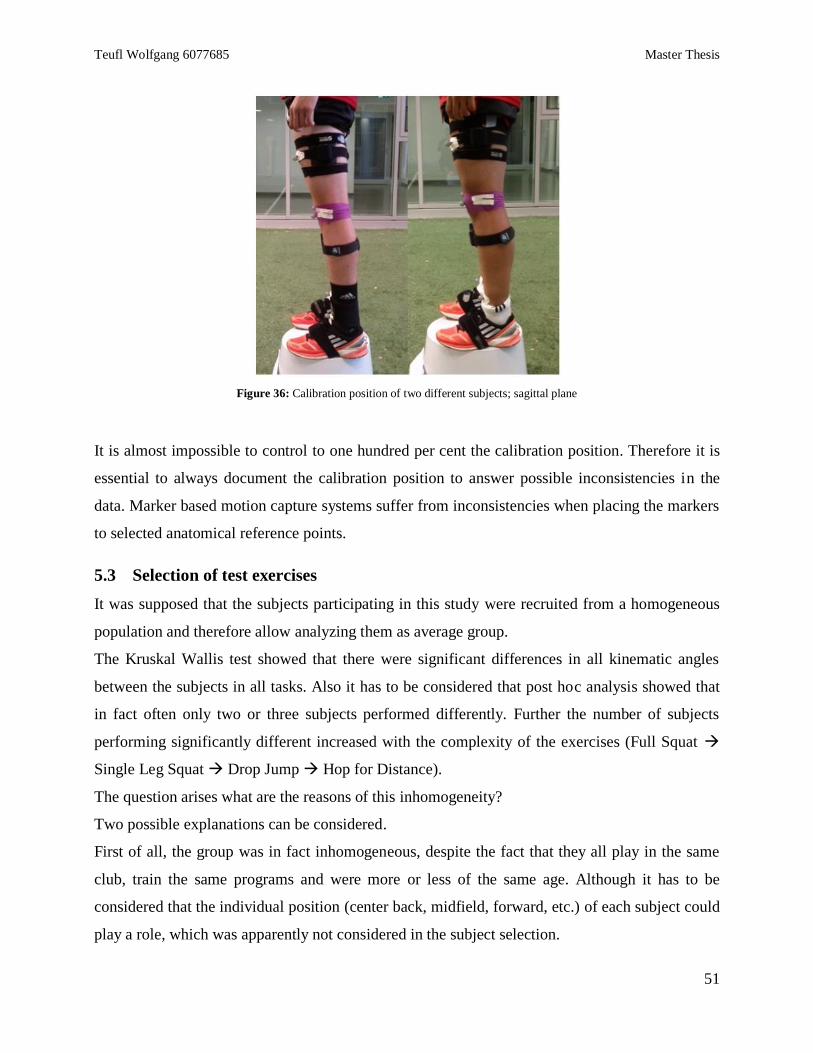
Teufl Wolfgang 6077685 Master Thesis
51
Figure 36: Calibration position of two different subjects; sagittal plane
It is almost impossible to control to one hundred per cent the calibration position. Therefore it is
essential to always document the calibration position to answer possible inconsistencies in the
data. Marker based motion capture systems suffer from inconsistencies when placing the markers
to selected anatomical reference points.
5.3 Selection of test exercises
It was supposed that the subjects participating in this study were recruited from a homogeneous
population and therefore allow analyzing them as average group.
The Kruskal Wallis test showed that there were significant differences in all kinematic angles
between the subjects in all tasks. Also it has to be considered that post hoc analysis showed that
in fact often only two or three subjects performed differently. Further the number of subjects
performing significantly different increased with the complexity of the exercises (Full Squat
Single Leg Squat Drop Jump Hop for Distance).
The question arises what are the reasons of this inhomogeneity?
Two possible explanations can be considered.
First of all, the group was in fact inhomogeneous, despite the fact that they all play in the same
club, train the same programs and were more or less of the same age. Although it has to be
considered that the individual position (center back, midfield, forward, etc.) of each subject could
play a role, which was apparently not considered in the subject selection.
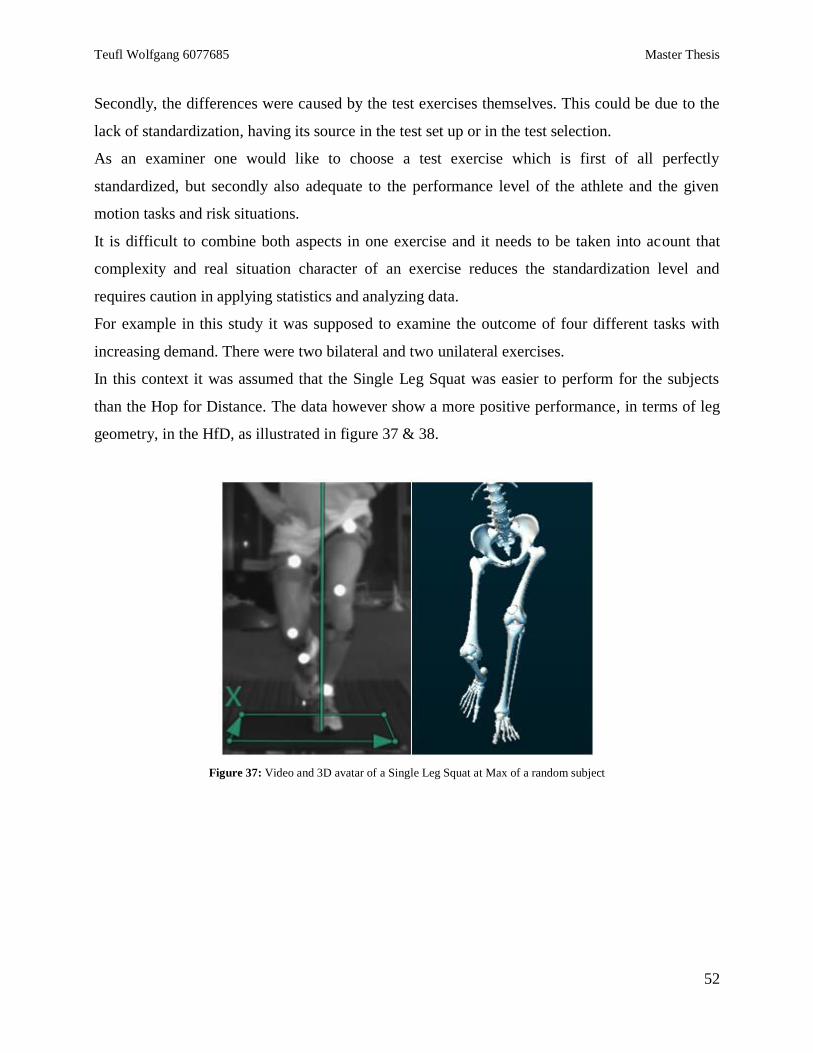
Teufl Wolfgang 6077685 Master Thesis
52
Secondly, the differences were caused by the test exercises themselves. This could be due to the
lack of standardization, having its source in the test set up or in the test selection.
As an examiner one would like to choose a test exercise which is first of all perfectly
standardized, but secondly also adequate to the performance level of the athlete and the given
motion tasks and risk situations.
It is difficult to combine both aspects in one exercise and it needs to be taken into acount that
complexity and real situation character of an exercise reduces the standardization level and
requires caution in applying statistics and analyzing data.
For example in this study it was supposed to examine the outcome of four different tasks with
increasing demand. There were two bilateral and two unilateral exercises.
In this context it was assumed that the Single Leg Squat was easier to perform for the subjects
than the Hop for Distance. The data however show a more positive performance, in terms of leg
geometry, in the HfD, as illustrated in figure 37 & 38.
Figure 37: Video and 3D avatar of a Single Leg Squat at Max of a random subject
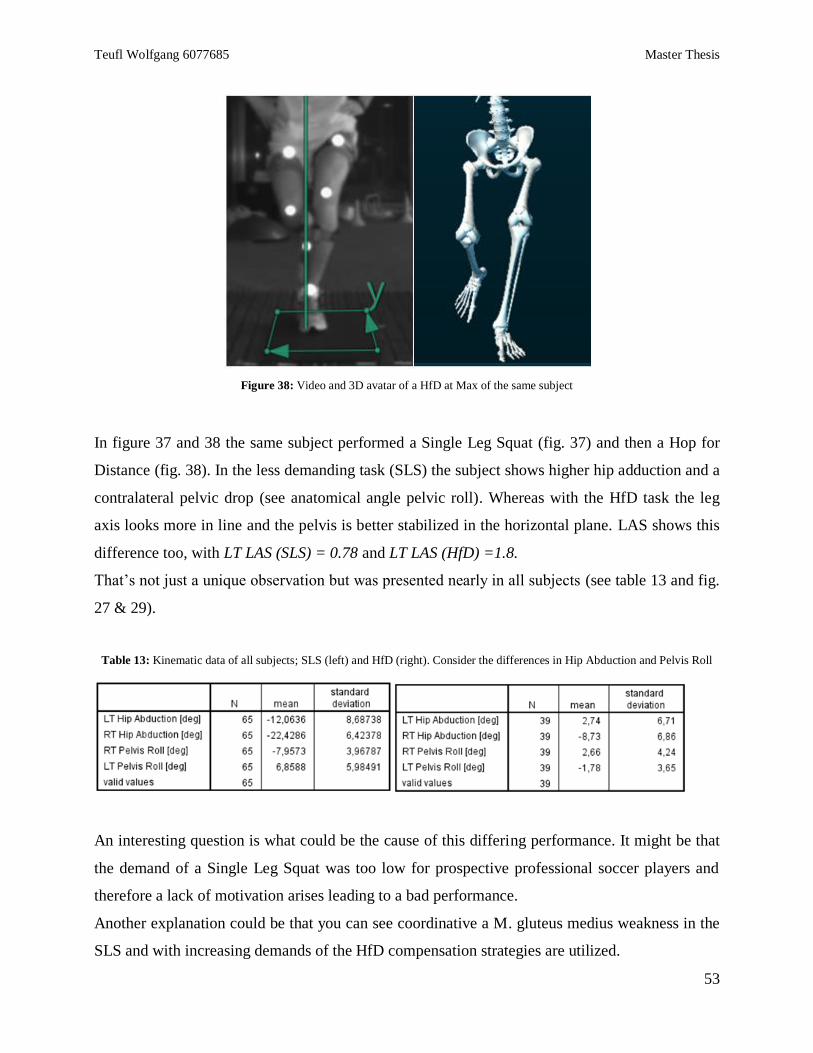
Teufl Wolfgang 6077685 Master Thesis
53
Figure 38: Video and 3D avatar of a HfD at Max of the same subject
In figure 37 and 38 the same subject performed a Single Leg Squat (fig. 37) and then a Hop for
Distance (fig. 38). In the less demanding task (SLS) the subject shows higher hip adduction and a
contralateral pelvic drop (see anatomical angle pelvic roll). Whereas with the HfD task the leg
axis looks more in line and the pelvis is better stabilized in the horizontal plane. LAS shows this
difference too, with LT LAS (SLS) = 0.78 and LT LAS (HfD) =1.8.
That’s not just a unique observation but was presented nearly in all subjects (see table 13 and fig.
27 & 29).
Table 13: Kinematic data of all subjects; SLS (left) and HfD (right). Consider the differences in Hip Abduction and Pelvis Roll
An interesting question is what could be the cause of this differing performance. It might be that
the demand of a Single Leg Squat was too low for prospective professional soccer players and
therefore a lack of motivation arises leading to a bad performance.
Another explanation could be that you can see coordinative a M. gluteus medius weakness in the
SLS and with increasing demands of the HfD compensation strategies are utilized.
Teufl Wolfgang 6077685 Master Thesis
54
Important difference between both motion tasks is that the single leg squat is a voluntary
controlled concentric eccentric contraction at low contraction speed whereas the Hop for
Distance is operated in the stretch-shortening cycle of muscle contraction1 and requires pre-
innervation of muscle due to stiffness regulation and optimal impact absorption. It can be
hypothesized that the neuromuscular demands of both exercises require different motor control
skills.
Further EMG studies may help to better understand the analytical value of such exercise classes
in relation to leg geometry analysis.
5.4 LAS
The LAS was supposed to be a first approach to get a quick interpretation of the leg axis using
IMU based kinematic data.
How the equation was designed was explained in chapter 4.5.
The basic idea was to compare varus and valgus components in a simple division:
1 + 𝑉𝑎𝑟𝑢𝑠 𝑐𝑜𝑚𝑝𝑜𝑛𝑒𝑛𝑡𝑠
1 + 𝑉𝑎𝑙𝑔𝑢𝑠 𝑐𝑜𝑚𝑝𝑜𝑛𝑒𝑛𝑡𝑠
1 was included in the equation because of the possibility that varus and valgus equal each other.
After evaluating the valgus and varus components using the correlation of the anatomical angles
with the FPPA the equation for FS, SLS and HfD was:
1 + 𝐻𝑖𝑝 𝐴𝑏𝑑 + 𝐻𝑖𝑝 𝐼𝑅 + 𝐾𝑛𝑒𝑒 𝐴𝑑𝑑 + 𝐾𝑛𝑒𝑒 𝐼𝑅 + 𝐴𝑛𝑘𝑙𝑒 𝐸𝑣
1 + 𝐻𝑖𝑝 𝐴𝑑𝑑 + 𝐻𝑖𝑝 𝐸𝑅 + 𝐾𝑛𝑒𝑒 𝐴𝑏𝑑 + 𝐾𝑛𝑒𝑒 𝐸𝑅 + 𝐴𝑛𝑘𝑙𝑒 𝐼𝑛𝑣
Equation for DJ was made out to:
1 + 𝐻𝑖𝑝 𝐴𝑏𝑑 + 𝐻𝑖𝑝 𝐸𝑅 + 𝐾𝑛𝑒𝑒 𝐴𝑑𝑑 + 𝐾𝑛𝑒𝑒 𝐼𝑅 + 𝐴𝑛𝑘𝑙𝑒 𝐸𝑣
1 + 𝐻𝑖𝑝 𝐴𝑑𝑑 + 𝐻𝑖𝑝 𝐼𝑅 + 𝐾𝑛𝑒𝑒 𝐴𝑏𝑑 + 𝐾𝑛𝑒𝑒 𝐸𝑅 + 𝐴𝑛𝑘𝑙𝑒 𝐼𝑛𝑣
1 Komi 2000
Teufl Wolfgang 6077685 Master Thesis
55
The LAS is supposed to represent all joint angles deviations of the transversal and frontal plane
from the hip, knee and ankle. In this first approach all angles are considered with the same
weighting.
For two of the four exercises Hip external rotation was related to valgus alignment (see chapter
4.5 fig. 30). But according to recent literature the relation is meant to be just vice versa1.
One possible reason that could explain this difference is that most of the researchers do not seem
to concern themselves with the position of the pelvis. One of the few doing otherwise is Willson
et al.2. They found that a negative FPPA was inversely correlated with a contralateral pelvic drop
(p=0.06) and directly correlated with contralateral posterior pelvic rotation (p=0.03)3.
The anatomical IMU data lack a direct calculation of pelvic movements like pelvic depression,
elevation or rotation4. The orientation angles of the pelvis sensor allow it to analyze the absolute
position of the pelvis according to the calibration position.
In this regard one important factor when analyzing the leg axis is the pelvic roll angle, which was
shown already in a previous chapter (5.3).
According to figure 37 & 38 and the data from table 13 it can be assumed that the pelvis roll
follows approximately the pelvic depression.
Therefore, along anatomical knowledge, if the pelvis drops to the contralateral side there is an
inevitable hip external rotation on the ipsilateral side.
So the hip abduction seems to be important to provide information about the leg axis. Because it
not just delivers the obvious information about the hip movement but also it contains within
information about the positioning of the pelvis. As shown in the diagram (fig. 39) below.
1 Powers 2010
2 Willson John D. und Davis Irene S. 2008
3 Willson John D. und Davis Irene S. 2008, S. 610
4 Schünke et al. 2005
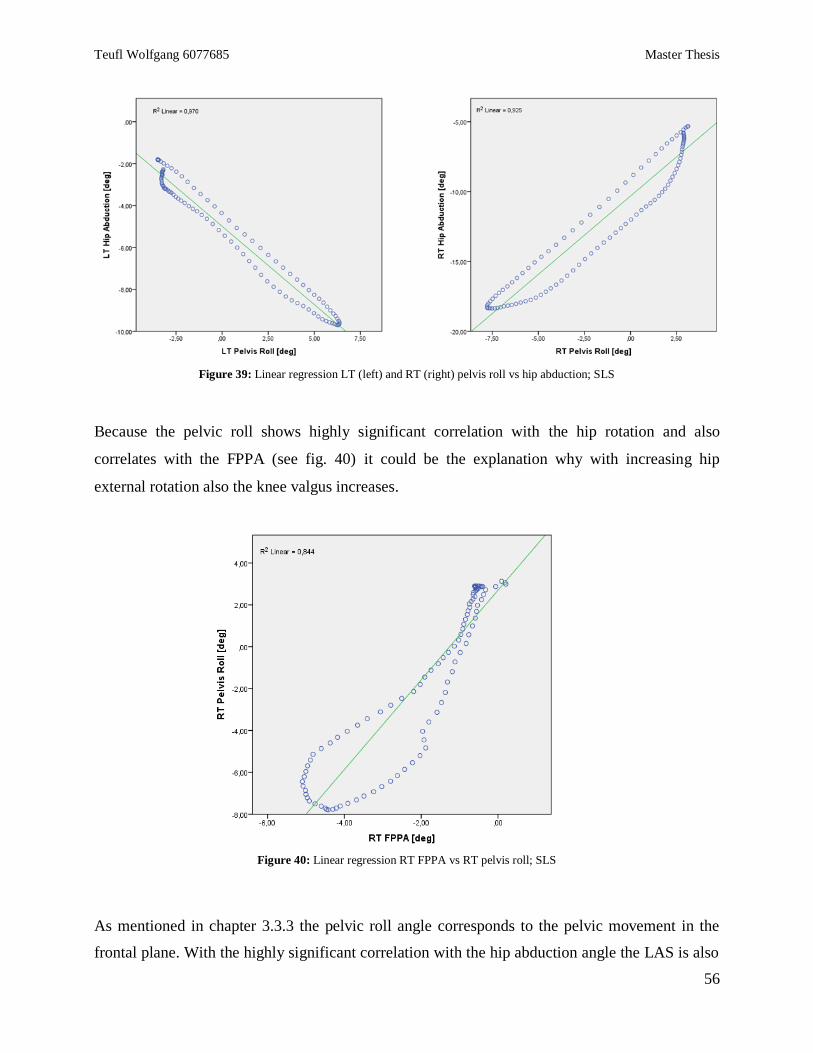
Teufl Wolfgang 6077685 Master Thesis
56
Figure 39: Linear regression LT (left) and RT (right) pelvis roll vs hip abduction; SLS
Because the pelvic roll shows highly significant correlation with the hip rotation and also
correlates with the FPPA (see fig. 40) it could be the explanation why with increasing hip
external rotation also the knee valgus increases.
Figure 40: Linear regression RT FPPA vs RT pelvis roll; SLS
As mentioned in chapter 3.3.3 the pelvic roll angle corresponds to the pelvic movement in the
frontal plane. With the highly significant correlation with the hip abduction angle the LAS is also
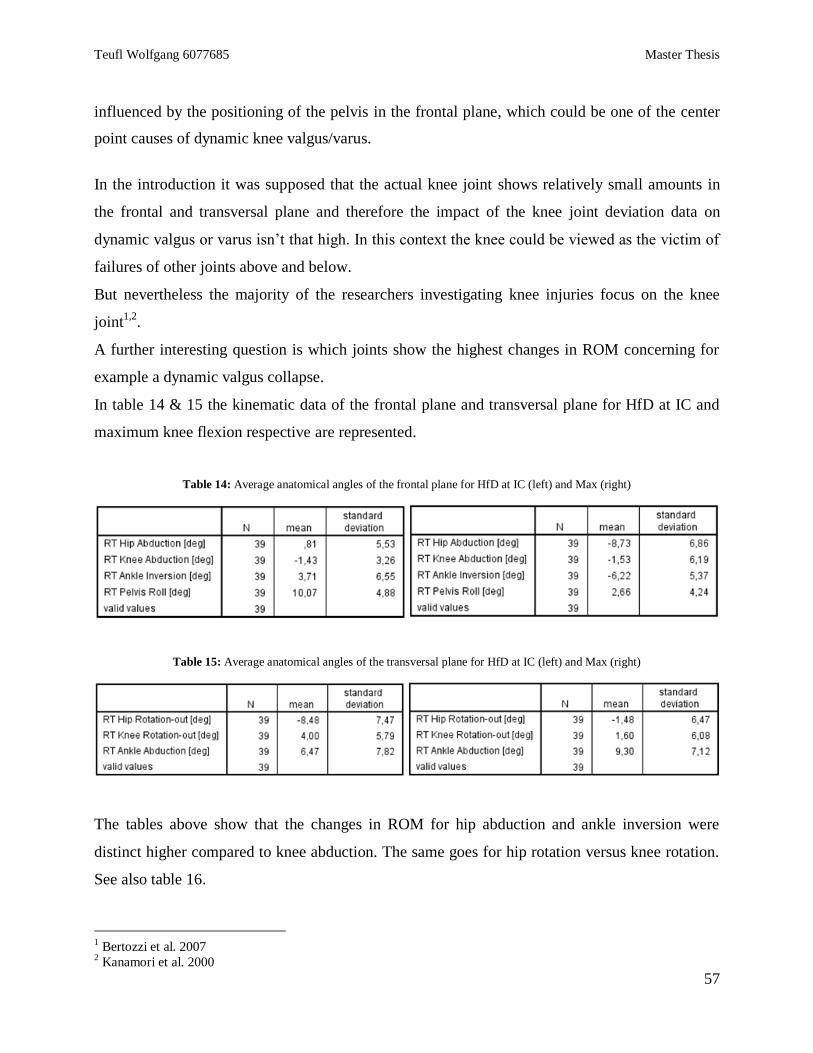
Teufl Wolfgang 6077685 Master Thesis
57
influenced by the positioning of the pelvis in the frontal plane, which could be one of the center
point causes of dynamic knee valgus/varus.
In the introduction it was supposed that the actual knee joint shows relatively small amounts in
the frontal and transversal plane and therefore the impact of the knee joint deviation data on
dynamic valgus or varus isn’t that high. In this context the knee could be viewed as the victim of
failures of other joints above and below.
But nevertheless the majority of the researchers investigating knee injuries focus on the knee
joint1,2
.
A further interesting question is which joints show the highest changes in ROM concerning for
example a dynamic valgus collapse.
In table 14 & 15 the kinematic data of the frontal plane and transversal plane for HfD at IC and
maximum knee flexion respective are represented.
Table 14: Average anatomical angles of the frontal plane for HfD at IC (left) and Max (right)
Table 15: Average anatomical angles of the transversal plane for HfD at IC (left) and Max (right)
The tables above show that the changes in ROM for hip abduction and ankle inversion were
distinct higher compared to knee abduction. The same goes for hip rotation versus knee rotation.
See also table 16.
1 Bertozzi et al. 2007
2 Kanamori et al. 2000
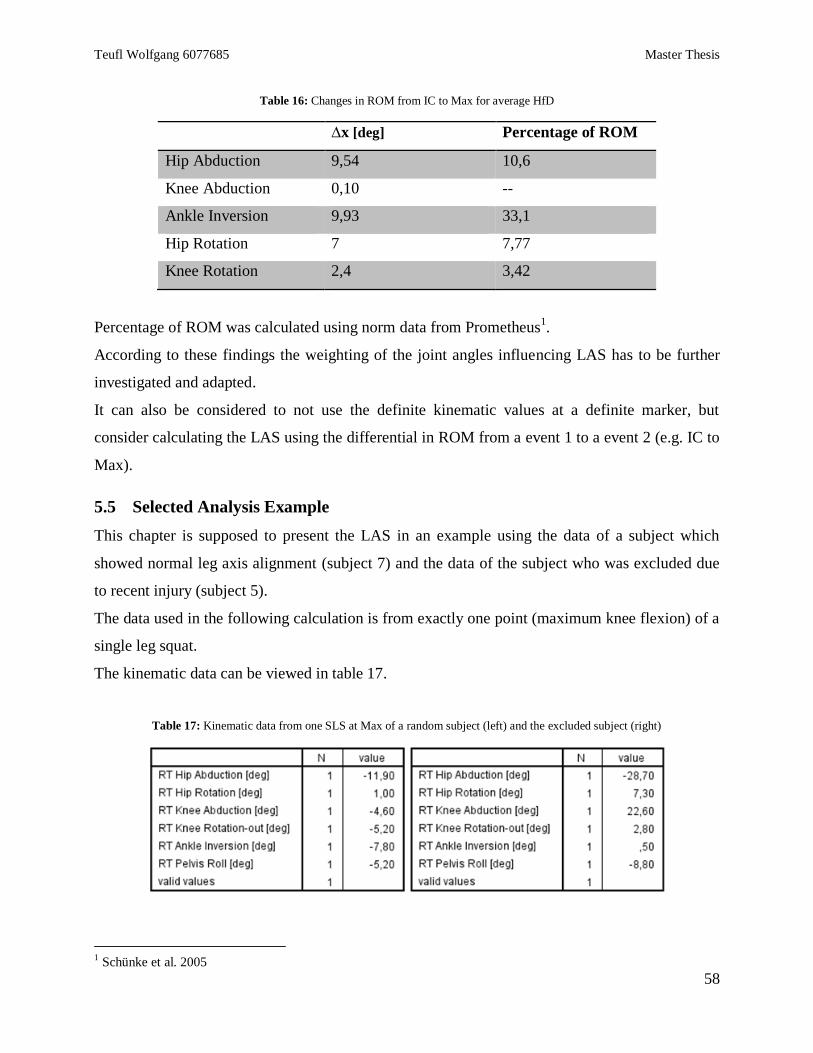
Teufl Wolfgang 6077685 Master Thesis
58
Table 16: Changes in ROM from IC to Max for average HfD
∆x [deg] Percentage of ROM
Hip Abduction 9,54 10,6
Knee Abduction 0,10 --
Ankle Inversion 9,93 33,1
Hip Rotation 7 7,77
Knee Rotation 2,4 3,42
Percentage of ROM was calculated using norm data from Prometheus1.
According to these findings the weighting of the joint angles influencing LAS has to be further
investigated and adapted.
It can also be considered to not use the definite kinematic values at a definite marker, but
consider calculating the LAS using the differential in ROM from a event 1 to a event 2 (e.g. IC to
Max).
5.5 Selected Analysis Example
This chapter is supposed to present the LAS in an example using the data of a subject which
showed normal leg axis alignment (subject 7) and the data of the subject who was excluded due
to recent injury (subject 5).
The data used in the following calculation is from exactly one point (maximum knee flexion) of a
single leg squat.
The kinematic data can be viewed in table 17.
Table 17: Kinematic data from one SLS at Max of a random subject (left) and the excluded subject (right)
1 Schünke et al. 2005
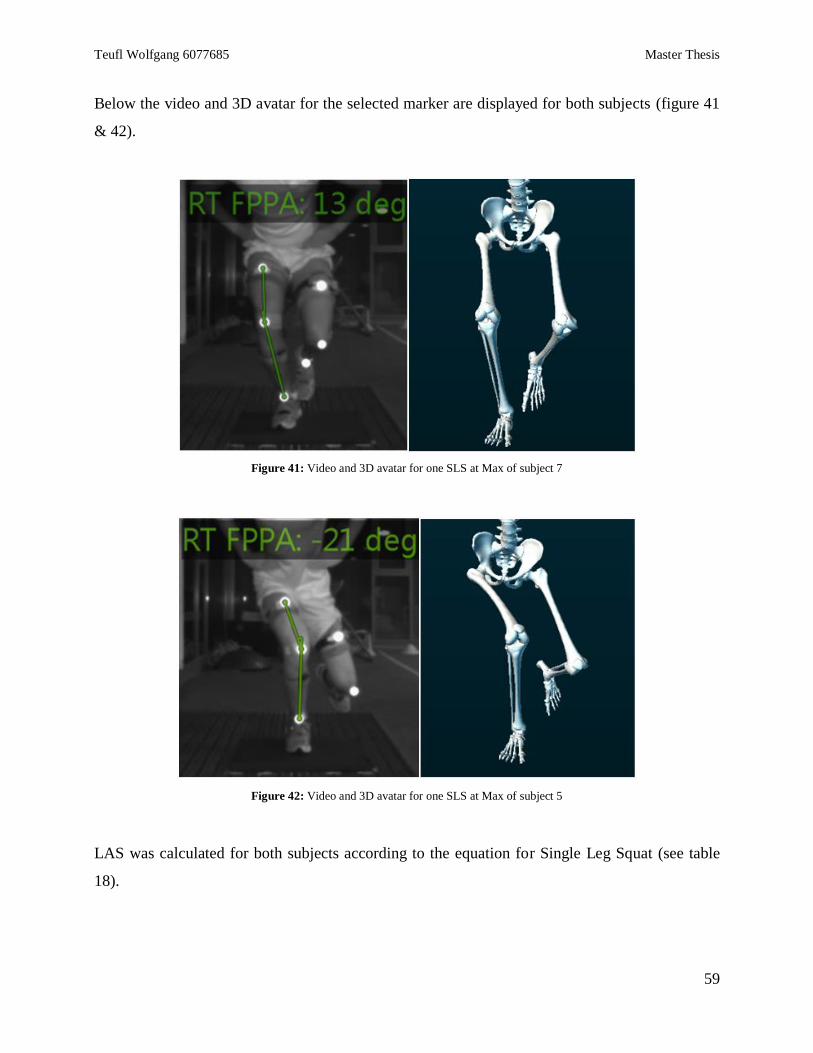
Teufl Wolfgang 6077685 Master Thesis
59
Below the video and 3D avatar for the selected marker are displayed for both subjects (figure 41
& 42).
Figure 41: Video and 3D avatar for one SLS at Max of subject 7
Figure 42: Video and 3D avatar for one SLS at Max of subject 5
LAS was calculated for both subjects according to the equation for Single Leg Squat (see table
18).
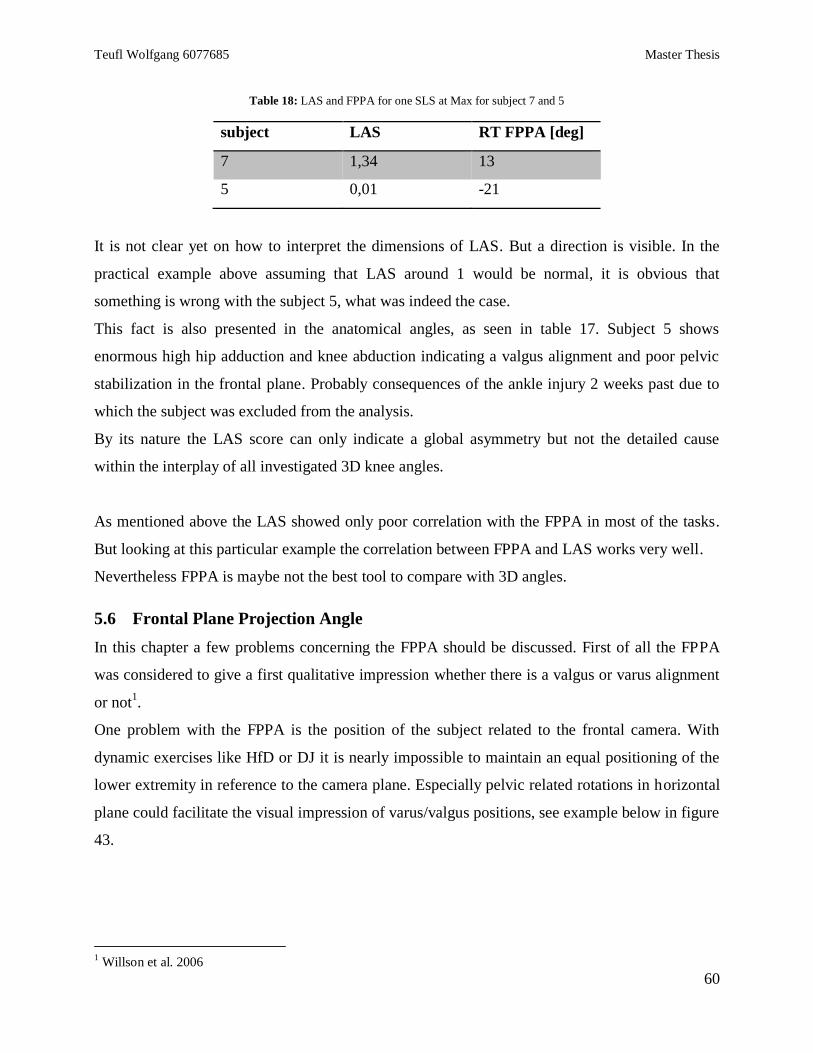
Teufl Wolfgang 6077685 Master Thesis
60
Table 18: LAS and FPPA for one SLS at Max for subject 7 and 5
subject LAS RT FPPA [deg]
7 1,34 13
5 0,01 -21
It is not clear yet on how to interpret the dimensions of LAS. But a direction is visible. In the
practical example above assuming that LAS around 1 would be normal, it is obvious that
something is wrong with the subject 5, what was indeed the case.
This fact is also presented in the anatomical angles, as seen in table 17. Subject 5 shows
enormous high hip adduction and knee abduction indicating a valgus alignment and poor pelvic
stabilization in the frontal plane. Probably consequences of the ankle injury 2 weeks past due to
which the subject was excluded from the analysis.
By its nature the LAS score can only indicate a global asymmetry but not the detailed cause
within the interplay of all investigated 3D knee angles.
As mentioned above the LAS showed only poor correlation with the FPPA in most of the tasks.
But looking at this particular example the correlation between FPPA and LAS works very well.
Nevertheless FPPA is maybe not the best tool to compare with 3D angles.
5.6 Frontal Plane Projection Angle
In this chapter a few problems concerning the FPPA should be discussed. First of all the FPPA
was considered to give a first qualitative impression whether there is a valgus or varus alignment
or not1.
One problem with the FPPA is the position of the subject related to the frontal camera. With
dynamic exercises like HfD or DJ it is nearly impossible to maintain an equal positioning of the
lower extremity in reference to the camera plane. Especially pelvic related rotations in horizontal
plane could facilitate the visual impression of varus/valgus positions, see example below in figure
43.
1 Willson et al. 2006
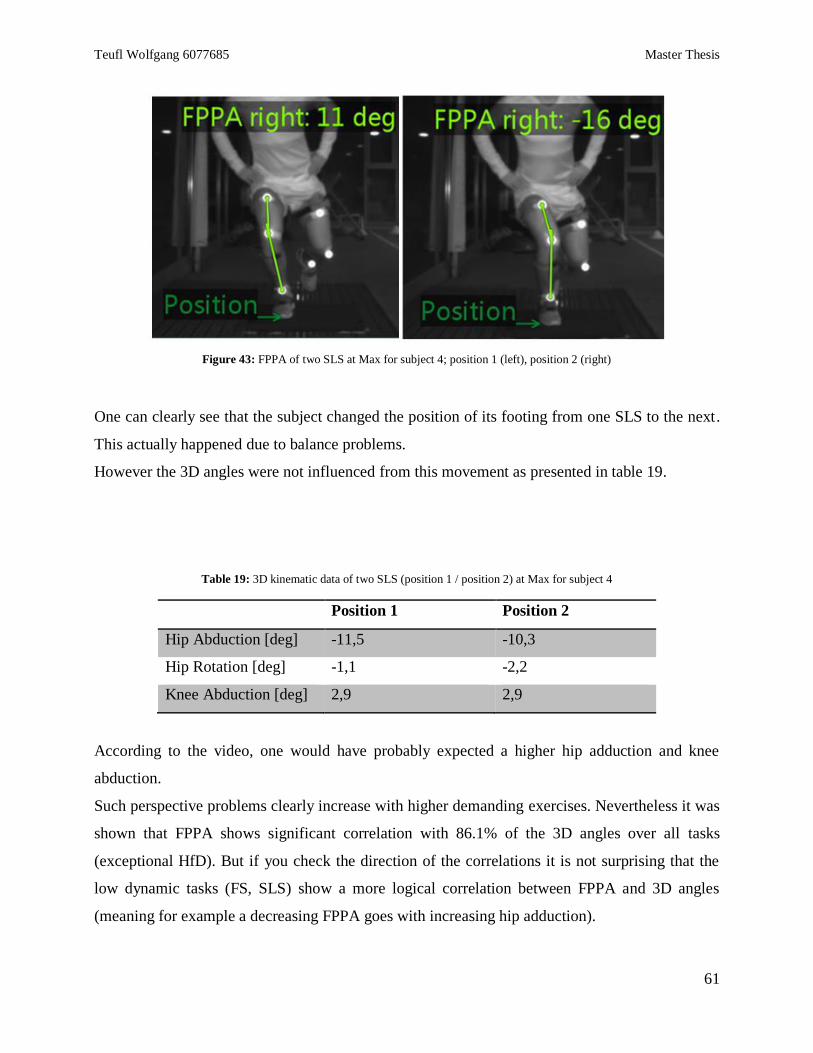
Teufl Wolfgang 6077685 Master Thesis
61
Figure 43: FPPA of two SLS at Max for subject 4; position 1 (left), position 2 (right)
One can clearly see that the subject changed the position of its footing from one SLS to the next.
This actually happened due to balance problems.
However the 3D angles were not influenced from this movement as presented in table 19.
Table 19: 3D kinematic data of two SLS (position 1 / position 2) at Max for subject 4
Position 1 Position 2
Hip Abduction [deg] -11,5 -10,3
Hip Rotation [deg] -1,1 -2,2
Knee Abduction [deg] 2,9 2,9
According to the video, one would have probably expected a higher hip adduction and knee
abduction.
Such perspective problems clearly increase with higher demanding exercises. Nevertheless it was
shown that FPPA shows significant correlation with 86.1% of the 3D angles over all tasks
(exceptional HfD). But if you check the direction of the correlations it is not surprising that the
low dynamic tasks (FS, SLS) show a more logical correlation between FPPA and 3D angles
(meaning for example a decreasing FPPA goes with increasing hip adduction).
Teufl Wolfgang 6077685 Master Thesis
62
It would have been interesting to examine if the FPPA correlates with the pelvic rotation in the
horizontal plane. But the orientation angle “pelvis course”, which refers to the motion of the
pelvis sensor around the vertical x-axis and therefore represents approximately the pelvic
rotation, could not be analyzed. That is because “pelvis course” is no anatomical angle and as
orientation angle it registers each movement along the x axis. For example for the HfD task six
jumps were measured within one record. Meaning that each time the subject turned around to get
back in staring position, “pelvis course” increased approximately about 360°. “Pelvis roll” was
not influenced by this effect.
5.7 Limitations of the study
There were of course a few limitations concerning the study design.
First of all the group size was relatively small, an expected number of 20 subjects could not be
reached. Although recent studies were conducted with similar small groups1,2
.
Nevertheless a number of subjects like measured in Ford et al.3 would be desirable.
Further the ankle abduction was excluded from the LAS calculation due to several reasons.
First the ankle abduction showed errors in measurement especially after the landing impact. The
high impacts reached values over 16g which is out of the measurement range of the IMU’s used
in this study. Therefore the sensor was saturated and temporarily produced wrong angle
calculations in the translational plane. However ankle inversion and ankle dorsiflexion weren’t
affected.
Second the ankle abduction is a movement which in the opinion of the author has to be used with
caution. It’s a movement which is not mentioned in leading anatomical and physiological
literature4,5
. In the opinion of the author, ankle abduction is first of all a pathological joint
position of the ankle or the forefoot rather (pes adductus6). The visible ankle abduction however,
which one could expect in fig 42, could be traced back to a combination consisting of knee
rotation and ankle inversion/eversion/flexion rather.
The problem of sensor positioning and fixation was already mentioned. Despite applied
1 Clément et al. 2014
2 Kuo et al. 2011
3 Ford et al. 2003
4 Platzer 2013
5 Schünke et al. 2005
6 Niethard et al. 2009
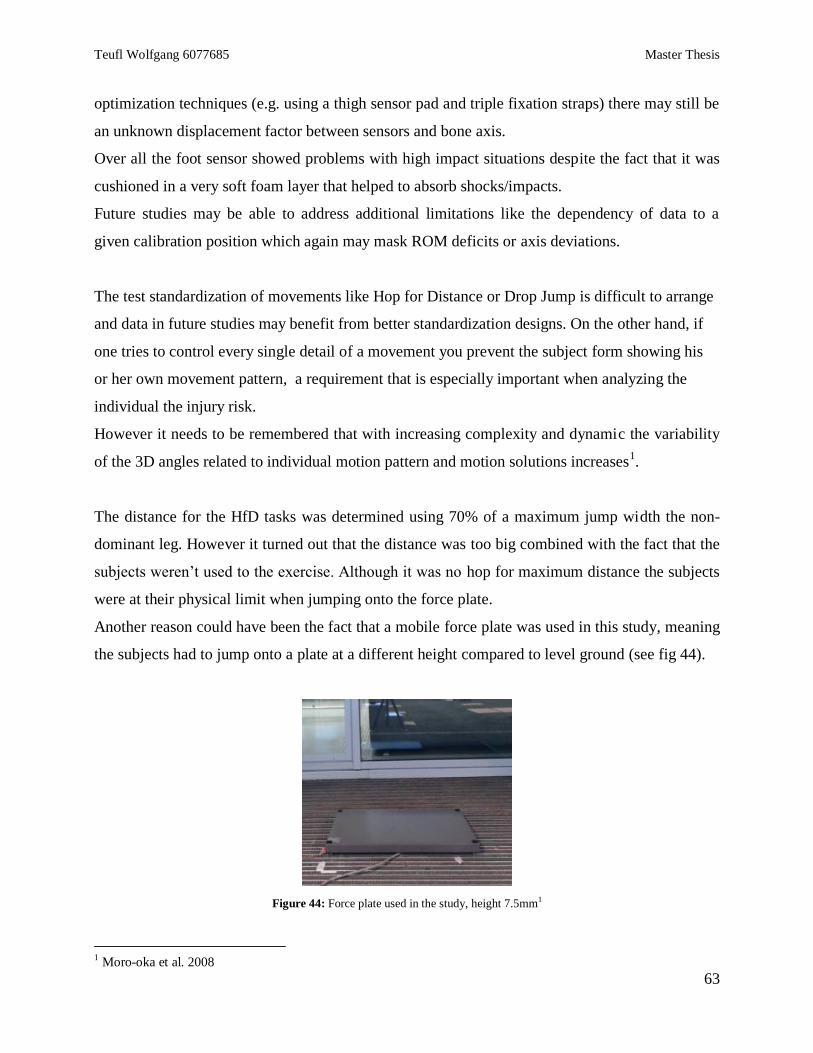
Teufl Wolfgang 6077685 Master Thesis
63
optimization techniques (e.g. using a thigh sensor pad and triple fixation straps) there may still be
an unknown displacement factor between sensors and bone axis.
Over all the foot sensor showed problems with high impact situations despite the fact that it was
cushioned in a very soft foam layer that helped to absorb shocks/impacts.
Future studies may be able to address additional limitations like the dependency of data to a
given calibration position which again may mask ROM deficits or axis deviations.
The test standardization of movements like Hop for Distance or Drop Jump is difficult to arrange
and data in future studies may benefit from better standardization designs. On the other hand, if
one tries to control every single detail of a movement you prevent the subject form showing his
or her own movement pattern, a requirement that is especially important when analyzing the
individual the injury risk.
However it needs to be remembered that with increasing complexity and dynamic the variability
of the 3D angles related to individual motion pattern and motion solutions increases1.
The distance for the HfD tasks was determined using 70% of a maximum jump width the non-
dominant leg. However it turned out that the distance was too big combined with the fact that the
subjects weren’t used to the exercise. Although it was no hop for maximum distance the subjects
were at their physical limit when jumping onto the force plate.
Another reason could have been the fact that a mobile force plate was used in this study, meaning
the subjects had to jump onto a plate at a different height compared to level ground (see fig 44).
Figure 44: Force plate used in the study, height 7.5mm1
1 Moro-oka et al. 2008
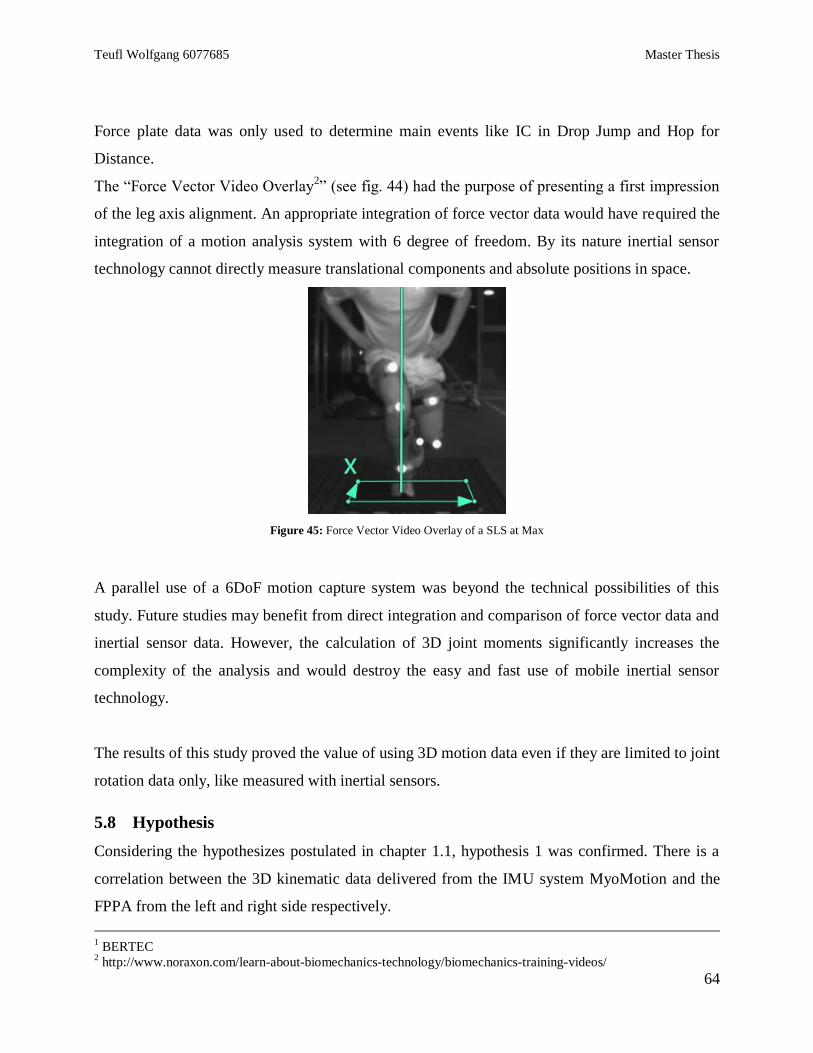
Teufl Wolfgang 6077685 Master Thesis
64
Force plate data was only used to determine main events like IC in Drop Jump and Hop for
Distance.
The “Force Vector Video Overlay2” (see fig. 44) had the purpose of presenting a first impression
of the leg axis alignment. An appropriate integration of force vector data would have required the
integration of a motion analysis system with 6 degree of freedom. By its nature inertial sensor
technology cannot directly measure translational components and absolute positions in space.
Figure 45: Force Vector Video Overlay of a SLS at Max
A parallel use of a 6DoF motion capture system was beyond the technical possibilities of this
study. Future studies may benefit from direct integration and comparison of force vector data and
inertial sensor data. However, the calculation of 3D joint moments significantly increases the
complexity of the analysis and would destroy the easy and fast use of mobile inertial sensor
technology.
The results of this study proved the value of using 3D motion data even if they are limited to joint
rotation data only, like measured with inertial sensors.
5.8 Hypothesis
Considering the hypothesizes postulated in chapter 1.1, hypothesis 1 was confirmed. There is a
correlation between the 3D kinematic data delivered from the IMU system MyoMotion and the
FPPA from the left and right side respectively.
1 BERTEC
2 http://www.noraxon.com/learn-about-biomechanics-technology/biomechanics-training-videos/
Teufl Wolfgang 6077685 Master Thesis
65
Hypothesis 2 was confirmed with restrictions. A score could have been developed, trying to
assess DKV. But it does not correlate positively with the FPPA and is yet not accurate enough to
present an explicit interpretation of the dimension of DKV.
6 Conclusion
In summary the IMU system MyoMotion proved to be a very useful tool when studying the
problem of identifying injury risk factors.
It is quick to assemble and in combination with the MR3 software almost quicker to analyze.
However, it can be concluded from this study, that the use of IMU systems in general still show
certain technical limitations and require more investigations to optimize it’s use in human motion
analysis:
a) The problem of surface mounted sensors and its associated dislocation against bone axis
due to soft tissue artifacts with surface sensor applications.
b) Magnetic distortion may affect data especially in laboratory environment
c) High impact situations exceeding 16g and 2000°/deg rotation velocity
d) Correct management of calibration positions
On the analysis and interpretation side the IMU based 3D angle analysis of lower leg geometry
proved to be a very helpful tool, superior to 2D Video based analysis that can lead to
considerable misinterpretations, as shown in the FPPA data discussion.
Like in the literature discussed in the chapter “Fundamentals”, also in this study hip joint angle in
the transversal and frontal and pelvis movement in the frontal plane proved to be more
meaningful than the knee joint angles in the appropriate planes when analyzing dynamic knee
valgus and quality of lower limb alignment.
Further studies should focus more on the 3D pelvic movement and it’s correlation to knee
injuries.
Teufl Wolfgang 6077685 Master Thesis
66
The LAS turned out to be a useful tool for future examination of DKV if specific improvements
are conducted. Right now LAS shows you differences between subjects concerning the leg axis
as shown in chapter 5.5. It is yet unclear how to interpret the absolute values of LAS. More
studies including LAS are necessary.
It seems important that a specific weighing of the included kinematic angles is applied to LAS
corresponding to the statement above.
Further it has to be considered to not use absolute 3D angle values at a specific event marker, but
calculate LAS using the changes in ROM between two events. This would answer more
accurately the issue of dynamic stabilization of the leg axis.
A general conclusion from this study can also be that absolute angle values have to be used with
care. A more qualitative approach studying the trend or direction of an angular displacement
value and its interplay with other 3D angles may be suitable enough to answer practical
questions.
Moreover it turned out that the analysis methods right tools are just one aspect in injury risk
prediction. Another similar important aspect is the correct selection of testing exercises. A
compromise has to be made between the demand for the athlete and the standardizability of the
task.
Finally it has to be remembered again that any injury risk scaling should always include multi-
disciplinary methods and data, as demonstrated and proven by Hewett et al. In their scoring
system biomechanical analysis data are one of overall ten other scoring parameters.

i
List of cited Literature
ACER (2015); retrieved from: http://www.acer.at/ac/de/AT/content/home download 29.12.2015
Akbarshahi, Massoud; Schache, Anthony G.; Fernandez, Justin W.; Baker, Richard; Banks, Scott; Pandy, Marcus G.
(2010): Non-invasive assessment of soft-tissue artifact and its effect on knee joint kinematics during functional
activity. In: Journal of biomechanics 43 (7), S. 1292–1301. DOI: 10.1016/j.jbiomech.2010.01.002.
Benoit, Daniel L.; Ramsey, Dan K.; Lamontagne, Mario; Xu, Lanyi; Wretenberg, Per; Renström, Per (2006): Effect
of skin movement artifact on knee kinematics during gait and cutting motions measured in vivo. In: Gait & posture
24 (2), S. 152–164. DOI: 10.1016/j.gaitpost.2005.04.012.
BERTEC: Analog & Digital Amplifier AM6800. Product Details and Specifications, S. 1–2.
BERTEC: Force Plate FP-4060-07. Product Details and Specifications, S. 1–2.
Bertozzi, Luigi; Stagni, Rita; Fantozzi, Silvia; Cappello, Angelo (2007): Knee model sensitivity to cruciate ligaments
parameters: a stability simulation study for a living subject. In: Journal of biomechanics 40 Suppl 1, S. S38-44. DOI:
10.1016/j.jbiomech.2007.02.018.
Boling, Michelle C.; Padua, Darin A.; Marshall, Stephen W.; Guskiewicz, Kevin; Pyne, Scott; Beutler, Anthony
(2009): A prospective investigation of biomechanical risk factors for patellofemoral pain syndrome: the Joint
Undertaking to Monitor and Prevent ACL Injury (JUMP-ACL) cohort. In: Am J Sports Med 37 (11), S. 2108–2116.
DOI: 10.1177/0363546509337934.
Clément, Julien; Hagemeister, Nicola; Aissaoui, Rachid; Guise, Jacques A. de (2014): Comparison of quasi-static
and dynamic squats: a three-dimensional kinematic, kinetic and electromyographic study of the lower limbs. In: Gait
Posture 40 (1), S. 94–100. DOI: 10.1016/j.gaitpost.2014.02.016.
Debrunner, H. U.; Schweizerische Arbeitsgemeinschaft für Osteosynthesefragen (1971): Gelenkmessung: (Neutral-
O-Methode), Längenmessung, Umfangmessung: Schweizerische Arbeitsgemeinschaft für Osteosynthesefragen.
Online verfügbar unter https://books.google.de/books?id=B9woygAACAAJ.
Decker, Michael J.; Torry, Michael R.; Wyland, Douglas J.; Sterett, William I.; Richard Steadman, J. (2003): Gender
differences in lower extremity kinematics, kinetics and energy absorption during landing. In: Clinical Biomechanics
18 (7), S. 662–669. DOI: 10.1016/S0268-0033(03)00090-1.
Dejnabadi, Hooman; Jolles, Brigitte M.; Aminian, Kamiar (2005): A new approach to accurate measurement of
uniaxial joint angles based on a combination of accelerometers and gyroscopes. In: IEEE Trans Biomed Eng 52 (8),
S. 1478–1484. DOI: 10.1109/TBME.2005.851475.
Dwyer, Maureen K.; Boudreau, Samantha N.; Mattacola, Carl G.; Uhl, Timothy L.; Lattermann, Christian (2010):
Comparison of lower extremity kinematics and hip muscle activation during rehabilitation tasks between sexes. In: J
Athl Train 45 (2), S. 181–190. DOI: 10.4085/1062-6050-45.2.181.
Ekegren, Christina L.; Miller, William C.; Celebrini, Richard G.; Eng, Janice J.; Macintyre, Donna L. (2009):
Reliability and validity of observational risk screening in evaluating dynamic knee valgus. In: J Orthop Sports Phys
Ther 39 (9), S. 665–674. DOI: 10.2519/jospt.2009.3004.
Fong, Chun-Man; Blackburn, J. Troy; Norcross, Marc F.; McGrath, Melanie; Padua, Darin A. (2011): Ankle-
dorsiflexion range of motion and landing biomechanics. In: J Athl Train 46 (1), S. 5–10. DOI: 10.4085/1062-6050-
46.1.5.
Ford, Kevin R.; Myer, Gregory D.; Hewett, Timothy E. (2003): Valgus knee motion during landing in high school
female and male basketball players. In: Med Sci Sports Exerc 35 (10), S. 1745–1750. DOI:
10.1249/01.MSS.0000089346.85744.D9.
Georgoulis (2003): 3D tibiofemoral kinematics of the ACL deficient and reconstructed knee during walking. In: Am
J Sports Med 31 (1), S. 75–79.
Glen Cooper, Ian Sheret, Louise McMillian, Konstantinos Siliverdis, Ning Sha, Diana Hodgins, Laurence Kenney,
David Howard: Inertial sensor-based knee flexion/extension angle estimation. In: 1Centre for Rehabilitation and
Human Performance Research, University of Salford, UK.

ii
Gwynne R. Craig, Curran A. Sarah (2014): Quantifying Frontal Plane Knee Motion During Single Limb Squats:
Reliability And Validity Of 2-Dimensional Measures. In: The International Journal of Sports Physical Therapy 9
(7), S. 898–906.
Herrington, Lee (2014): Knee valgus angle during single leg squat and landing in patellofemoral pain patients and
controls. In: Knee 21 (2), S. 514–517. DOI: 10.1016/j.knee.2013.11.011.
Hewett, T. E.; Stroupe, A. L.; Nance, T. A.; Noyes, F. R. (1996): Plyometric training in female athletes. Decreased
impact forces and increased hamstring torques. In: Am J Sports Med 24 (6), S. 765–773.
Hewett, T. E.; Torg, J. S.; Boden, B. P. (2009): Video analysis of trunk and knee motion during non-contact anterior
cruciate ligament injury in female athletes: lateral trunk and knee abduction motion are combined components of the
injury mechanism. In: Br J Sports Med 43 (6), S. 417–422. DOI: 10.1136/bjsm.2009.059162.
Hewett, Timothy; Snyder-Mackler, Lynn; Spindler, Kurt P. (2007): The drop-jump screening test: difference in
lower limb control by gender and effect of neuromuscular training in female athletes. In: Am J Sports Med 35 (1), S.
145; author reply 146-7. DOI: 10.1177/0363546506296609.
Hewett, Timothy E.; Myer, Gregory D.; Ford, Kevin R.; Heidt, Robert S.; Colosimo, Angelo J.; McLean, Scott G. et
al. (2005): Biomechanical measures of neuromuscular control and valgus loading of the knee predict anterior
cruciate ligament injury risk in female athletes: a prospective study. In: Am J Sports Med 33 (4), S. 492–501. DOI:
10.1177/0363546504269591.
Hewett, Timothy E.; Myer, Gregory D.; Ford, Kevin R.; Slauterbeck, James R. (2006): Preparticipation Physical
Examination Using a Box Drop Vertical Jump Test in Young Athletes. In: Clinical Journal of Sport Medicine 16 (4),
S. 298–304. DOI: 10.1097/00042752-200607000-00003.
Hewett E. T.,* PhD, Lindenfeld Thomas N., MD, Riccobene Jennifer V., Noyes Frank R., MD (1999): The Effect of
Neuromuscular Training on the Incidence of Knee Injury in Female Athletes: A Prospective Study. In: The American
Journal of Sports Medicine 27 (6), S. 699–706.
Kaiser, Jarred; Bradford, Robert; Johnson, Kevin; Wieben, Oliver; Thelen, Darryl G. (2013): Measurement of
tibiofemoral kinematics using highly accelerated 3D radial sampling. In: Magn Reson Med 69 (5), S. 1310–1316.
DOI: 10.1002/mrm.24362.
Kanamori, A.; Woo, S. L.; Ma, C. B.; Zeminski, J.; Rudy, T. W.; Li, G.; Livesay, G. A. (2000): The forces in the
anterior cruciate ligament and knee kinematics during a simulated pivot shift test: A human cadaveric study using
robotic technology. In: Arthroscopy : the journal of arthroscopic & related surgery : official publication of the
Arthroscopy Association of North America and the International Arthroscopy Association 16 (6), S. 633–639. DOI:
10.1053/jars.2000.7682.
Kawano, Keiro; Kobashi, Syoji; Yagi, Masayoshi; Kondo, Katsuya; Yoshiya, Shinichi; Hata, Yutaka(2007):
Analyzing 3D Knee Kinematics Using Accelerometers, Gyroscopes and Magnetometers. In: IEEE International
Conference on System of Systems Engineering. San Antonio, TX, USA, S. 1–6.
Komi, Paavo V. (2000): Stretch-shortening cycle. A powerful model to study normal and fatigued muscle. In:
Journal of biomechanics 33 (10), S. 1197–1206. DOI: 10.1016/S0021-9290(00)00064-6.
Kristianslund, Eirik; Krosshaug, Tron (2013): Comparison of drop jumps and sport-specific sidestep cutting:
implications for anterior cruciate ligament injury risk screening. In: Am J Sports Med 41 (3), S. 684–688. DOI:
10.1177/0363546512472043.
Kuo, Mei-Ying; Tsai, Tsung-Yuan; Lin, Cheng-Chung; Lu, Tung-Wu; Hsu, Horng-Chaung; Shen, Wu-Chung
(2011): Influence of soft tissue artifacts on the calculated kinematics and kinetics of total knee replacements during
sit-to-stand. In: Gait Posture 33 (3), S. 379–384. DOI: 10.1016/j.gaitpost.2010.12.007.
Lafortune M. A. et al. (1992): Three-Dimensional Kinematics Of The Human Knee During Walking. In: J.
Biomechanics 25 (4), S. 347–357.
Leardini, Alberto; Chiari, Lorenzo; Della Croce, Ugo; Cappozzo, Aurelio (2005): Human movement analysis using
stereophotogrammetry. Part 3. Soft tissue artifact assessment and compensation. In: Gait & posture 21 (2), S. 212–
225. DOI: 10.1016/j.gaitpost.2004.05.002.

iii
Li, Guoan; Zayontz, Shay; Most, Ephrat; Defrate, Louis E.; Suggs, Jeremy F.; Rubash, Harry E. (2004): In situ
forces of the anterior and posterior cruciate ligaments in high knee flexion: an in vitro investigation. In: Journal of
orthopaedic research : official publication of the Orthopaedic Research Society 22 (2), S. 293–297. DOI:
10.1016/S0736-0266(03)00179-7.
Logitech HD Pro Webcam C920 (2015); retrieved from: http://www.logitech.com/en-us/product/hd-pro-webcam-
c920?crid=34 download 29.12.2015
M. Sangeux, F. Marin, F. Charleux, L. Dürselen, M.C. Ho Ba Tho (2006): Quantification of the 3D relative
movement of external marker sets vs. bones based on magnetic resonance imaging. In: Clinical Biomechanics 21 (9),
S. 984–991.
Markolf, Keith L.; Jackson, Steven R.; Foster, Brock; McAllister, David R. (2014): ACL forces and knee kinematics
produced by axial tibial compression during a passive flexion-extension cycle. In: Journal of orthopaedic research :
official publication of the Orthopaedic Research Society 32 (1), S. 89–95. DOI: 10.1002/jor.22476.
Moro-oka, Taka-aki; Hamai, Satoshi; Miura, Hiromasa; Shimoto, Takeshi; Higaki, Hidehiko; Fregly, Benjamin J. et
al. (2007): Can magnetic resonance imaging–derived bone models be used for accurate motion measurement with
single-plane three-dimensional shape registration? In: J. Orthop. Res. 25 (7), S. 867–872. DOI: 10.1002/jor.20355.
Moro-oka, Taka-aki; Hamai, Satoshi; Miura, Hiromasa; Shimoto, Takeshi; Higaki, Hidehiko; Fregly, Benjamin J. et
al. (2008): Dynamic activity dependence of in vivo normal knee kinematics. In: J. Orthop. Res. 26 (4), S. 428–434.
DOI: 10.1002/jor.20488.
Myer, Gregory D.; Ford, Kevin R.; Foss, Kim D. Barber; Rauh, Mitchell J.; Paterno, Mark V.; Hewett, Timothy E.
(2014): A predictive model to estimate knee-abduction moment: implications for development of a clinically
applicable patellofemoral pain screening tool in female athletes. In: J Athl Train 49 (3), S. 389–398. DOI:
10.4085/1062-6050-49.2.17.
Myer, Gregory D.; Ford, Kevin R.; Khoury, Jane; Succop, Paul; Hewett, Timothy E. (2010): Clinical correlates to
laboratory measures for use in non-contact anterior cruciate ligament injury risk prediction algorithm. In: Clin
Biomech (Bristol, Avon) 25 (7), S. 693–699. DOI: 10.1016/j.clinbiomech.2010.04.016.
Myer, Gregory D.; Martin, Larry; Ford, Kevin R.; Paterno, Mark V.; Schmitt, Laura C.; Heidt, Robert S. et al.
(2012): No association of time from surgery with functional deficits in athletes after anterior cruciate ligament
reconstruction: evidence for objective return-to-sport criteria. In: Am J Sports Med 40 (10), S. 2256–2263. DOI:
10.1177/0363546512454656.
Myers, Casey A.; Torry, Michael R.; Shelburne, Kevin B.; Giphart, J. Erik; LaPrade, Robert F.; Woo, Savio L-Y;
Steadman, J. Richard (2012): In vivo tibiofemoral kinematics during 4 functional tasks of increasing demand using
biplane fluoroscopy. In: Am J Sports Med 40 (1), S. 170–178. DOI: 10.1177/0363546511423746.
Niethard, Fritz U.; Pfeil, Joachim; Biberthaler, Peter (2009): Orthopädie und Unfallchirurgie. [inklusive Video-CD-
ROM]. 6., vollst. überarb. und erw. Aufl. Stuttgart: Thieme (Duale Reihe).
Noehren, B.; Barrance, P. J.; Pohl, M. P.; Davis, I. S. (2012): A comparison of tibiofemoral and patellofemoral
alignment during a neutral and valgus single leg squat: an MRI study. In: Knee 19 (4), S. 380–386. DOI:
10.1016/j.knee.2011.05.012.
Noraxon (2013a): Analog Input System. User Manual 2013, S. 1–31.
Noraxon (2013b): MyoMotion System User Manual 2013, S. 1–46.
Noraxon (2013c): MyoSync. User Manual 2013, S. 1–23.
Noraxon Discovery Videos (n.y.) Force Vector Overlay; retrieved from: http://www.noraxon.com/learn-about-
biomechanics-technology/biomechanics-training-videos/ download 29.12.2015
Noyes, F. R. (2005): The Drop-Jump Screening Test. Difference in Lower Limb Control By Gender and Effect of
Neuromuscular Training in Female Athletes. In: American Journal of Sports Medicine 33 (2), S. 197–207. DOI:
10.1177/0363546504266484.
Oberländer, K. (2015): ABC of IMU. Part 1: Introduction to Inertial Sensor Measurement Technology and
Calculations 2015, S. 1–68.

iv
Optitrack (2015); retrieved from: http://www.optitrack.com/products/flex-3/specs.html download 29.12.2015
Padua, Darin A.; DiStefano, Lindsay J.; Beutler, Anthony I.; de la Motte, Sarah J; DiStefano, Michael J.; Marshall,
Steven W. (2015): The Landing Error Scoring System as a Screening Tool for an Anterior Cruciate Ligament Injury-
Prevention Program in Elite-Youth Soccer Athletes. In: Journal of athletic training 50 (6), S. 589–595. DOI:
10.4085/1062-6050-50.1.10.
Padua, Darin A.; Marshall, Stephen W.; Boling, Michelle C.; Thigpen, Charles A.; Garrett, William E.; Beutler,
Anthony I. (2009): The Landing Error Scoring System (LESS) Is a valid and reliable clinical assessment tool of
jump-landing biomechanics: The JUMP-ACL study. In: Am J Sports Med 37 (10), S. 1996–2002. DOI:
10.1177/0363546509343200.
Paterno, Mark V.; Schmitt, Laura C.; Ford, Kevin R.; Rauh, Mitchell J.; Myer, Gregory D.; Huang, Bin; Hewett,
Timothy E. (2010): Biomechanical measures during landing and postural stability predict second anterior cruciate
ligament injury after anterior cruciate ligament reconstruction and return to sport. In: Am J Sports Med 38 (10), S.
1968–1978. DOI: 10.1177/0363546510376053.
Platzer, Werner (2013): Bewegungsapparat. 11., überarb. Aufl. Stuttgart: Thieme (Taschenatlas Anatomie, in 3
Bänden ; Bd. 1).
Powers, Christopher M. (2010): The influence of abnormal hip mechanics on knee injury: a biomechanical
perspective. In: J Orthop Sports Phys Ther 40 (2), S. 42–51. DOI: 10.2519/jospt.2010.3337.
Ristic, Branko; Arulampalam, Sanjeev; Gordon, Neil (2004): Beyond the Kalman filter. Particle filters for tracking
applications. Boston, Mass.: Artech House (Artech House radar library).
Rondinelli, Robert D.; Genovese, Elizabeth; Brigham, Christopher R. (2008): Guides to the evaluation of permanent
impairment. 6th ed. [Chicago, Ill.]: American Medical Association.
Russell, Kyla A.; Palmieri, Riann M.; Zinder, Steven M.; Ingersoll, Christopher D. (2006): Sex differences in valgus
knee angle during a single-leg drop jump. In: J Athl Train 41 (2), S. 166–171.
Ryf, Chr.; Weymann, A. (1995): The neutral zero method — A principle of measuring joint function. In: Injury 26,
S. 1–11. DOI: 10.1016/0020-1383(95)90116-7.
Salci, Yasar; Kentel, Behzat Bahadir; Heycan, Cengiz; Akin, Sabire; Korkusuz, Feza (2004): Comparison of landing
maneuvers between male and female college volleyball players. In: Clin Biomech (Bristol, Avon) 19 (6), S. 622–628.
DOI: 10.1016/j.clinbiomech.2004.03.006.
Schmitz, Randy J.; Kulas, Anthony S.; Perrin, David H.; Riemann, Bryan L.; Shultz, Sandra J. (2007): Sex
differences in lower extremity biomechanics during single leg landings. In: Clin Biomech (Bristol, Avon) 22 (6), S.
681–688. DOI: 10.1016/j.clinbiomech.2007.03.001.
Schünke, Michael; Schulte, Erik; Schumacher, Udo; Rude, Jürgen; Voll, Markus; Wesker, Karl (2005): Allgemeine
Anatomie und Bewegungssystem. 100 Tabellen. Stuttgart: Thieme (Prometheus, LernAtlas der Anatomie / Michael
Schünke; Erik Schulte; Udo Schumacher. Unter Mitarb. von Jürgen Rude. Ill. von Markus Voll; Karl Wesker).
Online verfügbar unter http://www.gbv.de/dms/faz-rez/FNUW200410062501520.pdf.
Seisler, Andrea R.; Sheehan, Frances T. (2007): Normative three-dimensional patellofemoral and tibiofemoral
kinematics: a dynamic, in vivo study. In: IEEE transactions on bio-medical engineering 54 (7), S. 1333–1341. DOI:
10.1109/TBME.2007.890735.
Shin, Choongsoo S.; Chaudhari, Ajit M.; Andriacchi, Thomas P. (2011): Valgus plus internal rotation moments
increase anterior cruciate ligament strain more than either alone. In: Medicine and science in sports and exercise 43
(8), S. 1484–1491. DOI: 10.1249/MSS.0b013e31820f8395.
SPSS Software Lösungen und Software für Predictive Analytics (n.y.); retrieved from: http://www-
01.ibm.com/software/de/analytics/spss/ download 29.12.15
Targus (2015) Home / Zubehör / Targus Universal USB 3.0 Superspeed™ Dual Video Docking Station; retrieved
from: http://www.targus.com/de/targus-universal-usb-3_0-superspeed-dual-video-docking-station-de-acp70eu
download 29.12.2015

v
Ugalde, Viviane; Brockman, Chuck; Bailowitz, Zach; Pollard, Christine D. (2015): Single leg squat test and its
relationship to dynamic knee valgus and injury risk screening. In: PM R 7 (3), S. 229-35; quiz 235. DOI:
10.1016/j.pmrj.2014.08.361.
Vicon (n.y.); retrieved from: http://www.vicon.com/ download 29.12.2015
Willson, John D.; Ireland, Mary Lloyd; Davis, Irene (2006): Core strength and lower extremity alignment during
single leg squats. In: Med Sci Sports Exerc 38 (5), S. 945–952. DOI: 10.1249/01.mss.0000218140.05074.fa.
Willson John D.; Davis Irene S. (2008): Utility of the Frontal Plane Projection Angle in Females With Patellofemoral
Pain. In: Journal of Orthopaedic & Sport Physikal Therapy 38 (10), S. 606–615.
Yu, Bing; Lin, Cheng-Feng; Garrett, William E. (2006): Lower extremity biomechanics during the landing of a stop-
jump task. In: Clin Biomech (Bristol, Avon) 21 (3), S. 297–305. DOI: 10.1016/j.clinbiomech.2005.11.003.
Zeller, Brian L.; McCrory, Jean L.; Kibler, W. Ben; Uhl, Timothy L. (2003): Differences in kinematics and
electromyographic activity between men and women during the single-legged squat. In: Am J Sports Med 31 (3), S.
449–456.
vi
Eidesstaatliche Erklärung
Ich versichere, dass ich die vorliegende Arbeit selbstständig verfasst und keine anderen als die
angegebenen Quellen und Hilfsmittel verwendet habe, alle Ausführungen, die anderen Schriften
wörtlich oder sinngemäß entnommen wurden, kenntlich gemacht sind und die Arbeit in gleicher
oder ähnlicher Form noch keiner anderen Prüfungsbehörde vorgelegen hat. Ich stimme zu, dass
die vorliegende Arbeit mit einer Anti-Plagiatssoftware überprüft werden darf.
Wolfgang Teufl Bad Kreuznach, Jänner 2016
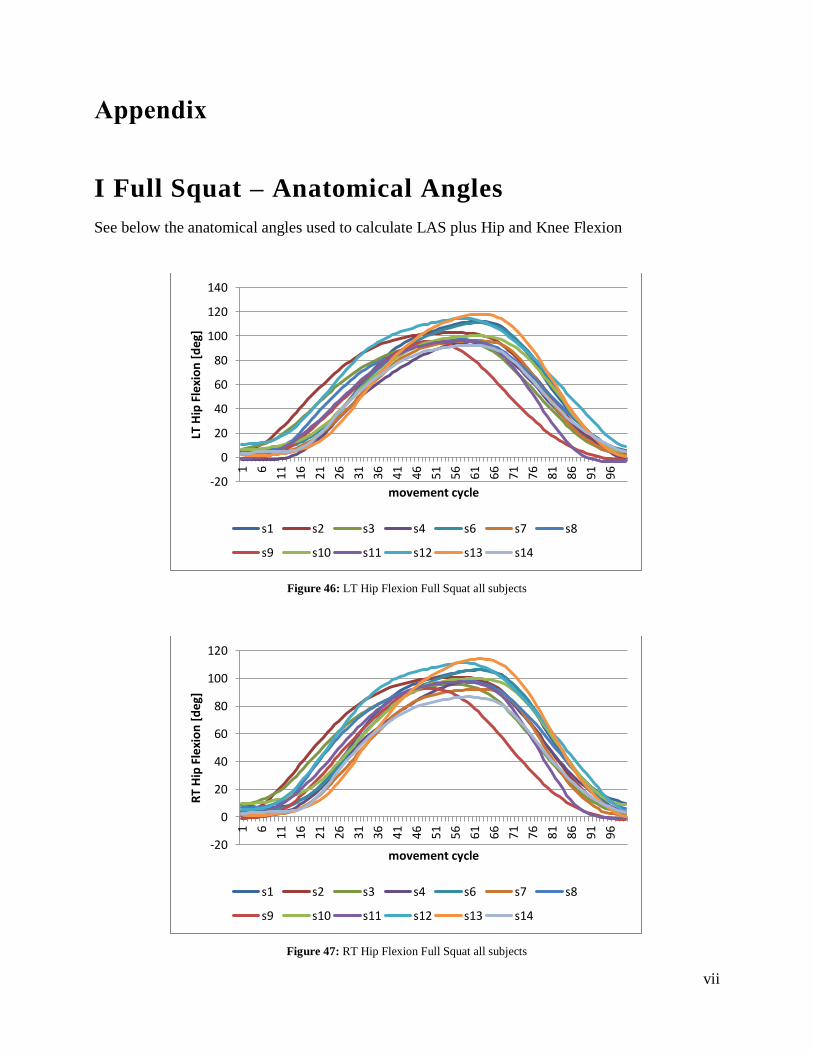
vii
Appendix
I Full Squat – Anatomical Angles
See below the anatomical angles used to calculate LAS plus Hip and Knee Flexion
Figure 46: LT Hip Flexion Full Squat all subjects
Figure 47: RT Hip Flexion Full Squat all subjects
-20
0
20
40
60
80
100
120
140
1 6
11 16 21 26 31 36 41 46 51 56 61 66 71 76 81 86 91 96
LT H
ip F
lexi
on
[d
eg]
movement cycle
s1 s2 s3 s4 s6 s7 s8
s9 s10 s11 s12 s13 s14
-20
0
20
40
60
80
100
120
1 6
11 16 21 26 31 36 41 46 51 56 61 66 71 76 81 86 91 96
RT
Hip
Fle
xio
n [
deg
]
movement cycle
s1 s2 s3 s4 s6 s7 s8
s9 s10 s11 s12 s13 s14
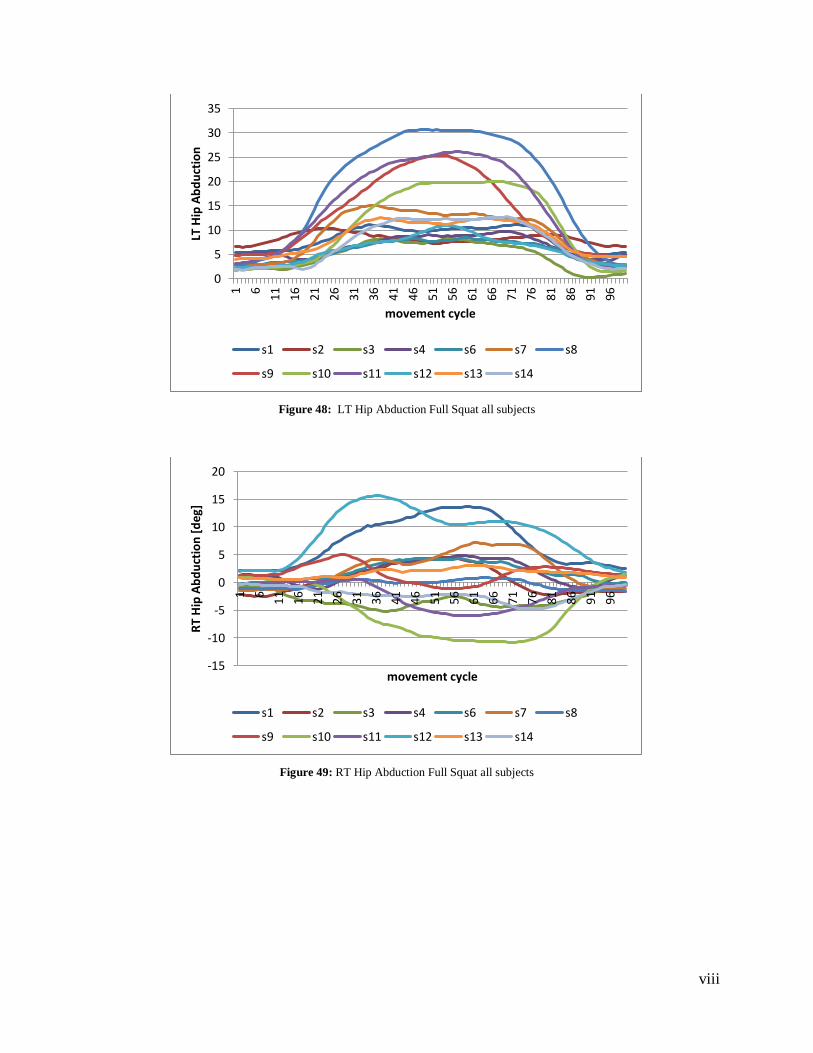
viii
Figure 48: LT Hip Abduction Full Squat all subjects
Figure 49: RT Hip Abduction Full Squat all subjects
0
5
10
15
20
25
30
35
1 6
11 16 21 26 31 36 41 46 51 56 61 66 71 76 81 86 91 96
LT H
ip A
bd
uct
ion
movement cycle
s1 s2 s3 s4 s6 s7 s8
s9 s10 s11 s12 s13 s14
-15
-10
-5
0
5
10
15
20
1 6
11 16 21 26 31 36 41 46 51 56 61 66 71 76 81 86 91 96
RT
Hip
Ab
du
ctio
n [
deg
]
movement cycle
s1 s2 s3 s4 s6 s7 s8
s9 s10 s11 s12 s13 s14
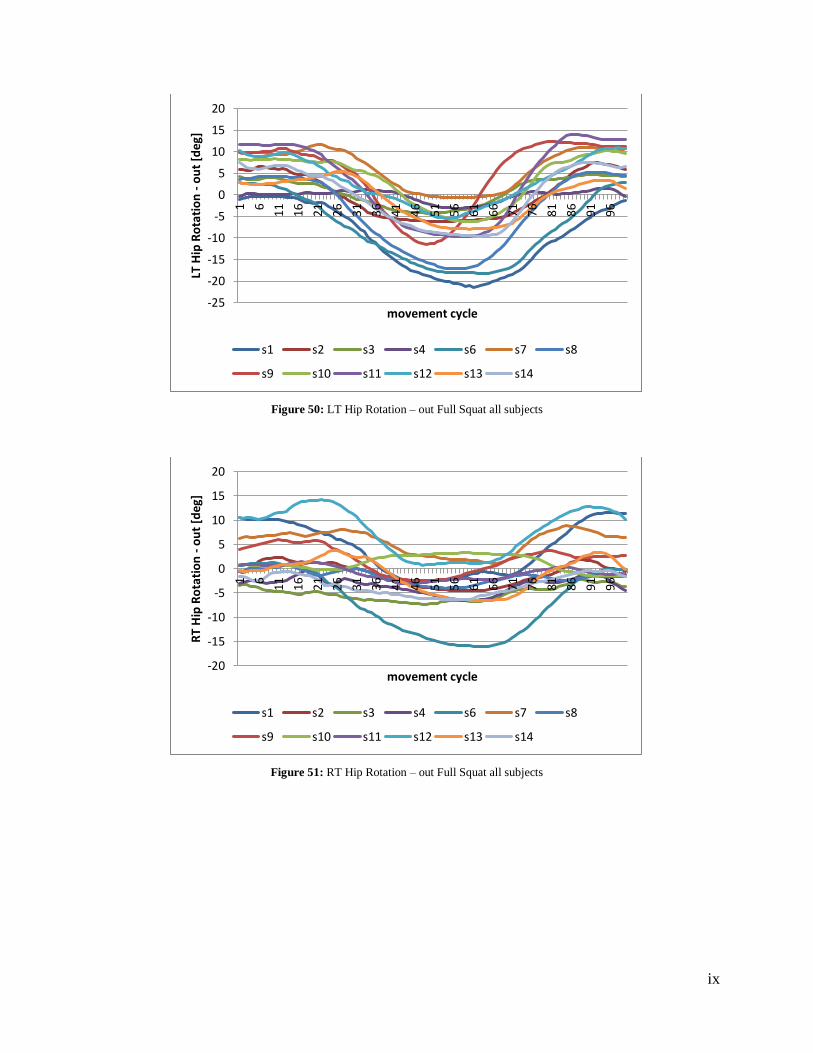
ix
Figure 50: LT Hip Rotation – out Full Squat all subjects
Figure 51: RT Hip Rotation – out Full Squat all subjects
-25
-20
-15
-10
-5
0
5
10
15
20
1 6
11 16 21 26 31 36 41 46 51 56 61 66 71 76 81 86 91 96
LT H
ip R
ota
tio
n -
ou
t [d
eg]
movement cycle
s1 s2 s3 s4 s6 s7 s8
s9 s10 s11 s12 s13 s14
-20
-15
-10
-5
0
5
10
15
20
1 6
11 16 21 26 31 36 41 46 51 56 61 66 71 76 81 86 91 96
RT
Hip
Ro
tati
on
- o
ut
[deg
]
movement cycle
s1 s2 s3 s4 s6 s7 s8
s9 s10 s11 s12 s13 s14
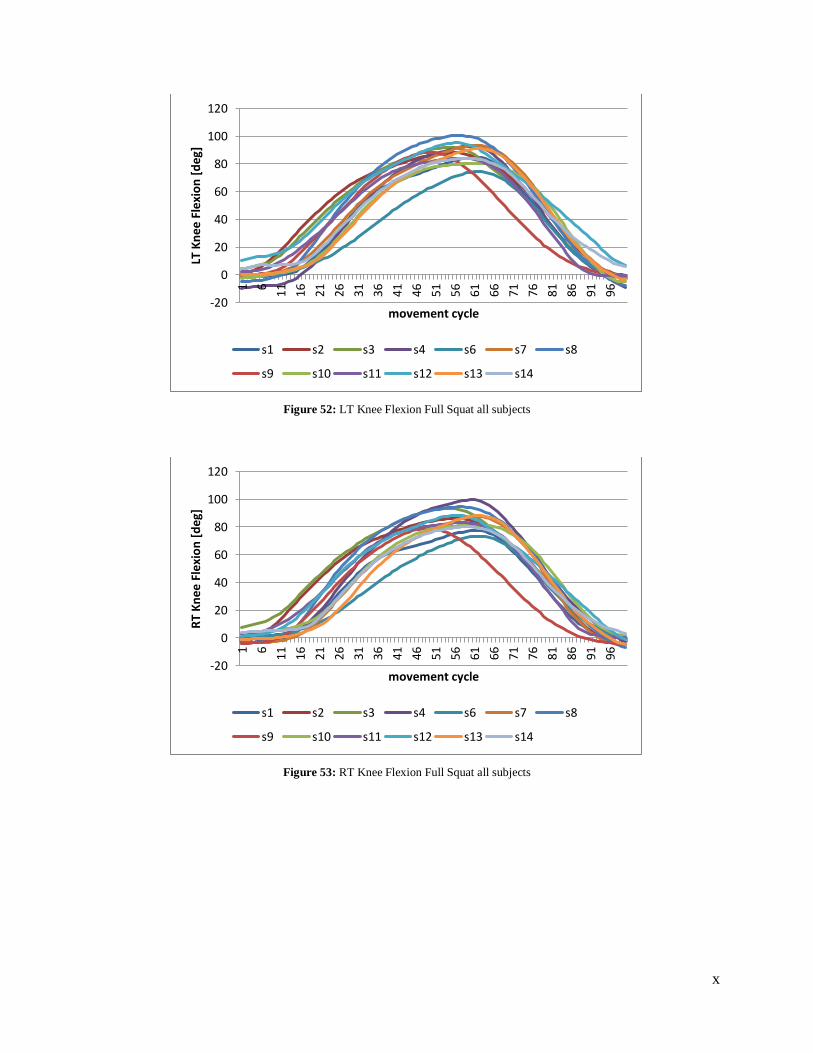
x
Figure 52: LT Knee Flexion Full Squat all subjects
Figure 53: RT Knee Flexion Full Squat all subjects
-20
0
20
40
60
80
100
120
1 6
11 16 21 26 31 36 41 46 51 56 61 66 71 76 81 86 91 96
LT K
nee
Fle
xio
n [
deg
]
movement cycle
s1 s2 s3 s4 s6 s7 s8
s9 s10 s11 s12 s13 s14
-20
0
20
40
60
80
100
120
1 6
11 16 21 26 31 36 41 46 51 56 61 66 71 76 81 86 91 96
RT
Kn
ee F
lexi
on
[d
eg]
movement cycle
s1 s2 s3 s4 s6 s7 s8
s9 s10 s11 s12 s13 s14
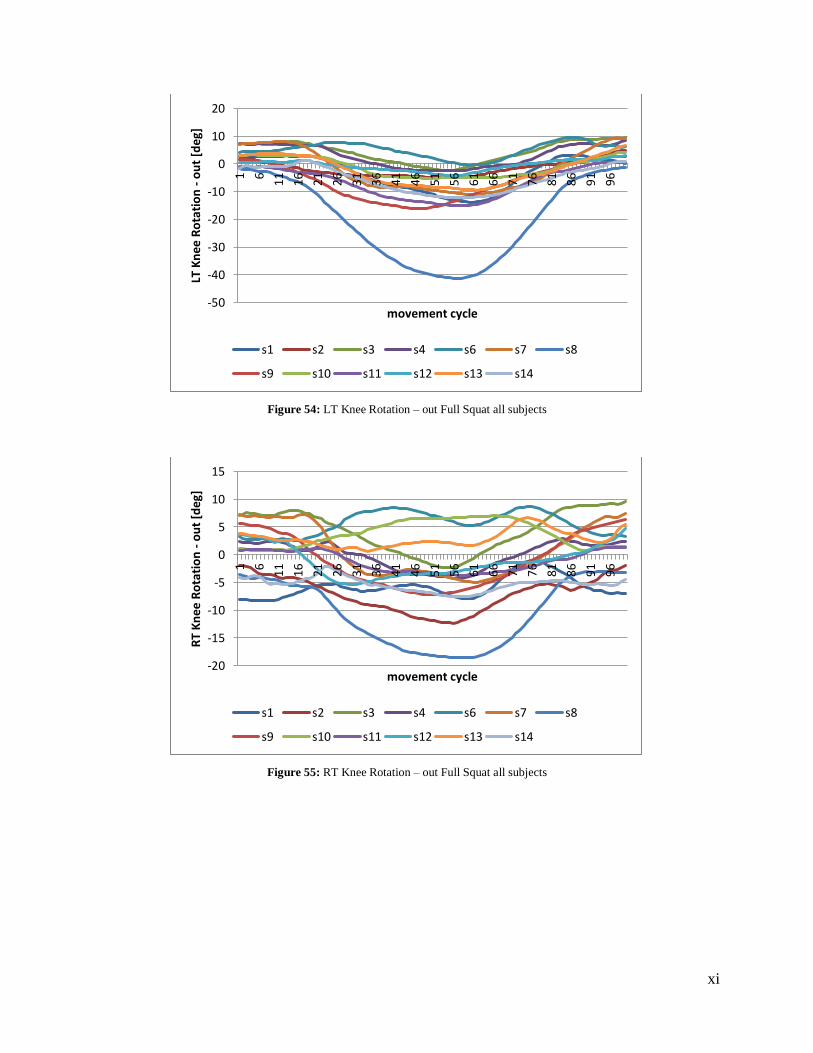
xi
Figure 54: LT Knee Rotation – out Full Squat all subjects
Figure 55: RT Knee Rotation – out Full Squat all subjects
-50
-40
-30
-20
-10
0
10
20
1 6
11 16 21 26 31 36 41 46 51 56 61 66 71 76 81 86 91 96
LT K
nee
Ro
tati
on
- o
ut
[deg
]
movement cycle
s1 s2 s3 s4 s6 s7 s8
s9 s10 s11 s12 s13 s14
-20
-15
-10
-5
0
5
10
15
1 6
11 16 21 26 31 36 41 46 51 56 61 66 71 76 81 86 91 96
RT
Kn
ee R
ota
tio
n -
ou
t [d
eg]
movement cycle
s1 s2 s3 s4 s6 s7 s8
s9 s10 s11 s12 s13 s14
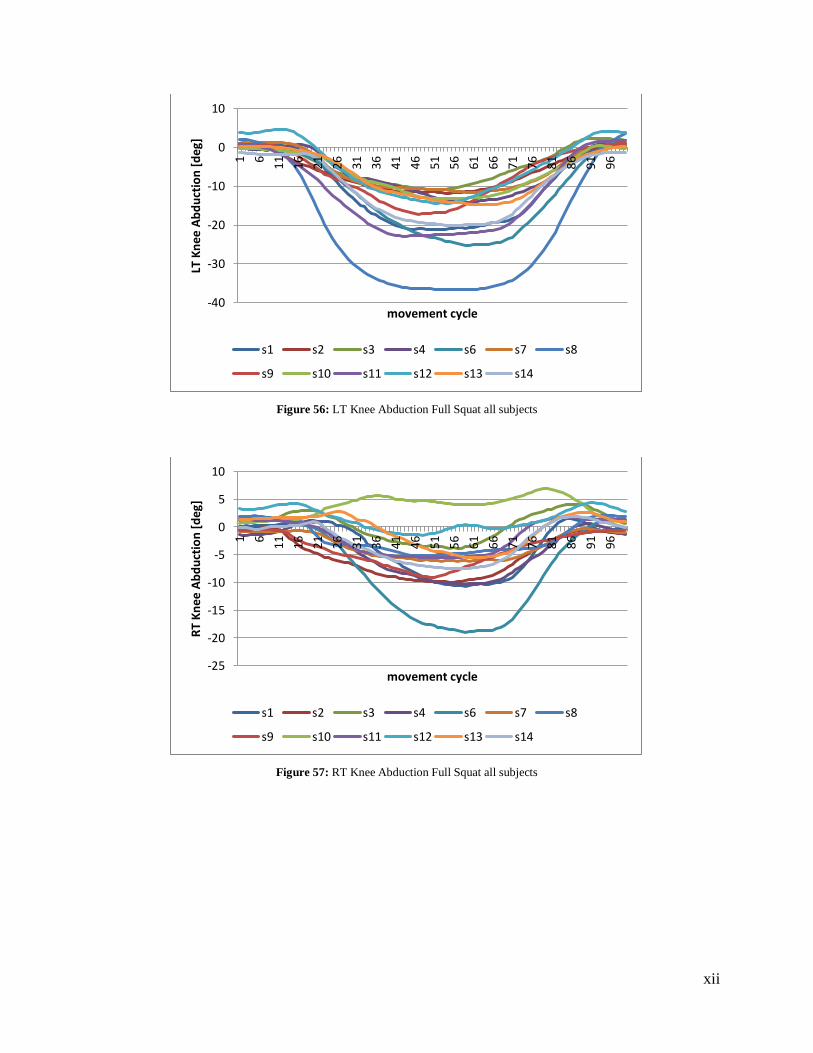
xii
Figure 56: LT Knee Abduction Full Squat all subjects
Figure 57: RT Knee Abduction Full Squat all subjects
-40
-30
-20
-10
0
10
1 6
11 16 21 26 31 36 41 46 51 56 61 66 71 76 81 86 91 96
LT K
nee
Ab
du
ctio
n [
deg
]
movement cycle
s1 s2 s3 s4 s6 s7 s8
s9 s10 s11 s12 s13 s14
-25
-20
-15
-10
-5
0
5
10
1 6
11 16 21 26 31 36 41 46 51 56 61 66 71 76 81 86 91 96
RT
Kn
ee A
bd
uct
ion
[d
eg]
movement cycle
s1 s2 s3 s4 s6 s7 s8
s9 s10 s11 s12 s13 s14
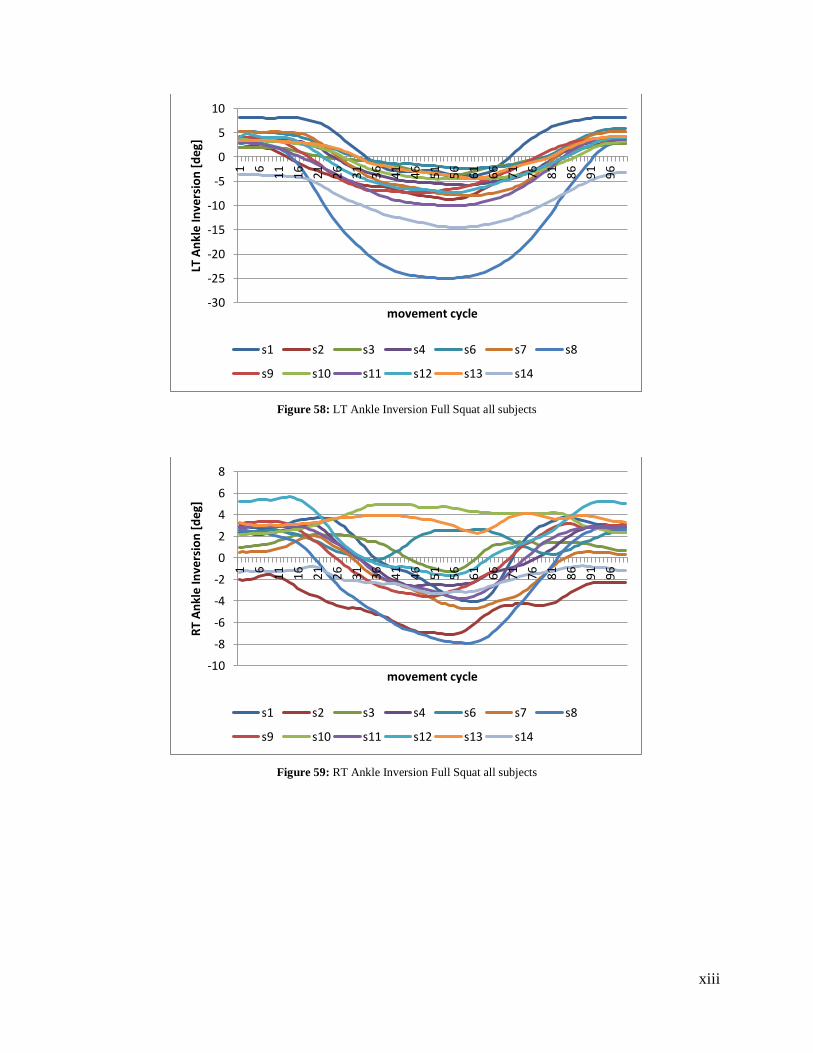
xiii
Figure 58: LT Ankle Inversion Full Squat all subjects
Figure 59: RT Ankle Inversion Full Squat all subjects
-30
-25
-20
-15
-10
-5
0
5
10
1 6
11 16 21 26 31 36 41 46 51 56 61 66 71 76 81 86 91 96
LT A
nkl
e In
vers
ion
[d
eg]
movement cycle
s1 s2 s3 s4 s6 s7 s8
s9 s10 s11 s12 s13 s14
-10
-8
-6
-4
-2
0
2
4
6
8
1 6
11 16 21 26 31 36 41 46 51 56 61 66 71 76 81 86 91 96
RT
An
kle
Inve
rsio
n [
deg
]
movement cycle
s1 s2 s3 s4 s6 s7 s8
s9 s10 s11 s12 s13 s14
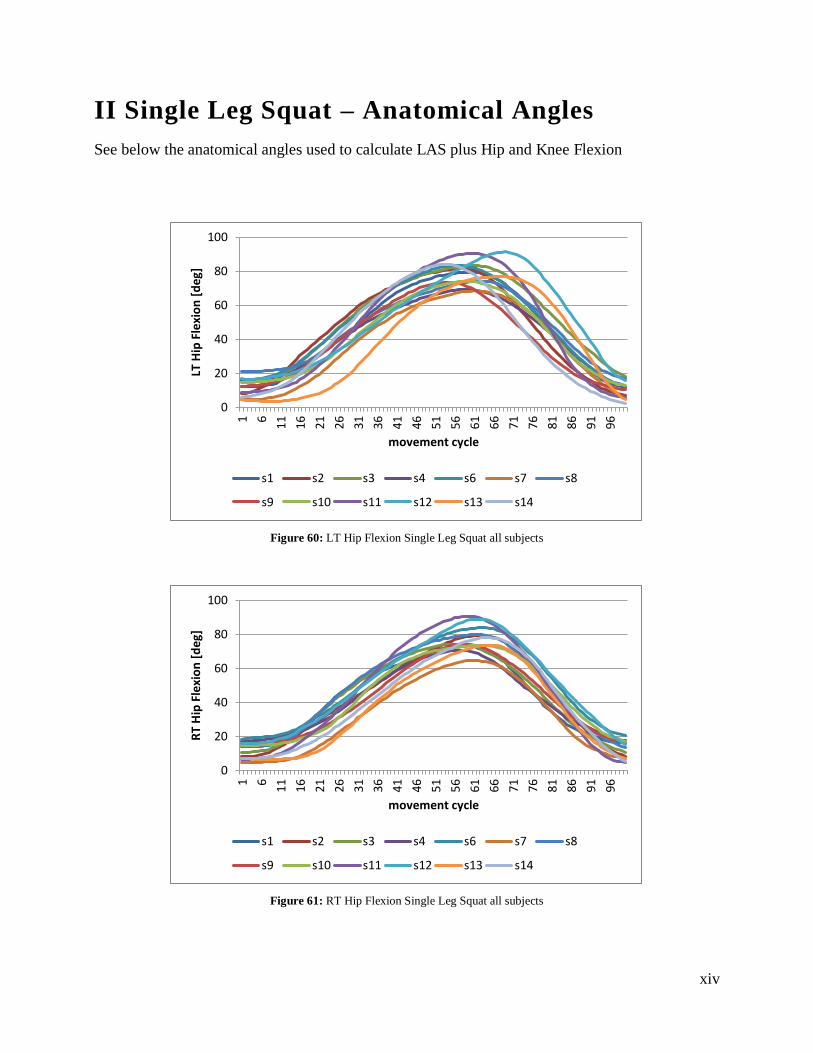
xiv
II Single Leg Squat – Anatomical Angles
See below the anatomical angles used to calculate LAS plus Hip and Knee Flexion
Figure 60: LT Hip Flexion Single Leg Squat all subjects
Figure 61: RT Hip Flexion Single Leg Squat all subjects
0
20
40
60
80
1001 6
11 16 21 26 31 36 41 46 51 56 61 66 71 76 81 86 91 96
LT H
ip F
lexi
on
[d
eg]
movement cycle
s1 s2 s3 s4 s6 s7 s8
s9 s10 s11 s12 s13 s14
0
20
40
60
80
100
1 6
11 16 21 26 31 36 41 46 51 56 61 66 71 76 81 86 91 96
RT
Hip
Fle
xio
n [
deg
]
movement cycle
s1 s2 s3 s4 s6 s7 s8
s9 s10 s11 s12 s13 s14
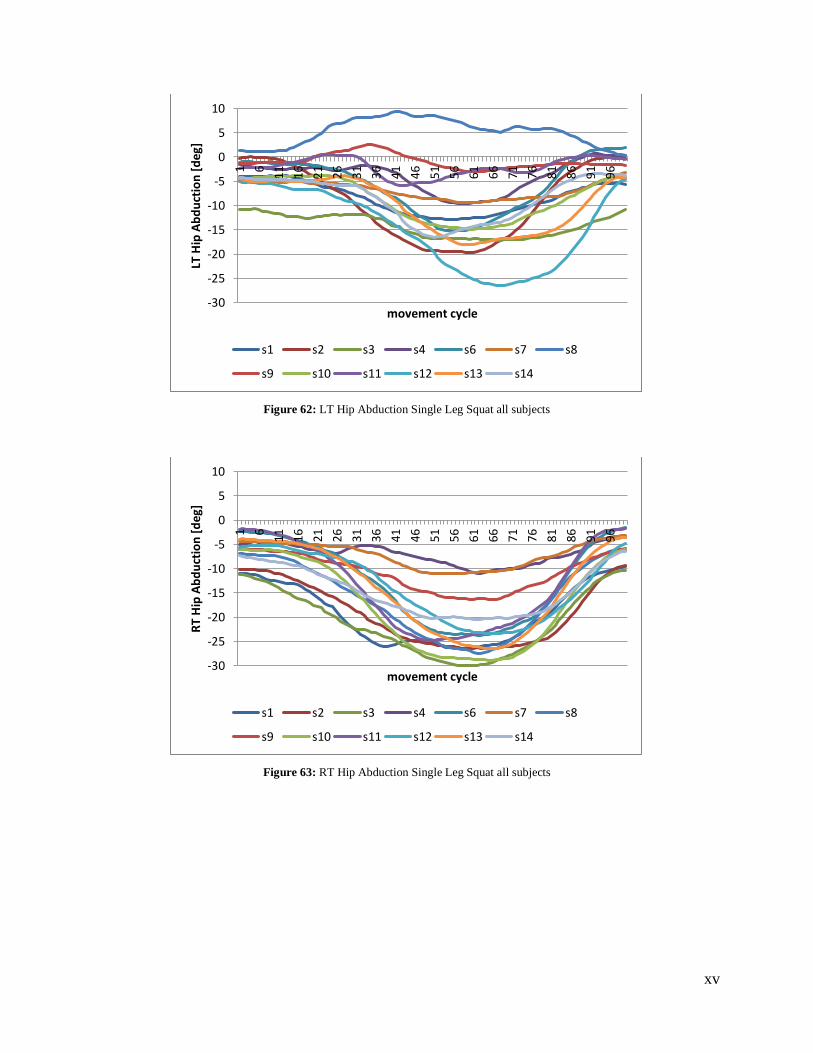
xv
Figure 62: LT Hip Abduction Single Leg Squat all subjects
Figure 63: RT Hip Abduction Single Leg Squat all subjects
-30
-25
-20
-15
-10
-5
0
5
10
1 6
11 16 21 26 31 36 41 46 51 56 61 66 71 76 81 86 91 96
LT H
ip A
bd
uct
ion
[d
eg]
movement cycle
s1 s2 s3 s4 s6 s7 s8
s9 s10 s11 s12 s13 s14
-30
-25
-20
-15
-10
-5
0
5
10
1 6
11 16 21 26 31 36 41 46 51 56 61 66 71 76 81 86 91 96
RT
Hip
Ab
du
ctio
n [
deg
]
movement cycle
s1 s2 s3 s4 s6 s7 s8
s9 s10 s11 s12 s13 s14
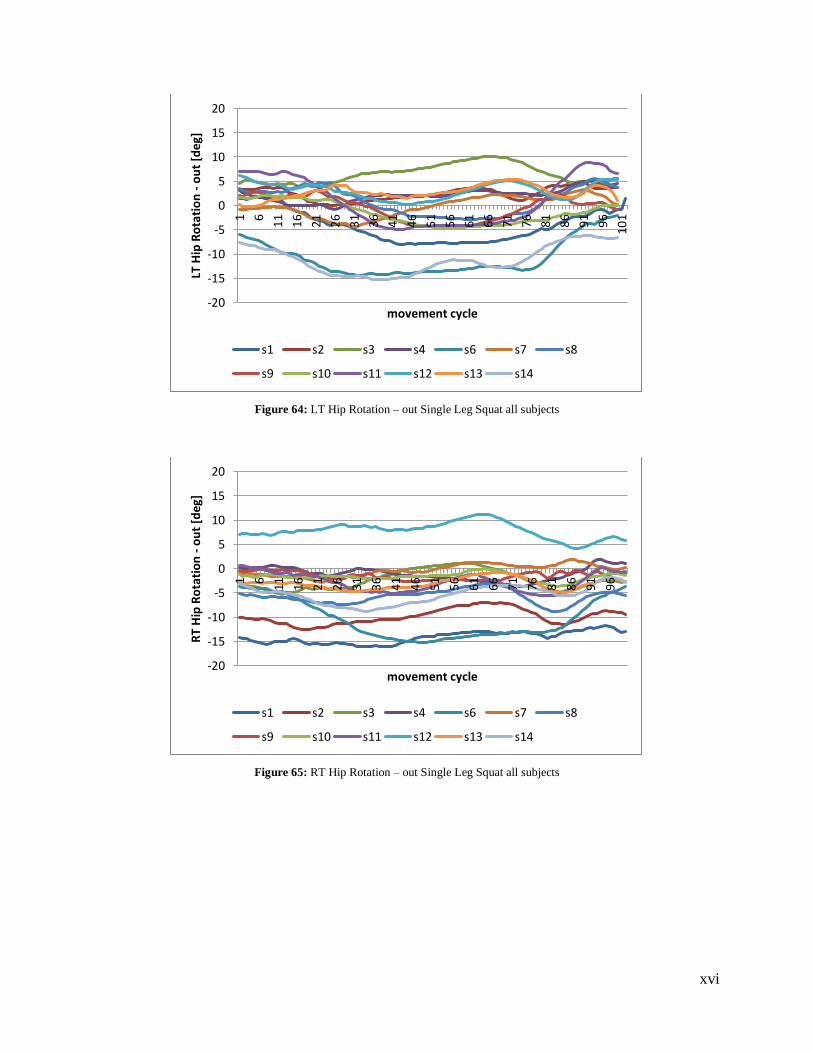
xvi
Figure 64: LT Hip Rotation – out Single Leg Squat all subjects
Figure 65: RT Hip Rotation – out Single Leg Squat all subjects
-20
-15
-10
-5
0
5
10
15
20
1 6
11 16 21 26 31 36 41 46 51 56 61 66 71 76 81 86 91 96
101
LT H
ip R
ota
tio
n -
ou
t [d
eg]
movement cycle
s1 s2 s3 s4 s6 s7 s8
s9 s10 s11 s12 s13 s14
-20
-15
-10
-5
0
5
10
15
20
1 6
11 16 21 26 31 36 41 46 51 56 61 66 71 76 81 86 91 96
RT
Hip
Ro
tati
on
- o
ut
[deg
]
movement cycle
s1 s2 s3 s4 s6 s7 s8
s9 s10 s11 s12 s13 s14
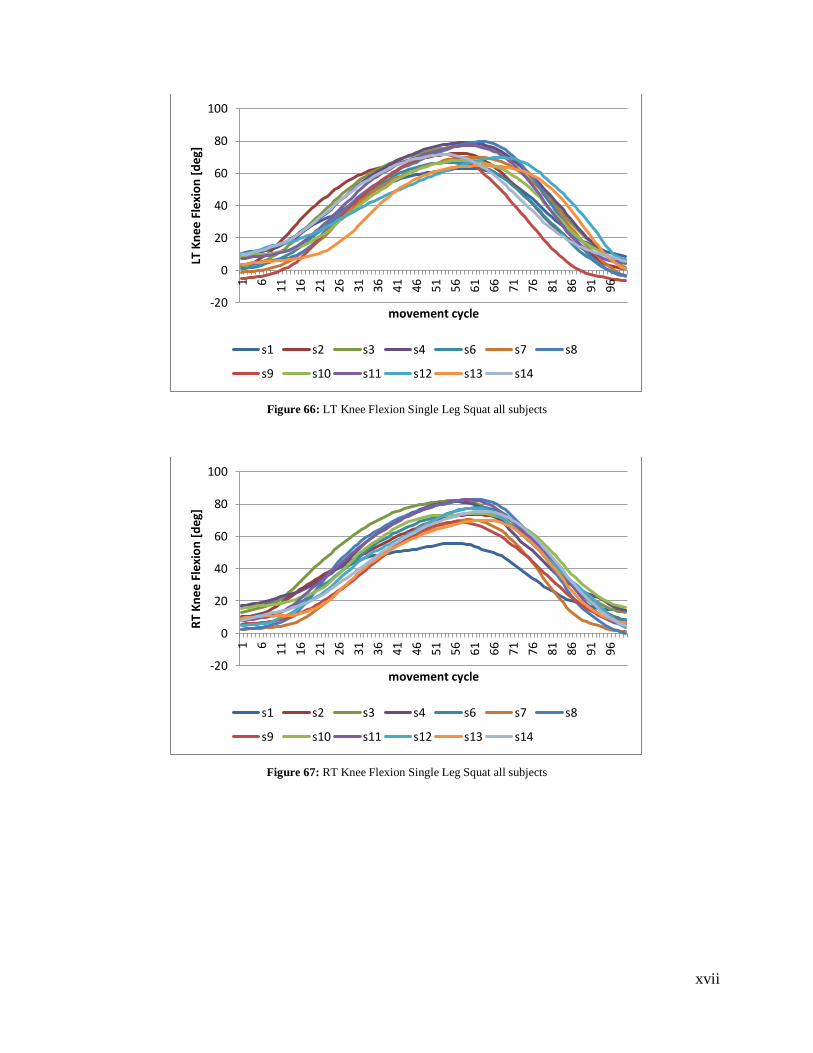
xvii
Figure 66: LT Knee Flexion Single Leg Squat all subjects
Figure 67: RT Knee Flexion Single Leg Squat all subjects
-20
0
20
40
60
80
100
1 6
11 16 21 26 31 36 41 46 51 56 61 66 71 76 81 86 91 96
LT K
nee
Fle
xio
n [
deg
]
movement cycle
s1 s2 s3 s4 s6 s7 s8
s9 s10 s11 s12 s13 s14
-20
0
20
40
60
80
100
1 6
11 16 21 26 31 36 41 46 51 56 61 66 71 76 81 86 91 96
RT
Kn
ee F
lexi
on
[d
eg]
movement cycle
s1 s2 s3 s4 s6 s7 s8
s9 s10 s11 s12 s13 s14
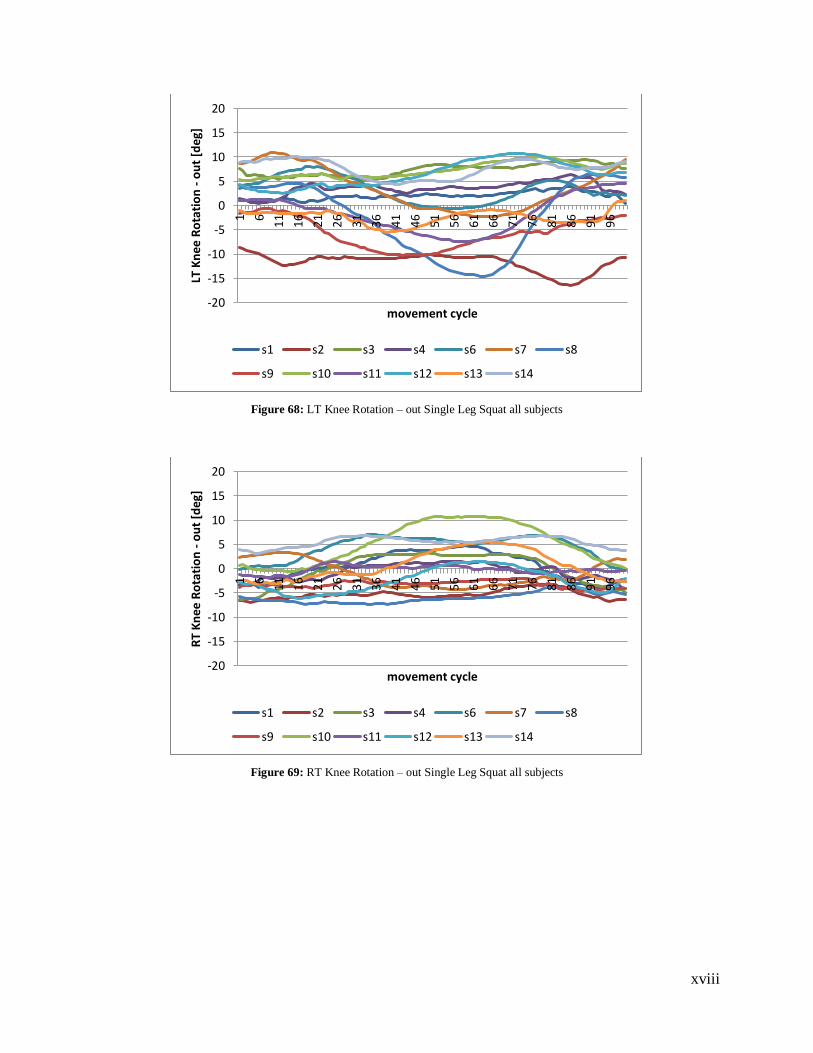
xviii
Figure 68: LT Knee Rotation – out Single Leg Squat all subjects
Figure 69: RT Knee Rotation – out Single Leg Squat all subjects
-20
-15
-10
-5
0
5
10
15
20
1 6
11 16 21 26 31 36 41 46 51 56 61 66 71 76 81 86 91 96
LT K
nee
Ro
tati
on
- o
ut
[deg
]
movement cycle
s1 s2 s3 s4 s6 s7 s8
s9 s10 s11 s12 s13 s14
-20
-15
-10
-5
0
5
10
15
20
1 6
11 16 21 26 31 36 41 46 51 56 61 66 71 76 81 86 91 96
RT
Kn
ee R
ota
tio
n -
ou
t [d
eg]
movement cycle
s1 s2 s3 s4 s6 s7 s8
s9 s10 s11 s12 s13 s14
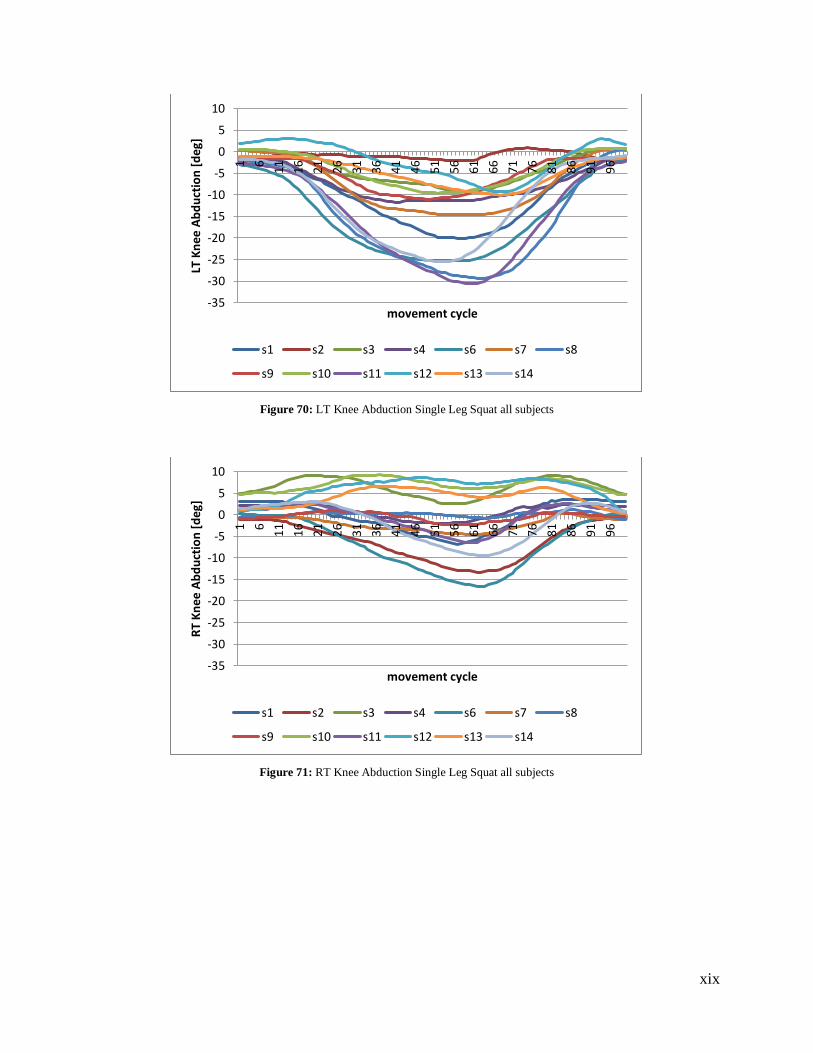
xix
Figure 70: LT Knee Abduction Single Leg Squat all subjects
Figure 71: RT Knee Abduction Single Leg Squat all subjects
-35
-30
-25
-20
-15
-10
-5
0
5
10
1 6
11 16 21 26 31 36 41 46 51 56 61 66 71 76 81 86 91 96
LT K
nee
Ab
du
ctio
n [
deg
]
movement cycle
s1 s2 s3 s4 s6 s7 s8
s9 s10 s11 s12 s13 s14
-35
-30
-25
-20
-15
-10
-5
0
5
10
1 6
11 16 21 26 31 36 41 46 51 56 61 66 71 76 81 86 91 96
RT
Kn
ee A
bd
uct
ion
[d
eg]
movement cycle
s1 s2 s3 s4 s6 s7 s8
s9 s10 s11 s12 s13 s14
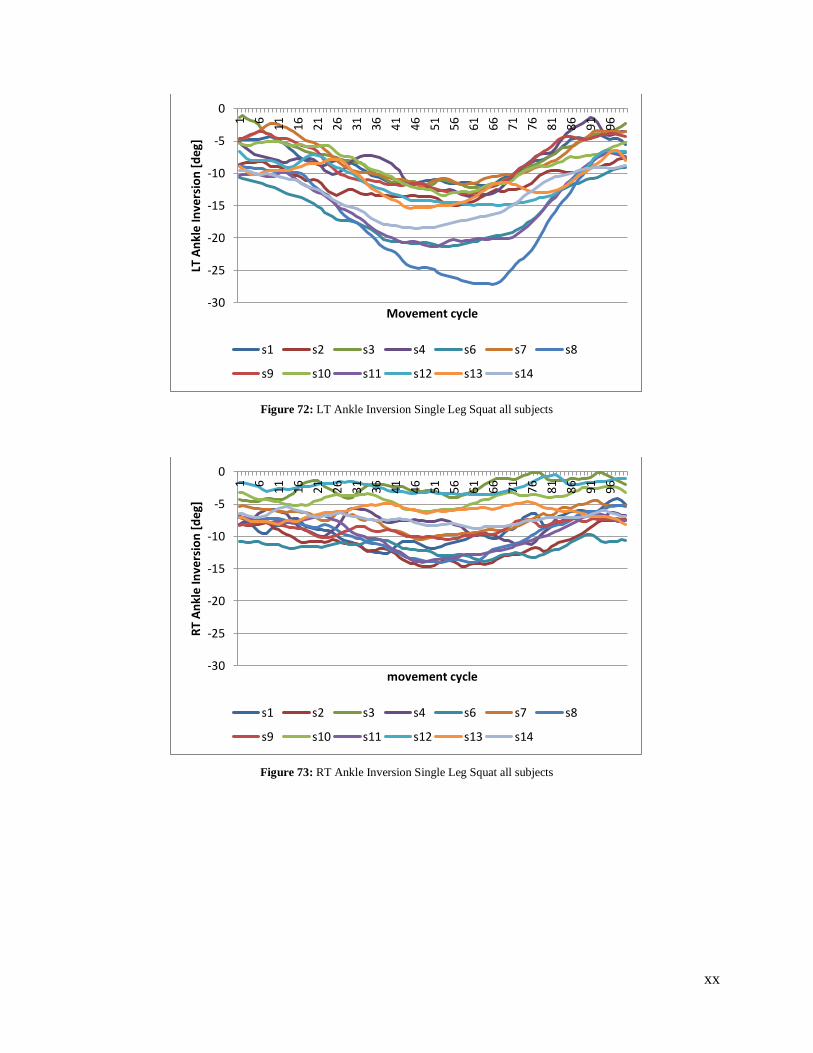
xx
Figure 72: LT Ankle Inversion Single Leg Squat all subjects
Figure 73: RT Ankle Inversion Single Leg Squat all subjects
-30
-25
-20
-15
-10
-5
0
1 6
11 16 21 26 31 36 41 46 51 56 61 66 71 76 81 86 91 96
LT A
nkl
e In
vers
ion
[d
eg]
Movement cycle
s1 s2 s3 s4 s6 s7 s8
s9 s10 s11 s12 s13 s14
-30
-25
-20
-15
-10
-5
0
1 6
11 16 21 26 31 36 41 46 51 56 61 66 71 76 81 86 91 96
RT
An
kle
Inve
rsio
n [
deg
]
movement cycle
s1 s2 s3 s4 s6 s7 s8
s9 s10 s11 s12 s13 s14
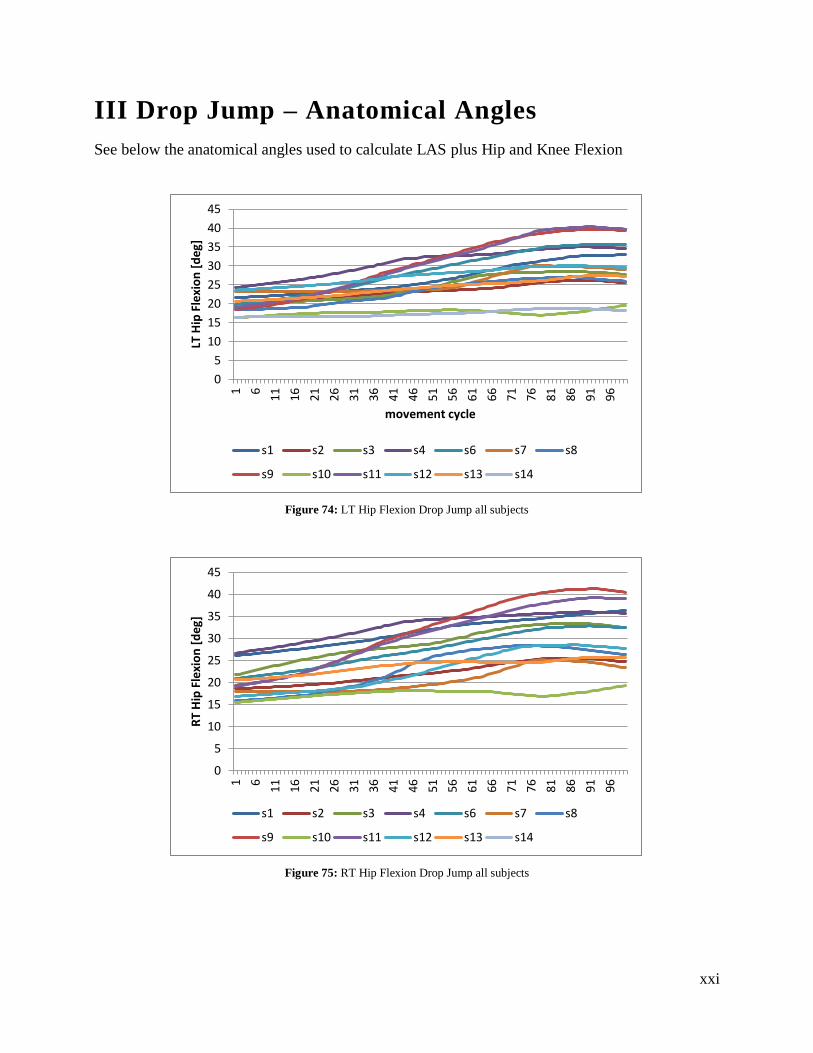
xxi
III Drop Jump – Anatomical Angles
See below the anatomical angles used to calculate LAS plus Hip and Knee Flexion
Figure 74: LT Hip Flexion Drop Jump all subjects
Figure 75: RT Hip Flexion Drop Jump all subjects
0
5
10
15
20
25
30
35
40
45
1 6
11 16 21 26 31 36 41 46 51 56 61 66 71 76 81 86 91 96
LT H
ip F
lexi
on
[d
eg]
movement cycle
s1 s2 s3 s4 s6 s7 s8
s9 s10 s11 s12 s13 s14
0
5
10
15
20
25
30
35
40
45
1 6
11 16 21 26 31 36 41 46 51 56 61 66 71 76 81 86 91 96
RT
Hip
Fle
xio
n [
deg
]
s1 s2 s3 s4 s6 s7 s8
s9 s10 s11 s12 s13 s14
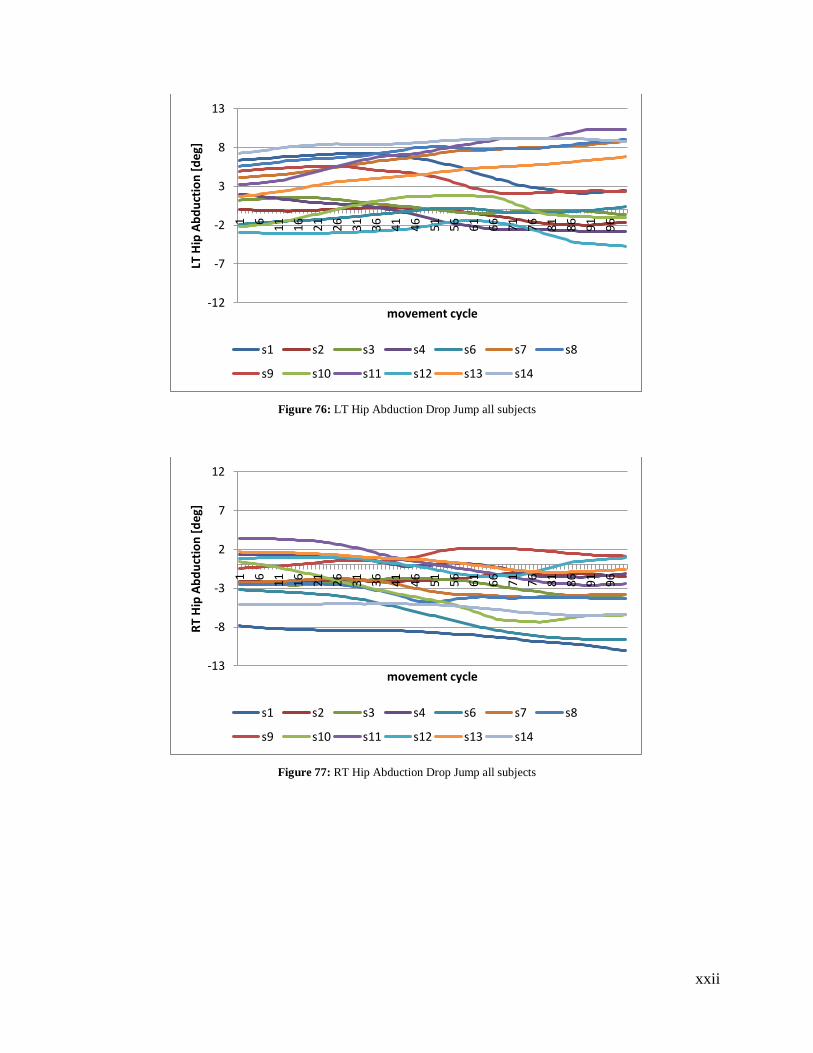
xxii
Figure 76: LT Hip Abduction Drop Jump all subjects
Figure 77: RT Hip Abduction Drop Jump all subjects
-12
-7
-2
3
8
13
1 6
11 16 21 26 31 36 41 46 51 56 61 66 71 76 81 86 91 96
LT H
ip A
bd
uct
ion
[d
eg]
movement cycle
s1 s2 s3 s4 s6 s7 s8
s9 s10 s11 s12 s13 s14
-13
-8
-3
2
7
12
1 6
11 16 21 26 31 36 41 46 51 56 61 66 71 76 81 86 91 96
RT
Hip
Ab
du
ctio
n [
deg
]
movement cycle
s1 s2 s3 s4 s6 s7 s8
s9 s10 s11 s12 s13 s14
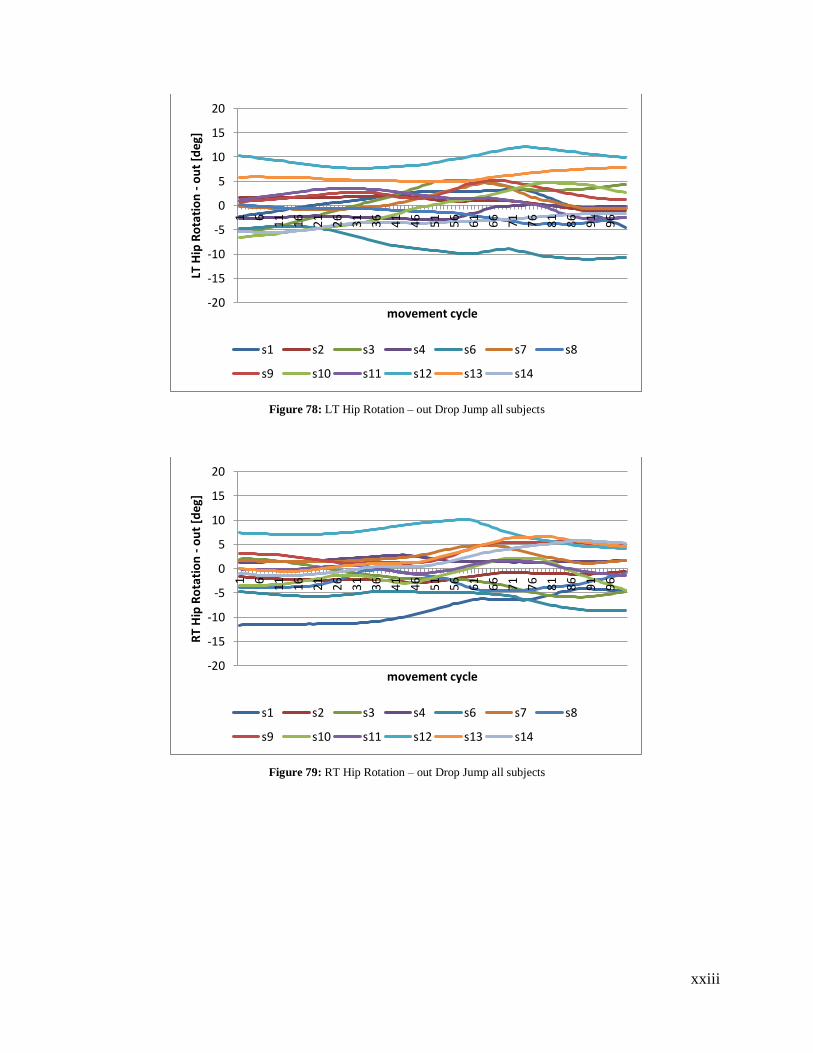
xxiii
Figure 78: LT Hip Rotation – out Drop Jump all subjects
Figure 79: RT Hip Rotation – out Drop Jump all subjects
-20
-15
-10
-5
0
5
10
15
20
1 6
11 16 21 26 31 36 41 46 51 56 61 66 71 76 81 86 91 96
LT H
ip R
ota
tio
n -
ou
t [d
eg]
movement cycle
s1 s2 s3 s4 s6 s7 s8
s9 s10 s11 s12 s13 s14
-20
-15
-10
-5
0
5
10
15
20
1 6
11 16 21 26 31 36 41 46 51 56 61 66 71 76 81 86 91 96
RT
Hip
Ro
tati
on
- o
ut
[deg
]
movement cycle
s1 s2 s3 s4 s6 s7 s8
s9 s10 s11 s12 s13 s14
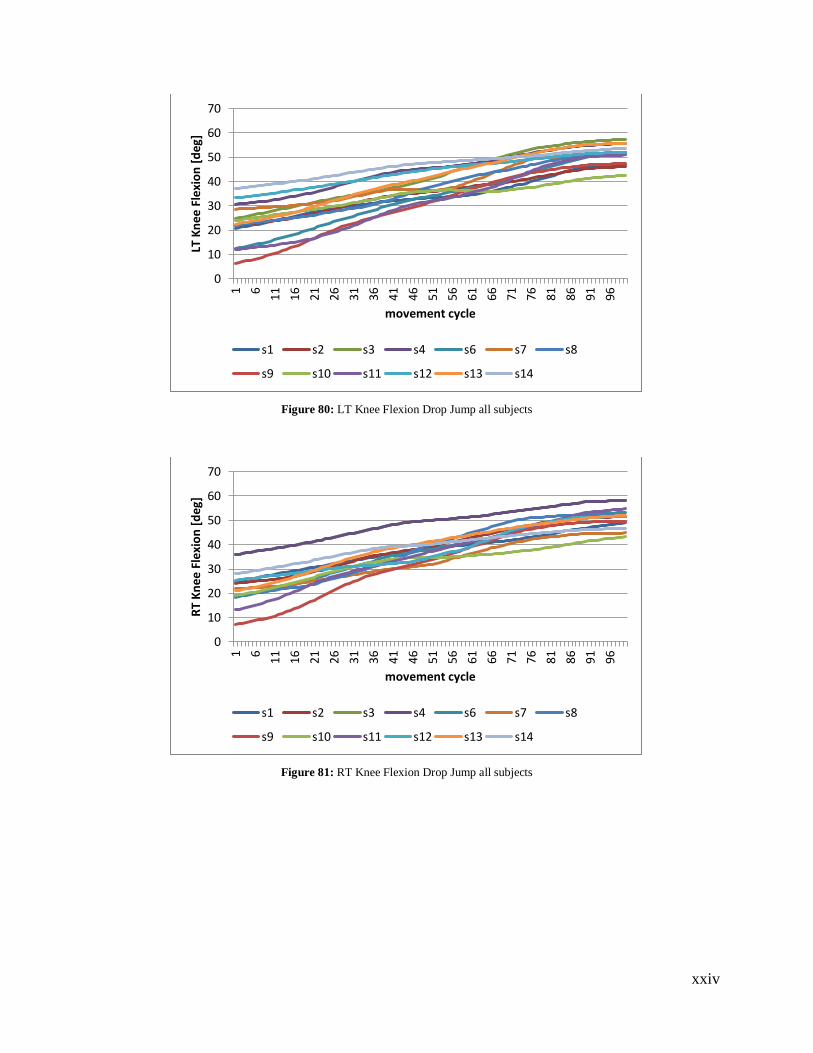
xxiv
Figure 80: LT Knee Flexion Drop Jump all subjects
Figure 81: RT Knee Flexion Drop Jump all subjects
0
10
20
30
40
50
60
70
1 6
11 16 21 26 31 36 41 46 51 56 61 66 71 76 81 86 91 96
LT K
nee
Fle
xio
n [
deg
]
movement cycle
s1 s2 s3 s4 s6 s7 s8
s9 s10 s11 s12 s13 s14
0
10
20
30
40
50
60
70
1 6
11 16 21 26 31 36 41 46 51 56 61 66 71 76 81 86 91 96
RT
Kn
ee F
lexi
on
[d
eg]
movement cycle
s1 s2 s3 s4 s6 s7 s8
s9 s10 s11 s12 s13 s14
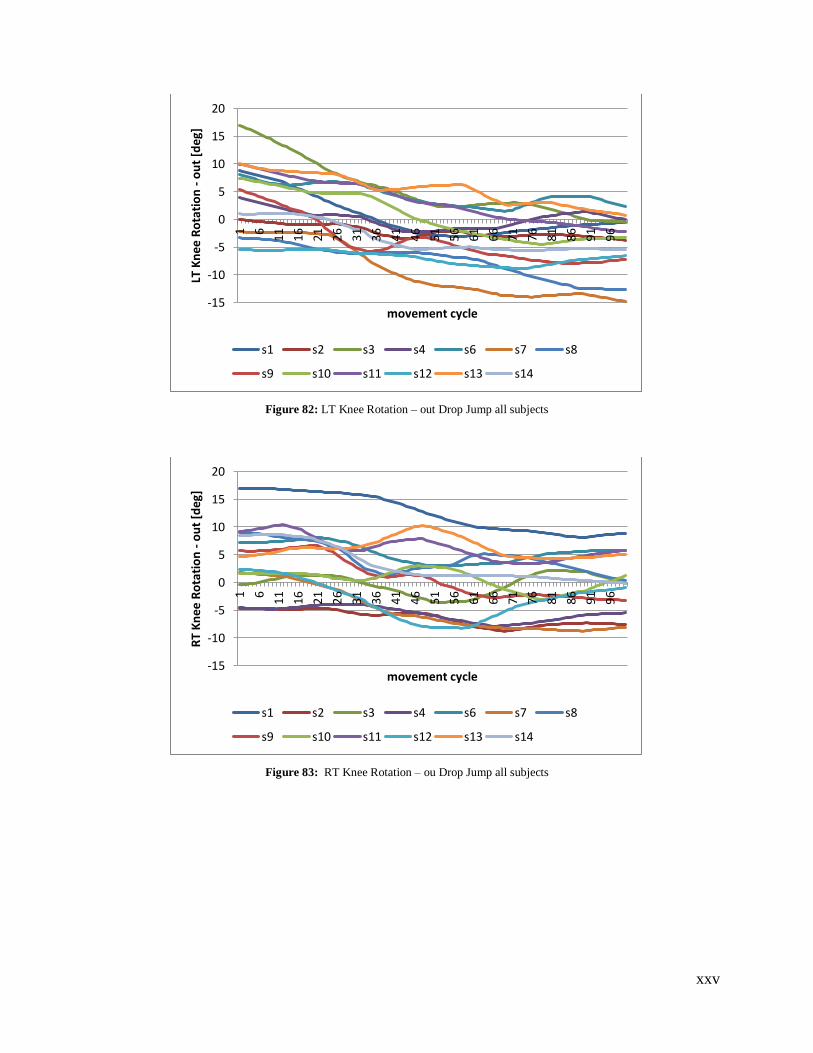
xxv
Figure 82: LT Knee Rotation – out Drop Jump all subjects
Figure 83: RT Knee Rotation – ou Drop Jump all subjects
-15
-10
-5
0
5
10
15
20
1 6
11 16 21 26 31 36 41 46 51 56 61 66 71 76 81 86 91 96
LT K
nee
Ro
tati
on
- o
ut
[deg
]
movement cycle
s1 s2 s3 s4 s6 s7 s8
s9 s10 s11 s12 s13 s14
-15
-10
-5
0
5
10
15
20
1 6
11 16 21 26 31 36 41 46 51 56 61 66 71 76 81 86 91 96
RT
Kn
ee R
ota
tio
n -
ou
t [d
eg]
movement cycle
s1 s2 s3 s4 s6 s7 s8
s9 s10 s11 s12 s13 s14
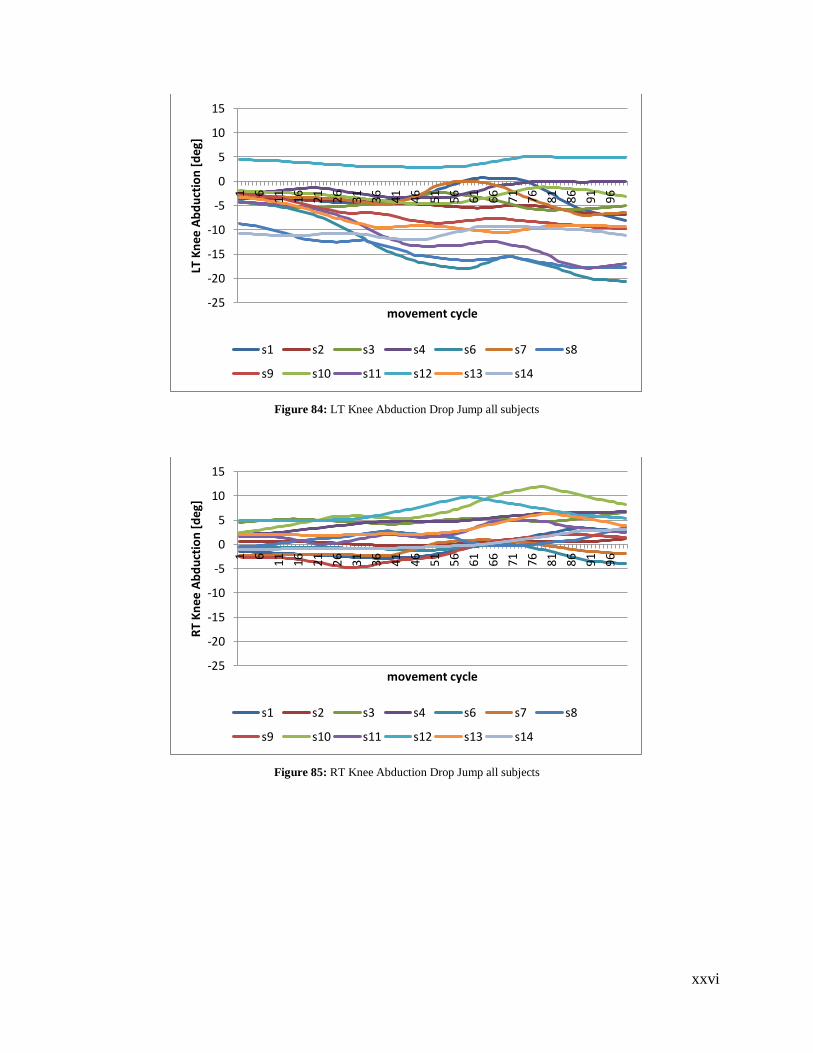
xxvi
Figure 84: LT Knee Abduction Drop Jump all subjects
Figure 85: RT Knee Abduction Drop Jump all subjects
-25
-20
-15
-10
-5
0
5
10
15
1 6
11 16 21 26 31 36 41 46 51 56 61 66 71 76 81 86 91 96
LT K
nee
Ab
du
ctio
n [
deg
]
movement cycle
s1 s2 s3 s4 s6 s7 s8
s9 s10 s11 s12 s13 s14
-25
-20
-15
-10
-5
0
5
10
15
1 6
11 16 21 26 31 36 41 46 51 56 61 66 71 76 81 86 91 96
RT
Kn
ee A
bd
uct
ion
[d
eg]
movement cycle
s1 s2 s3 s4 s6 s7 s8
s9 s10 s11 s12 s13 s14
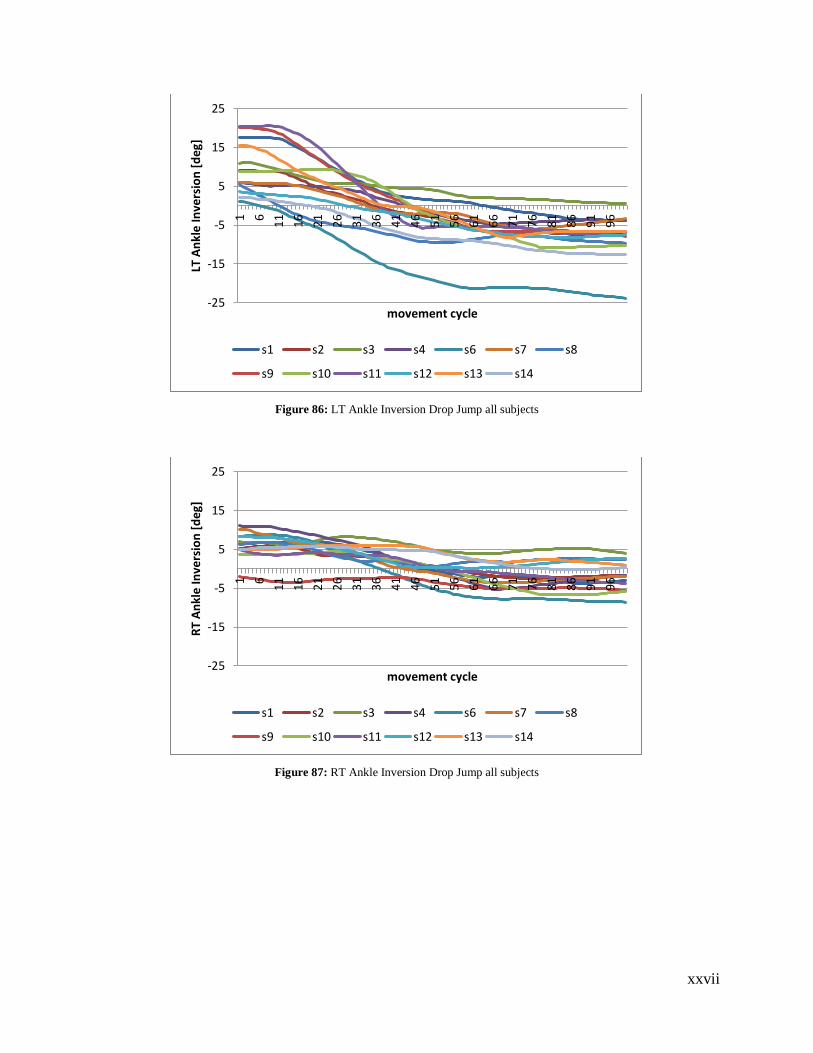
xxvii
Figure 86: LT Ankle Inversion Drop Jump all subjects
Figure 87: RT Ankle Inversion Drop Jump all subjects
-25
-15
-5
5
15
25
1 6
11 16 21 26 31 36 41 46 51 56 61 66 71 76 81 86 91 96
LT A
nkl
e In
vers
ion
[d
eg]
movement cycle
s1 s2 s3 s4 s6 s7 s8
s9 s10 s11 s12 s13 s14
-25
-15
-5
5
15
25
1 6
11 16 21 26 31 36 41 46 51 56 61 66 71 76 81 86 91 96
RT
An
kle
Inve
rsio
n [
deg
]
movement cycle
s1 s2 s3 s4 s6 s7 s8
s9 s10 s11 s12 s13 s14
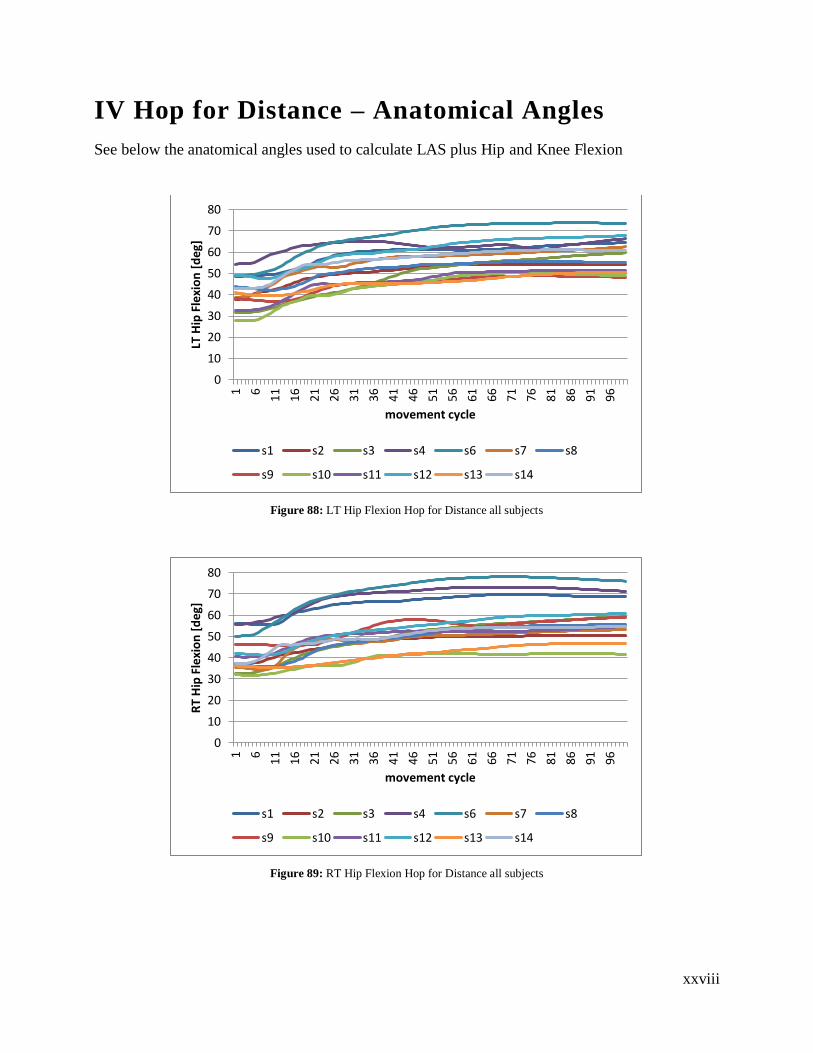
xxviii
IV Hop for Distance – Anatomical Angles
See below the anatomical angles used to calculate LAS plus Hip and Knee Flexion
Figure 88: LT Hip Flexion Hop for Distance all subjects
Figure 89: RT Hip Flexion Hop for Distance all subjects
0
10
20
30
40
50
60
70
80
1 6
11 16 21 26 31 36 41 46 51 56 61 66 71 76 81 86 91 96
LT H
ip F
lexi
on
[d
eg]
movement cycle
s1 s2 s3 s4 s6 s7 s8
s9 s10 s11 s12 s13 s14
0
10
20
30
40
50
60
70
80
1 6
11 16 21 26 31 36 41 46 51 56 61 66 71 76 81 86 91 96
RT
Hip
Fle
xio
n [
deg
]
movement cycle
s1 s2 s3 s4 s6 s7 s8
s9 s10 s11 s12 s13 s14
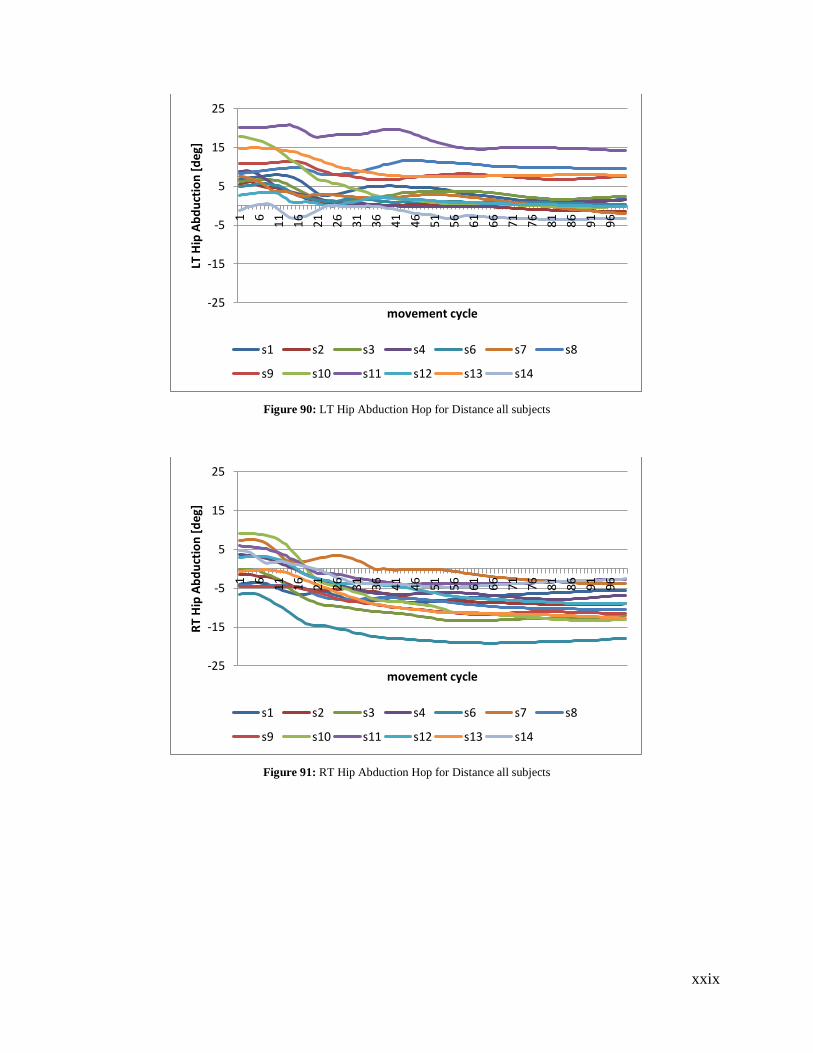
xxix
Figure 90: LT Hip Abduction Hop for Distance all subjects
Figure 91: RT Hip Abduction Hop for Distance all subjects
-25
-15
-5
5
15
25
1 6
11 16 21 26 31 36 41 46 51 56 61 66 71 76 81 86 91 96
LT H
ip A
bd
uct
ion
[d
eg]
movement cycle
s1 s2 s3 s4 s6 s7 s8
s9 s10 s11 s12 s13 s14
-25
-15
-5
5
15
25
1 6
11 16 21 26 31 36 41 46 51 56 61 66 71 76 81 86 91 96
RT
Hip
Ab
du
ctio
n [
deg
]
movement cycle
s1 s2 s3 s4 s6 s7 s8
s9 s10 s11 s12 s13 s14
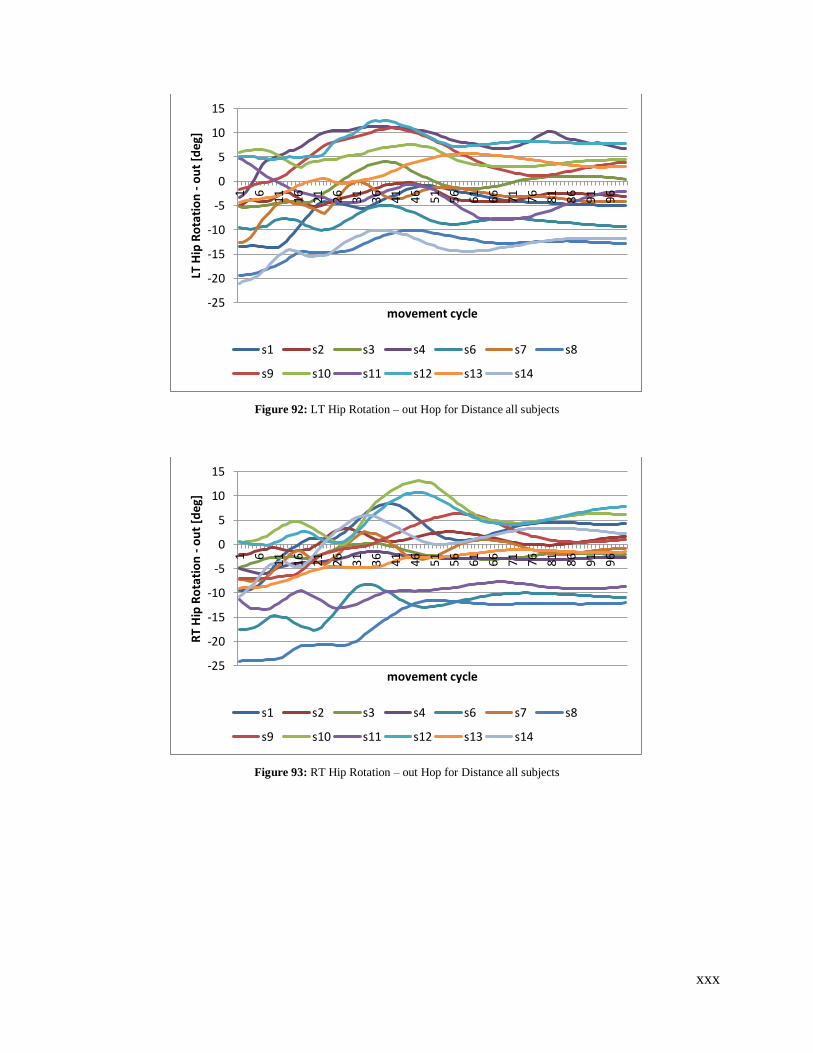
xxx
Figure 92: LT Hip Rotation – out Hop for Distance all subjects
Figure 93: RT Hip Rotation – out Hop for Distance all subjects
-25
-20
-15
-10
-5
0
5
10
15
1 6
11 16 21 26 31 36 41 46 51 56 61 66 71 76 81 86 91 96
LT H
ip R
ota
tio
n -
ou
t [d
eg]
movement cycle
s1 s2 s3 s4 s6 s7 s8
s9 s10 s11 s12 s13 s14
-25
-20
-15
-10
-5
0
5
10
15
1 6
11 16 21 26 31 36 41 46 51 56 61 66 71 76 81 86 91 96
RT
Hip
Ro
tati
on
- o
ut
[deg
]
movement cycle
s1 s2 s3 s4 s6 s7 s8
s9 s10 s11 s12 s13 s14
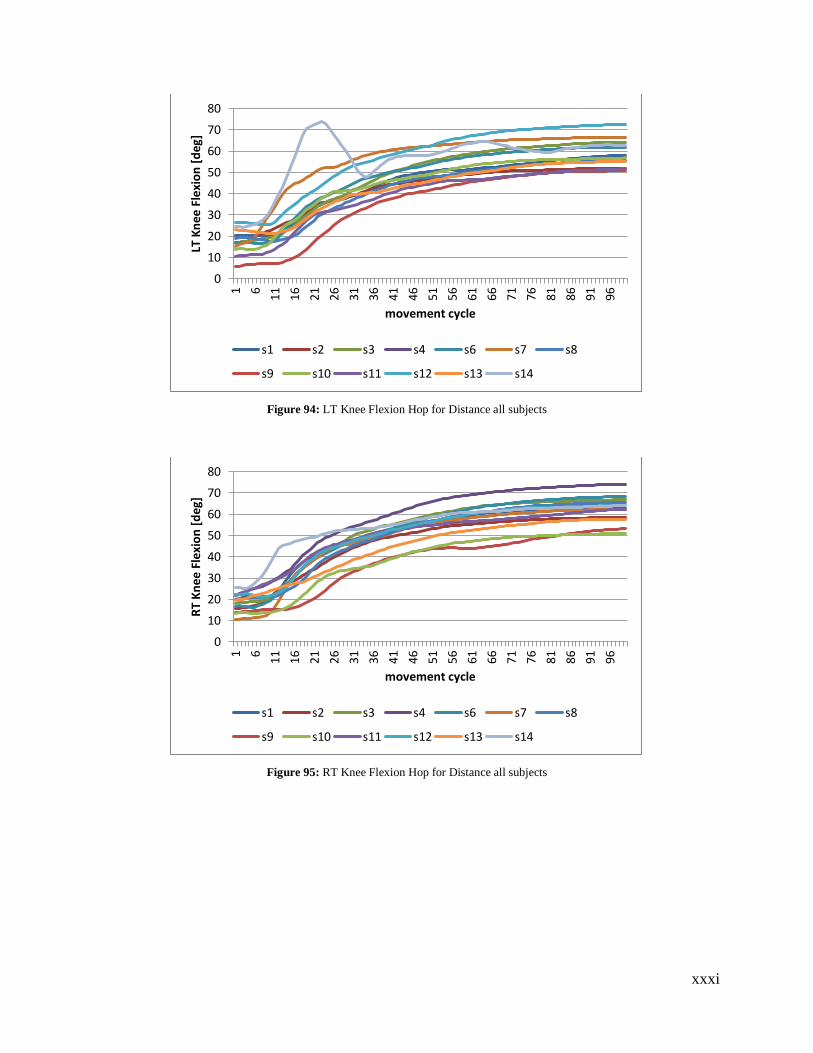
xxxi
Figure 94: LT Knee Flexion Hop for Distance all subjects
Figure 95: RT Knee Flexion Hop for Distance all subjects
0
10
20
30
40
50
60
70
80
1 6
11 16 21 26 31 36 41 46 51 56 61 66 71 76 81 86 91 96
LT K
nee
Fle
xio
n [
deg
]
movement cycle
s1 s2 s3 s4 s6 s7 s8
s9 s10 s11 s12 s13 s14
0
10
20
30
40
50
60
70
80
1 6
11 16 21 26 31 36 41 46 51 56 61 66 71 76 81 86 91 96
RT
Kn
ee F
lexi
on
[d
eg]
movement cycle
s1 s2 s3 s4 s6 s7 s8
s9 s10 s11 s12 s13 s14
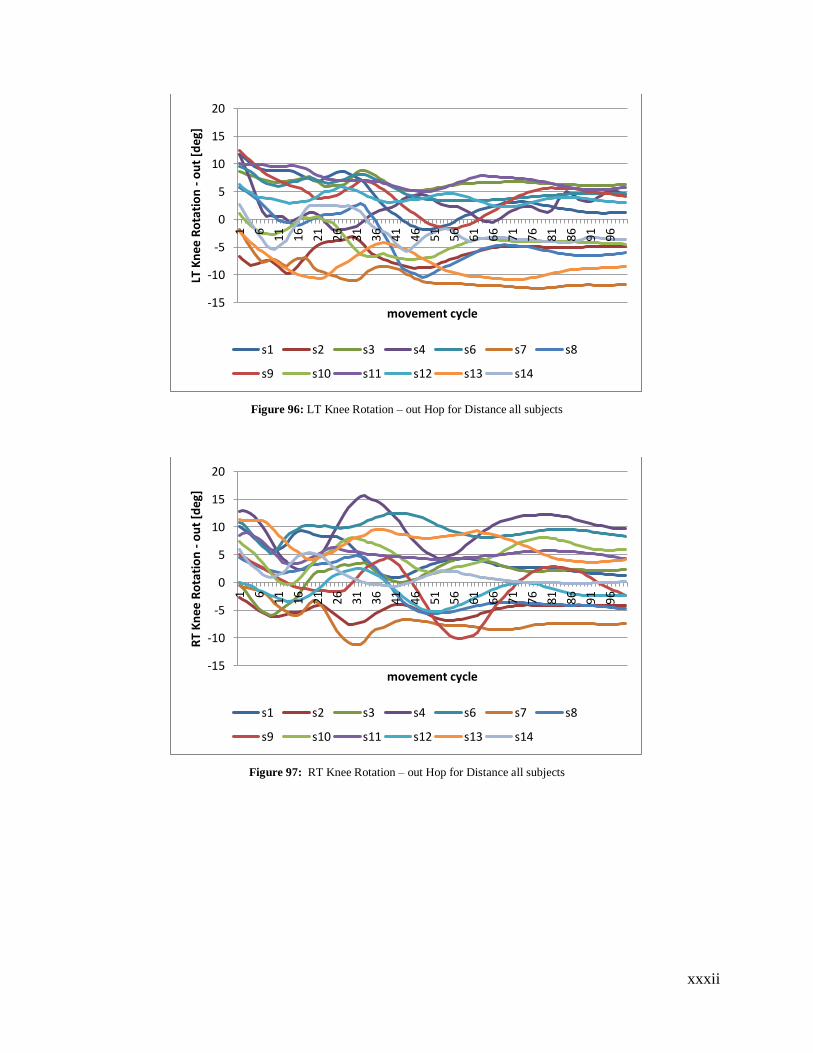
xxxii
Figure 96: LT Knee Rotation – out Hop for Distance all subjects
Figure 97: RT Knee Rotation – out Hop for Distance all subjects
-15
-10
-5
0
5
10
15
20
1 6
11 16 21 26 31 36 41 46 51 56 61 66 71 76 81 86 91 96
LT K
nee
Ro
tati
on
- o
ut
[deg
]
movement cycle
s1 s2 s3 s4 s6 s7 s8
s9 s10 s11 s12 s13 s14
-15
-10
-5
0
5
10
15
20
1 6
11 16 21 26 31 36 41 46 51 56 61 66 71 76 81 86 91 96
RT
Kn
ee R
ota
tio
n -
ou
t [d
eg]
movement cycle
s1 s2 s3 s4 s6 s7 s8
s9 s10 s11 s12 s13 s14
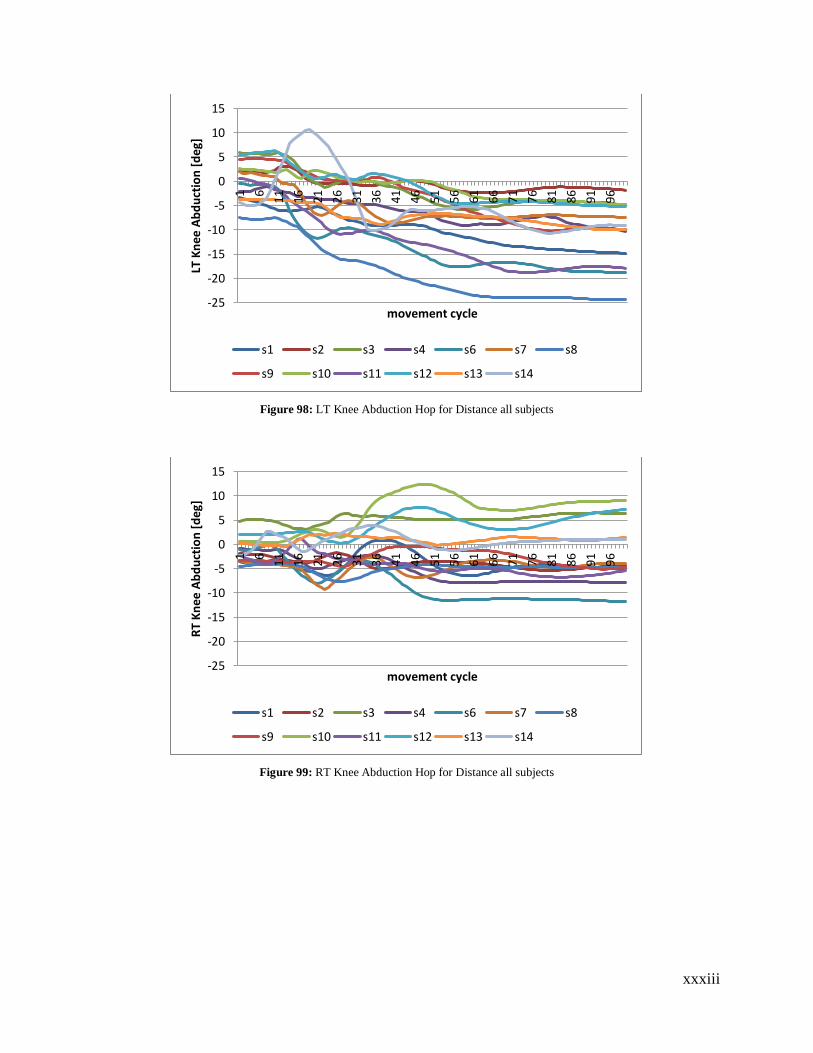
xxxiii
Figure 98: LT Knee Abduction Hop for Distance all subjects
Figure 99: RT Knee Abduction Hop for Distance all subjects
-25
-20
-15
-10
-5
0
5
10
15
1 6
11 16 21 26 31 36 41 46 51 56 61 66 71 76 81 86 91 96
LT K
nee
Ab
du
ctio
n [
deg
]
movement cycle
s1 s2 s3 s4 s6 s7 s8
s9 s10 s11 s12 s13 s14
-25
-20
-15
-10
-5
0
5
10
15
1 6
11 16 21 26 31 36 41 46 51 56 61 66 71 76 81 86 91 96
RT
Kn
ee A
bd
uct
ion
[d
eg]
movement cycle
s1 s2 s3 s4 s6 s7 s8
s9 s10 s11 s12 s13 s14
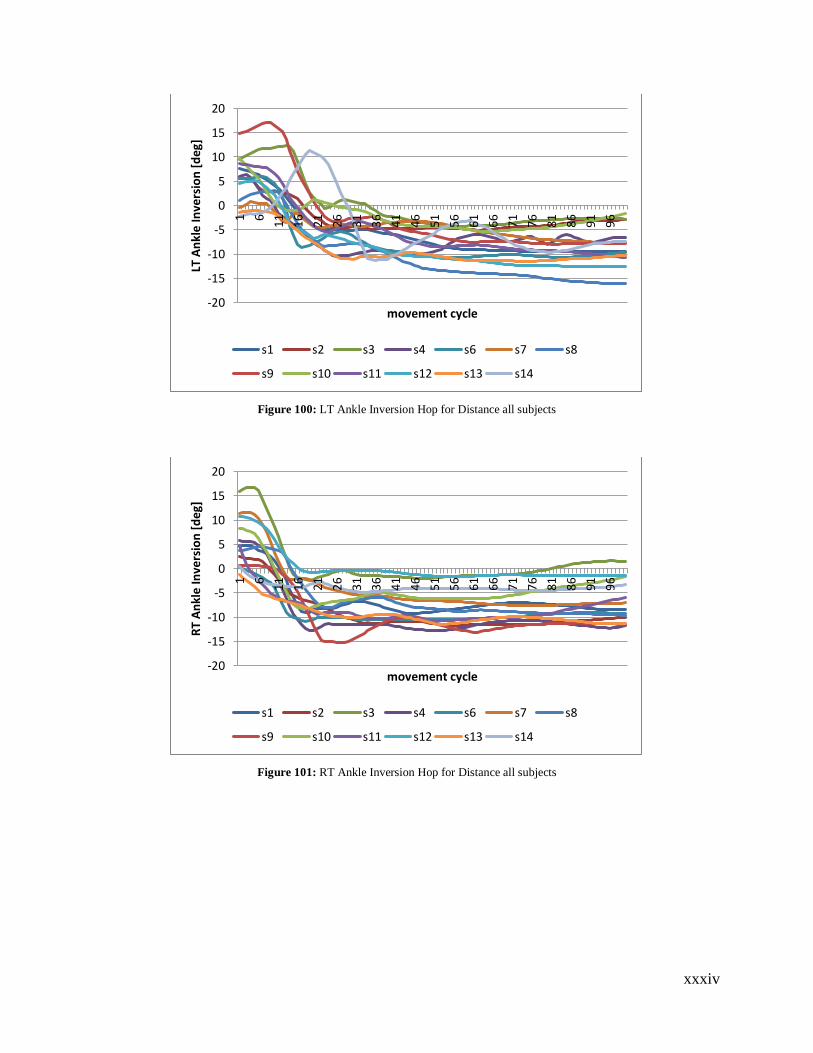
xxxiv
Figure 100: LT Ankle Inversion Hop for Distance all subjects
Figure 101: RT Ankle Inversion Hop for Distance all subjects
-20
-15
-10
-5
0
5
10
15
20
1 6
11 16 21 26 31 36 41 46 51 56 61 66 71 76 81 86 91 96
LT A
nkl
e In
vers
ion
[d
eg]
movement cycle
s1 s2 s3 s4 s6 s7 s8
s9 s10 s11 s12 s13 s14
-20
-15
-10
-5
0
5
10
15
20
1 6
11 16 21 26 31 36 41 46 51 56 61 66 71 76 81 86 91 96
RT
An
kle
Inve
rsio
n [
deg
]
movement cycle
s1 s2 s3 s4 s6 s7 s8
s9 s10 s11 s12 s13 s14
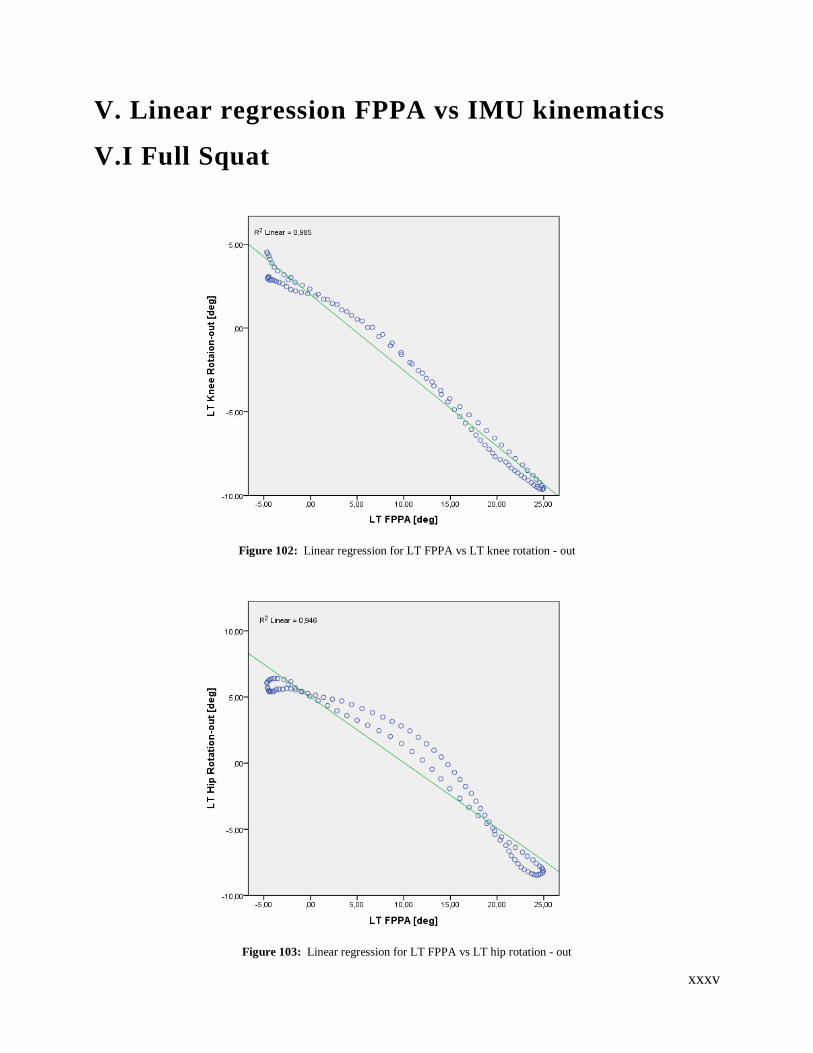
xxxv
V. Linear regression FPPA vs IMU kinematics
V.I Full Squat
Figure 102: Linear regression for LT FPPA vs LT knee rotation - out
Figure 103: Linear regression for LT FPPA vs LT hip rotation - out
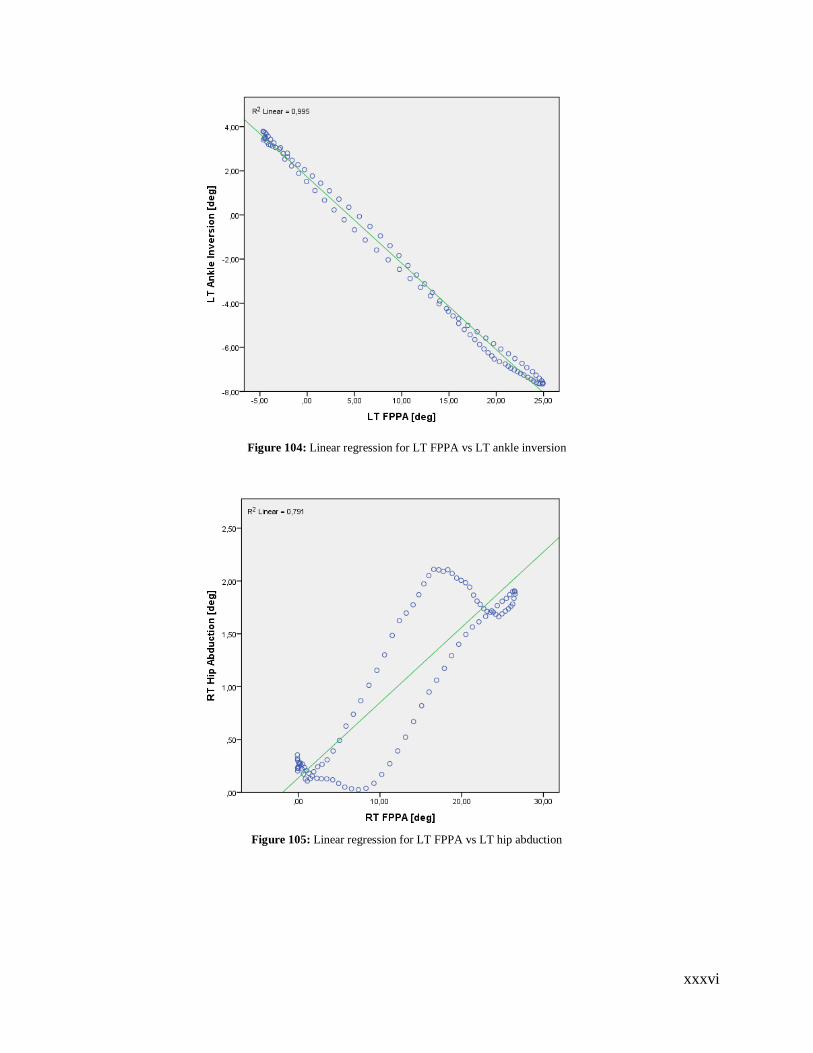
xxxvi
Figure 104: Linear regression for LT FPPA vs LT ankle inversion
Figure 105: Linear regression for LT FPPA vs LT hip abduction
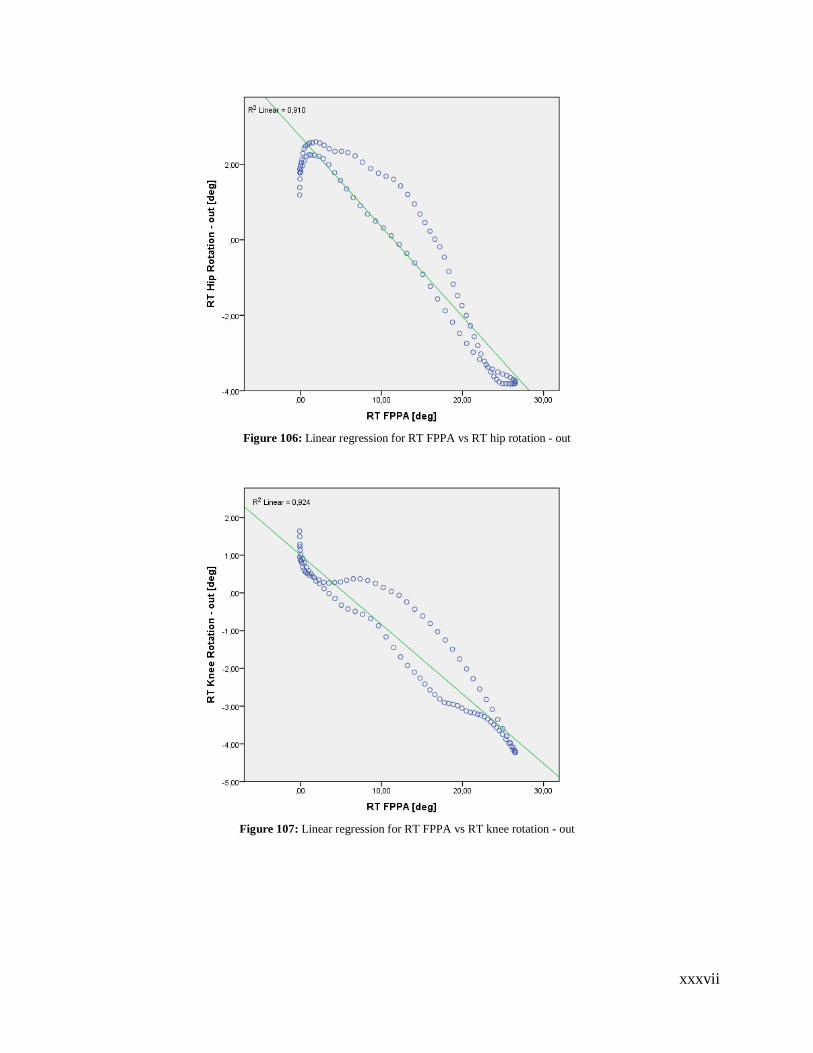
xxxvii
Figure 106: Linear regression for RT FPPA vs RT hip rotation - out
Figure 107: Linear regression for RT FPPA vs RT knee rotation - out
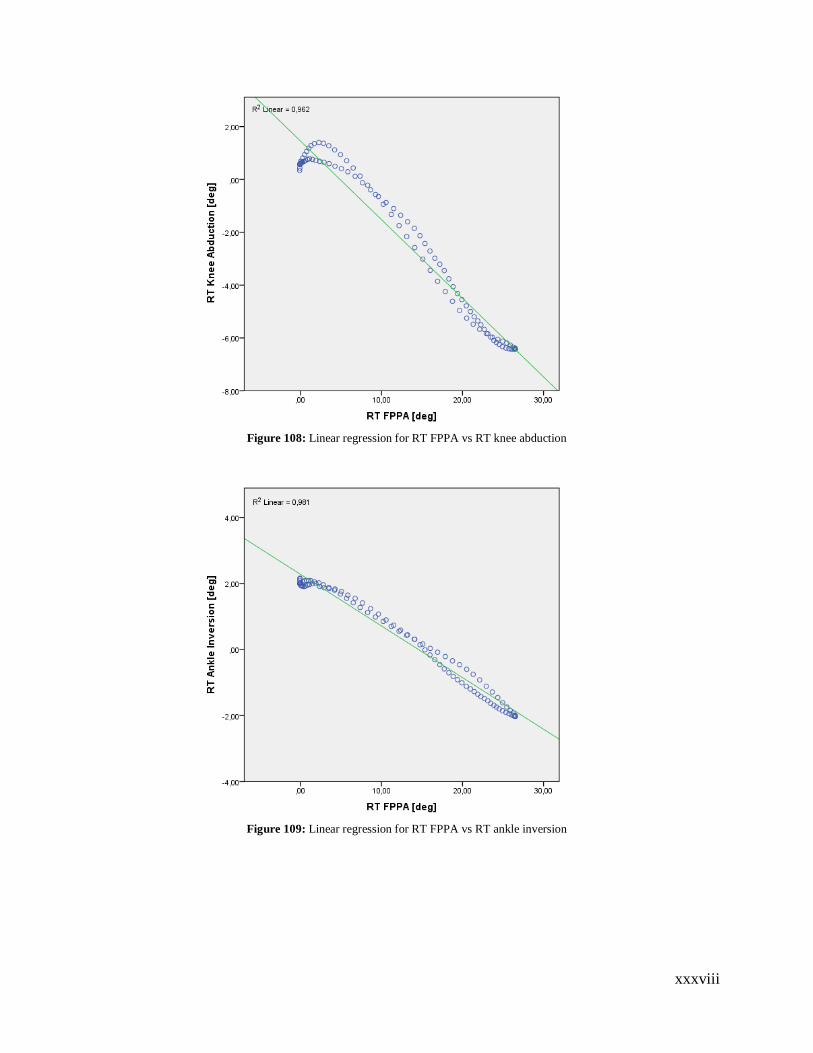
xxxviii
Figure 108: Linear regression for RT FPPA vs RT knee abduction
Figure 109: Linear regression for RT FPPA vs RT ankle inversion
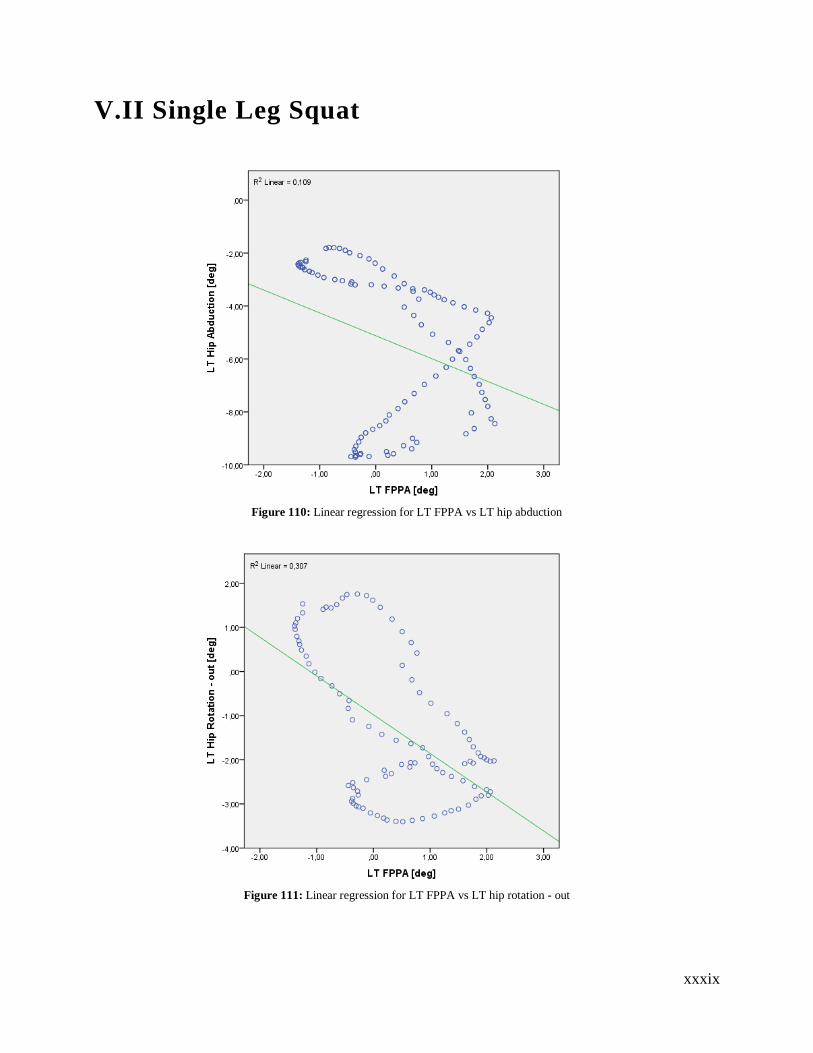
xxxix
V.II Single Leg Squat
Figure 110: Linear regression for LT FPPA vs LT hip abduction
Figure 111: Linear regression for LT FPPA vs LT hip rotation - out
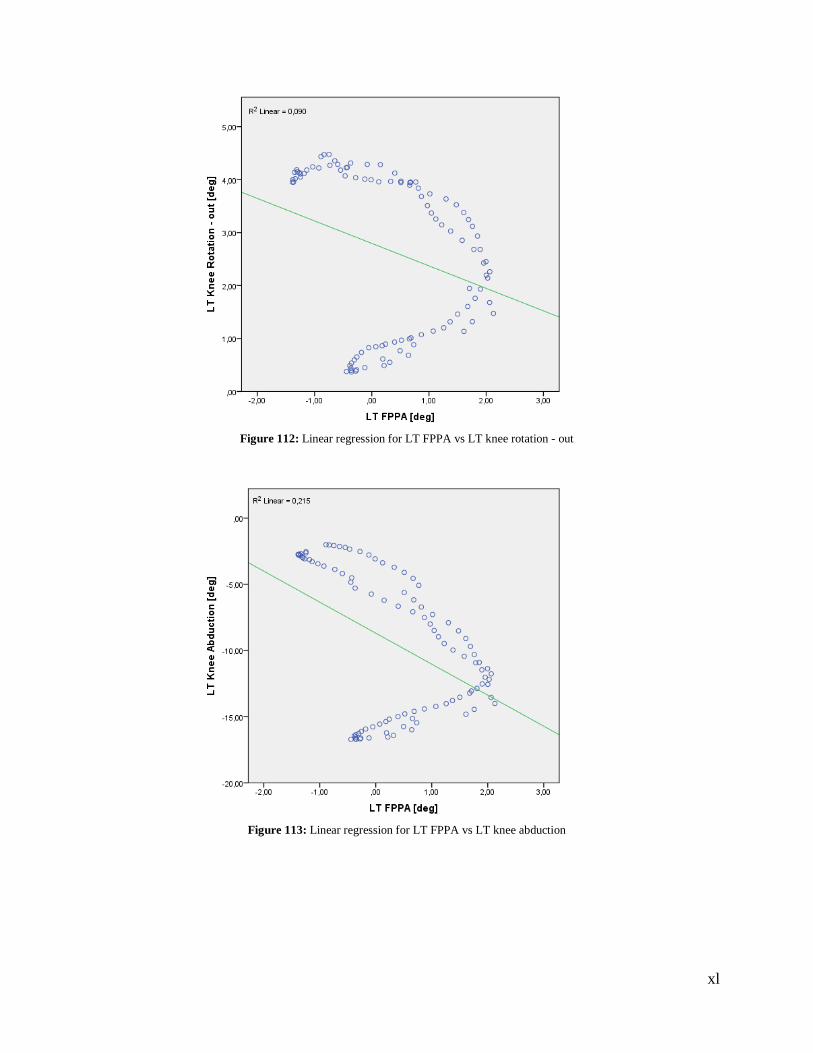
xl
Figure 112: Linear regression for LT FPPA vs LT knee rotation - out
Figure 113: Linear regression for LT FPPA vs LT knee abduction
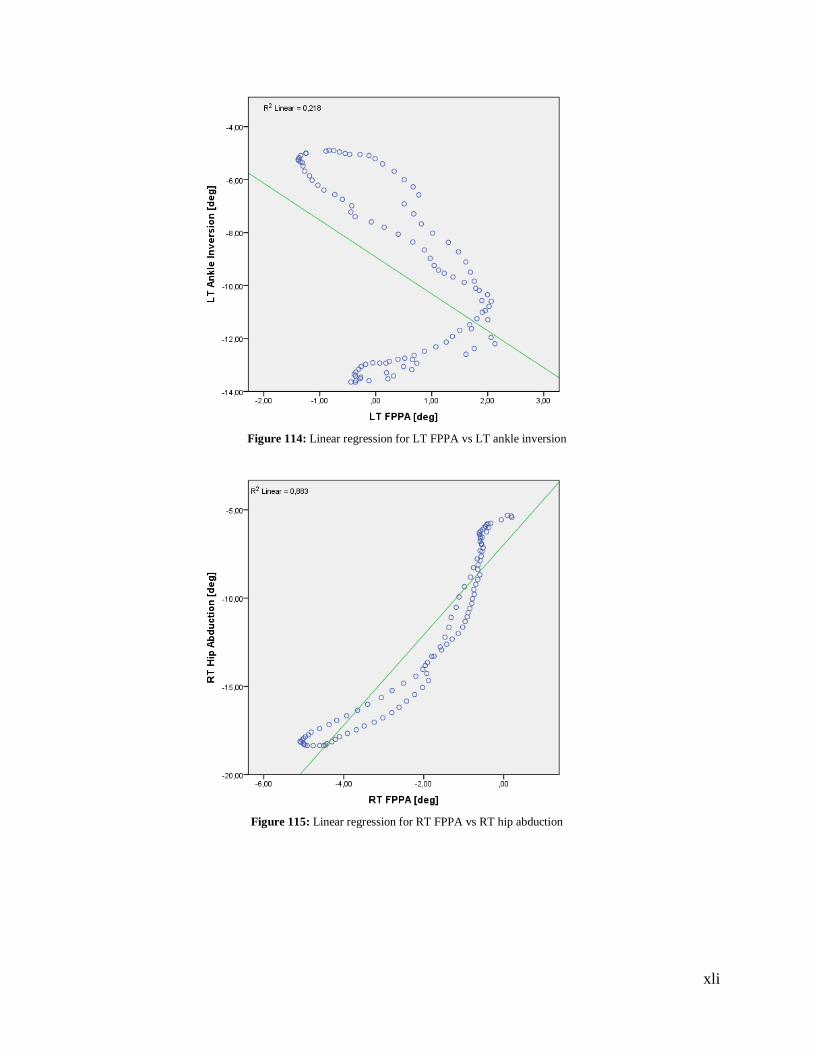
xli
Figure 114: Linear regression for LT FPPA vs LT ankle inversion
Figure 115: Linear regression for RT FPPA vs RT hip abduction
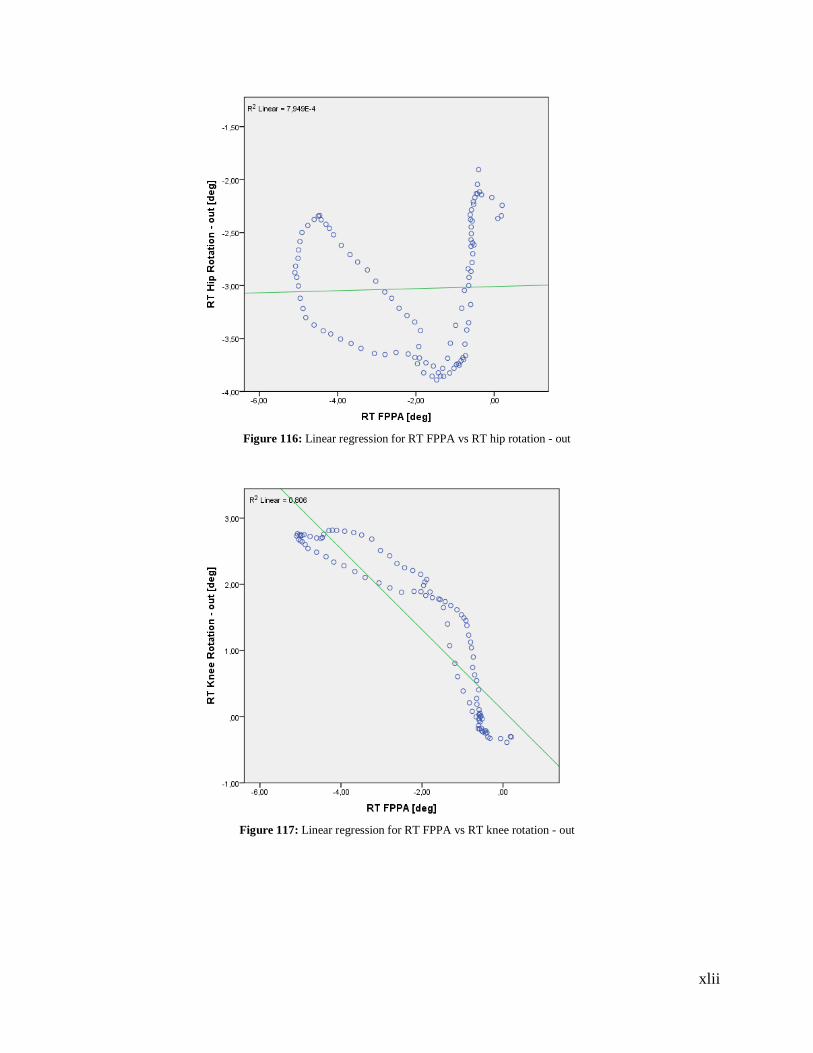
xlii
Figure 116: Linear regression for RT FPPA vs RT hip rotation - out
Figure 117: Linear regression for RT FPPA vs RT knee rotation - out
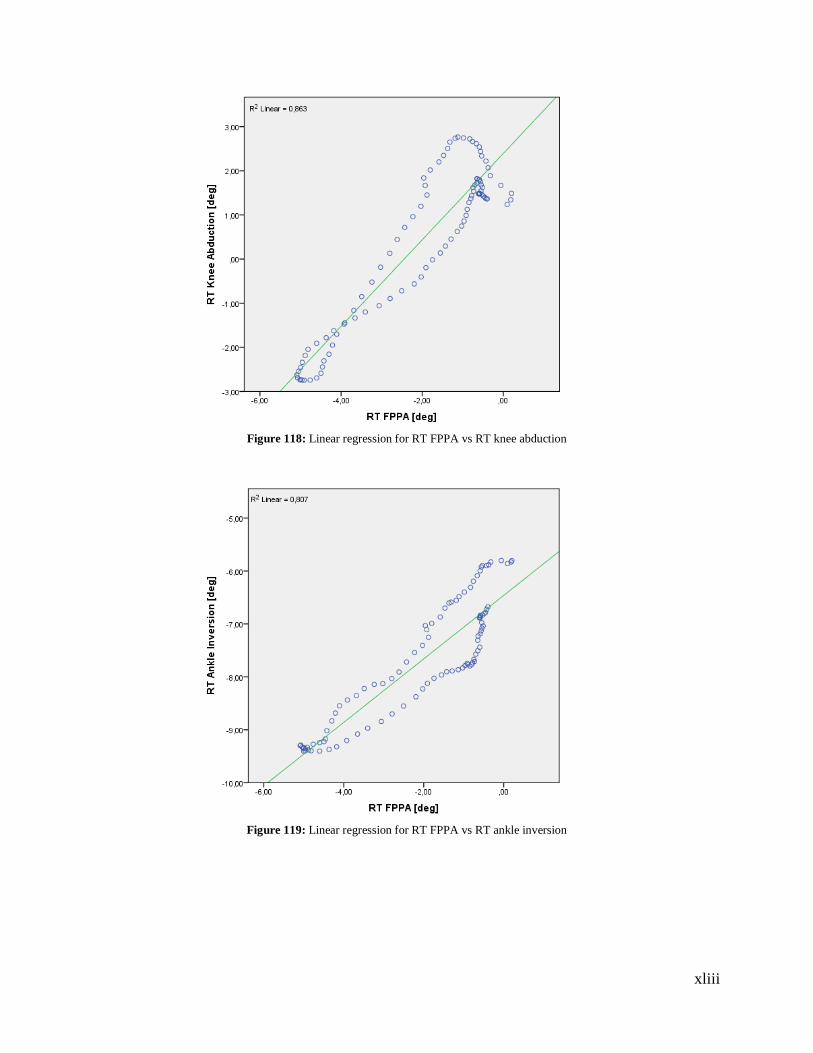
xliii
Figure 118: Linear regression for RT FPPA vs RT knee abduction
Figure 119: Linear regression for RT FPPA vs RT ankle inversion
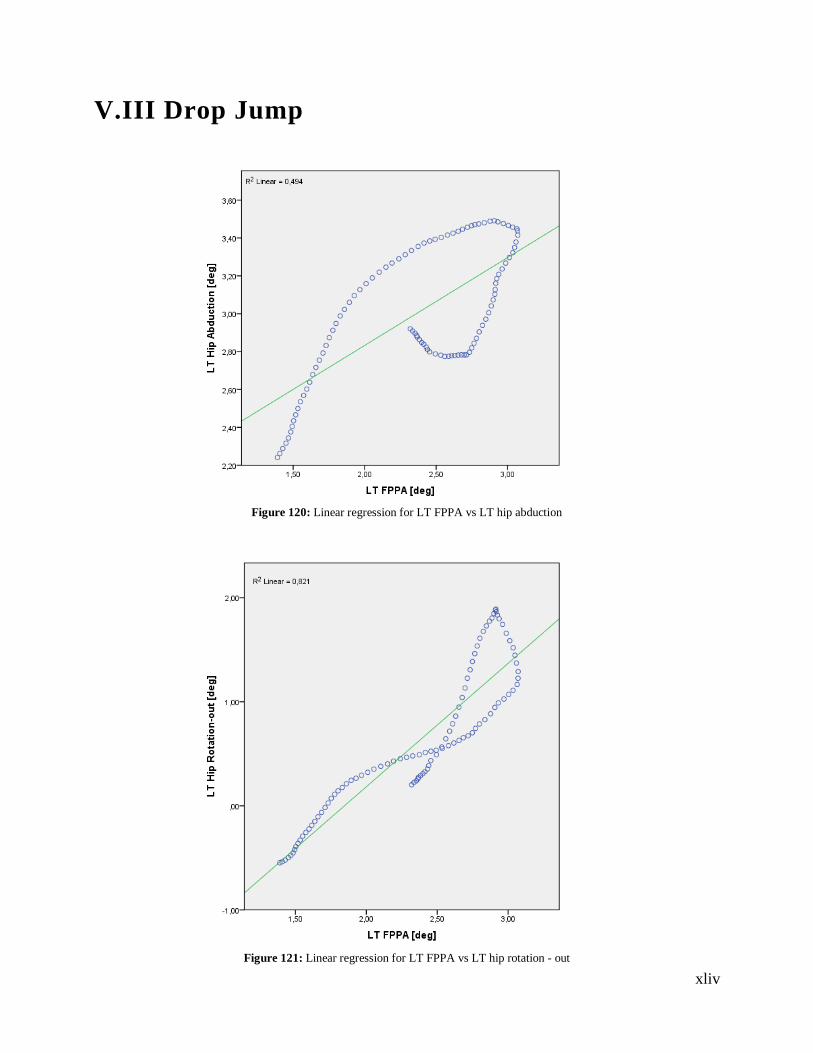
xliv
V.III Drop Jump
Figure 120: Linear regression for LT FPPA vs LT hip abduction
Figure 121: Linear regression for LT FPPA vs LT hip rotation - out
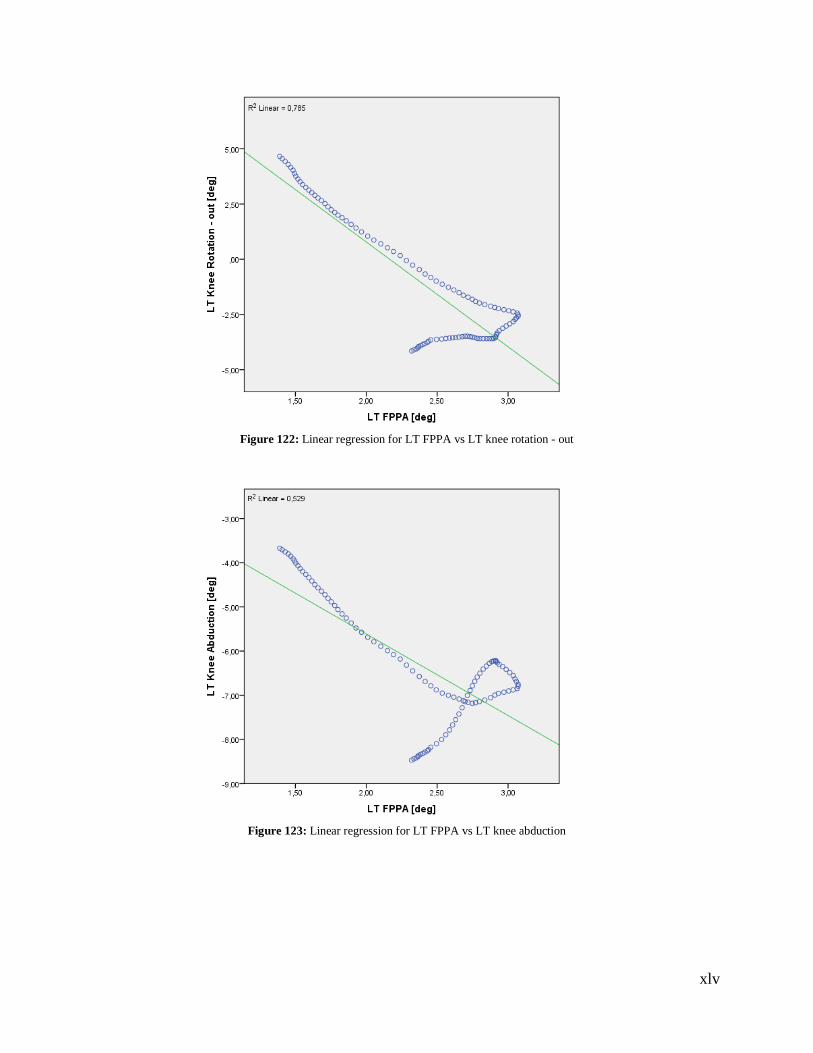
xlv
Figure 122: Linear regression for LT FPPA vs LT knee rotation - out
Figure 123: Linear regression for LT FPPA vs LT knee abduction
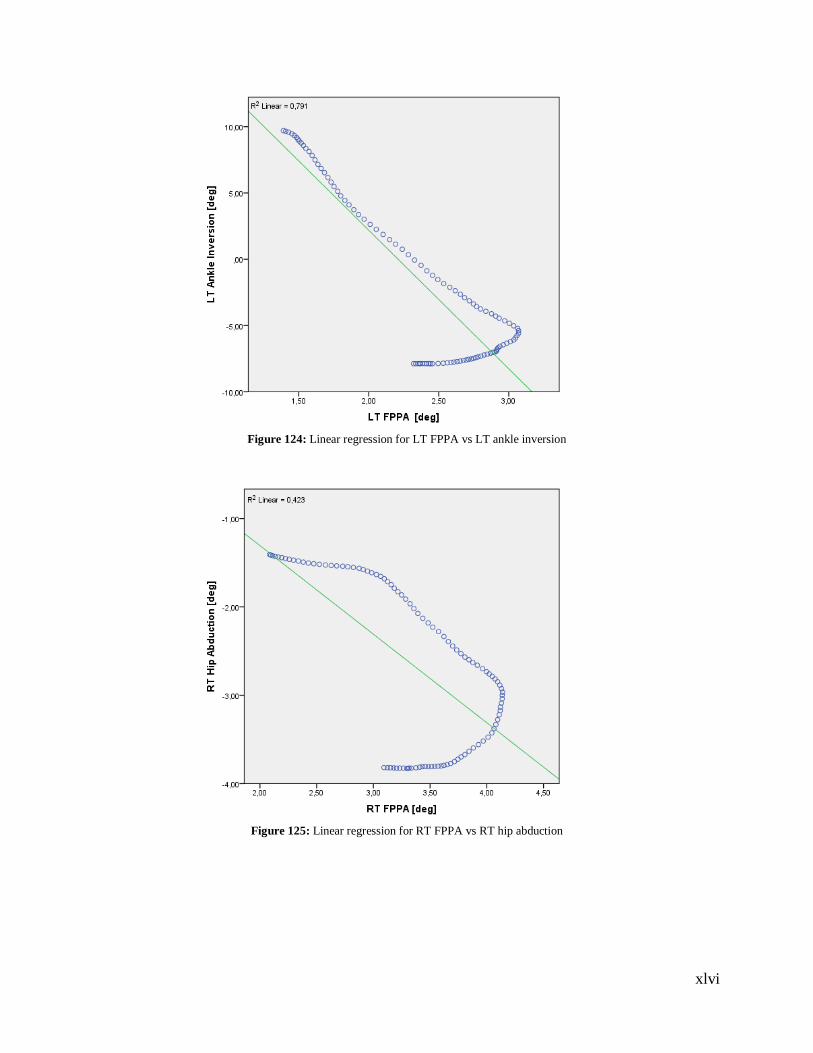
xlvi
Figure 124: Linear regression for LT FPPA vs LT ankle inversion
Figure 125: Linear regression for RT FPPA vs RT hip abduction
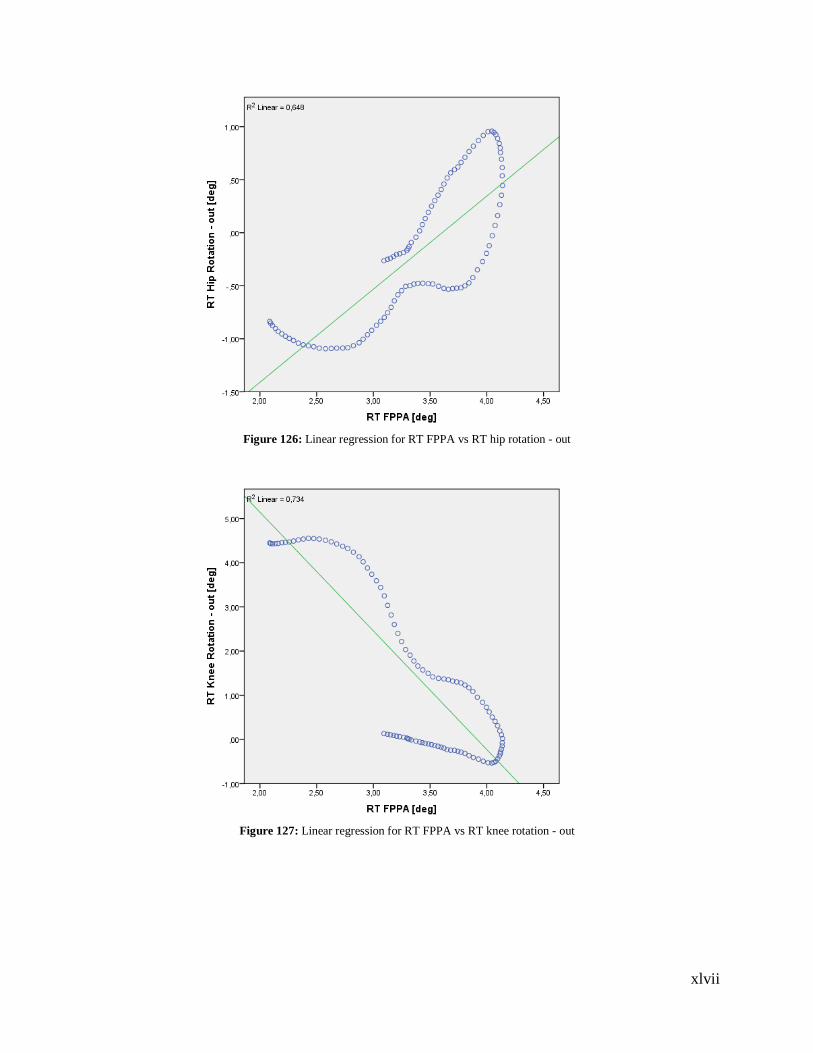
xlvii
Figure 126: Linear regression for RT FPPA vs RT hip rotation - out
Figure 127: Linear regression for RT FPPA vs RT knee rotation - out
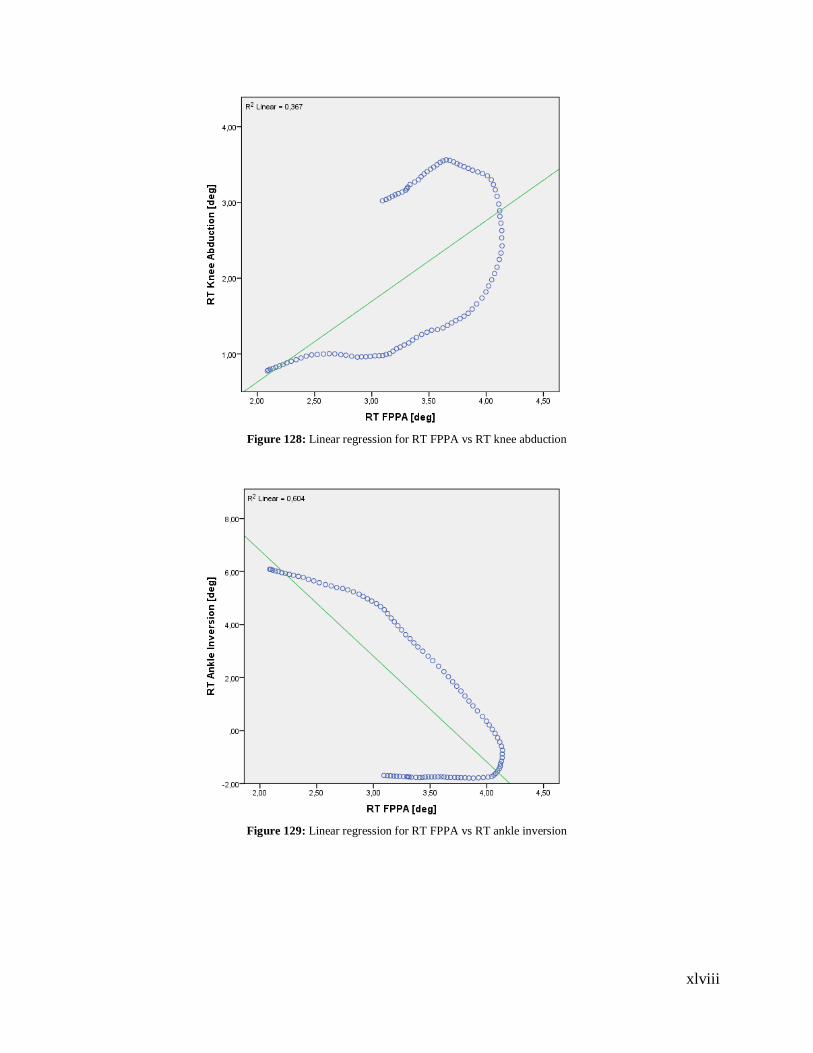
xlviii
Figure 128: Linear regression for RT FPPA vs RT knee abduction
Figure 129: Linear regression for RT FPPA vs RT ankle inversion
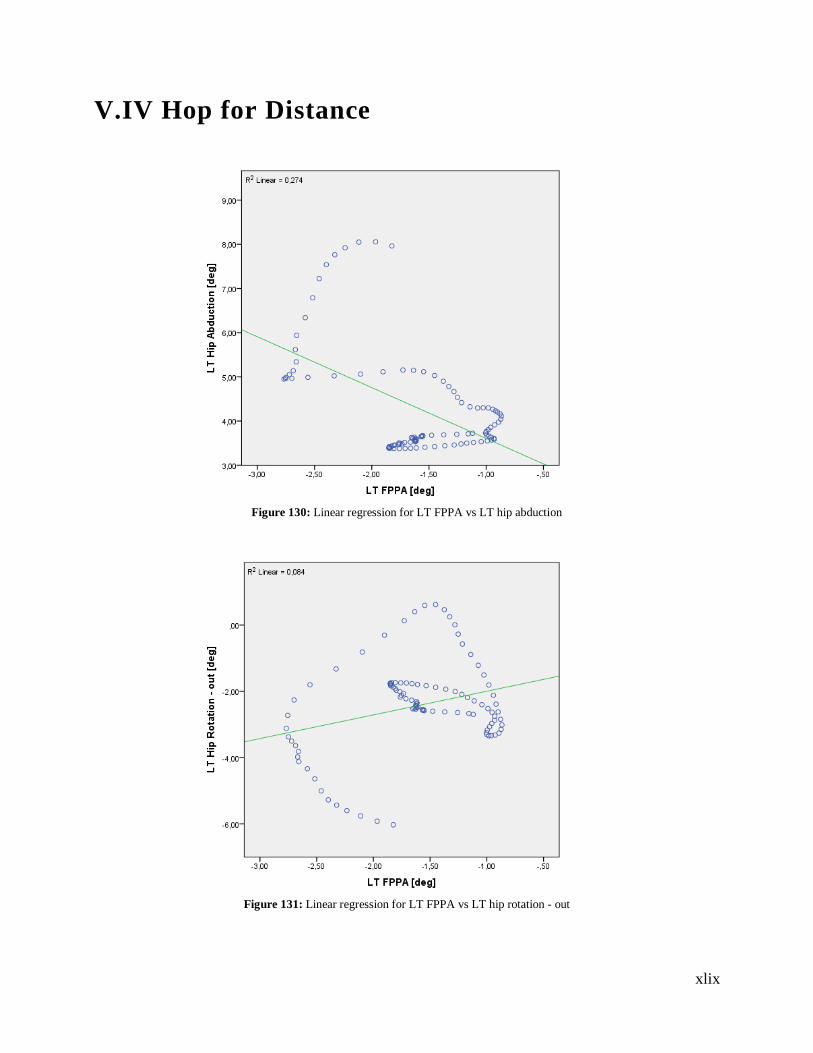
xlix
V.IV Hop for Distance
Figure 130: Linear regression for LT FPPA vs LT hip abduction
Figure 131: Linear regression for LT FPPA vs LT hip rotation - out
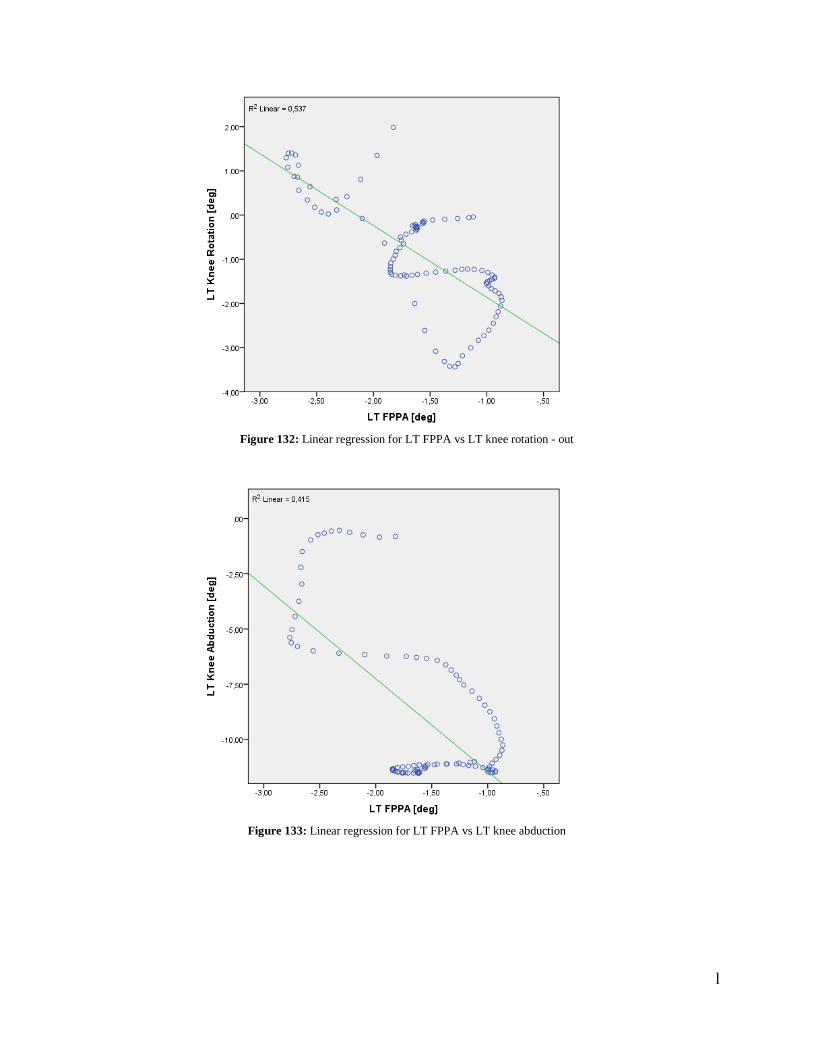
l
Figure 132: Linear regression for LT FPPA vs LT knee rotation - out
Figure 133: Linear regression for LT FPPA vs LT knee abduction
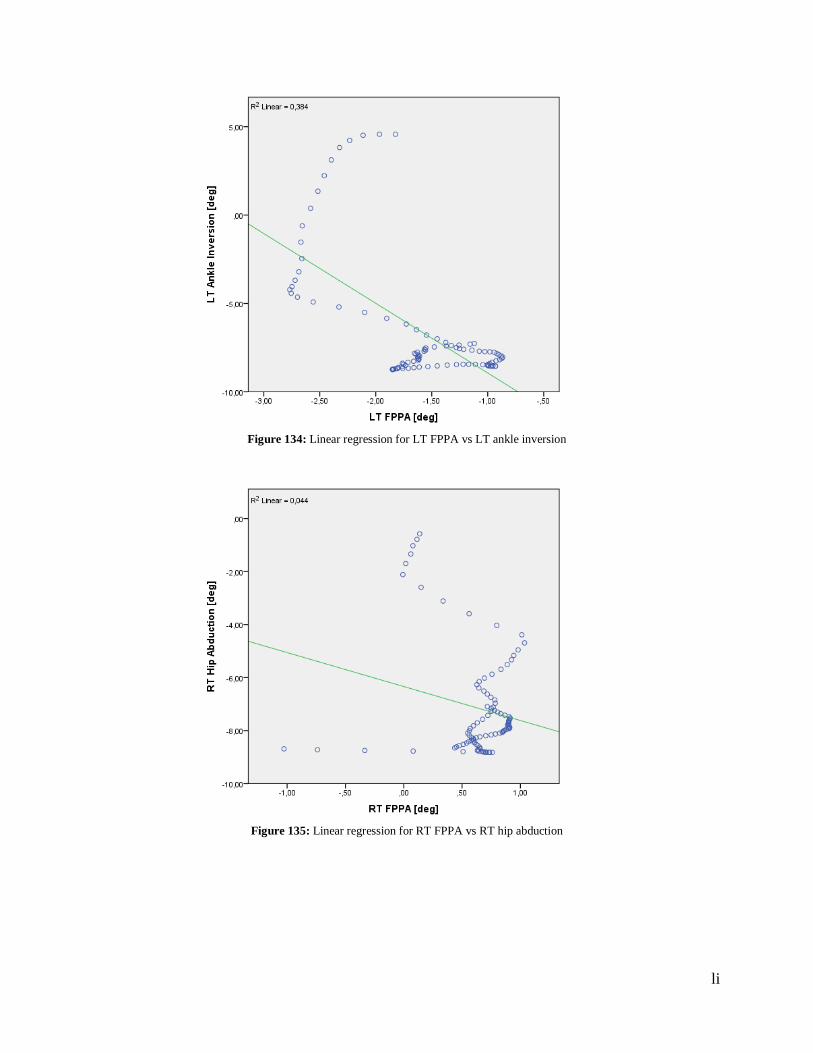
li
Figure 134: Linear regression for LT FPPA vs LT ankle inversion
Figure 135: Linear regression for RT FPPA vs RT hip abduction
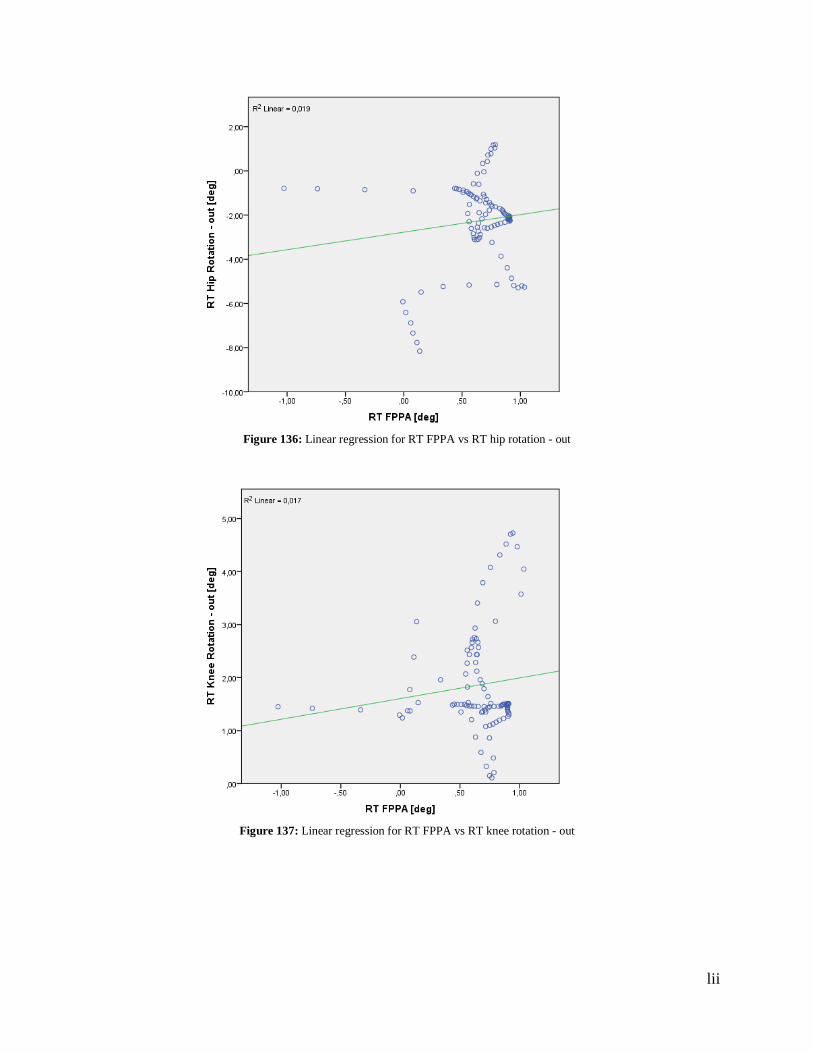
lii
Figure 136: Linear regression for RT FPPA vs RT hip rotation - out
Figure 137: Linear regression for RT FPPA vs RT knee rotation - out
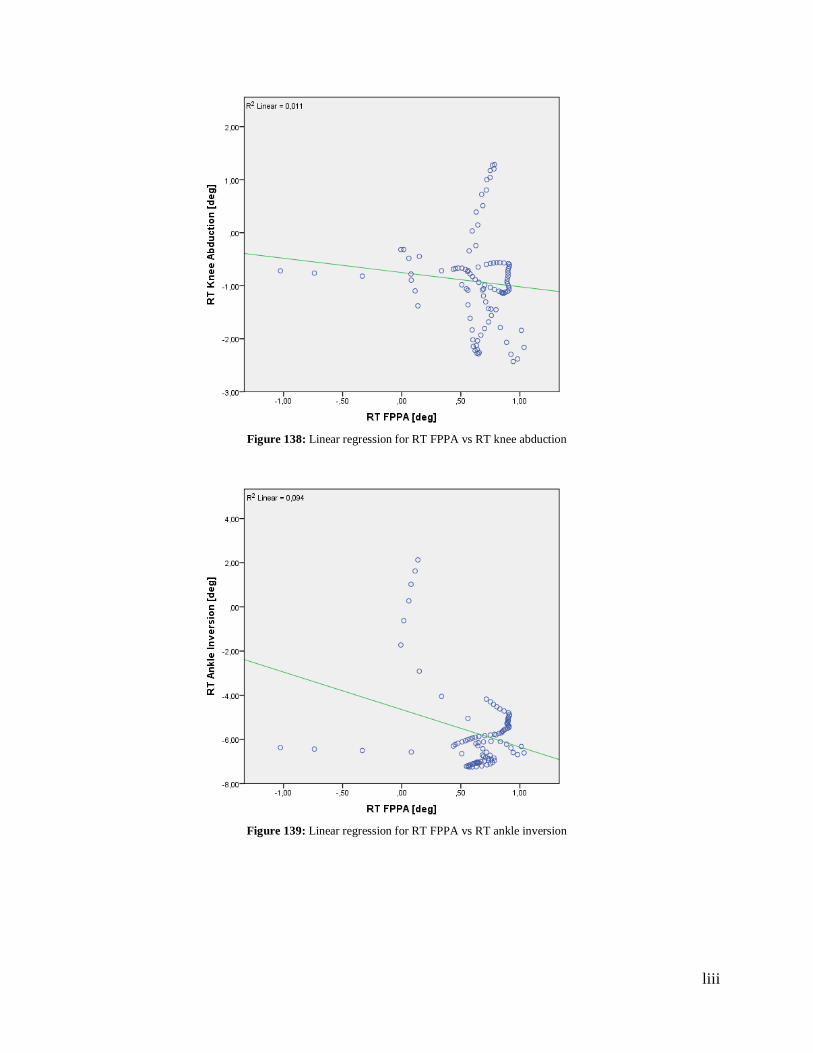
liii
Figure 138: Linear regression for RT FPPA vs RT knee abduction
Figure 139: Linear regression for RT FPPA vs RT ankle inversion
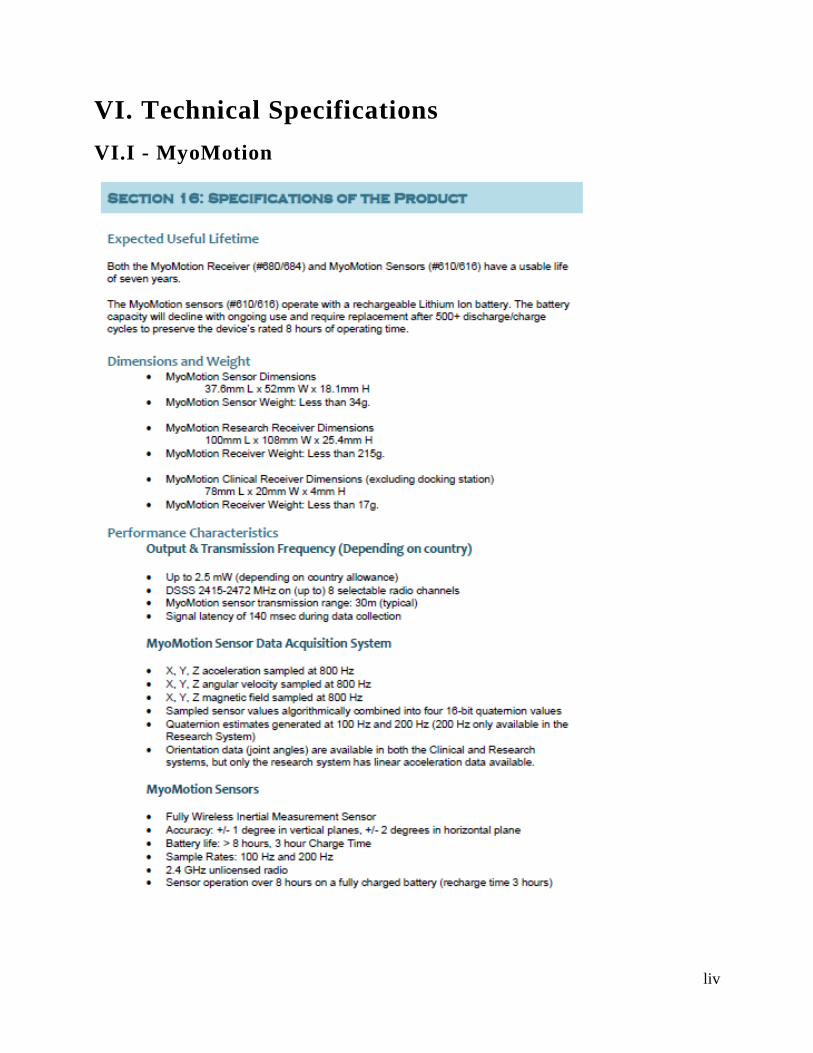
liv
VI. Technical Specifications
VI.I - MyoMotion
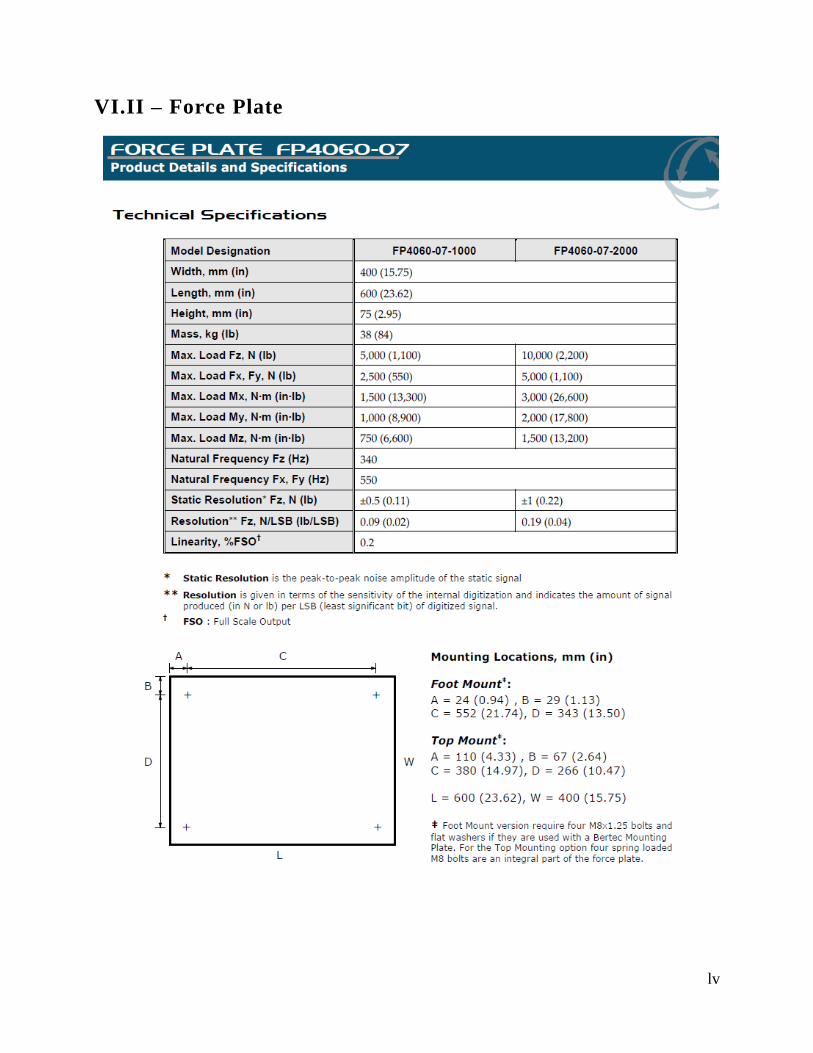
lv
VI.II – Force Plate
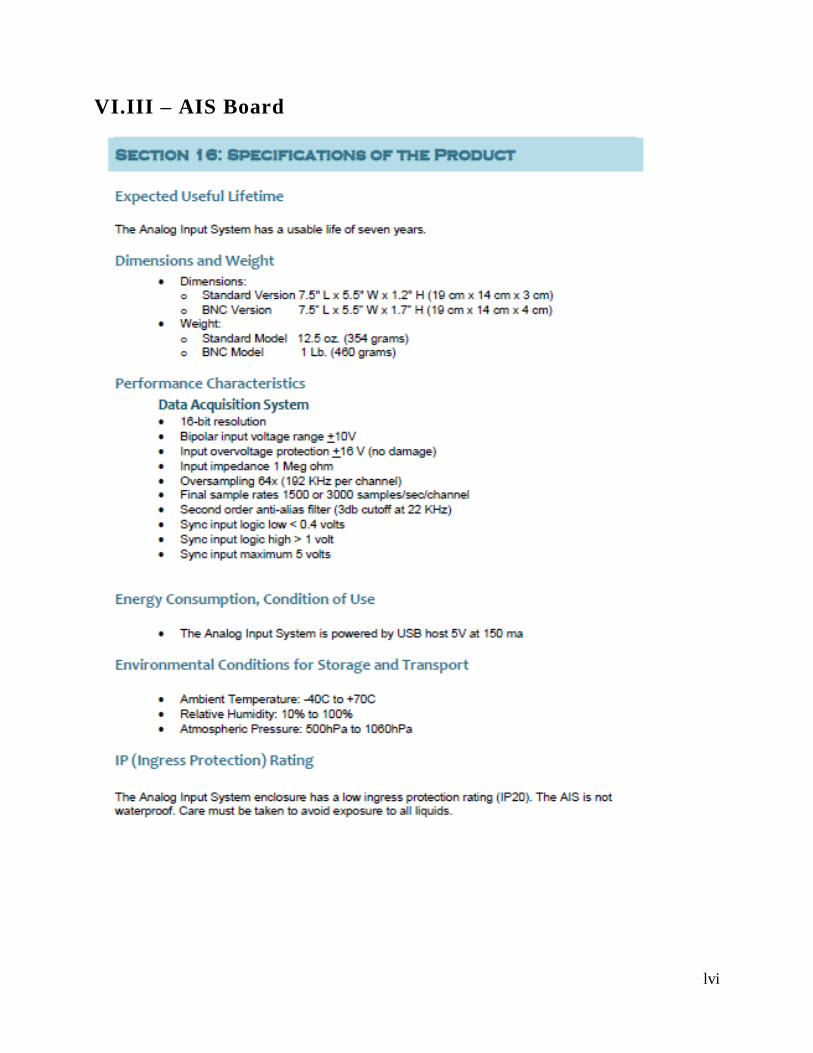
lvi
VI.III – AIS Board
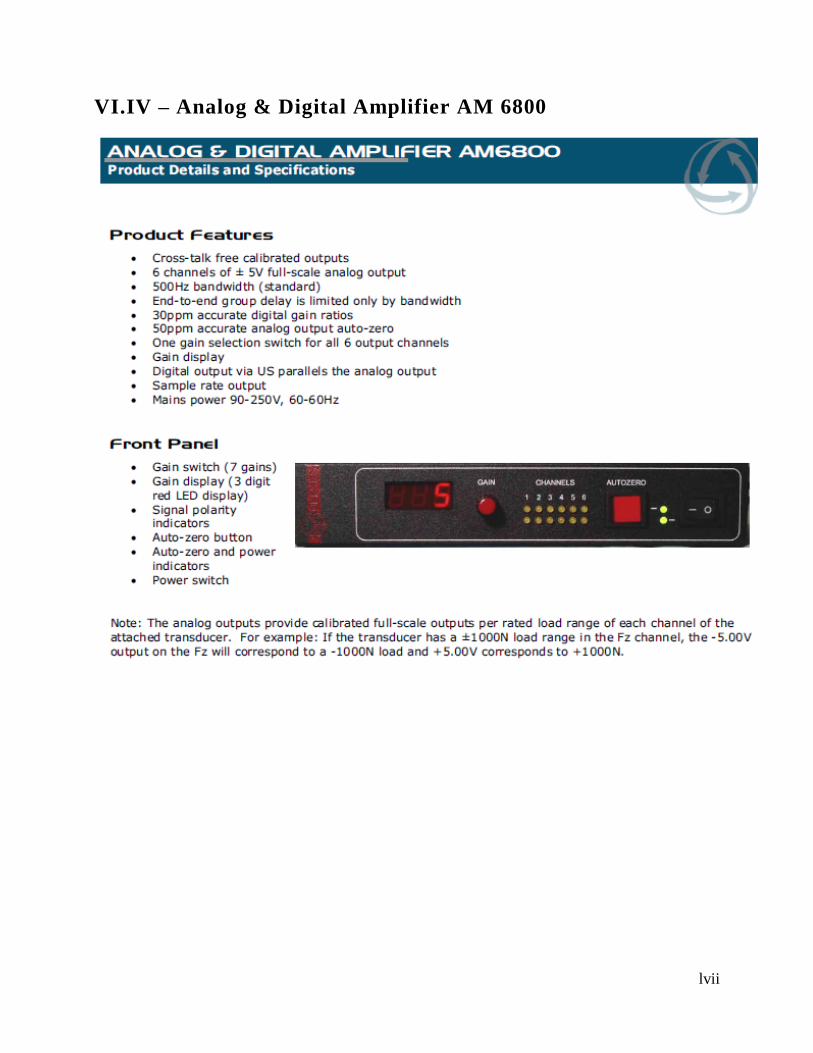
lvii
VI.IV – Analog & Digital Amplifier AM 6800
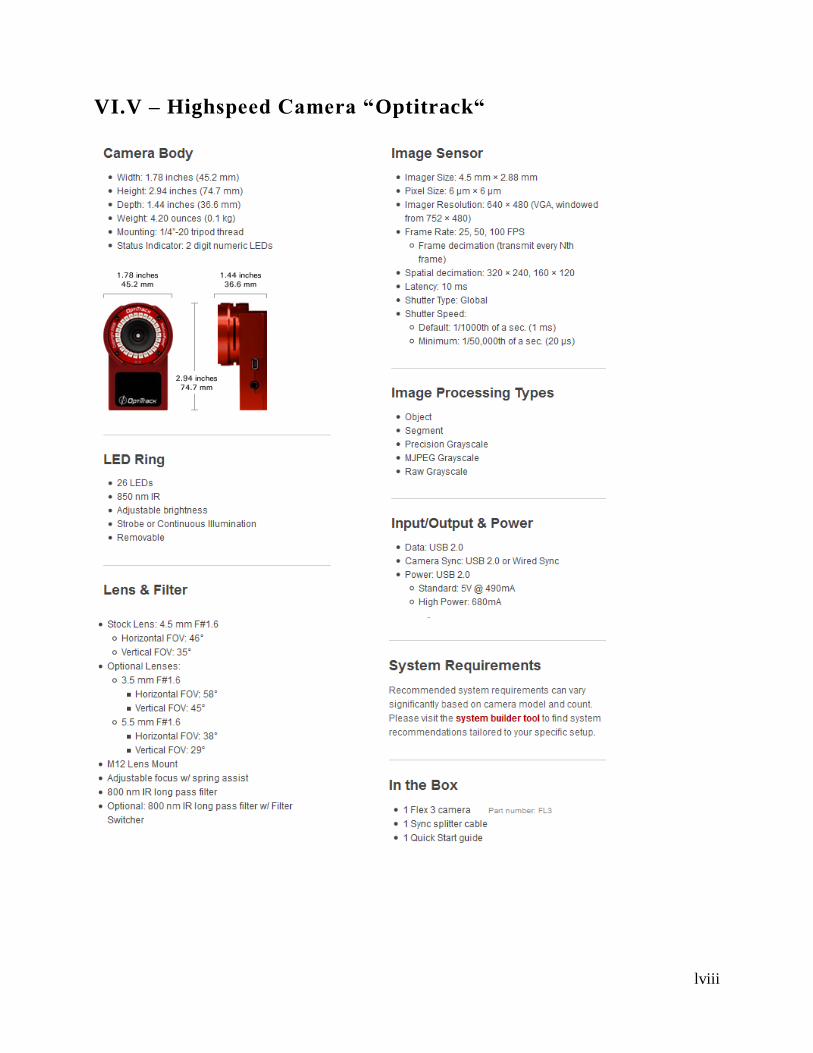
lviii
VI.V – Highspeed Camera “Optitrack“
lix
VI.VI – HD Webcam “Logitech C920”