Embed Size (px)
Citation preview
44
C H A P T E R
Biomechanics of Skeletal Muscle
STRUCTURE OF SKELETAL MUSCLE . . . . . . . . . . . . . . . . . . . . . . . . . . . . . . . . . . . . . . . .45
Structure of an Individual Muscle Fiber . . . . . . . . . . . . . . . . . . . . . . . . . . . . . . . . . . . . .45
The Connective Tissue System within the Muscle Belly . . . . . . . . . . . . . . . . . . . . . . . . .46
FACTORS THAT INFLUENCE A MUSCLE’S ABILITY TO PRODUCE A MOTION . . . . . . . . . .47
Effect of Fiber Length on Joint Excursion . . . . . . . . . . . . . . . . . . . . . . . . . . . . . . . . . . .48
Effect of Muscle Moment Arms on Joint Excursion . . . . . . . . . . . . . . . . . . . . . . . . . . . .49
Joint Excursion as a Function of Both Fiber Length and the Anatomical
Moment Arm of a Muscle . . . . . . . . . . . . . . . . . . . . . . . . . . . . . . . . . . . . . . . . . . . . . . . . .50
FACTORS THAT INFLUENCE A MUSCLE’S STRENGTH . . . . . . . . . . . . . . . . . . . . . . . . . . .51
Muscle Size and Its Effect on Force Production . . . . . . . . . . . . . . . . . . . . . . . . . . . . . . .52
Relationship between Force Production and Instantaneous Muscle Length (Stretch) . .53
Relationship between a Muscle’s Moment Arm and Its Force Production . . . . . . . . . . .55
Relationship between Force Production and Contraction Velocity . . . . . . . . . . . . . . . .57
Relationship between Force Production and Level of Recruitment
of Motor Units within the Muscle . . . . . . . . . . . . . . . . . . . . . . . . . . . . . . . . . . . . . . . . .58
Relationship between Force Production and Fiber Type . . . . . . . . . . . . . . . . . . . . . . . .59
ADAPTATION OF MUSCLE TO ALTERED FUNCTION . . . . . . . . . . . . . . . . . . . . . . . . . . . .60
Adaptation of Muscle to Prolonged Length Changes . . . . . . . . . . . . . . . . . . . . . . . . . .60
Adaptations of Muscle to Sustained Changes in Activity Level . . . . . . . . . . . . . . . . . . .61
SUMMARY . . . . . . . . . . . . . . . . . . . . . . . . . . . . . . . . . . . . . . . . . . . . . . . . . . . . . . . . . .62
Skeletal muscle is a fascinating biological tissue able to transform chemical energy to
mechanical energy. The focus of this chapter is on the mechanical behavior of skeletal muscle
as it contributes to function and dysfunction of the musculoskeletal system. Although a
basic understanding of the energy transformation from chemical to mechanical energy is
essential to a full understanding of the behavior of muscle, it is beyond the scope of this
book. The reader is urged to consult other sources for a discussion of the chemical and
physiological interactions that produce and affect a muscle contraction [36,47,78].
Skeletal muscle has three basic performance parameters that describe its function:
■ Movement production
■ Force production
■ Endurance
The production of movement and force is the mechanical outcome of skeletal muscle con-
traction. The factors that influence these parameters are the focus of this chapter. A brief
description of the morphology of muscles and the physiological processes that produce
4
45Chapter 4 | BIOMECHANICS OF SKELETAL MUSCLE
STRUCTURE OF SKELETAL MUSCLE
The functional unit that produces motion at a joint consistsof two discrete units, the muscle belly and the tendon thatbinds the muscle belly to the bone. The structure of the mus-cle belly itself is presented in the current chapter. The struc-ture and mechanical properties of the tendon, composed ofconnective tissue, are presented in Chapter 6. The musclebelly consists of the muscle cells, or fibers, that produce thecontraction and the connective tissue encasing the musclefibers. Each is discussed below.
Structure of an IndividualMuscle FiberA skeletal muscle fiber is a long cylindrical, multinucleatedcell that is filled with smaller units of filaments (Fig. 4.1).These filamentous structures are roughly aligned parallel tothe muscle fiber itself. The largest of the filaments is the my-ofibril, composed of subunits called sarcomeres that arearranged end to end the length of the myofibril. Each sar-comere also contains filaments, known as myofilaments.There are two types of myofilaments within each sarcomere.The thicker myofilaments are composed of myosin proteinmolecules, and the thinner myofilaments are composed ofmolecules of the protein actin. Sliding of the actin myofila-ment on the myosin chain is the basic mechanism of musclecontraction.
THE SLIDING FILAMENT THEORY OFMUSCLE CONTRACTION
The sarcomere, containing the contractile proteins actin andmyosin, is the basic functional unit of muscle. Contraction of
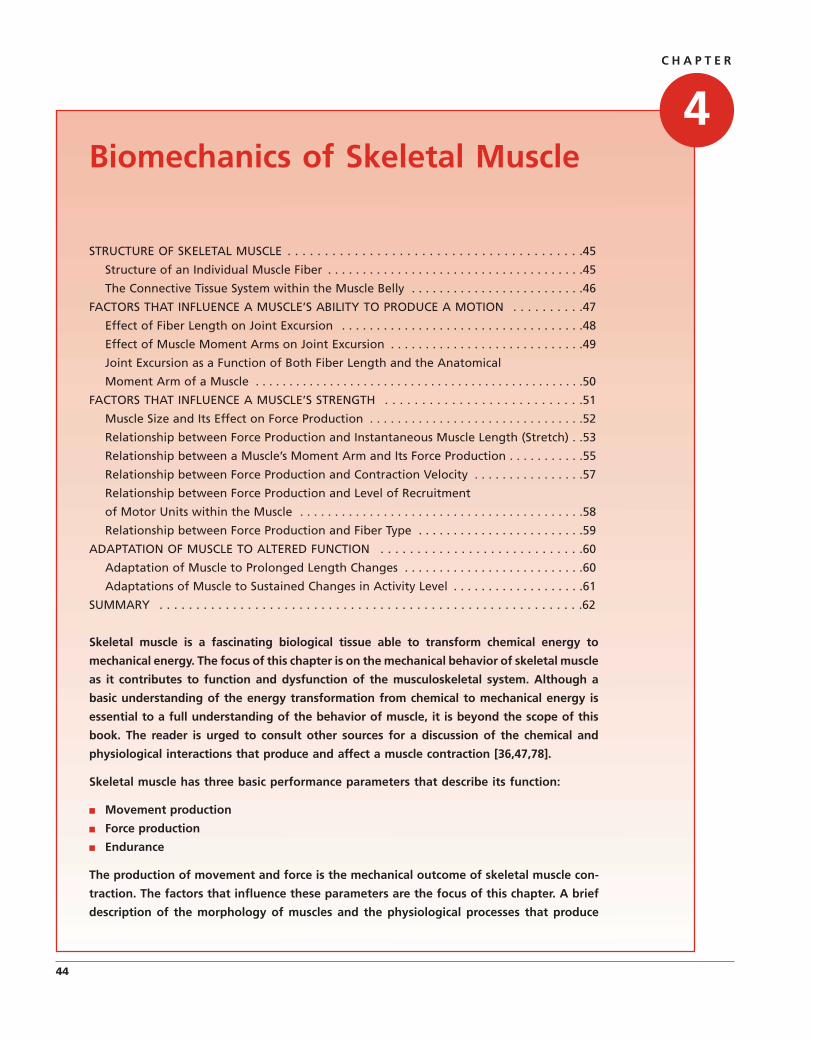
a whole muscle is actually the sum of singular contractionevents occurring within the individual sarcomeres. Therefore,it is necessary to understand the organization of the sarcom-ere. The thinner actin chains are more abundant than themyosin myofilaments in a sarcomere. The actin myofilamentsare anchored at both ends of the sarcomere at the Z-line andproject into the interior of the sarcomere where they surrounda thicker myosin myofilament (Fig. 4.2). This arrangement ofmyosin myofilaments surrounded by actin myofilaments is re-peated throughout the sarcomere, filling its interior and giv-ing the muscle fiber its characteristic striations. The amountof these contractile proteins within the cells is strongly relatedto a muscle’s contractile force [5,6,24].
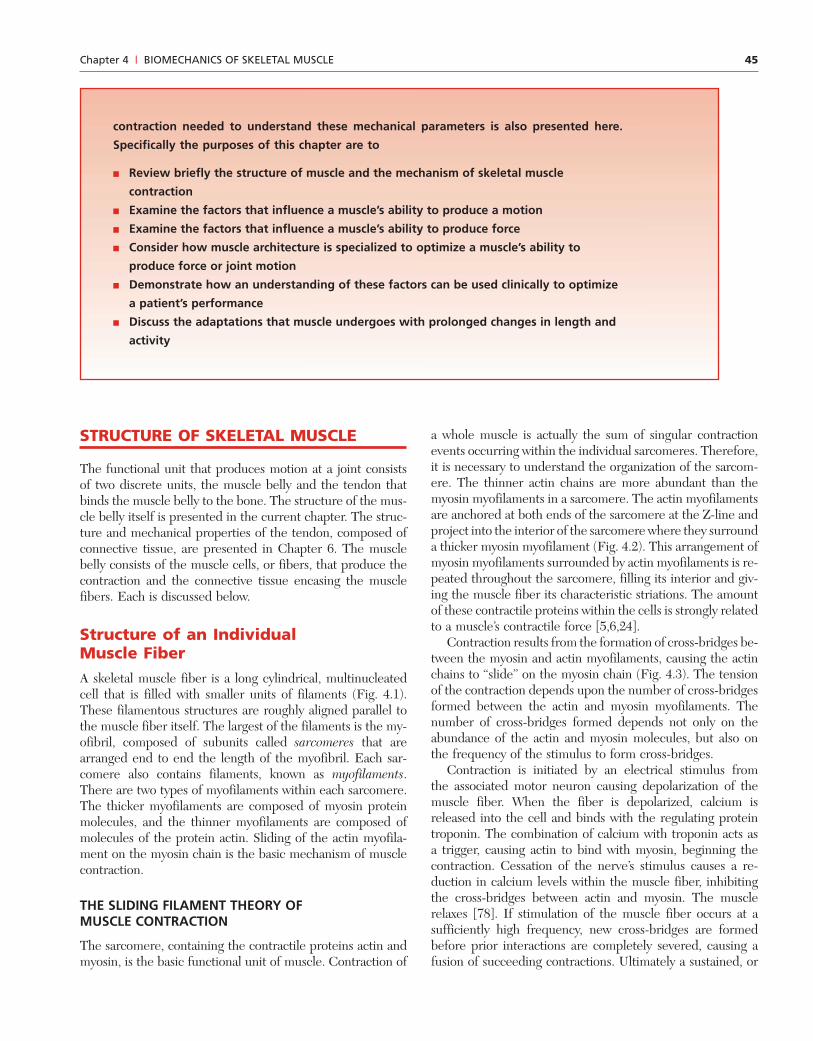
Contraction results from the formation of cross-bridges be-tween the myosin and actin myofilaments, causing the actinchains to “slide” on the myosin chain (Fig. 4.3). The tensionof the contraction depends upon the number of cross-bridgesformed between the actin and myosin myofilaments. Thenumber of cross-bridges formed depends not only on theabundance of the actin and myosin molecules, but also onthe frequency of the stimulus to form cross-bridges.
Contraction is initiated by an electrical stimulus fromthe associated motor neuron causing depolarization of themuscle fiber. When the fiber is depolarized, calcium isreleased into the cell and binds with the regulating proteintroponin. The combination of calcium with troponin acts asa trigger, causing actin to bind with myosin, beginning thecontraction. Cessation of the nerve’s stimulus causes a re-duction in calcium levels within the muscle fiber, inhibitingthe cross-bridges between actin and myosin. The musclerelaxes [78]. If stimulation of the muscle fiber occurs at asufficiently high frequency, new cross-bridges are formedbefore prior interactions are completely severed, causing afusion of succeeding contractions. Ultimately a sustained, or
contraction needed to understand these mechanical parameters is also presented here.
Specifically the purposes of this chapter are to
■ Review briefly the structure of muscle and the mechanism of skeletal muscle
contraction
■ Examine the factors that influence a muscle’s ability to produce a motion
■ Examine the factors that influence a muscle’s ability to produce force
■ Consider how muscle architecture is specialized to optimize a muscle’s ability to
produce force or joint motion
■ Demonstrate how an understanding of these factors can be used clinically to optimize
a patient’s performance
■ Discuss the adaptations that muscle undergoes with prolonged changes in length and
activity
46 Part I | BIOMECHANICAL PRINCIPLES
tetanic, contraction is produced. Modulation of the frequencyand magnitude of the initial stimulus has an effect on the forceof contraction of a whole muscle and is discussed later inthis chapter.
The Connective Tissue System withinthe Muscle BellyThe muscle belly consists of the muscle cells, or fibers, andthe connective tissue that binds the cells together (Fig. 4.4).The outermost layer of connective tissue that surrounds theentire muscle belly is known as the epimysium. The musclebelly is divided into smaller bundles or fascicles by additionalconnective tissue known as perimysium. Finally individualfibers within these larger sheaths are surrounded by more
Biceps brachii m.
Whole muscle(Biceps brachii m.)
Muscle fiber
Myosin myofilament
Single myofibril
Actin myofilament
Muscle fascicle
Figure 4.1: Organization of muscle. A progressively magnified view of a whole muscle demonstrates the organization of thefilaments composing the muscle.
H
ActinMyosin
Z-lineZ-line
A
Z-line
I
Sarcomere
A
H
Figure 4.2: Organization of actin and myosin within a musclefiber. The arrangement of the actin and myosin chains in twoadjacent sarcomeres within a fiber produces the characteristicstriations of skeletal muscle.
47Chapter 4 | BIOMECHANICS OF SKELETAL MUSCLE
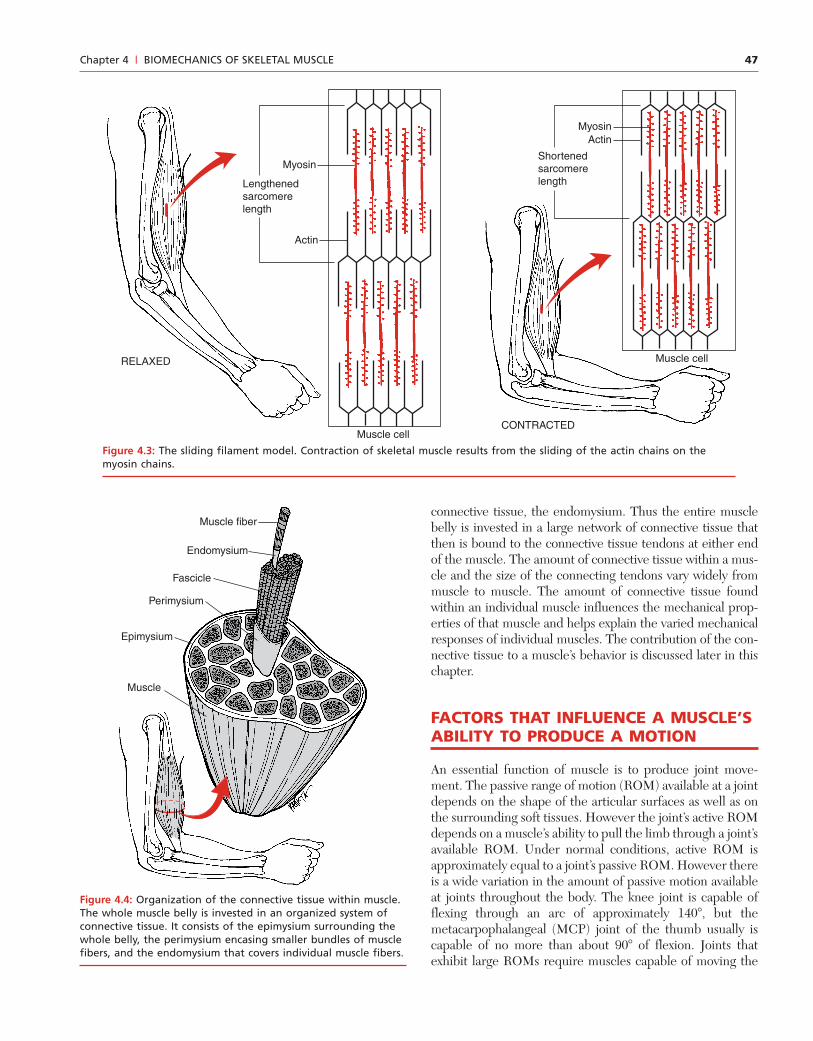
connective tissue, the endomysium. Thus the entire musclebelly is invested in a large network of connective tissue thatthen is bound to the connective tissue tendons at either endof the muscle. The amount of connective tissue within a mus-cle and the size of the connecting tendons vary widely frommuscle to muscle. The amount of connective tissue foundwithin an individual muscle influences the mechanical prop-erties of that muscle and helps explain the varied mechanicalresponses of individual muscles. The contribution of the con-nective tissue to a muscle’s behavior is discussed later in thischapter.
FACTORS THAT INFLUENCE A MUSCLE’SABILITY TO PRODUCE A MOTION
An essential function of muscle is to produce joint move-ment. The passive range of motion (ROM) available at a jointdepends on the shape of the articular surfaces as well as onthe surrounding soft tissues. However the joint’s active ROMdepends on a muscle’s ability to pull the limb through a joint’savailable ROM. Under normal conditions, active ROM isapproximately equal to a joint’s passive ROM. However thereis a wide variation in the amount of passive motion availableat joints throughout the body. The knee joint is capable offlexing through an arc of approximately 140�, but themetacarpophalangeal (MCP) joint of the thumb usually iscapable of no more than about 90� of flexion. Joints thatexhibit large ROMs require muscles capable of moving the
Muscle cell
Muscle cell
CONTRACTED
RELAXED
Myosin
Actin
Lengthenedsarcomerelength
MyosinActin
Shortenedsarcomerelength
Figure 4.3: The sliding filament model. Contraction of skeletal muscle results from the sliding of the actin chains on themyosin chains.
Muscle
Endomysium
Muscle fiber
Perimysium
Fascicle
Epimysium
Figure 4.4: Organization of the connective tissue within muscle.The whole muscle belly is invested in an organized system ofconnective tissue. It consists of the epimysium surrounding thewhole belly, the perimysium encasing smaller bundles of musclefibers, and the endomysium that covers individual muscle fibers.
48 Part I | BIOMECHANICAL PRINCIPLES
Bone
Bone
Bone
Bone
A
B
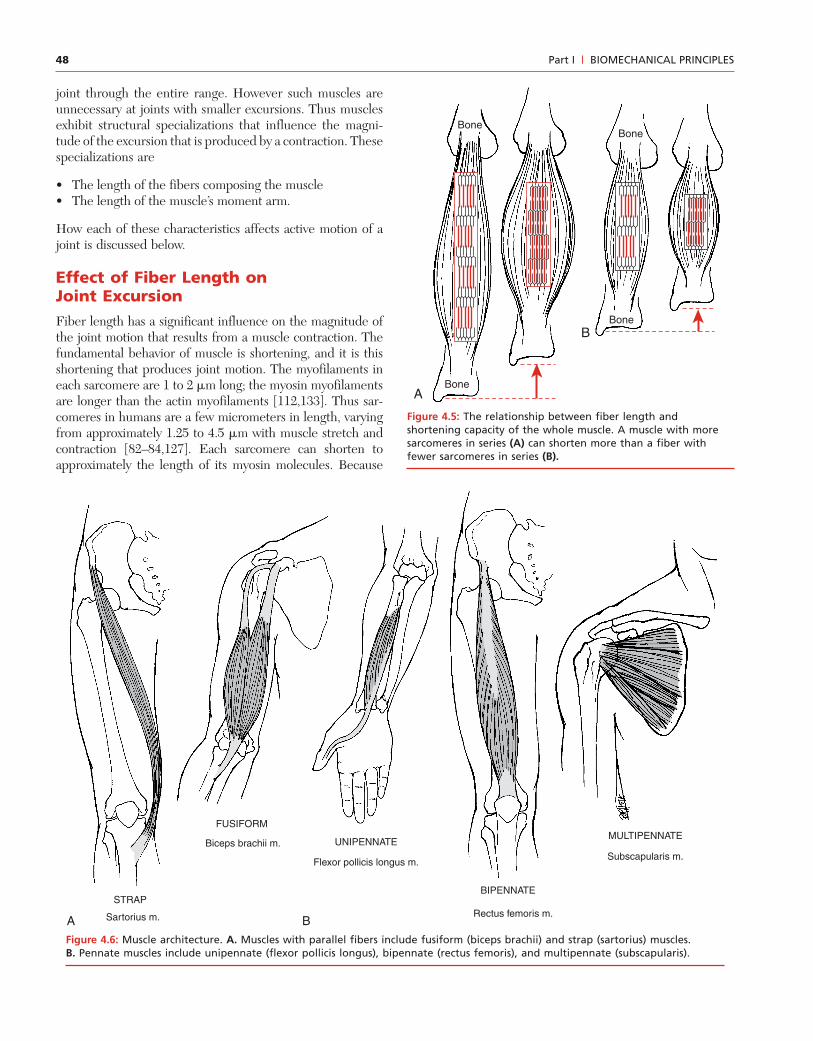
Figure 4.5: The relationship between fiber length andshortening capacity of the whole muscle. A muscle with moresarcomeres in series (A) can shorten more than a fiber withfewer sarcomeres in series (B).
STRAP
FUSIFORM
A B
BIPENNATE
MULTIPENNATEUNIPENNATE
Subscapularis m.
Sartorius m.
Biceps brachii m.
Rectus femoris m.
Flexor pollicis longus m.
joint through the entire range. However such muscles areunnecessary at joints with smaller excursions. Thus musclesexhibit structural specializations that influence the magni-tude of the excursion that is produced by a contraction. Thesespecializations are
• The length of the fibers composing the muscle• The length of the muscle’s moment arm.
How each of these characteristics affects active motion of ajoint is discussed below.
Effect of Fiber Length onJoint ExcursionFiber length has a significant influence on the magnitude ofthe joint motion that results from a muscle contraction. Thefundamental behavior of muscle is shortening, and it is thisshortening that produces joint motion. The myofilaments ineach sarcomere are 1 to 2 �m long; the myosin myofilamentsare longer than the actin myofilaments [112,133]. Thus sar-comeres in humans are a few micrometers in length, varyingfrom approximately 1.25 to 4.5 �m with muscle stretch andcontraction [82–84,127]. Each sarcomere can shorten toapproximately the length of its myosin molecules. Because
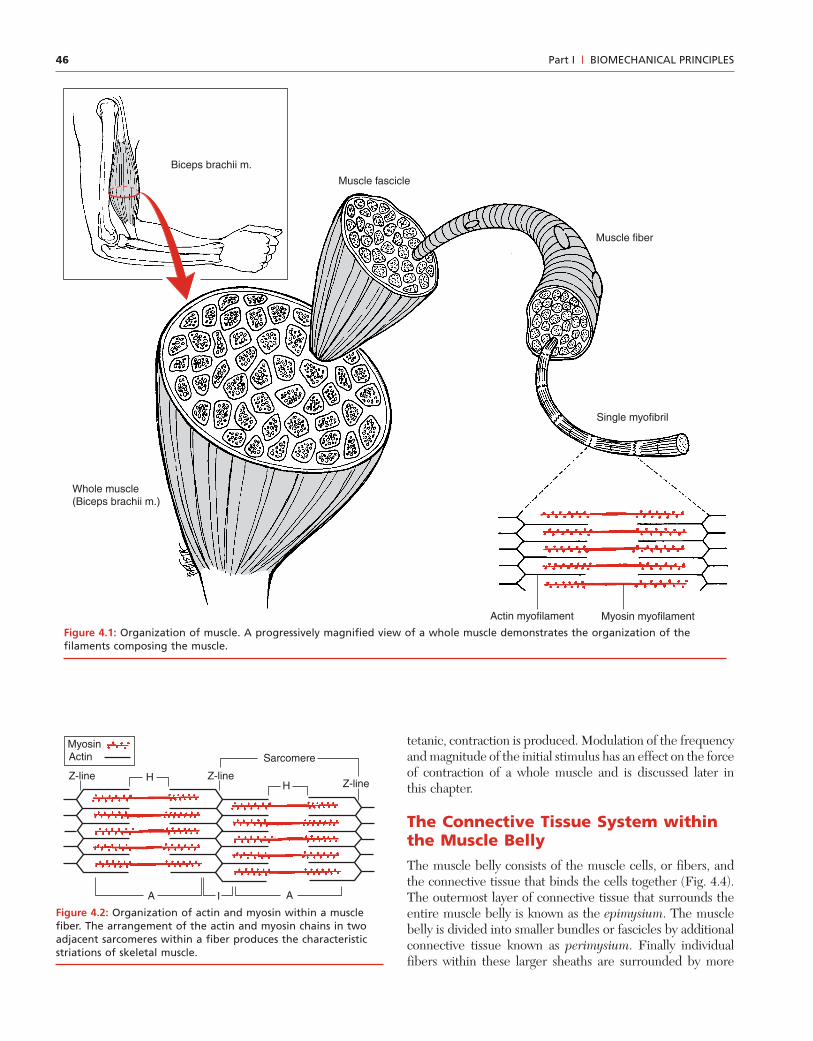
Figure 4.6: Muscle architecture. A. Muscles with parallel fibers include fusiform (biceps brachii) and strap (sartorius) muscles.B. Pennate muscles include unipennate (flexor pollicis longus), bipennate (rectus femoris), and multipennate (subscapularis).
49Chapter 4 | BIOMECHANICS OF SKELETAL MUSCLE
the sarcomeres are arranged in series in a myofibril, theamount of shortening that a myofibril and, ultimately, a mus-cle fiber can produce is the sum of the shortening in all ofthe sarcomeres. Thus the total shortening of a muscle fiberdepends upon the number of sarcomeres arranged in serieswithin each myofibril. The more sarcomeres in a fiber, thelonger the fiber is and the more it is able to shorten (Fig. 4.5).The amount a muscle fiber can shorten is proportional to itslength [13,81,138]. A fiber can shorten roughly 50 to 60% ofits length [39,138] although there is some evidence that fibersexhibit varied shortening capabilities [13].
Since fiber shortening is a function of fiber length, theamount a whole muscle can shorten is dictated by the lengthof its constituent fibers. An individual whole muscle is com-posed mostly of fibers of similar lengths [13]. However thereis a wide variation in fiber lengths found in the human body,ranging from a few centimeters to approximately half a meter[78,130]. The length of the fibers within a muscle is a functionof the architecture of that muscle rather than of the muscle’stotal length. The following describes how fiber length andmuscle architecture are related.
ARCHITECTURE OF SKELETAL MUSCLE
Although all skeletal muscle is composed of muscle fibers, thearrangement of those fibers can vary significantly among mus-cles. This fiber arrangement has marked effects on a muscle’sability to produce movement and to generate force. Fiberarrangements have different names but fall into two majorcategories, parallel and pennate [37] (Fig. 4.6). In general,the fibers within a parallel fiber muscle are approximately par-allel to the length of the whole muscle. These muscles can beclassified as either fusiform or strap muscles. Fusiform mus-cles have tendons at both ends of the muscle so that the mus-cle fibers taper to insert into the tendons. Strap muscles haveless prominent tendons, and therefore their fibers taper lessat both ends of the whole muscle. Parallel fiber muscles arecomposed of relatively long fibers, although these fibers stillare shorter than the whole muscle. Even the sartorius mus-cle, a classic strap muscle, contains fibers that are only about90% of its total length.
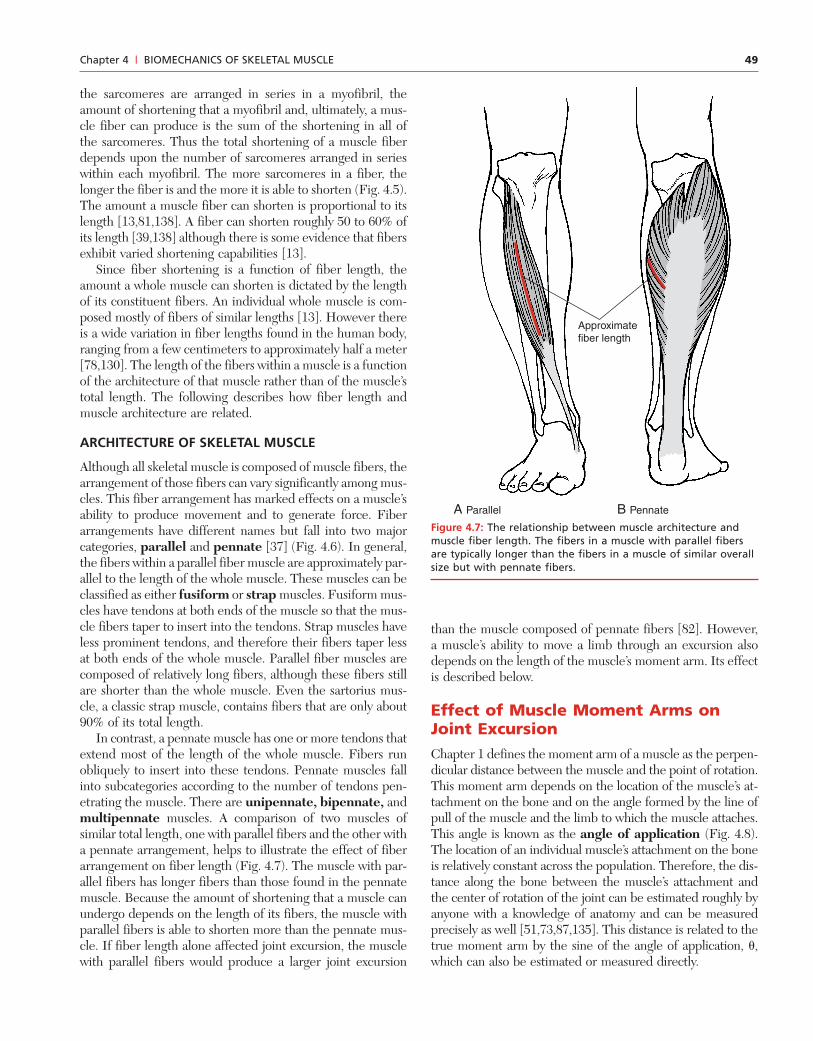
In contrast, a pennate muscle has one or more tendons thatextend most of the length of the whole muscle. Fibers runobliquely to insert into these tendons. Pennate muscles fallinto subcategories according to the number of tendons pen-etrating the muscle. There are unipennate, bipennate, andmultipennate muscles. A comparison of two muscles ofsimilar total length, one with parallel fibers and the other witha pennate arrangement, helps to illustrate the effect of fiberarrangement on fiber length (Fig. 4.7). The muscle with par-allel fibers has longer fibers than those found in the pennatemuscle. Because the amount of shortening that a muscle canundergo depends on the length of its fibers, the muscle withparallel fibers is able to shorten more than the pennate mus-cle. If fiber length alone affected joint excursion, the musclewith parallel fibers would produce a larger joint excursion
than the muscle composed of pennate fibers [82]. However,a muscle’s ability to move a limb through an excursion alsodepends on the length of the muscle’s moment arm. Its effectis described below.
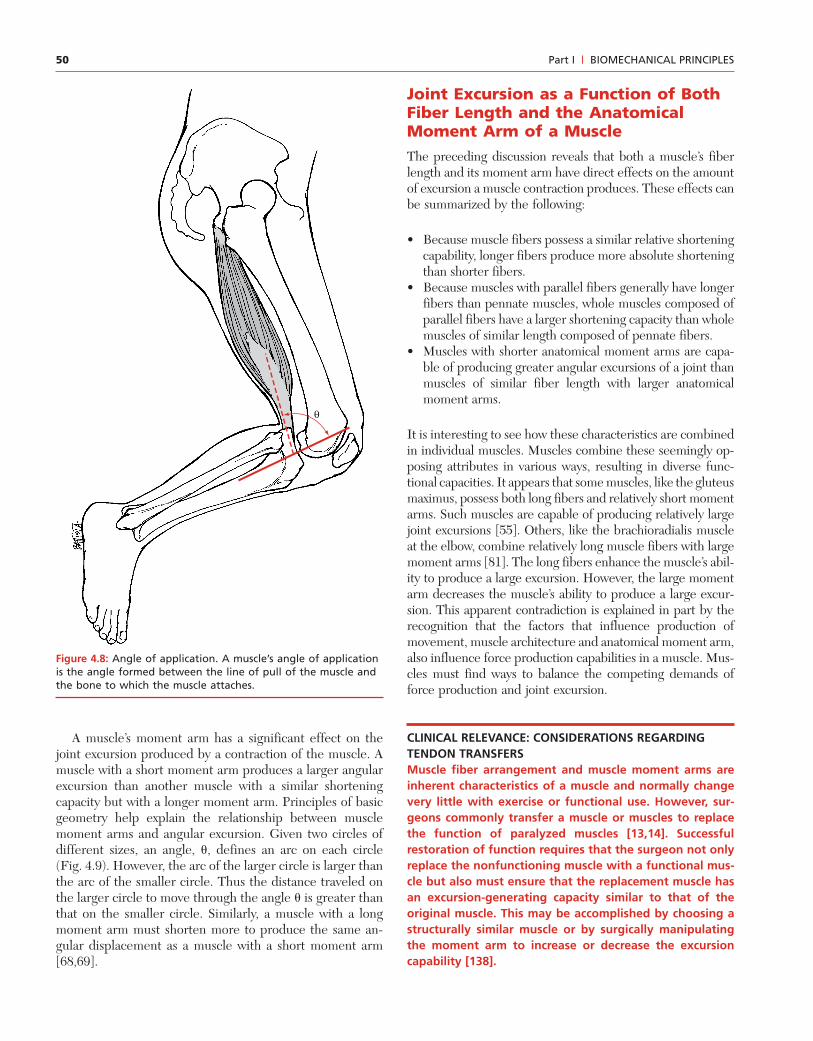
Effect of Muscle Moment Arms onJoint ExcursionChapter 1 defines the moment arm of a muscle as the perpen-dicular distance between the muscle and the point of rotation.This moment arm depends on the location of the muscle’s at-tachment on the bone and on the angle formed by the line ofpull of the muscle and the limb to which the muscle attaches.This angle is known as the angle of application (Fig. 4.8).The location of an individual muscle’s attachment on the boneis relatively constant across the population. Therefore, the dis-tance along the bone between the muscle’s attachment andthe center of rotation of the joint can be estimated roughly byanyone with a knowledge of anatomy and can be measuredprecisely as well [51,73,87,135]. This distance is related to thetrue moment arm by the sine of the angle of application, �,which can also be estimated or measured directly.
Approximate fiber length
A Parallel B Pennate
Figure 4.7: The relationship between muscle architecture andmuscle fiber length. The fibers in a muscle with parallel fibersare typically longer than the fibers in a muscle of similar overallsize but with pennate fibers.
50 Part I | BIOMECHANICAL PRINCIPLES
A muscle’s moment arm has a significant effect on thejoint excursion produced by a contraction of the muscle. Amuscle with a short moment arm produces a larger angularexcursion than another muscle with a similar shorteningcapacity but with a longer moment arm. Principles of basicgeometry help explain the relationship between musclemoment arms and angular excursion. Given two circles ofdifferent sizes, an angle, �, defines an arc on each circle(Fig. 4.9). However, the arc of the larger circle is larger thanthe arc of the smaller circle. Thus the distance traveled onthe larger circle to move through the angle � is greater thanthat on the smaller circle. Similarly, a muscle with a longmoment arm must shorten more to produce the same an-gular displacement as a muscle with a short moment arm[68,69].
Joint Excursion as a Function of BothFiber Length and the AnatomicalMoment Arm of a MuscleThe preceding discussion reveals that both a muscle’s fiberlength and its moment arm have direct effects on the amountof excursion a muscle contraction produces. These effects canbe summarized by the following:
• Because muscle fibers possess a similar relative shorteningcapability, longer fibers produce more absolute shorteningthan shorter fibers.
• Because muscles with parallel fibers generally have longerfibers than pennate muscles, whole muscles composed ofparallel fibers have a larger shortening capacity than wholemuscles of similar length composed of pennate fibers.
• Muscles with shorter anatomical moment arms are capa-ble of producing greater angular excursions of a joint thanmuscles of similar fiber length with larger anatomicalmoment arms.
It is interesting to see how these characteristics are combinedin individual muscles. Muscles combine these seemingly op-posing attributes in various ways, resulting in diverse func-tional capacities. It appears that some muscles, like the gluteusmaximus, possess both long fibers and relatively short momentarms. Such muscles are capable of producing relatively largejoint excursions [55]. Others, like the brachioradialis muscleat the elbow, combine relatively long muscle fibers with largemoment arms [81]. The long fibers enhance the muscle’s abil-ity to produce a large excursion. However, the large momentarm decreases the muscle’s ability to produce a large excur-sion. This apparent contradiction is explained in part by therecognition that the factors that influence production ofmovement, muscle architecture and anatomical moment arm,also influence force production capabilities in a muscle. Mus-cles must find ways to balance the competing demands offorce production and joint excursion.
CLINICAL RELEVANCE: CONSIDERATIONS REGARDINGTENDON TRANSFERSMuscle fiber arrangement and muscle moment arms areinherent characteristics of a muscle and normally changevery little with exercise or functional use. However, sur-geons commonly transfer a muscle or muscles to replacethe function of paralyzed muscles [13,14]. Successfulrestoration of function requires that the surgeon not onlyreplace the nonfunctioning muscle with a functional mus-cle but also must ensure that the replacement muscle hasan excursion-generating capacity similar to that of theoriginal muscle. This may be accomplished by choosing astructurally similar muscle or by surgically manipulatingthe moment arm to increase or decrease the excursioncapability [138].
θ
Figure 4.8: Angle of application. A muscle’s angle of applicationis the angle formed between the line of pull of the muscle andthe bone to which the muscle attaches.
51Chapter 4 | BIOMECHANICS OF SKELETAL MUSCLE
For example, the flexor carpi radialis muscle at thewrist is a good substitute for the extensor digitorum mus-cle of the fingers in the event of radial nerve palsy. Thewrist flexor has long muscle fibers and, therefore, thecapacity to extend the fingers through their full ROM. Incontrast, the flexor carpi ulnaris, another muscle of thewrist, has very short fibers and lacks the capacity to movethe fingers through their full excursion. Thus the func-tional outcome depends on the surgeon’s understandingof muscle mechanics, including those factors that influ-ence the production of motion.
FACTORS THAT INFLUENCE A MUSCLE’S STRENGTH
Strength is the most familiar characteristic of muscle perform-ance. However, the term strength has many different interpre-tations. Understanding the factors affecting strength requiresa clear understanding of how the term is used. The basic ac-tivity of muscle is to shorten, thus producing a tensile force. Asnoted in Chapter 1, a force also produces a moment, or a ten-dency to rotate, when the force is exerted at some distancefrom the point of rotation. The ability to generate a ten-sile force and the ability to create a moment are both used todescribe a muscle’s strength. Assessment of muscle strengthin vivo is typically performed by determining the muscle’s abil-ity to produce a moment. Such assessments include deter-mination of the amount of manual resistance an individualcan sustain without joint rotation, the amount of weight a sub-ject can lift, or the direct measurement of moments using a
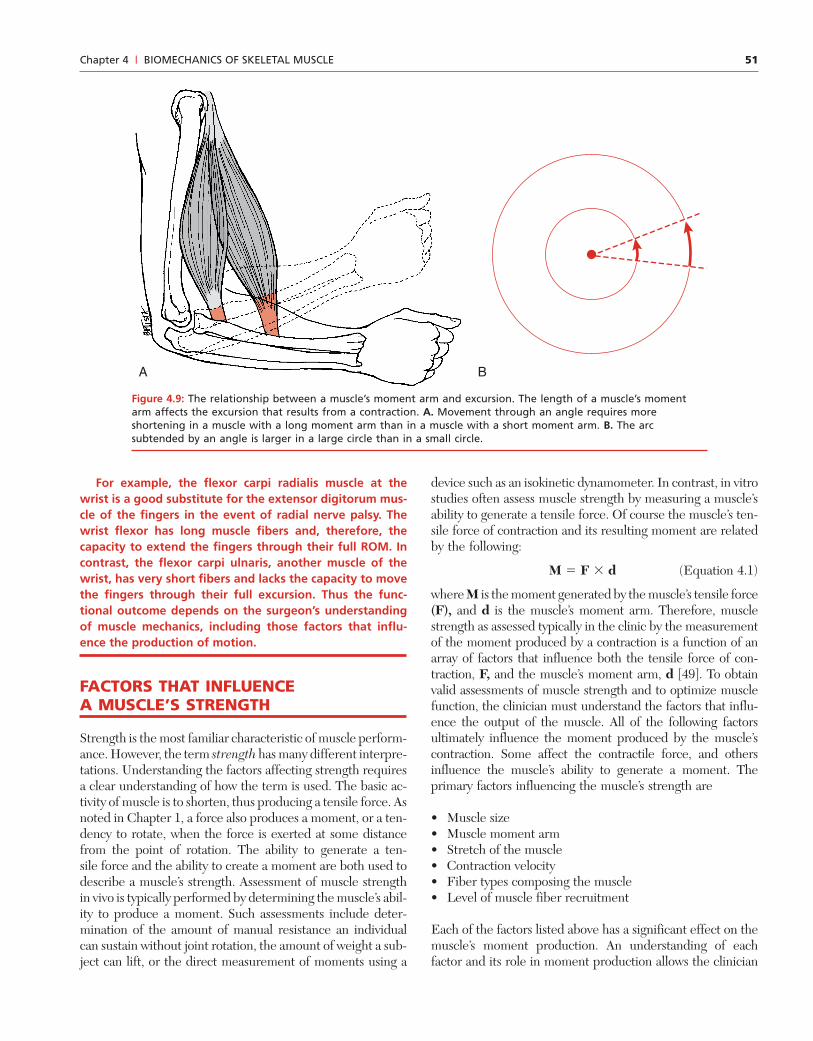
device such as an isokinetic dynamometer. In contrast, in vitrostudies often assess muscle strength by measuring a muscle’sability to generate a tensile force. Of course the muscle’s ten-sile force of contraction and its resulting moment are relatedby the following:
M � F � d (Equation 4.1)
where M is the moment generated by the muscle’s tensile force(F), and d is the muscle’s moment arm. Therefore, musclestrength as assessed typically in the clinic by the measurementof the moment produced by a contraction is a function of anarray of factors that influence both the tensile force of con-traction, F, and the muscle’s moment arm, d [49]. To obtainvalid assessments of muscle strength and to optimize musclefunction, the clinician must understand the factors that influ-ence the output of the muscle. All of the following factorsultimately influence the moment produced by the muscle’scontraction. Some affect the contractile force, and othersinfluence the muscle’s ability to generate a moment. Theprimary factors influencing the muscle’s strength are
• Muscle size• Muscle moment arm• Stretch of the muscle• Contraction velocity• Fiber types composing the muscle• Level of muscle fiber recruitment
Each of the factors listed above has a significant effect on themuscle’s moment production. An understanding of eachfactor and its role in moment production allows the clinician
A B
Figure 4.9: The relationship between a muscle’s moment arm and excursion. The length of a muscle’s momentarm affects the excursion that results from a contraction. A. Movement through an angle requires moreshortening in a muscle with a long moment arm than in a muscle with a short moment arm. B. The arcsubtended by an angle is larger in a large circle than in a small circle.
52 Part I | BIOMECHANICAL PRINCIPLES
to use these factors to optimize a patient’s performance andto understand the alteration in muscle performance withpathology. The effects of size, moment arm, and stretch aremost apparent in isometric contractions. Consequently, theexperiments demonstrating these effects usually employ iso-metric contractions. However, the reader must recognize thatthe effects are manifested in all types of contraction. Eachfactor is discussed below.
Muscle Size and Its Effect onForce ProductionAs noted earlier in this chapter, the force of contraction is afunction of the number of cross-links made between the actinand myosin chains [1,34]. The more cross-links formed, thestronger the force of contraction. Therefore, the force of con-traction depends upon the amount of actin and myosin avail-able and thus on the number of fibers a muscle contains. Inother words, the force of contraction is related to a muscle’ssize [59,113]. In fact, muscle size is the most important sin-gle factor determining the tensile force generated by a mus-cle’s contraction [39]. Estimates of the maximal contractileforce per unit of muscle range from approximately 20 to 135N/cm2 [13,20,108,138]. These data reveal a wide disparity inthe estimates of the maximum tensile force that muscle canproduce. Additional research is needed to determine if allskeletal muscle has the same potential maximum and whatthat maximum really is.
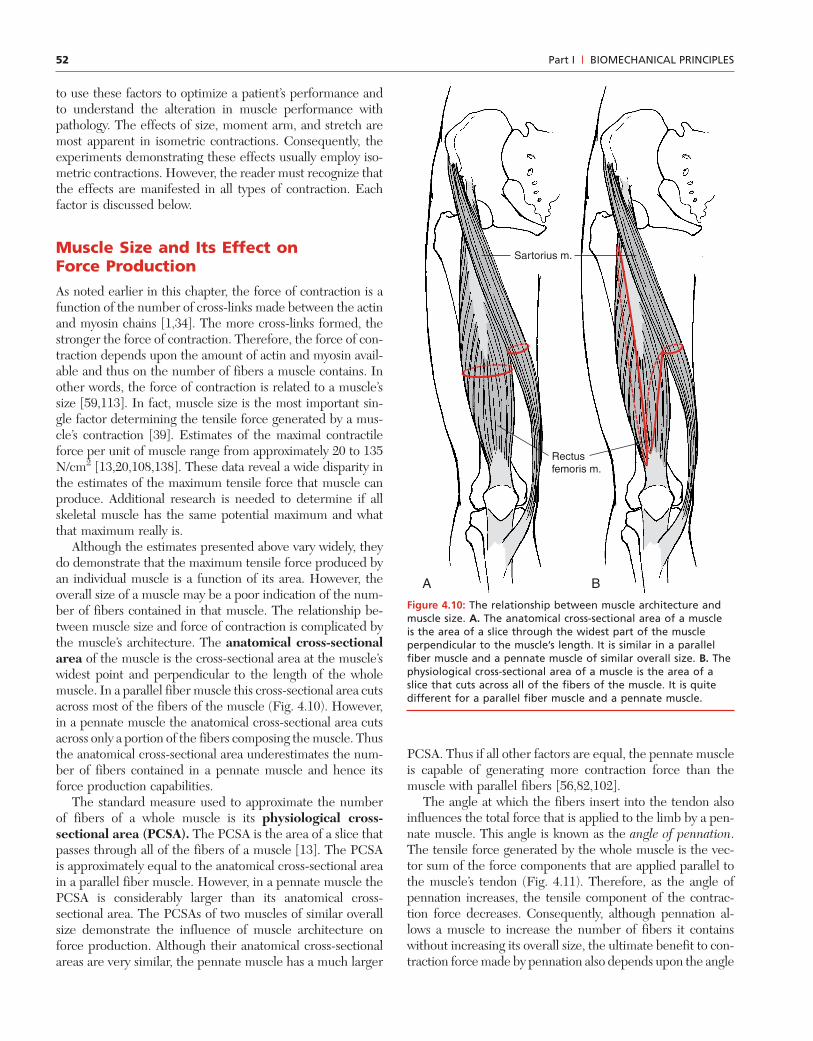
Although the estimates presented above vary widely, theydo demonstrate that the maximum tensile force produced byan individual muscle is a function of its area. However, theoverall size of a muscle may be a poor indication of the num-ber of fibers contained in that muscle. The relationship be-tween muscle size and force of contraction is complicated bythe muscle’s architecture. The anatomical cross-sectionalarea of the muscle is the cross-sectional area at the muscle’swidest point and perpendicular to the length of the wholemuscle. In a parallel fiber muscle this cross-sectional area cutsacross most of the fibers of the muscle (Fig. 4.10). However,in a pennate muscle the anatomical cross-sectional area cutsacross only a portion of the fibers composing the muscle. Thusthe anatomical cross-sectional area underestimates the num-ber of fibers contained in a pennate muscle and hence itsforce production capabilities.
The standard measure used to approximate the numberof fibers of a whole muscle is its physiological cross-sectional area (PCSA). The PCSA is the area of a slice thatpasses through all of the fibers of a muscle [13]. The PCSAis approximately equal to the anatomical cross-sectional areain a parallel fiber muscle. However, in a pennate muscle thePCSA is considerably larger than its anatomical cross-sectional area. The PCSAs of two muscles of similar overallsize demonstrate the influence of muscle architecture onforce production. Although their anatomical cross-sectionalareas are very similar, the pennate muscle has a much larger
PCSA. Thus if all other factors are equal, the pennate muscleis capable of generating more contraction force than themuscle with parallel fibers [56,82,102].
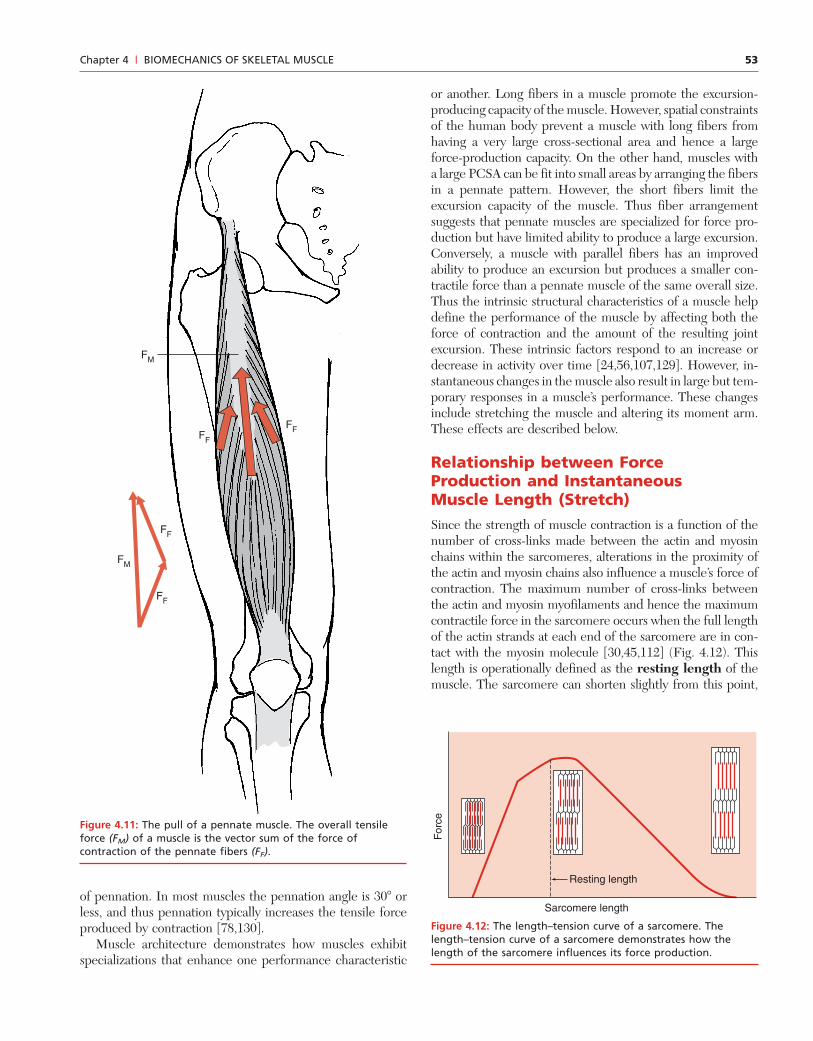
The angle at which the fibers insert into the tendon alsoinfluences the total force that is applied to the limb by a pen-nate muscle. This angle is known as the angle of pennation.The tensile force generated by the whole muscle is the vec-tor sum of the force components that are applied parallel tothe muscle’s tendon (Fig. 4.11). Therefore, as the angle ofpennation increases, the tensile component of the contrac-tion force decreases. Consequently, although pennation al-lows a muscle to increase the number of fibers it containswithout increasing its overall size, the ultimate benefit to con-traction force made by pennation also depends upon the angle
A B
Sartorius m.
Rectusfemoris m.
Figure 4.10: The relationship between muscle architecture andmuscle size. A. The anatomical cross-sectional area of a muscleis the area of a slice through the widest part of the muscleperpendicular to the muscle’s length. It is similar in a parallelfiber muscle and a pennate muscle of similar overall size. B. Thephysiological cross-sectional area of a muscle is the area of aslice that cuts across all of the fibers of the muscle. It is quitedifferent for a parallel fiber muscle and a pennate muscle.
53Chapter 4 | BIOMECHANICS OF SKELETAL MUSCLE
or another. Long fibers in a muscle promote the excursion-producing capacity of the muscle. However, spatial constraintsof the human body prevent a muscle with long fibers fromhaving a very large cross-sectional area and hence a largeforce-production capacity. On the other hand, muscles witha large PCSA can be fit into small areas by arranging the fibersin a pennate pattern. However, the short fibers limit theexcursion capacity of the muscle. Thus fiber arrangementsuggests that pennate muscles are specialized for force pro-duction but have limited ability to produce a large excursion.Conversely, a muscle with parallel fibers has an improvedability to produce an excursion but produces a smaller con-tractile force than a pennate muscle of the same overall size.Thus the intrinsic structural characteristics of a muscle helpdefine the performance of the muscle by affecting both theforce of contraction and the amount of the resulting jointexcursion. These intrinsic factors respond to an increase ordecrease in activity over time [24,56,107,129]. However, in-stantaneous changes in the muscle also result in large but tem-porary responses in a muscle’s performance. These changesinclude stretching the muscle and altering its moment arm.These effects are described below.
Relationship between ForceProduction and InstantaneousMuscle Length (Stretch)Since the strength of muscle contraction is a function of thenumber of cross-links made between the actin and myosinchains within the sarcomeres, alterations in the proximity ofthe actin and myosin chains also influence a muscle’s force ofcontraction. The maximum number of cross-links betweenthe actin and myosin myofilaments and hence the maximumcontractile force in the sarcomere occurs when the full lengthof the actin strands at each end of the sarcomere are in con-tact with the myosin molecule [30,45,112] (Fig. 4.12). Thislength is operationally defined as the resting length of themuscle. The sarcomere can shorten slightly from this point,
FF
FF
FM
FF
FF
FM
Figure 4.11: The pull of a pennate muscle. The overall tensileforce (FM) of a muscle is the vector sum of the force ofcontraction of the pennate fibers (FF).
of pennation. In most muscles the pennation angle is 30� orless, and thus pennation typically increases the tensile forceproduced by contraction [78,130].
Muscle architecture demonstrates how muscles exhibitspecializations that enhance one performance characteristic
For
ce
Sarcomere length
Resting length
Figure 4.12: The length–tension curve of a sarcomere. Thelength–tension curve of a sarcomere demonstrates how thelength of the sarcomere influences its force production.
54 Part I | BIOMECHANICAL PRINCIPLES
maintaining the maximum cross-linking. However, increasedshortening causes the actin strands from each end of the sar-comere to interfere with each other. This reduces the num-ber of available sites for cross-bridge formation, and the forceof contraction decreases. Similarly, when the sarcomere isstretched from its resting length, contact between the actinand myosin myofilaments decreases, and thus the number ofcross-links that can be made again diminishes. Consequently,the force of contraction decreases.
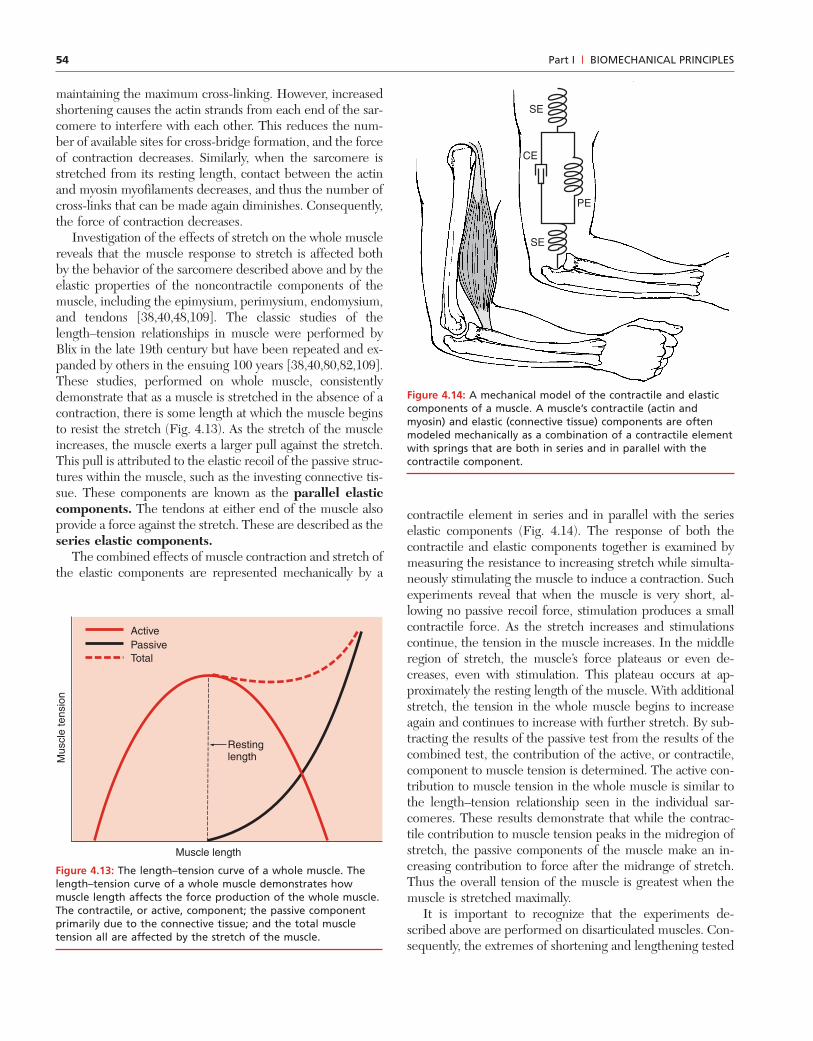
Investigation of the effects of stretch on the whole musclereveals that the muscle response to stretch is affected bothby the behavior of the sarcomere described above and by theelastic properties of the noncontractile components of themuscle, including the epimysium, perimysium, endomysium,and tendons [38,40,48,109]. The classic studies of thelength–tension relationships in muscle were performed byBlix in the late 19th century but have been repeated and ex-panded by others in the ensuing 100 years [38,40,80,82,109].These studies, performed on whole muscle, consistentlydemonstrate that as a muscle is stretched in the absence of acontraction, there is some length at which the muscle beginsto resist the stretch (Fig. 4.13). As the stretch of the muscleincreases, the muscle exerts a larger pull against the stretch.This pull is attributed to the elastic recoil of the passive struc-tures within the muscle, such as the investing connective tis-sue. These components are known as the parallel elasticcomponents. The tendons at either end of the muscle alsoprovide a force against the stretch. These are described as theseries elastic components.
The combined effects of muscle contraction and stretch ofthe elastic components are represented mechanically by a
contractile element in series and in parallel with the serieselastic components (Fig. 4.14). The response of both thecontractile and elastic components together is examined bymeasuring the resistance to increasing stretch while simulta-neously stimulating the muscle to induce a contraction. Suchexperiments reveal that when the muscle is very short, al-lowing no passive recoil force, stimulation produces a smallcontractile force. As the stretch increases and stimulationscontinue, the tension in the muscle increases. In the middleregion of stretch, the muscle’s force plateaus or even de-creases, even with stimulation. This plateau occurs at ap-proximately the resting length of the muscle. With additionalstretch, the tension in the whole muscle begins to increaseagain and continues to increase with further stretch. By sub-tracting the results of the passive test from the results of thecombined test, the contribution of the active, or contractile,component to muscle tension is determined. The active con-tribution to muscle tension in the whole muscle is similar tothe length–tension relationship seen in the individual sar-comeres. These results demonstrate that while the contrac-tile contribution to muscle tension peaks in the midregion ofstretch, the passive components of the muscle make an in-creasing contribution to force after the midrange of stretch.Thus the overall tension of the muscle is greatest when themuscle is stretched maximally.
It is important to recognize that the experiments de-scribed above are performed on disarticulated muscles. Con-sequently, the extremes of shortening and lengthening tested
Mus
cle
tens
ion
Muscle length
Restinglength
ActivePassive Total
Figure 4.13: The length–tension curve of a whole muscle. Thelength–tension curve of a whole muscle demonstrates howmuscle length affects the force production of the whole muscle.The contractile, or active, component; the passive componentprimarily due to the connective tissue; and the total muscletension all are affected by the stretch of the muscle.
SE
CE
PE
SE
Figure 4.14: A mechanical model of the contractile and elasticcomponents of a muscle. A muscle’s contractile (actin andmyosin) and elastic (connective tissue) components are oftenmodeled mechanically as a combination of a contractile elementwith springs that are both in series and in parallel with thecontractile component.
55Chapter 4 | BIOMECHANICS OF SKELETAL MUSCLE
are nonphysiological. An intact human muscle functions some-where in the central portion of the length–tension curve, al-though the precise shape of the length–tension curve variesacross muscles [40,136]. The response to stretch depends onthe architecture of the individual muscle as well as the ratioof contractile tissue to connective tissue in the muscle [40]. Inaddition, the exact amount of stretch and shortening sustainedby a muscle depends on the individual muscle and the joint.Muscles that cross two or more joints undergo more shorten-ing and lengthening than muscles that span only one joint. Theforce output of such multijointed muscles is influencedsignificantly by the length–tension relationship [50,111].
A muscle’s length, and therefore its force of contraction,changes as the joint position changes. However, the length ofthe muscle is only one factor that changes as the joint posi-tion changes. The moment arm of the muscle also varies withjoint position. The influence of a muscle’s moment arm onmuscle performance is described below.
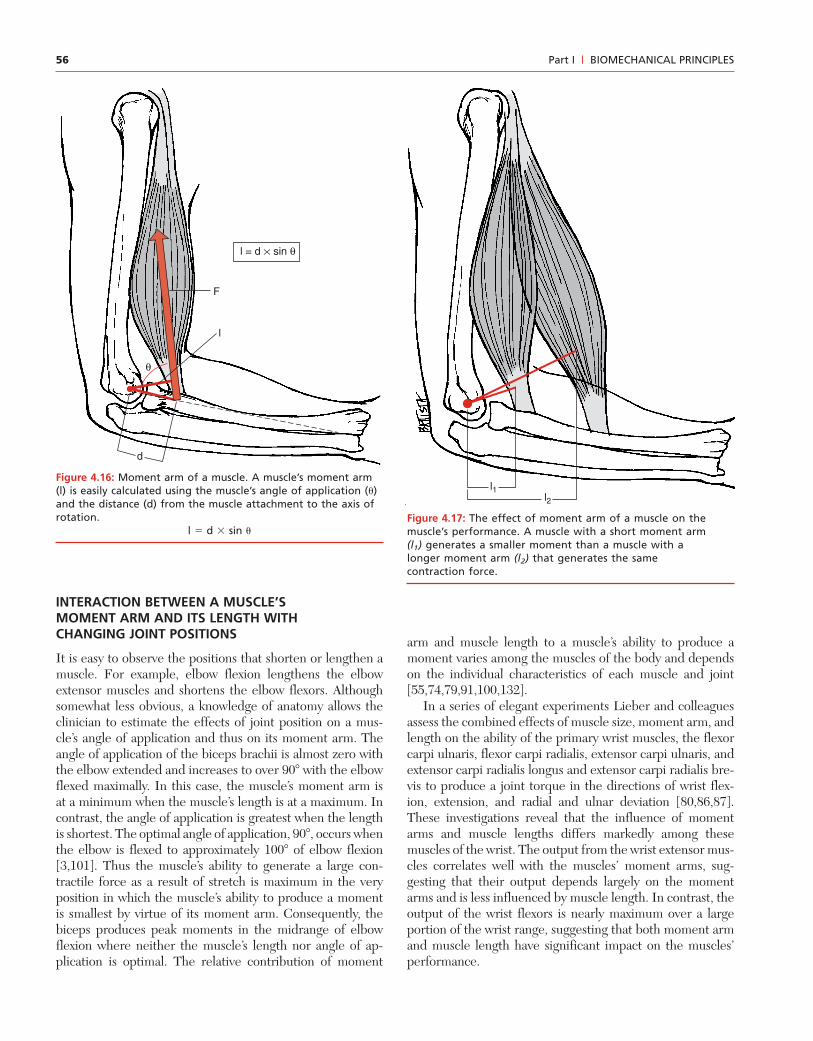
Relationship between aMuscle’s Moment Arm andIts Force ProductionAs noted earlier, a muscle’s ability to rotate a joint dependsupon the muscle’s force of contraction and on its momentarm, the perpendicular distance from the muscle force to thepoint of rotation [112]. The previous discussion reveals thatmuscle size and the stretch of the muscle have a significantimpact on the force of contraction. However, the muscle’s mo-ment arm is critical in determining the moment generated bythe muscle contraction. The larger the moment arm, thelarger the moment created by the muscle contraction. Therelationship between a muscle’s moment arm and its angle ofapplication is described earlier in the current chapter. Themoment arm is determined by the sine of the angle of appli-cation and the distance between the muscle’s attachment andthe joint’s axis of rotation (Fig. 4.16). The moment generatedby a muscle contraction is maximum when the muscle’s an-gle of application is 90�, since the sine of 90� equals 1. Addi-tionally, a muscle with a large moment arm produces a largermoment than a muscle with a shorter moment arm if bothmuscles generate equal contractile forces (Fig. 4.17). The mo-ment arms of some muscles such as the hamstrings changeseveral centimeters through the full ROM of the joint,while others such as the flexor digitorum profundus demon-strate changes of a few millimeters [51,62,63,73,101,121,135].Therefore, a muscle’s ability to produce a moment varies withthe joint position.
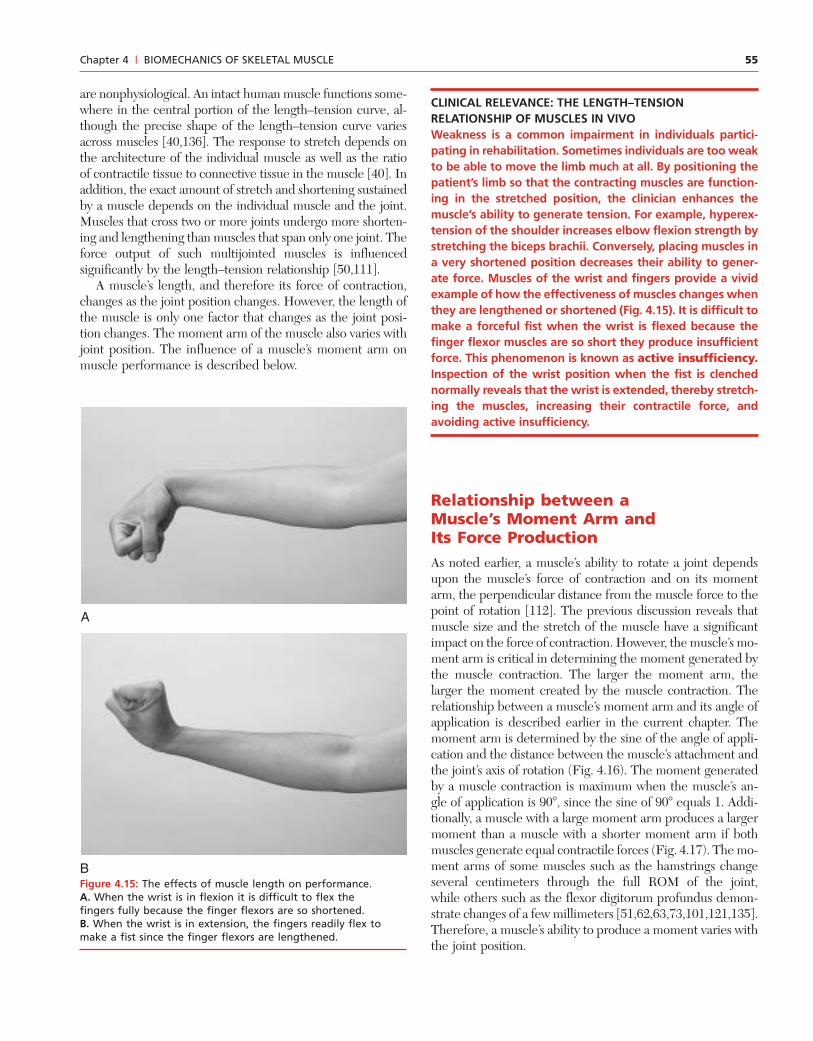
BFigure 4.15: The effects of muscle length on performance. A. When the wrist is in flexion it is difficult to flex the fingers fully because the finger flexors are so shortened. B. When the wrist is in extension, the fingers readily flex tomake a fist since the finger flexors are lengthened.
A
CLINICAL RELEVANCE: THE LENGTH–TENSIONRELATIONSHIP OF MUSCLES IN VIVOWeakness is a common impairment in individuals partici-pating in rehabilitation. Sometimes individuals are too weakto be able to move the limb much at all. By positioning thepatient’s limb so that the contracting muscles are function-ing in the stretched position, the clinician enhances themuscle’s ability to generate tension. For example, hyperex-tension of the shoulder increases elbow flexion strength bystretching the biceps brachii. Conversely, placing muscles ina very shortened position decreases their ability to gener-ate force. Muscles of the wrist and fingers provide a vividexample of how the effectiveness of muscles changes whenthey are lengthened or shortened (Fig. 4.15). It is difficult tomake a forceful fist when the wrist is flexed because thefinger flexor muscles are so short they produce insufficientforce. This phenomenon is known as active insufficiency.Inspection of the wrist position when the fist is clenchednormally reveals that the wrist is extended, thereby stretch-ing the muscles, increasing their contractile force, andavoiding active insufficiency.
56 Part I | BIOMECHANICAL PRINCIPLES
INTERACTION BETWEEN A MUSCLE’SMOMENT ARM AND ITS LENGTH WITHCHANGING JOINT POSITIONS
It is easy to observe the positions that shorten or lengthen amuscle. For example, elbow flexion lengthens the elbowextensor muscles and shortens the elbow flexors. Althoughsomewhat less obvious, a knowledge of anatomy allows theclinician to estimate the effects of joint position on a mus-cle’s angle of application and thus on its moment arm. Theangle of application of the biceps brachii is almost zero withthe elbow extended and increases to over 90� with the elbowflexed maximally. In this case, the muscle’s moment arm isat a minimum when the muscle’s length is at a maximum. Incontrast, the angle of application is greatest when the lengthis shortest. The optimal angle of application, 90�, occurs whenthe elbow is flexed to approximately 100� of elbow flexion[3,101]. Thus the muscle’s ability to generate a large con-tractile force as a result of stretch is maximum in the veryposition in which the muscle’s ability to produce a momentis smallest by virtue of its moment arm. Consequently, thebiceps produces peak moments in the midrange of elbowflexion where neither the muscle’s length nor angle of ap-plication is optimal. The relative contribution of moment
arm and muscle length to a muscle’s ability to produce amoment varies among the muscles of the body and dependson the individual characteristics of each muscle and joint[55,74,79,91,100,132].
In a series of elegant experiments Lieber and colleaguesassess the combined effects of muscle size, moment arm, andlength on the ability of the primary wrist muscles, the flexorcarpi ulnaris, flexor carpi radialis, extensor carpi ulnaris, andextensor carpi radialis longus and extensor carpi radialis bre-vis to produce a joint torque in the directions of wrist flex-ion, extension, and radial and ulnar deviation [80,86,87].These investigations reveal that the influence of momentarms and muscle lengths differs markedly among thesemuscles of the wrist. The output from the wrist extensor mus-cles correlates well with the muscles’ moment arms, sug-gesting that their output depends largely on the momentarms and is less influenced by muscle length. In contrast, theoutput of the wrist flexors is nearly maximum over a largeportion of the wrist range, suggesting that both moment armand muscle length have significant impact on the muscles’performance.
l
F
d
θ
l = d × sin θ
Figure 4.16: Moment arm of a muscle. A muscle’s moment arm(l) is easily calculated using the muscle’s angle of application (�)and the distance (d) from the muscle attachment to the axis ofrotation.
l � d � sin �Figure 4.17: The effect of moment arm of a muscle on themuscle’s performance. A muscle with a short moment arm(l1) generates a smaller moment than a muscle with alonger moment arm (l2) that generates the samecontraction force.
l1l2
57Chapter 4 | BIOMECHANICS OF SKELETAL MUSCLE
CLINICAL RELEVANCE: JOINT POSITION’S INFLUENCEON MUSCLE STRENGTHJoint position is likely to have a dramatic effect on the out-put from a muscle contraction, since joint position affectsboth the stretch and the moment arm of a muscle. Theexact influence is revealed through careful testing andvaries across muscles and joints. Similarly, only carefulinvestigation provides an explanation for the precisenature of the relationship between joint position and mus-cle force. However, a valid clinical assessment of strengthrequires that the joint position at which strength isassessed be maintained for each subsequent test. The clini-cian must consider the effects of joint position on muscleoutput when measuring strength and also when designingintervention strategies to improve muscle function. Unlessthe effects of muscle moment arm and muscle length areheld constant, changes in strength resulting from interven-tion cannot be distinguished from changes resulting fromthe mechanical change in the muscle.
The following scenario provides a helpful demonstra-tion. In the initial visit to a patient treated at home, theclinician measures hip flexion strength while the patient issitting in a wheelchair. Weakness is identified, and exer-cises are provided. On the next visit, 2 days later, the clini-cian finds the patient in bed and so measures hip flexionstrength in bed with the hip extended. Hip flexion strengthis greater at this measurement than in the previous meas-urement. The astute therapist recognizes that the apparentincrease in strength may be attributable to the change inposition, since muscle hypertrophy as a result of exercise isunlikely after only 2 days.
Relationship between ForceProduction and Contraction VelocityThe chapter to this point has examined the influence of mus-cle factors on force production only in isometric contractions,contractions with no visible change in muscle length. How-ever in nonisometric contractions, the direction and speed ofcontraction influence the muscle’s output. Speed of move-ment and its direction are described together by the vectorquantity velocity. This section examines the effects of con-traction velocity on muscle output. Both the direction and themagnitude of the velocity are important influences and arediscussed individually below.
EFFECTS OF THE MAGNITUDE OF THECONTRACTION VELOCITY ON FORCEPRODUCTION IN MUSCLE
Contractile velocity of a muscle is determined usually by themacroscopic change in length per unit time. Thus an isomet-ric contraction has zero contraction velocity. It is importantto recognize that on the microscopic level there is a changein length of the muscle even in an isometric contraction. In
contrast, a concentric contraction is defined as a contrac-tion in which there is visible shortening of the muscle. Thusa concentric contraction has a positive contraction velocity.
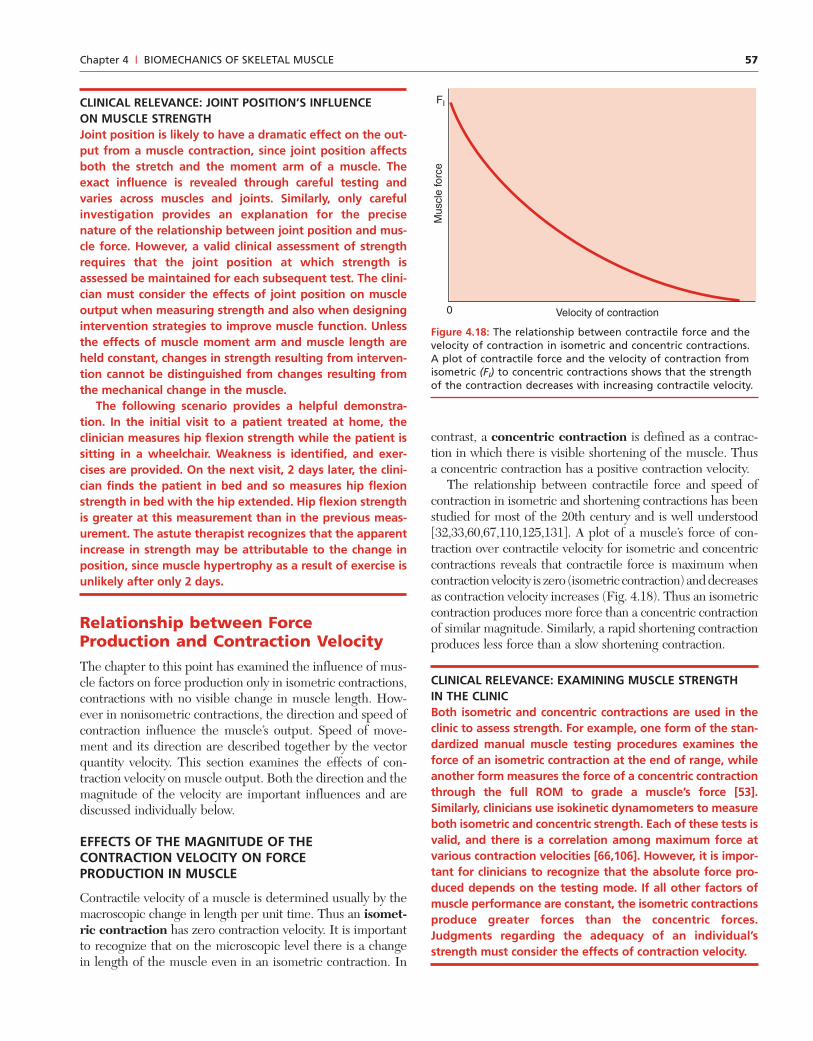
The relationship between contractile force and speed ofcontraction in isometric and shortening contractions has beenstudied for most of the 20th century and is well understood[32,33,60,67,110,125,131]. A plot of a muscle’s force of con-traction over contractile velocity for isometric and concentriccontractions reveals that contractile force is maximum whencontraction velocity is zero (isometric contraction) and decreasesas contraction velocity increases (Fig. 4.18). Thus an isometriccontraction produces more force than a concentric contractionof similar magnitude. Similarly, a rapid shortening contractionproduces less force than a slow shortening contraction.
CLINICAL RELEVANCE: EXAMINING MUSCLE STRENGTHIN THE CLINICBoth isometric and concentric contractions are used in theclinic to assess strength. For example, one form of the stan-dardized manual muscle testing procedures examines theforce of an isometric contraction at the end of range, whileanother form measures the force of a concentric contractionthrough the full ROM to grade a muscle’s force [53].Similarly, clinicians use isokinetic dynamometers to measureboth isometric and concentric strength. Each of these tests isvalid, and there is a correlation among maximum force atvarious contraction velocities [66,106]. However, it is impor-tant for clinicians to recognize that the absolute force pro-duced depends on the testing mode. If all other factors ofmuscle performance are constant, the isometric contractionsproduce greater forces than the concentric forces.Judgments regarding the adequacy of an individual’sstrength must consider the effects of contraction velocity.
Mus
cle
forc
e
Velocity of contraction
FI
0
Figure 4.18: The relationship between contractile force and thevelocity of contraction in isometric and concentric contractions.A plot of contractile force and the velocity of contraction fromisometric (FI) to concentric contractions shows that the strengthof the contraction decreases with increasing contractile velocity.
58 Part I | BIOMECHANICAL PRINCIPLES
EFFECTS OF THE DIRECTION OF CONTRACTION ONFORCE PRODUCTION IN MUSCLE
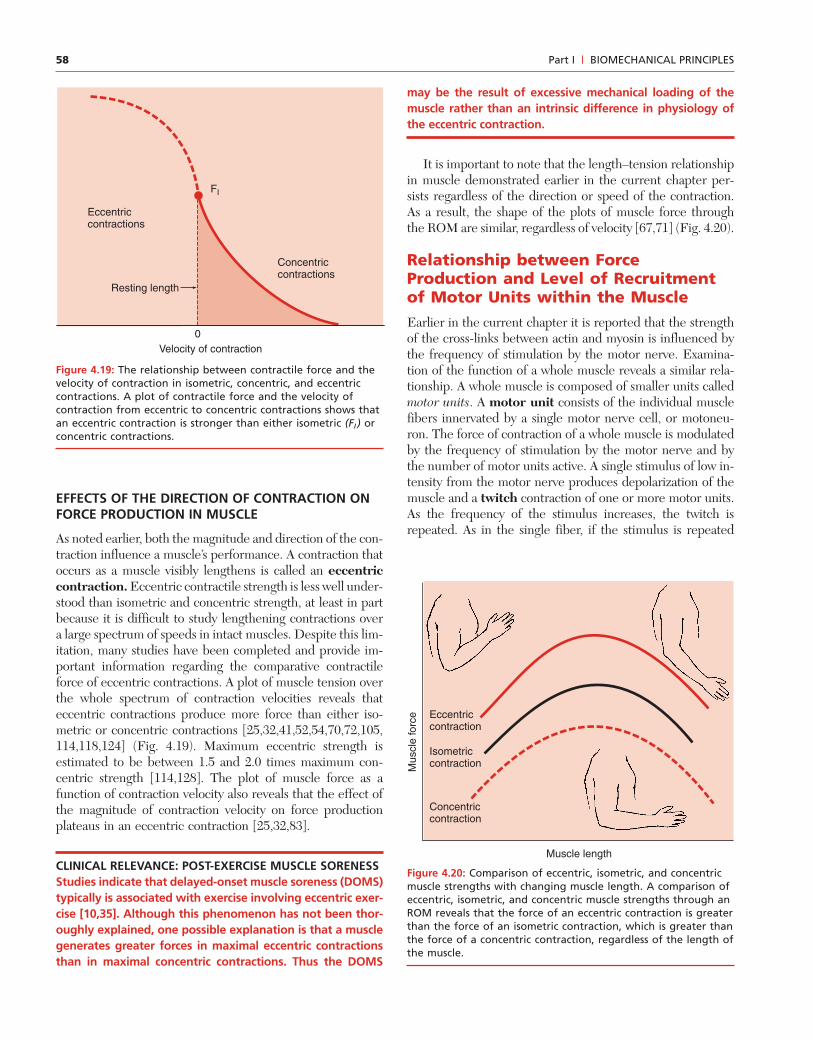
As noted earlier, both the magnitude and direction of the con-traction influence a muscle’s performance. A contraction thatoccurs as a muscle visibly lengthens is called an eccentriccontraction. Eccentric contractile strength is less well under-stood than isometric and concentric strength, at least in partbecause it is difficult to study lengthening contractions overa large spectrum of speeds in intact muscles. Despite this lim-itation, many studies have been completed and provide im-portant information regarding the comparative contractileforce of eccentric contractions. A plot of muscle tension overthe whole spectrum of contraction velocities reveals thateccentric contractions produce more force than either iso-metric or concentric contractions [25,32,41,52,54,70,72,105,114,118,124] (Fig. 4.19). Maximum eccentric strength isestimated to be between 1.5 and 2.0 times maximum con-centric strength [114,128]. The plot of muscle force as afunction of contraction velocity also reveals that the effect ofthe magnitude of contraction velocity on force productionplateaus in an eccentric contraction [25,32,83].
CLINICAL RELEVANCE: POST-EXERCISE MUSCLE SORENESSStudies indicate that delayed-onset muscle soreness (DOMS)typically is associated with exercise involving eccentric exer-cise [10,35]. Although this phenomenon has not been thor-oughly explained, one possible explanation is that a musclegenerates greater forces in maximal eccentric contractionsthan in maximal concentric contractions. Thus the DOMS
may be the result of excessive mechanical loading of themuscle rather than an intrinsic difference in physiology ofthe eccentric contraction.
It is important to note that the length–tension relationshipin muscle demonstrated earlier in the current chapter per-sists regardless of the direction or speed of the contraction.As a result, the shape of the plots of muscle force throughthe ROM are similar, regardless of velocity [67,71] (Fig. 4.20).
Relationship between ForceProduction and Level of Recruitmentof Motor Units within the MuscleEarlier in the current chapter it is reported that the strengthof the cross-links between actin and myosin is influenced bythe frequency of stimulation by the motor nerve. Examina-tion of the function of a whole muscle reveals a similar rela-tionship. A whole muscle is composed of smaller units calledmotor units. A motor unit consists of the individual musclefibers innervated by a single motor nerve cell, or motoneu-ron. The force of contraction of a whole muscle is modulatedby the frequency of stimulation by the motor nerve and bythe number of motor units active. A single stimulus of low in-tensity from the motor nerve produces depolarization of themuscle and a twitch contraction of one or more motor units.As the frequency of the stimulus increases, the twitch isrepeated. As in the single fiber, if the stimulus is repeated
Mus
cle
forc
e
Muscle length
Concentric contraction
Isometric contraction
Eccentric contraction
Eccentriccontractions
FI
Concentriccontractions
Velocity of contraction
Resting length
0
Figure 4.19: The relationship between contractile force and thevelocity of contraction in isometric, concentric, and eccentriccontractions. A plot of contractile force and the velocity ofcontraction from eccentric to concentric contractions shows thatan eccentric contraction is stronger than either isometric (FI ) orconcentric contractions.
Figure 4.20: Comparison of eccentric, isometric, and concentricmuscle strengths with changing muscle length. A comparison ofeccentric, isometric, and concentric muscle strengths through anROM reveals that the force of an eccentric contraction is greaterthan the force of an isometric contraction, which is greater thanthe force of a concentric contraction, regardless of the length ofthe muscle.
59Chapter 4 | BIOMECHANICS OF SKELETAL MUSCLE
before the muscle relaxes, the twitches begin to fuse, and asustained, or tetanic, contraction is elicited. As the intensityof the stimulus increases, more motor units are stimulated,and the force of contraction increases. Thus a muscle is ableto produce maximal or submaximal contractions by modifyingthe characteristics of the stimulus from the nerve.
The amount of activity of a muscle is measured by its elec-tromyogram (EMG). The EMG is the electrical activity in-duced by depolarization of the muscle fibers. In an isometriccontraction, there is a strong relationship between the elec-trical activity of the muscle, its EMG, and the force of con-traction. As isometric force increases, the EMG also increases[22,26,27,70,116,120,122,126]. This relationship is logical,since the force of contraction is a function of the number ofcross-links formed between the actin and myosin chains andthus a function of the number of muscle fibers contracting.The EMG reflects the number of active fibers as well as theirfiring frequency [7,9,11,120]. However, the relationship of themuscle’s EMG and its force of contraction is more compli-cated when the muscle is free to change length and the jointis free to move.
This chapter demonstrates that the size and stretch of themuscle, the muscle’s moment arm, and the velocity of con-traction all contribute to the force produced by contraction.The EMG merely serves to indicate the electrical activity ina muscle. Thus a larger muscle produces a larger EMG pat-tern during a maximal contraction than a smaller muscleperforming a maximal contraction, since there are more mo-tor units firing in the larger muscle. However, within the samemuscle, a maximal eccentric contraction elicits an EMG pat-tern similar to that produced during a maximal concentriccontraction, even though the force of contraction is greaterin the eccentric contraction [70,114]. In the case of maximalcontractions, the muscle recruits approximately the samenumber of motor units regardless of the output. The outputof the muscle varies primarily because of the mechanical ef-fects of contraction velocity.
CLINICAL RELEVANCE: ASSESSMENT OF PEAK STRENGTHThe basic premise of strength assessment is that the testsubject is producing a maximal contraction; that is, the sub-ject is maximally recruiting available motor units. The valid-ity and reliability of muscle testing depends upon thetester’s ability to motivate the individual to produce a max-imal contraction. A classic study of the reliability of manualmuscle testing reveals that an important factor explainingthe lack of reliability is that some testers failed to elicit amaximal contraction, erroneously grading a submaximalcontraction [57]. Encouraging a subject to produce a maxi-mal effort requires both psychological and mechanical skillsthat are developed with knowledge and practice but areessential to valid and reliable measures of strength.
In a submaximal contraction, the muscle recruits enoughmotor units to produce the necessary muscle force. A muscle
that is lengthened or positioned with a large moment arm issaid to be at a mechanical advantage. It can produce thesame moment with less recruitment and consequently asmaller EMG than when the muscle is at a mechanicaldisadvantage, positioned at a shortened length, or with a smallmoment arm [58,97]. When a muscle is at a mechanicaladvantage or when it is stronger, it needs fewer motor unitsto generate a moment; when the muscle is at a mechanicaldisadvantage or is weaker, it must recruit more motor units togenerate the same moment [8,26,96].
This literature review demonstrates that EMG reflects therelative activity of a muscle rather than providing a directmeasure of the force of that muscle’s contraction. The litera-ture is filled with studies of the EMG activity of muscles dur-ing function. These studies are used to explain the role ofmuscles during activity. Reference to such articles is madefrequently throughout this textbook. However, caution isneeded when interpreting these studies, since EMG reflectsonly the relative activity of a muscle. Muscle size and me-chanical advantage affect the recorded electrical activity. Thereare also several technical factors that influence the magnitudeof EMG produced during muscle contraction. These includethe type and size of the recording electrodes and the signal-processing procedures. These issues are beyond the scope ofthis book, but they serve as a warning to the clinician that in-terpretation of EMG and comparisons across studies must pro-ceed with caution. To improve the generalizability of EMGdata, analysis of the electrical activity of a muscle typically in-volves some form of normalization of the data. A commonnormalizing procedure is to compare the activity of a muscleto the EMG produced by a maximal voluntary contraction(MVC). The basic premise in this approach is that an MVCrequires maximal recruitment of a muscle’s motor units, whichthen produces a maximum electrical signal. This maximal ac-tivity is used as the basis for comparing the muscle’s level ofactivity in other activities. Processing of the electrical signalalso affects the interpretation of the signal [7]. A discussion ofthe issues involved in the analysis of EMG data is beyond thescope of this book. However, the reader is urged to use EMGdata cautiously when analyzing the roles of individual muscles.
Relationship between ForceProduction and Fiber TypeThe last characteristic of muscle influencing the force of con-traction to be discussed in this chapter is the type of fiberscomposing an individual muscle. Different types of musclefibers possess different contractile properties. Therefore,their distribution within a muscle influences the contractileperformance of a whole muscle. However, because humanmuscles are composed of a mix of fiber types, fiber type hasless influence on the force-producing capacity of a musclethan do the factors discussed to this point.
There are a variety of ways to categorize voluntary mus-cle fibers based on such characteristics as their metabolic
60 Part I | BIOMECHANICAL PRINCIPLES
processes, their histochemical composition, and their pheno-type. Although each method examines different properties,each identifies groups ranging from fatigue-resistant fiberswith slow contractile properties to rapidly fatiguing cells withfaster contractile velocities [137]. A common catalogingsystem based on metabolic properties classifies most humanmuscle fibers as type I, type IIa, or type IIb fibers. Charac-teristics of these three fiber types are listed in Table 4.1. Forthe purposes of the current discussion, a closer examinationof the mechanical properties of these fibers is indicated. Ingeneral, the contractile force of a type IIb fiber is greater thanthat of a type I fiber [12]. Thus muscles composed of moretype IIb fibers are likely to generate larger contractile forcesthan a comparable muscle consisting of mostly type I fibers[98]. Type I fibers are innervated by small-diameter axons ofthe motor nerve. They are recruited first in a muscle con-traction. Type IIb fibers are innervated by large axons and arerecruited only after type I and type IIa fibers. Type IIb fibersare recruited as the resistance increases [94,95].
The velocity of contraction also differs among fiber types[2,12]. Consequently, the force–velocity relationship alsovaries among the fiber types. Data from human musclessuggest that type IIb fibers exert larger forces at higher ve-locities, while type I fibers have slower maximal contractilevelocities as well as lower peak forces [12]. Thus muscles witha preponderance of type II fibers have a higher rate of forceproduction and a higher contractile force than muscles withmore type I fibers [1].
Postural muscles typically are composed largely of type Ifibers, while muscles whose functions demand large bursts offorce consist of more type II fibers [1,119]. However, as al-ready noted, human muscles contain a mixture of fiber types[28,29,93,95]. Therefore, the contractile properties of wholemuscles reflect the combined effects of the fibers types. Con-sequently, the other factors influencing force production suchas muscle size and mechanical advantage appear to have alarger influence on contractile force [23]. However, musclefibers demonstrate different responses to changes in activityand thus play a significant role in muscle adaptation. Theadaptability of muscle is discussed briefly below.
ADAPTATION OF MUSCLE TOALTERED FUNCTION
Muscle is perhaps the most mutable of biological tissues. Adiscussion of the mechanical properties of muscle cannot becomplete without a brief discussion of the changes in these
mechanical properties resulting from changes in the demandsplaced on muscle. The following provides a brief discussionof the changes in muscle that occur in response to sustainedchanges in
• Muscle length• Activity level
Understanding the effects of sustained changes in musclelength or activity level is complicated by the recognition thatthese factors are often combined in investigations. Studies as-sessing the effects of length changes often use immobiliza-tion to apply the length change. Consequently, the musclesrespond to both the altered length and decreased activity. Asa result, a complete understanding of the influence of thesefactors on muscle function continues to elude investigators.The following briefly reviews the current state of knowledgeof muscles’ adaptation to altered function.
Adaptation of Muscle to ProlongedLength ChangesThe relationship between stretch of a muscle and its force ofcontraction is presented in detail elsewhere in this chapter.This relationship is a function of both the contractile and non-contractile components of muscle. However, it also is impor-tant to ponder the effect of prolonged length change on thelength–tension relationship. Since muscles are organized ingroups of opposing muscles, when one muscle is held onstretch, another muscle is held in a shortened position. There-fore, it is important to consider a muscle’s response to bothprolonged lengthening and prolonged shortening. The vastmajority of studies examining alterations in muscle resultingfrom prolonged length changes use immobilization proce-dures to provide the length change. Therefore, the readermust exert caution when attempting to generalize these re-sults to other cases such as postural abnormalities that do notinvolve immobilization.
CHANGES IN MUSCLE WITHPROLONGED LENGTHENING
In general, prolonged stretch of a muscle induces protein syn-thesis and the production of additional sarcomeres [43,44,123,134,137]. The muscle hypertrophies, and as a result, peak con-tractile force is increased with prolonged stretch. The addi-tion of sarcomeres in series increases the overall length of themuscle fibers. This remodeling appears important in allow-ing the muscle to maintain its length–tension relationship.
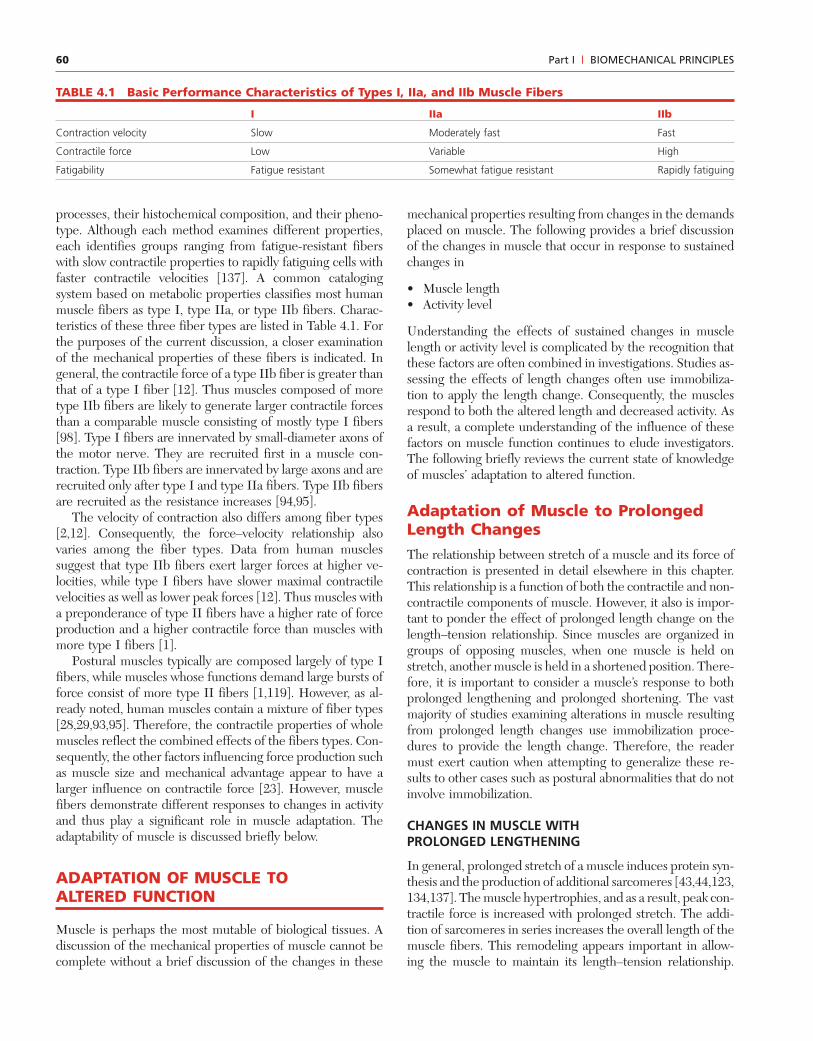
TABLE 4.1 Basic Performance Characteristics of Types I, IIa, and IIb Muscle Fibers
I IIa IIb
Contraction velocity Slow Moderately fast Fast
Contractile force Low Variable High
Fatigability Fatigue resistant Somewhat fatigue resistant Rapidly fatiguing
61Chapter 4 | BIOMECHANICS OF SKELETAL MUSCLE
There also is evidence of changes in the metabolic charac-teristics of muscle cells subjected to prolonged stretch. Somemuscles exhibit changes in mRNA consistent with a transi-tion from type II to type I fibers [137].
Although hypertrophy is the typical muscle response toprolonged stretch, studies report more varied responsesamong individual muscles. Changes in muscle mass, peakstrength, and even gene expression with prolonged stretchvary across muscles and appear to depend upon the muscle’sfiber type composition and its function [78,88].
CHANGES IN MUSCLE HELD IN A SHORTENEDPOSITION FOR A PROLONGED PERIOD
Investigation into the effects of prolonged shortening alsodemonstrates a complex response. Prolonged shortening pro-duced by immobilization appears to accelerate atrophy, andmuscles demonstrate a loss of sarcomeres [43,123,137]. Somemuscles immobilized in a shortened position also show evi-dence of a transition toward type II fibers. Yet a study exam-ining the effects of shortening without immobilization reportsan increase in sarcomeres [69]. Results of this study suggestthat tendon excursion may be a stronger factor than theshortening itself in determining the muscle’s remodeling. Inaddition, like prolonged stretch, prolonged shortening yieldsdifferent responses in different muscles [78].
Clearly, complete understanding of the factors inducingmuscle adaptation requires further investigation. The studiesreported here demonstrate that the adaptability of muscle toprolonged length changes is complex and depends on manyfactors besides the specific change in length. Yet these stud-ies do consistently demonstrate changes that seem directed,at least in part, at maintaining a safe and functional length–tension relationship in each muscle [78,112,123].
CLINICAL RELEVANCE: PROLONGED LENGTHCHANGES IN MUSCLE AS THE RESULT OFPOSTURAL ABNORMALITIESPostural abnormalities reportedly produce prolongedlengthening of some muscles and prolonged shortening ofother muscles [61]. This has led to the belief that abnormalposture produces changes in muscle strength. Studies haveattempted to identify such changes in strength andchanges in the length tension relationships of muscles thatappear to be affected by postural abnormalities [21,104].However, these studies fail to demonstrate a clear changein strength attributable to length changes. Yet clinicianscontinue to treat abnormal postural alignment withstrengthening and stretching exercises. Although currentstudies neither prove nor disprove the existence of clinicallymeasurable changes in muscle as the result of prolongedlength changes, they emphasize the need for clinicians touse caution in assuming relationships between posturalalignment and muscular strength.
Adaptations of Muscle to SustainedChanges in Activity LevelMuscle’s basic response to changes in activity level is wellknown: increased activity results in hypertrophy and increasedforce production, and decreased activity leads to atrophy anddecreased force production. Of course the exact response isfar more complicated than this. The response depends on thenature of the activity change and on the nature of the mus-cle whose activity is altered.
Resistance exercise leads to muscle hypertrophy and in-creased strength in both men and women of virtually all ages[16,64,75,107,129]. Strengthening exercises in humans pro-duce an increase in the cross-sectional area (CSA) of bothtype I and type II fibers, although there is evidence thatthere is a greater increase in the CSA of type II fibers[23,24,54,89,92,103]. In addition, animal studies reveal thatprotein synthesis is consistent with a transition from type IIbfibers to type I fibers [5,78].
In contrast, decreased activity produces a decrease in CSAand loss of strength [42,77,103]. One study reports a 13% de-crease in some lower extremity strength in 10 healthy sub-jects who underwent only 10 days of non-weight-bearing ac-tivity [8]! Disuse atrophy is apparent in both type I and typeII fibers. In addition, there is evidence supporting a transi-tion from type I fibers to type II fibers [4,5,88].
Although the preceding discussion demonstrates generalpatterns of muscle response to changes in activity level, theresponse is actually quite muscle dependent [77,78]. Onestudy reports a 26% loss in plantarflexion strength with nosignificant loss in dorsiflexion strength in healthy individualsfollowing 5 weeks of bed rest [77]. Animal studies show similardifferences among muscle groups [17,78]. Other mechanicalfactors such as stretch also affect a muscle’s response toreduced activity [88].
CLINICAL RELEVANCE: DISUSE ATROPHY IN PATIENTSPatients who have spent prolonged periods in bed arelikely to demonstrate significant loss of strength resultingdirectly from the inactivity and unrelated to other simulta-neous impairments or comorbidities. However, the effectsof inactivity may be manifested differently in the variousmuscle groups of the body. The clinician must be aware ofthe likely loss of strength and also must consider the pos-sible loss of muscular endurance that may result from atransition from type I to type II muscle fibers. In addition,the clinician also must screen carefully for these changes toidentify those muscle groups that are most affected bydisuse.
AGING AS ANOTHER MODEL OF ALTERED ACTIVITY
Loss of strength is a well-established finding in aging adults[15,75,85,90,107,117]. This loss of strength is attributed to adecreased percentage of, and greater atrophy in, type II fibers
62 Part I | BIOMECHANICAL PRINCIPLES
3. An KN, Kaufman KR, Chao EYS: Physiological considerationsof muscle force through the elbow joint. J Biomech 1989; 22:1249–1256.
4. Andersen JL, Gruschy-Knudsen T, Sabdri C, et al.: Bed restincreases the amount of mismatched fibers in human skeletalmuscle. J Appl Physiol 1999; 86: 455–460.
5. Baldwin KM: Effects of altered loading states on muscle plas-ticity: what have we learned from rodents? Med Sci SportsExerc 1996; 28: S101–S106.
6. Baldwin KM, Valdez V, Herrick RE, et al.: Biochemical prop-erties of overloaded fast-twitch skeletal muscle. J Appl Physiol1982; 52: 467–472.
7. Basmajian JV, DeLuca CJ: Muscles Alive. Their FunctionRevealed by Electromyography. Baltimore: Williams &Wilkins, 1985.
8. Berg HE, Tesch PA: Changes in muscle function in responseto 10 days of lower limb unloading in humans. Acta PhysiolScand 1996; 157: 63–70.
9. Bergstrom RM: The relation between the number of impulsesand the integrated electrical activity in electromyogram. ActaPhysiol Scand 1959; 45: 97–101.
10. Berry CB, Moritani T, Tolson H: Electrical activity and sore-ness in muscles after exercise. Am J Phys Med Rehabil 1990;69: 60–66.
11. Bigland B, Lippold OCJ: The relation between force, velocityand integrated electrical activity in human muscles. J Physiol1954; 123: 214–224.
12. Bottinelli R, Pellegrino MA, Canepari M, et al.: Specific contri-butions of various muscle fibre types to human muscle perform-ance: an in vitro study. J Electromyogr Kinesiol 1999; 9: 87–95.
13. Brand PW, Beach RB, Thompson DE: Relative tension andpotential excursion of muscles in the forearm and hand. J HandSurg [Am]. 1999; 6: 209–219.
14. Brand PW, Hollister A: Clinical Mechanics of the Hand. St.Louis, MO: Mosby-Year Book, 1993.
15. Brown DA, Miller WC: Normative data for strength andflexibility of women throughout life. Eur J Appl Physiol 1998;78: 77–82.
16. Brown M: Exercising and elderly person. Phys Ther Pract1992; 1: 34–42.
17. Brown M, Hasser EM: Weight-bearing effects on skeletal mus-cle during and after simulated bed rest. Arch Phys MedRehabil 1995; 76: 541–546.
18. Brown M, Hasser EM: Complexity of age-related change inskeletal muscle. J Gerontol 1996; 51A: B117–B123.
19. Brown M, Sinacore D, Host H: The relationship of strength tofunction in the older adult. J Gerontol 1995; 50A: 55–59.
20. Buchanan TS: Evidence that maximum muscle stress is not aconstant: differences in specific tension in elbow flexors andextensors. Med Eng Phys 1995; 17: 529–536.
21. Buchner DM, Beresford SAA, Larson EB, et al.: Effects ofphysical activity on health status in older adults II: interventionstudies. Annu Rev Public Health 1992; 13: 469–488.
22. Clancy EA, Hogan N: Relating agonist-antagonist electromyo-grams to joint torque during isometric, quasi-isotonic, nonfa-tiguing contractions. IEEE Trans Biomed Eng 1997; 44:1024–1028.
23. Clarkson PM, Kroll W, Melchionda AM: Isokinetic strength,endurance, and fiber type composition in elite American pad-dlers. Eur J Appl Physiol 1982; 48: 67–76.
[65,76,115]. As in the other adaptations of muscle describedabove, changes in muscle with age vary across muscles [18].Some muscle groups appear to be more susceptible to age-related change; others seem impervious to such changes.Again these data reveal that the clinician must assess strengthin the aging individual. However, the clinician must also takecare to identify those muscle groups that are weakened andthose that are relatively unaffected, to target the interventionspecifically for optimal results.
CLINICAL RELEVANCE: DECREASED STRENGTHWITH AGINGDecreased functional ability is a frequent finding withaging. Although many factors contribute to diminishedfunction with age, investigations demonstrate a relation-ship between diminished functional ability and decreasedstrength [19,21,46]. Similarly, increasing strength in eldersimproves functional ability [31,99]. One of the challengesin rehabilitation is to identify successful strategies to pre-vent or reduce strength loss and preserve functional abilityin the aging population.
SUMMARY
This chapter reviews the basic mechanisms of muscle short-ening and discusses in detail the individual factors that influ-ence a muscle’s ability to produce motion and to generateforce. The primary factors influencing a muscle’s ability toproduce joint motion are the length of the muscle fiberswithin the muscle and the length of the muscle’s moment arm.Muscle strength, including its tensile force of contraction andits resulting moment, is a function of muscle size, muscle mo-ment arm length, stretch of the muscle, contraction velocity,fiber types within the muscle, and amount of muscle fiber re-cruitment. Each factor is described and examples are pro-vided to demonstrate how an understanding of the factor canbe used in the clinic to explain or optimize performance. Thediscussion also demonstrates that often as one factor is en-hancing a performance characteristic another factor may bedetracting from that performance. The final output of a mus-cle is the result of all of the factors influencing performance.Thus to understand the basis for a patient’s performance, theclinician must be able to recognize how the individual factorsinfluencing muscle performance change as joint position andmotion change.
References
1. Aagaard P, Andersen JL: Correlation between contractilestrength and myosin heavy chain isoform composition in humanskeletal muscle. Med Sci Sports Exerc 1998; 30: 1217–1222.
2. Adam C, Eckstein F, Milz S, Putz R: The distribution of carti-lage thickness within the joints of the lower limb of elderlyindividuals. J Anat 1998; 193: 203–214.
63Chapter 4 | BIOMECHANICS OF SKELETAL MUSCLE
24. Cress NM, Conley KE, Balding SL, et al.: Functional training:muscle structure, function and performance in older women. JOrthop Sports Phys Ther 1996; 24: 4–10.
25. Cress NM, Peters KS, Chandler JM: Eccentric and concentricforce-velocity relationships of the quadriceps femoris muscle. JOrthop Sports Phys Ther 1992; 16: 82–86.
26. Dolan P, Adams MA: The relationship between EMG activityand extensor moment generation in the erector spinae musclesduring bending and lifting activities. J Biomech 1993; 26:513–522.
27. Dolan P, Kingman I, DeLooze MP, et al: An EMG techniquefor measuring spinal loading during asymmetric lifting. ClinBiomech 2001; 16 Suppl: S17–S24.
28. Edgerton VR, Smith JL, Simpson DR: Muscle fibre type pop-ulations of human leg muscles. Histochem J 1975; 7: 259–266.
29. Elder GCB, Bradbury K, Roberts R: Variability of fiber typedistributions within human muscles. J Appl Physiol 1982; 53:1473–1480.
30. Elftman H: Biomechanics of muscle, with particular applica-tion to studies of gait. J Bone Joint Surg [AM] 1966; 48:363–377.
31. Evans WJ: Exercise training guidelines for the elderly. Med SciSports Exerc 1999; 31: 12–17.
32. Evetovich TK, Housh TJ, Johnson GO, et al.: Gender compar-isons of the mechanomyographic responses to maximal con-centric and eccentric isokinetic muscle actions. Med Sci SportsExerc 1998; 30: 1697–1702.
33. Fenn WO, Marsh BS: Muscular force at different speed ofshortening. Proc R Soc B [Lond] 1998; 277–297.
34. Fitts RH, McDonald KS, Schluter JM: The determinants ofskeletal muscle force and power: their adaptability withchanges in activity pattern. J Biomech 1991; 24: 111–122.
35. Fitzgerald GK, Rothstein JM, Mayhew TP, Lamb RL:Exercise-induced muscle soreness after concentric and eccen-tric isokinetic contractions. Phys Ther 1991; 71: 505–513.
36. Foss ML, Keteyian SJ: Fox’s physiological basis of exercise andsport. Boston: WCB/McGraw-Hill, 1998.
37. Fukunaga T, Kawakami Y, Kuno S, et al.: Muscle architectureand function in humans. J Biomech 1997; 30: 457–463.
38. Gandevia SC, McKenzie DK: Activation of human muscles atshort muscle lengths during maximal static efforts. J Physiol[Lond] 1988; 407: 599–613.
39. Gans C: Fiber architecture and muscle function. Exerc SportsSci Rev 1982; 10: 160–207.
40. Gareis H, Solomonow M, Baratta R, et al.: The isometriclength-force models of nine different skeletal muscles. JBiomech 1992; 25: 903–916.
41. Ghena DR, Kurth AL, Thomas M, Mayhew J: Torque charac-teristics of the quadriceps and hamstring muscles during con-centric and eccentric loading. J Orthop Sports Phys Ther 1991;14: 149–154.
42. Gogia PP, Schneider VS, LeBlanc AD, et al.: Bed rest effect onextremity muscle torque in healthy men. Arch Phys MedRehabil 1988; 69: 1030–1032.
43. Goldspink G: The influence of immobilization and stretch inprotein turnover of rat skeletal muscle. J Physiol 1977; 264:267–282.
44. Goldspink G: Changes in muscle mass and phenotype and theexpression of autocrine and systemic growth factors by musclein response to stretch and overload. J Anat 1999; 194: 323–334.
45. Gordon AM, Huxley AF, Julian FJ: The variation in isometrictension with sarcomere length in vertebrate muscle fibres.J Physiol 1966; 184: 170–192.
46. Graafmans WC, Ooms ME, Hofstee HMA, et al.: Falls in theelderly: a prospective study of the risk factors and risk profiles.Am J Epidemiol 1996; 143: 1129–1136.
47. Harms-Ringdahl K: Muscle strength. Edinburgh: ChurchillLivingstone, 1993.
48. Hawkins D, Bey M: Muscle and tendon force-length pro-perties and their interactions in vivo. J Biomech 1997; 30:63–70.
49. Hawkins DA, Hull ML: A computer simulation of muscle-tendon mechanics. Comput Biol Med 1991; 21: 369–382.
50. Herzog W, Leonard TR, Renaud JM, et al.: Force-length prop-erties and functional demands of cat gastrocnemius, soleus,and plantaris muscles. J Biomech 1992; 25: 1329–1335.
51. Herzog W, Read LJ: Lines of action and moment arms of themajor force-carrying structures crossing the human knee joint.J Anat 1993; 182: 213–230.
52. Higbie EJ, Cureton KJ, Warren GLI, Prior BM: Effects ofconcentric and eccentric training on muscle strength, cross-sectional area, and neural activation. J Appl Physiol 1996; 81:2173–2181.
53. Hislop HJ, Montgomery J: Daniel’s and Worthingham’s MuscleTesting: Techniques of Manual Examination. Philadelphia:WB Saunders, 1995.
54. Hortobagyi T, Hill JP, Houmard JA, et al.: Adaptive responsesto muscle lengthening and shortening in humans. J ApplPhysiol 1996; 80: 765–772.
55. Hoy MG, Zajac FE: A musculoskeletal model of the humanlower extremity: the effect of muscle, tendon, and momentarm on the moment-angle relationship of musculotendonactuators at the hip, knee, and ankle. J Biomech 1990; 23:157–169.
56. Ichinose Y: Relationship between muscle fiber pennation andforce generation capability in Olympic athletes. Int J SportsMed 1998; 19: 541–546.
57. Iddings DM, Smith LK, Spencer WA: Muscle testing: Part 2.Reliability in clinical use. Phys Ther Rev 1960; 41: 249–256.
58. Inman VT, Ralston HJ, Saunders JBDM, et al.: Relation ofhuman electromyogram to muscular tension. ElectroencephClin Neurophysiol 1952; 4: 187–194.
59. Kanehisa H, Ikegawa S, Fukunaga T: Force-velocity relation-ships and fatigability of strength and endurance-trained sub-jects. Int J Sports Med. 1997; 18: 106–112.
60. Katz B: The relation between force and speed in muscular con-traction. J Physiol 1939; 96: 45–64.
61. Kendall FP, McCreary EK, Provance PG: Muscle Testing andFunction. Baltimore: Williams & Wilkins, 1993.
62. Ketchum LD, Thompson D, Pocock G, Wallingford D: A clin-ical study of forces generated by the intrinsic muscles of theindex finger and the extrinsic flexor and extensor muscles ofthe hand. J Hand Surg [Am]. 1978; 3: 571–578.
63. Klein P, Mattys S, Rooze M: Moment arm length variations ofselected muscles acting on talocrural and subtalar joints duringmovement: an in vitro study. J Biomech 1996; 29: 21–30.
64. Klinge K, Magnusson SP, Simonsen EB, et al.: The effect ofstrength and flexibility training on skeletal muscle electromyo-graphic activity, stiffness, and viscoelastic stress relaxationresponse. Am J Sports Med. 1997; 25: 710–716.
64 Part I | BIOMECHANICAL PRINCIPLES
65. Klitgaard H, Mantoni M, Schiaffino S, et al.: Function, mor-phology and protein expression of ageing skeletal muscle: across-sectional study of elderly men with different trainingbackgrounds. Acta Physiol Scand. 1990; 140: 41–54.
66. Knapik JJ: Isokinetic, isometric and isotonic strength relation-ships. Arch Phys Med Rehabil 1983; 64: 77–80.
67. Knapik JJ, Wright JE, Mawdsley RH, Braun J: Isometric,isotonic, and isokinetic torque variations in four musclegroups through a range of joint motion. Phys Ther 1983;63: 938–947.
68. Koh TJ, Herzog W: Increasing the moment arm of the tibialisanterior induces structural and functional adaptation: implica-tions for tendon transfer. J Biomech 1998; 31: 593–599.
69. Koh TJ, Herzog W: Excursion is important in regulating sar-comere number in the growing rabbit tibialis anterior. J Physiol[Lond] 1998; 508: 267–280.
70. Komi PV: Relationship between muscle tension, EMG, andvelocity of contraction under concentric and eccentric work.In: New Developments in Electromyography and ClinicalNeurophysiology. Desmedt JE, ed. Basel: Karger, 1973;596–606.
71. Komi PV: Measurement of the force-velocity relationship inhuman muscle under concentric and eccentric contractions.Biomechanics III 1979; 224–229.
72. Krylow AM, Sandercock TG: Dynamic force responses of mus-cle involving eccentric contraction. J Biomech 1997; 30: 27–33.
73. Kuechle DK, Newman SR, Itoi E, et al.: Shoulder musclemoment arms during horizontal flexion and elevation. JShoulder Elbow Surg 1997; 6: 429–439.
74. Kulig K, Andrews JG, Hay JG: Human strength curves. ExercSports Sci Rev 1984; 12: 417–466.
75. Laforest S, St-Peirre DMM, Cyr J, Gayton D: Effects of ageand regular exercise on muscle strength and endurance. Eur JAppl Physiol 1990; 60: 104–111.
76. Larsson L, Grimby G, Karlsson J: Muscle strength and speedof movement in relation to age and muscle morphology. J ApplPhysiol 1979; 46: 451–456.
77. LeBlanc A, Gogia P, Schneider VS, et al.: Calf muscle area andstrength changes after 5 weeks of horizontal bed rest. Am JSports Med 1988; 16: 624–629.
78. Lieber RL: Skeletal Muscle Structure and Function:Implications for Rehabilitation and Sports Medicine. Baltimore:Williams & Wilkins, 1992.
79. Lieber RL, Boakes JL: Sarcomere length and joint kinematicsduring torque production in frog hindlimb. Am J Phys 1988;254: C759–C768.
80. Lieber RL, Friden J: Musculoskeletal balance of the humanwrist elucidated using intraoperative laser diffraction. JElectromyogr Kinesiol 1998; 8: 93–100.
81. Lieber RL, Jacobson MD, Fazeli BM, et al.: Architecture ofselected muscles of the arm and forearm: anatomy and impli-cations for tendon transfer. J Hand Surg [Am]. 1992; 17:787–798.
82. Lieber RL, Ljung B, Friden J: Intraoperative sarcomere lengthmeasurements reveal differential design of human wrist exten-sor muscles. J Exp Biol 1997; 200: 19–25.
83. Lieber RL, Ljung B, Friden J: Sarcomere length in wrist exten-sor muscles, changes may provide insights into the etiology ofchronic lateral epicondylitis. Acta Orthop Scand 1997; 68:249–254.
84. Lieber RL, Loren GJ, Friden J: In vivo measurement ofhuman wrist extensor muscle sarcomere length changes. JNeurophysiol. 1994; 71: 874–881.
85. Lindle RS, Metter EJ, Lynch NA, et al.: Age and gender com-parisons of muscle strength in 654 women and men aged20–93 yr. J Appl Physiol 1997; 83: 1581–1587.
86. Loren GJ, Lieber RL: Tendon biomechanical propertiesenhance human wrist muscle specialization. J Biomech 1995;28: 791–799.
87. Loren GJ, Shoemaker SD, Burkholder TJ, et al.: Human wristmotors: biomechanical design and application to tendon trans-fers. J Biomech 1996; 29: 331–342.
88. Loughna PT: Disuse and passive stretch cause rapid alter-ations in expression of developmental and adult contractileprotein genes in skeletal muscle. Development 1990; 109:217–223.
89. MacDougall JD, Elder GCB, Sale DG, et al.: Effects ofstrength training and immobilization on human muscle fibers.J Appl Physiol 1980; 43: 25–34.
90. Maclennan WJ, Hall MPR, Timithy JI, Robinson M: Is weak-ness in old age due to muscle wasting? Age Ageing 1980; 9:188–192.
91. Marshall RN, Mazur SM, Taylor NAS: Three-dimensional sur-faces for human muscle kinetics. Eur J Appl Physiol 1990; 61:263–270.
92. McCall GE, Byrnes WC, Dickinson A, et al.: Muscle fiberhypertrophy, hyperplasia, and capillary density in college menafter resistance training. J Appl Physiol 1996; 81: 2004–2012.
93. Miller AEJ, MacDougall JD, Tarnopolsky MA, Sale DG:Gender differences in strength and muscle fiber characteris-tics. Eur J Appl Physiol. 1993; 66: 254–262.
94. Milner-Brown HS, Stein RB, Yemm R: The orderly recruit-ment of human motor units during voluntary isometric con-tractions. J Physiol 1973; 230: 359–370.
95. Mizuno M, Secher NH, Quistorff B: 31P-NMR spectroscopy,rsEMG, and histochemical fiber types of human wrist flexormuscles. J Appl Physiol. 1994; 76: 531–538.
96. Moritani T: 1998 ISEK Congress Keynote Lecture: The use ofelectromyography in applied physiology. International Societyof Electrophysiology and Kinesiology. J Electromyogr Kinesiol.1998; 8: 363–381.
97. Moritani T, DeVries HA: Reexamination of the relationshipbetween the surface integrated electromyogram (IEMG) andforce of isometric contraction. Am J Phys Med. 1978; 57:263–277.
98. Moss CL: Comparison of the histochemical and contractileproperties of human gastrocnemius muscle. J Orthop SportsPhys Ther 1991; 13: 322–327.
99. Mulrow CD, Gerety MB, Kanten D, et al.: A randomized trialof physical rehabilitation for very frail nursing home residents.JAMA 1994; 271: 519–524.
100. Murphy AJ, Wilson GJ, Pryor JF, Newton RU: Isometricassessment of muscular function: the effect of joint angle. JAppl Biomech 1995; 11: 205–214.
101. Murray WM, Delp SL, Buchanan TS: Variation of musclemoment arms with elbow and forearm position. J Biomech1995; 28: 513–525.
102. Narici M: Human skeletal muscle architecture studied in vivoby non-invasive imaging techniques: functional significanceand applications. J Electromyogr Kinesiol 1999; 9: 97–103.
65Chapter 4 | BIOMECHANICS OF SKELETAL MUSCLE
103. Narici MV, Roi GS, Landoni L, et al.: Changes in force, cross-sectional area and neural activation during strength trainingand detraining of the human quadriceps. Eur J Appl Physiol.1989; 59: 310–319.
104. Neumann DA, Soderberg GL, Cook TM: Comparison of max-imal isometric hip abductor muscle torques between hip sides.Phys Ther 1988; 68: 496–502.
105. Olson VL, Smidt GL, Johnston RC: The maximum torque gen-erated by the eccentric, isometric, and concentric contractionsof the hip abductor muscles. Phys Ther 1972; 52: 149–158.
106. Osternig LR, Bates BT, James SL: Isokinetic and isometrictorque force relationships. Arch Phys Med Rehabil 1977; 58:254–257.
107. Payne VG, Morrow JR Jr, Johnson L, Dalton SN: Resistancetraining in children and youth: a meta-analysis. Res Q ExercSport 1997; 68: 80–88.
108. Powell PL, Roy RR, Kanim P, et al.: Predictability of skeletalmuscle tension from architectural determinations in guinea pighindlimbs. J Appl Physiol 1984; 57: 1715–1721.
109. Ralston HJ, Inman VT, Strait LA, Shaffrath MD: Mechanics ofhuman isolated voluntary muscle. Am J Phys 1947; 151:612–620.
110. Ralston HJ, Polissar MJ, Inman VT, et al.: Dynamic features ofhuman isolated voluntary muscle in isometric and free con-tractions. J Appl Physiol 1949; 1: 526–533.
111. Raschke U, Chaffin DB: Support for a linear length-tensionrelation of the torso extensor muscles: an investigation of thelength and velocity EMG-force relationships. J Biomech 1996;29: 1597–1604.
112. Rassier DE, MacIntosh BR, Herzog W: Length dependence ofactive force production in skeletal muscle. J Appl Physiol.1999; 86: 1445–1457.
113. Raty HP, Kujala U, Videman T, et al.: Associations of isometricand isoinertial trunk muscle strength measurements and lum-bar paraspinal muscle cross-sectional areas. J Spinal Disord1999; 12: 266–270.
114. Rogers KL, Berger RA: Motor-unit involvement and tensionduring maximum voluntary concentric, eccentric and isometriccontractions of elbow flexors. Med Sci Sports 1974; 6: 253–254.
115. Scelsi R, Marchetti C, Poggi P: Histochemical and ultrastruc-tural aspects of muscle vastus lateralis in sedentary old people(age 65–89). Acta Neuropathol 1980; 51: 99–105.
116. Seroussi RE, Pope MH: The relationship between trunk mus-cle electromyography and lifting moments in the sagittal andfrontal planes. J Biomech 1987; 20: 135–146.
117. Shephard RJ, Sidney KH: Exercise and aging. Exerc Sports SciRev 1978; 6: 1–57.
118. Shklar A, Dvir Z: Isokinetic strength relationships in shouldermuscles. Clin Biomech 1995; 10: 369–373.
119. Sirca A, Kostevc V: The fibre type composition of thoracic andlumbar paravertebral muscles in man. J Anat 1985; 141: 131–137.
120. Solomonow M, Baratta R, Shoji H, D’Ambrosia R: The EMG-force relationships of skeletal muscle; dependence on contrac-tion rate, and motor units control strategy. Electromyogr ClinNeurophysiol 1990; 30: 141–152.
121. Spoor C, Van Leeuwen J, Meskers C, et al.: Estimation ofinstantaneous moment arms of lower-leg muscles. J Biomech1990; 23: 1247–1259.
122. Stokes IAF, Moffroid M, Rush S, Haugh LD: EMG to torquerelationship in rectus abdominis muscle: results with repeatedtesting. Spine 1989; 14: 857–861.
123. Tabary JC, Tabary C, Tardieu C, et al.: Physiological and struc-tural changes in the cat’s soleus muscle due to immobilizationat different lengths by plaster casts. J Physiol 1972; 224:231–244.
124. Tesch PA, Dudley GA, Duvoisin MR, et al.: Force and EMGsignal patterns during repeated bouts of concentric or eccen-tric muscle actions. Acta Physiol Scand. 1990; 138: 263–271.
125. Thorstensson A, Grimby G, Karlsson J: Force-velocity relationsand fiber composition in human knee extensor muscles. J ApplPhysiol 1976; 40: 12–16.
126. Vogt R, Nix WA, Pfeifer B: Relationship between electrical andmechanical properties of motor units. J Neurol NeurosurgPsychiatry 1990; 53: 331–334.
127. Walker SM, Schrodt GR: I segment lengths and thin filamentperiods in skeletal muscle fibers of the rhesus monkey andhuman. Anat Rec 1974; 178: 63–81.
128. Webber S, Kriellaars D: Neuromuscular factors contributing toin vivo eccentric moment generation. J Appl Physiol. 1997; 83:40–45.
129. Welle S, Totterman S, Thornton C: Effect of age on musclehypertrophy induced by resistance training. J Gerontol A BiolSci Med Sci 1996; 51: M270–M275
130. Wickiewicz TL, Roy RR, Powell PL, Edgerton VR: Musclearchitecture of the human lower limb. Clin Orthop 1983; 179:275–283.
131. Wilkie DR: The relation between force and velocity in humanmuscle. J Physiol 1950; 110: 249–286.
132. Williams M, Stutzman L: Strength variation through the rangeof joint motion. Phys Ther Rev 1959; 39: 145–152.
133. Williams P, Bannister L, Berry M, et al.: Gray’s Anatomy, TheAnatomical Basis of Medicine and Surgery, Br. ed. London:Churchill Livingstone, 1995.
134. Williams P, Kyberd P, Simpson H, et al.: The morphologicalbasis of increased stiffness of rabbit tibialis anterior musclesduring surgical limb-lengthening. J Anat 1998; 193: 131–138.
135. Wilson DL, Zhu Q, Duerk JL, et al.: Estimation of tendonmoment arms from three-dimensional magnetic resonanceimages. Ann Biomed Eng 1999; 27: 247–256.
136. Winters J, Stark L, Seif-Naraghi A: An analysis of the sourcesof musculoskeletal system impedance. J Biomech 1988; 21:12:1011–1025.
137. Yang H, Alnaqeeb M, Simpson H, Goldspink G: Changes inmuscle fibre type, muscle mass and IGF-I gene expression inrabbit skeletal muscle subjected to stretch. J Anat 1997; 190:613–622.
138. Zajac FE: How musculotendon architecture and joint geome-try affect the capacity of muscles to move and exert force onobjects: a review with application to arm and forearm tendontransfer design. J Hand Surg [Am]. 1992; 17: 799–804.