Embed Size (px)
Citation preview

BioMed CentralBioMedical Engineering OnLine
ss
Open AcceResearchSpectral clustering for TRUS imagesSamar S Mohamed and Magdy MA Salama*Address: E&CE Dept., University of Waterloo, Waterloo, Ontario, Canada
Email: Samar S Mohamed - [email protected]; Magdy MA Salama* - [email protected]
* Corresponding author
AbstractBackground: Identifying the location and the volume of the prostate is important for ultrasound-guided prostate brachytherapy. Prostate volume is also important for prostate cancer diagnosis.Manual outlining of the prostate border is able to determine the prostate volume accurately,however, it is time consuming and tedious. Therefore, a number of investigations have beendevoted to designing algorithms that are suitable for segmenting the prostate boundary inultrasound images. The most popular method is the deformable model (snakes), a method thatinvolves designing an energy function and then optimizing this function. The snakes algorithmusually requires either an initial contour or some points on the prostate boundary to be estimatedclose enough to the original boundary which is considered a drawback to this powerful method.
Methods: The proposed spectral clustering segmentation algorithm is built on a totally differentfoundation that doesn't involve any function design or optimization. It also doesn't need anycontour or any points on the boundary to be estimated. The proposed algorithm depends mainlyon graph theory techniques.
Results: Spectral clustering is used in this paper for both prostate gland segmentation from thebackground and internal gland segmentation. The obtained segmented images were compared tothe expert radiologist segmented images. The proposed algorithm obtained excellent glandsegmentation results with 93% average overlap areas. It is also able to internally segment the glandwhere the segmentation showed consistency with the cancerous regions identified by the expertradiologist.
Conclusion: The proposed spectral clustering segmentation algorithm obtained fast excellentestimates that can give rough prostate volume and location as well as internal gland segmentationwithout any user interaction.
1. BackgroundProstate disease has a foremost impact on the quality oflife of elderly men. Benign enlargement of the prostate fre-quently causes bladder outlet difficulty [1,2]. Malignantdiseases of the prostate are considered a significant causeof death. Moreover, there has been an increase in thereported prevalence of prostate cancer. This is believed to
be due to increased prostate awareness, prostate specificantigen (PSA) screening, and imaging techniques such asTransRectal UltraSound (TRUS).
Prostate Cancer is typically diagnosed by conduction abiopsy operation. Prostate Cancer diagnosis is usuallyaided by using TRUS images. This procedure is two mani-
Published: 15 March 2007
BioMedical Engineering OnLine 2007, 6:10 doi:10.1186/1475-925X-6-10
Received: 13 October 2006Accepted: 15 March 2007
This article is available from: http://www.biomedical-engineering-online.com/content/6/1/10
© 2007 Mohamed and Salama; licensee BioMed Central Ltd. This is an Open Access article distributed under the terms of the Creative Commons Attribution License (http://creativecommons.org/licenses/by/2.0), which permits unrestricted use, distribution, and reproduction in any medium, provided the original work is properly cited.
Page 1 of 13(page number not for citation purposes)
BioMedical Engineering OnLine 2007, 6:10 http://www.biomedical-engineering-online.com/content/6/1/10
fold, first the prostate boundary is detected, Second theprostate tissue should be segmented and/or classified todifferent regions. The work done in this paper focuses onthe TRUS image segmentation. The gland is first seg-mented from the background, second the outlined glandis further segmented into different regions.
The first segmentation process (prostate boundary seg-mentation from TRUS images) is crucial for some majorapplications in prostate disease decisions such as aidingdiagnosis [3,4] and treatment planning [5,6]. ProstateBrachtherapy involves accurately insertion of radioactivematerials (seeds) into the gland according to a predeter-mined plan [5] in which the gland location and boundaryshould be determined.
The purpose of the second segmentation process is mainlyComputer Aided Diagnosis (CAD). The internal segmen-tation process involves segmenting the prostate gland intoregions where different regions that represent different tis-sue textures in the gland are identified. The region seg-mentation highlights the different gland regions for eitherthe purpose of feature analysis, or to augment the radiol-ogist decision in highlighting the suspicious regions.
The internal segmentation system proposed in this papercan serve as a preprocessing stage for any CAD system. Inthe earlier work features were constructed for the wholeimage, where the whole image is divided into smallsquares and features are then constructed from each ofthose squares [7,8]. This is considered a time consumingprocess. Therefore internally segmenting the prostate andstudying only the highly suspicious regions is expected tobe more accurate and efficient.
The proposed segmentation method has a different foun-dation than the previously proposed segmentation sys-tems as it relies mainly on graph theory techniques. Onthe other hand, the older segmentation methods aremainly: edge base segmentation, texture based segmenta-tion and model based segmentation. Each of these meth-ods requires prior knowledge such as a seed point or threepoints on the boundary. In the proposed TRUS image seg-mentation method, spectral clustering treats the image asa weighted undirected graph and finds the segmentationresult by obtaining the minimum cut of this weightedgraph based on the graph theory methods without anyprior knowledge to either a seed point or any point on theboundary.
The TRUS images used in this work are obtained fromUniversity of Western Ontario and are derived from Aloka2000 ultrasound machine using a broadband 7 MHz lin-ear transducer and a field of view of approximately 6 cm.
A set of 29 radiologist identified TRUS images were usedfor this study.
2. Related workThe prostate boundaries are typically identified fromTRUS images. Although manual outlining of the prostateborder enables the prostate volume to be determinedaccurately [9], it is time consuming and tiresome. Moreo-ver, since, in TRUS images' quality is not very good, there-fore, traditional edge detectors are unable to extract thecorrect boundaries. Therefore, a number of investigationshave been devoted to design automatic or semi-automaticmethods that are suitable for segmenting the prostateboundary from ultrasound images.
A segmentation method that depends on clustering eachpixel of an ultrasound image was introduced in [10]. Inthis method, along with the relative position of the pixel,four energy measures were used to determine the clusterthat the pixel belongs to. A drawback of this method isthat the number of clusters is not predictable for a partic-ular image; therefore, the prostate might be representedby disconnected regions.
Artificial Neural Networks (ANNs) was also introduced asa method for prostate segmentation in transrectal ultra-sound images [11]. This method segments images to pros-tate and non-prostate regions. Three neural networkarchitectures have been proposed. This method needs lotsof training data in order to train the ANN; moreover thetraining process is lengthy and computationally expen-sive.
Active contours were introduced in [12] and are used sincethen as one of the main methods for prostate boundarydetection. The active contours model is used in [13] forprostate boundary detection where constraints wereimposed on the model's deformation according to a pre-defined model shape. In this method, one-dimensionalwavelet transform was applied on the radial function ofboth the prior model and the deformed model. While itwas demonstrated that this method detected the prostateboundary accurately for typical gland shapes, the depend-ence of the statistically derived prior model has limited itsability to segment the prostate with atypical shape.
In an attempt to enhance the active contours method acubic spline interpolation technique was used in [14] toidentify an initial contour based on four user-definedpoints. Then, Lobregt's discrete dynamic contour (DDC)model [15] was used to refine the boundary. This methodwas shown to be effective if the initial contour wasdefined accurately, however, the result was less satisfac-tory for segmenting an irregular boundary that could notbe accurately approximated by the initial contour, and
Page 2 of 13(page number not for citation purposes)

BioMedical Engineering OnLine 2007, 6:10 http://www.biomedical-engineering-online.com/content/6/1/10
further human intervention was required under this con-dition.
Another semi-automatic segmentation algorithm basedon the dyadic wavelet transform and the discrete dynamiccontours was used in [16]. In this method first a splineinterpolation is used to determine the initial contourbased on four user-defined initial points. Then the dis-crete dynamic contour refines the initial contour based onthe approximate coefficients and the wavelet coefficientsgenerated using the dyadic wavelet transform. A selectionrule is used as well to choose the best contour.
A common deformable model was also used in [17] tosegment the prostate in transrectal ultrasound images. Thenew enhancement was the use of a Gabor filter bank inboth multiple scales and multiple orientations to charac-terize the prostate boundaries. The Gabor features arethen reconstructed to be invariant to the rotation of theultrasound probe. Then, the segmentation is obtained byminimizing the energy function of the prostate shapemodel. The model focuses on the similarity of differentGabor features at different deformation stages using amultiresolution technique.
Another deformable models based research presented anapproach where model initialization and constrainingmodel evolution are based on prior knowledge about theprostate shape [18]. The prostate shape has been modeledusing deformable superellipses.
Deformable models were also used in [19] for automaticsegmentation of trans-abdominal ultrasound images ofthe prostate. In this method a filter is used to enhance thecontours without changing the information in the image.Adaptive morphological and median filtering areemployed to detect the noise-containing regions andsmooth these areas. Then a heuristic optimization algo-rithm begins to search for the contour initialized from aprostate model.
All the active contours based methods depend mainly onthe initial points set by the user as well as the initial con-tour generation. Most of the research is focused on chang-ing the number of initial points or changing the methodused to obtain the initial contour. Optimizing the energyfunction is also an area of research using the active con-tour method.
Another segmentation technique to extract prostate con-tours from Transrectal Ultrasound images using Sticks fil-ter to reduce the speckle was proposed in [21]. Equi-spaced radii were then projected from an arbitrary seedpoint inside the prostate cavity towards its boundary.Candidate edge points are then obtained along each
radius which include the edge points and some falsepoints. This approach is dependent on the choice of theseed point which might mislead the prostate contourextraction method.
The sticks method was used in another algorithm for pros-tate boundary detection in [20]. The algorithm providesprostate edge detection as a visual guide to the observerusing edge delineation. It is then followed by manual edit-ing. This edge detection algorithm contains three stages.First, the sticks algorithm is used to enhance contrast andreduce speckle in the image. Second, the resulting imageis smoothed using an anisotropic diffusion filter. Finally,some basic prior knowledge of the prostate, such as shapeand echo pattern, is used to detect the most probableedges which indicate the prostate shape. In the last stage,the information is then integrated by using a manual link-ing procedure on the detected edges. The drawback of thismethod is that it depends on prior knowledge of someprostate features, a limitation that makes it limited to typ-ical prostate gland shapes and echo patterns. Moreover itneeds manual editing at the final stage to obtain the pros-tate boundaries.
Most of the above-mentioned methods depended on sta-tistical estimation for initialization and some of these ini-tialization methods were not accurate enough [17]. Someother methods depend on choosing the right seed point,otherwise the algorithm will not converge to the rightboundary. While all the above methods depend on solv-ing optimization problems that are parameter sensitiveand time consuming.
Generally, prostate segmentation methods have limita-tions when the image contains shadows with similar graylevel and texture attached to the prostate. In these casesthe segmentation error may increase considerably.Another problem may be the lack of sufficient number oftraining images if a learning technique is used. Algorithmsbased on active contours have been quite successfullyimplemented with the major drawback that they dependon user interaction to determine the seed points or the ini-tial snake.
Based on the previous literature review of the existingmethods, a new approach should ideally be:
• Independent on user interaction as user interaction (e.g.defining seed points or initial contours) has drawbackssuch as time consumption, human error etc.
• Independent on training images where training imagesis typically difficult to obtain, especially if the samplesshould be prepared by an expert. Hence, sample-basedlearning should be avoided.
Page 3 of 13(page number not for citation purposes)
BioMedical Engineering OnLine 2007, 6:10 http://www.biomedical-engineering-online.com/content/6/1/10
• Independent on noise level where the approach must berobust with respect to the presence of noise and shadow.
The proposed segmentation algorithm in this paper has atotally different basis as it doesn't depend on the inheritedsnakes' algorithm. This will get rid of designing the energyfunction, optimizing it and accurately selecting the seedpoints or initial contour points.
3. Spectral clusteringThe Human Visual System (HVS) can effectively identifyobjects in a scene and can often segment the scene tocoherent segments or clusters. There has been a tremen-dous amount of research done to achieve the same level ofperformance obtained by the HVS. Various methods havebeen introduced in literature to segment ultrasoundimages such as Kalman filters [21] and statistical shapemodels in which the prostate is segmented from the back-ground in order to determine the gland volume. Howevermost of these methods require large amount of humaninteraction. The Gabor filters were introduced in this fieldas a method to internally segment the prostate gland thatwas already manually segmented from the background[22] in which a Gabor filter was designed to automaticallyand accurately segment the TRUS images.
Spectral Clustering methods are applied in this paper inorder to give a fast segmentation results that don't requireeither filter design or any human interaction. SpectralClustering have been introduced for data clustering andwas applied in different fields. The spectral clustering usu-ally represents the data by a weighted graph and the eigen-vectors of the affinity (or similarity) matrix of this graphare used for the segmentation [23]. In the problem ofimage segmentation the image pixels are considered as thedata points as shown in [24].
3.1. Graph based image segmentationGiven an image I, a graph G = (V, E, W) is constructed withthe pixels represented by the graph nodes V, and the pixelswithin a distance V ≤ Gr are connected by a graph edge E.The weight W(i, j) measures the likelihood of pixel i and jbeing in the same cluster. Partitioning of this graph repre-sents the image segmentation [24-26].
Assigning weights to graph edgesThe pair-wise pixel affinity graph determines the segmen-tation accuracy. Therefore, as recommended in [25] twosimple local grouping cues are used which are the inten-sity and contours.
1. Grey Level Intensity: neighboring pixels with closeintensity are most likely to be in the same region.
Where Xi and Ii represent pixel location and intensity.
Connecting pixels considering only intensity and locationusually gives bad segmentation due to the texture that ispresent in the TRUS images. Therefore the principal imagecontours (edges) are also considered for the segmentationof TRUS images.
2. Dominant Contours: the image edges are considereduseful when the neighboring regions have the same cutter.The affinity between two pixels is calculated by measuringthe image edges between them.
Where line(i, j) is a straight line joining pixels i and j andEdge(x) is the edge strength at location(x).
The two cues are combined in this work in the form:
Spectral clustering segmentation algorithmsIn [26], a clustering algorithm based on thresholding thelargest eigenvector of the affinity matrix was suggested.While in [27] the authors have argued for using a totallydifferent eigenvector for solving these types of segmenta-tion problems. Rather than examining the first eigenvec-tor of W they examined the generalized eigenvectors. LetD be the degree matrix of W:
The generalized eigenvector yi is a solution to:
(D — W)yi = λiDyi (5)
Solving the generalized eigenvector minimizes the Ncutwhich in turn produce the optimum segmentation asproved in [24]. In this case the generalized eigenvectorcorresponding to the second smallest eigenvalue wasused. Thresholding this second eigenvector to obtain thesegmentation result was suggested. This method isadopted for the application of TRUS image segmentationand it yields to a segmentation that minimizes the nor-malized cut:
W i j ei
X X I Ii j
x
i j
I( , ) = ( )−
−−
−2 2
1σ σ
W i j eCEdge xx line i j c( , )
max ( ) /( , )= ( )− ∈2
2σ
W i j W i j W i jI C C( , ) ( , ) ( , )× + ( )α 3
D i i W i jj
( , ) ( , )= ( )∑ 4
Page 4 of 13(page number not for citation purposes)

BioMedical Engineering OnLine 2007, 6:10 http://www.biomedical-engineering-online.com/content/6/1/10
where: A ∪ B = V and A ∩ B = 0,
and
Therefore the solution to the segmentation problem min-imizes the affinity between groups normalized by theaffinity within the same group. In this work, the spectralclustering is used for the first time for TRUS image seg-mentation using the approach proposed in [27].
4. Proposed lgorithm implementationThe segmentation proposed algorithm is composed of thefollowing steps:
1. The edge map of the TRUS image is obtained usingCanny edge detection method
2. The Affinity matrix is created using equation 3.
3. The eigenvectors are calculated and reshaped to beshown in the figures.
4. Eigen vector Discretization: In the best case scenariothe second smallest eigenvector should take on two dis-crete values and the signs of the values can tell how to par-tition the graph. The second smallest eigenvectorobtained in our case is a continuous vector; therefore itneeds to be discretized in order to find a splitting point toobtain the clustering. In this work the splitting point thatminimizes Ncut that is shown in equation (6) is chosen.
5. Validation methodsIn the previous research that focuses on prostate boundarydetection, several validation measures were used[14,16,29] such as:
Distance δ = Average Euclidean distance (in pixels)between the algorithm-based segmentation and the man-ual segmentation. For each pixel the distance is defined asthe shortest Euclidean distance between that pixel and thepixels located on the other contour.
Area Difference AD :
where SManual is the area of the manual segmentation and
SAlgorithm is the area of the algorithm-based segmentation.
Area Overlap AO:
Since the main purpose of this paper is to introduce thenew method and prove its concepts, one validationmethod is used which is the AO. The AO can be consid-ered as a good representation for the algorithm success insegmenting the prostate as it measures the area of thegland that the algorithm could capture. The authors real-ize that more images are needed for the investigation to begeneralized.
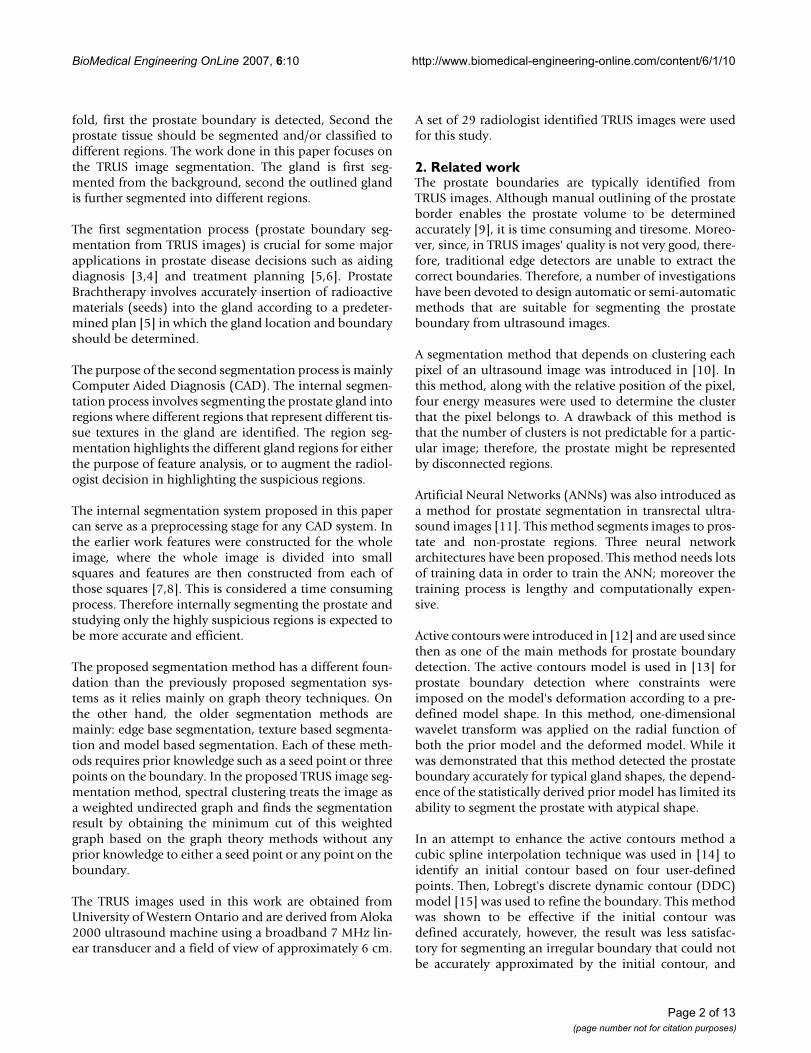
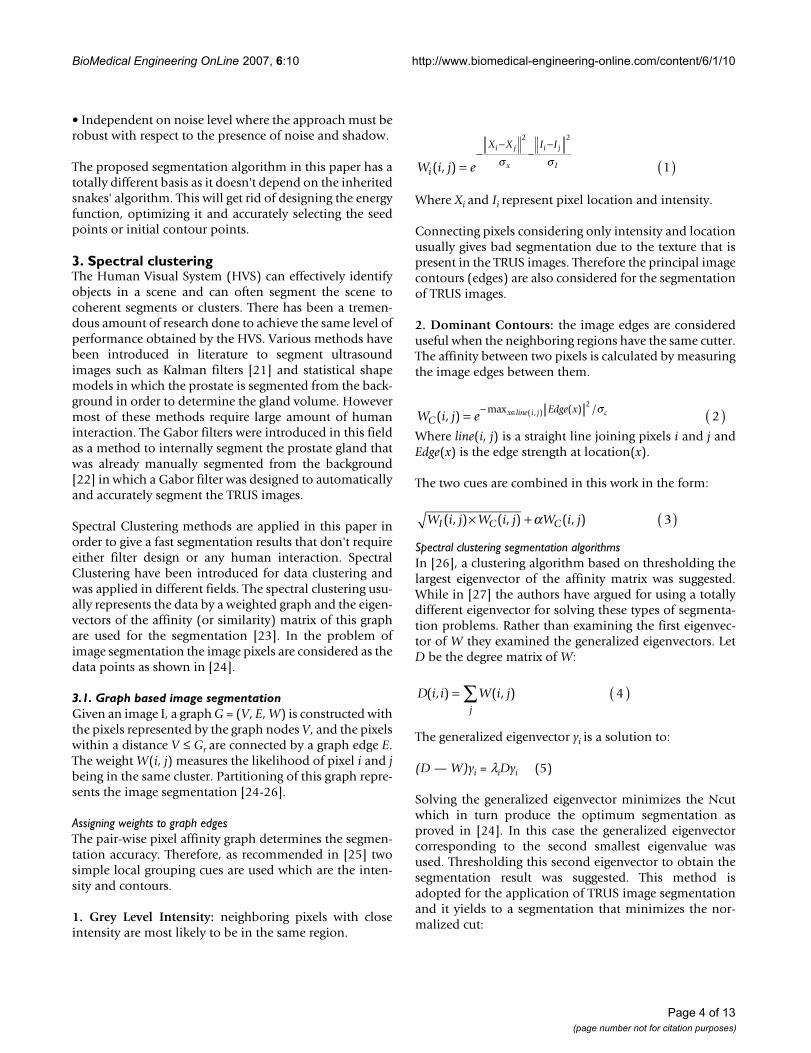
6. Experimental resultsIn this section, some results that show the correlationbetween the desired segmentation and the eigenvectors ofthe affinity matrix corresponding to TRUS images alreadysegmented (either from the background or into cancerousand non cancerous regions) by an expert radiologist.
6.1. Segmenting the prostate from the backgroundSpectral Clustering was applied for medical image seg-mentation only in one recent publication [28]. SpectralClustering was applied mainly to artificial ultrasoundimages and was then tested on a couple of ultrasoundimages obtained from vivo. Therefore more justificationneeds to be done to accept the algorithm results for pros-tate tissue classification and regions segmentation. Inorder to test the validity of applying the Spectral Cluster-ing for the TRUS image segmentation for the purpose oftissue classification and to ensure that the internal seg-mentation of the gland is acceptable, the algorithm isbeing tested in this work with a problem whose solutionis well defined. Therefore, Spectral Clustering is used tosegment the prostate gland from the background and theresults are compared to those obtained by the radiologist(considered better ground truth than recognizing the can-cerous regions). Twenty nine Prostate images are seg-mented from the background using the proposed SpectralClustering algorithm with high accuracy. The commonareas between the doctor's segmented images and thespectral clustering segmented images are obtained and theaverage area for all images is 93%. The results are shownin the following figures where Figure 1 shows the originalimage, the radiologist's map and the second eigenvectorreshaped to an image, which shows the high correlationbetween the radiologist mask and the second Eigen vector.Figure 2 shows all the obtained eigenvectors which showthat the second eigenvector is the most correlated onewith the desired segmentation. Figure 3 shows the pro-posed segmentation algorithm result. Figure 4 shows acomparison between the manually segmented prostateand the prostate segmented using the proposed algo-rithm.
Ncut A Bcut A B
asso A V
cut A B
asso B V( , )
( , )
( , )
( , )
( , )= + ( )6
cut A B W i ji A j B
( , ) ( , ),
=∈ ∈∑
asso A V W i ji Aj
( , ) ( , )=∈∑∑
ADS S
Smanual A orithm
manual= ∗
−100
lg
AOS AND S
S OR Smanual A orithm
manual A orithm= ∗100
lg
lg
Page 5 of 13(page number not for citation purposes)
BioMedical Engineering OnLine 2007, 6:10 http://www.biomedical-engineering-online.com/content/6/1/10
Page 6 of 13(page number not for citation purposes)
a) Original TRUS Image1, b) Manually Segmented, c)Second EigenvectorFigure 1a) Original TRUS Image1, b) Manually Segmented, c)Second Eigenvector.
a b c
All Obtained EigenvectorsFigure 2All Obtained Eigenvectors.
a) the obtained segmentation using the implemented algorithm, b) the contour map overlapped on the original TRUS imageFigure 3a) the obtained segmentation using the implemented algorithm, b) the contour map overlapped on the original TRUS image.
a b

BioMedical Engineering OnLine 2007, 6:10 http://www.biomedical-engineering-online.com/content/6/1/10
More segmentation results are shown in Figure 5, Figure 6,Figure 7, Figure 8, Figure 9 and Figure 10. More images areshown in Additional file 1. The overlap areas in all the seg-mented images prove the high accuracy in segmenting theprostate from the background regardless of the prostateshape, location and orientation. Therefore the SpectralClustering segmentation proved its excellent performancein segmenting the TRUS images. Therefore its results insegmenting the interior of the gland should be trusted aswell.
6.2. Internal regions segmentationThe spectral clustering image segmentation algorithm ismainly used in this work for internal gland segmentation.However it was applied in the previous subsection for theprostate gland segmentation from the TRUS image and itobtained high segmentation accuracy which proves itscapability of dealing with TRUS images effectively. There-fore, it is used in this sub-section for ROI (Region of Inter-est) segmentation from the manually segmented prostate.
The proposed algorithm in this work is faster than theGabor multi-resolution analysis that was used earlier forprostate ROI identification [12] on the expense of givinga rough estimate of the internal segmentation than theearlier presented work. The algorithm proposed in this
paper can then be used for suspicious regions estimationin an online application. It can also be used to support thedecisions obtained using the feature analysis methodsespecially if the later contradicts the radiologist's decision.
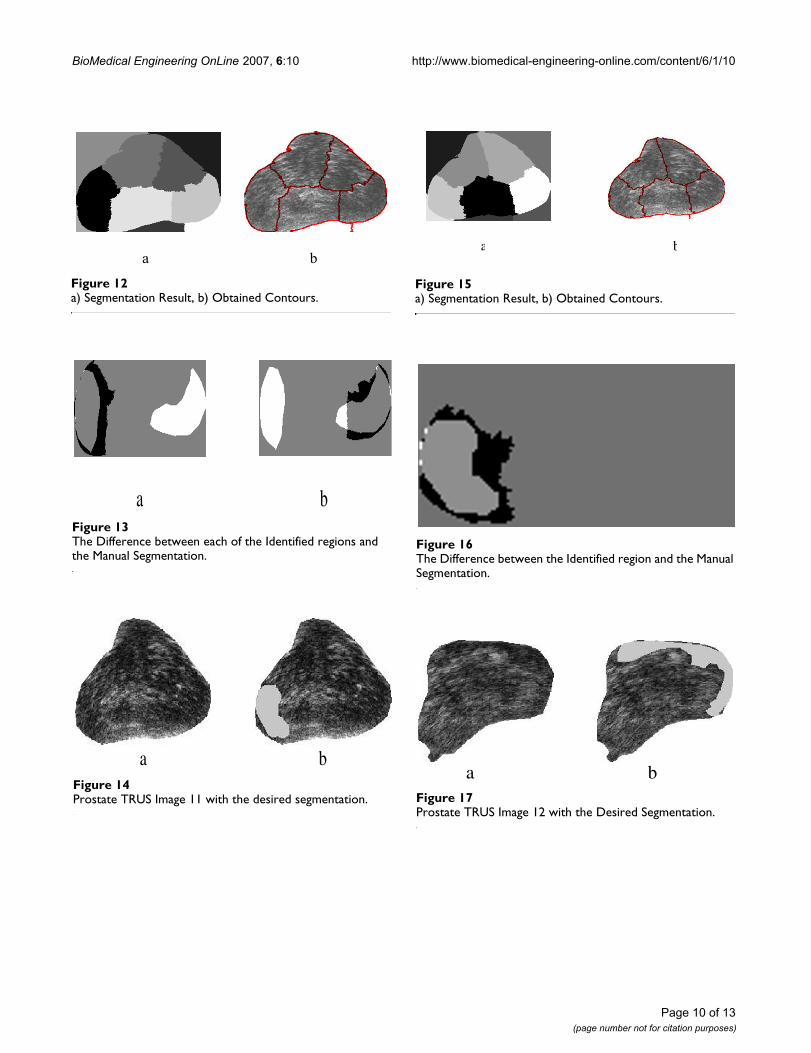
Typical prostate shapeThe proposed spectral algorithm was successful for captur-ing the suspicious cancerous regions from the TRUSimages with typical prostate shape. The original gland, thecorresponding doctor's segmentation and the correspond-ing regions contours are shown in Figure 11, 12 and 13,and another example is shown in 14, 15 and 16. Theresults show that the algorithm was successful in identify-ing the doctor's suspicious regions in the typical gland.The proposed Spectral Clustering algorithm did capturethe information that was hidden from the radiologist'sdecision and can't be seen by the naked eye which con-firms and supports the decision of the recognition meth-ods explained earlier in the thesis. Therefore, it can beconcluded that the Spectral Clustering algorithm recog-nized regions that were missed by the radiologist, yet stillcarry the same information of the radiologist identifiedregions which proves the superiority of the proposed algo-rithm.
Original TRUS Image2, Manually Segmented, Second EigenvectorFigure 5Original TRUS Image2, Manually Segmented, Second Eigenvector.
a b c
a) Manual Segmentation, b) Spectral Clustering Segmentation, c) overlap (92.86%)Figure 4a) Manual Segmentation, b) Spectral Clustering Segmentation, c) overlap (92.86%).
a b c
Page 7 of 13(page number not for citation purposes)
BioMedical Engineering OnLine 2007, 6:10 http://www.biomedical-engineering-online.com/content/6/1/10
Page 8 of 13(page number not for citation purposes)
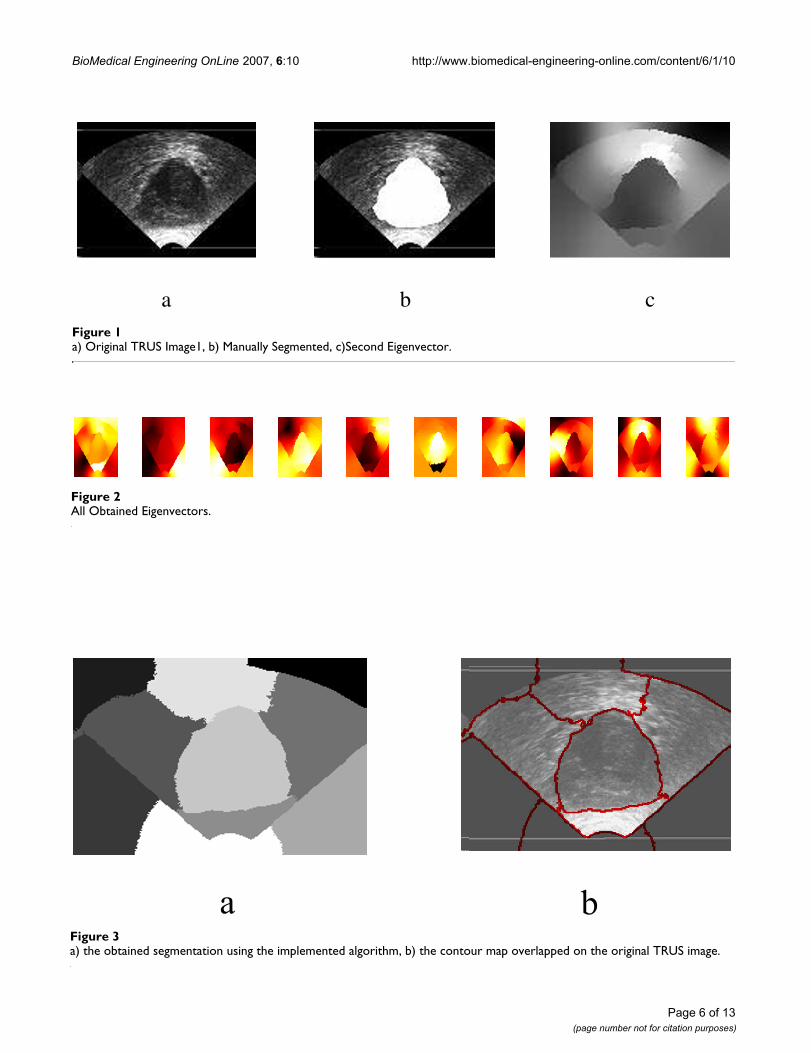
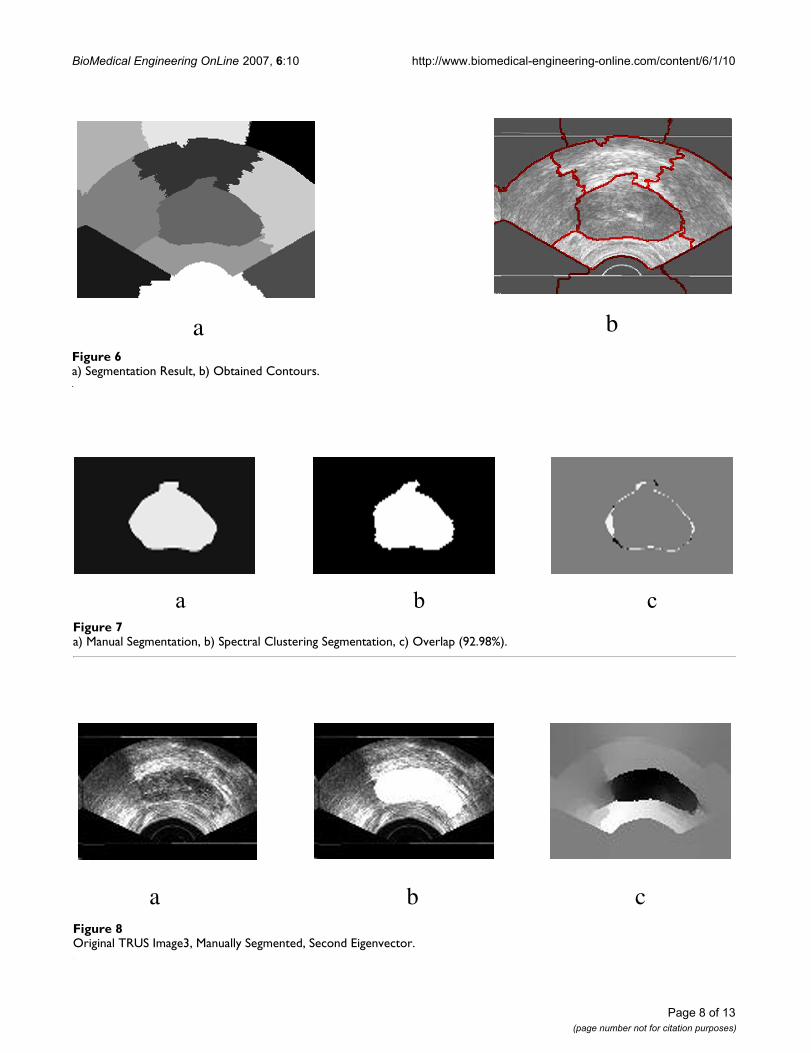
a) Manual Segmentation, b) Spectral Clustering Segmentation, c) Overlap (92.98%)Figure 7a) Manual Segmentation, b) Spectral Clustering Segmentation, c) Overlap (92.98%).
a b c
a) Segmentation Result, b) Obtained ContoursFigure 6a) Segmentation Result, b) Obtained Contours.
a b
Original TRUS Image3, Manually Segmented, Second EigenvectorFigure 8Original TRUS Image3, Manually Segmented, Second Eigenvector.
a b c

BioMedical Engineering OnLine 2007, 6:10 http://www.biomedical-engineering-online.com/content/6/1/10
Page 9 of 13(page number not for citation purposes)
a) Segmentation Result, b) Obtained ContoursFigure 9a) Segmentation Result, b) Obtained Contours.
a b
a) Manual Segmentation, b) Spectral Clustering Segmentation, c) Difference (93.03%)Figure 10a) Manual Segmentation, b) Spectral Clustering Segmentation, c) Difference (93.03%).
a b c
Prostate TRUS Image 10 with the desired segmentationFigure 11Prostate TRUS Image 10 with the desired segmentation.
a b
BioMedical Engineering OnLine 2007, 6:10 http://www.biomedical-engineering-online.com/content/6/1/10
Page 10 of 13(page number not for citation purposes)
a) Segmentation Result, b) Obtained ContoursFigure 15a) Segmentation Result, b) Obtained Contours.
a b
a) Segmentation Result, b) Obtained ContoursFigure 12a) Segmentation Result, b) Obtained Contours.
a
b
The Difference between each of the Identified regions and the Manual SegmentationFigure 13The Difference between each of the Identified regions and the Manual Segmentation.
a b
Prostate TRUS Image 11 with the desired segmentationFigure 14Prostate TRUS Image 11 with the desired segmentation.
a b
The Difference between the Identified region and the Manual SegmentationFigure 16The Difference between the Identified region and the Manual Segmentation.
Prostate TRUS Image 12 with the Desired SegmentationFigure 17Prostate TRUS Image 12 with the Desired Segmentation.
a b

BioMedical Engineering OnLine 2007, 6:10 http://www.biomedical-engineering-online.com/content/6/1/10
Page 11 of 13(page number not for citation purposes)
a) Segmentation Result, b) Obtained ContoursFigure 18a) Segmentation Result, b) Obtained Contours.
a b
Prostate TRUS Image 13 with the Desired SegmentationFigure 20Prostate TRUS Image 13 with the Desired Segmentation.
a b
a) Segmentation Result, b) Obtained ContoursFigure 21a) Segmentation Result, b) Obtained Contours.
a b
The Difference between the Identified region and the Manual SegmentationFigure 22The Difference between the Identified region and the Manual Segmentation.
The Difference between the Identified region and the Manual SegmentationFigure 19The Difference between the Identified region and the Manual Segmentation.

BioMedical Engineering OnLine 2007, 6:10 http://www.biomedical-engineering-online.com/content/6/1/10
Unusual prostate shapeThe spectral clustering algorithm also shows excellent seg-mentation even if the prostate shape is not the typicalshape. Another example of unusual prostate shapes isshown 17, 18 and 19. The last sample image and its corre-sponding segmentation is shown in 20, 21 and 22. Theproposed segmentation algorithm did capture a roughestimate of the suspicious regions and their location in thegland even in the atypical gland shape which is consideredconfusing for the registration algorithms. This proves theability of the algorithm to be used as a preliminary onlineestimate for the cancerous regions as well as a support forthe existing CAD methods that involve ROI identification.
7. DiscussionFrom the above results it is clear that the spectral cluster-ing can be used as a preliminary estimate for the cancer-ous regions during the imaging procedure. Moreover itcan be used as a support for the decision making either bythe radiologist or by the other CAD systems. It can alsoestimate the prostate volume, location and size from theTRUS image effectively. The second smallest eigenvectorproved to be consistent with the radiologist manual seg-mentation for the two different segmentation problemstackled in this paper
8. ConclusionIn this paper a novel technique is proposed to segment theprostate using TRUS images. The new strategy that is intro-duced in this work is based on the spectral clustering algo-rithm. Spectral clustering has the benefit of being built ona totally different foundation that doesn't include anycontour or seed point estimation. The proposed spectralclustering segmentation method is inspired from thegraph theory techniques. The idea of the spectral cluster-ing depends mainly on treating the image as a weightedgraph and searched for the minimum cut of that graph.This idea has a totally different prospective than the wellknown prostate segmentation methods such as thesnakes. The proposed spectral clustering segmentationmethod is accurate, simple to implement and doesn'tinvolve any energy functions to be built or optimized.From the results and analysis shown in this paper, it canbe concluded that spectral clustering can be considered asa new advance for prostate segmentation that proved itsability to accurately segment the gland from the back-ground for typical as well as atypical prostate shapes.Moreover, it is also clear from the results obtained in thiswork that the spectral clustering method is able to roughlysegment the cancerous regions that proved consistencywith the regions identified by the doctor. The proposedmethod is able to recognize regions regardless of the pros-tate shape and the spatial location of the cancer within thegland.
In conclusion, the algorithm obtained fast excellent esti-mates that can give rough prostate volume as well as can-cerous regions segmentation which can be used for onlineapplication.
Additional material
References1. Lee C, Kozlowski JM, Grayhack JT: "Etiology of benign prostatic
hyperplasia". Urol Clin North Amer 1995, 22:237-246.2. Barry MJ: "The epidemiology and natural history of benign
prostatic hyperplasia". Curr Opin Urol 1994, 4:3-6.3. Catalona WJ, Beiser JA, Smith DS: "Serum free prostate specific
antigen and prostate specific antigen density measurementsfor predicting cancer in men with prior negative prostaticbiopsies". J Urol 2167, 158:2162-1997.
4. Presti JC Jr, Hovey R, Bhargava V, Carroll PR, Shinohara K, Moul JW:"Prospective evaluation of prostate specific antigen andprostate specific antigen density in detection of carcinoma ofprostate: ethnic variations". J Urol 1997, 157:907-912.
5. Grimm PD, Blasko JC, Ragde H, Sylvester J, Clarke D: "Does brach-ytherapy have a role in the treatment of prostate cancer".Hemat Oncol Clin North Amer 1996, 10:653-673.
6. Hill CR, ter Haar GR: "High intensity focused ultrasound poten-tial for cancer treatment". Br J Radiol 1303, 68:1296-1995.
7. Bassat O, Sun Z, Mestas JL, Gimenez G: "Texture Analysis OfUltrasound Images of the Prostate By Means of Co-occur-rence Matrices". Ultrasonic Imaging 1993, 15:218-237.
8. Ulrich Scheipers, Helmut Ermert, Hans-Joerg Sommerfeld, MiguelGarcia-Schürmann: "Ultrasonic multifeature tissue characteri-zation for prostate diagnostics". Ultrasound in Medicine and Biol-ogy 2003, 29(8):1137-1149.
9. Tong S, Cardinal HN, Downey DB, Fenster A: Analysis of linear,area, and volume distortion in 3D ultrasound imaging. Ultra-sound Med Biol 1998, 24:355-73.
10. Richard WD, Keen CG: Automated texture-based segmenta-tion of ultrasound images of the prostate. Computerized MedicalImaging and Graphics 1996, 20(3):131-140.
11. Prater JS, Richard WD: Segmenting ultrasound images of theprostrate using neural networks. Ultrasound Imaging 1992,14:159-185.
12. Kass M, Witkin A, Terzopoulos D: "Snakes: active contour mod-els". Int J Comput Vision 1987, 1:321-331.
13. Knoll C, Alcaniz M, Grau V, Monserrat C, Juan MC: "Outlining ofthe prostate using snakes with shape restrictions based onthe wavelet transform". Pattern Recognition 1999, 32:1767-1781.
14. Ladak HM, Mao F, Wang Y, Downey DB, Steinman DA, Fenster A:Prostate boundary segmentation from 2D ultrasoundimages. Medical Physics 2000, 27:1777-1788.
15. Lobregt S, Viergever M: A discrete dynamic contour model.IEEE Trans Med Imaging 1995, 14:12-24.
16. Bernard Chiu, George H Freeman, Salama MMA, Aaron Fenster:"Prostate segmentation algorithm using dyadic wavelettransform and discrete dynamic contour". Phys Med Biol49(21):4943-4960. 7 November 2004
17. Shen D, Zhan Y, Davatzikos C: "Segmentation of the prostateboundaries from ultrasound images using statistical shapemodel". IEEE Transactions on Medical Imaging 22(2003):539-551.
18. Gong L, Pathak SD, Haynor DR, Cho PS, Kim Y: Parametric ShapeModeling Using Deformable Superellipses for Prostate Seg-
Additional file 1Appendix 1. The file contains some of the resulting segmented prostate glands from the TRUS images as well as their manually segmented coun-terparts.Click here for file[http://www.biomedcentral.com/content/supplementary/1475-925X-6-10-S1.doc]
Page 12 of 13(page number not for citation purposes)

BioMedical Engineering OnLine 2007, 6:10 http://www.biomedical-engineering-online.com/content/6/1/10
mentation. IEEE Transactions on Medical Imaging 2004,23(3):340-349.
19. Betrounia N, Vermandela M, Pasquierc D, Maoucheb S, Rousseaua J:Segmentation of abdominal ultrasound images of the pros-tate using a priori information and an adapted noise filter.Computerized Medical Imaging and Graphics 2005, 29:43-51.
20. Pathak SD, Chalana V, Haynor DR, Kim Y: Edge-guided boundarydelineation in prostate ultrasound images. IEEE Transactions onMedical Imaging 2000, 19:1211-1219.
21. Abolmaesumi P, Sirouspour M: "An interacting multiple modelprobabilistic data association filter for cavity boundaryextraction from ultrasound images.". IEEE Transactions on Med-ical Imaging 23(2004):772-784.
22. Mohamed SS, Salama MMA, Kamel M, El-Sadaany EF, Rizkalla K, ChinJ: "Prostate cancer multi-feature analysis using TRUSimages". Physics in Medicine and Biology 50(15):N175-N185. 7August 2005
23. Ng AY, Jordan M, Weiss Y: "On spectral clustering: Analysis andan algorithm". In Advances in Neural Information Processing Systems14 MIT Press; 2002:849-856.
24. Shi J, Malik J: "Normalized cuts and image segmentation". IEEETransactions on Pattern Analysis and Machine Intelligence22(2000):888-905.
25. Timothee Cour, Florence Benezit, Jianbo Shi: "Spectral segmenta-tion with multiscale graph decomposition". IEEE InternationalConference on Computer Vision and Pattern Recognition (CVPR) 2005.
26. Perona P, Freeman WT: "A factorization approach to group-ing". Proc ECCV 1998:655-670.
27. Shi J, Malik J: "Normalized cuts and image segmentation". IEEEConf. on Computer Vision and Pattern Recognition 1997:731-737.
28. Archip N, Rohling R, Cooperberg P, Tahmasebpour H, Warfield SK:"Spectral Clustering Algorithms for Ultrasound Image Seg-mentation". MICCAI, LNCS 3750 2005:862-869.
29. Sahba Farhang, Tizhoosh Hamid R, Salama Magdy M: A coarse-to-fine approach to prostate boundary segmentation in ultra-sound images. BioMedical Engineering OnLine 2005, 4(4):58.
Page 13 of 13(page number not for citation purposes)


![Gut Pathogens BioMed Central - Home - Springer · PDF fileBioMed Central Page 1 of 11 ... Gut Pathogens 2009, ... [BD], Sparks, MD) or on MRS agar (BD) at 37°C. Clostridium difficile](https://img.pdfslide.net/doc/110x75/5aa6df4c7f8b9ab8228b717b/gut-pathogens-biomed-central-home-springer-central-page-1-of-11-gut-pathogens.jpg)