Embed Size (px)
Citation preview
T
M
Ba
b
1
a
ARRA
KEEQHHS
1
ifitmceoa
r(
1h
Biomedical Signal Processing and Control 10 (2014) 108–116
Contents lists available at ScienceDirect
Biomedical Signal Processing and Control
jo ur nal homep age: www.elsev ier .com/ locate /bspc
echnical Note
atlab-based tool for ECG and HRV analysis
arbara Malia, Sara Zuljb, Ratko Magjarevicb, Damijan Miklavcica, Tomaz Jarma,∗
University of Ljubljana, Faculty of Electrical Engineering, Department of Biomedical Engineering, Trzaska 25, SI-1000 Ljubljana, SloveniaUniversity of Zagreb, Faculty of Electrical Engineering and Computing, Department of Electronic Systems and Information Processing, Unska 3,000 Zagreb, Croatia
r t i c l e i n f o
rticle history:eceived 9 July 2013eceived in revised form 6 January 2014ccepted 20 January 2014
eywords:lectroporation-based treatmentslectrocardiogram analysisRS detectioneartbeat classificationeart rate variabilityoftware tool
a b s t r a c t
Delivery of electroporation pulses in electroporation-based treatments could potentially induce heart-related effects. The objective of our work was to develop a software tool for electrocardiogram (ECG)analysis to facilitate detection of such effects in pre-selected ECG- or heart rate variability (HRV) param-eters.
Our software tool consists of five distinct modules for: (i) preprocessing; (ii) learning; (iii) detection andclassification; (iv) selection and verification; and (v) ECG and HRV analysis. Its key features are: automatedselection of ECG segments from ECG signal according to specific user-defined requirements (e.g., selectionof relatively noise-free ECG segments); automated detection of prominent heartbeat features, such as Q,R and T wave peak; automated classification of individual heartbeat as normal or abnormal; displayingof heartbeat annotations; quick manual screening of analyzed ECG signal; and manual correction ofannotation and classification errors.
The performance of the detection and classification module was evaluated on 19 two-hour-long ECGrecords from Long-Term ST database. On average, the QRS detection algorithm had high sensitivity(99.78%), high positive predictivity (99.98%) and low detection error rate (0.35%). The classificationalgorithm correctly classified 99.45% of all normal QRS complexes. For normal heartbeats, the positivepredictivity of 99.99% and classification error rate of 0.01% were achieved.
The software tool provides for reliable and effective detection and classification of heartbeats and for
calculation of ECG and HRV parameters. It will be used to clarify the issues concerning patient safetyduring the electroporation-based treatments used in clinical practice. Preventing the electroporationpulses from interfering with the heart is becoming increasingly important because new applicationsof electroporation-based treatments are being developed which are using endoscopic, percutaneous orsurgical means to access internal tumors or tissues and in which the target tissue can be located inimmediate vicinity to the heart.. Introduction
Electroporation is a phenomenon resulting in transient increasen the cell membrane permeability due to exposure to an electriceld during delivery of short, high-voltage electric pulses, i.e., elec-roporation pulses [1–4]. Increased membrane permeability allows
olecules with intracellular targets, which under physiologicalonditions cannot cross the cell membrane, to enter the cell and
xert their cytotoxicity [5]. Electroporation can be either reversibler irreversible, depending on electrical conditions and tissue char-cteristics, and both have been used in biomedical applications∗ Corresponding author. Tel.: +386 1 47 68 820; fax: +386 1 42 64 658.E-mail addresses: [email protected] (B. Mali), [email protected] (S. Zulj),
[email protected] (R. Magjarevic), [email protected]. Miklavcic), [email protected] (T. Jarm).
746-8094/$ – see front matter © 2014 Elsevier Ltd. All rights reserved.ttp://dx.doi.org/10.1016/j.bspc.2014.01.011
© 2014 Elsevier Ltd. All rights reserved.
[6–11]. These applications include electrochemotherapy [12–18],electrotransfer for gene therapy and DNA vaccination [19–24],transdermal drug delivery [25–29], cell electrofusion [30–34], andtissue ablation [35–39]. Electroporation is also used in biotechnol-ogy and other areas [11,40].
Some of electroporation-based treatments, like elec-trochemotherapy, gene electrotransfer for gene therapy andDNA vaccination and non-thermal irreversible electroporation, arebeing successfully introduced into clinical practice. But when elec-troporation pulses are applied to visceral or other internal tumorsand tissues there is an increased risk of inducing heart-relatedeffects, especially when the treatment area is in vicinity of theheart [15,38,41–48]. These heart-related effects can be detected by
analyzing electrocardiogram (ECG) signals recorded before, duringand after the therapy.A software tool for reliable and effective analysis of poten-tial side-effects of electroporation pulses on ECG or heart rate
B. Mali et al. / Biomedical Signal Processing and Control 10 (2014) 108–116 109
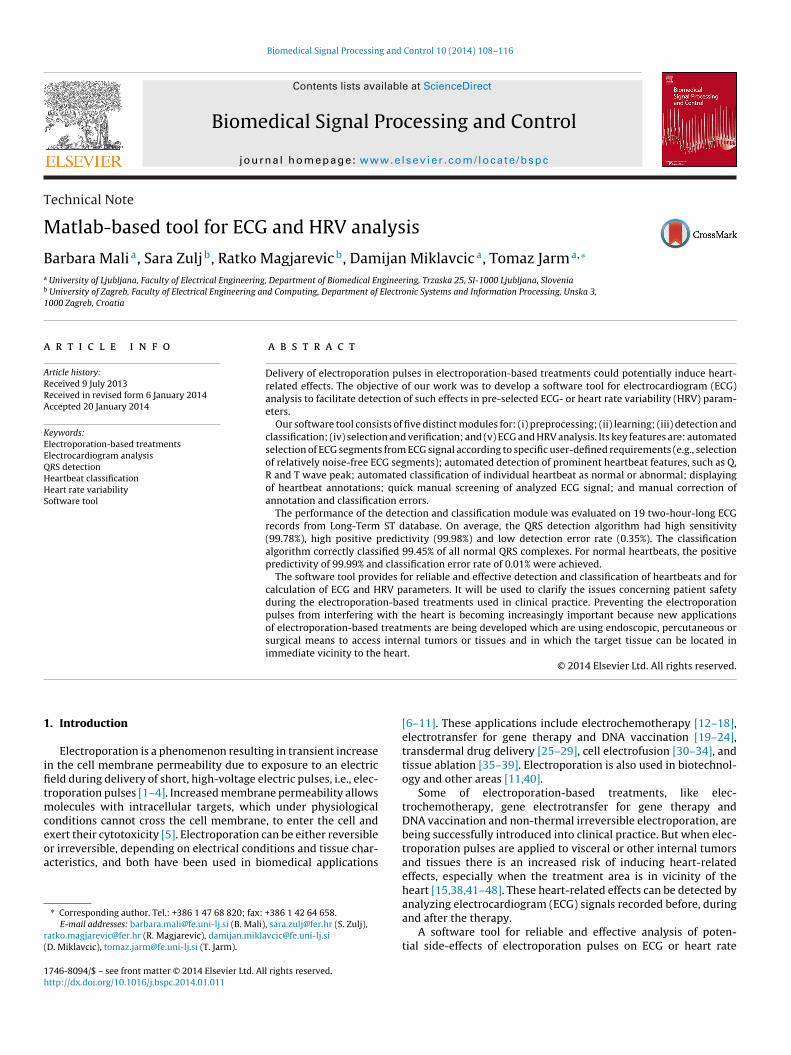
F ing; (E
vsihcdsfebTt
2
2
psspfinapvTp
2
birsmpw
2
td
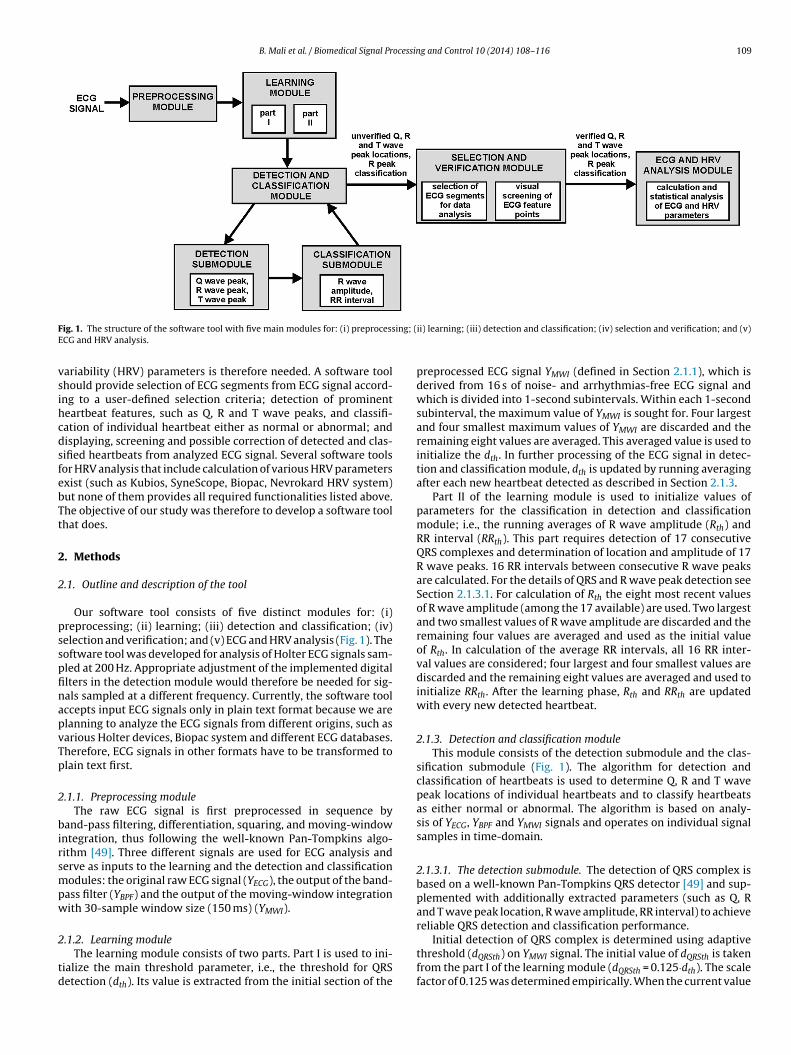
ig. 1. The structure of the software tool with five main modules for: (i) preprocessCG and HRV analysis.
ariability (HRV) parameters is therefore needed. A software toolhould provide selection of ECG segments from ECG signal accord-ng to a user-defined selection criteria; detection of prominenteartbeat features, such as Q, R and T wave peaks, and classifi-ation of individual heartbeat either as normal or abnormal; andisplaying, screening and possible correction of detected and clas-ified heartbeats from analyzed ECG signal. Several software toolsor HRV analysis that include calculation of various HRV parametersxist (such as Kubios, SyneScope, Biopac, Nevrokard HRV system)ut none of them provides all required functionalities listed above.he objective of our study was therefore to develop a software toolhat does.
. Methods
.1. Outline and description of the tool
Our software tool consists of five distinct modules for: (i)reprocessing; (ii) learning; (iii) detection and classification; (iv)election and verification; and (v) ECG and HRV analysis (Fig. 1). Theoftware tool was developed for analysis of Holter ECG signals sam-led at 200 Hz. Appropriate adjustment of the implemented digitallters in the detection module would therefore be needed for sig-als sampled at a different frequency. Currently, the software toolccepts input ECG signals only in plain text format because we arelanning to analyze the ECG signals from different origins, such asarious Holter devices, Biopac system and different ECG databases.herefore, ECG signals in other formats have to be transformed tolain text first.
.1.1. Preprocessing moduleThe raw ECG signal is first preprocessed in sequence by
and-pass filtering, differentiation, squaring, and moving-windowntegration, thus following the well-known Pan-Tompkins algo-ithm [49]. Three different signals are used for ECG analysis anderve as inputs to the learning and the detection and classificationodules: the original raw ECG signal (YECG), the output of the band-
ass filter (YBPF) and the output of the moving-window integrationith 30-sample window size (150 ms) (YMWI).
.1.2. Learning moduleThe learning module consists of two parts. Part I is used to ini-
ialize the main threshold parameter, i.e., the threshold for QRSetection (dth). Its value is extracted from the initial section of the
ii) learning; (iii) detection and classification; (iv) selection and verification; and (v)
preprocessed ECG signal YMWI (defined in Section 2.1.1), which isderived from 16 s of noise- and arrhythmias-free ECG signal andwhich is divided into 1-second subintervals. Within each 1-secondsubinterval, the maximum value of YMWI is sought for. Four largestand four smallest maximum values of YMWI are discarded and theremaining eight values are averaged. This averaged value is used toinitialize the dth. In further processing of the ECG signal in detec-tion and classification module, dth is updated by running averagingafter each new heartbeat detected as described in Section 2.1.3.
Part II of the learning module is used to initialize values ofparameters for the classification in detection and classificationmodule; i.e., the running averages of R wave amplitude (Rth) andRR interval (RRth). This part requires detection of 17 consecutiveQRS complexes and determination of location and amplitude of 17R wave peaks. 16 RR intervals between consecutive R wave peaksare calculated. For the details of QRS and R wave peak detection seeSection 2.1.3.1. For calculation of Rth the eight most recent valuesof R wave amplitude (among the 17 available) are used. Two largestand two smallest values of R wave amplitude are discarded and theremaining four values are averaged and used as the initial valueof Rth. In calculation of the average RR intervals, all 16 RR inter-val values are considered; four largest and four smallest values arediscarded and the remaining eight values are averaged and used toinitialize RRth. After the learning phase, Rth and RRth are updatedwith every new detected heartbeat.
2.1.3. Detection and classification moduleThis module consists of the detection submodule and the clas-
sification submodule (Fig. 1). The algorithm for detection andclassification of heartbeats is used to determine Q, R and T wavepeak locations of individual heartbeats and to classify heartbeatsas either normal or abnormal. The algorithm is based on analy-sis of YECG, YBPF and YMWI signals and operates on individual signalsamples in time-domain.
2.1.3.1. The detection submodule. The detection of QRS complex isbased on a well-known Pan-Tompkins QRS detector [49] and sup-plemented with additionally extracted parameters (such as Q, Rand T wave peak location, R wave amplitude, RR interval) to achievereliable QRS detection and classification performance.
Initial detection of QRS complex is determined using adaptivethreshold (dQRSth) on YMWI signal. The initial value of dQRSth is takenfrom the part I of the learning module (dQRSth = 0.125·dth). The scalefactor of 0.125 was determined empirically. When the current value

1 ocessing and Control 10 (2014) 108–116
omifm
fstwilmTpaTotdwwi
mccps5tmFdolopstta
tdeBs1ffsthtcto
2tbshtt
10 B. Mali et al. / Biomedical Signal Pr
f YMWI exceeded dQRSth, QRS complex was detected. The maxi-um value of YMWI within this QRS complex was determined and
ncluded in the running average of dQRSth, which consisted of theour most recent maximum values of YMWI detected from the four
ost recent QRS complexes.After finding the location of a QRS complex based on output
rom YMWI signal, the algorithm searches for R wave peak in YECGignal. The preprocessing of ECG signal introduces a delay in loca-ions of maxima (peaks) in YMWI signal relative to locations of Rave peaks in YECG signal, therefore, the search for an R wave peak
s performed up to 30 samples backwards from the correspondingocal maximum in YMWI signal (the interval of 30 samples was deter-
ined empirically and is valid for sampling frequency of 200 Hz).he search of R wave peak takes into account sharply concave mor-hology of the R wave around the R peak. A sequence of 5 positivend 3 negative or zero first derivatives are therefore sought for.he location of R wave peak is then determined as the locationf the sample from YECG signal with the maximum value amonghe samples from which the sequence of 5 positive and 3 negativeerivatives was derived. In the same way, the amplitude of the Rave peak is searched for from YBPF signal because baseline driftas eliminated from this signal and thus included more reliable
nformation about the R wave amplitude.After the location and amplitude of R wave peak are deter-
ined, location of Q wave peak is sought for. The Q wave peakorresponds to a minimum value of Q wave which typically hasonvex morphology. In order to reliably detect Q wave peak inresence of high-frequency noise frequently encountered in ECGignals, we first applied a 10th-order low-pass Butterwort filter on0-samples-long ECG segment from YECG signal backwards fromhe R wave peak location (the interval of 50 samples was deter-
ined empirically and is valid for sampling frequency of 200 Hz).rom this filtered segment, the algorithm then calculates the firsterivative backwards from the R wave peak until it finds a sequencef five successive samples among which the first (counted from theeft to the right) has either a negative or zero first derivative and thether four have a positive first derivative. The location of Q waveeak thus corresponds to either the first or the second of these fiveamples, i.e., to the sample with the minimal amplitude value. Ifhese criteria cannot be met within the 50-sample long segment,he location of the minimal value in this filtered segment is takens the location of Q wave peak.
Search for T wave peak location follows, taking into accountypically concave morphology of T wave. In order to reliablyetect T wave peak in presence of high-frequency noise frequentlyncountered in ECG signals, we first applied a 2nd-order low-passutterwort filter on a 120-samples-long ECG segment from YECGignal forwards from the R wave peak location (the interval of20 samples was determined empirically and is valid for samplingrequency of 200 Hz). The algorithm calculates the first derivativeorwards from the R wave peak until it finds six successive signalamples among which the first four have positive first derivative,he fifth has either a negative or zero first derivative, and the sixthas negative derivative. The location of T wave peak correspondso the sample with the maximal amplitude value. If these criteriaannot be fulfilled within the 120-sample segment, the location ofhe maximal value in this filtered segment is taken as the locationf T wave peak.
.1.3.2. The classification submodule. The most important charac-eristic of the classification submodule is its ability to distinguishetween normal and abnormal (i.e., abnormal heart rhythm or ECG
hape) heartbeats. The classification is made based on evaluation ofeart rhythm and amplitude of the R wave peak. For evaluation ofhe heart rhythm, the instantaneous RR interval (RR) is comparedo the running average of the last four normal RR intervals (RRth).Fig. 2. Classification of heartbeats based on values of RR interval and R wave ampli-tude.
Normal RR interval is determined as interval between two R wavesbelonging to normal heartbeats. The evaluation of the amplitude ofR wave peak is based on comparing the instantaneous amplitude ofR wave peak (R) to the running average of R wave amplitudes (Rth)of the last four normal heartbeats. The initial value of parametersRRth and Rth is taken from the part II of the learning module.
Classification of a current heartbeat as either normal or abnor-mal is performed by considering three conditions as shown in Fig. 2.First, if the value of the current RR interval (RR) is less than 85%of the average value RRth, the heartbeat is classified as abnormal,because it is considered to be too short for normal heart rhythm[50]. Second, if the current value of RR lies within 90–110% of RRth,the heartbeat is classified as normal. Third, if the current amplitudeof R wave peak (R) is within 60–130% of the average value Rth, theheartbeat is considered to be normal, otherwise it is considered tobe abnormal. The classification limits were previously empiricallydetermined [51,52].
These three classification conditions work well if values of RRthand Rth are regularly and correctly updated by dropping the oldestand including the newest RR interval or R wave amplitude respec-tively in the corresponding running average. RRth is updated if thevalue of the current RR is within 75–125% of the current RRth. Rthis updated with the current R wave amplitude if the value of Ris within 60–140% of the current Rth. The conditions for updat-ing are less strict than from the conditions used for classification(see Fig. 2) which allows the algorithm to adapt fast to changesin R wave amplitude and in heart rhythm. A special case occurswhen an individual heartbeat classified as abnormal is followed bya heartbeat classified as normal. In this case RRth is updated usingthe mean average value of the abnormal and the normal heartbeat,provided that this average is within the 90–110% range of the cur-rent RRth. This exception is important because more such sequences(an abnormal heartbeat followed by a normal one) appearing oneafter another (like in case of ventricular bigeminy) can lead to aslightly increased heart rate. So if these slightly shorter RR inter-vals were not used to update the RRth, the RRth could graduallybecome an inaccurate estimation of the heart rate and could leadto misclassification of normal heartbeats as abnormal.
2.1.4. Selection and verification module2.1.4.1. Selection of ECG segments for data analysis. In case of rela-tively long ECG signals (i.e., more than several hours long) it mightnot be necessary to analyze the entire ECG signal, as the analysisof only a selection of short segments from the original ECG signalmight be sufficient. In our software, the user can choose betweenmanual and automated selection of ECG segments for data anal-ysis. In the manual mode, the starting point and duration of ECG
segments that will be included into analysis can be selected man-ually. In automated mode, ECG segments for data analysis can beselected from original ECG signal by setting values of the follow-ing four selection parameters (criteria): the mean frequency of ECG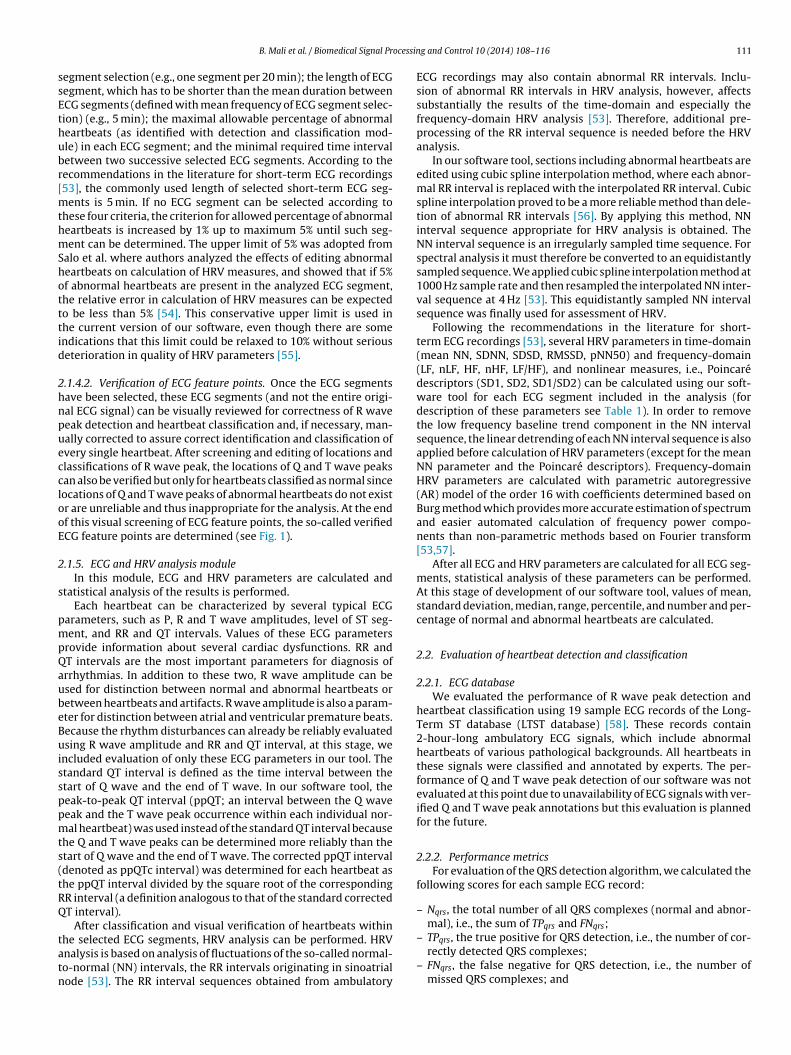
ocessin
ssEthubr[mthmShotttid
2hnpuecclooE
2
s
pmpQaubeBuissppmts(tRQ
tatn
B. Mali et al. / Biomedical Signal Pr
egment selection (e.g., one segment per 20 min); the length of ECGegment, which has to be shorter than the mean duration betweenCG segments (defined with mean frequency of ECG segment selec-ion) (e.g., 5 min); the maximal allowable percentage of abnormaleartbeats (as identified with detection and classification mod-le) in each ECG segment; and the minimal required time intervaletween two successive selected ECG segments. According to theecommendations in the literature for short-term ECG recordings53], the commonly used length of selected short-term ECG seg-
ents is 5 min. If no ECG segment can be selected according tohese four criteria, the criterion for allowed percentage of abnormaleartbeats is increased by 1% up to maximum 5% until such seg-ent can be determined. The upper limit of 5% was adopted from
alo et al. where authors analyzed the effects of editing abnormaleartbeats on calculation of HRV measures, and showed that if 5%f abnormal heartbeats are present in the analyzed ECG segment,he relative error in calculation of HRV measures can be expectedo be less than 5% [54]. This conservative upper limit is used inhe current version of our software, even though there are somendications that this limit could be relaxed to 10% without seriouseterioration in quality of HRV parameters [55].
.1.4.2. Verification of ECG feature points. Once the ECG segmentsave been selected, these ECG segments (and not the entire origi-al ECG signal) can be visually reviewed for correctness of R waveeak detection and heartbeat classification and, if necessary, man-ally corrected to assure correct identification and classification ofvery single heartbeat. After screening and editing of locations andlassifications of R wave peak, the locations of Q and T wave peaksan also be verified but only for heartbeats classified as normal sinceocations of Q and T wave peaks of abnormal heartbeats do not existr are unreliable and thus inappropriate for the analysis. At the endf this visual screening of ECG feature points, the so-called verifiedCG feature points are determined (see Fig. 1).
.1.5. ECG and HRV analysis moduleIn this module, ECG and HRV parameters are calculated and
tatistical analysis of the results is performed.Each heartbeat can be characterized by several typical ECG
arameters, such as P, R and T wave amplitudes, level of ST seg-ent, and RR and QT intervals. Values of these ECG parameters
rovide information about several cardiac dysfunctions. RR andT intervals are the most important parameters for diagnosis ofrrhythmias. In addition to these two, R wave amplitude can besed for distinction between normal and abnormal heartbeats oretween heartbeats and artifacts. R wave amplitude is also a param-ter for distinction between atrial and ventricular premature beats.ecause the rhythm disturbances can already be reliably evaluatedsing R wave amplitude and RR and QT interval, at this stage, we
ncluded evaluation of only these ECG parameters in our tool. Thetandard QT interval is defined as the time interval between thetart of Q wave and the end of T wave. In our software tool, theeak-to-peak QT interval (ppQT; an interval between the Q waveeak and the T wave peak occurrence within each individual nor-al heartbeat) was used instead of the standard QT interval because
he Q and T wave peaks can be determined more reliably than thetart of Q wave and the end of T wave. The corrected ppQT intervaldenoted as ppQTc interval) was determined for each heartbeat ashe ppQT interval divided by the square root of the correspondingR interval (a definition analogous to that of the standard correctedT interval).
After classification and visual verification of heartbeats within
he selected ECG segments, HRV analysis can be performed. HRVnalysis is based on analysis of fluctuations of the so-called normal-o-normal (NN) intervals, the RR intervals originating in sinoatrialode [53]. The RR interval sequences obtained from ambulatoryg and Control 10 (2014) 108–116 111
ECG recordings may also contain abnormal RR intervals. Inclu-sion of abnormal RR intervals in HRV analysis, however, affectssubstantially the results of the time-domain and especially thefrequency-domain HRV analysis [53]. Therefore, additional pre-processing of the RR interval sequence is needed before the HRVanalysis.
In our software tool, sections including abnormal heartbeats areedited using cubic spline interpolation method, where each abnor-mal RR interval is replaced with the interpolated RR interval. Cubicspline interpolation proved to be a more reliable method than dele-tion of abnormal RR intervals [56]. By applying this method, NNinterval sequence appropriate for HRV analysis is obtained. TheNN interval sequence is an irregularly sampled time sequence. Forspectral analysis it must therefore be converted to an equidistantlysampled sequence. We applied cubic spline interpolation method at1000 Hz sample rate and then resampled the interpolated NN inter-val sequence at 4 Hz [53]. This equidistantly sampled NN intervalsequence was finally used for assessment of HRV.
Following the recommendations in the literature for short-term ECG recordings [53], several HRV parameters in time-domain(mean NN, SDNN, SDSD, RMSSD, pNN50) and frequency-domain(LF, nLF, HF, nHF, LF/HF), and nonlinear measures, i.e., Poincarédescriptors (SD1, SD2, SD1/SD2) can be calculated using our soft-ware tool for each ECG segment included in the analysis (fordescription of these parameters see Table 1). In order to removethe low frequency baseline trend component in the NN intervalsequence, the linear detrending of each NN interval sequence is alsoapplied before calculation of HRV parameters (except for the meanNN parameter and the Poincaré descriptors). Frequency-domainHRV parameters are calculated with parametric autoregressive(AR) model of the order 16 with coefficients determined based onBurg method which provides more accurate estimation of spectrumand easier automated calculation of frequency power compo-nents than non-parametric methods based on Fourier transform[53,57].
After all ECG and HRV parameters are calculated for all ECG seg-ments, statistical analysis of these parameters can be performed.At this stage of development of our software tool, values of mean,standard deviation, median, range, percentile, and number and per-centage of normal and abnormal heartbeats are calculated.
2.2. Evaluation of heartbeat detection and classification
2.2.1. ECG databaseWe evaluated the performance of R wave peak detection and
heartbeat classification using 19 sample ECG records of the Long-Term ST database (LTST database) [58]. These records contain2-hour-long ambulatory ECG signals, which include abnormalheartbeats of various pathological backgrounds. All heartbeats inthese signals were classified and annotated by experts. The per-formance of Q and T wave peak detection of our software was notevaluated at this point due to unavailability of ECG signals with ver-ified Q and T wave peak annotations but this evaluation is plannedfor the future.
2.2.2. Performance metricsFor evaluation of the QRS detection algorithm, we calculated the
following scores for each sample ECG record:
– Nqrs, the total number of all QRS complexes (normal and abnor-mal), i.e., the sum of TPqrs and FNqrs;
– TPqrs, the true positive for QRS detection, i.e., the number of cor-rectly detected QRS complexes;
– FNqrs, the false negative for QRS detection, i.e., the number ofmissed QRS complexes; and
112 B. Mali et al. / Biomedical Signal Processin
Table 1ECG and HRV parameters currently included in our software tool.
Parameter Unit Description
ECG parametersRR ms Interval between two R wavesNN ms Interval between two R waves belonging to
normal heartbeats; normal-to-normal intervalR amplitude mV Amplitude of R waveppQT ms Peak-to-peak QT intervalppQTc ms1/2 Corrected ppQT interval (ppQT divided by the
square root of the corresponding RR interval)
Time-domain HRV parametersmean NN ms Mean of normal-to-normal (NN) intervalsSDNN ms Standard deviation of NN intervals; estimate of
overall HRVSDSD ms Standard deviation of differences between
adjacent NN intervals; estimate of short-termHRV; describes parasympathetic activity
RMSSD ms Square root of the mean of the sum of thesquares of differences between adjacent NNintervals; estimate of short-term HRV;describes parasympathetic activity
pNN50 % Number of pairs of adjacent NN intervalsdiffering by more than 50 ms divided by thetotal number of all NN intervals
Nonlinear HRV parametersSD1 ms Standard deviation of the Poincaré plot
perpendicular to line-of-identity; shortestdiameter of the fitted ellipse; estimate ofshort-term HRV; describes parasympatheticactivity
SD2 ms Standard deviation of the Poincaré plot alongthe line-of-identity; largest diameter of thefitted ellipse; estimate of long-term HRV;describes sympathetic activity
SD1/SD2 – Ratio of SD1 to SD2; describes the ratio ofshort-term to long-term HRV; describes theratio between parasympathetic andsympathetic activity
Frequency-domain HRV parametersLF ms2 Power in low frequency range (0.04–0.15 Hz);
estimate of long-term HRV; reflects bothsympathetic and parasympathetic activity
nLF n.u. Normalized power of LF; LF/(LF + HF) × 100;estimate of long-term HRV; reflects bothsympathetic and parasympathetic activity
HF ms2 Power in high frequency range (0.15–0.4 Hz);estimate of short-term HRV; describesparasympathetic (vagal) activity
nHF n.u. Normalized power of HF; HF/(LF + HF) × 100;estimate of short-term HRV; describesparasympathetic activity
LF/HF – Ratio between LF and HF range powers;describes the ratio of long-term to short-termHRV; describes the ratio between sympathetic
–
l
–
–
–
–
tion of a software tool for detection and classification of heartbeats
and parasympathetic activity, i.e.,sympathovagal balance
FPqrs, the false positive for QRS detection, i.e., the number of falseQRS detections.
For evaluation of the classification algorithm, we used the fol-owing additional scores for each record:
Nn, the total number of normal heartbeats in the database, i.e.,the sum of TPn and FNn;
TPn, the true positive for classification, i.e., the number of cor-rectly classified normal heartbeats;
FNn, the false negative for classification, i.e., the number of missed
normal heartbeats; andFPn, the false positive for classification, i.e., they can ariseboth from correctly detected but erroneously classified QRS
g and Control 10 (2014) 108–116
complexes (a subgroup of TPqrs) and from erroneously detectedQRS complexes (a subgroup of FPqrs).
Based on these scores obtained with a beat-by-beat com-parison of the results of our algorithm with true human-expert annotations of the heartbeats defined in the LTSTdatabase, we calculated standard performance measures forQRS detection: sensitivity (Seqrs(%) = 100·TPqrs/Nqrs), positive pre-dictivity (+Pqrs(%) = 100·TPqrs/(TPqrs + FPqrs)) and detection errorrate (DERqrs(%) = 100·(FPqrs + FNqrs)/Nqrs) for QRS detection. Sim-ilarly, we defined performance measures for classification ofnormal heartbeats: sensitivity (Sen(%) = 100·TPn/Nn), positive pre-dictivity (+Pn(%) = 100·TPn/(TPn + FPn)) and classification error rate(DERn(%) = 100·FPn/Nn) for normal heartbeats.
2.2.3. ProgrammingThe software tool and all routines for evaluation of performance
of the algorithm were written in Matlab and implemented on a PCplatform.
3. Results
We developed a Matlab-based GUI-driven tool for reliable andeffective detection and classification of heartbeats from ECG signalsand calculation of ECG and HRV parameters. For the structure of thetool see Fig. 1.
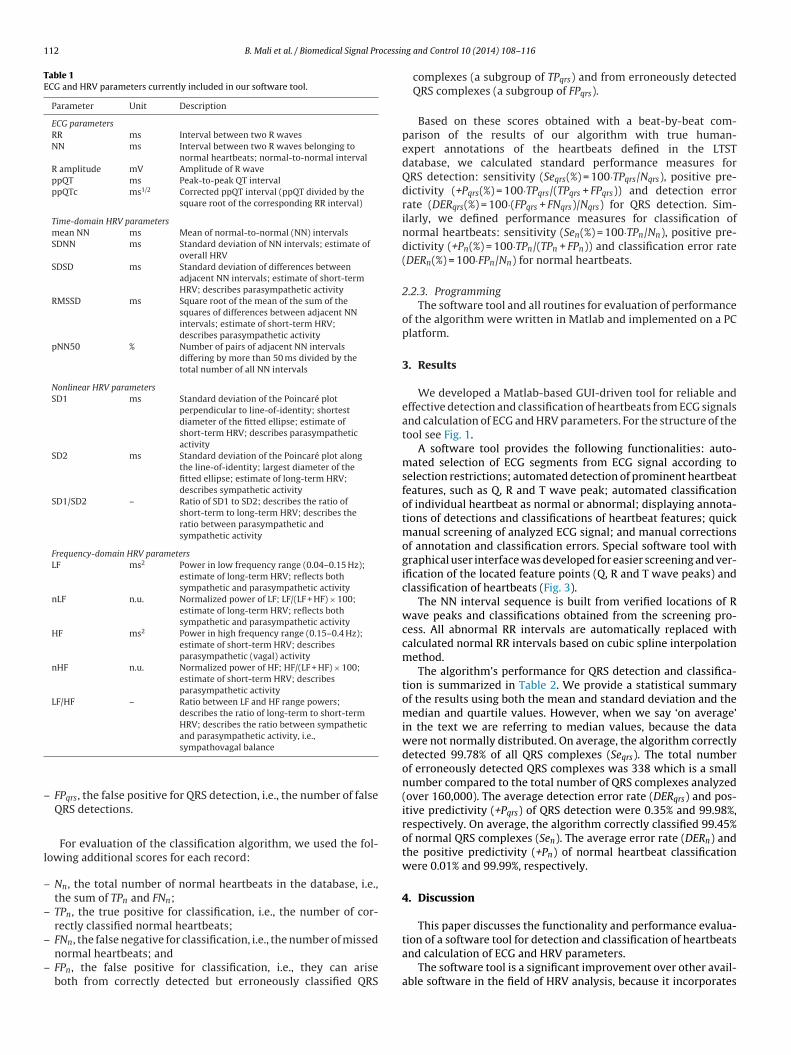
A software tool provides the following functionalities: auto-mated selection of ECG segments from ECG signal according toselection restrictions; automated detection of prominent heartbeatfeatures, such as Q, R and T wave peak; automated classificationof individual heartbeat as normal or abnormal; displaying annota-tions of detections and classifications of heartbeat features; quickmanual screening of analyzed ECG signal; and manual correctionsof annotation and classification errors. Special software tool withgraphical user interface was developed for easier screening and ver-ification of the located feature points (Q, R and T wave peaks) andclassification of heartbeats (Fig. 3).
The NN interval sequence is built from verified locations of Rwave peaks and classifications obtained from the screening pro-cess. All abnormal RR intervals are automatically replaced withcalculated normal RR intervals based on cubic spline interpolationmethod.
The algorithm’s performance for QRS detection and classifica-tion is summarized in Table 2. We provide a statistical summaryof the results using both the mean and standard deviation and themedian and quartile values. However, when we say ‘on average’in the text we are referring to median values, because the datawere not normally distributed. On average, the algorithm correctlydetected 99.78% of all QRS complexes (Seqrs). The total numberof erroneously detected QRS complexes was 338 which is a smallnumber compared to the total number of QRS complexes analyzed(over 160,000). The average detection error rate (DERqrs) and pos-itive predictivity (+Pqrs) of QRS detection were 0.35% and 99.98%,respectively. On average, the algorithm correctly classified 99.45%of normal QRS complexes (Sen). The average error rate (DERn) andthe positive predictivity (+Pn) of normal heartbeat classificationwere 0.01% and 99.99%, respectively.
4. Discussion
This paper discusses the functionality and performance evalua-
and calculation of ECG and HRV parameters.The software tool is a significant improvement over other avail-
able software in the field of HRV analysis, because it incorporates

B. Mali et al. / Biomedical Signal Processing and Control 10 (2014) 108–116 113
Fig. 3. Graphical user interface for screening and verification of Q, R and T wave peak locations. At the top, ECG signal for editing is selected and loaded. ECG signal is plottedand can be zoomed in or out and advanced along the time axis in either direction, which allows editing of ECG signal segment by segment. Q, R and T wave peak locationsc nged fa e end
n editing
tskmests
oHedhtslr+rorct1wrclafs
an be deleted or added. The annotation for R wave peak location can also be chabout the original and the edited ECG signal is displayed (i.e., about the start and thumber of normal and abnormal heartbeats detected within the ECG signal). After
he functionality for automated selection of the most adequate ECGegments from ECG signal for HRV analysis. To the best of ournowledge, no tool available on the market includes such built-inodule for automated selection. This property of the tool enables
xtraction of relatively noise-free ECG segments that are the mostuitable for reliable HRV analysis and presents important charac-eristics in terms of objective, unbiased and quick selection of ECGegments.
The fundamental functionality of the tool is reliable detectionf QRS complexes which in comparison to other software tools forRV analysis is not a frequently implemented characteristics, forxample Kubios does not provide QRS detection at all. The QRSetection algorithm has to correctly detect as many as possibleeartbeats (high TPqrs and Seqrs) without false positive QRS detec-ions (low FPqrs). When testing our QRS detection algorithm on 19ample ECG signals from the LTST database (with relatively lowevel of high-frequency noise present), the algorithm fulfilled theseequirements excellently as indicated by practically ideal Seqrs andPqrs values (Table 2). The performance of our QRS detection algo-ithm approached the ideal level at a degree similar to that of somether detectors with comparably simple algorithms [59–61]. Theecords with poorest results of our algorithm (having large DERqrs)ontain a transient appearance of high-frequency noise with ampli-udes similar to that of the R wave (typical examples: records 119,39 and 159). At this stage of development, our algorithm is notell suited to deal with signals that have very low signal-to-noise
atio or are largely nonstationary. We do not find this to be criti-al because for such signals only the ECG segments with relatively
ow level of noise can be selected for the analysis (by defining suit-ble selection criteria for the automated selection of ECG segmentsrom ECG signal; see Section 2.1.4.1) or manual detection and clas-ification of heartbeats can be performed in critical parts of the ECGrom normal to abnormal or vice versa. In the upper right corner, the informationof absolute recording time of ECG signal, total length of ECG signal in samples, and
of Q, R and T wave peaks, the changes can be saved in a separate file.
signal. However, the algorithm deals well with mildly nonstation-ary parts of the signal or transient onsets of noise contaminationwith low amplitudes, which were occasionally encountered in mostof the signals used in evaluation of the algorithm. Moreover, manyof the false negative QRS detections (FNqrs) were present due to verystrict requirements for no false positive QRS detections (FPqrs). Wewanted to achieve the number of FPqrs as low as possible since afalse positive is more detrimental for performance of the detectionalgorithm than a false negative because of the effect on updating ofthe algorithm’s parameters.
The software tool has to correctly classify as many normalheartbeats as possible (high TPn and Sen) without false positiveclassifications for normal heartbeats (low FPn and DERn and high+Pn). Again the false positives are more detrimental to the perfor-mance of classification and further on to HRV analysis than thefalse negatives. The classification algorithm satisfied these require-ments excellently as indicated by practically ideal Sen and +Pn
values (Table 2). There were 39 false positive classifications (FPn) incomparison to approximately 160,000 correctly classified normalheartbeats in evaluated ECG signals. The reason for these erro-neously classified heartbeats is mainly in particular arrhythmiasthat are sometimes indistinguishable from the normal heartbeatsin terms of morphology or the time of appearance. However, eventhough algorithm erroneously classifies some normal heartbeats,these mistakes can be manually corrected in further evaluationsteps of the tool, i.e., during the screening of ECG segments. Itshould be pointed out that presently the parameters Sen, +Pn andDERn (Table 2) reflect a combined performance of both the detec-
tion algorithm and the classification algorithms. We justify this bythe fact that both these components were fine-tuned together andnot independently of each other because of our specific final appli-cation of our tool. In the future, however, we intend to separate
114
B. M
ali et
al. /
Biomedical
Signal Processing
and Control
10 (2014)
108–116
Table 2Performance measures for QRS detection and heartbeat classification.
Original data Detection of heartbeats Detection & classification of normal heartbeats
Signala Nqrs Nn Na TPqrs FNqrs FPqrs Seqrs (%) +Pqrs (%) DERqrs (%) TPn FNn FPn Sen (%) +Pn (%) DERn (%)
103 7279 7195 84 7251 28 0 99.62 100.00 0.38 7176 19 5 99.74 99.93 0.07105 6615 6613 2 6607 8 3 99.88 99.95 0.17 6582 31 2 99.53 99.97 0.03107 7015 7001 14 6964 51 10 99.27 99.86 0.87 6929 72 1 98.97 99.99 0.01111 7519 7518 1 7494 25 1 99.67 99.99 0.35 7469 49 0 99.35 100.00 0.00113 8929 8911 18 8915 14 0 99.84 100.00 0.16 8865 46 1 99.48 99.99 0.01119 7702 7701 1 7647 55 35 99.29 99.54 1.17 7600 101 0 98.69 100.00 0.00121 10,609 10,594 15 10,590 19 30 99.82 99.72 0.46 10,534 60 5 99.43 99.95 0.05123 9155 9149 6 9136 19 1 99.79 99.99 0.22 9110 39 0 99.57 100.00 0.00125 9047 9043 4 9024 23 2 99.75 99.98 0.28 8997 46 0 99.49 100.00 0.00127 9373 9373 0 9373 0 0 100.00 100.00 0.00 9349 24 0 99.74 100.00 0.00139 10,611 10,611 0 10,504 107 48 98.99 99.55 1.46 10,288 323 0 96.96 100.00 0.00147 6360 6357 3 6354 6 0 99.91 100.00 0.09 6326 31 3 99.51 99.95 0.05155 8106 8105 1 8088 18 15 99.78 99.81 0.41 8050 55 0 99.32 100.00 0.00159 9180 9131 49 8900 280 184 96.95 97.97 5.05 8820 311 1 96.59 99.99 0.01161 8841 8836 5 8840 1 1 99.99 99.99 0.02 8787 49 0 99.45 100.00 0.00163 7599 7586 13 7595 4 3 99.95 99.96 0.09 7565 21 2 99.72 99.97 0.03501 7739 7734 5 7728 11 1 99.86 99.99 0.16 7701 33 1 99.57 99.99 0.01509 8074 7928 146 8005 69 2 99.15 99.98 0.88 7876 52 3 99.34 99.96 0.04607 10,248 10,200 48 10,197 51 2 99.50 99.98 0.52 10,131 69 15 99.32 99.85 0.15
Total 160,001 159,586 415 159,212 789 338 – – – 158,155 1431 39 – – –Min 6360 6357 0 6354 0 0 96.95 97.97 0.00 6326 19 0 96.59 99.85 0.0025% 7519 7518 1 7494 8 1 99.29 99.81 0.16 7469 31 0 99.32 99.96 0.00Median 8106 8105 5 8088 19 2 99.78 99.98 0.35 8050 49 1 99.45 99.99 0.0175% 9180 9149 18 9136 51 15 99.88 99.99 0.87 9110 69 3 99.57 100.00 0.04Max 10,611 10,611 146 10,590 280 184 100.00 100.00 5.05 10,534 323 15 99.74 100.00 0.15Mean 8421 8399 22 8380 42 18 99.53 99.80 0.67 8324 75 2 99.15 99.98 0.02Std 1241 1242 36 1226 62 41 0.67 0.45 1.10 1207 85 3 0.85 0.04 0.04CI95%LL 7863 7841 6 7828 14 0 99.22 99.60 0.17 7781 37 1 98.76 99.96 0.01CI95%UL 8979 8958 38 8931 69 36 99.83 100.00 1.17 8867 114 4 99.53 99.99 0.04
a Names of ECG signals are original names from LTST database; Nqrs , the total number of possible detected QRS complexes (normal and abnormal, Nn and Na), i.e., the sum of TPqrs and FNqrs; Nn , the total number of normalheartbeats, i.e., the sum of TPn and FNn; Na , the total number of abnormal heartbeats; TPqrs , the true positive for QRS detection, i.e., the number of correctly detected QRS complexes; FNqrs , the false negative for QRS detection, i.e.,the number of missed QRS complexes; FPqrs , the false positive for QRS detection, i.e., the number of false QRS detections; Seqrs = sensitivity for QRS detection; +Pqrs = positive predictivity for QRS detection; DERqrs = detection errorrate for QRS detection; TPn , the true positive for classification, i.e., the number of correctly classified normal heartbeats; FNn , the false negative for classification, i.e., the number of missed normal heartbeats; FPn , the false positivefor classification; Sen = sensitivity for normal heartbeats; +Pn = positive predictivity for normal heartbeats; DERn = detection error rate for normal heartbeats; CI95%LL = lower limit of 95% confidence interval; CI95%UL = upper limit of95% confidence interval.

ocessin
etp
cuawsnTsadbpr
haKHipkovpaEra(c
5
fbseevpitsaeodtammetifTctei
[
[
[
[
[
[
[
[
[
[
[
[
[
[
[
[
B. Mali et al. / Biomedical Signal Pr
valuation of the two algorithms and also to assess the classifica-ion performance with respect to different types of arrhythmiasresent in ECG records.
Beside the module for reliable QRS detection and heartbeatlassification, our tool incorporates selection and verification mod-le. This module displays automatically detected heartbeats withnnotated and classified R wave peaks and detected Q and Tave peaks. In addition, it enables quick manual screening of ECG
egments selected for evaluation, and manual corrections of erro-eously detected or classified heartbeats or wave peaks (Fig. 3).hese functionalities of our software tool present useful and time-aving characteristics since the screening and correction processesre always a tedious and time-consuming work. Moreover, our tooloes not require a clear RR sequence based on only normal heart-eats. The NN sequence is built after verification of ECG featureoints when all potential abnormal RR intervals are automaticallyeplaced with interpolated normal NN intervals.
The described software tool for detection and classification ofeartbeats and calculation of ECG and HRV parameters presents
significant improvement over other available software (such asubios, SyneScope, Biopac, Nevrokard HRV system) in the field ofRV analysis, because it incorporates a unique set of functional-
ties among which some are not at all or only rarely individuallyrovided in commonly available software but, to the best of ournowledge, no software tool available on the market provides allf them. The distinctive functionalities that our software tool pro-ides are: (1) reliable and automated detection of QRS and otherrominent heartbeat features, such as Q, R and T wave peak; (2)utomated selection of the most adequate ECG segments fromCG signal for HRV analysis according to specific user-definedequirements; (3) automated classification of individual heartbeats normal or abnormal; (4) displaying of heartbeat annotations;5) quick manual screening of analyzed ECG signal; and (6) manualorrection of annotation and classification errors.
. Conclusions
We tested the performance of a newly designed software toolor reliable and effective detection and classification of heart-eats and calculation of ECG and HRV parameters. This tool willerve in clarification of issues concerning patient safety during thelectroporation-based treatments used in clinical practice, such aslectrochemotherapy, electrotransfer for gene therapy and DNAaccination and non-thermal irreversible electroporation. Electriculses used in electroporation-based treatments are of very high
ntensities (voltages up to several kilovolts, currents up to severalens of amperes) and can potentially induce heart-related effects inpite of their very short durations [44,46,52]. Safety considerationsre becoming increasingly important because new applications oflectroporation-based treatments using endoscopic, percutaneousr surgical means to access internal tumors or tissues are beingeveloped. Due to relatively large electrical conductivity of internalissues and organs [62] and pronouncedly nonlinear tissue char-cteristics [63,64], electroporation pulses in these new treatmentodalities might have an increased probability of affecting cardiacuscle and thus greater potential of inducing heart-related effects,
specially when the application zone is in immediate vicinity ofhe heart [15,38,41–48]. Our software tool represents a significantmprovement over the existing practice of evaluation of changes inunctioning of the heart due to electroporation-based treatments.his software tool can of course also be used for evaluation of
hanges in ECG or HRV parameters in other applications wherehe effects of clinical interventions (e.g., effects of drugs) or differ-nt physiological conditions (e.g., effects of anxiety or stress) arenvestigated.[
[
g and Control 10 (2014) 108–116 115
Conflicts of interest
Authors declare no conflicts of interests.
Acknowledgements
This research was supported by the Research Agency of theRepublic of Slovenia and conducted within the scope of Electro-poration in Biology and Medicine (EBAM) European AssociatedLaboratory (LEA). Part of this work was facilitated by networkingactivities of COST Action TD1104 “European network for devel-opment of electroporation-based technologies and treatments(EP4Bio2Med)”.
References
[1] J.C. Weaver, Y.A. Chizmadzhev, Theory of electroporation: a review, Bioelec-trochem. Bioenerg. 41 (1996) 135–160.
[2] J.C. Weaver, Electroporation of cells and tissues, IEEE Trans. Plasma Sci. 28(2000) 24–33.
[3] C. Chen, S.W. Smye, M.P. Robinson, J.A. Evans, Membrane electroporation the-ories: a review, Med. Biol. Eng. Comput. 44 (2006) 5–14.
[4] T. Kotnik, P. Kramar, G. Pucihar, D. Miklavcic, M. Tarek, Cell membrane electro-poration – Part 1: The phenomenon, IEEE Electr. Insul. Mag. 28 (2012) 14–23.
[5] L.M. Mir, S. Orlowski, J. Belehradek Jr., C. Paoletti, Electrochemotherapy poten-tiation of antitumour effect of bleomycin by local electric pulses, Eur. J. Cancer27 (1991) 68–72.
[6] A. Macek Lebar, G. Sersa, S. Kranjc, A. Groselj, D. Miklavcic, Optimisation ofpulse parameters in vitro for in vivo electrochemotherapy, Anticancer Res. 22(2002) 1731–1736.
[7] A. Zupanic, S. Corovic, D. Miklavcic, Optimization of electrode position and elec-tric pulse amplitude in electrochemotherapy, Radiol. Oncol. 42 (2008) 93–101.
[8] M. Cemazar, M. Golzio, G. Sersa, P. Hojman, S. Kranjc, S. Mesojednik, et al.,Control by pulse parameters of DNA electrotransfer into solid tumors in mice,Gene Ther. 16 (2009) 635–644.
[9] D. Miklavcic, L. Towhidi, Numerical study of the electroporation pulse shapeeffect on molecular uptake of biological cells, Radiol. Oncol. 44 (2010) 34–41.
10] D. Miklavcic, M. Snoj, A. Zupanic, B. Kos, M. Cemazar, M. Kropivnik, et al.,Towards treatment planning and treatment of deep-seated solid tumors byelectrochemotherapy, Biomed. Eng. Online 9 (2010) 10.
11] S. Haberl, D. Miklavcic, G. Sersa, W. Frey, B. Rubinsky, Cell membrane electro-poration – Part 2: The applications, IEEE Electr. Insul. Mag. 29 (2013) 29–37.
12] M. Marty, G. Sersa, J.R. Garbay, J. Gehl, C.G. Collins, M. Snoj, et al., Elec-trochemotherapy – an easy, highly effective and safe treatment of cutaneousand subcutaneous metastases: results of ESOPE (European Standard OperatingProcedures of Electrochemotherapy) study, Eur. J. Cancer Suppl. 4 (2006) 3–13.
13] M.G. Moller, S. Salwa, D.M. Soden, G.C. O’Sullivan, Electrochemotherapy asan adjunct or alternative to other treatments for unresectable or in-transitmelanoma, Expert Rev. Anticancer Ther. 9 (2009) 1611–1630.
14] T. Hampton, Electric pulses help with chemotherapy, may open new paths forother agents, JAMA 305 (2011) 549–551.
15] I. Edhemovic, E.M. Gadzijev, E. Brecelj, D. Miklavcic, B. Kos, A. Zupanic, et al.,Electrochemotherapy: a new technological approach in treatment of metas-tases in the liver, Technol. Cancer Res. Treat. 10 (2011) 475–485.
16] G. Sersa, T. Cufer, S.M. Paulin, M. Cemazar, M. Snoj, Electrochemotherapy ofchest wall breast cancer recurrence, Cancer Treat. Rev. 38 (2012) 379–386.
17] L.G. Campana, S. Valpione, S. Mocellin, R. Sundararajan, E. Granziera, L. Sar-tore, et al., Electrochemotherapy for disseminated superficial metastases frommalignant melanoma, Br. J. Surg. 99 (2012) 821–830.
18] B. Mali, T. Jarm, M. Snoj, G. Sersa, D. Miklavcic, Antitumor effectiveness of elec-trochemotherapy: a systematic review and meta-analysis, Eur. J. Surg. Oncol.39 (2013) 4–16.
19] F. Andre, L.M. Mir, DNA electrotransfer: its principles and an updated reviewof its therapeutic applications, Gene Ther. 11 (2004) S33–S42.
20] F.M. Andre, J. Gehl, G. Sersa, V. Preat, P. Hojman, J. Eriksen, et al., Efficiency ofhigh- and low-voltage pulse combinations for gene electrotransfer in muscle,liver, tumor, and skin, Hum. Gene Ther. 19 (2008) 1261–1271.
21] A. Gothelf, J. Gehl, Gene electrotransfer to skin: review of existing literatureand clinical perspectives, Curr. Gene Ther. 10 (2010) 287–299.
22] S.V. Littel-van den Hurk, D. Hannaman, Electroporation for DNA immunization:clinical application, Expert Rev. Vaccines 9 (2010) 503–517.
23] L.C. Heller, R. Heller, Electroporation gene therapy preclinical and clinical trialsfor melanoma, Curr. Gene Ther. 10 (2010) 312–317.
24] P. Hojman, Basic principles and clinical advancements of muscle electrotrans-fer, Curr. Gene Ther. 10 (2010) 128–138.
25] M.R. Prausnitz, A practical assessment of transdermal drug delivery by skin
electroporation, Adv. Drug Deliv. Rev. 35 (1999) 61–76.26] A.R. Denet, R. Vanbever, V. Preat, Skin electroporation for transdermal andtopical delivery, Adv. Drug Deliv. Rev. 56 (2004) 659–674.
27] N. Pavselj, V. Preat, DNA electrotransfer into the skin using a combination ofone high- and one low-voltage pulse, J. Controlled Release 106 (2005) 407–415.

1 ocessin
[
[
[
[
[
[
[
[
[
[
[
[
[
[
[
[
[
[
[
[
[
[
[
[
[
[
[
[
[
[
[
[
[
[
[
[
16 B. Mali et al. / Biomedical Signal Pr
28] H. Kalluri, A.K. Banga, Transdermal delivery of proteins, AAPS Pharm. Sci. Tech.12 (2011) 431–441.
29] T.W. Wong, T.Y. Chen, C.C. Huang, J.C. Tsai, S.W. Hui, Painless skin electropo-ration as a novel way for insulin delivery, Diabetes Technol. Ther. 13 (2011)929–935.
30] H. Mekid, L.M. Mir, In vivo cell electrofusion, Biochim. Biophys. Acta 1524(2000) 118–130.
31] K. Trontelj, M. Rebersek, M. Kanduser, V.C. Serbec, M. Sprohar, D. Miklavcic,Optimization of bulk cell electrofusion in vitro for production of human-mouseheterohybridoma cells, Bioelectrochemistry 74 (2008) 124–129.
32] S. Salomskaite-Davalgiene, K. Cepurniene, S. Satkauskas, M.S. Venslauskas, L.M.Mir, Extent of cell electrofusion in vitro and in vivo is cell line dependent,Anticancer Res. 29 (2009) 3125–3130.
33] M. Usaj, K. Trontelj, D. Miklavcic, M. Kanduser, Cell-cell electrofusion: optimiza-tion of electric field amplitude and hypotonic treatment for mouse melanoma(B16-F1) and Chinese Hamster ovary (CHO) cells, J. Membr. Biol. 236 (2010)107–116.
34] M. Usaj, K. Flisar, D. Miklavcic, M. Kanduser, Electrofusion of B16-F1 and CHOcells: the comparison of the pulse first and contact first protocols, Bioelectro-chemistry 89 (2013) 34–41.
35] R. Davalos, L. Mir, B. Rubinsky, Tissue ablation with irreversible electroporation,Ann. Biomed. Eng. 33 (2005) 223–231.
36] B. Rubinsky, Irreversible electroporation in medicine, Technol. Cancer Res.Treat. 6 (2007) 255–259.
37] E. Maor, A. Ivorra, B. Rubinsky, Non thermal irreversible electroporation: noveltechnology for vascular smooth muscle cells ablation, PLoS ONE 4 (2009) e4757.
38] M. Pech, A. Janitzky, J.J. Wendler, C. Strang, S. Blaschke, O. Dudeck, et al.,Irreversible electroporation of renal cell carcinoma: a first-in-man phase I clin-ical study, Cardiovasc. Intervent. Radiol. 34 (2011) 132–138.
39] C.R. Tracy, W. Kabbani, J.A. Cadeddu, Irreversible electroporation (IRE): a novelmethod for renal tissue ablation, BJU Int. 107 (2011) 1982–1987.
40] D. Miklavcic, Network for development of electroporation-based technologiesand treatments: COST TD1104, J. Membr. Biol. 245 (2012) 591–598.
41] W.G. Marshall Jr., B.A. Boone, J.D. Burgos, S.I. Gografe, M.K. Baldwin, M.L.Danielson, et al., Electroporation-mediated delivery of a naked DNA plasmidexpressing VEGF to the porcine heart enhances protein expression, Gene Ther.17 (2010) 419–423.
42] E.L. Ayuni, A. Gazdhar, M.N. Giraud, A. Kadner, M. Gugger, M. Cecchini, et al.,In vivo electroporation mediated gene delivery to the beating heart, PLoS ONE5 (2010) e14467.
43] B. Hargrave, H. Downey, R. Strange, L. Murray, C. Cinnamond, C. Lundberg, et al.,Electroporation-mediated gene transfer directly to the swine heart, Gene Ther.20 (2013) 151–157.
44] C. Ball, K.R. Thomson, H. Kavnoudias, Irreversible electroporation: a new chal-lenge in “out of operating theater” anesthesia, Anesth. Analg. 110 (2010)1305–1309.
45] K. Thomson, Human experience with irreversible electroporation, in: B. Rubin-sky (Ed.), Irreversible Electroporation, Springer Verlag, Berlin, Heidelberg, 2010,
pp. 249–254.46] A. Deodhar, T. Dickfeld, G.W. Single, W.C. Hamilton, R.H. Thornton, C.T.Sofocleous, et al., Irreversible electroporation near the heart: ventriculararrhythmias can be prevented with ECG synchronization, Am. J. Roentgenol.196 (2011) W330–W335.
[
g and Control 10 (2014) 108–116
47] S. Bagla, D. Papadouris, Percutaneous irreversible electroporation of surgicallyunresectable pancreatic cancer: a case report, J. Vasc. Interv. Radiol. 23 (2012)142–145.
48] D. Miklavcic, G. Sersa, E. Brecelj, J. Gehl, D. Soden, G. Bianchi, et al., Elec-trochemotherapy: technological advancements for efficient electroporation-based treatment of internal tumors, Med. Biol. Eng. Comput. 50 (2012)1213–1225.
49] J. Pan, W.J. Tompkins, A real-time QRS detection algorithm, IEEE Trans. Biomed.Eng. 32 (1985) 230–236.
50] C. Burghardt, ECG Interpretation Made Incredibly Easy!, fifth ed, LippincottWilliams & Wilkins, USA, 2010.
51] B. Mali, T. Jarm, F. Jager, D. Miklavcic, An algorithm for synchroniza-tion of in vivo electroporation with ECG, J. Med. Eng. Technol. 29 (2005)288–296.
52] B. Mali, T. Jarm, S. Corovic, M.S. Paulin-Kosir, M. Cemazar, G. Sersa, et al., Theeffect of electroporation pulses on functioning of the heart, Med. Biol. Eng.Comput. 46 (2008) 745–757.
53] A.J. Camm, M. Malik, J.T. Bigger, G. Breithardt, S. Cerutti, R.J. Cohen, et al., Heartrate variability. Standards of measurement, physiological interpretation, andclinical use, Eur. Heart J. 17 (1996) 354–381.
54] M.A. Salo, H.V. Huikuri, T. Seppänen, Ectopic beats in heart rate variabilityanalysis: effects of editing on time and frequency domain measures, Ann. Non-invasive Electrocardiol. 6 (2001) 5–17.
55] P. Melillo, M. Bracale, L. Pecchia, Nonlinear heart rate variability features forreal-life stress detection. Case study: students under stress due to universityexamination, Biomed. Eng. Online 10 (2011) 96.
56] N. Lippman, K.M. Stein, B.B. Lerman, Comparison of methods for removal ofectopy in measurement of heart rate variability, Am. J. Physiol. 267 (1994)H411–H418.
57] U.R. Acharya, P.K. Joseph, N. Kannathal, C. Bernat, J. Suri, Heart rate variability:a review, Med. Biol. Eng. Comput. 44 (2006) 1031–1051.
58] F. Jager, A. Taddei, G.B. Moody, M. Emdin, G. Antolic, R. Dorn, et al., Long-termST database: a reference for the development and evaluation of automatedischaemia detectors and for the study of the dynamics of myocardial ischaemia,Med. Biol. Eng. Comput. 41 (2003) 172–182.
59] D. Benitez, P.A. Gaydecki, A. Zaidi, A.P. Fitzpatrick, The use of theHilbert transform in ECG signal analysis, Comput. Biol. Med. 31 (2001)399–406.
60] A. Ruha, S. Sallinen, S. Nissilä, A real-time microprocessor QRS detector systemwith a 1-ms timing accuracy for the measurement of ambulatory HRV, IEEETrans. Biomed. Eng. 44 (1997) 159–167.
61] G.M. Friesen, T.C. Jannett, M.A. Jadallah, S.L. Yates, S.R. Quint, H.T. Nagle, A com-parison of the noise sensitivity of nine QRS detection algorithms, IEEE Trans.Biomed. Eng. 37 (1990) 85–98.
62] D. Miklavcic, N. Pavselj, F.X. Hart, Electric properties of tissues, in: Wiley Ency-clopedia of Biomedical Engineering, John Wiley & Sons, New York, 2006, pp.3578–3589.
63] I. Lackovic, R. Magjarevic, D. Miklavcic, Three-dimensional finite-element anal-
ysis of joule heating in electrochemotherapy and in vivo gene electrotransfer,IEEE Trans. Dielect. Electr. Insul. 16 (2009) 1338–1347.64] S. Corovic, I. Lackovic, P. Sustaric, T. Sustar, T. Rodic, D. Miklavcic, Modeling ofelectric field distribution in tissues during electroporation, Biomed. Eng. Online12 (2013) 16.