Embed Size (px)
Citation preview
Biomolecular Matchmaking
Material Misfits
Solar Power’s Rising Star
Digital Epidemiology
L o s A l am o s S c i e n c e an d Te c h n ol o g y Ma g a z i n e | May 2 0 1 5
1663 May 2015
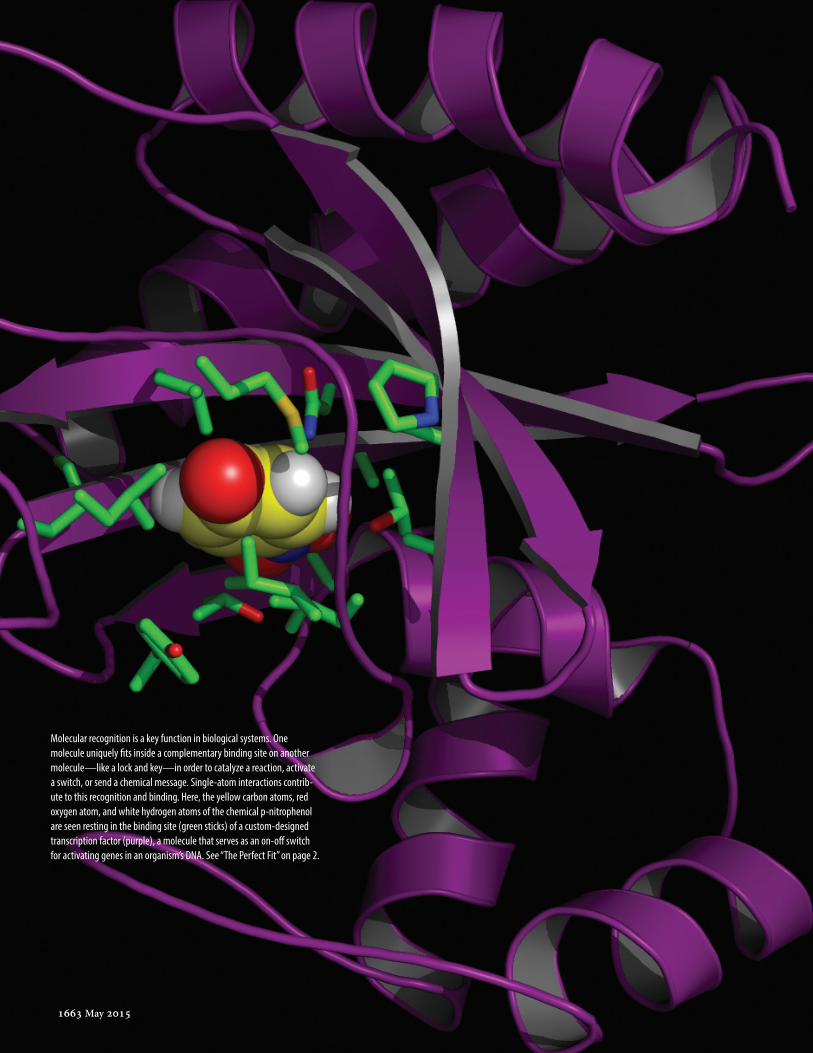
Molecular recognition is a key function in biological systems. One molecule uniquely fits inside a complementary binding site on another molecule—like a lock and key—in order to catalyze a reaction, activate a switch, or send a chemical message. Single-atom interactions contrib-ute to this recognition and binding. Here, the yellow carbon atoms, red oxygen atom, and white hydrogen atoms of the chemical p-nitrophenol are seen resting in the binding site (green sticks) of a custom-designed transcription factor (purple), a molecule that serves as an on-off switch for activating genes in an organism’s DNA. See “The Perfect Fit” on page 2.
1663 May 2015
1663LOS ALAMOS SCIENCE AND TECHNOLOGY MAGAZINE
Features
Craig TylerEleanor Hutterer
Rebecca McDonaldDonald Montoya
Leslie SandovalCaroline SpaethAndrea Maestas
Ethan Frogget
Sta� Editor-in-ChiefScience Writer Science Writer Art DirectorDesign, Layout, and ProductionCopyeditorCopyeditor Photographer
Spotlights
2
12
24
8
21
31
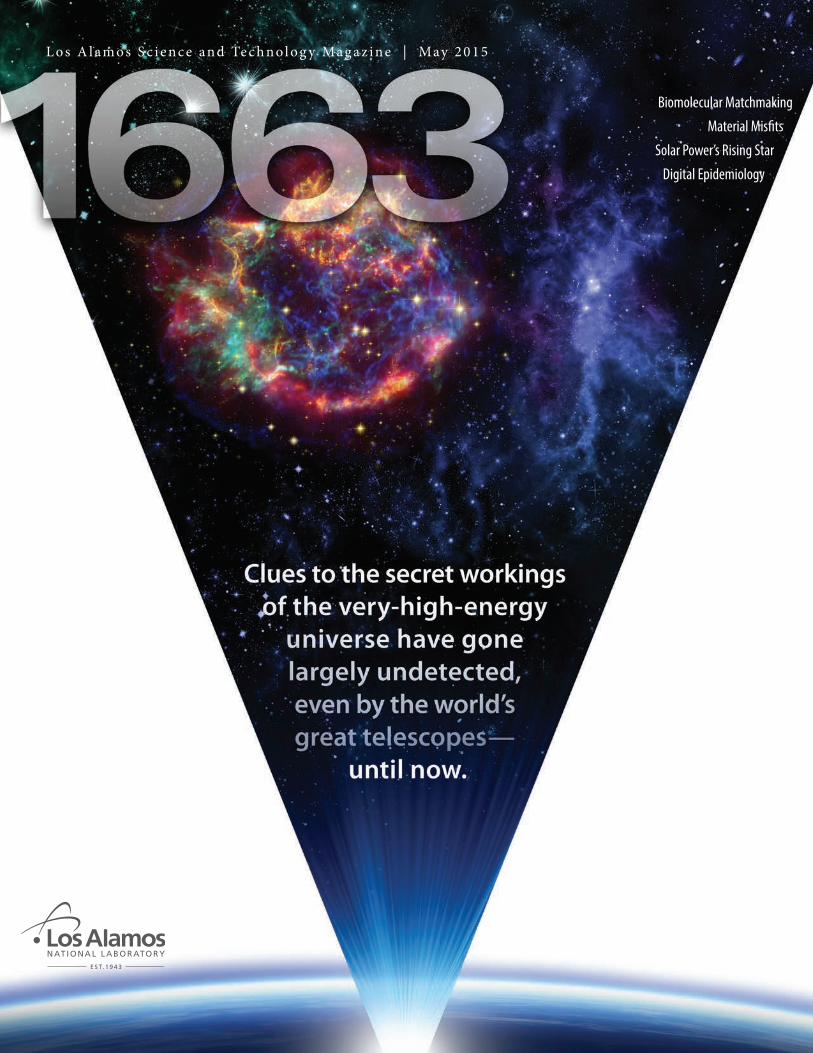
About the Cover: This past March, a major new astronomical observatory began full-scale operations. Called HAWC, the High-altitude Water Cherenkov Observatory is a sophisticated gamma-ray and cosmic-ray telescope that captures upper-atmosphere events from the slopes of Mexico’s highest peak. It is a collaboration among more than 100 scientists at 30 institutions, including its operations manager at Los Alamos National Laboratory. Unlike most other gamma- and cosmic-ray observatories, HAWC continuously scans a large fraction of the sky—day or night, rain or shine—for very-high-energy celestial sources and events, such as supernova shockwaves, supermassive black-hole jets, and gamma-ray bursts. It will gather the data needed to answer a number of long-standing questions about the galaxy and universe we call home.Image credit for the Cassiopeia A supernova remnant on the front cover, upper left: O. Krause/Steward Obs. et al., SSC, JPL, Caltech, NASA
About Our Name: During World War II, all that the outside world knew of Los Alamos and its top-secret laboratory was the mailing address—P. O. Box 1663, Santa Fe, New Mexico. That box number, still part of our address, symbolizes our historic role in the nation’s service.
About the Logo: Laboratory Directed Research and Development (LDRD) is a competitive, internal program by which Los Alamos National Laboratory is authorized by Congress to invest in research and development that is both highly innovative and vital to our national interests. Whenever 1663 reports on research that received support from LDRD, this logo appears at the end of the article.
The Perfect Fit
Finding, even customizing, biomolecules that � t together precisely and reliably
Celestial MysteryMachine
The hidden depths of the high-energy universe
Mis� ts in theMiddle
PerovskitePower
Wikidemiology
Interface interactions in novel materials
Cheap and e� cient solar-energy harvesting
Forecasting � u and other diseases
How We Survived the Big Bang
Safety in Numbers
Slime-busting Salt

2 1663 May 2015
1663 May 2015 3
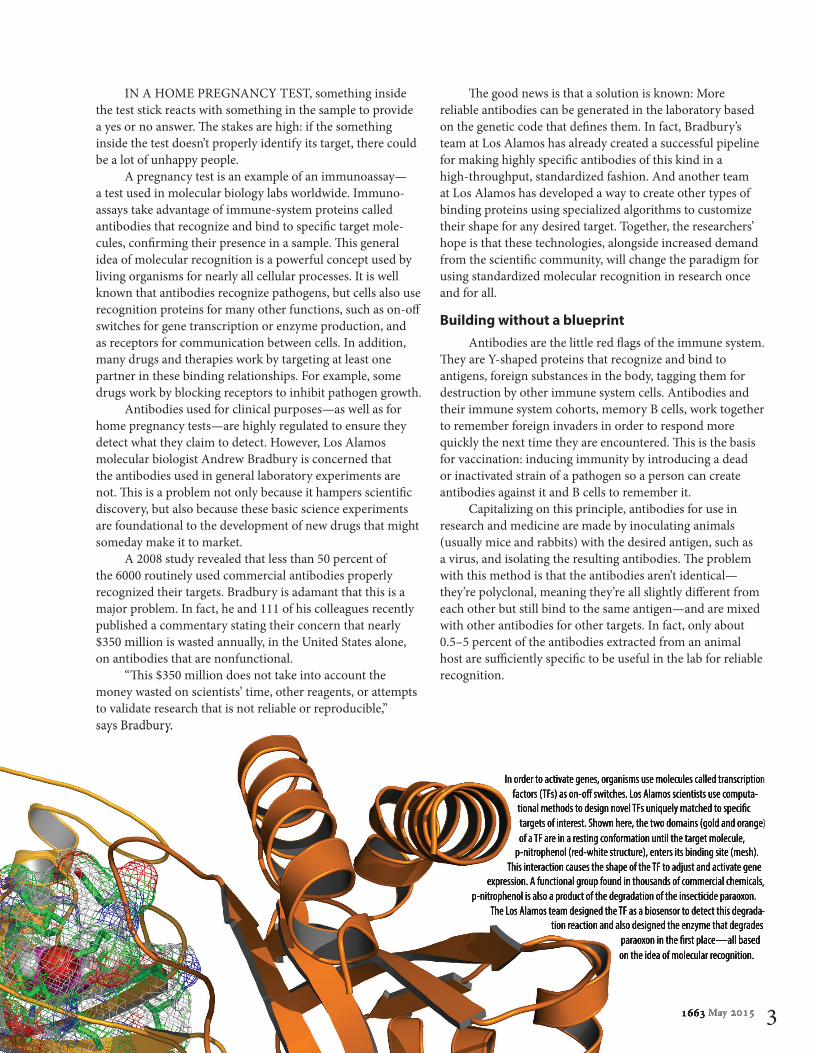
In order to activate genes, organisms use molecules called transcription factors (TFs) as on-o� switches. Los Alamos scientists use computa-
tional methods to design novel TFs uniquely matched to speci� c targets of interest. Shown here, the two domains (gold and orange) of a TF are in a resting conformation until the target molecule,
p-nitrophenol (red-white structure), enters its binding site (mesh). This interaction causes the shape of the TF to adjust and activate gene
expression. A functional group found in thousands of commercial chemicals, p-nitrophenol is also a product of the degradation of the insecticide paraoxon.
The Los Alamos team designed the TF as a biosensor to detect this degrada-tion reaction and also designed the enzyme that degrades
paraoxon in the � rst place—all based on the idea of molecular recognition.
IN A HOME PREGNANCY TEST, something inside the test stick reacts with something in the sample to provide a yes or no answer. � e stakes are high: if the something inside the test doesn’t properly identify its target, there could be a lot of unhappy people.
A pregnancy test is an example of an immunoassay—a test used in molecular biology labs worldwide. Immuno-assays take advantage of immune-system proteins called antibodies that recognize and bind to speci� c target mole-cules, con� rming their presence in a sample. � is general idea of molecular recognition is a powerful concept used by living organisms for nearly all cellular processes. It is well known that antibodies recognize pathogens, but cells also use recognition proteins for many other functions, such as on-o� switches for gene transcription or enzyme production, and as receptors for communication between cells. In addition, many drugs and therapies work by targeting at least one partner in these binding relationships. For example, some drugs work by blocking receptors to inhibit pathogen growth.
Antibodies used for clinical purposes—as well as for home pregnancy tests—are highly regulated to ensure they detect what they claim to detect. However, Los Alamos molecular biologist Andrew Bradbury is concerned that the antibodies used in general laboratory experiments are not. � is is a problem not only because it hampers scienti� c discovery, but also because these basic science experiments are foundational to the development of new drugs that might someday make it to market.
A 2008 study revealed that less than 50 percent of the 6000 routinely used commercial antibodies properly recognized their targets. Bradbury is adamant that this is a major problem. In fact, he and 111 of his colleagues recently published a commentary stating their concern that nearly $350 million is wasted annually, in the United States alone, on antibodies that are nonfunctional.
“� is $350 million does not take into account the money wasted on scientists’ time, other reagents, or attempts to validate research that is not reliable or reproducible,” says Bradbury.
� e good news is that a solution is known: More reliable antibodies can be generated in the laboratory based on the genetic code that de� nes them. In fact, Bradbury’s team at Los Alamos has already created a successful pipeline for making highly speci� c antibodies of this kind in a high-throughput, standardized fashion. And another team at Los Alamos has developed a way to create other types of binding proteins using specialized algorithms to customize their shape for any desired target. Together, the researchers’ hope is that these technologies, alongside increased demand from the scienti� c community, will change the paradigm for using standardized molecular recognition in research once and for all.
Building without a blueprintAntibodies are the little red � ags of the immune system.
� ey are Y-shaped proteins that recognize and bind to antigens, foreign substances in the body, tagging them for destruction by other immune system cells. Antibodies and their immune system cohorts, memory B cells, work together to remember foreign invaders in order to respond more quickly the next time they are encountered. � is is the basis for vaccination: inducing immunity by introducing a dead or inactivated strain of a pathogen so a person can create antibodies against it and B cells to remember it.
Capitalizing on this principle, antibodies for use in research and medicine are made by inoculating animals (usually mice and rabbits) with the desired antigen, such as a virus, and isolating the resulting antibodies. � e problem with this method is that the antibodies aren’t identical—they’re polyclonal, meaning they’re all slightly di� erent from each other but still bind to the same antigen—and are mixed with other antibodies for other targets. In fact, only about 0.5–5 percent of the antibodies extracted from an animal host are su� ciently speci� c to be useful in the lab for reliable recognition.
1663 May 2015May 2015May
In order to activate genes, organisms use molecules called transcription factors (TFs) as on-o� switches. Los Alamos scientists use computa-
tional methods to design novel TFs uniquely matched to speci� c targets of interest. Shown here, the two domains (gold and orange) of a TF are in a resting conformation until the target molecule,
p-nitrophenol (red-white structure), enters its binding site (mesh). This interaction causes the shape of the TF to adjust and activate gene
expression. A functional group found in thousands of commercial chemicals, p-nitrophenol is also a product of the degradation of the insecticide paraoxon.
The Los Alamos team designed the TF as a biosensor to detect this degrada-tion reaction and also designed the enzyme that degrades
paraoxon in the � rst place—all based on the idea of molecular recognition.
says Bradbury.
4 1663 May 2015
An improvement to this method came about in the 1970s, when scientists created “hybridomas” in the lab by taking antibody-producing B cells from inoculated mice and fusing them with cancer cells. In theory, the cancer cells enable the hybrid to grow inde� nitely, creating an endless supply of antibodies—all produced from the same B cell, so that the resulting antibodies would be monoclonal (iden-tical). Unfortunately, these hybrid cell lines are not as great as they sound. � ey do not actually last forever, endlessly producing antibodies, and their antibodies require careful characterization because some of the antibodies produced still recognize more than one target.
� e problem is that both of these approaches still rely on design based on prior exposure, rather than based on speci� c instructions. It’s somewhat akin to an architect recre-ating the Ei� el Tower based on his or her memory of seeing it at age 10, instead of using a blueprint. It would be more accurate to use the blueprint.
“Our work creates antibodies that are de� ned by their DNA sequences, just as genes are,” says Bradbury. “We believe the entire community should move to methods of generating antibodies that will not require the use of animals at all. � is will directly lead to more reliable molecules.”
Using a blueprint libraryIn order to create an antibody with a known genetic
blueprint, a scientist needs two things: the antibody’s genetic sequence and the molecular machinery to translate it into protein. � e molecular machinery part can easily be found inside a bacterium or other cell; however, to obtain an anti-body’s genetic sequence one must � rst know which antibody perfectly � ts the antigen of interest.
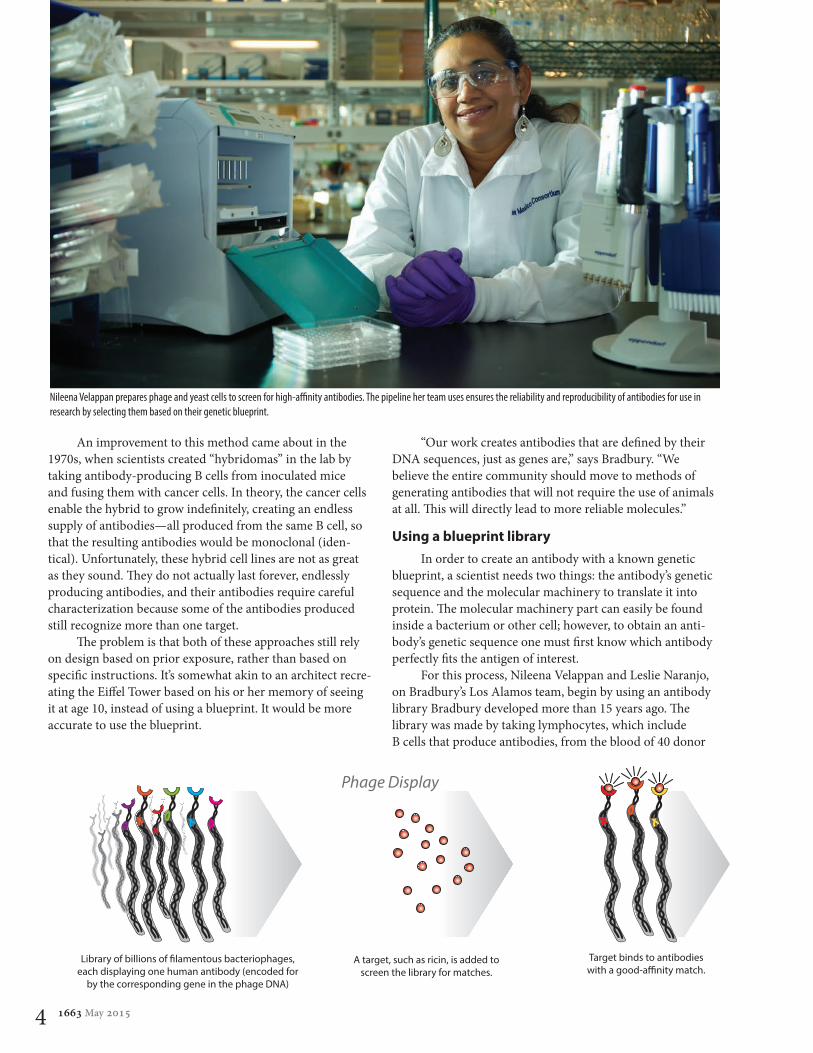
For this process, Nileena Velappan and Leslie Naranjo, on Bradbury’s Los Alamos team, begin by using an antibody library Bradbury developed more than 15 years ago. � e library was made by taking lymphocytes, which include B cells that produce antibodies, from the blood of 40 donor
Nileena Velappan prepares phage and yeast cells to screen for high-a� nity antibodies. The pipeline her team uses ensures the reliability and reproducibility of antibodies for use in research by selecting them based on their genetic blueprint.
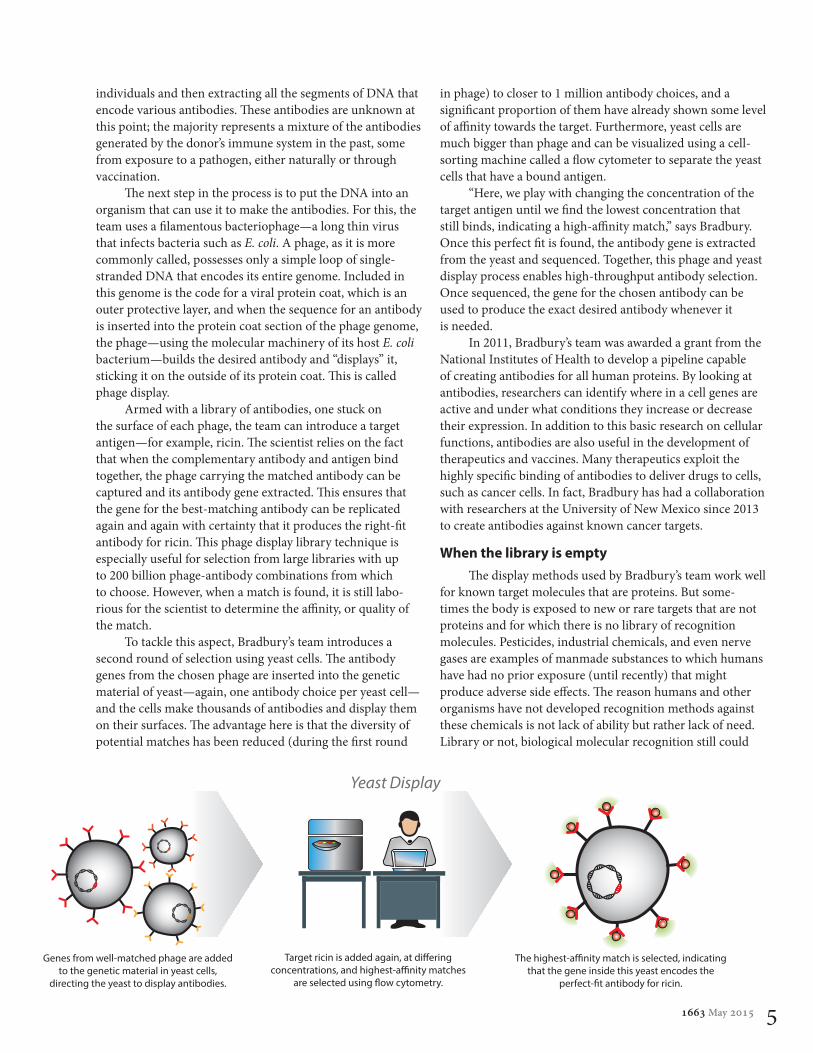
Phage Display Yeast Display
Library of billions of �lamentous bacteriophages, each displaying one human antibody (encoded for
by the corresponding gene in the phage DNA)
A target, such as ricin, is added to screen the library for matches.
Target binds to antibodies with a good-a�nity match.
Genes from well-matched phage are added to the genetic material in yeast cells,
directing the yeast to display antibodies.
Target ricin is added again, at di�ering concentrations, and highest-a�nity matches
are selected using �ow cytometry.
The highest-a�nity match is selected, indicating that the gene inside this yeast encodes the
perfect-�t antibody for ricin.
1663 May 2015 5
individuals and then extracting all the segments of DNA that encode various antibodies. � ese antibodies are unknown at this point; the majority represents a mixture of the antibodies generated by the donor’s immune system in the past, some from exposure to a pathogen, either naturally or through vaccination.
� e next step in the process is to put the DNA into an organism that can use it to make the antibodies. For this, the team uses a � lamentous bacteriophage—a long thin virus that infects bacteria such as E. coli. A phage, as it is more commonly called, possesses only a simple loop of single-stranded DNA that encodes its entire genome. Included in this genome is the code for a viral protein coat, which is an outer protective layer, and when the sequence for an antibody is inserted into the protein coat section of the phage genome, the phage—using the molecular machinery of its host E. coli bacterium—builds the desired antibody and “displays” it, sticking it on the outside of its protein coat. � is is called phage display.
Armed with a library of antibodies, one stuck on the surface of each phage, the team can introduce a target antigen—for example, ricin. � e scientist relies on the fact that when the complementary antibody and antigen bind together, the phage carrying the matched antibody can be captured and its antibody gene extracted. � is ensures that the gene for the best-matching antibody can be replicated again and again with certainty that it produces the right-� t antibody for ricin. � is phage display library technique is especially useful for selection from large libraries with up to 200 billion phage-antibody combinations from which to choose. However, when a match is found, it is still labo-rious for the scientist to determine the a� nity, or quality of the match.
To tackle this aspect, Bradbury’s team introduces a second round of selection using yeast cells. � e antibody genes from the chosen phage are inserted into the genetic material of yeast—again, one antibody choice per yeast cell—and the cells make thousands of antibodies and display them on their surfaces. � e advantage here is that the diversity of potential matches has been reduced (during the � rst round
in phage) to closer to 1 million antibody choices, and a signi� cant proportion of them have already shown some level of a� nity towards the target. Furthermore, yeast cells are much bigger than phage and can be visualized using a cell-sorting machine called a � ow cytometer to separate the yeast cells that have a bound antigen.
“Here, we play with changing the concentration of the target antigen until we � nd the lowest concentration that still binds, indicating a high-a� nity match,” says Bradbury. Once this perfect � t is found, the antibody gene is extracted from the yeast and sequenced. Together, this phage and yeast display process enables high-throughput antibody selection. Once sequenced, the gene for the chosen antibody can be used to produce the exact desired antibody whenever it is needed.
In 2011, Bradbury’s team was awarded a grant from the National Institutes of Health to develop a pipeline capable of creating antibodies for all human proteins. By looking at antibodies, researchers can identify where in a cell genes are active and under what conditions they increase or decrease their expression. In addition to this basic research on cellular functions, antibodies are also useful in the development of therapeutics and vaccines. Many therapeutics exploit the highly speci� c binding of antibodies to deliver drugs to cells, such as cancer cells. In fact, Bradbury has had a collaboration with researchers at the University of New Mexico since 2013 to create antibodies against known cancer targets.
When the library is empty � e display methods used by Bradbury’s team work well
for known target molecules that are proteins. But some-times the body is exposed to new or rare targets that are not proteins and for which there is no library of recognition molecules. Pesticides, industrial chemicals, and even nerve gases are examples of manmade substances to which humans have had no prior exposure (until recently) that might produce adverse side e� ects. � e reason humans and other organisms have not developed recognition methods against these chemicals is not lack of ability but rather lack of need. Library or not, biological molecular recognition still could
Phage Display Yeast Display
Library of billions of �lamentous bacteriophages, each displaying one human antibody (encoded for
by the corresponding gene in the phage DNA)
A target, such as ricin, is added to screen the library for matches.
Target binds to antibodies with a good-a�nity match.
Genes from well-matched phage are added to the genetic material in yeast cells,
directing the yeast to display antibodies.
Target ricin is added again, at di�ering concentrations, and highest-a�nity matches
are selected using �ow cytometry.
The highest-a�nity match is selected, indicating that the gene inside this yeast encodes the
perfect-�t antibody for ricin.
6 1663 May 2015
be the most e� ective route to the development of sensors to detect toxic chemicals—and even enzymes to neutralize or destroy them.
“Molecular recognition is a major part of what distin-guishes biology from chemistry,” says Los Alamos biologist Charlie Strauss. One molecule being able to recognize and exclusively interact with another is an essential component of cellular metabolism, communication, reproduction, and evolution. “� e beauty of recognition proteins is that this single class of molecule has variants that can grip any target structure with sub-angstrom [less than one ten-billionth of a meter] shape complementarity. Change the gene sequence and you change the shape—it’s that simple. No class of manmade materials achieves that degree of programmable molecular recognition, so this paradigm is only seen in biology.”
With this in mind, Strauss and colleague Ramesh Jha, also a biologist at Los Alamos, have created an arti� cial selection system to identify the best binding molecules for speci� c targets. � ey do so by combining computation and experimental tools to create recognition-binding proteins from scratch. Without a known library of proteins to choose from, they instead rely on a computer to suggest a number of proteins whose shape will likely bind to the desired target. � ey use Rosetta protein-modeling so� ware, a commercial platform that Strauss helped originate in 1998, to help manage the possibilities. For a small protein, say just 100 amino acids long, there could be up to 10180 possible genes that produce a matching conformation. “� at’s more than there are atoms in the observable universe by a factor of a googol,” says Strauss. “So we use a computer model to winnow it down to a feasible genetic library of a merebillion guesses.”
“Even so, manually testing, let alone synthesizing, a billion of anything is prohibitive, so instead we let E. coli cells do both for us,” says Jha. � e trick is to make the binding event itself trigger a gene that makes the cell glow. Each cell carries within it a unique binding candidate from the Rosetta-developed library. If the candidate is able to success-fully bind, the cell carrying it expresses a � uorescent protein.
One-stop shopping“Creating a protein from scratch that � ts a target
molecule is the ultimate test of our understanding of protein design,” says Jha. High-a� nity binding is a complicated inter-action between molecules, made possible by atoms located in the right spaces to make bonds and interactions. High a� nity allows the protein to capture its speci� c target exclusively, even in the complex mixture of similar chemicals found inside a cell.
Currently, Strauss and Jha are working on enzymes that catalyze the degradation of paraoxon, which is a powerful insecticide that works by inhibiting a neurotransmitter. � is happens to be similar to the way sarin gas and many other nerve agents work, making paraoxon a fairly dangerous chemical that is now very rarely used in agriculture.
� e Rosetta so� ware analyzed the shape of the target paraoxon molecule to determine the complementarily shaped binding site that a protein would need to create a high-a� nity match. � e team used the so� ware to select a known enzyme as a sca� old that could support the genetic adjustments needed to create new chemical activity in the enzyme—in this case, to hypothetically bind and degrade paraoxon. � is alone would be a fantastic result: a custom-made enzyme that can degrade a powerful nerve agent.
Once Rosetta suggested billions of enzyme variants to try, the team engineered E. coli cells to produce the enzymes (one version of the enzyme per bacterium). However, individually testing the chemical contents of billions of cells for a dilute reaction product is prohibitively di� cult, so the team also added a biosensor for the reaction product to the E. coli cell.
“When paraoxon is degraded, one of the products is a molecule called p-nitrophenol, or PNP,” says Jha. “By engi-neering a protein biosensor that recognizes the PNP, we can determine that the paraoxon was successfully degraded.” For this, the team chose a transcription factor as the sca� old for their second custom binder and used Rosetta to determine the code to make it bind to the PNP product. Transcription factors turn on the expression of genes, so the team added the gene for green � uorescent protein—which causes cells to glow green—to be used as a signal to show that PNP (and paraoxon degradation) has been detected in the cell.
to winnow it down to a feasible genetic library of a billion guesses.”
2015
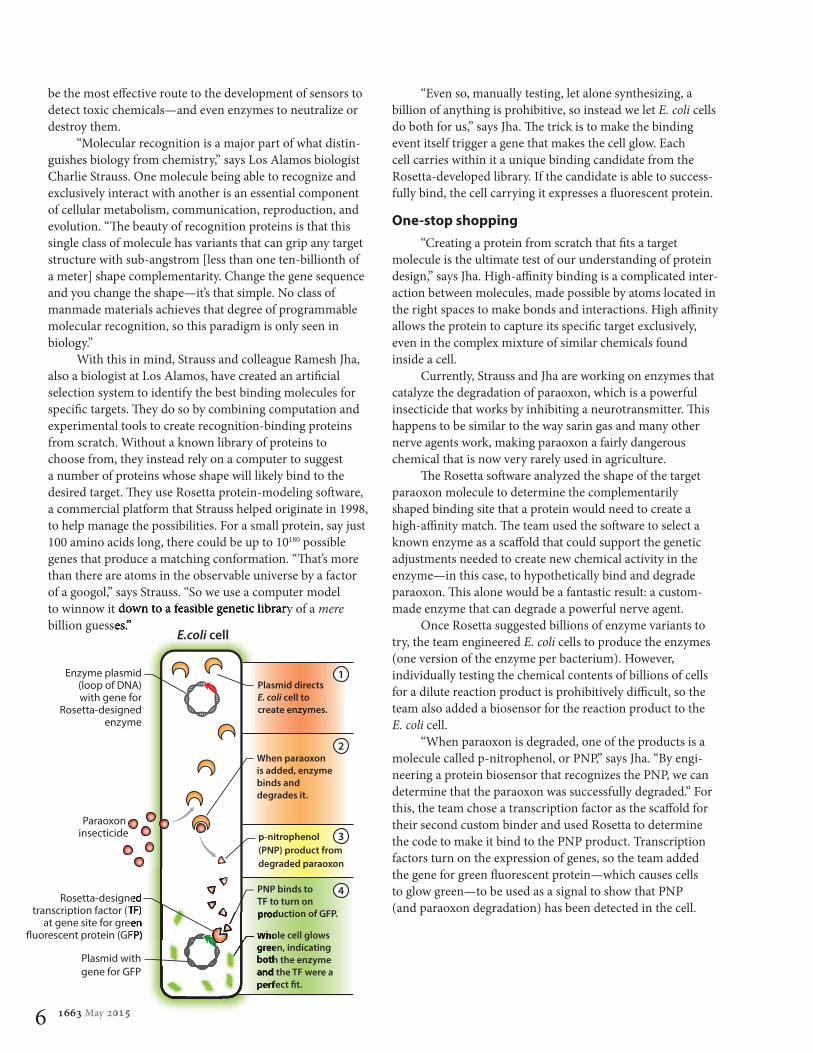
E.coli cell
Enzyme plasmid(loop of DNA)with gene for
Rosetta-designedenzyme
Paraoxon insecticide
When paraoxon is added, enzyme binds and degrades it.
p-nitrophenol (PNP) product from degraded paraoxon
PNP binds to TF to turn on production of GFP.
Whole cell glows green, indicating both the enzyme and the TF were a perfect �t.
Plasmid directs E. coli cell to create enzymes.
Rosetta-designedtranscription factor (TF)
at gene site for green�uorescent protein (GFP)
2015
production of GFP.
Whole cell glows green, indicating both the enzyme and the TF were a perfect �t.
Whole cell glows green, indicating both the enzyme and the TF were a perfect �t.
transcription factor (TF)at gene site for green
�uorescent protein (GFP)
Rosetta-designedtranscription factor (TF)
at gene site for green�uorescent protein (GFP)
1
2
3
4
Plasmid withgene for GFP
1663 May 2015 7
�is setup, which couples the catalytic event within each individual cell to a �uorescence signal, makes it possible to separate the cells using a �ow cytometer. �e glowing cells with a successfully functioning enzyme can be isolated and allowed to reproduce so the sequences for the successful enzymes can be retrieved for further analysis and iteration with Rosetta.
�e team now has three results: a customized enzyme that can bind to a chemical and catalyze its modi�cation, a transcription factor protein that can detect the reaction product, and a system for testing the e�ectiveness of each at the single-cell level. Whew.
Matchmaker, matchmakerWhat’s signi�cant about the two methods of obtaining
molecular recognition proteins—from antibody libraries or by Rosetta design—is that the binding proteins are de�ned by their genetic codes so they can be reproduced reliably and sustainably. In addition, they both use �ow cytometry (which was invented at Los Alamos, as described in the November 2013 issue of 1663) to make high-throughput screening possible. �is dramatically impacts the e�ciency of the laboratory processes, making the selection methods both speci�c and proli�c.
Reliability, sustainability, and speed are important characteristics of the next generation of biological research tools. Now that genomic sequencing is faster and readily available to scientists, the next big challenge to under-standing living systems is assigning function: matching proteins and enzymes to their genetic blueprint. In the past, this could only be accomplished by a trial-and-error approach, but new technologies, some coupled with compu-tation, are demonstrating entrance to a new era.
�is trend will open doors to many possibilities. �e most obvious ones are in the medical arena, which is espe-cially important now that microbial resistance is increasingly rendering existing drugs ine�ective. Molecules that recognize targets are the basis of many drugs and therapeutics, and being able to �nd and test the a�nity of potential new ones, as well as quickly screen them, will be critical. Furthermore, engineering custom catalysts, as demonstrated in the paraoxon detector, has a multitude of applications, ranging from production of biofuel precursors to fossil-fuel-free nylon to enzymes that help with materials manufacturing. �e key to it all is having the right �t.
—Rebecca McDonald
More protein research at Los AlamosProtein structure is key to overall protein function. Los Alamos scientists are investigating ways to analyze these structures using a number of techniques:
Determining protein structures with SOLVE/RESOLVE and Phenix software
Determining protein structures with neutron crystallography
Ribosome modeling
More protein science at Los Alamos
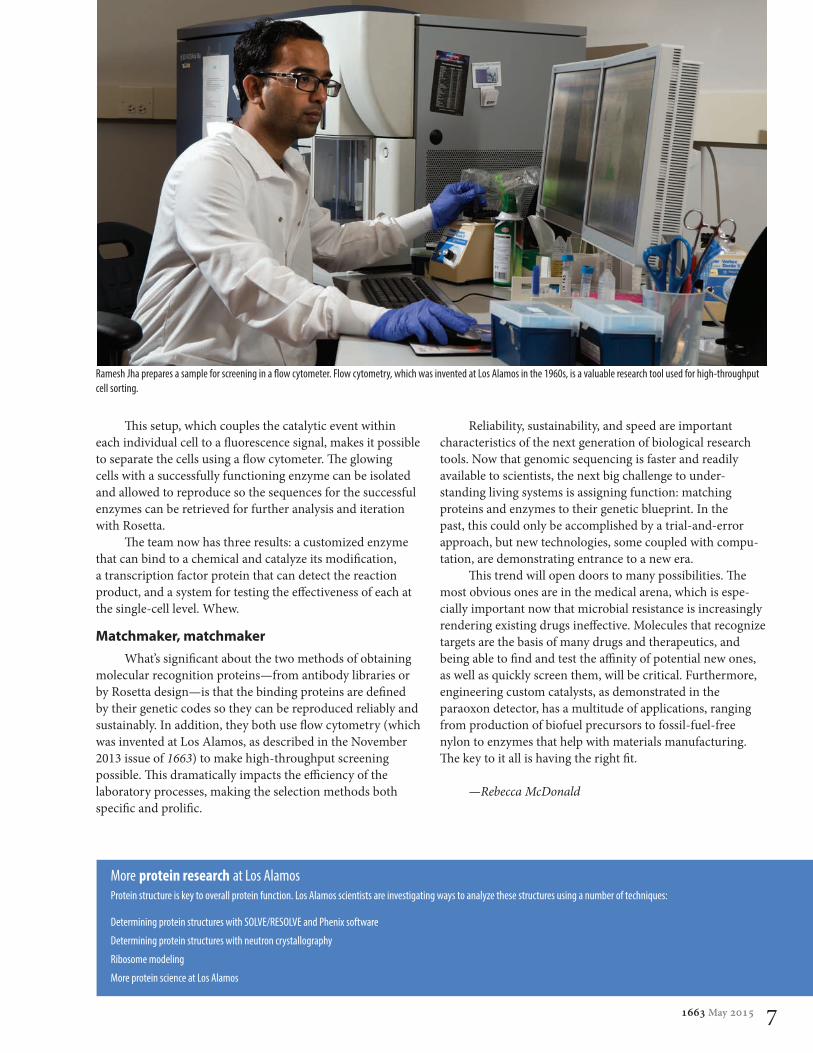
Ramesh Jha prepares a sample for screening in a �ow cytometer. Flow cytometry, which was invented at Los Alamos in the 1960s, is a valuable research tool used for high-throughput cell sorting.

8 1663 May 2015

1663 May 2015 9
SUNLIGHT IS ABUNDANT beyond the energy needs of the entire human race and completely free. Yet ironically, this free and abundant energy resource has long been deemed too expensive to harness. Photo-voltaic panels, plus systems to make them compatible with grid electricity, plus batteries to squirrel away energy for when it’s cloudy—all these add cost. And while such hardware and installation costs have diminished over time, the standard silicon solar cells they rely upon remained stubbornly expensive for most of the past quarter century.
In recent years, the picture has changed somewhat. Costs for silicon solar cells have dropped to the point where, in particularly sunny regions, solar energy can compete with higher-cost energy sources in the existing power mix. But these cost reductions have largely resulted from economies of scale, which may now have saturated. �ere is a sentiment within the industry that any future savings of signi�cance will have to derive not from further manufacturing economies but from tangible scienti�c advances in solar-harvesting materials or their processing.
Solar-harvesting materials under development at Los Alamos and elsewhere include specialized thin �lms, organic layers, semiconductor nanodevices, and others. Each has promise, and each has drawbacks. But a new class of challengers emerged a few years ago and has been improving with surprising speed since then. Known as perovskites, they are any crystalline material with the same broad class of chemical structure as a natural mineral of the same name. Perovskite solar cells are generally easy to work with, easy to adjust for improved performance, and very easy to a�ord. And in recent experiments at Los Alamos, a particular recipe has been shown to reliably generate perovskite crystals that exhibit solar conversion e�ciencies comparable to those of silicon.
“Silicon solar cells are still the gold standard. �ey’re reliable and e�cient, and they’ve been thoroughly demonstrated in the �eld,” says Los Alamos materials scientist Aditya Mohite. “But I think we can do better.”
Anatomy of a cellA standard solar cell contains an active layer, usually silicon, sand-
wiched between two electrode layers. Inside the active layer, photons of sunlight transfer energy to electrons in the material, allowing the electrons to break free from their normal energy state and enter a higher-energy state in which they can power an external circuit. �is is known as the photoelectric e�ect, and in physics parlance, these photoelectrons are said to jump across an energy gap from the valence band to the conduction band. �e gap between the two bands, or band gap, can be bigger or smaller in di�erent materials, and in silicon it happens to be nearly ideal for solar power applications.
“At �rst glance, it would seem that the smaller the band gap the better, because then a greater percentage of solar photons would have enough energy to excite an electron up to the conduction band,” explains Sergei Tretiak, a theoretical physicist on the Los Alamos team. “But then any excess energy a photon has beyond the band-gap energy is wasted.” In this sense, a higher band-gap material might be preferred; although fewer
10 1663 May 2015
be extraordinarily free of defects for the photoelectrons to reliably reach the electrode. And sometimes reaching the electrode isn’t enough; the interface between the active layer and the electrode layer can sometimes cause a photoelectron to rebound back into the crystal. �ese are the struggles associated with crystalline solar cells, and this is what Mohite is most enthusiastic about in the new Los Alamos crystals.
“We’re growing crystals with millimeter-scale, defect-free domains,” Mohite says. “�at’s unheard of. It virtually guarantees that the photoelectrons make it out.” A milli-meter may not sound like much, but the important point is that it’s 2000 times greater than the 500-nm thickness of the solar cell. So an electron has to travel up to 500 nm, possibly multiple times due to rebounds at the electrode interfaces. But while doing so, it will almost never wander far enough sideways to reach a defect at the edge of the defect-free domain. �e odds are overwhelmingly against that. As a result, the perovskite, while slightly worse than silicon in terms of its natural band gap, can be much more cheaply manufactured with excellent crystal purity.
�e secret to the team members’ success appears to reside in the way they have learned to process the perovskite. In particular, they use a technique called hot casting: coating an already hot substrate with the perovskite material in solution. And although this takes place at an elevated temperature, it is still a lower temperature (read: cheaper and easier) than that of comparable procedures for manu-facturing other types of solar-cell crystals. �e result is a surprisingly industry-adaptable crystal production process.
“Until now, growing solar crystals required high temperature or sophisticated processing,” explains Wanyi Nie. Nie and Hsinhan Tsai are postdoctoral researchers on the team, and both have been instrumental in developing the new perovskite crystals in the lab. “But here we have low temperature and easy solution processing.”
�e solution aspect is a big deal. Unlike the complex crystal-growth methodologies used to make conven-tional, state-of-the-art semiconductor solar cells, solution processing is both fast and �exible. Fast means inexpensive, and the �exibility of liquid solution-based processing means the perovskite can be applied in convenient ways, such as spraying or painting the photoelectric layer directly onto a surface, opening the door to numerous new applications.
Solar sellFor commercial success, inexpensive, low-temperature
solution processing is not enough. �e new perovskite solar cells need excellent performance as well. �at means they must be three things: e�cient, predictable, and long lasting.
solar photons would make the cut, less energy would be wasted by those that do. �e combination of the two e�ects creates a sweet spot for photoelectric energy conversion. And a�er taking into consideration the selective atmospheric absorption of sunlight at di�erent wavelengths, that sweet spot divides into two optimal peaks at about 1.1 and 1.4 elec-tronvolts (eV) of energy. �e silicon band gap is 1.1 eV, making it hard to beat (or even tie). �e team’s perovskite has a band gap of about 1.5 eV—slightly worse than silicon, but still better than a lot of other alternatives.
Once an electron jumps into the conduction band, all it has to do is move to the negative electrode without getting trapped somewhere along the way or encountering a positive “hole” le� behind when another electron made the jump. Conventional silicon solar cells, dubbed �rst-generation technology, are typically 0.1 millimeters thick, so the photo-electron needs to travel at most that far to reach an electrode. �e distance is even shorter in second- and third-generation, thin-�lm solar cells. �e perovskite layer (third generation), for example, is only 500 nanometers (nm) thick, thus requiring 200 times less material (and correspondingly less weight) than �rst-generation solar panels. Yet even 500 nm can be a long way for a photoelectron to travel unimpeded in an imperfect crystal.
Huge millimetersWhat makes silicon and other semiconductor solar cells
so expensive to make is the required purity of their crystal structure. Even the most miniscule of crystal defects creates a natural electron-trapping site, so a solar-cell crystal must
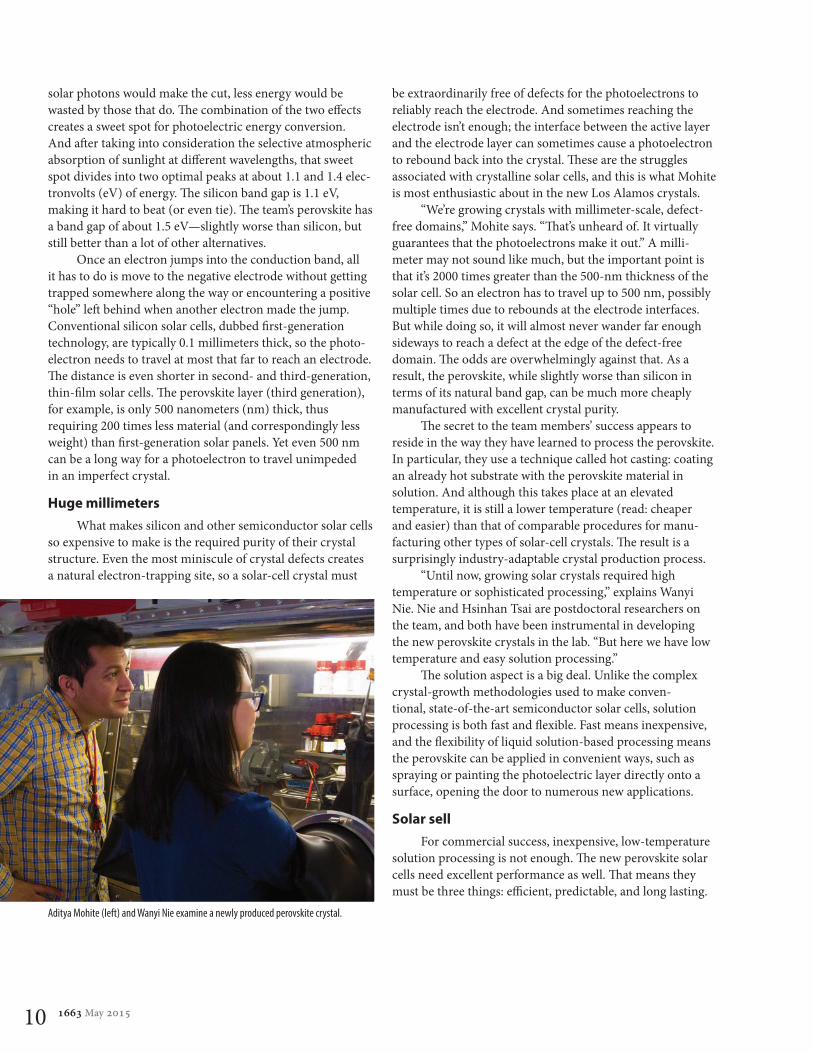
Aditya Mohite (left) and Wanyi Nie examine a newly produced perovskite crystal.
1663 May 2015 11
Silicon cells, while theoretically capable of 33 percent e�ciency, have so far reached only about 20 percent in commercial use. In other words, they convert about 20 percent of the energy in sunlight into usable electricity. �e most e�cient solar cells to date are known as multi-junction solar cells, which combine two or more absorbers with band gaps optimized for di�erent colors within sunlight. But as Mohite says, “Sure, multi-junction, NASA-quality solar cells can get you almost 40 percent, but they can’t compete commercially. We’re more than a thousand times less expensive.”
To compete, perovskites need to come close to commercial silicon’s 20 percent, and so far, the Los Alamos team is averaging 15 percent. �eir current best is 18. Yet it took decades for silicon cells to reach 20 percent, and Los Alamos got perovskites to 15 percent in just six months.
“We haven’t really tried to optimize our e�ciency yet, either,” says Hsing-Lin Wang, a Los Alamos chemist on the team. “We started with a generic perovskite and relatively common electrode materials. And our hot casting param-eters, like evaporation rate and spin rate, are probably not ideal yet. All these things can be dialed in more carefully.”
�eir perovskite, for instance, has the chemical structure CH3NH3PbX3, where the X at the end is a halide, such as chlorine, iodine, or bromium. Yet other materials that might perform better in various ways can be substituted at any part of that chemical formula. In particular, Wang believes they can adjust the material to lower the 1.5-eV band gap slightly and correspondingly increase the absorption of sunlight.
�e electrode materials could improve, too. �eir upper, positive electrode is made from indium tin oxide, a transparent conducting glass that lets sunlight through to the photoelectric layer. �eir lower, negative electrode is made of carbon fullerenes, 60-atom carbon balls. �ese materials were chosen in part because their valence energies are very close to the corresponding perovskite energies. �e carbon fullerenes have a valence energy just below the perovskite conduction energy, which helps to coax electrons from the perovskite into the electrode to power the circuit. �e valence energy of the indium tin oxide lies just above that of the perovskite, nudging electrons back into the perovskite to complete the circuit. But with a di�erent perovskite compo-sition, these energy levels would change, and other electrode materials could take advantage of the new levels better than
the current materials do. With such changes, e�ciencies are likely to improve.
In terms of predictability, the Los Alamos perovskites are already exceptional. �ey have a very narrow range of e�ciencies when produced. And their electrical performance is unusually simple. Most solar cells, including silicon, ramp up and down in voltage and current in complex ways. As a result, it is di�cult to even determine (much less implement) their optimal voltage and current settings. �e team’s perovskites do not su�er from this problem.
�e only real question is their longevity. Perovskites in general have not yet been shown to maintain their photo-electric e�ciency for long periods of time when exposed to the environment. Indeed, oxygen and humidity tend to degrade them. So the perovskites still need to be properly engineered (or at least sealed, as silicon cells are) to avoid this problem. But this is unlikely to be a deal breaker, as the more di�cult problems have already been largely overcome.
“Like silicon, our crystals absorb well across the solar spectrum, they’re defect-free over large millimeter distances, and they can be made cheaply and easily,” says Mohite. “And I’m con�dent our e�ciencies will get close to the theoretical limits.”
It might seem reasonable to take such claims with an element of skepticism. In spite of solar power’s potential to rescue humanity from its energy woes, progress has been fraught with struggles and setbacks. Yet these new perovskites are showing much more promise, advancing much more quickly, and proving to be much more problem-free than the solar-energy �eld has come to expect. And to see the enthusiasm on the team’s faces, one can’t help but think they’re on to something.
—Craig Tyler
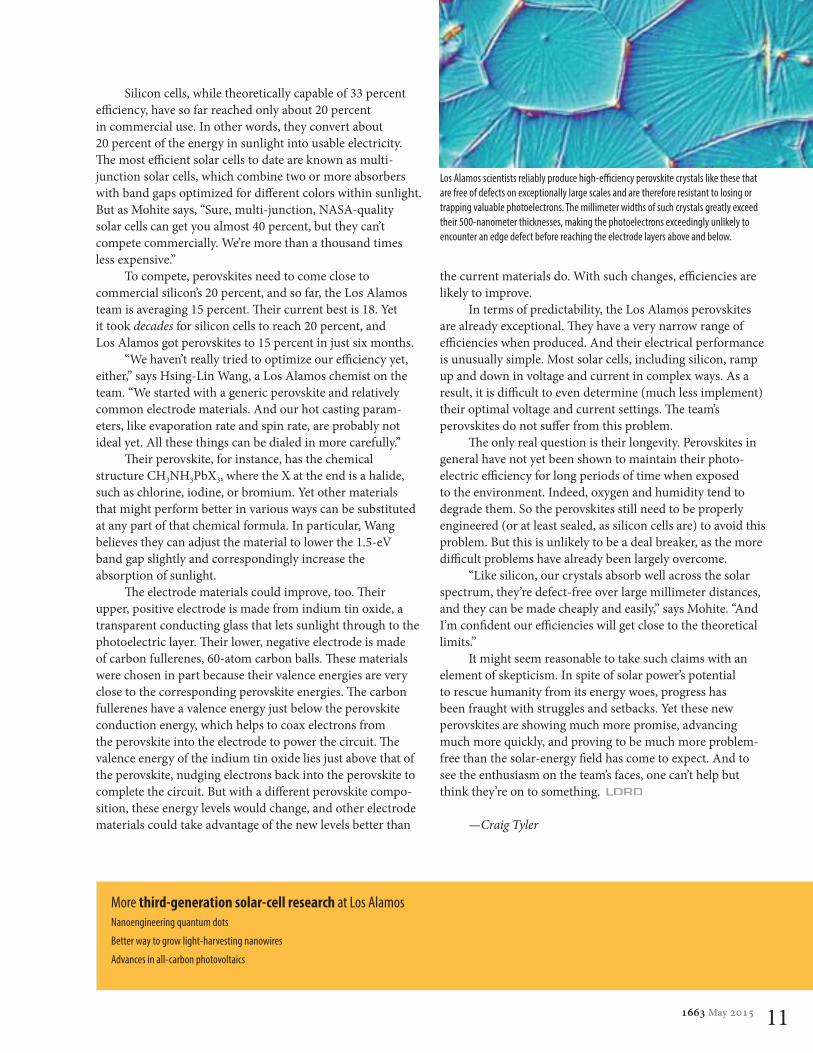
Los Alamos scientists reliably produce high-e�ciency perovskite crystals like these that are free of defects on exceptionally large scales and are therefore resistant to losing or trapping valuable photoelectrons. The millimeter widths of such crystals greatly exceed their 500-nanometer thicknesses, making the photoelectrons exceedingly unlikely to encounter an edge defect before reaching the electrode layers above and below.
More third-generation solar-cell research at Los AlamosNanoengineering quantum dots
Better way to grow light-harvesting nanowires
Advances in all-carbon photovoltaics

12 1663 May 2015
1663 May 2015 13
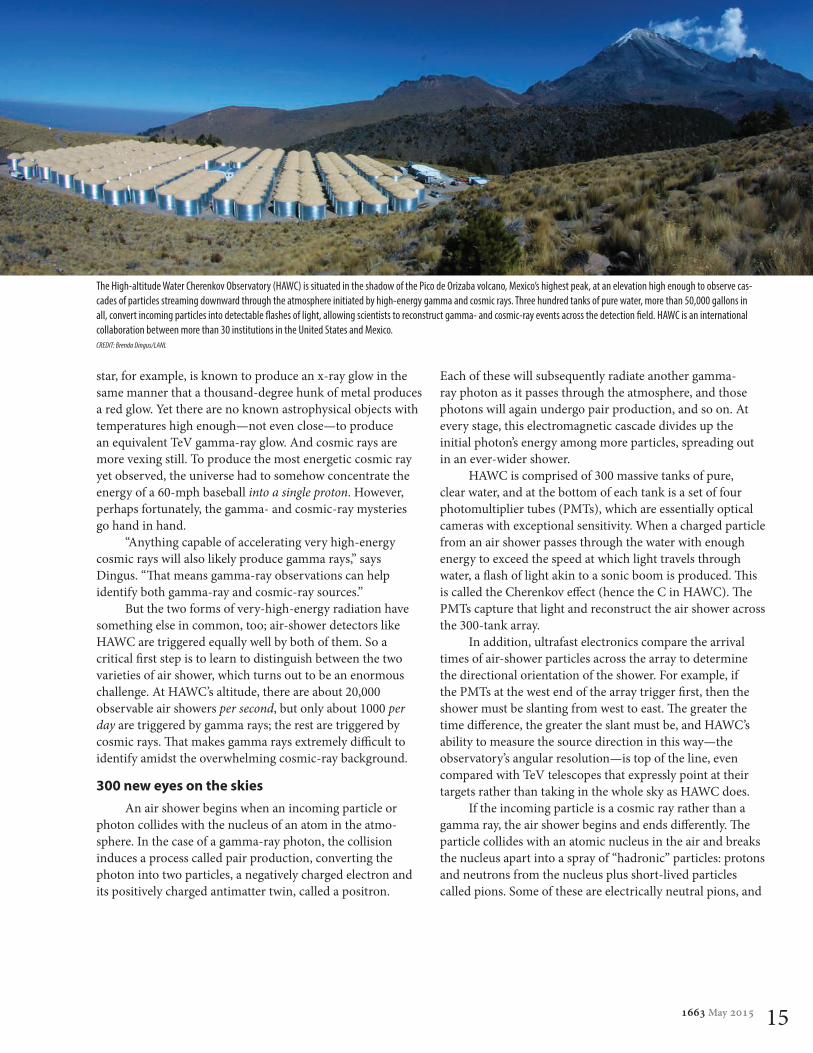
ON THE SLOPES OF PICO DE ORIZABA, the highest peak in Mexico and third highest in North America, lies the newest addition to the astronomical community’s suite of world-class observatories. At an elevation of 13,500 feet, the High-altitude Water Cherenkov Observatory, or HAWC, is ideally situated to witness upper-atmosphere events known as air showers—cascades of subatomic particles and photons of electromagnetic radiation produced whenever a high-energy gamma ray or cosmic ray hits our atmosphere. By observing air showers, HAWC indirectly observes gamma and cosmic rays.
Among more than 100 scientists from more than 30 institutions in the United States and Mexico, Los Alamos astrophysicist Brenda Dingus is the HAWC operations manager and lead investigator on several of its scienti�c grants. For her, payday has arrived—or at least, payo� day: the HAWC observatory, nearly 20 years in the making (if you count its smaller predecessor observatory in New Mexico), began full-scale science operations in March. It is now the world’s most sensitive, continuously running, wide-�eld, teraelectronvolt (TeV, or trillion electronvolt energy scale) astronomical observatory.
“HAWC sees about one-sixth of the sky at every instant and covers two-thirds of the sky during the course of the earth’s daily rotation,” explains Dingus. “And unlike most gamma-ray observatories that came before, it runs day and night, rain or shine, nearly 100 percent of the time, with excellent high-energy sensitivity. We are virtually guaranteed to make new discoveries.”
What kinds of discoveries? In some ways, the sky’s the limit. �e gamma rays observable to HAWC, ranging in energy from less than a tenth of a TeV to more than a hundred TeV, are expected to shed light on astrophysical processes in sources ranging from the local (nearby pulsars) to the distant (blazar galaxies), from the well-known (supernova remnants) to the purely theoretical (microscopic black holes), and from the ultra-bright (gamma-ray bursts) to the utterly invisible (dark matter). As for high-energy cosmic rays, HAWC can help answer the hundred-year mystery of exactly where they come from. Uncovering what secrets the jumbled rain of high-energy particles and photons above may harbor is now just a matter of time, talent, and tenacity.
Mystery rays�e universe is awash in unseen radiation, and optical
telescopes alone give us an incomplete picture. Radio tele-scopes reveal exotic new objects like pulsars and quasars not always visible in ordinary light and x-ray telescopes show us the high-temperature environment of galaxy clusters and
black holes. But there is an even higher-energy world out there, requiring other specialized telescopes to see it: the world of gamma rays and cosmic rays. And unlike optical, radio, x-ray, and all the rest, with gamma and cosmic rays, it’s o�en unclear what’s making them.
Part of the problem is the nature of the radiation itself. Gamma rays are the highest-energy variety of light and are di�cult to detect; ordinary optical components won’t do the trick. And even though the rays travel in a straight line from their astronomical source, gamma-ray instruments are less precise than those used for other wavelengths of light when resolving the location of a source. In addition, gamma-ray sources are sometimes di�use, spread out across the light years. Other times, the sources are tiny, distant dots, shining more brightly than anything else in the known universe— but only for a few seconds, then they’re gone.
Cosmic rays, meanwhile, are subatomic particles like protons and electrons, rather than photons of light, but their electrical charges cause them to turn whenever they pass through magnetic �elds. Since magnetic �elds are oriented every which way throughout the universe, cosmic rays take a complex, loopy path before �nding their way to a detector on Earth. �e distance between the Sun and the next closest star is thousands of times greater than the average radius of curvature for a TeV cosmic-ray proton in our galactic neigh-borhood. So it’s never evident where a given TeV cosmic ray originated, even if it was just next door.
�e sources of gamma and cosmic rays are not only di�cult to make out in a technical sense, but also in a theoretical sense. Both forms of radiation extend to extraor-dinarily high energies, and it’s not a simple matter to identify how they obtain those energies. A million-degree neutron
14 1663 May 2015
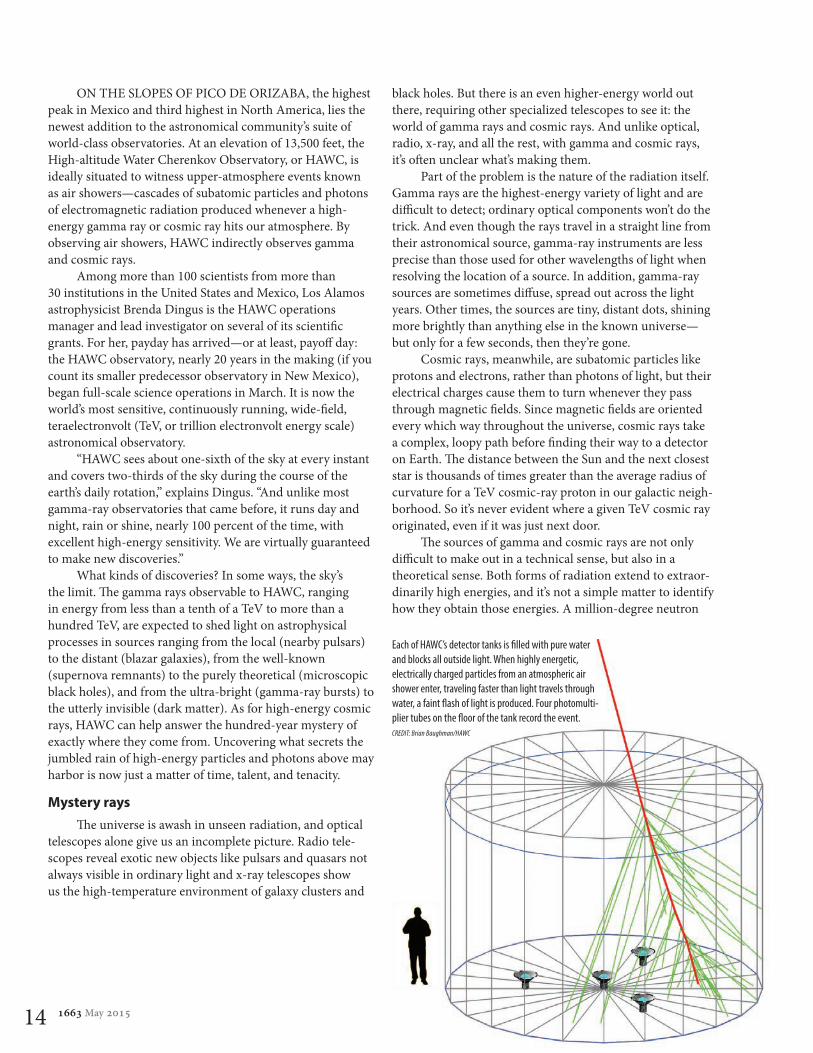
Each of HAWC’s detector tanks is �lled with pure water and blocks all outside light. When highly energetic, electrically charged particles from an atmospheric air shower enter, traveling faster than light travels through water, a faint �ash of light is produced. Four photomulti-plier tubes on the �oor of the tank record the event.CREDIT: Brian Baughman/HAWC
1663 May 2015 15
star, for example, is known to produce an x-ray glow in the same manner that a thousand-degree hunk of metal produces a red glow. Yet there are no known astrophysical objects with temperatures high enough—not even close—to produce an equivalent TeV gamma-ray glow. And cosmic rays are more vexing still. To produce the most energetic cosmic ray yet observed, the universe had to somehow concentrate the energy of a 60-mph baseball into a single proton. However, perhaps fortunately, the gamma- and cosmic-ray mysteries go hand in hand.
“Anything capable of accelerating very high-energy cosmic rays will also likely produce gamma rays,” says Dingus. “�at means gamma-ray observations can help identify both gamma-ray and cosmic-ray sources.”
But the two forms of very-high-energy radiation have something else in common, too; air-shower detectors like HAWC are triggered equally well by both of them. So a critical �rst step is to learn to distinguish between the two varieties of air shower, which turns out to be an enormous challenge. At HAWC’s altitude, there are about 20,000 observable air showers per second, but only about 1000 per day are triggered by gamma rays; the rest are triggered by cosmic rays. �at makes gamma rays extremely di�cult to identify amidst the overwhelming cosmic-ray background.
300 new eyes on the skies An air shower begins when an incoming particle or
photon collides with the nucleus of an atom in the atmo-sphere. In the case of a gamma-ray photon, the collision induces a process called pair production, converting the photon into two particles, a negatively charged electron and its positively charged antimatter twin, called a positron.
Each of these will subsequently radiate another gamma-ray photon as it passes through the atmosphere, and those photons will again undergo pair production, and so on. At every stage, this electromagnetic cascade divides up the initial photon’s energy among more particles, spreading out in an ever-wider shower.
HAWC is comprised of 300 massive tanks of pure, clear water, and at the bottom of each tank is a set of four photomultiplier tubes (PMTs), which are essentially optical cameras with exceptional sensitivity. When a charged particle from an air shower passes through the water with enough energy to exceed the speed at which light travels through water, a �ash of light akin to a sonic boom is produced. �is is called the Cherenkov e�ect (hence the C in HAWC). �e PMTs capture that light and reconstruct the air shower across the 300-tank array.
In addition, ultrafast electronics compare the arrival times of air-shower particles across the array to determine the directional orientation of the shower. For example, if the PMTs at the west end of the array trigger �rst, then the shower must be slanting from west to east. �e greater the time di�erence, the greater the slant must be, and HAWC’s ability to measure the source direction in this way—the observatory’s angular resolution—is top of the line, even compared with TeV telescopes that expressly point at their targets rather than taking in the whole sky as HAWC does.
If the incoming particle is a cosmic ray rather than a gamma ray, the air shower begins and ends di�erently. �e particle collides with an atomic nucleus in the air and breaks the nucleus apart into a spray of “hadronic” particles: protons and neutrons from the nucleus plus short-lived particles called pions. Some of these are electrically neutral pions, and
The High-altitude Water Cherenkov Observatory (HAWC) is situated in the shadow of the Pico de Orizaba volcano, Mexico’s highest peak, at an elevation high enough to observe cas-cades of particles streaming downward through the atmosphere initiated by high-energy gamma and cosmic rays. Three hundred tanks of pure water, more than 50,000 gallons in all, convert incoming particles into detectable �ashes of light, allowing scientists to reconstruct gamma- and cosmic-ray events across the detection �eld. HAWC is an international collaboration between more than 30 institutions in the United States and Mexico.CREDIT: Brenda Dingus/LANL
16 1663 May 2015
they radioactively decay into gamma rays, which subse-quently pair-produce and develop into an electromagnetic cascade, just as gamma rays born in space do. Charged pions, on the other hand, decay into several di� erent particles, including comparatively longer-lived muons. � ese muons travel through the air without interacting and continue to the ground before decaying, while the electromagnetic component of the air shower continues to make more particles (until the energy of each particle is too low to make
any more). � e result is that cosmic rays, unlike gamma rays, introduce a distinctive hadronic signature, with individual muons embedded within the wider electromagnetic shower.
HAWC and other air-shower experiments can recognize this di� erence between electromagnetic-only showers from gamma rays and showers with a hadronic component from cosmic rays. HAWC was designed to detect as many muons as possible by packing the water tanks as close together as practical. In addition, the 15-foot-tall water tanks stop the electromagnetic component in the upper few feet of water, but muons penetrate close to the PMTs at the bottom of the tank for a particularly bright � ash of light.
Sometimes, due to random chance, a hadronic event will produce very few muons, in which case they may go undetected, and the shower will be mistakenly asso-ciated with a gamma ray. � e only way to make up for this confusion is with statistics. If an excess of gamma-ray identi-� cations emerge over time from a particular part of the sky, then it is probably due to an actual gamma-ray source in that direction. � e longer HAWC observes, the more statistically signi� cant those detections become. � at’s why it acquires better results the longer it runs. In addition, collecting more data helps scientists observe the highest-energy gamma rays because the rate at which gamma rays arrive from a source decreases rapidly with energy.
Nature’s particle acceleratorsBroadly speaking, TeV gamma- and cosmic-ray
astronomy is a survey of the most energetic places in the universe, where particles are accelerated to nearly the speed of light. � ese environments include supernova-explosion shockwaves, highly magnetized neutron stars, bursts of new star formation, black holes, and more. � ese are the universe’s great particle accelerators, regularly carrying out experiments too energetic to be carried out in man-made accelerator laboratories here on Earth.
High-energy particle acceleration produces cosmic rays directly and gamma rays through the cosmic rays’ subse-quent interactions. For example, collisions between energetic cosmic-ray electrons and lower-energy photons can give the photons a boost, turning them into gamma rays. Alterna-tively, gamma rays can be produced in particle-particle colli-sions. For example, when cosmic-ray protons of su� cient energy collide with other protons (such as those that comprise the nuclei of ordinary hydrogen atoms), they produce pions. A miniscule fraction of a second later, neutral
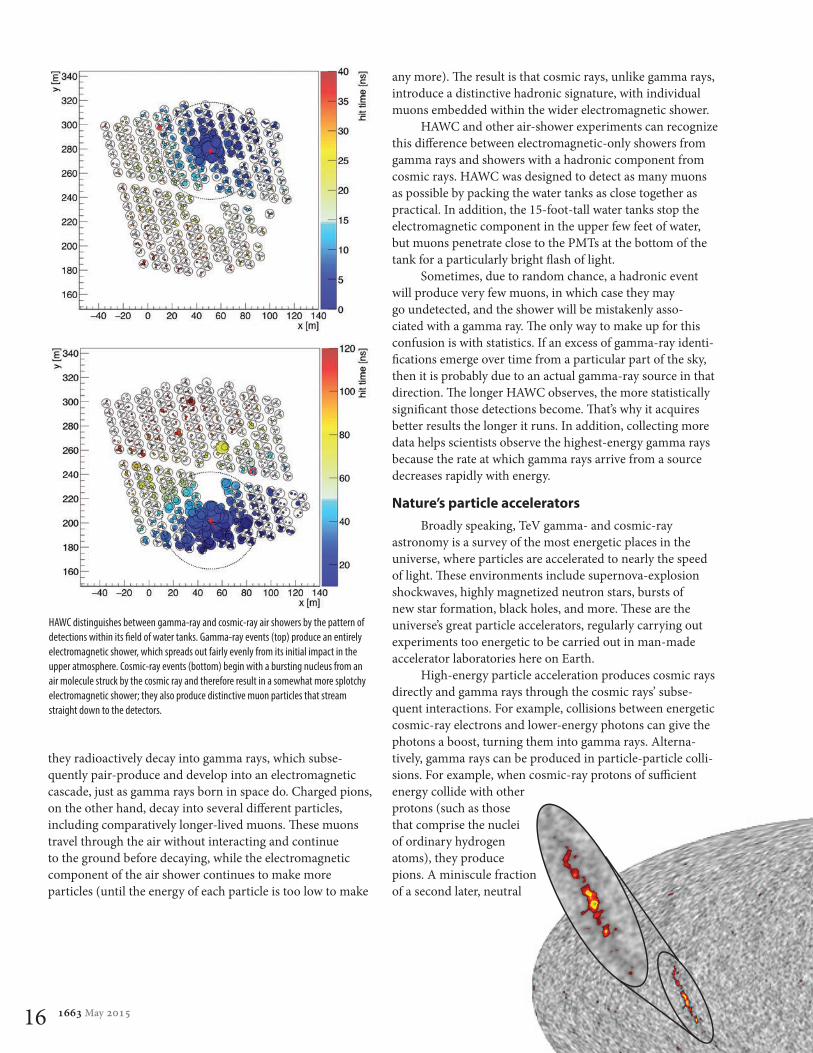
HAWC distinguishes between gamma-ray and cosmic-ray air showers by the pattern of detections within its � eld of water tanks. Gamma-ray events (top) produce an entirely electromagnetic shower, which spreads out fairly evenly from its initial impact in the upper atmosphere. Cosmic-ray events (bottom) begin with a bursting nucleus from an air molecule struck by the cosmic ray and therefore result in a somewhat more splotchy electromagnetic shower; they also produce distinctive muon particles that stream straight down to the detectors.

1663 May 2015 17
pions decay into gamma rays. In either case, cosmic rays only produce gamma rays at the site of the collision, which need not be where the cosmic rays were � rst accelerated.
A supernova resulting from the death-collapse of a star between about 10 and 30 times the mass of the Sun is illustrative, as it produces TeV gamma rays both locally and far away. Following the supernova explosion, a roiling shockwave expands outward from the blast site and pushes through gases shed by the star before it went supernova. A� er perhaps a thousand years of expansion through this gas, the shockwave develops to the point of being able to accelerate cosmic rays above TeV energies. Some of the cosmic rays will then interact with the matter near the supernova to create TeV gamma rays, but most will wander through the Galaxy for tens of millions of years before happening upon a dense cloud, colliding with its particles, and creating TeV gamma rays. In this way, cosmic rays from past supernovae can continue to produce di� use gamma rays at various locations in our galaxy and beyond, far from the initial explosion.
This early-release gamma-ray sky map from HAWC was created with data collected when only about one-third of the observatory’s collection tanks were operational. Nonetheless, it
reveals gamma rays from the disk of the Milky Way (red-yellow stripe, left), the extragalactic source Markarian 421 (a blazar, red spot, center), and the brightest gamma-ray source in our
sky, the Crab Pulsar (rainbow-colored spot, right).
� e same supernova explosion can also generate numerous gamma rays locally because it leaves behind an ultradense, ultramagnetized, and ultrarapidly spinning pulsar at its center. � e pulsar can accelerate particles, especially lightweight electrons, up to tremendous energies in what’s known as a pulsar wind nebula. Its magnetic � elds also spawn low-energy photons through an emission mechanism known as synchrotron radiation, and collisions between the accelerated electrons and the synchrotron photons yield gamma rays emanating from the immediate vicinity of the supernova.
The TeV sky“We see gamma rays of both kinds, local and di� use,”
says Dingus, pointing at the false-color, early-release gamma-ray sky map from HAWC. “� is region here”—she sweeps her hand across a broad red swath in the gamma-ray map—“that’s the galactic plane. Here we’re seeing both point sources and di� use gamma-ray light generated by cosmic rays that travel various distances across the Galaxy before colliding with something. And this here”—she points at a large red blob—“is the Crab Pulsar, a distinct compact source nearby.”
Dingus’s gamma-ray sky map was completed when only about 100 of HAWC’s detector tanks, not the full 300, were online. Even so, it reveals the Crab pulsar wind nebula with a tremendous degree of detection signi� cance. With more tanks online and more observing time, HAWC will identify more sources and leapfrog detections by earlier instruments. But one of the real prizes yet to be found in the gamma-ray
At the center of the Crab Nebula (shown here as a composite of optical and x-ray images) resides the Crab Pulsar, an ultradense, highly magnetized, rapidly spinning neutron star. It is believed to power a pulsar wind nebula, spewing very-high-energy charged particles outward. When these particles collide with the optical and infrared photons inside the Crab Nebula—the remnant of a supernova observed nearly a thousand years ago—they produce an exceptionally bright source of gamma rays. CREDIT: NASA, Chandra X-ray Observatory, SAO, DSS
18 1663 May 2015
sky would be a source with the proper energy spectrum—the right mix of higher- and lower-energy photons—to match that of very energetic cosmic rays.
“We’re searching for the smoking gun, the evidence that will �rmly identify the origin of the majority of galactic cosmic rays and di�use gamma rays,” Dingus explains. “Even though we’ve got potential sources like shockwaves and pulsars, we haven’t yet caught one in the act of producing TeV cosmic rays.” Ideally, she hopes to �nd a gamma-ray source in our galaxy that is producing gamma rays with energies high enough to be consistent with the production of the galactic cosmic rays. �is is a challenge because the conditions that could make it possible to observe that link between gamma- and cosmic-ray origins could be very speci�c, such as the shockwave in an expanding supernova remnant between 10,000 and 12,000 years a�er the initial explosion. �at would provide a window of only 2000 years—very brief in astronomical terms—to identify the culprit. �ere simply may not be a source of just the right age that’s close enough to detect. However, HAWC will perform the most sensitive search yet for such a source.
Meanwhile, HAWC’s early-release TeV cosmic-ray (not gamma-ray) map may o�er clues to other astrophysical mysteries involving cosmic-ray origins. �e map shows a mostly uniform distribution of TeV cosmic rays from every which way, as expected. But it also includes three regions of slight excess, each approximately 10 degrees wide, two
of which Dingus �rst encountered with the Milagro water-Cherenkov observatory, HAWC’s predecessor. Scientists do not yet understand the reason for these excesses.
Because local magnetic �elds will cause TeV protons to turn with a radius much smaller than the average distance between stars in the Galaxy, there isn’t any viable cosmic-ray accelerator close enough (associated with our own solar system!) to produce the excesses. �ey may be indicators of a magnetic focusing e�ect, although there is no corrobo-rating evidence for that at present. And alternative explana-tions suggest more exotic mechanisms, such as cosmic rays produced by dark matter, by a new form of quark matter, or by an unknown variety of solar magnetic e�ect. �us HAWC may become an instrument for studying not just gamma rays and cosmic rays, but exotic new physics as well.
Farther a�eldAt greater energies, cosmic rays are less a�ected by
magnetic �elds. At about 1016 eV, several orders of magnitude above the TeV level (1012 eV), cosmic rays have enough energy to escape the magnetic con�nement of the galaxy where they were born. And in intergalactic space, magnetic �elds are typically much weaker than they are inside a galaxy. By about 1019 eV, cosmic rays may travel in straight enough lines to point back to a distant extragalactic source, or at least close to it, just as the associated gamma rays do.
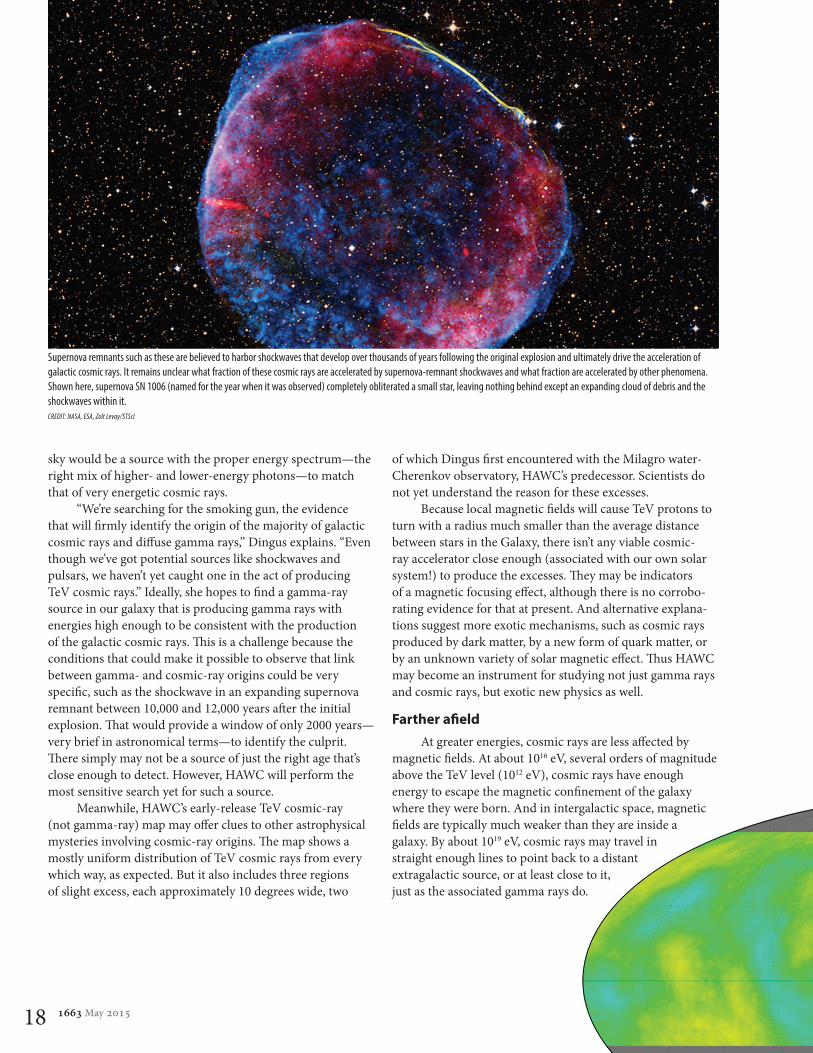
Supernova remnants such as these are believed to harbor shockwaves that develop over thousands of years following the original explosion and ultimately drive the acceleration of galactic cosmic rays. It remains unclear what fraction of these cosmic rays are accelerated by supernova-remnant shockwaves and what fraction are accelerated by other phenomena. Shown here, supernova SN 1006 (named for the year when it was observed) completely obliterated a small star, leaving nothing behind except an expanding cloud of debris and the shockwaves within it.CREDIT: NASA, ESA, Zolt Levay/STScI
1663 May 2015 19
relatively nearby if they are to arrive at Earth before colliding away their great energy. �at limits the number of possible sources within range.
HAWC is not well suited to overcome the low arrival rates of 1020-eV particles. Even the world’s largest cosmic-ray observatory, operating for over a decade, has yet to accu-mulate enough of these events to unambiguously identify their sources based on arrival directions. But the same collisions with the universe’s background radiation that limit direct-observation strategies also produce pions, which decay into observable gamma rays. �at means HAWC can probe the origins of the universe’s highest-energy particles from a di�erent angle. In so doing, it will also obtain rare insight about the intensity and makeup of the extragalactic background light—insight that will inform other aspects of extragalactic astronomy and cosmology.
Answers ahead“TeV gamma rays show up in all of the most energetic
processes in the universe,” says Dingus. “Want to know about cosmic rays a billion times more energetic than TeV? Look to TeV gamma rays. Want to know about galactic supernova remnants, pulsar wind nebulae, and black-hole binary
Known extragalactic sources capable of accelerating such high-energy cosmic rays and producing such high-energy gamma rays are some of the most energetic objects in the universe. �ey include so-called starburst galaxies, active galaxies, and gamma-ray bursts. In starburst galaxies, for example, a galaxy-wide episode of new star formation generates a large number of hot, massive, and short-lived stars that quickly run out of fuel and go supernova. �e resulting shockwave free-for-all accelerates cosmic rays, ranging up to about 1016 eV, which then interact with galactic gas to produce gamma rays, just as they do in our own galaxy. Indeed, gamma rays from a few starburst galaxies have already been observed.
Active galaxies are believed to accelerate particles to considerably higher energies. Also known as quasars, blazars, radio galaxies, and others, active galaxies are powered by supermassive black holes and are regularly observed with TeV-and-above gamma rays. Two were identi�ed in HAWC’s pre-completion early data release, hinting at a great many more—currently known and unknown—for HAWC to �nd in the coming years. With luck, HAWC may even be able to identify some of them (or other extragalactic objects) as the accelerators of the very highest-energy cosmic rays.
Cosmic rays exceeding 1020 eV are the most energetic matter ever observed, and their origin is a mystery. �ey might come from active-galaxy jets, or pulsars, or even some-thing that hasn’t been discovered yet. �e best way to �nd out is to match their arrival directions with known astrophysical sources. Unfortunately, that’s hard to do because they don’t show up very o�en. Above 1020 eV, they arrive at a rate of only about one particle per square kilometer scanned per century.
In addition, the highest-energy cosmic rays tend to lose energy as they travel through space by colliding with photons from the cosmic microwave background, the residual glow from the big bang. And to a lesser degree, somewhat lower-energy cosmic rays also lose energy in collisions with infrared photons from the extragalactic background light, a blend of radiation from active and inactive galaxies. Both backgrounds are present throughout the universe. �at means the highest-energy cosmic rays, and a fraction of those with slightly lower energy as well, must originate
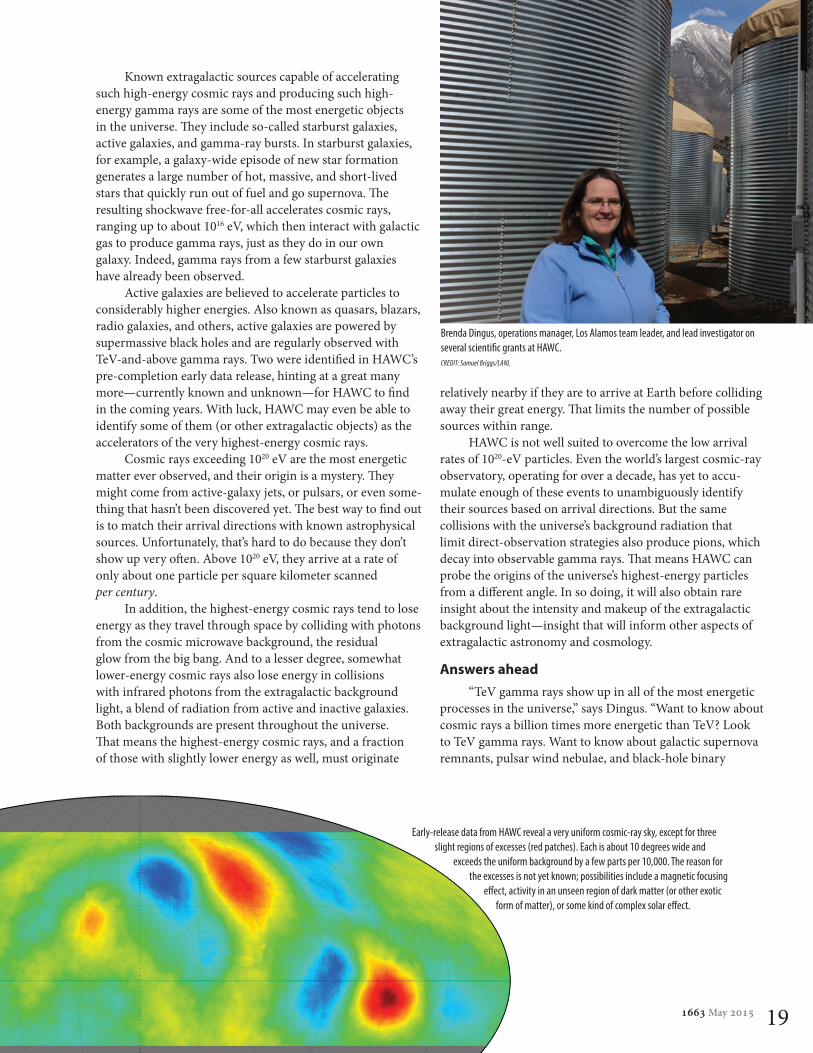
Early-release data from HAWC reveal a very uniform cosmic-ray sky, except for three slight regions of excesses (red patches). Each is about 10 degrees wide and
exceeds the uniform background by a few parts per 10,000. The reason for the excesses is not yet known; possibilities include a magnetic focusing
e�ect, activity in an unseen region of dark matter (or other exotic form of matter), or some kind of complex solar e�ect.
Brenda Dingus, operations manager, Los Alamos team leader, and lead investigator on several scienti�c grants at HAWC.CREDIT: Samuel Briggs/LANL
20 1663 May 2015
systems? Look to TeV gamma rays. Or extragalactic sources like blazars and gamma-ray bursts? Again, look to TeV gamma rays.”
Dingus explains by way of example how the HAWC collaboration recently demonstrated that the high-energy component of the most powerful gamma-ray burst yet detected would have been easily observable by HAWC (had HAWC been operational then), making HAWC the �rst ground-based observatory capable of detecting gamma rays from a gamma-ray burst. HAWC’s detection of a gamma-ray burst would give important clues about the mechanisms that produce these bright �ashes. (In earlier research, Dingus was the �rst to discover that gamma-ray bursts even have a separate high-energy component, somewhat below TeV. Most of their gamma rays are only MeV—millions, not billions or trillions, of eV.) And while gamma-ray bursts are too brief for scientists to aim their telescopes in time to witness the whole thing, HAWC takes in a large chunk of the sky at every instant, allowing it to catch the all-important initial moments of a burst.
“In fact, gamma-ray bursts aside,” Dingus says, returning to her earlier train of thought, “even if you want to know about exotic new physics, such as microscopic black holes and dark matter, look to TeV gamma rays and HAWC.” Dingus and colleagues recently showed that HAWC is sensitive to gamma-ray signals from either decaying or colliding dark-matter particles with higher masses than can be observed by other dark-matter experiments. �ey also determined that HAWC has the potential to observe one of the most speculative of exotic objects proposed to inhabit the universe, microscopic black holes.
In 1974, physicist Stephen Hawking published a calcu-lation blending the quantum mechanical and gravitational e�ects at work at the event horizon of a black hole. It was extraordinary research both because the physics of quantum gravity hadn’t yet been �gured out (and still hasn’t) and because his results revealed, quite unexpectedly, that a black hole isn’t entirely black. Rather, it shines faintly with the same spectrum of emission as a hot coal or a star. To be detectable, a black hole would have to be so small as to verge on shining itself right out of existence—a black hole more closely resem-bling a subatomic particle than a dead star—and even then it would have to be fairly close to our solar system for HAWC to pick it up. But the big bang may well have produced such microscopic black holes, and if one were ever detected, it would represent the �rst observational con�rmation of a remarkable quantum-gravity prediction that Hawking put forth in the same year when Richard Nixon resigned the presidency.
Want to know if he was right? Look to TeV gamma rays.
—Craig Tyler
High-energy
Astronomyfor National SecurityFundamental scienti�c research programs at Los Alamos, such as HAWC, provide valuable insights about nature. In addition, they often contribute to applied national security research programs—not only in terms of technology, but also in terms of training key personnel.
For example, the emerging generation of researchers working on a recent series of successful nuclear weapons experiments, the Gemini tests, all started their Los Alamos careers with fundamental-science programs. (The Gemini experiments were well-instrumented “subcritical” weapons tests using a plutonium mass too small to produce a self-sustaining nuclear chain reaction; see “Critical Subcriticals” in the August 2014 issue of 1663.) HAWC itself has an excel-lent track record when it comes to training scientists for national security research.
Gus Sinnis joined Los Alamos as a founder and co-spokes-person for the Milagro experiment, HAWC’s predecessor, and went on to join HAWC afterward. He now leads the Los Alamos Neutron Science Center Weapons Physics Group.
Todd Haines was a founding member of the Milagro col-laboration. Before HAWC began, he started working on subcritical experiments and now leads a radiography team responsible for the development of enhanced subcritical experiments.
Patrick Younk joined Los Alamos as a postdoctoral researcher on HAWC. He was tasked with the mechani-cal design of the detector, pre-installation testing of its photomultiplier tubes, and the development of a high-level data analysis framework. Through association with other weapons physicists in his group, he then became interested in the subcritical testing program as well and currently devotes most of his time there.
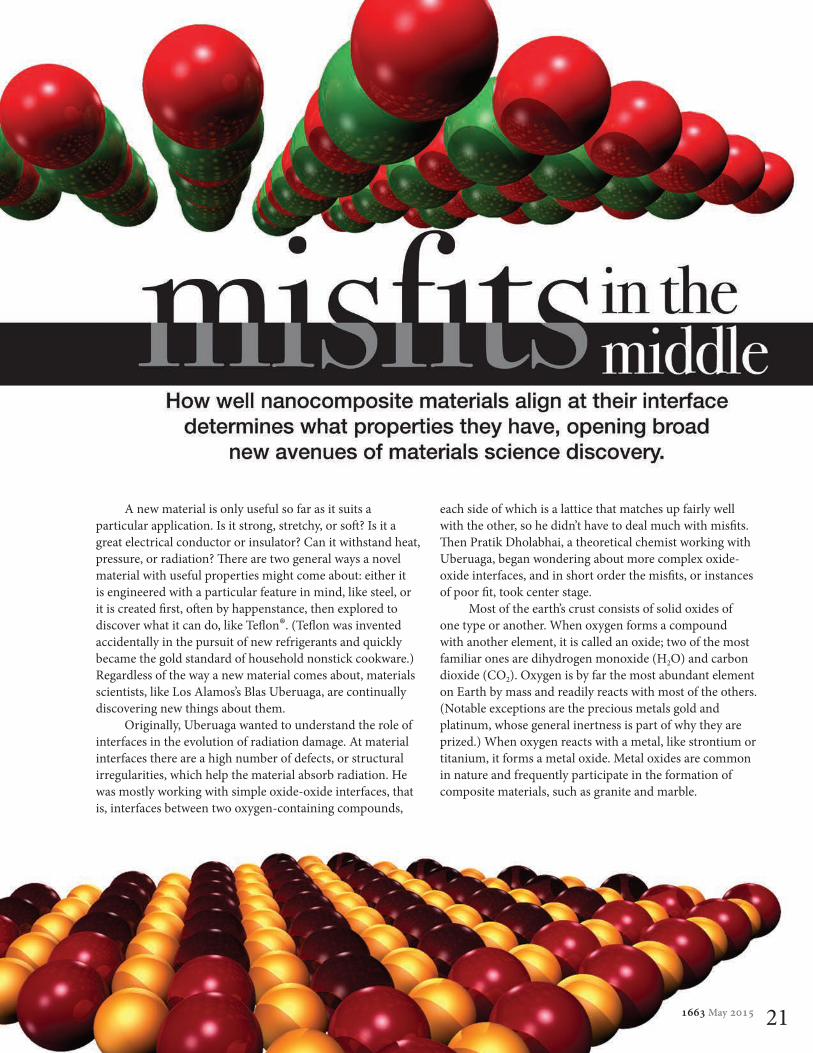
A new material is only useful so far as it suits a particular application. Is it strong, stretchy, or so�? Is it a great electrical conductor or insulator? Can it withstand heat, pressure, or radiation? �ere are two general ways a novel material with useful properties might come about: either it is engineered with a particular feature in mind, like steel, or it is created �rst, o�en by happenstance, then explored to discover what it can do, like Te�on®. (Te�on was invented accidentally in the pursuit of new refrigerants and quickly became the gold standard of household nonstick cookware.) Regardless of the way a new material comes about, materials scientists, like Los Alamos’s Blas Uberuaga, are continually discovering new things about them.
Originally, Uberuaga wanted to understand the role of interfaces in the evolution of radiation damage. At material interfaces there are a high number of defects, or structural irregularities, which help the material absorb radiation. He was mostly working with simple oxide-oxide interfaces, that is, interfaces between two oxygen-containing compounds,
each side of which is a lattice that matches up fairly well with the other, so he didn’t have to deal much with mis�ts. �en Pratik Dholabhai, a theoretical chemist working with Uberuaga, began wondering about more complex oxide-oxide interfaces, and in short order the mis�ts, or instances of poor �t, took center stage.
Most of the earth’s crust consists of solid oxides of one type or another. When oxygen forms a compound with another element, it is called an oxide; two of the most familiar ones are dihydrogen monoxide (H2O) and carbon dioxide (CO2). Oxygen is by far the most abundant element on Earth by mass and readily reacts with most of the others. (Notable exceptions are the precious metals gold and platinum, whose general inertness is part of why they are prized.) When oxygen reacts with a metal, like strontium or titanium, it forms a metal oxide. Metal oxides are common in nature and frequently participate in the formation of composite materials, such as granite and marble.
1663 May 2015 21
22 1663 May 2015
Displacement Displacement
Ener
gy
Energy
S2
S1S3 S3 S3S1
S2
S1
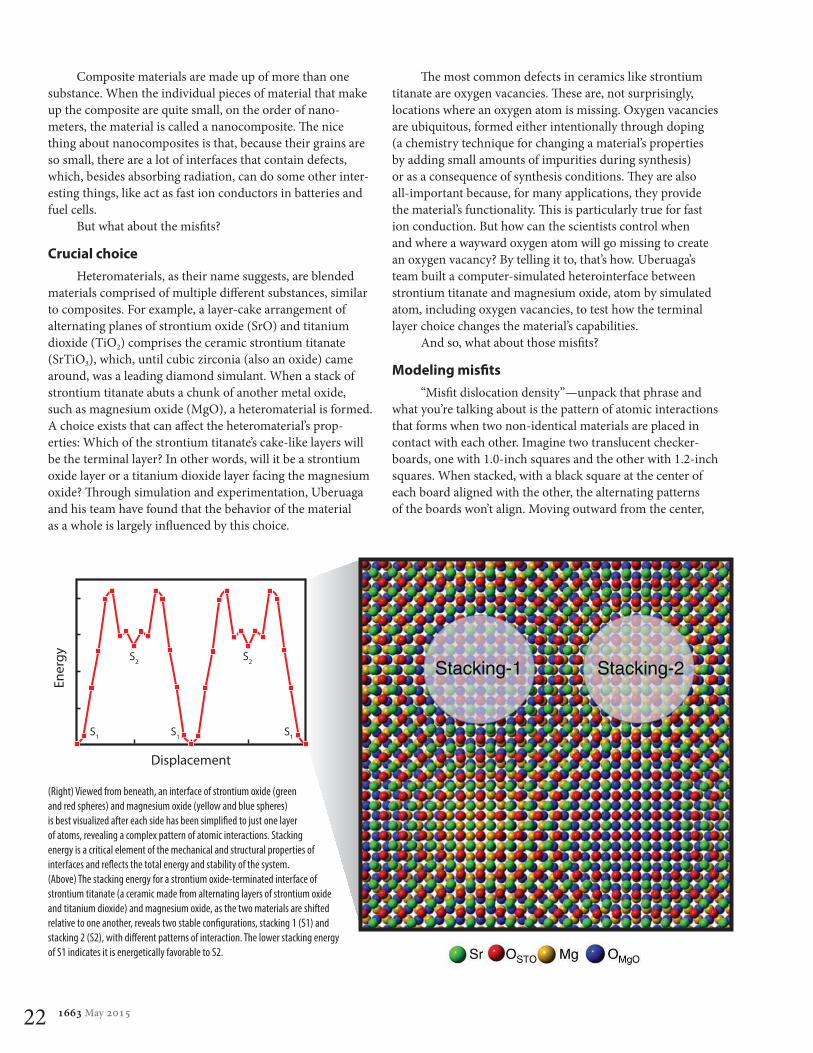
�e most common defects in ceramics like strontium titanate are oxygen vacancies. �ese are, not surprisingly, locations where an oxygen atom is missing. Oxygen vacancies are ubiquitous, formed either intentionally through doping (a chemistry technique for changing a material’s properties by adding small amounts of impurities during synthesis) or as a consequence of synthesis conditions. �ey are also all-important because, for many applications, they provide the material’s functionality. �is is particularly true for fast ion conduction. But how can the scientists control when and where a wayward oxygen atom will go missing to create an oxygen vacancy? By telling it to, that’s how. Uberuaga’s team built a computer-simulated heterointerface between strontium titanate and magnesium oxide, atom by simulated atom, including oxygen vacancies, to test how the terminal layer choice changes the material’s capabilities.
And so, what about those mis�ts?
Modeling mis�ts“Mis�t dislocation density”—unpack that phrase and
what you’re talking about is the pattern of atomic interactions that forms when two non-identical materials are placed in contact with each other. Imagine two translucent checker-boards, one with 1.0-inch squares and the other with 1.2-inch squares. When stacked, with a black square at the center of each board aligned with the other, the alternating patterns of the boards won’t align. Moving outward from the center,
(Right) Viewed from beneath, an interface of strontium oxide (greenand red spheres) and magnesium oxide (yellow and blue spheres) is best visualized after each side has been simpli�ed to just one layer of atoms, revealing a complex pattern of atomic interactions. Stackingenergy is a critical element of the mechanical and structural properties of interfaces and re�ects the total energy and stability of the system. (Above) The stacking energy for a strontium oxide-terminated interface of strontium titanate (a ceramic made from alternating layers of strontium oxide and titanium dioxide) and magnesium oxide, as the two materials are shifted relative to one another, reveals two stable con�gurations, stacking 1 (S1) and stacking 2 (S2), with di�erent patterns of interaction. The lower stacking energy of S1 indicates it is energetically favorable to S2.
Composite materials are made up of more than one substance. When the individual pieces of material that make up the composite are quite small, on the order of nano-meters, the material is called a nanocomposite. �e nice thing about nanocomposites is that, because their grains are so small, there are a lot of interfaces that contain defects, which, besides absorbing radiation, can do some other inter-esting things, like act as fast ion conductors in batteries and fuel cells.
But what about the mis�ts?
Crucial choiceHeteromaterials, as their name suggests, are blended
materials comprised of multiple di�erent substances, similar to composites. For example, a layer-cake arrangement of alternating planes of strontium oxide (SrO) and titanium dioxide (TiO2) comprises the ceramic strontium titanate (SrTiO3), which, until cubic zirconia (also an oxide) came around, was a leading diamond simulant. When a stack of strontium titanate abuts a chunk of another metal oxide, such as magnesium oxide (MgO), a heteromaterial is formed. A choice exists that can a�ect the heteromaterial’s prop-erties: Which of the strontium titanate’s cake-like layers will be the terminal layer? In other words, will it be a strontium oxide layer or a titanium dioxide layer facing the magnesium oxide? �rough simulation and experimentation, Uberuaga and his team have found that the behavior of the material as a whole is largely in�uenced by this choice.
1663 May 2015 23
Displacement Displacement
Ener
gy
Energy
S2
S1S3 S3 S3S1
S2
S1
toward understanding the chemistry that happens at the interface,” says Dholabhai. By studying mis�t dislocation structures, he and Uberuaga can extrapolate a more general understanding of how to tweak heteromaterials to better perform a given task. For acting as a radiation-damage sink, more mis�ts are best, as they can lead to more defects. For ferroelectric applications, higher strain and fewer mis�ts are preferred.
�e surprising result from the computer simulations is that the pattern of mis�ts is dictated by the chemistry of the terminating layer. “If you change the chemistry, you change the functionality,” says Uberuaga. But there are limits to the “tunability” of the model. �e terminal layer can be altered or the component crystals can be rotated, relative to the other side of the interface. �ese modi�cations are considerably easier to make in computer simulations than in the labo-ratory. But Uberuaga, being somewhat of a mis�t himself, sees no reason why that should stop them. “�is is the kind of discovery that can make the foundation for an academic career,” he says. “It is the beginning of a whole new avenue of exploration.” Who knows? Tomorrow’s Te�on-caliber materials discovery could be just around the corner, and Los Alamos scientists don’t intend to wait to stumble upon it by accident.
—Eleanor Hutterer
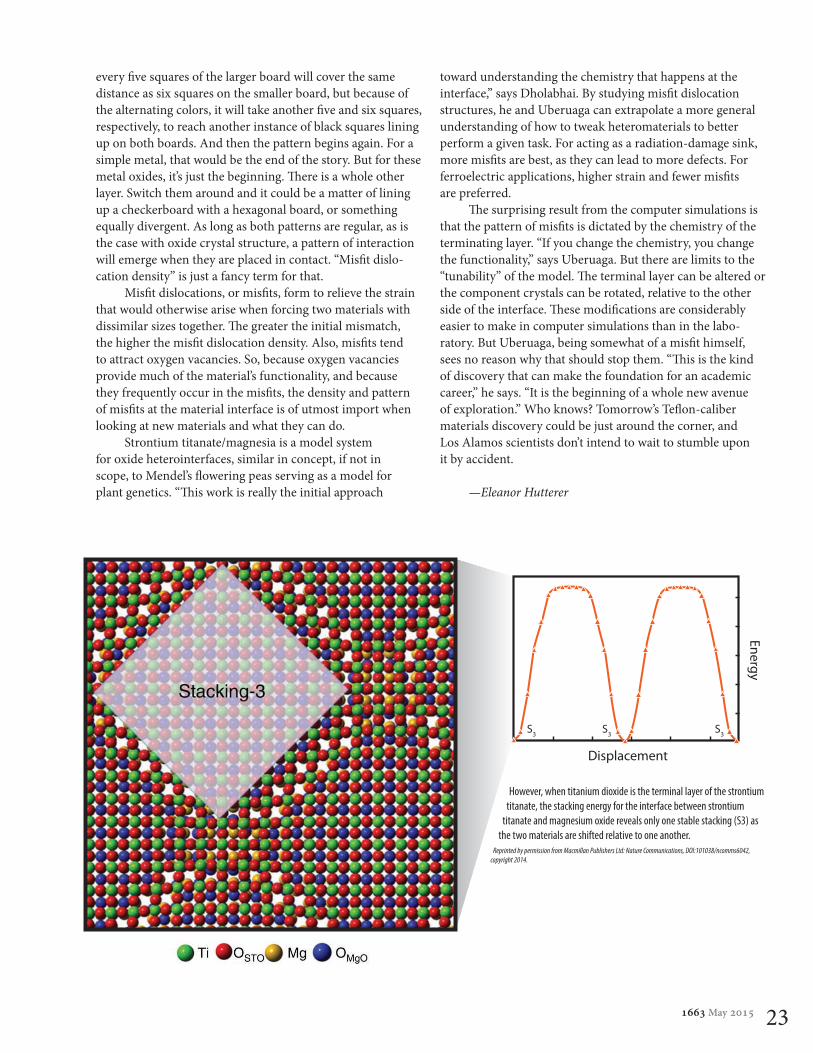
However, when titanium dioxide is the terminal layer of the strontium titanate, the stacking energy for the interface between strontium
titanate and magnesium oxide reveals only one stable stacking (S3) as the two materials are shifted relative to one another.
Reprinted by permission from Macmillan Publishers Ltd: Nature Communications, DOI:101038/ncomms6042, copyright 2014.
every �ve squares of the larger board will cover the same distance as six squares on the smaller board, but because of the alternating colors, it will take another �ve and six squares, respectively, to reach another instance of black squares lining up on both boards. And then the pattern begins again. For a simple metal, that would be the end of the story. But for these metal oxides, it’s just the beginning. �ere is a whole other layer. Switch them around and it could be a matter of lining up a checkerboard with a hexagonal board, or something equally divergent. As long as both patterns are regular, as is the case with oxide crystal structure, a pattern of interaction will emerge when they are placed in contact. “Mis�t dislo-cation density” is just a fancy term for that.
Mis�t dislocations, or mis�ts, form to relieve the strain that would otherwise arise when forcing two materials with dissimilar sizes together. �e greater the initial mismatch, the higher the mis�t dislocation density. Also, mis�ts tend to attract oxygen vacancies. So, because oxygen vacancies provide much of the material’s functionality, and because they frequently occur in the mis�ts, the density and pattern of mis�ts at the material interface is of utmost import when looking at new materials and what they can do.
Strontium titanate/magnesia is a model system for oxide heterointerfaces, similar in concept, if not in scope, to Mendel’s �owering peas serving as a model for plant genetics. “�is work is really the initial approach

Forecasting isn’t just for sunny skies and drizzly days.
Los Alamos scientists are now using open-access digital data
to accurately forecast fl u and other important infectious diseases.
24 1663 May 2015 Wikipedia graphic elements courtesy of Wikimedia Foundation
In this Information Age, the answer to nearly any question is just a couple of clicks away. Got a question? Google it, then click the most promising result. � at’s all there is to it. We all do it—it’s become standard oper-ating procedure for information-seeking in the modern, wired world. And it’s not just curiosities and factoids, like the rules to unicycle hockey or the gross domestic product of Wales; infor-mation on important events and changing trends is sought in the same way.
� e 2014–2015 � u season has died down, and so too, for
now, has tra� c on � u-related websites. When someone thinks he might have the � u, the � rst thing he does (maybe the second thing, a� er changing into pajamas) is to Google his symptoms: “fever and cough,” or minimally, “� u,” searching for con� rmation of his suspected diagnosis and maybe a way to beat it. Frequently, among the top search results, is a Wikipedia article containing a wealth of infor-mation on in� uenza, similar illnesses, symptoms, treatments, complications, history, and more. Because so many people use Wikipedia, and because all this activity creates records, (i.e., data), the result is essentially a real-time, worldwide survey of what’s on people’s minds. Now, a charismatic multi-disciplinary team of researchers at Los Alamos has tapped into this rich resource with the aim of forecasting infectious disease outbreaks more precisely and more broadly than has ever been done before.
“Most infectious disease modeling has sought to understand disease dynamics. It’s only recently that there has been much thought given to actual forecasting,” says applied mathematician Sara Del Valle, who heads the team.
Forecasting, she explains, is o� en erroneously equated with predicting. Whereas a prediction portends a discrete onset of a future event, a forecast is rooted in the present moment. It takes a phenomenon that is already underway, looks at what has happened so far, and makes forward projections of what is likely to happen in the near future. Using data from Wiki-pedia, Del Valle and her team have demonstrated the success of their forecasting model and now are taking it up a notch.
Quality of dataLaunched in 2001, Wikipedia has become the most
frequently accessed website worldwide that is neither social-media platform nor search engine. It is a free, open-access, online encyclopedia that exists in hundreds of languages throughout the virtual world. � e site’s content can be edited by anyone who has something to add and cares to take the time to register. (� ere are roughly 70,000 regular contrib-utors and editors, who get to call themselves “Wikipedians.”)
� e Wikimedia Foundation is a nonpro� t organization that provides a home for Wikipedia but does not govern it. In the spirit of public service, the foundation’s mission includes full transparency, open accessibility, and unre-stricted dissemination. In addition to Wikipedia’s content being available to all, data about the content, like how o� en it’s viewed or edited, is also available to anyone who asks. Every time a page is viewed, an anonymous record is created, and those aggregated records are available for free, in their entirety, updated every hour going back to 2007. Anyone can � nd out how many times the unicycle hockey article has been viewed in any language for any time frame. � is is consid-erably better than other Internet activity-based massive data sets, some of which charge high fees or only provide certain types or quantities of data.
� is is part of what makes the Los Alamos team’s fore-casting model unique. Other e� orts have relied on di� erent types of data or been structured di� erently. For example, Google search terms can be used to see what kind of health information people are seeking and Twitter feeds can be used
Contents [hide]
1 Introduction 1.1 Forecasting 1.2 Sara Del Valle2 Quality of data 2.1 Open access 2.2 Similar projects 2.3 Language and location3 Quantity of data 3.1 Aggregated counts 3.2 Reid Priedhorsky 3.3 Geoffrey Fairchild 3.4 Transposition 3.5 Contexts and correlates4 Proof of principle 4.1 Nowcasting 4.2 Ground truthing 4.3 Nick Generous 4.4 Kyle Hickmann5 Forecasting fl u 5.1 CDC infl uenza challenge 5.2 ILI and SEIR6 The future of forecasting 6.1 Transferability 6.2 Next steps 6.3 Biosurveillance Gateway 6.4 Alina Deshpande 6.5 Renewed interest
1663 May 2015 25
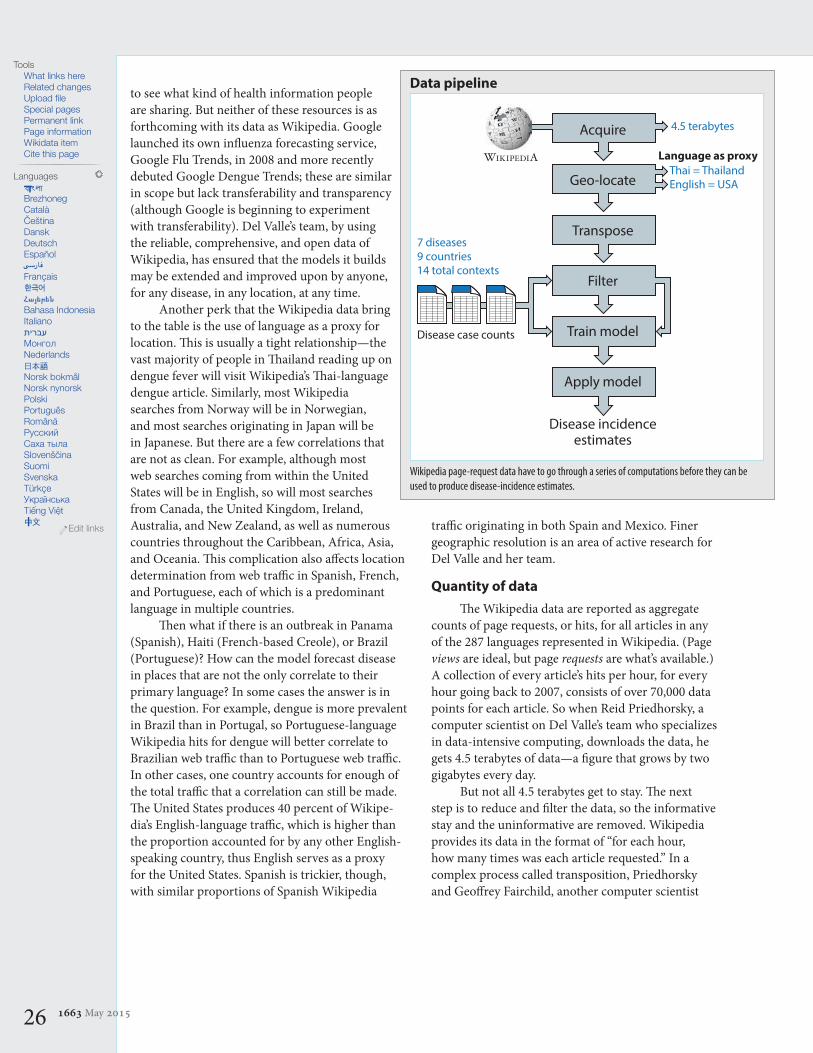
to see what kind of health information people are sharing. But neither of these resources is as forthcoming with its data as Wikipedia. Google launched its own in� uenza forecasting service, Google Flu Trends, in 2008 and more recently debuted Google Dengue Trends; these are similar in scope but lack transferability and transparency (although Google is beginning to experiment with transferability). Del Valle’s team, by using the reliable, comprehensive, and open data of Wikipedia, has ensured that the models it builds may be extended and improved upon by anyone, for any disease, in any location, at any time.
Another perk that the Wikipedia data bring to the table is the use of language as a proxy for location. � is is usually a tight relationship—the vast majority of people in � ailand reading up on dengue fever will visit Wikipedia’s � ai-language dengue article. Similarly, most Wikipedia searches from Norway will be in Norwegian, and most searches originating in Japan will be in Japanese. But there are a few correlations that are not as clean. For example, although most web searches coming from within the United States will be in English, so will most searches from Canada, the United Kingdom, Ireland, Australia, and New Zealand, as well as numerous countries throughout the Caribbean, Africa, Asia, and Oceania. � is complication also a� ects location determination from web tra� c in Spanish, French, and Portuguese, each of which is a predominant language in multiple countries.
� en what if there is an outbreak in Panama (Spanish), Haiti (French-based Creole), or Brazil (Portuguese)? How can the model forecast disease in places that are not the only correlate to their primary language? In some cases the answer is in the question. For example, dengue is more prevalent in Brazil than in Portugal, so Portuguese-language Wikipedia hits for dengue will better correlate to Brazilian web tra� c than to Portuguese web tra� c. In other cases, one country accounts for enough of the total tra� c that a correlation can still be made. � e United States produces 40 percent of Wikipe-dia’s English-language tra� c, which is higher than the proportion accounted for by any other English-speaking country, thus English serves as a proxy for the United States. Spanish is trickier, though, with similar proportions of Spanish Wikipedia
tra� c originating in both Spain and Mexico. Finer geographic resolution is an area of active research for Del Valle and her team.
Quantity of data� e Wikipedia data are reported as aggregate
counts of page requests, or hits, for all articles in any of the 287 languages represented in Wikipedia. (Page views are ideal, but page requests are what’s available.) A collection of every article’s hits per hour, for every hour going back to 2007, consists of over 70,000 data points for each article. So when Reid Priedhorsky, a computer scientist on Del Valle’s team who specializes in data-intensive computing, downloads the data, he gets 4.5 terabytes of data—a � gure that grows by two gigabytes every day.
But not all 4.5 terabytes get to stay. � e next step is to reduce and � lter the data, so the informative stay and the uninformative are removed. Wikipedia provides its data in the format of “for each hour, how many times was each article requested.” In a complex process called transposition, Priedhorsky and Geo� rey Fairchild, another computer scientist
Data pipeline
Wikipedia page-request data have to go through a series of computations before they can be used to produce disease-incidence estimates.
0
1
2
3
4
5
6
7
33 34 35 36 37 38 38 40 41 42 43 44 45 46 47 48 49 50 51 52
Epidemic Week
% V
isits
for I
LI
1 2 3 4 5 6 7 8 9 10 11 12 13 14 15 16 17 18 19 20
Median Prior ForcastILI Data
Acquire
Geo-locate
Transpose
Filter
Train model
Apply model
Disease incidenceestimates
WIKIPEDIA
7 diseases9 countries14 total contexts
Disease case counts
4.5 terabytes
Thai = ThailandEnglish = USA
Language as proxy
9K
8K
7K
6K
5K
4K
3K
2K
1K
0
9K
8K
7K
6K
5K
4K
3K
2K
1K
0
0 0
0
0
0
1
1
1
1
2011 2012 2013
2011 2012 2013
2011 2012 2013
2011 2012 2013
O�cial Model Wikipedia
1
2
3
4
5
6
7
0
2K
4K
6K
8K
10K
12K
14K
Tuberculosis, China
Art
icle
acc
esse
sA
rtic
le a
cces
ses
Art
icle
acc
esse
sA
rtic
le a
cces
ses
Case
s per
100
K po
pula
tion
% IL
ICa
ses
Case
s
Dengue, Brazil
In�uenza, Poland
In�uenza, United States
26 1663 May 2015
Tools What links here Related changes Upload file Special pages Permanent link Page information Wikidata item Cite this page
Languages
Brezhoneg Català Čeština Dansk Deutsch Español
Français
Bahasa Indonesia Italianoעברית Монгол Nederlands
Norsk bokmål Norsk nynorsk Polski Português Română Русский Саха тыла Slovenščina Suomi Svenska Türkçe Українська Tiếng Việt
Edit links

and programmer on the team, change the format subtly but importantly to “for each article, how many times was it requested each hour.” � is generates a time series across which the researchers can identify windows of unusually high tra� c to that page, which appear in the time series as peaks rising above the background noise.
Each article also has dozens of links to similar articles (e.g., “In� uenza virus,” “Swine in� uenza,” and “Viral pneu-monia,” all link to the “In� uenza” article). � ese get ranked based on correlation to the best available public-health data, such as in� uenza statistics from the Centers for Disease Control and Prevention (CDC), and the 10 best-correlated articles are included in the analysis. � e team groups disease articles in particular languages with speci� c countries, creating disease-country pairs, which are referred to as “contexts.” So in� uenza in the United States (English language) will be a di� erent context from plague in the United States and also from in� uenza in Poland (Polish language). By choosing speci� c and diverse contexts in this way, and further widening their net by including correlated articles, Fair-child and Priedhorsky built a robust proving ground for the � edgling forecast system. � e 14 contexts used for their pilot study were: in� uenza in Japan, Poland, � ailand, and the United States; tuberculosis in China, Norway, and � ailand; dengue in Brazil and � ailand; HIV in China
and Japan; cholera in Haiti; Ebola in Uganda; and plague in the United States. � e next step was to test the predictive power of Wikipedia tra� c to each context against actual case data from the chosen countries.
Proof of principleEpidemiologists and other disease detectives rarely
know the state of a� airs at the present moment. Usually the best they can do is the state of a� airs last week or two weeks ago. Because actual case data, like in� uenza infection rates, need to be collected and tabulated by clinics and counties
0
1
2
3
4
5
6
7
33 34 35 36 37 38 38 40 41 42 43 44 45 46 47 48 49 50 51 52
Epidemic Week
% V
isits
for I
LI
1 2 3 4 5 6 7 8 9 10 11 12 13 14 15 16 17 18 19 20
Median Prior ForcastILI Data
Acquire
Geo-locate
Transpose
Filter
Train model
Apply model
Disease incidenceestimates
WIKIPEDIA
7 diseases9 countries14 total contexts
Disease case counts
4.5 terabytes
Thai = ThailandEnglish = USA
Language as proxy
9K
8K
7K
6K
5K
4K
3K
2K
1K
0
9K
8K
7K
6K
5K
4K
3K
2K
1K
0
0 0
0
0
0
1
1
1
1
2011 2012 2013
2011 2012 2013
2011 2012 2013
2011 2012 2013
O�cial Model Wikipedia
1
2
3
4
5
6
7
0
2K
4K
6K
8K
10K
12K
14K
Tuberculosis, China
Art
icle
acc
esse
sA
rtic
le a
cces
ses
Art
icle
acc
esse
sA
rtic
le a
cces
ses
Case
s per
100
K po
pula
tion
% IL
ICa
ses
Case
s
Dengue, Brazil
In�uenza, Poland
In�uenza, United States
1663 May 2015 27
The Los Alamos team’s proof-of-principle study used 14 di� erent contexts (disease-location pairings) to determine whether Wikipedia page-request data can be used to infer disease incidence. Eight of the 14 were successful with four of the best shown above. O� cial case counts (blue) were matched by the model’s predictions (red), which were based on the � ve Wikipedia pages found to be best correlated to the o� cial data (gray).
0
1
2
3
4
5
6
7
33 34 35 36 37 38 38 40 41 42 43 44 45 46 47 48 49 50 51 52
Epidemic Week
% V
isits
for I
LI
1 2 3 4 5 6 7 8 9 10 11 12 13 14 15 16 17 18 19 20
Median Prior ForcastILI Data
acquire
geo-locate
transpose
�lter
train model
apply model
disease incidenceestimates
WikipediA
Del Valle’s experiment7 diseases9 countries14 total contexts
Disease case counts
We used a linearmodel trained withordinary least squaresmultiple regression.
4.5 TB
Thai = ThailandEnglish = USA
Language as proxy
9K
8K
7K
6K
5K
4K
3K
2K
1K
0
9K
8K
7K
6K
5K
4K
3K
2K
1K
0
0 0
0
0
0
1
1
1
1
2011 2012 2013
2011 2012 2013
2011 2012 2013
2011 2012 2013
O�cial Model Wikipedia
1
2
3
4
5
6
7
0
2K
4K
6K
8K
10K
12K
14K
Tuberculosis, China
Art
icle
acc
esse
sA
rtic
le a
cces
ses
Art
icle
acc
esse
sA
rtic
le a
cces
ses
Case
s per
100
K po
pula
tion
% IL
ICa
ses
Case
s
Dengue, Brazil
In�uenza, Poland
In�uenza, United States

before being summarized and reported by state and federal health agencies, there is a time lag between what is happening and what is known. But with a good statistical estimation model, the situation right now can be extracted from what is known in what’s called nowcasting.
In order to determine the utility of a modeling system, it must be fed historical data and allowed to make projections as if in real time— then the resulting nowcast can be compared to the historical record for validation. For this training phase, team member Nick Generous, a self-styled microbiologist-turned-epidemiologist, collected the latest historical data from the CDC and its foreign counterparts. Cases of con� rmed infection, as determined by clinical testing, and cases of probable infection, as determined by patient description of symptoms and doctor observation (as well as, in some instances, cases of possible infection as determined by non-doctor clinicians), were collected for recent three-year periods for each of the 14 test contexts.
Next, Del Valle and Los Alamos mathematician Kyle Hickmann trained linear regression models by mapping Wikipedia hits for each context to the o� cial case data collected from disease-monitoring agencies. When the case data were compared to the Wikipedia tra� c, the results were mixed. In eight of 14 contexts, the Wikipedia-based nowcasts mirrored the o� cial case counts. � e remaining six contexts su� ered from two particular challenges: no detectable pattern in the o� cial data or no detectable pattern in the Wikipedia data.
No detectable pattern in the o� cial data could occur in instances of slow disease progression, as would be seen with HIV or tuberculosis, and indeed, these were among the contexts that failed. No detectable pattern in the Wikipedia data could occur in instances where unrelated hits drown out hits associated with infection. For example, since the start of the still-ongoing, record-shattering Ebola outbreak, web tra� c about Ebola will undoubtedly correlate to locations with high media coverage and Internet access, whereas actual Ebola infections tend to occur in regions with poor media and web connectivity.
Media frenzy can be a major confounding factor for mathematical models trained on patterns of web tra� c. If there is a sudden surge of news coverage on a topic like Ebola, there will be a
corresponding surge of web tra� c from the curious and web-connected. If the model was trained with a lower baseline, as existed before the heightened media coverage, it may interpret the increased interest as increased infection. So the forecast falls apart unless the human programmers intervene outside of the usual annual evaluation, which in the case of Google’s models they usually don’t. Google Flu Trends famously missed the H1N1 swine � u pandemic in 2009 for similar reasons; the outbreak didn’t follow the patterns for seasonal � u, and there was such a � urry of media-driven web tra� c that the infection-driven pattern got buried in the media-driven surge.
What Del Valle’s team sought to remedy, compared to the current state of the art for disease nowcasting, was four-fold. First, models should be completely open, in terms of data source and algorithms used, so that others may replicate, deploy, or even improve upon them. Second, models should be transferable from one context to another with minimal cost and e� ort, so as to maximize relevance and impact. � ird, models should be translatable to regions where o� cial incidence data are not available and, having been trained on trusted incidence data elsewhere, still be able to produce accurate forecasts. Fourth, models should be able to reliably forecast the future course and not just the present situation of an outbreak. Whereas other systems like Google Flu Trends do a decent job of nowcasting, the Los Alamos team’s system goes even further—it goes into the future.
Forecasting � uBuoyed by their considerable success with the
proof of principle, the team was ready to prove that their system could work in real time. � e 2013–2014 � u season was right around the corner and, as luck would have it, the CDC was conducting a contest, called the Predict the In� uenza Season Challenge, which posed the problem of � u forecasting to inno-vators far and wide. � e CDC tracks actual in� uenza infection—as well as anything that has a similar clinical presentation; i.e., fever, cough, and sore throat with no other identi� able cause—and posts this in� uenza-like-illness (ILI) case data online every week. � e challenge was to build a model capable of producing the most accurate forecast, as measured by comparison to the CDC’s o� cial ILI data.
28 1663 May 2015
Tools What links here Related changes Upload file Special pages Permanent link Page information Wikidata item Cite this page
Languages
Brezhoneg Català Čeština Dansk Deutsch Español
Français
Bahasa Indonesia Italianoעברית Монгол Nederlands
Norsk bokmål Norsk nynorsk Polski Português Română Русский Саха тыла Slovenščina Suomi Svenska Türkçe Українська Tiếng Việt
Edit links
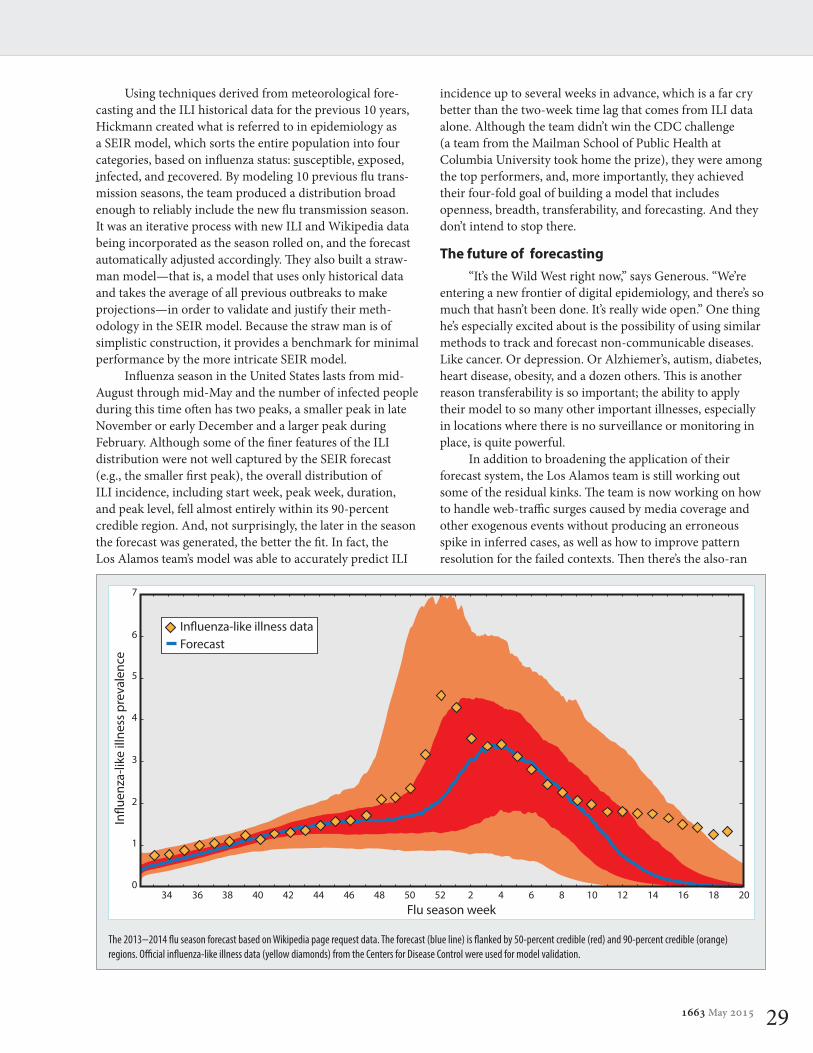
The 2013–2014 � u season forecast based on Wikipedia page request data. The forecast (blue line) is � anked by 50-percent credible (red) and 90-percent credible (orange) regions. O� cial in� uenza-like illness data (yellow diamonds) from the Centers for Disease Control were used for model validation.
incidence up to several weeks in advance, which is a far cry better than the two-week time lag that comes from ILI data alone. Although the team didn’t win the CDC challenge (a team from the Mailman School of Public Health at Columbia University took home the prize), they were among the top performers, and, more importantly, they achieved their four-fold goal of building a model that includes openness, breadth, transferability, and forecasting. And they don’t intend to stop there.
The future of forecasting “It’s the Wild West right now,” says Generous. “We’re
entering a new frontier of digital epidemiology, and there’s so much that hasn’t been done. It’s really wide open.” One thing he’s especially excited about is the possibility of using similar methods to track and forecast non-communicable diseases. Like cancer. Or depression. Or Alzhiemer’s, autism, diabetes, heart disease, obesity, and a dozen others. � is is another reason transferability is so important; the ability to apply their model to so many other important illnesses, especially in locations where there is no surveillance or monitoring in place, is quite powerful.
In addition to broadening the application of their forecast system, the Los Alamos team is still working out some of the residual kinks. � e team is now working on how to handle web-tra� c surges caused by media coverage and other exogenous events without producing an erroneous spike in inferred cases, as well as how to improve pattern resolution for the failed contexts. � en there’s the also-ran
1663 May 2015 29
Using techniques derived from meteorological fore-casting and the ILI historical data for the previous 10 years, Hickmann created what is referred to in epidemiology as a SEIR model, which sorts the entire population into four categories, based on in� uenza status: susceptible, exposed, infected, and recovered. By modeling 10 previous � u trans-mission seasons, the team produced a distribution broad enough to reliably include the new � u transmission season. It was an iterative process with new ILI and Wikipedia data being incorporated as the season rolled on, and the forecast automatically adjusted accordingly. � ey also built a straw-man model—that is, a model that uses only historical data and takes the average of all previous outbreaks to make projections—in order to validate and justify their meth-odology in the SEIR model. Because the straw man is of simplistic construction, it provides a benchmark for minimal performance by the more intricate SEIR model.
In� uenza season in the United States lasts from mid-August through mid-May and the number of infected people during this time o� en has two peaks, a smaller peak in late November or early December and a larger peak during February. Although some of the � ner features of the ILI distribution were not well captured by the SEIR forecast (e.g., the smaller � rst peak), the overall distribution of ILI incidence, including start week, peak week, duration, and peak level, fell almost entirely within its 90-percent credible region. And, not surprisingly, the later in the season the forecast was generated, the better the � t. In fact, the Los Alamos team’s model was able to accurately predict ILI
Flu season week
0
1
2
3
4
5
6
7
In�u
enza
-like
illn
ess p
reva
lenc
e
34 36 38 40 42 44 46 48 50 52 2 4 6 8 10 12 14 16 18 20
In�uenza-like illness dataForecast
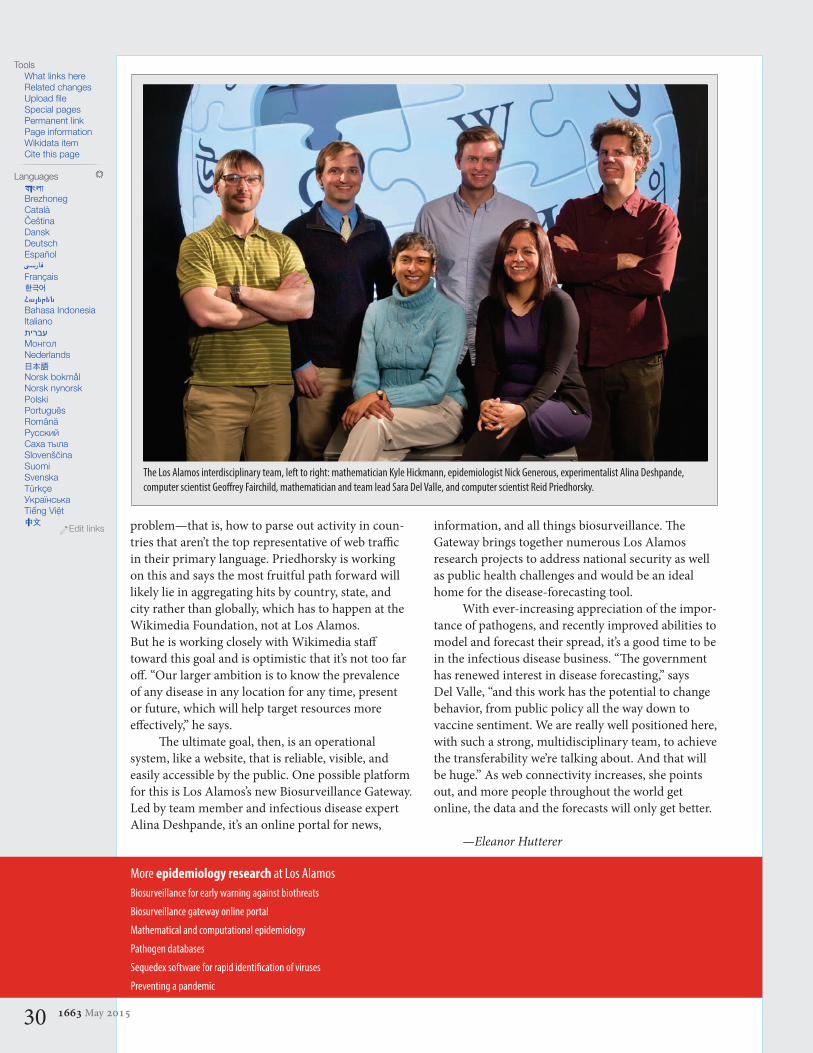
problem—that is, how to parse out activity in coun-tries that aren’t the top representative of web tra� c in their primary language. Priedhorsky is working on this and says the most fruitful path forward will likely lie in aggregating hits by country, state, and city rather than globally, which has to happen at the Wikimedia Foundation, not at Los Alamos. But he is working closely with Wikimedia sta� toward this goal and is optimistic that it’s not too far o� . “Our larger ambition is to know the prevalence of any disease in any location for any time, present or future, which will help target resources more e� ectively,” he says.
� e ultimate goal, then, is an operational system, like a website, that is reliable, visible, and easily accessible by the public. One possible platform for this is Los Alamos’s new Biosurveillance Gateway. Led by team member and infectious disease expert Alina Deshpande, it’s an online portal for news,
information, and all things biosurveillance. � e Gateway brings together numerous Los Alamos research projects to address national security as well as public health challenges and would be an ideal home for the disease-forecasting tool.
With ever-increasing appreciation of the impor-tance of pathogens, and recently improved abilities to model and forecast their spread, it’s a good time to be in the infectious disease business. “� e government has renewed interest in disease forecasting,” says Del Valle, “and this work has the potential to change behavior, from public policy all the way down to vaccine sentiment. We are really well positioned here, with such a strong, multidisciplinary team, to achieve the transferability we’re talking about. And that will be huge.” As web connectivity increases, she points out, and more people throughout the world get online, the data and the forecasts will only get better.
—Eleanor Hutterer
More epidemiology research at Los AlamosBiosurveillance for early warning against biothreats
Biosurveillance gateway online portal
Mathematical and computational epidemiology
Pathogen databases
Sequedex software for rapid identi� cation of viruses
Preventing a pandemic
The Los Alamos interdisciplinary team, left to right: mathematician Kyle Hickmann, epidemiologist Nick Generous, experimentalist Alina Deshpande, computer scientist Geo� rey Fairchild, mathematician and team lead Sara Del Valle, and computer scientist Reid Priedhorsky.
30 1663 May 2015
Tools What links here Related changes Upload file Special pages Permanent link Page information Wikidata item Cite this page
Languages
Brezhoneg Català Čeština Dansk Deutsch Español
Français
Bahasa Indonesia Italianoעברית Монгол Nederlands
Norsk bokmål Norsk nynorsk Polski Português Română Русский Саха тыла Slovenščina Suomi Svenska Türkçe Українська Tiếng Việt
Edit links
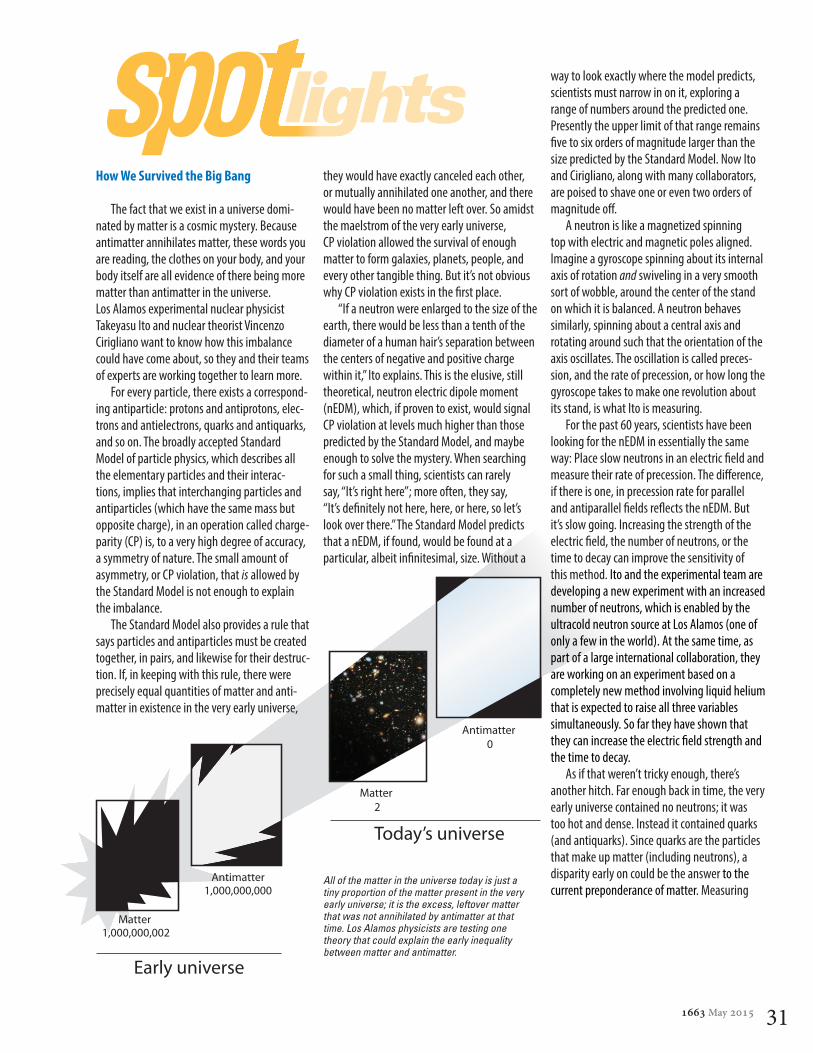
1663 May 2015 31
Matter 1,000,000,002
Antimatter1,000,000,000
Antimatter 0
Matter 2
Early universe
Today’s universe
How We Survived the Big Bang
The fact that we exist in a universe domi-nated by matter is a cosmic mystery. Because antimatter annihilates matter, these words you are reading, the clothes on your body, and your body itself are all evidence of there being more matter than antimatter in the universe. Los Alamos experimental nuclear physicist Takeyasu Ito and nuclear theorist Vincenzo Cirigliano want to know how this imbalance could have come about, so they and their teams of experts are working together to learn more.
For every particle, there exists a correspond-ing antiparticle: protons and antiprotons, elec-trons and antielectrons, quarks and antiquarks, and so on. The broadly accepted Standard Model of particle physics, which describes all the elementary particles and their interac-tions, implies that interchanging particles and antiparticles (which have the same mass but opposite charge), in an operation called charge-parity (CP) is, to a very high degree of accuracy, a symmetry of nature. The small amount of asymmetry, or CP violation, that is allowed by the Standard Model is not enough to explain the imbalance.
The Standard Model also provides a rule that says particles and antiparticles must be created together, in pairs, and likewise for their destruc-tion. If, in keeping with this rule, there were precisely equal quantities of matter and anti-matter in existence in the very early universe,
they would have exactly canceled each other, or mutually annihilated one another, and there would have been no matter left over. So amidst the maelstrom of the very early universe, CP violation allowed the survival of enough matter to form galaxies, planets, people, and every other tangible thing. But it’s not obvious why CP violation exists in the � rst place.
“If a neutron were enlarged to the size of the earth, there would be less than a tenth of the diameter of a human hair’s separation between the centers of negative and positive charge within it,” Ito explains. This is the elusive, still theoretical, neutron electric dipole moment (nEDM), which, if proven to exist, would signal CP violation at levels much higher than those predicted by the Standard Model, and maybe enough to solve the mystery. When searching for such a small thing, scientists can rarely say, “It’s right here”; more often, they say, “It’s de� nitely not here, here, or here, so let’s look over there.” The Standard Model predicts that a nEDM, if found, would be found at a particular, albeit in� nitesimal, size. Without a
way to look exactly where the model predicts, scientists must narrow in on it, exploring a range of numbers around the predicted one. Presently the upper limit of that range remains � ve to six orders of magnitude larger than the size predicted by the Standard Model. Now Ito and Cirigliano, along with many collaborators, are poised to shave one or even two orders of magnitude o� .
A neutron is like a magnetized spinning top with electric and magnetic poles aligned. Imagine a gyroscope spinning about its internal axis of rotation and swiveling in a very smooth sort of wobble, around the center of the stand on which it is balanced. A neutron behaves similarly, spinning about a central axis and rotating around such that the orientation of the axis oscillates. The oscillation is called preces-sion, and the rate of precession, or how long the gyroscope takes to make one revolution about its stand, is what Ito is measuring.
For the past 60 years, scientists have been looking for the nEDM in essentially the same way: Place slow neutrons in an electric � eld and measure their rate of precession. The di� erence, if there is one, in precession rate for parallel and antiparallel � elds re� ects the nEDM. But it’s slow going. Increasing the strength of the electric � eld, the number of neutrons, or the time to decay can improve the sensitivity of this method. Ito and the experimental team are developing a new experiment with an increased number of neutrons, which is enabled by the ultracold neutron source at Los Alamos (one of only a few in the world). At the same time, as part of a large international collaboration, they are working on an experiment based on a completely new method involving liquid helium that is expected to raise all three variables simultaneously. So far they have shown that they can increase the electric � eld strength and the time to decay.
As if that weren’t tricky enough, there’s another hitch. Far enough back in time, the very early universe contained no neutrons; it was too hot and dense. Instead it contained quarks (and antiquarks). Since quarks are the particles that make up matter (including neutrons), a disparity early on could be the answer to the current preponderance of matter. Measuring
All of the matter in the universe today is just a tiny proportion of the matter present in the very early universe; it is the excess, leftover matter that was not annihilated by antimatter at that time. Los Alamos physicists are testing one theory that could explain the early inequality between matter and antimatter.

32 1663 May 2015
neutrons in the laboratory today, however, and extrapolating implications for quarks (and antiquarks) 13.8 billion years ago requires quite a bit of theoretical calculation. Cirigliano and the theory team are performing the intricate calculations needed to interpret either a positive or null experimental result in terms of quark-level sources of CP violation. No matter what the number is when it’s �nally measured, they want to know what it means.
The bene�t of experimentalists, like Ito’s team, and theorists, like Cirigliano’s team, working together on these types of problems is that they whittle down and re�ne the scope of each other’s work. The team has its short-term endeavor as well as the longer-term interna-tional collaborative experiment— which will be installed at the Spallation Neutron Source facility at Oak Ridge National Labora-tory—both aimed at homing in on the nEDM. If they are successful in either or both, a popular family of theories referred to as supersymmetry, designed to address the de�ciencies in the Stan-dard Model, could be largely invalidated.
“We are agnostic when it comes to super-symmetry,” says Cirigliano. “It could be right or it could be wrong. If it’s right, and the nEDM doesn’t exist, we’ll just have to come up with a new explanation.” They aren’t pursuing a spe-ci�c agenda after all; they are just studying new interactions beyond the known ones, beyond the Standard Model.
—Eleanor Hutterer
Safety in Numbers
After 18 years of development, the Los Alamos advanced encryption technology QKarD (a smart card based on Quantum Key Distribution) is headed to market. In the largest information technology agreement ever signed by the Laboratory, the startup company White-wood Encryption Systems, Inc., aims to use the patented technology to develop a com-mercial device for creating completely secure electronic communications.
Anyone who has ever had a credit card number stolen online, or worse,
a complete identity stolen, will know just how important it is that companies keep their customers’ data secure. Conventional encryp-tion methods are not perfect and rely on the di�culty—not impossibility—of cracking a code to steal information. QKarD meanwhile uses an encryption system that is both rapid and completely secure, even against future methods of cracking. One of the key innovations that enables this is the ability to produce truly random numbers—an essential component of secure encryption. There are many prominent examples of codes being cracked due to imper-fect random number generation; e.g., Sony’s master key for authorizing software on Playsta-tion 3 was stolen in 2010, and the Bitcoin implementation on Android devices allowed Bitcoins to be stolen in 2013.
Encryption is the process of encoding infor-mation such that only individuals who possess the same secret numerical “key” may unlock the message. This process is fundamentally simple: Information is encrypted by carrying out a mathematical operation on it in combination with the key. For instance, the operation could be multiplication by the key. Say the message to be communicated is 7 and the key is 3; then the encoded message would be 21. In order to decipher the information, the recipient would reverse the operation using the secret key—they would divide 21 by 3 to get the message 7. Of course, in reality, the message is rarely as simple as 7, and the encryption operation is much more sophisticated than multiplication, but the principle is the same: without the key (and knowledge of the operation), the informa-tion remains encrypted.
But how does one choose the value of the key? This is where random numbers come in. If an identical message, such as an indi-vidual’s checking account number, is repeat-edly encrypted with the same secret key, the encrypted output would be the same every time, so it is essential to vary the key with each encryption. And the more random this varia-
tion proves to be, the more resistant the encryption is against being cracked.
The rapid generation of a large number of
keys is important for commercial or security applications in which a large number of secure transmissions is processed daily. Machine-generated random numbers used for encryp-tion keys are typically either derived from physical phenomena, such as microscopic electrical sources of white noise, or from a so-called pseudo-random algorithm: a complex mathematical formula that generates numerical sequences that appear random to anyone who doesn’t know the formula’s inputs. The former method is slow to generate a large quantity of random numbers and is susceptible to manipu-lation at the source of the noise, whereas the latter is vulnerable to mathematical code crack-ing. QKarD, however, manages to achieve both the large quantity needed and true randomness by exploiting the inherently probabilistic nature of quantum particles such as photons (particles of light).
The quantum encryption platform currently requires that the sender and the recipient be linked via �ber optic cable to a central server to allow communication of the quantum keys with photons rather than ordinary electrical current. Therefore, the target market for the new QKarD product will likely be a single �ber optic-linked organization housed under one roof or within a contiguous campus. Future development of the QKaRD concept will focus on broader long-distance communication.
Ray Newell, a physicist on the Los Alamos QKarD team assisting in the technology transfer process with Whitewood, says the �rst com-mercial prototype system will be in operation later this year. Some of the initial marketing challenges will involve reducing production costs to be competitive in the current market and convincing potential buyers to invest in a fundamentally new method of encrypting their data. Yet if successful, QKarD will bring with it a much-needed, renewed con�dence in information security, with high-throughput encryption that is unbreakable by any known or foreseeable cryptographic methods. Eventual applications include systems for banking, online transactions, secure facility access, electronic voting, and more.
—Owen Summerscales
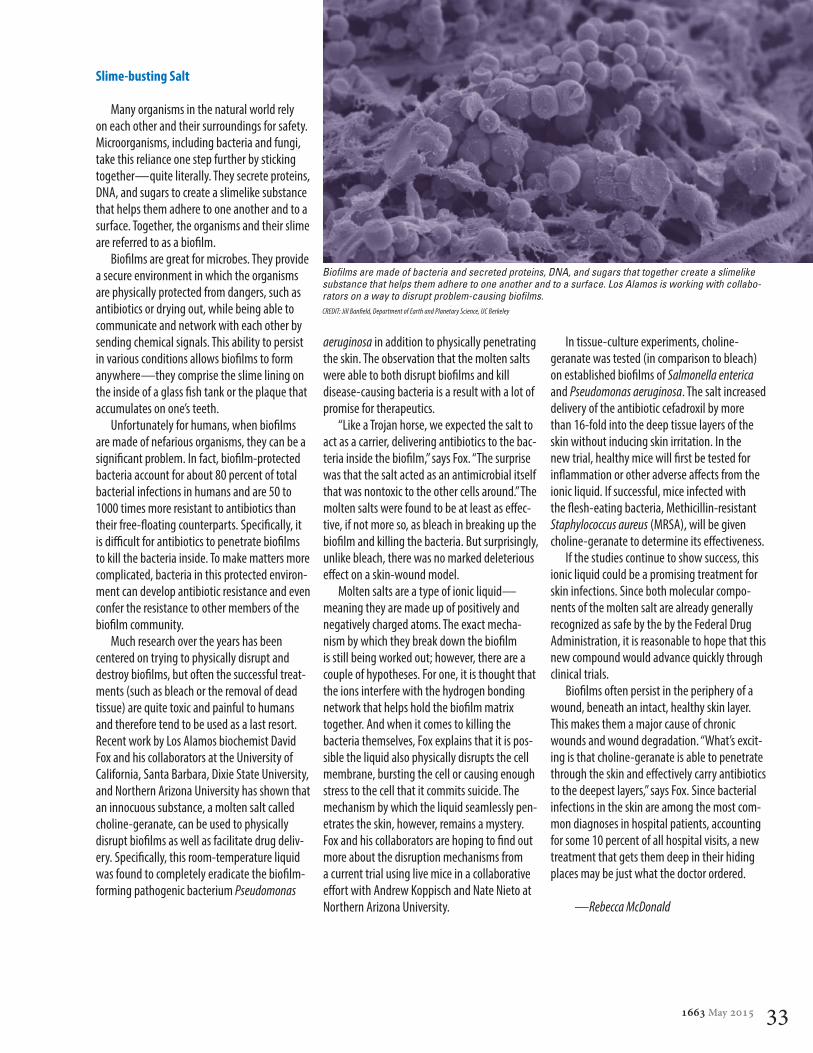
1663 May 2015 33
Slime-busting Salt
Many organisms in the natural world rely on each other and their surroundings for safety. Microorganisms, including bacteria and fungi, take this reliance one step further by sticking together—quite literally. They secrete proteins, DNA, and sugars to create a slimelike substance that helps them adhere to one another and to a surface. Together, the organisms and their slime are referred to as a bio� lm.
Bio� lms are great for microbes. They provide a secure environment in which the organisms are physically protected from dangers, such as antibiotics or drying out, while being able to communicate and network with each other by sending chemical signals. This ability to persist in various conditions allows bio� lms to form anywhere—they comprise the slime lining on the inside of a glass � sh tank or the plaque that accumulates on one’s teeth.
Unfortunately for humans, when bio� lms are made of nefarious organisms, they can be a signi� cant problem. In fact, bio� lm-protected bacteria account for about 80 percent of total bacterial infections in humans and are 50 to 1000 times more resistant to antibiotics than their free-� oating counterparts. Speci� cally, it is di� cult for antibiotics to penetrate bio� lms to kill the bacteria inside. To make matters more complicated, bacteria in this protected environ-ment can develop antibiotic resistance and even confer the resistance to other members of the bio� lm community.
Much research over the years has been centered on trying to physically disrupt and destroy bio� lms, but often the successful treat-ments (such as bleach or the removal of dead tissue) are quite toxic and painful to humans and therefore tend to be used as a last resort. Recent work by Los Alamos biochemist David Fox and his collaborators at the University of California, Santa Barbara, Dixie State University, and Northern Arizona University has shown that an innocuous substance, a molten salt called choline-geranate, can be used to physically disrupt bio� lms as well as facilitate drug deliv-ery. Sp eci� cally, this room-temperature liquid was found to completely eradicate the bio� lm-forming pathogenic bacterium Pseudomonas
aeruginosa in addition to physically penetrating the skin. The observation that the molten salts were able to both disrupt bio� lms and kill disease-causing bacteria is a result with a lot of promise for therapeutics.
“Like a Trojan horse, we expected the salt to act as a carrier, delivering antibiotics to the bac-teria inside the bio� lm,” says Fox. “The surprise was that the salt acted as an antimicrobial itself that was nontoxic to the other cells around.” The molten salts were found to be at least as e� ec-tive, if not more so, as bleach in breaking up the bio� lm and killing the bacteria. But surprisingly, unlike bleach, there was no marked deleterious e� ect on a skin-wound model.
Molten salts are a type of ionic liquid—meaning they are made up of positively and negatively charged atoms. The exact mecha-nism by which they break down the bio� lm is still being worked out; however, there are a couple of hypotheses. For one, it is thought that the ions interfere with the hydrogen bonding network that helps hold the bio� lm matrix together. And when it comes to killing the bacteria themselves, Fox explains that it is pos-sible the liquid also physically disrupts the cell membrane, bursting the cell or causing enough stress to the cell that it commits suicide. The mechanism by which the liquid seamlessly pen-etrates the skin, however, remains a mystery. Fox and his collaborators are hoping to � nd out more about the disruption mechanisms from a current trial using live mice in a collaborative e� ort with Andrew Koppisch and Nate Nieto at Northern Arizona University.
In tissue-culture experiments, choline-geranate was tested (in comparison to bleach) on established bio� lms of Salmonella entericaand Pseudomonas aeruginosa. The salt increased delivery of the antibiotic cefadroxil by more than 16-fold into the deep tissue layers of the skin without inducing skin irritation. In the new trial, healthy mice will � rst be tested for in� ammation or other adverse a� ects from the ionic liquid. If successful, mice infected with the � esh-eating bacteria, Methicillin-resistant Staphylococcus aureus (MRSA), will be given choline-geranate to determine its e� ectiveness.
If the studies continue to show success, this ionic liquid could be a promising treatment for skin infections. Since both molecular compo-nents of the molten salt are already generally recognized as safe by the by the Federal Drug Administration, it is reasonable to hope that this new compound would advance quickly through clinical trials.
Bio� lms often persist in the periphery of a wound, beneath an intact, healthy skin layer. This makes them a major cause of chronic wounds and wound degradation. “What’s excit-ing is that choline-geranate is able to penetrate through the skin and e� ectively carry antibiotics to the deepest layers,” says Fox. Since bacterial infections in the skin are among the most com-mon diagnoses in hospital patients, accounting for some 10 percent of all hospital visits, a new treatment that gets them deep in their hiding places may be just what the doctor ordered.
—Rebecca McDonald
Biofi lms are made of bacteria and secreted proteins, DNA, and sugars that together create a slimelike substance that helps them adhere to one another and to a surface. Los Alamos is working with collabo-rators on a way to disrupt problem-causing biofi lms. CREDIT: Jill Ban� eld, Department of Earth and Planetary Science, UC Berkeley

ISSN: 1942-6631 1663Mail Stop M711
Los Alamos National LaboratoryP.O. Box 1663
Los Alamos, NM 87545
Presorted StandardU.S. Postage PaidAlbuquerque, NM
Permit No. 532
Printed onrecycled paper
Los Alamos National Laboratory, an a� rmative action/equal opportunity employer, is operated by Los Alamos National Security, LLC, for the National Nuclear Security Administration of the U.S. Department of Energy under contract DE-AC52-06NA25396. A U.S. Department of Energy Laboratory LALP-15-003
www.lanl.gov/newsroom/publications/1663/
A virtual river of light adorns the Main Hill Road to Los Alamos.