Embed Size (px)
Citation preview
For Research Use Only. Not for use in diagnostic procedures
Copyright© 2021 Bionano Genomics, Inc. All Rights Reserved
Bionano Solve Theory of Operation:
Bionano EnFocusTM Fragile X Analysis
Document Number: 30457
Document Revision: A
For Research Use Only. Not for use in diagnostic procedures.
30457 Rev A, Bionano Solve Theory of Operation: Bionano EnFocusTM Fragile X Analysis Page 2 of 17
Table of Contents
Legal Notice ........................................................................................................................................... 3
Revision History ..................................................................................................................................... 4
Introduction ............................................................................................................................................ 4
Analysis workflow .................................................................................................................................. 5
Local assembly of regions of interest .................................................................................................. 5
Identification of intervals encoding the CGG repeat array ................................................................... 5
Repeat count estimation .................................................................................................................. 5
Assessment of molecule support ........................................................................................................ 6
Quality control .................................................................................................................................... 6
Inferred sex of sample ..................................................................................................................... 6
Assessment of molecule quality ...................................................................................................... 6
Selection and assessment of stable regions .................................................................................... 6
Data summary .................................................................................................................................... 7
Performance summary ........................................................................................................................... 8
Sample validation ............................................................................................................................... 8
Performance at different coverage levels ............................................................................................ 9
Definition of confidence ranges ......................................................................................................... 10
Repeatability ..................................................................................................................................... 10
Analysis of low-quality samples ........................................................................................................ 11
Sample treatment .......................................................................................................................... 11
EnFocusTM Fragile X Analysis Report .................................................................................................. 13
FAQs ................................................................................................................................................... 16
Technical Assistance ........................................................................................................................... 17
For Research Use Only. Not for use in diagnostic procedures.
30457 Rev A, Bionano Solve Theory of Operation: Bionano EnFocusTM Fragile X Analysis Page 3 of 17
Legal Notice
For Research Use Only. Not for use in diagnostic procedures.
This material is protected by United States Copyright Law and International Treaties. Unauthorized use of this material is prohibited. No part of the publication may be copied, reproduced, distributed, translated, reverse-engineered or transmitted in any form or by any media, or by any means, whether now known or unknown, without the express prior permission in writing from Bionano Genomics. Copying, under the law, includes translating into another language or format. The technical data contained herein is intended for ultimate destinations permitted by U.S. law. Diversion contrary to U. S. law prohibited. This publication represents the latest information available at the time of release. Due to continuous efforts to improve the product, technical changes may occur that are not reflected in this document. Bionano Genomics reserves the right to make changes in specifications and other information contained in this publication at any time and without prior notice. Please contact Bionano Genomics Customer Support for the latest information.
BIONANO GENOMICS DISCLAIMS ALL WARRANTIES WITH RESPECT TO THIS DOCUMENT, EXPRESSED OR IMPLIED, INCLUDING BUT NOT LIMITED TO THOSE OF MERCHANTABILITY OR FITNESS FOR A PARTICULAR PURPOSE. TO THE FULLEST EXTENT ALLOWED BY LAW, IN NO EVENT SHALL BIONANO GENOMICS BE LIABLE, WHETHER IN CONTRACT, TORT, WARRANTY, OR UNDER ANY STATUTE OR ON ANY OTHER BASIS FOR SPECIAL, INCIDENTAL, INDIRECT, PUNITIVE, MULTIPLE OR CONSEQUENTIAL DAMAGES IN CONNECTION WITH OR ARISING FROM THIS DOCUMENT, INCLUDING BUT NOT LIMITED TO THE USE THEREOF, WHETHER OR NOT FORESEEABLE AND WHETHER OR NOT BIONANO GENOMICS IS ADVISED OF THE POSSIBILITY OF SUCH DAMAGES.
Patents
Products of Bionano Genomics® may be covered by one or more U.S. or foreign patents.
Trademarks
The Bionano Genomics logo and names of Bionano Genomics products or services are registered trademarks or trademarks owned by Bionano Genomics in the United States and certain other countries.
Bionano Genomics®, Saphyr®, Saphyr Chip®, Bionano Access® and Bionano EnFocusTM are trademarks of Bionano Genomics, Inc. All other trademarks are the sole property of their respective owners.
No license to use any trademarks of Bionano Genomics is given or implied. Users are not permitted to use these trademarks without the prior written consent of Bionano Genomics. The use of these trademarks or any other materials, except as permitted herein, is expressly prohibited and may be in violation of federal or other applicable laws.
© Copyright 2021 Bionano Genomics, Inc. All rights reserved.
For Research Use Only. Not for use in diagnostic procedures.
30457 Rev A, Bionano Solve Theory of Operation: Bionano EnFocusTM Fragile X Analysis Page 4 of 17
Revision History Revision Notes
A Initial document release
Introduction Expansions and contractions of simple sequence repeats are associated with more than 40 diseases including
Fragile X Syndrome, Huntington’s disease, myotonic dystrophy, facioscapulohumeral muscular dystrophy (FSHD)
and Friedreich’s ataxia. Expanded repeats are unstable and may expand during intergenerational transfer. The
associated disorders tend to increase in severity with each successive generation. Phenotype severity is often
correlated with the amount of pathogenic expansion or contraction. Thus, accurate sizing of the repeats is crucial.
Southern blotting is the primary method for analyzing pathogenic repeats. The repetitive and polymorphic nature
of these regions presents difficulties for both polymerase chain reaction (PCR), where the polymerase is unable to
traverse through long repeats, and sequencing based methods, which face limitations in read lengths.
Fragile X syndrome is associated with cognitive impairment and is the most common heritable cause of
intellectual disability. Nearly all cases of Fragile X syndrome are caused by an expansion of a CGG triplet repeat
region in the FMR1 gene. Fragile X repeat sizes are characterized in the following ranges:
• Normal: 5 – 40 repeats
• Pre-mutation: 55 - 200 repeats
• Full mutation: > 200 repeats
Bionano Genomics has developed a targeted analysis workflow for Fragile X Syndrome based on optical genome
mapping (OGM) with the Bionano Genomics Saphyr platform. The Saphyr platform can detect germline SVs >500
bp in size including repeat expansions/contractions and provides a high-resolution analysis of the Fragile X repeat
region.
Briefly, the workflow selects the subset of molecules that align to regions of interest and then assembles that
subset into consensus maps. The workflow then uses the resulting consensus maps as input to the Bionano
EnFocusTM Fragile X Analysis. This analysis first determines the number of alleles in the FMR1 repeat region on
chromosome X and then sizes these regions. The analysis then calculates the probability that the size of the
repeat region on each allele exceeds 200 copies of the CGG triplet. The analysis results can be imported into
Bionano Access, a graphical user interface tool for visualization and curation. Access can generate a summary of
the results in pdf and in JSON format.
Note that the method described cannot detect single-nucleotide variants that do not impact enzyme sequence
motif sites and may miss small variants with potential functional impacts. The pipeline only supports Bionano’s
DLE-1 labeling enzyme.
For Research Use Only. Not for use in diagnostic procedures.
30457 Rev A, Bionano Solve Theory of Operation: Bionano EnFocusTM Fragile X Analysis Page 5 of 17
Analysis workflow
Local assembly of regions of interest
The Fragile X analysis pipeline first analyzes intervals of interest by selecting molecules that align to the FMR1
locus and performing a local assembly using only those molecules. The pipeline then analyzes the repeat content
of those resulting genome maps that align to the CGG repeat region in the FMR1 gene on chromosome X. The
pipeline also assembles and analyzes other selected regions of the genome as part of a quality-control process
(discussed in a subsequent section; Table 1).
The local assembly workflow is similar to the standard Bionano de novo whole-genome assembly workflow, but
the key difference here is that this workflow uses a reference as a guide and only assembles targeted regions.
This workflow performs local assembly of those targeted regions using parameters specifically optimized for
effective assembly of the FMR1 repeat regions. This workflow significantly reduces the assembly time and is
effective in assembling the targeted regions despite such regions’ typical complexity.
Identification of intervals encoding the CGG repeat array
We identified the coordinates of CGG repeat array (chrX: 147,912,037-147,912,111bp) in the FMR1 gene in the
hg38 reference genome using the UCSC Genome Browser. The interval of interest refers to the narrowest
interval containing the CGG repeat array in an assembled map. The workflow uses the labels at chrX
147,910,189 bp and 147,918,814 bp as the endpoints of the reference interval. An interval aligning to the
reference is the observed interval (O) which the workflow uses to the infer the number of repeats in a sample.
Repeat count estimation
The workflow uses Bayesian probability to compute the repeat count in a sample. Since the DLE-1 enzyme does
not directly label the bounds of the CGG repeat array in the FMR1 gene, the interval of interest consists of the
CGG repeat array (R) and flanking region (C) in which R varies among samples and C is a constant value. C is
calculated by [reference interval – reference CGG repeat array size].
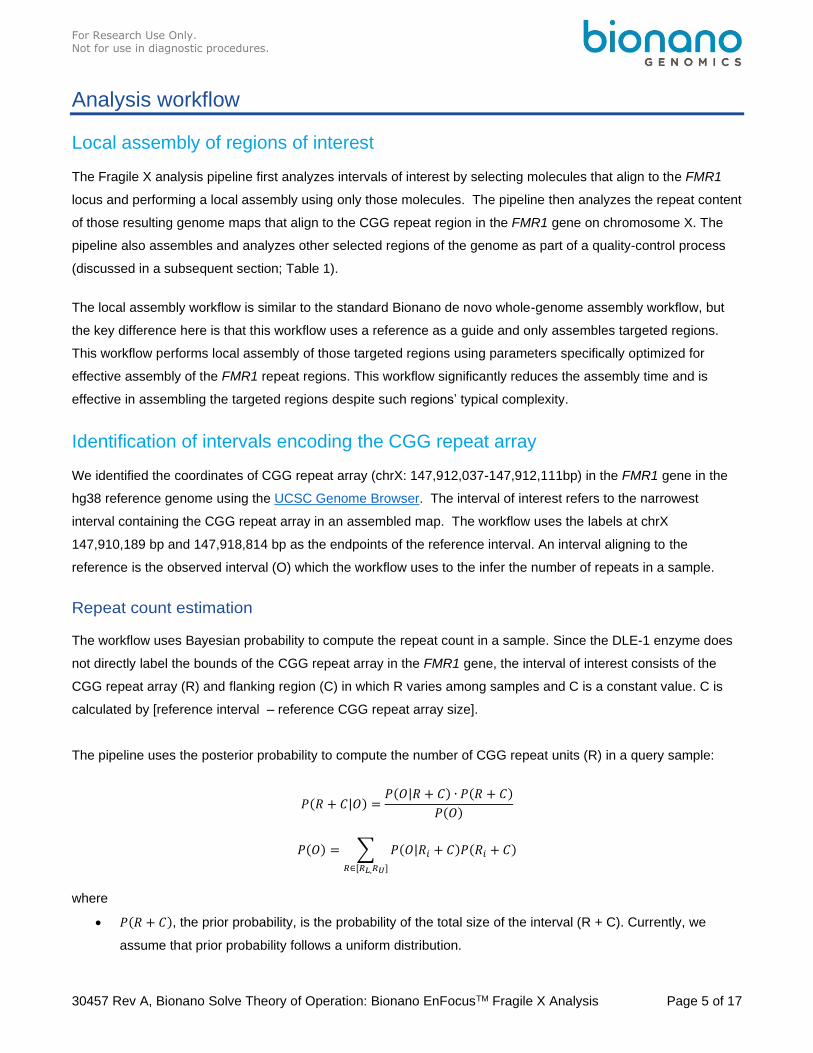
The pipeline uses the posterior probability to compute the number of CGG repeat units (R) in a query sample:
𝑃(𝑅 + 𝐶|𝑂) =𝑃(𝑂|𝑅 + 𝐶) ∙ 𝑃(𝑅 + 𝐶)
𝑃(𝑂)
𝑃(𝑂) = ∑ 𝑃(𝑂|𝑅𝑖 + 𝐶)𝑃(𝑅𝑖 + 𝐶)
𝑅∈[𝑅𝐿,𝑅𝑈]
where
• 𝑃(𝑅 + 𝐶), the prior probability, is the probability of the total size of the interval (R + C). Currently, we
assume that prior probability follows a uniform distribution.
For Research Use Only. Not for use in diagnostic procedures.
30457 Rev A, Bionano Solve Theory of Operation: Bionano EnFocusTM Fragile X Analysis Page 6 of 17
• 𝑃(𝑂|𝑅 + 𝐶) is the likelihood function for a Gaussian distribution 𝑁(𝜇, 𝜎2), in which 𝜇 and 𝜎2 were pre-
determined at the assembly step of the pipeline.
• 𝑃(𝑅 + 𝐶|𝑂) is the posterior probability.
In the final report, R is quantified by:
• a repeat number with the maximum posterior probability (MAP)
• a 99% credible interval (CI) giving the upper and lower bounds of the repeat number estimation
• the probability that R >= 200 units
Assessment of molecule support
The pipeline analyzes the molecule-to-map alignments to assess the amount of molecule support for a given
map. The number of molecules spanning across the repeat start and end sites provide supporting evidence for
the repeat count estimation. This pipeline provides this information in the final report.
Quality control
Inferred sex of sample
The analysis pipeline includes running the whole genome copy number pipeline and can infer sex information for
the sample. The pipeline infers the sex to be male if non-trivial coverage of chrY is found, otherwise it determines
the sex to be female. The pipeline does not handle more complex sex chromosome configurations. If external
data is available, one could compare the inferred sex with the external data and check for consistency.
Assessment of molecule quality
The pipeline collects data on molecule alignment quality to the reference. To ensure that the molecule quality is
sufficient for downstream analyses, mapping rate should be at least 70%, the effective coverage should be at
least 75X, and the molecule N50 should be at least 200 kbp.
Selection and assessment of stable regions
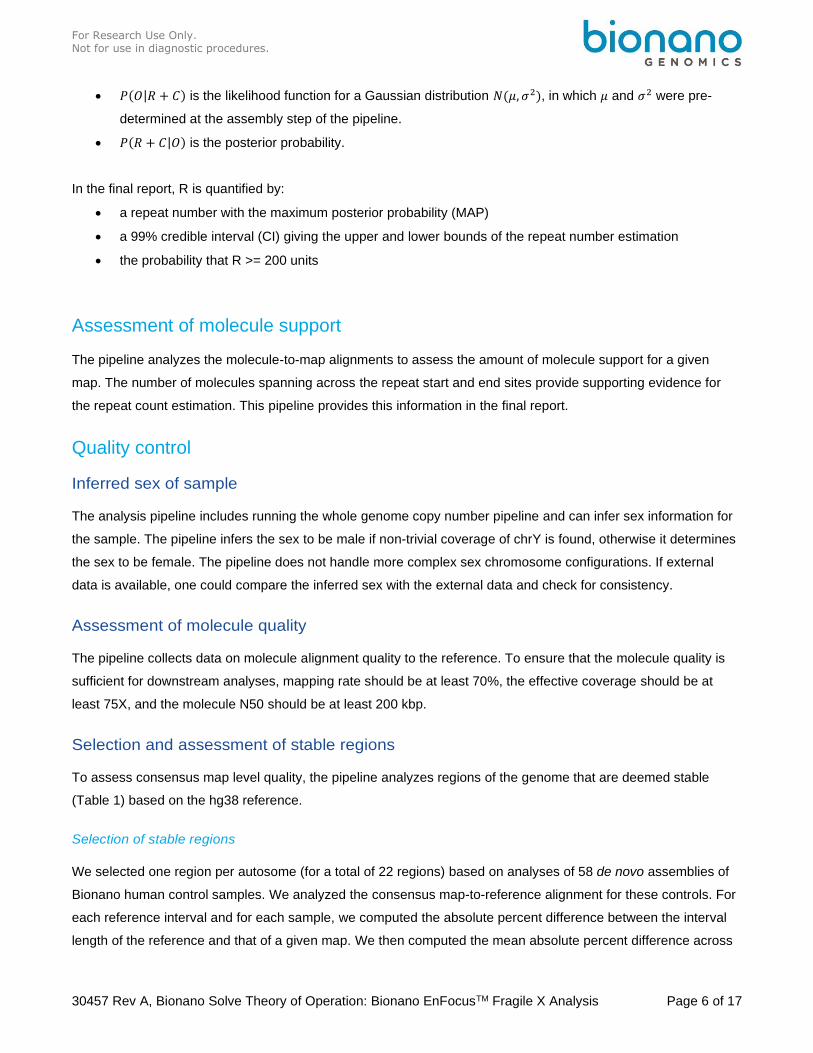
To assess consensus map level quality, the pipeline analyzes regions of the genome that are deemed stable
(Table 1) based on the hg38 reference.
Selection of stable regions
We selected one region per autosome (for a total of 22 regions) based on analyses of 58 de novo assemblies of
Bionano human control samples. We analyzed the consensus map-to-reference alignment for these controls. For
each reference interval and for each sample, we computed the absolute percent difference between the interval
length of the reference and that of a given map. We then computed the mean absolute percent difference across
For Research Use Only. Not for use in diagnostic procedures.
30457 Rev A, Bionano Solve Theory of Operation: Bionano EnFocusTM Fragile X Analysis Page 7 of 17
controls for each interval. We then sorted these, and after excluding regions with insufficient data or too many
alignments, we selected the regions with the lowest mean absolute percent differences, which we assume to be
the most stable.
Assessment of stable regions
When analyzing a sample of interest, the Fragile X pipeline assembles molecules from the stable regions in Table
1. We analyze the resulting consensus maps and consensus map-to-reference alignment in a similar fashion. The
pipeline expects the consensus maps to be consistent with the reference for the selected regions. Based on
expected sizing errors, the absolute percent differences between the map and the reference should not exceed
1.2%. The pipeline requires that at least 90% of the regions be under this threshold.
Chr Coordinates Chr Coordinates
1 222,324,492 - 222,349,194 12 25,901,387 - 25,914,482
2 203,598,419 - 203,624,005 13 26,774,581 - 26,796,446
3 31,786,552 - 31,805,963 14 49,469,153 - 49,487,044
4 159,395,859 - 159,416,605 15 60,014,272 - 60,041,969
5 37,318,756 - 37,335,731 16 77,498,326 - 77,517,842
6 53,262,654 - 53,282,806 17 1,377,309 - 1,389,336
7 26,961,779 - 26,970,051 18 12,367,665 - 12,396,092
8 121,580,578 - 121,595,557 19 13,335,300 - 13,361,530
9 116,981,783 - 117,012,768 20 47,394,428 - 47,417,351
10 62,135,760 - 62,157,297 21 37,268,614 - 37,282,468
11 78,075,503 - 78,100,220 22 38,154,243 - 38,163,301
Data summary
The pipeline compiles all the data necessary for Bionano Access to visualize the maps, to highlight the repeat
regions and to generate the final Fragile X analysis report. The key data files are compressed into a zip file, and
results are summarized in a JSON file, both of which are automatically transferred into Bionano Access.
The JSON file is also available for download and direct import into the customer’s reporting tool for parsing and
presentation. See Bionano EnFocus™ Fragile X Analysis JSON File Format Specification (PN 30458) for detailed
information on the content and format of the JSON file.
Table 1. List of stable regions based on hg38 coordinates included in the quality control assessment.
For Research Use Only. Not for use in diagnostic procedures.
30457 Rev A, Bionano Solve Theory of Operation: Bionano EnFocusTM Fragile X Analysis Page 8 of 17
Performance summary
To evaluate the capability of detecting disease causing repeat expansions, we analyzed the FMR1 repeats
relevant to Fragile X syndrome using Coriell cell lines and deidentified patient samples with known repeat sizes as
well as unaffected control samples assumed to be negative for the Fragile X repeat expansion. In addition, 10
female samples were simulated by combining one male with a normal repeat and one with the full mutation
expansion. We observed the expected expansion alleles with sizes consistent with annotation, with the largest
expansion being almost 1000 copies.
Sample validation
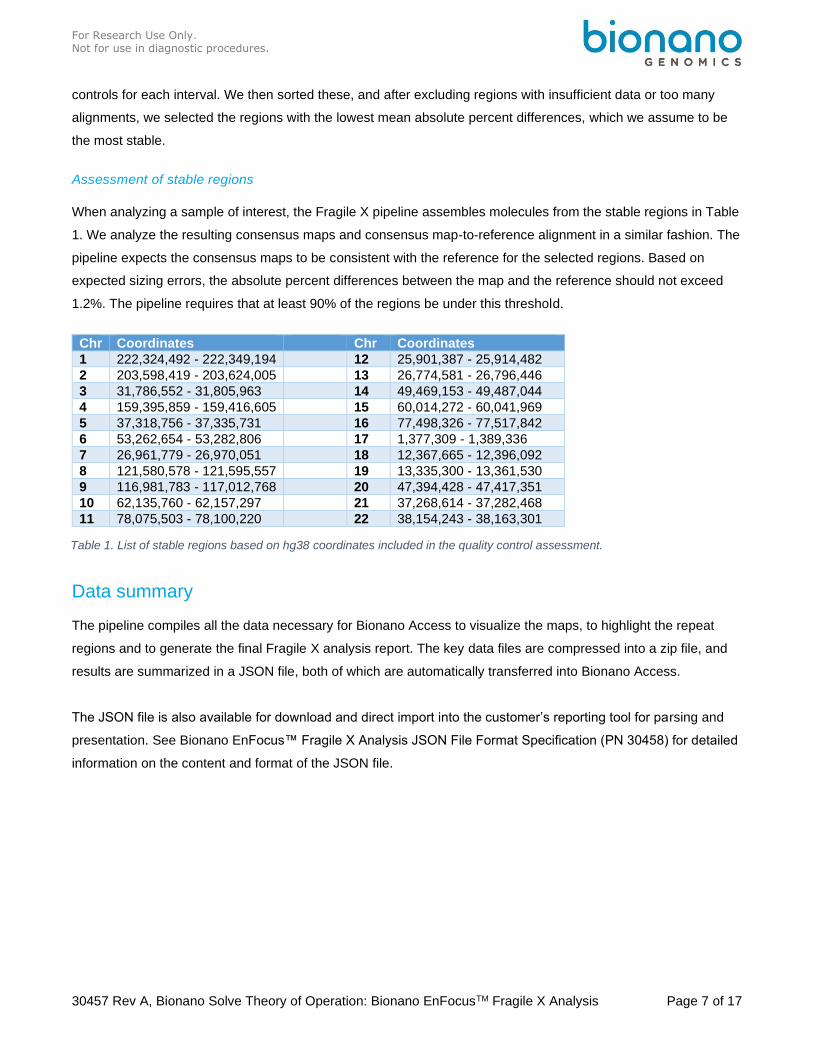
We analyzed a total of 75 samples, in which 37 carried the FMR1 mutation (repeat >=200) and 38 had a repeat
number < 200. The categories of validation set can be found in Table 2.
Sex R < 100 R in [100, 200] R >= 200 Negative control
(assumed R < 100)
Female 4 5 18 11
Male 6 3 19 9
The Fragile X analysis produces a probability that a sample’s repeat number (R) is greater than 200. We used
the reported probability (P) that R >= 200 to assess the test’s analysis performance as follows:
• True Positives (TP): Samples annotated with R > 200 where at least one allele is called with P > 99%
• True Negatives (TN): Samples annotated with R < 200 where all alleles are called with P < 50%
• False Positives (FP): Samples annotated with R < 200 with at least one allele called with P > 99% and
• False Negatives (FN): Samples annotated with R > 200 with all alleles called with P < 99%
Overall, the validation identified one false negative, relative to the available southern blot results, which was
annotated with 200 repeat units. The analysis reported that the false negative has 0.54%, 53.96% and 64.28%
chance to carry FMR1 mutation at 80X, 175X and 300X coverage, respectively. From the analysis of 75 samples,
the EnFocus™ Fragile X Analysis pipeline was assessed to have 97% sensitivity and 100% PPV (Table 3).
Table 2. Overview of validation samples. R refers to the independently determined repeat size.
For Research Use Only. Not for use in diagnostic procedures.
30457 Rev A, Bionano Solve Theory of Operation: Bionano EnFocusTM Fragile X Analysis Page 9 of 17
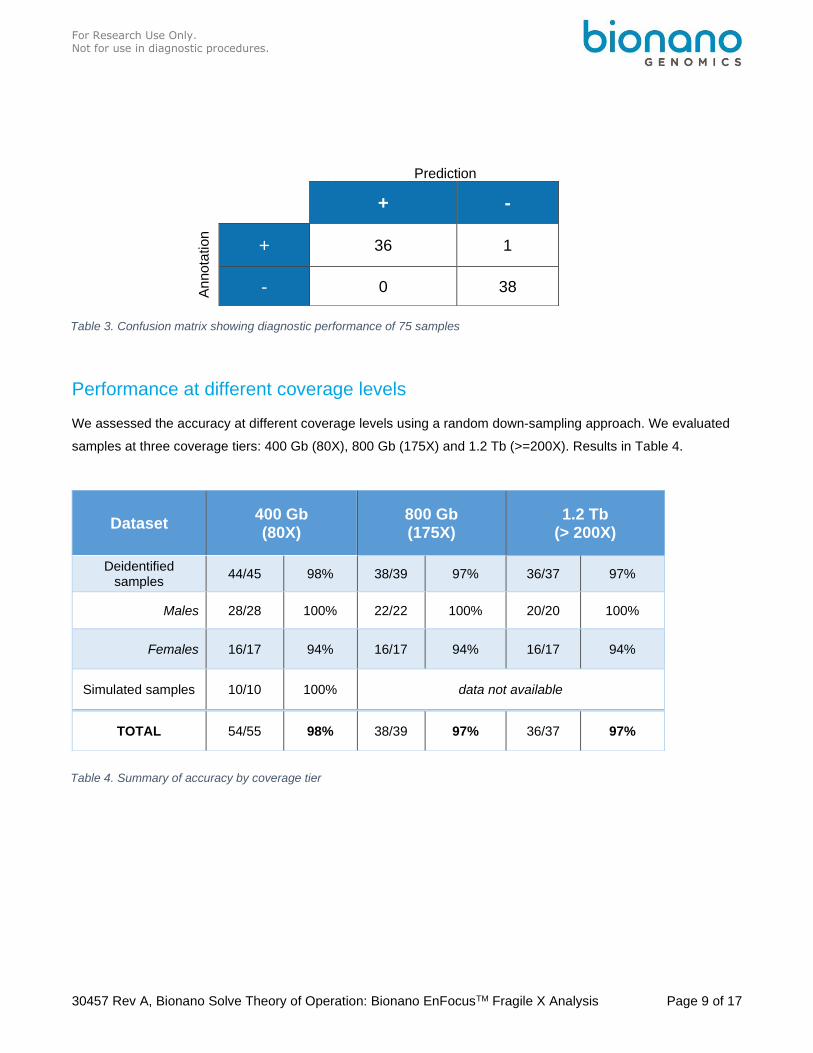
Performance at different coverage levels
We assessed the accuracy at different coverage levels using a random down-sampling approach. We evaluated
samples at three coverage tiers: 400 Gb (80X), 800 Gb (175X) and 1.2 Tb (>=200X). Results in Table 4.
Prediction
+ -
An
no
tation
+ 36 1
- 0 38
Table 3. Confusion matrix showing diagnostic performance of 75 samples
Dataset 400 Gb (80X)
800 Gb (175X)
1.2 Tb (> 200X)
Deidentified samples
44/45 98% 38/39 97% 36/37 97%
Males 28/28 100% 22/22 100% 20/20 100%
Females 16/17 94% 16/17 94% 16/17 94%
Simulated samples 10/10 100% data not available
TOTAL 54/55 98% 38/39 97% 36/37 97%
Table 4. Summary of accuracy by coverage tier
For Research Use Only. Not for use in diagnostic procedures.
30457 Rev A, Bionano Solve Theory of Operation: Bionano EnFocusTM Fragile X Analysis Page 10 of 17
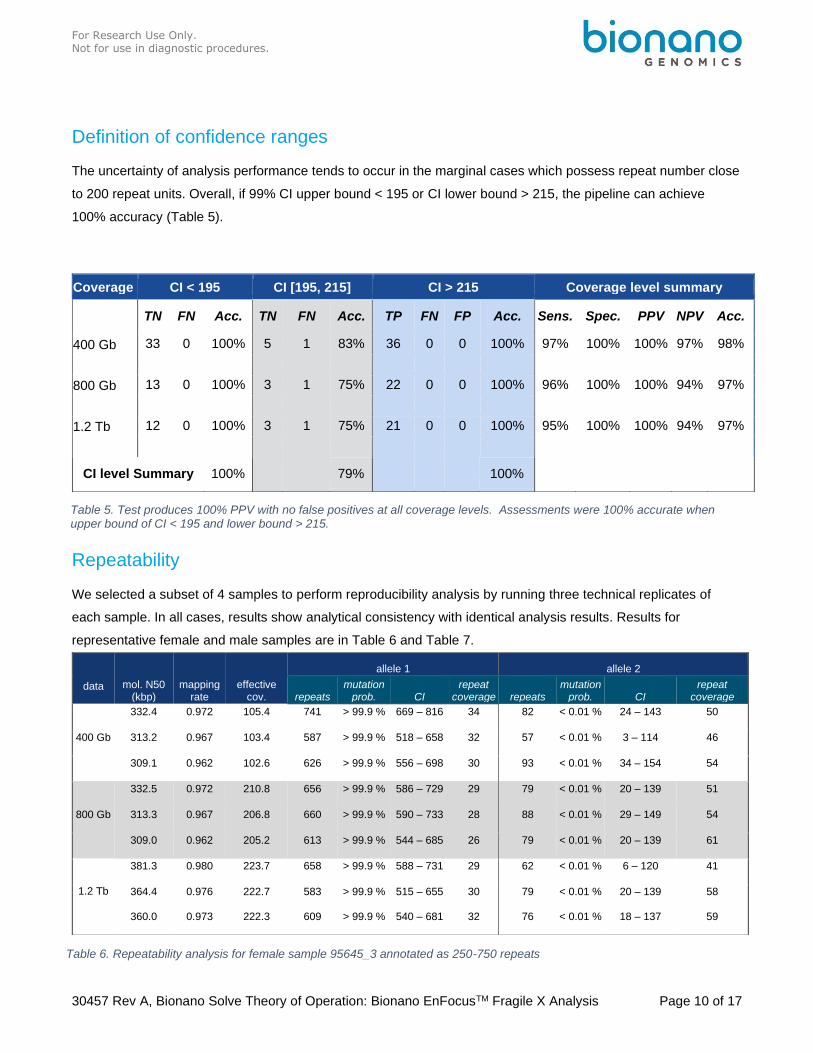
Definition of confidence ranges
The uncertainty of analysis performance tends to occur in the marginal cases which possess repeat number close
to 200 repeat units. Overall, if 99% CI upper bound < 195 or CI lower bound > 215, the pipeline can achieve
100% accuracy (Table 5).
Repeatability
We selected a subset of 4 samples to perform reproducibility analysis by running three technical replicates of
each sample. In all cases, results show analytical consistency with identical analysis results. Results for
representative female and male samples are in Table 6 and Table 7.
Table 5. Test produces 100% PPV with no false positives at all coverage levels. Assessments were 100% accurate when upper bound of CI < 195 and lower bound > 215.
Coverage CI < 195 CI [195, 215] CI > 215 Coverage level summary
TN FN Acc. TN FN Acc. TP FN FP Acc. Sens. Spec. PPV NPV Acc.
400 Gb 33 0 100% 5 1 83% 36 0 0 100% 97% 100% 100% 97% 98%
800 Gb 13 0 100% 3 1 75% 22 0 0 100% 96% 100% 100% 94% 97%
1.2 Tb 12 0 100% 3 1 75% 21 0 0 100% 95% 100% 100% 94% 97%
CI level Summary 100% 79% 100%
data mol. N50 (kbp)
mapping rate
effective cov.
allele 1 allele 2
repeats mutation
prob. CI repeat
coverage repeats mutation
prob. CI repeat
coverage
400 Gb
332.4 0.972 105.4 741 > 99.9 % 669 – 816 34 82 < 0.01 % 24 – 143 50
313.2 0.967 103.4 587 > 99.9 % 518 – 658 32 57 < 0.01 % 3 – 114 46
309.1 0.962 102.6 626 > 99.9 % 556 – 698 30 93 < 0.01 % 34 – 154 54
800 Gb
332.5 0.972 210.8 656 > 99.9 % 586 – 729 29 79 < 0.01 % 20 – 139 51
313.3 0.967 206.8 660 > 99.9 % 590 – 733 28 88 < 0.01 % 29 – 149 54
309.0 0.962 205.2 613 > 99.9 % 544 – 685 26 79 < 0.01 % 20 – 139 61
1.2 Tb
381.3 0.980 223.7 658 > 99.9 % 588 – 731 29 62 < 0.01 % 6 – 120 41
364.4 0.976 222.7 583 > 99.9 % 515 – 655 30 79 < 0.01 % 20 – 139 58
360.0 0.973 222.3 609 > 99.9 % 540 – 681 32 76 < 0.01 % 18 – 137 59
Table 6. Repeatability analysis for female sample 95645_3 annotated as 250-750 repeats
For Research Use Only. Not for use in diagnostic procedures.
30457 Rev A, Bionano Solve Theory of Operation: Bionano EnFocusTM Fragile X Analysis Page 11 of 17
data mol. N50 (kbp)
mapping rate
effective cov.
repeats mutation prob.
CI repeat coverage
400 Gb 332.4 0.973 106.8 133 0.32 % 73 – 194 27
282.1 0.963 101.4 122 0.08 % 62 – 183 39
279.6 0.959 101.6 106 0.01 % 47 – 167 30
800 Gb 332.5 0.972 213.7 122 0.08 % 63 – 184 50
282.2 0.963 203.0 108 0.01 % 49 – 169 54
279.6 0.959 203.2 91 < 0.01 % 33 – 153 37
1.2 Tb 378.5 0.979 223.6 118 0.05 % 59 – 180 51
328.6 0.968 219.9 106 0.01 % 46 – 167 54
336.8 0.968 218.6 120 0.06 % 61 – 182 54
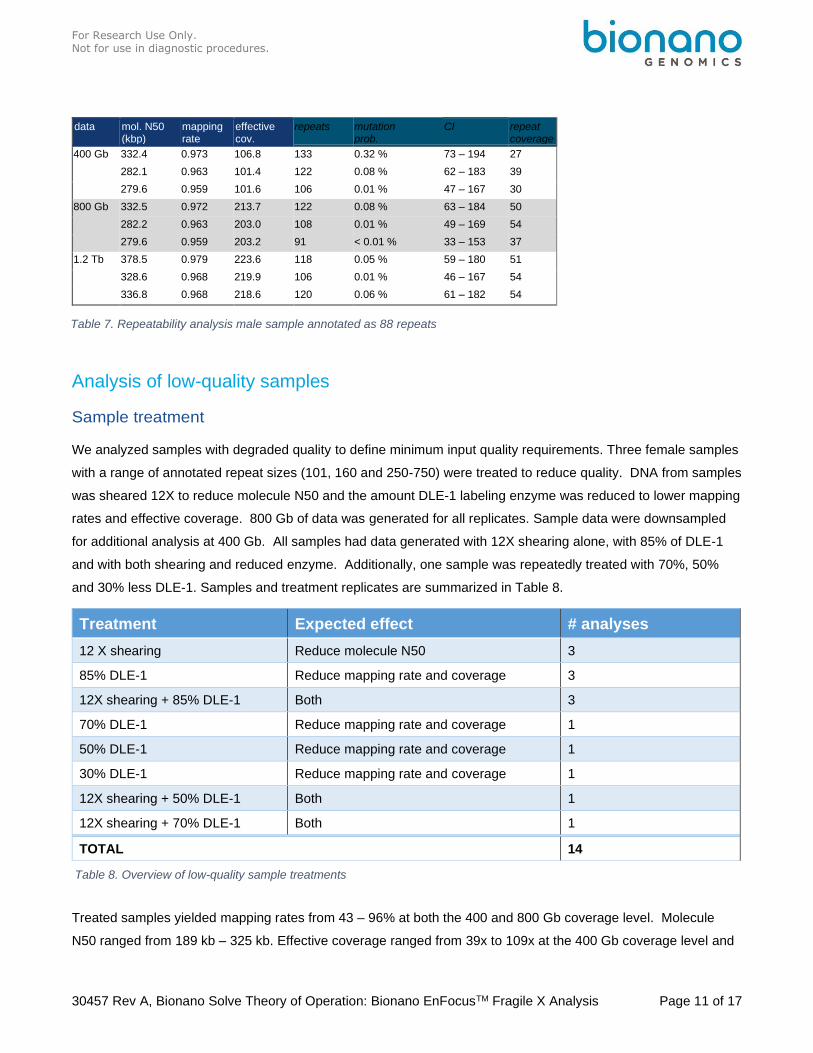
Analysis of low-quality samples
Sample treatment
We analyzed samples with degraded quality to define minimum input quality requirements. Three female samples
with a range of annotated repeat sizes (101, 160 and 250-750) were treated to reduce quality. DNA from samples
was sheared 12X to reduce molecule N50 and the amount DLE-1 labeling enzyme was reduced to lower mapping
rates and effective coverage. 800 Gb of data was generated for all replicates. Sample data were downsampled
for additional analysis at 400 Gb. All samples had data generated with 12X shearing alone, with 85% of DLE-1
and with both shearing and reduced enzyme. Additionally, one sample was repeatedly treated with 70%, 50%
and 30% less DLE-1. Samples and treatment replicates are summarized in Table 8.
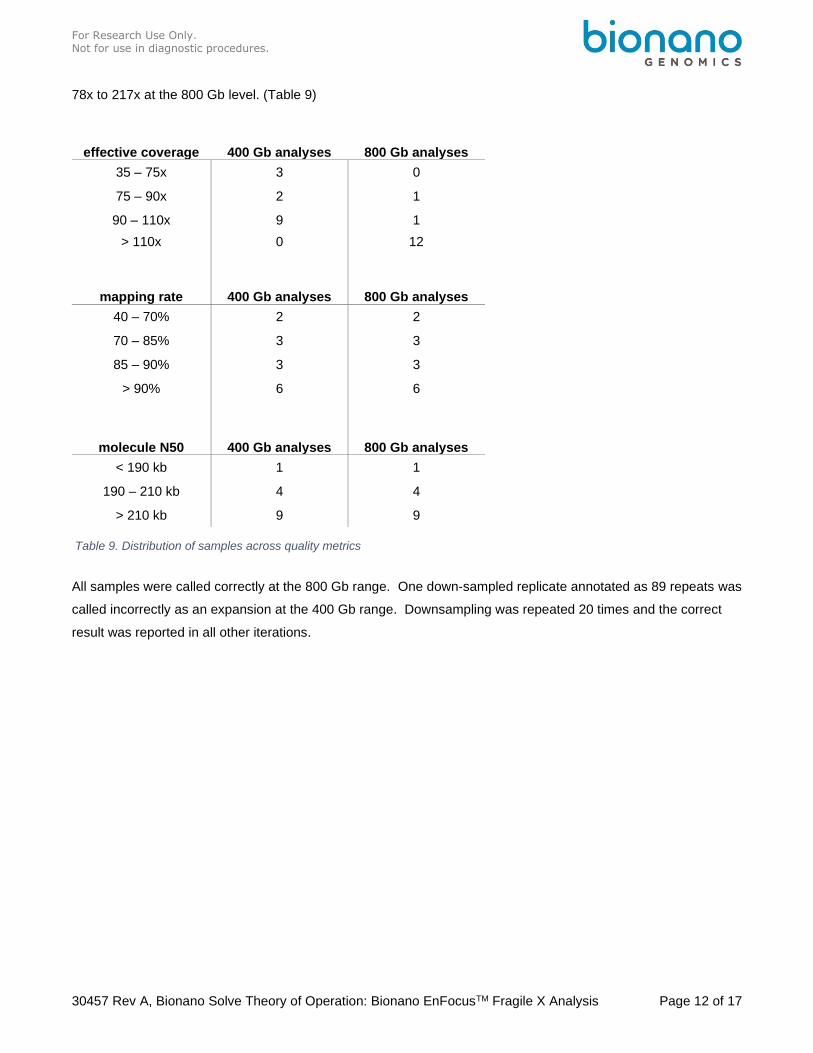
Treated samples yielded mapping rates from 43 – 96% at both the 400 and 800 Gb coverage level. Molecule
N50 ranged from 189 kb – 325 kb. Effective coverage ranged from 39x to 109x at the 400 Gb coverage level and
Table 7. Repeatability analysis male sample annotated as 88 repeats
Treatment Expected effect # analyses
12 X shearing Reduce molecule N50 3
85% DLE-1 Reduce mapping rate and coverage 3
12X shearing + 85% DLE-1 Both 3
70% DLE-1 Reduce mapping rate and coverage 1
50% DLE-1 Reduce mapping rate and coverage 1
30% DLE-1 Reduce mapping rate and coverage 1
12X shearing + 50% DLE-1 Both 1
12X shearing + 70% DLE-1 Both 1
TOTAL 14
Table 8. Overview of low-quality sample treatments
For Research Use Only. Not for use in diagnostic procedures.
30457 Rev A, Bionano Solve Theory of Operation: Bionano EnFocusTM Fragile X Analysis Page 12 of 17
78x to 217x at the 800 Gb level. (Table 9)
All samples were called correctly at the 800 Gb range. One down-sampled replicate annotated as 89 repeats was
called incorrectly as an expansion at the 400 Gb range. Downsampling was repeated 20 times and the correct
result was reported in all other iterations.
effective coverage 400 Gb analyses 800 Gb analyses
35 – 75x 3 0
75 – 90x 2 1
90 – 110x 9 1
> 110x 0 12
mapping rate 400 Gb analyses 800 Gb analyses
40 – 70% 2 2
70 – 85% 3 3
85 – 90% 3 3
> 90% 6 6
molecule N50 400 Gb analyses 800 Gb analyses
< 190 kb 1 1
190 – 210 kb 4 4
> 210 kb 9 9
Table 9. Distribution of samples across quality metrics
For Research Use Only. Not for use in diagnostic procedures.
30457 Rev A, Bionano Solve Theory of Operation: Bionano EnFocusTM Fragile X Analysis Page 13 of 17
EnFocusTM Fragile X Analysis Report
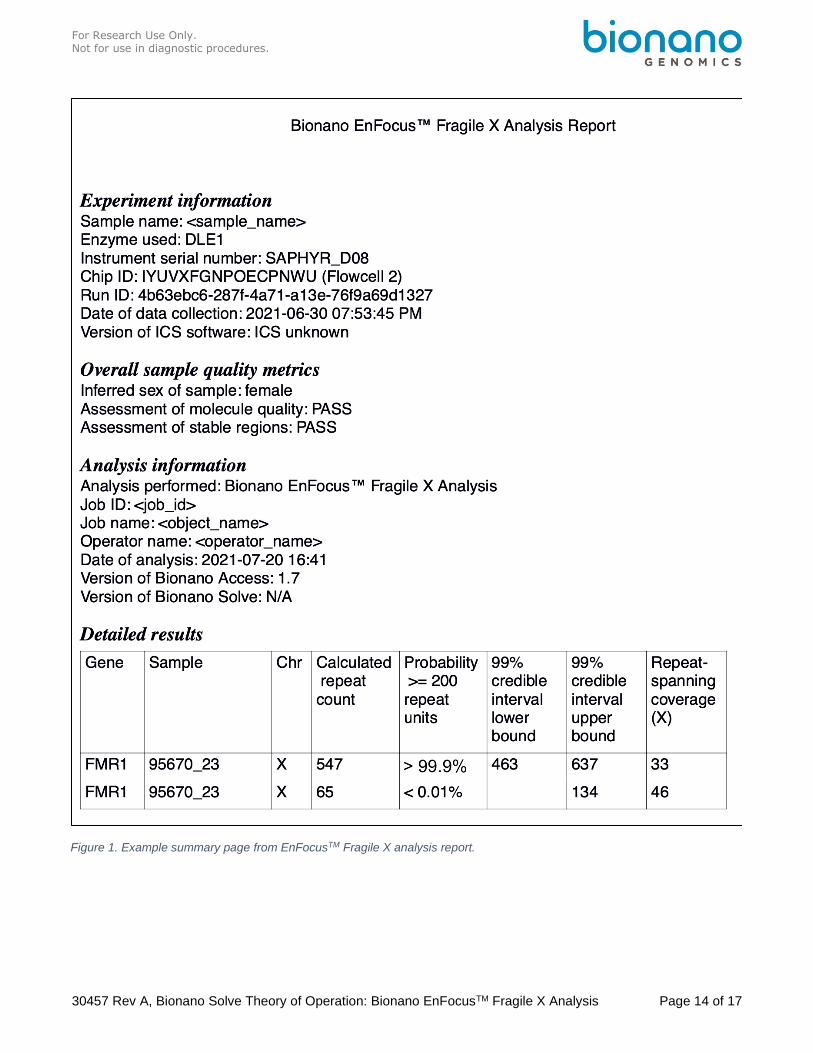
Bionano Access generates a PDF summary report that contains the key results from the Fragile X analysis
pipeline. The first page of the report is a summary page that contains basic information about the sample being
analyzed and the main findings on the Fragile X repeat region. An example of this summary page is shown in
Figure 1.
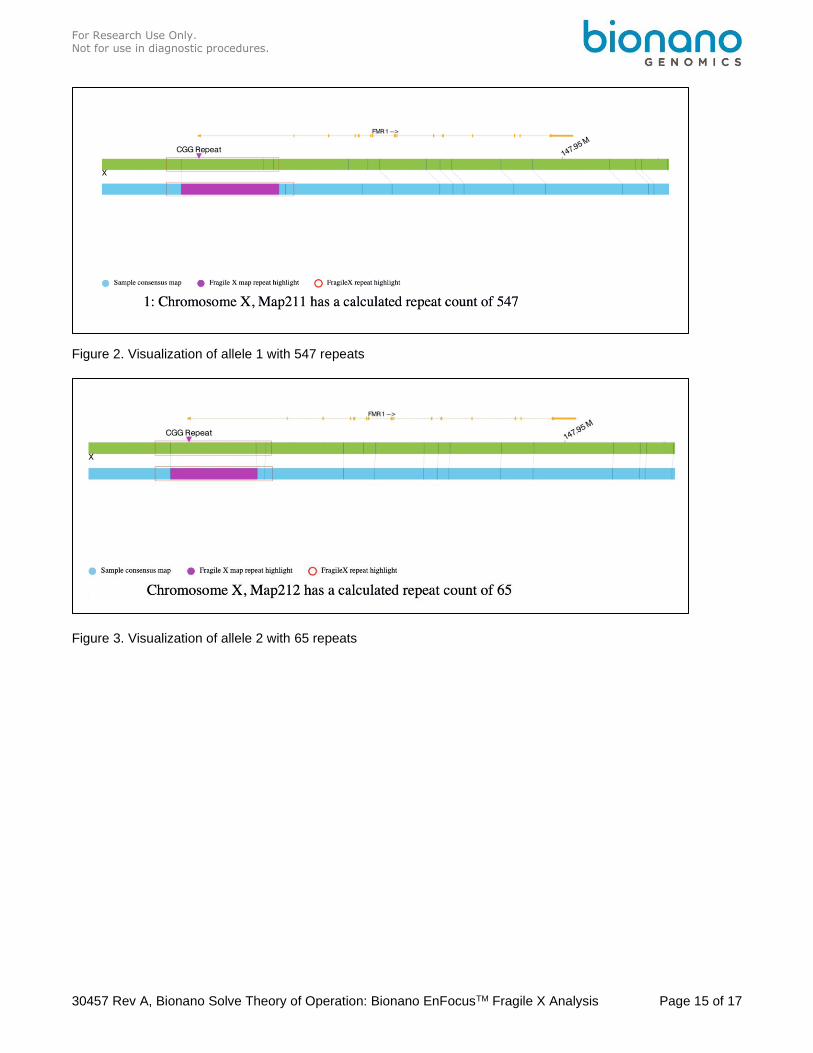
The summary page is followed by detailed results pages where each page shows an assembled Bionano map
that contains the Fragile X repeat. The maps shown correspond to entries in the results table on the first page.
The molecules that support the assembled maps can be shown below the maps as supportive evidence. An
example of a heterozygous full mutation repeat expansion alleles (i.e. one allele greater than 200 repeats and one
less than 200) is shown in Figure 2 and Figure 3.
For Research Use Only. Not for use in diagnostic procedures.
30457 Rev A, Bionano Solve Theory of Operation: Bionano EnFocusTM Fragile X Analysis Page 14 of 17
Figure 1. Example summary page from EnFocusTM Fragile X analysis report.
For Research Use Only. Not for use in diagnostic procedures.
30457 Rev A, Bionano Solve Theory of Operation: Bionano EnFocusTM Fragile X Analysis Page 15 of 17
Figure 2. Visualization of allele 1 with 547 repeats
Figure 3. Visualization of allele 2 with 65 repeats
For Research Use Only. Not for use in diagnostic procedures.
30457 Rev A, Bionano Solve Theory of Operation: Bionano EnFocusTM Fragile X Analysis Page 16 of 17
FAQs
1. How does data quality impact Fragile X analysis results?
As discussed in the quality control section, the pipeline looks at three specific criteria at the molecule quality level
(map rate, molecule N50 > 150 kbp, and effective coverage) and also checks the consensus map quality. Having
sufficiently long molecules and sufficient coverage ensures that the repeats can be fully spanned, and that
haplotypes can be assigned. It also helps ensure that the map-level errors are low.
2. How does de-duplication work?
If the sample is a female or an aneuploid male, the pipeline outputs all FMR1 relevant maps. For a diploid male, if
there are maps with the same repeat counts, the pipeline picks one representative one (with the longest length).
3. What is the performance to detect mosaic repeat expansion alleles?
The current Fragile X pipeline has been validated for germline samples without significant mosaicism.
4. How do you interpret the probability score (P >= 200)?
P >= 200 refers to the probability that the sample has the FMR1 full mutation of >= 200 repeat units. The
probability has no indication for the FMR1 pre-mutation range.
5. Why is the estimated repeat number zero?
In some cases, unresolved close labels (distance <= 1kbp) can occur at the boundary of the interval of interest.
When one-to-multiple label alignment happens, the irrelevant region needs to be corrected by adding an extra
space. Overcorrection of an irrelevant region can cause underestimation of the repeat number. Thus, an
estimated repeat count of zero indicates the sample possesses a small number of repeats. However,
overcorrection events won’t impact diagnostic performance of the pipeline
6. How much time does it take to run the EnFocus Fragile X analysis?
For the recommended coverage of 400 Gbp, the analysis takes1.5 hours on a Saphyr Compute and 3.5 hours on
the Bionano Access Server.
For Research Use Only. Not for use in diagnostic procedures.
30457 Rev A, Bionano Solve Theory of Operation: Bionano EnFocusTM Fragile X Analysis Page 17 of 17
Technical Assistance
For technical assistance, contact Bionano Genomics Technical Support.
You can retrieve documentation on Bionano products, SDS's, certificates of analysis, frequently asked questions, and other related documents from the Support website or by request through e-mail and telephone.
Type Contact
Email [email protected]
Phone Hours of Operation:
Monday through Friday, 9:00 a.m. to 5:00 p.m., PST
US: +1 (858) 888-7663
Website www.bionanogenomics.com/support
Bionano Genomics, Inc. 9540 Towne Centre Drive, Suite 100 San Diego, CA 92121