Embed Size (px)
Citation preview
Bionanoparticles as Candidate Reference Materials for MobilityAnalysis of NanoparticlesR. You,§,‡ M. Li,§,‡ S. Guha,§,‡,† G. W. Mulholland,§,‡ and M. R. Zachariah*,§,‡
§University of Maryland, College Park, Maryland 20742, United States‡National Institute of Standards and Technology, Gaithersburg, Maryland 20899, United States
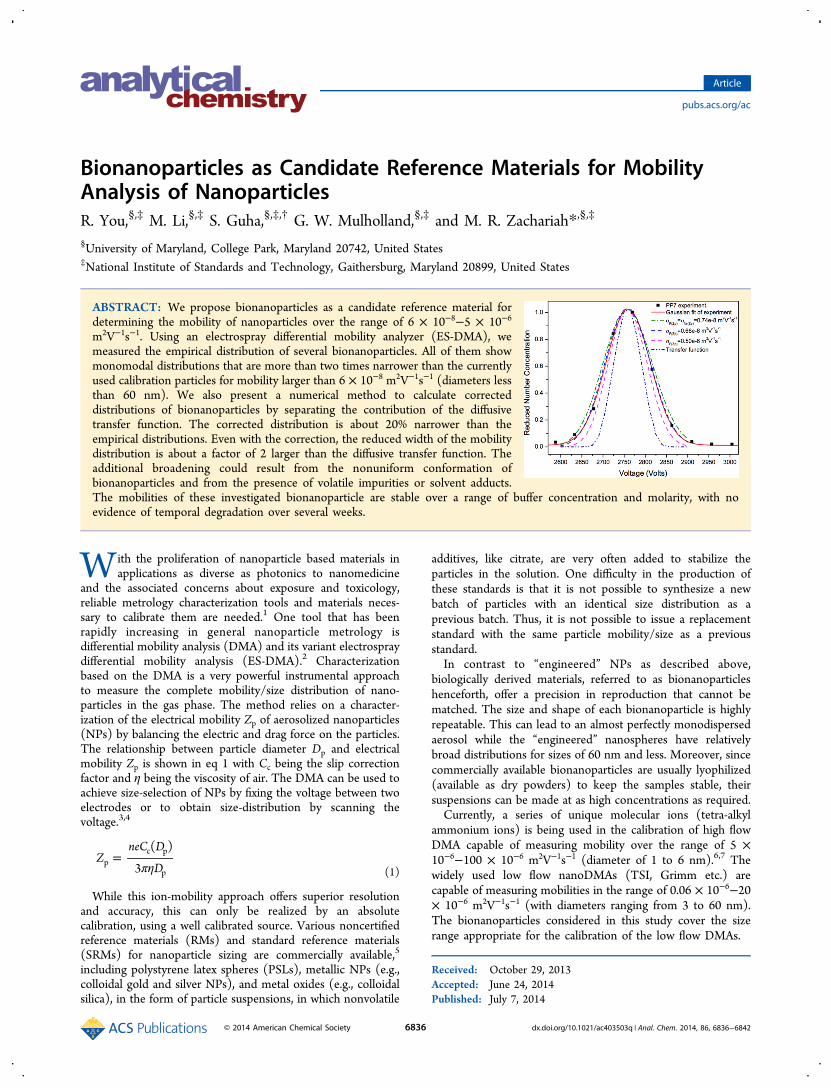
ABSTRACT: We propose bionanoparticles as a candidate reference material fordetermining the mobility of nanoparticles over the range of 6 × 10⁻⁸−5 × 10⁻⁶
m2V−1s−1. Using an electrospray differential mobility analyzer (ES-DMA), wemeasured the empirical distribution of several bionanoparticles. All of them showmonomodal distributions that are more than two times narrower than the currentlyused calibration particles for mobility larger than 6 × 10⁻⁸ m2V−1s−1 (diameters lessthan 60 nm). We also present a numerical method to calculate correcteddistributions of bionanoparticles by separating the contribution of the diffusivetransfer function. The corrected distribution is about 20% narrower than theempirical distributions. Even with the correction, the reduced width of the mobilitydistribution is about a factor of 2 larger than the diffusive transfer function. Theadditional broadening could result from the nonuniform conformation ofbionanoparticles and from the presence of volatile impurities or solvent adducts.The mobilities of these investigated bionanoparticle are stable over a range of buffer concentration and molarity, with noevidence of temporal degradation over several weeks.
With the proliferation of nanoparticle based materials inapplications as diverse as photonics to nanomedicine
and the associated concerns about exposure and toxicology,reliable metrology characterization tools and materials neces-sary to calibrate them are needed.1 One tool that has beenrapidly increasing in general nanoparticle metrology isdifferential mobility analysis (DMA) and its variant electrospraydifferential mobility analysis (ES-DMA).2 Characterizationbased on the DMA is a very powerful instrumental approachto measure the complete mobility/size distribution of nano-particles in the gas phase. The method relies on a character-ization of the electrical mobility Zp of aerosolized nanoparticles(NPs) by balancing the electric and drag force on the particles.The relationship between particle diameter Dp and electricalmobility Zp is shown in eq 1 with Cc being the slip correctionfactor and η being the viscosity of air. The DMA can be used toachieve size-selection of NPs by fixing the voltage between twoelectrodes or to obtain size-distribution by scanning thevoltage.3,4
πη=Z
neC D
D
( )
3pc p
p (1)
While this ion-mobility approach offers superior resolutionand accuracy, this can only be realized by an absolutecalibration, using a well calibrated source. Various noncertifiedreference materials (RMs) and standard reference materials(SRMs) for nanoparticle sizing are commercially available,5
including polystyrene latex spheres (PSLs), metallic NPs (e.g.,colloidal gold and silver NPs), and metal oxides (e.g., colloidalsilica), in the form of particle suspensions, in which nonvolatile
additives, like citrate, are very often added to stabilize theparticles in the solution. One difficulty in the production ofthese standards is that it is not possible to synthesize a newbatch of particles with an identical size distribution as aprevious batch. Thus, it is not possible to issue a replacementstandard with the same particle mobility/size as a previousstandard.In contrast to “engineered” NPs as described above,
biologically derived materials, referred to as bionanoparticleshenceforth, offer a precision in reproduction that cannot bematched. The size and shape of each bionanoparticle is highlyrepeatable. This can lead to an almost perfectly monodispersedaerosol while the “engineered” nanospheres have relativelybroad distributions for sizes of 60 nm and less. Moreover, sincecommercially available bionanoparticles are usually lyophilized(available as dry powders) to keep the samples stable, theirsuspensions can be made at as high concentrations as required.Currently, a series of unique molecular ions (tetra-alkyl
ammonium ions) is being used in the calibration of high flowDMA capable of measuring mobility over the range of 5 ×10⁻⁶−100 × 10−6 m2V−1s−1 (diameter of 1 to 6 nm).6,7 Thewidely used low flow nanoDMAs (TSI, Grimm etc.) arecapable of measuring mobilities in the range of 0.06 × 10⁻⁶−20× 10−6 m2V−1s−1 (with diameters ranging from 3 to 60 nm).The bionanoparticles considered in this study cover the sizerange appropriate for the calibration of the low flow DMAs.
Received: October 29, 2013Accepted: June 24, 2014Published: July 7, 2014
Article
pubs.acs.org/ac
© 2014 American Chemical Society 6836 dx.doi.org/10.1021/ac403503q | Anal. Chem. 2014, 86, 6836−6842
In this paper, we explore using biologically derived materialsas potential particle mobility/size standards for the DMA. Thefirst implementation of ES-DMA to bionanoparticles can betraced back to 1996, when Kaufman et al. measured globularproteins ranging from 3 to 14 nm.8 Subsequently, researchershave presented the application of this technique to otherspecific bionanoparticles such as polymers, viruses, bacterioph-ages, etc.9−12 Most of them, however, were investigated only ata modest resolution, and the actual width of the mobility sizedistributions remained unknown. One recent study by A.Maiβer using high flow DMA included bovine serum albumin(BSA), which is included in our study, to provide an overlapbetween the high flow and low flow DMA measurements.6
Here, we systematically investigated five different bionanopar-ticles: BSA, polyclonal human immunoglobulin (IgG), aglycoprotein with a high glyan heterogeneity, phage PP7,coliphage PR772, and tobacco mosaic virus (TMV) with sizeranging from 6 nm up to 64 nm. The measurements of thesematerials were compared with high precision “engineered”nanoparticles: gold colloids (AuNPs) and polystyrene latexbeads (PSL). We also calculated corresponding transferfunctions and separated its contribution from the measureddistribution in order to further estimate the true width of thesize spectrum for each aerosolized bionanoparticle. Todemonstrate the stability of these bionanoparticles, themobility/size was measured for a range of bionanoparticlesuspension concentration and buffer molarity. Day-to-dayvariation of mobility/size was also evaluated. We concludefrom these results that bioderived material offer superiorcalibration of mobility-analysis equipment over most “engi-neered” nanoparticles. It is worth noting that size measured byDMA could differ from device to device up to 15% even for thesame analyte.13 Hence, the model of the equipment should bespecified, and a round robin test is important before assigningthe value for reference material, which is beyond the scope ofthe discussion in this paper.
■ EXPERIMENTAL SECTIONElectrospray Particle Generation and Differential
Mobility Measurements. We measured the size distributionwith an ES-neutralizer-DMA-condensation particle counter(ES-neutralizer-DMA-CPC) system described previously.14
Suspended bionanoparticles were first aerosolized using a 40μm inner diameter capillary mounted in an electrospray (TSIInc., Shore View, MN, #3480) with the chamber pressure of2.55 × 104 Pa (3.7 psi) and a carrier gas of 20 cm3/s (1.2 L/min) purified air. The aerosolized droplets were then charge-reduced in a Po-210 radiation source so that most aerosolscarry −1, 0, or +1 charge. A negative voltage was applied to thecentral electrode of a Nano DMA (TSI Inc., #3085) such thatthe +1 charged particles passed through the DMA and werecounted by a condensation particle counter (CPC) (TSI Inc.#3025A), counting efficiency of which is over 95% for theinvestigated sizes. Two modules of mass flow controller (MKSInc., #M100B), 333.3 cm3/s (20 000 sccm) and 500 cm3/s (30000 sccm), were used to control the sheath flow in the DMA,accuracy of which is ±5 cm3/s (300 sccm) and ±10 cm3/s (600sccm), respectively.The investigated bionanoparticles were split into two groups
based on their expected mobility size. For smaller particles, i.e.,IgG, BSA, and PP7, a high sheath flow rate of 500 cm3/s (30 L/min) was adopted to reduce the broadening of the DMAtransfer function from Brownian motion. For the larger
particles, i.e., PR772 and TMV, a sheath flow rate of 83.33cm3/s (5 L/min) was used so that the largest particle could besampled at a voltage below the maximum value of 10 000 V forthe power supply. Due to anticipated narrow size distributionsof bionanoparticles, the ratios of the sheath to aerosol flow werechosen to be large, about 42 for smaller particles and 33 for thelarger ones. Since the resolution in a DMA scales as the ratio ofthe sheath to aerosol, the operating resolution of the DMA ishigher than what is normal practice. To ensure this resolution,the DMA was operated in a voltage stepping mode with aninterval of 25 s at high sheath flow and 40 s under low flow rate,which ensured that the residence time from DMA inlet to theCPC detector was smaller than the dwell time. The scanninginterval is chosen to be 0.2 nm for the smaller bionanoparticles,particularly 0.05 nm for BSA, and 1 nm for the larger ones. Forthe purpose of equipment calibration, NIST SRM PSL of 100.7nm, SRM1963, was used in the measurements of bigbionanoparticles while 30 nm citrate-stabilized AuNPs (TedPella Inc.), size-calibrated by SRM 1963, were employed inthose of small biomolecules. For the size distributionmeasurement of citrate-stabilized AuNPs, we refer the readersto Hinterwirth’s paper15 which gives comparative assessment ofseveral characterization methods and shows that ES-DMA hasthe highest size resolution.The voltage associated with centroid electrical mobility was
assigned by averaging the means of Gaussian fits to threereplicate measurements. Electrical mobility of each bionano-particle was calculated as below.
π=Z
Q
V L
ln
2
rr
psh
e d
out
in
(2)
where Qsh is the sheath flow rate, rout and rin are the outer andinner radii of DMA column, Ve is the voltage applied onelectrodes, and Ld is the length of DMA column. The mobilitysize in this paper was calculated using eq 1, in which the slipcorrection factor is given by
= + + −C D K A A A K( ) 1 [ exp( / )]c p n 1 2 3 n (3)
where Kn is twice the mean free path of air divided by theparticle diameter (Kn = 2λ/Dp) and A1 = 1.142, A2 = 0.558, andA3 = 0.999.16 Eq 3 is an empirical and alternative expression11
that has been suggested for describing the relationship betweenmobility and particle diameter for small particles in the sizerange of less than 10 nm. The fundamental quantity accuratelymeasured by the DMA is the mobility of the particle, while thedetermination of the mobility diameter has additionaluncertainty from the use of eq 3. We present our results interms of mobility diameter as well as mobility because of thewidespread use of mobility diameter in the aerosol community.
ES-DMA Buffer Preparation. Twenty mM ammoniumacetate buffer solutions (AmAc) were prepared by dissolving0.77 g of ammonium acetate powder (Sigma-Aldrich, St. Louis,MO, #631-61-8) in 0.5 L of deionized water (18 MΩ/cm,Barnestead nanopure UV system) filtered by 0.2 μm pores. Tenand two mM buffers were then obtained by diluting withfiltered deionized water.
Bionanoparticle Suspension Preparation. We foundthat to obtain well-shaped mobility spectra with minimalcapillary clogging of the electrospray the optimized sampleconcentration should yield a CPC count ranging from 2000 to6000 particles/cm3. The easiest approach to achieve this targetwas to start with highly concentrated solutions and dilute with
Analytical Chemistry Article
dx.doi.org/10.1021/ac403503q | Anal. Chem. 2014, 86, 6836−68426837
buffer. For BSA (Sigma-Aldrich, St. Louis, MO, # A9418), andhuman IgG (Sigma-Aldrich, St. Louis, MO, # 14506), initialsolution was prepared by suspending 1 mg in 1 mL of 20 mMAmAc. The solution was then diluted to be 100 μg/mL anddenoted as a 1× dilution. Phage PP7 from ATCC (Manassas,VA; accession numbers 15692-B4) and PR772 (Felix d’HerelleReference Center for Bacterial Viruses, Universite Laval,Quebec, Canada) were prepared as described in a previouspaper.17 The initial solutions were obtained with a concen-tration of 2.5 × 10¹³ plaque forming units/cm3 (pfu/cm3) and1.5 × 1012 pfu/cm3, respectively. The phages were thendialyzed into 20 mM AmAc and adjusted to 2.1 × 10¹¹ pfu/cm3
for PP7 and 1.25 × 10¹⁰ pfu/cm3 for PR772 in a 1× dilution. ATMV suspension (James N. Culver’s Lab, UMD) with an initialconcentration of 15 mg/mL was diluted to 50 μg/mL with 2mM AmAc for 1× dilutions. Samples with five (5×) and ten(10×) times dilutions were also made to assess the effect ofconcentration on the mobility size. To assess the stability ofbionanoparticle size in buffers with different molarities, 10 and2 mM AmAc were used to prepare 5× solutions for IgG andBSA as well as 1× solutions for PP7 and PR772. For TMV, 1×solutions were also prepared using 10 and 20 mM buffers.“Engineered” NPs Suspension Preparation. Size
distributions of “engineered” NPs including 10, 20, 30, and
60 nm citrate-stabilized monodispersed colloidal AuNPs (TedPella Inc.) were measured. A suspension (1.5 mL) of 10 nmAuNPs were first centrifuged at 13.2 kRPM for 40 min toremove most of the supernatant and then replaced with anequivalent volume of 2 mM AmAc. This process was repeatedto remove the citrate stabilizer, which forms a residue on thesurface of the gold particle if not removed. The same procedurewas applied to 20, 30, and 60 nm AuNPs by changing thecentrifuge time to 15, 3, and 1 min, respectively. For the PSLspheres, a drop of SRM 1963 was mixed with 1 mL of 2 mMAmAc and diluted 6 times. The same procedure was applied to30 nm PSLs (Thermo Scientific. 3030A) and 60 nm PSLs(NIST SRM1964) with a dilution factor of 20 for the 30 nmsample and 10 for the 60 nm sample.
■ RESULTS AND DISCUSSION
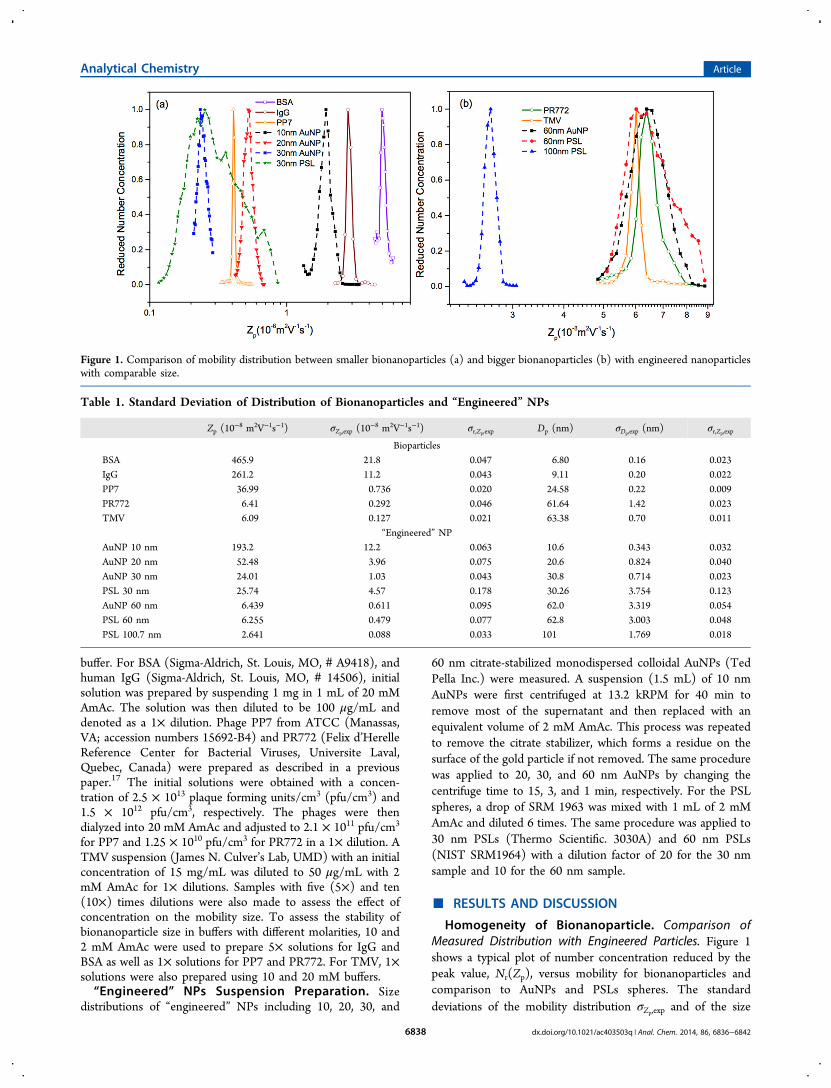
Homogeneity of Bionanoparticle. Comparison ofMeasured Distribution with Engineered Particles. Figure 1shows a typical plot of number concentration reduced by thepeak value, Nr(Zp), versus mobility for bionanoparticles andcomparison to AuNPs and PSLs spheres. The standarddeviations of the mobility distribution σZp,exp and of the size
Figure 1. Comparison of mobility distribution between smaller bionanoparticles (a) and bigger bionanoparticles (b) with engineered nanoparticleswith comparable size.
Table 1. Standard Deviation of Distribution of Bionanoparticles and “Engineered” NPs
Zp (10−8 m2V−1s−1) σZp,exp (10
−8 m2V−1s−1) σr,Zp,exp Dp (nm) σDp,exp (nm) σr,Zp,exp
BioparticlesBSA 465.9 21.8 0.047 6.80 0.16 0.023IgG 261.2 11.2 0.043 9.11 0.20 0.022PP7 36.99 0.736 0.020 24.58 0.22 0.009PR772 6.41 0.292 0.046 61.64 1.42 0.023TMV 6.09 0.127 0.021 63.38 0.70 0.011
“Engineered” NPAuNP 10 nm 193.2 12.2 0.063 10.6 0.343 0.032AuNP 20 nm 52.48 3.96 0.075 20.6 0.824 0.040AuNP 30 nm 24.01 1.03 0.043 30.8 0.714 0.023PSL 30 nm 25.74 4.57 0.178 30.26 3.754 0.123AuNP 60 nm 6.439 0.611 0.095 62.0 3.319 0.054PSL 60 nm 6.255 0.479 0.077 62.8 3.003 0.048PSL 100.7 nm 2.641 0.088 0.033 101 1.769 0.018
Analytical Chemistry Article
dx.doi.org/10.1021/ac403503q | Anal. Chem. 2014, 86, 6836−68426838
distribution σDp,exp are listed in Table 1. The reduced standard
deviations σr,Zp,exp and σr,Dp,exp are calculated as
σσ
σσ
= =Z D
,ZZ
pr D
Dr, ,exp
,exp, ,exp
,exp
pp
p
p
p
(4)
In all cases, the bionanoparticles have narrower width ofNr(Zp) with reduced standard deviations that did not exceed0.047. In contrast, among the engineered particles, only SRM1963 (PSL 100.7 nm) has a comparable distribution with aσr,Zp,exp of 0.033. The colloidal gold samples are by far the betterof the “engineered” particles relative to PSLs for sizes of 60 nmand lower in terms of monodispersity. It is also worth notingthat the narrow distributions of bioparticles comprise bothsingle molecules (e.g., IgG and BSA) as well as whole viruses(PP7, PR772, TMV). However, despite the remarkably narrowdistribution of TMV (σr,Zp,exp = 0.021) and consistency ofmobility measured over a long period of time as shown in theStability of Bionanoparticle section, we suggest that it be usedwith an understanding of its length variation in solution andfolded state after electrospray.18
Evaluation of Instrumental Resolution Limit. To assess ifthe observed size distributions reflect the intrinsic property ofthe particles or the resolution limit of the DMA, we evaluatethe transfer function. The transfer function of the DMA isdefined as the probability of an aerosol particle with a certainsize that enters at the inlet slit and exits via the sampling slit.3
As a good approximation, the transfer function includingBrownian diffusion of the aerosol reflects the instrumentalresolution limit. We calculated the transfer function accordingto Stolzenburg’s approach19 and found that the peak value of
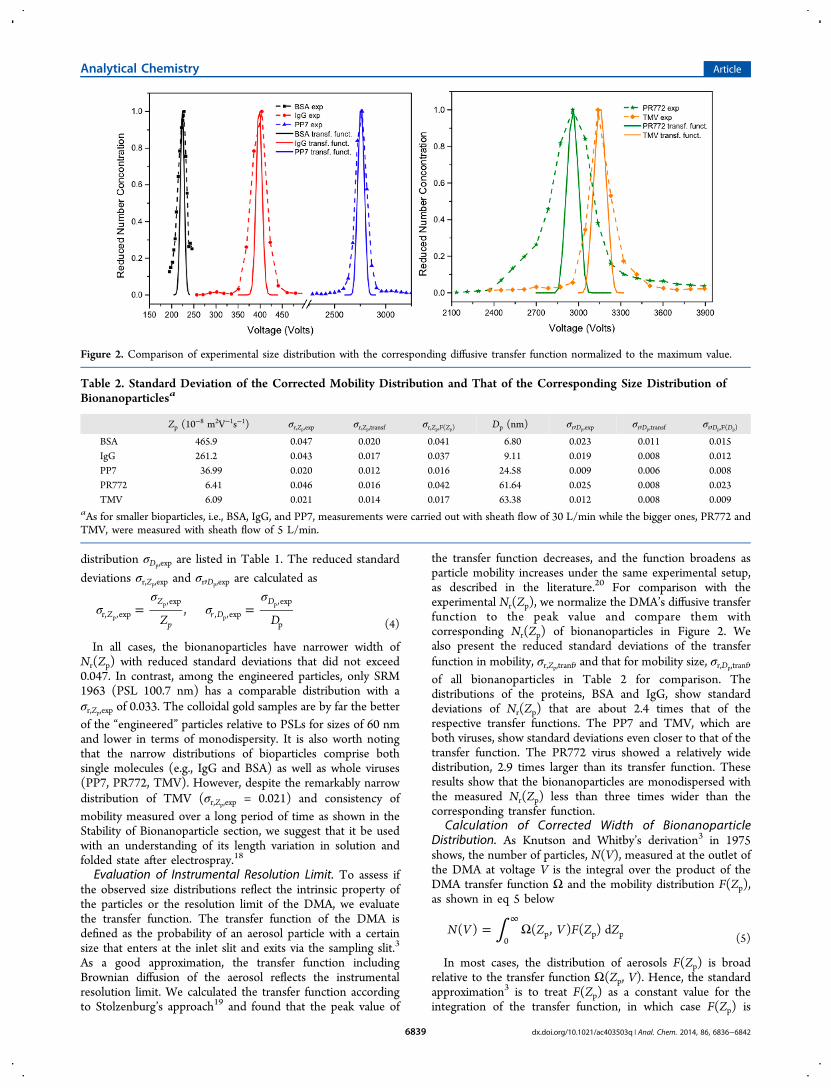
the transfer function decreases, and the function broadens asparticle mobility increases under the same experimental setup,as described in the literature.20 For comparison with theexperimental Nr(Zp), we normalize the DMA’s diffusive transferfunction to the peak value and compare them withcorresponding Nr(Zp) of bionanoparticles in Figure 2. Wealso present the reduced standard deviations of the transferfunction in mobility, σr,Zp,tranf, and that for mobility size, σr,Dp,tranf,of all bionanoparticles in Table 2 for comparison. Thedistributions of the proteins, BSA and IgG, show standarddeviations of Nr(Zp) that are about 2.4 times that of therespective transfer functions. The PP7 and TMV, which areboth viruses, show standard deviations even closer to that of thetransfer function. The PR772 virus showed a relatively widedistribution, 2.9 times larger than its transfer function. Theseresults show that the bionanoparticles are monodispersed withthe measured Nr(Zp) less than three times wider than thecorresponding transfer function.
Calculation of Corrected Width of BionanoparticleDistribution. As Knutson and Whitby’s derivation3 in 1975shows, the number of particles, N(V), measured at the outlet ofthe DMA at voltage V is the integral over the product of theDMA transfer function Ω and the mobility distribution F(Zp),as shown in eq 5 below
∫= Ω∞
N V Z V F Z Z( ) ( , ) ( ) d0
p p p (5)
In most cases, the distribution of aerosols F(Zp) is broadrelative to the transfer function Ω(Zp, V). Hence, the standardapproximation3 is to treat F(Zp) as a constant value for theintegration of the transfer function, in which case F(Zp) is
Figure 2. Comparison of experimental size distribution with the corresponding diffusive transfer function normalized to the maximum value.
Table 2. Standard Deviation of the Corrected Mobility Distribution and That of the Corresponding Size Distribution ofBionanoparticlesa
Zp (10−8 m2V−1s−1) σr,Zp,exp σr,Zp,transf σr,Zp,F(Zp) Dp (nm) σr,Dp,exp σr,Dp,transf σr,Dp,F(Dp)
BSA 465.9 0.047 0.020 0.041 6.80 0.023 0.011 0.015IgG 261.2 0.043 0.017 0.037 9.11 0.019 0.008 0.012PP7 36.99 0.020 0.012 0.016 24.58 0.009 0.006 0.008PR772 6.41 0.046 0.016 0.042 61.64 0.025 0.008 0.023TMV 6.09 0.021 0.014 0.017 63.38 0.012 0.008 0.009
aAs for smaller bioparticles, i.e., BSA, IgG, and PP7, measurements were carried out with sheath flow of 30 L/min while the bigger ones, PR772 andTMV, were measured with sheath flow of 5 L/min.
Analytical Chemistry Article
dx.doi.org/10.1021/ac403503q | Anal. Chem. 2014, 86, 6836−68426839
proportional to the empirical Nr(Zp) in Figure 1. However, thisis clearly not the case for bionanoparticles. Due to their verynarrow distribution, such an approximation could result in anoverestimation of the true width of the distribution ofbionanoparticles.Here, we present a numerical method to evaluate the width
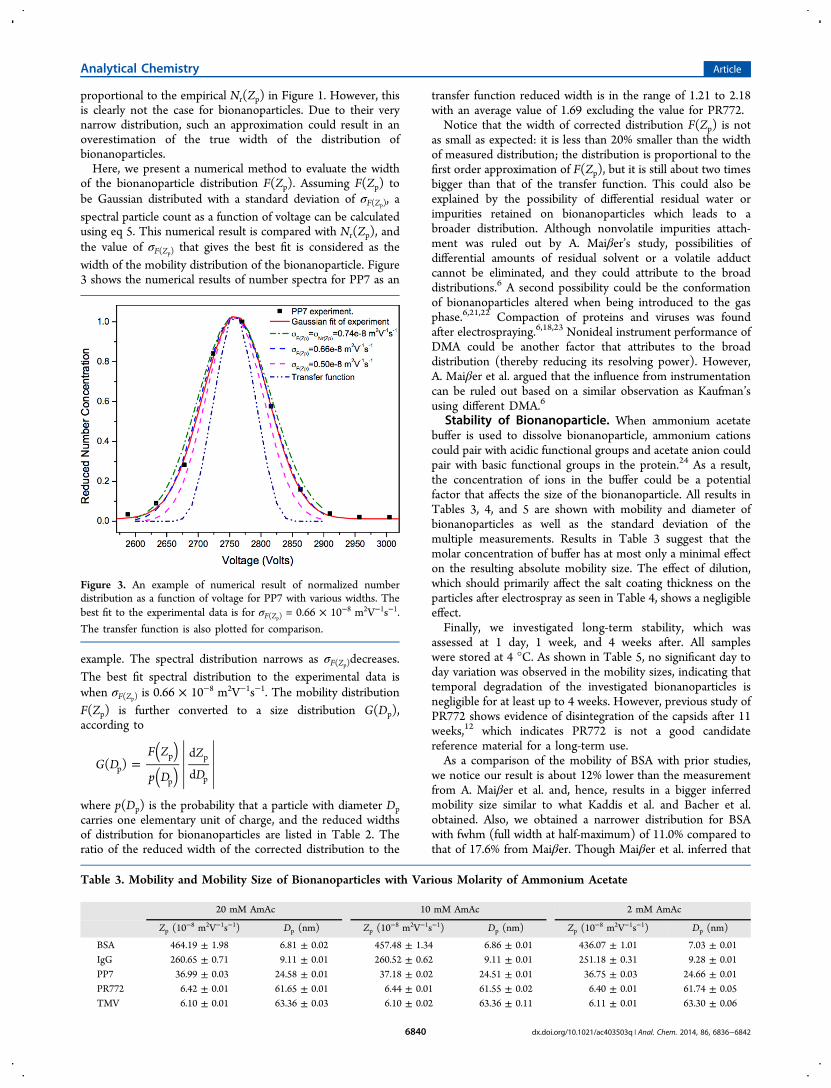
of the bionanoparticle distribution F(Zp). Assuming F(Zp) tobe Gaussian distributed with a standard deviation of σF(Zp), aspectral particle count as a function of voltage can be calculatedusing eq 5. This numerical result is compared with Nr(Zp), andthe value of σF(Zp) that gives the best fit is considered as thewidth of the mobility distribution of the bionanoparticle. Figure3 shows the numerical results of number spectra for PP7 as an
example. The spectral distribution narrows as σF(Zp)decreases.The best fit spectral distribution to the experimental data iswhen σF(Zp) is 0.66 × 10⁻⁸ m2V−1s−1. The mobility distributionF(Zp) is further converted to a size distribution G(Dp),according to
=( )( )
G DF Z
p D
Z
D( )
d
dpp
p
p
p
where p(Dp) is the probability that a particle with diameter Dpcarries one elementary unit of charge, and the reduced widthsof distribution for bionanoparticles are listed in Table 2. Theratio of the reduced width of the corrected distribution to the
transfer function reduced width is in the range of 1.21 to 2.18with an average value of 1.69 excluding the value for PR772.Notice that the width of corrected distribution F(Zp) is not
as small as expected: it is less than 20% smaller than the widthof measured distribution; the distribution is proportional to thefirst order approximation of F(Zp), but it is still about two timesbigger than that of the transfer function. This could also beexplained by the possibility of differential residual water orimpurities retained on bionanoparticles which leads to abroader distribution. Although nonvolatile impurities attach-ment was ruled out by A. Maiβer’s study, possibilities ofdifferential amounts of residual solvent or a volatile adductcannot be eliminated, and they could attribute to the broaddistributions.6 A second possibility could be the conformationof bionanoparticles altered when being introduced to the gasphase.6,21,22 Compaction of proteins and viruses was foundafter electrospraying.6,18,23 Nonideal instrument performance ofDMA could be another factor that attributes to the broaddistribution (thereby reducing its resolving power). However,A. Maiβer et al. argued that the influence from instrumentationcan be ruled out based on a similar observation as Kaufman’susing different DMA.6
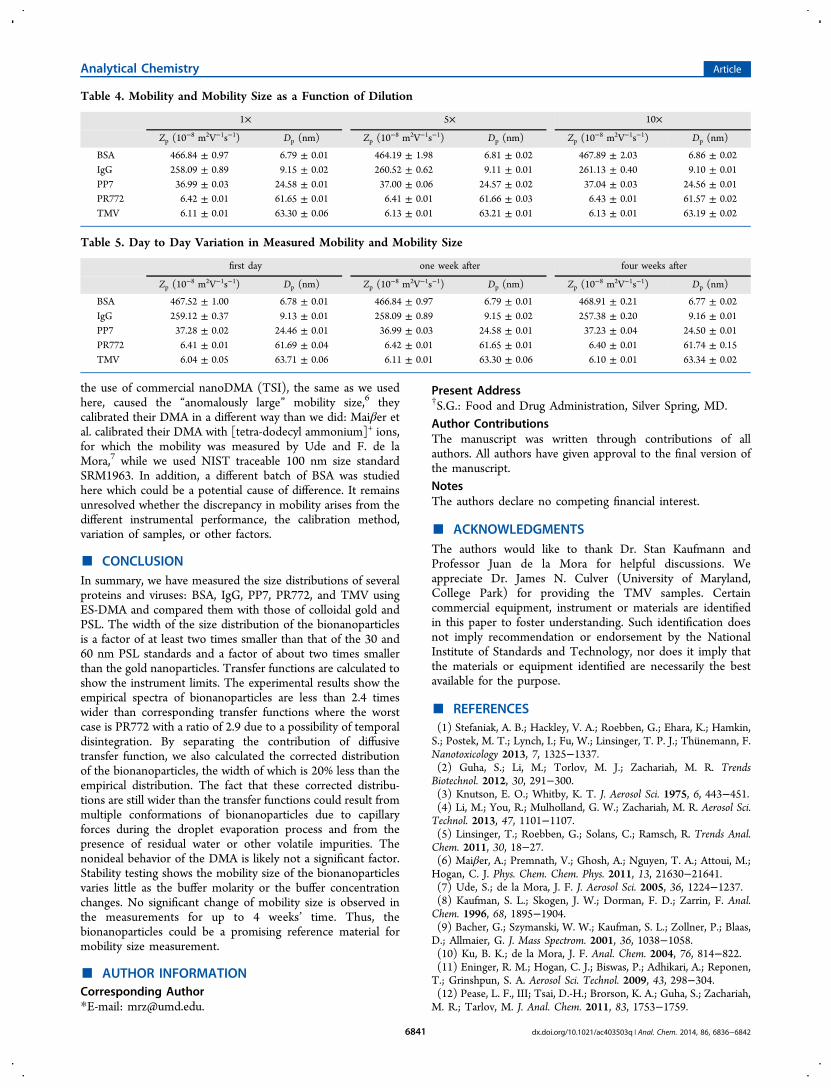
Stability of Bionanoparticle. When ammonium acetatebuffer is used to dissolve bionanoparticle, ammonium cationscould pair with acidic functional groups and acetate anion couldpair with basic functional groups in the protein.24 As a result,the concentration of ions in the buffer could be a potentialfactor that affects the size of the bionanoparticle. All results inTables 3, 4, and 5 are shown with mobility and diameter ofbionanoparticles as well as the standard deviation of themultiple measurements. Results in Table 3 suggest that themolar concentration of buffer has at most only a minimal effecton the resulting absolute mobility size. The effect of dilution,which should primarily affect the salt coating thickness on theparticles after electrospray as seen in Table 4, shows a negligibleeffect.Finally, we investigated long-term stability, which was
assessed at 1 day, 1 week, and 4 weeks after. All sampleswere stored at 4 °C. As shown in Table 5, no significant day today variation was observed in the mobility sizes, indicating thattemporal degradation of the investigated bionanoparticles isnegligible for at least up to 4 weeks. However, previous study ofPR772 shows evidence of disintegration of the capsids after 11weeks,12 which indicates PR772 is not a good candidatereference material for a long-term use.As a comparison of the mobility of BSA with prior studies,
we notice our result is about 12% lower than the measurementfrom A. Maiβer et al. and, hence, results in a bigger inferredmobility size similar to what Kaddis et al. and Bacher et al.obtained. Also, we obtained a narrower distribution for BSAwith fwhm (full width at half-maximum) of 11.0% compared tothat of 17.6% from Maiβer. Though Maiβer et al. inferred that
Figure 3. An example of numerical result of normalized numberdistribution as a function of voltage for PP7 with various widths. Thebest fit to the experimental data is for σF(Zp) = 0.66 × 10⁻⁸ m2V−1s−1.
The transfer function is also plotted for comparison.
Table 3. Mobility and Mobility Size of Bionanoparticles with Various Molarity of Ammonium Acetate
20 mM AmAc 10 mM AmAc 2 mM AmAc
Zp (10−8 m2V−1s−1) Dp (nm) Zp (10
−8 m2V−1s−1) Dp (nm) Zp (10−8 m2V−1s−1) Dp (nm)
BSA 464.19 ± 1.98 6.81 ± 0.02 457.48 ± 1.34 6.86 ± 0.01 436.07 ± 1.01 7.03 ± 0.01IgG 260.65 ± 0.71 9.11 ± 0.01 260.52 ± 0.62 9.11 ± 0.01 251.18 ± 0.31 9.28 ± 0.01PP7 36.99 ± 0.03 24.58 ± 0.01 37.18 ± 0.02 24.51 ± 0.01 36.75 ± 0.03 24.66 ± 0.01PR772 6.42 ± 0.01 61.65 ± 0.01 6.44 ± 0.01 61.55 ± 0.02 6.40 ± 0.01 61.74 ± 0.05TMV 6.10 ± 0.01 63.36 ± 0.03 6.10 ± 0.02 63.36 ± 0.11 6.11 ± 0.01 63.30 ± 0.06
Analytical Chemistry Article
dx.doi.org/10.1021/ac403503q | Anal. Chem. 2014, 86, 6836−68426840
the use of commercial nanoDMA (TSI), the same as we usedhere, caused the “anomalously large” mobility size,6 theycalibrated their DMA in a different way than we did: Maiβer etal. calibrated their DMA with [tetra-dodecyl ammonium]+ ions,for which the mobility was measured by Ude and F. de laMora,7 while we used NIST traceable 100 nm size standardSRM1963. In addition, a different batch of BSA was studiedhere which could be a potential cause of difference. It remainsunresolved whether the discrepancy in mobility arises from thedifferent instrumental performance, the calibration method,variation of samples, or other factors.
■ CONCLUSIONIn summary, we have measured the size distributions of severalproteins and viruses: BSA, IgG, PP7, PR772, and TMV usingES-DMA and compared them with those of colloidal gold andPSL. The width of the size distribution of the bionanoparticlesis a factor of at least two times smaller than that of the 30 and60 nm PSL standards and a factor of about two times smallerthan the gold nanoparticles. Transfer functions are calculated toshow the instrument limits. The experimental results show theempirical spectra of bionanoparticles are less than 2.4 timeswider than corresponding transfer functions where the worstcase is PR772 with a ratio of 2.9 due to a possibility of temporaldisintegration. By separating the contribution of diffusivetransfer function, we also calculated the corrected distributionof the bionanoparticles, the width of which is 20% less than theempirical distribution. The fact that these corrected distribu-tions are still wider than the transfer functions could result frommultiple conformations of bionanoparticles due to capillaryforces during the droplet evaporation process and from thepresence of residual water or other volatile impurities. Thenonideal behavior of the DMA is likely not a significant factor.Stability testing shows the mobility size of the bionanoparticlesvaries little as the buffer molarity or the buffer concentrationchanges. No significant change of mobility size is observed inthe measurements for up to 4 weeks’ time. Thus, thebionanoparticles could be a promising reference material formobility size measurement.
■ AUTHOR INFORMATIONCorresponding Author*E-mail: [email protected].
Present Address†S.G.: Food and Drug Administration, Silver Spring, MD.Author ContributionsThe manuscript was written through contributions of allauthors. All authors have given approval to the final version ofthe manuscript.NotesThe authors declare no competing financial interest.
■ ACKNOWLEDGMENTSThe authors would like to thank Dr. Stan Kaufmann andProfessor Juan de la Mora for helpful discussions. Weappreciate Dr. James N. Culver (University of Maryland,College Park) for providing the TMV samples. Certaincommercial equipment, instrument or materials are identifiedin this paper to foster understanding. Such identification doesnot imply recommendation or endorsement by the NationalInstitute of Standards and Technology, nor does it imply thatthe materials or equipment identified are necessarily the bestavailable for the purpose.
■ REFERENCES(1) Stefaniak, A. B.; Hackley, V. A.; Roebben, G.; Ehara, K.; Hamkin,S.; Postek, M. T.; Lynch, I.; Fu, W.; Linsinger, T. P. J.; Thunemann, F.Nanotoxicology 2013, 7, 1325−1337.(2) Guha, S.; Li, M.; Torlov, M. J.; Zachariah, M. R. TrendsBiotechnol. 2012, 30, 291−300.(3) Knutson, E. O.; Whitby, K. T. J. Aerosol Sci. 1975, 6, 443−451.(4) Li, M.; You, R.; Mulholland, G. W.; Zachariah, M. R. Aerosol Sci.Technol. 2013, 47, 1101−1107.(5) Linsinger, T.; Roebben, G.; Solans, C.; Ramsch, R. Trends Anal.Chem. 2011, 30, 18−27.(6) Maiβer, A.; Premnath, V.; Ghosh, A.; Nguyen, T. A.; Attoui, M.;Hogan, C. J. Phys. Chem. Chem. Phys. 2011, 13, 21630−21641.(7) Ude, S.; de la Mora, J. F. J. Aerosol Sci. 2005, 36, 1224−1237.(8) Kaufman, S. L.; Skogen, J. W.; Dorman, F. D.; Zarrin, F. Anal.Chem. 1996, 68, 1895−1904.(9) Bacher, G.; Szymanski, W. W.; Kaufman, S. L.; Zollner, P.; Blaas,D.; Allmaier, G. J. Mass Spectrom. 2001, 36, 1038−1058.(10) Ku, B. K.; de la Mora, J. F. Anal. Chem. 2004, 76, 814−822.(11) Eninger, R. M.; Hogan, C. J.; Biswas, P.; Adhikari, A.; Reponen,T.; Grinshpun, S. A. Aerosol Sci. Technol. 2009, 43, 298−304.(12) Pease, L. F., III; Tsai, D.-H.; Brorson, K. A.; Guha, S.; Zachariah,M. R.; Tarlov, M. J. Anal. Chem. 2011, 83, 1753−1759.
Table 4. Mobility and Mobility Size as a Function of Dilution
1× 5× 10×
Zp (10−8 m2V−1s−1) Dp (nm) Zp (10
−8 m2V−1s−1) Dp (nm) Zp (10−8 m2V−1s−1) Dp (nm)
BSA 466.84 ± 0.97 6.79 ± 0.01 464.19 ± 1.98 6.81 ± 0.02 467.89 ± 2.03 6.86 ± 0.02IgG 258.09 ± 0.89 9.15 ± 0.02 260.52 ± 0.62 9.11 ± 0.01 261.13 ± 0.40 9.10 ± 0.01PP7 36.99 ± 0.03 24.58 ± 0.01 37.00 ± 0.06 24.57 ± 0.02 37.04 ± 0.03 24.56 ± 0.01PR772 6.42 ± 0.01 61.65 ± 0.01 6.41 ± 0.01 61.66 ± 0.03 6.43 ± 0.01 61.57 ± 0.02TMV 6.11 ± 0.01 63.30 ± 0.06 6.13 ± 0.01 63.21 ± 0.01 6.13 ± 0.01 63.19 ± 0.02
Table 5. Day to Day Variation in Measured Mobility and Mobility Size
first day one week after four weeks after
Zp (10−8 m2V−1s−1) Dp (nm) Zp (10
−8 m2V−1s−1) Dp (nm) Zp (10−8 m2V−1s−1) Dp (nm)
BSA 467.52 ± 1.00 6.78 ± 0.01 466.84 ± 0.97 6.79 ± 0.01 468.91 ± 0.21 6.77 ± 0.02IgG 259.12 ± 0.37 9.13 ± 0.01 258.09 ± 0.89 9.15 ± 0.02 257.38 ± 0.20 9.16 ± 0.01PP7 37.28 ± 0.02 24.46 ± 0.01 36.99 ± 0.03 24.58 ± 0.01 37.23 ± 0.04 24.50 ± 0.01PR772 6.41 ± 0.01 61.69 ± 0.04 6.42 ± 0.01 61.65 ± 0.01 6.40 ± 0.01 61.74 ± 0.15TMV 6.04 ± 0.05 63.71 ± 0.06 6.11 ± 0.01 63.30 ± 0.06 6.10 ± 0.01 63.34 ± 0.02
Analytical Chemistry Article
dx.doi.org/10.1021/ac403503q | Anal. Chem. 2014, 86, 6836−68426841
(13) Laschober, C.; Kaddis, C. S.; Reischl, G. P.; Loo, J. A.; Allmaier,G.; Szymanski, W. W. J. Exp. Nanosci. 2007, 2, 291−301.(14) Tsai, D.-H.; Zangmeister, R. A.; Pease, L. F., III; Tarlov, M. J.;Zachariah, M. R. Langmuir 2008, 24, 8483−8490.(15) Hinterwirth, H.; Wiedmer, S. K.; Moilanen, M.; Lehner, A.;Allmaier, G.; Waitz, T.; Lindner, W.; Lammerhofer, M. J. Sep. Sci.2013, 36, 2952−2961.(16) Allen, M. D.; Raabe, O. G. Aerosol Sci. Technol. 1985, 4, 269−286.(17) Guha, S.; Pease, L. F., III; Brorson, K. A.; Tarlov, M. J.;Zachariah, M. R. J. Virol. Methods 2011, 178, 201−208.(18) Allmaier, G.; Laschober, C.; Szymanski, W. W. J. Am. Soc. Mass.Spectrom. 2008, 19, 1062−1068.(19) Stolzenburg, M. R. An Ultrafine Aerosol Size DistibutionMeasuring System, Ph.D. Thesis, University of Minnesota Twin Cities,Minneapolis, 1988.(20) Hagwood, C.; Sivathanu, Y.; Mulholland, G. Aerosol Sci. Technol.1999, 30, 40−61.(21) Attoui, M.; Paragano, M.; Cuevas, J.; de la Mora, J. F. Aerosol Sci.Technol. 2013, 47, 499−511.(22) Hogan, C. J.; Ruotolo, B.; Robinson, C.; de la Mora, J. F. J. Phys.Chem. B 2011, 115, 3614−3621.(23) Hogan, C. J.; Kettleson, E. M.; Ramaswami, B.; Chen, D.;Biswas, P. Anal. Chem. 2006, 78, 844−852.(24) Banerjee, S.; Mazumdar, S. Int. J. Anal. Chem. 2012, 2012, 1−40.
Analytical Chemistry Article
dx.doi.org/10.1021/ac403503q | Anal. Chem. 2014, 86, 6836−68426842