Embed Size (px)
Citation preview
Brief Review
January 30, 2012 11:1 WSPC/147-MPLB S0217984911300031 1–32
Modern Physics Letters BVol. 26, No. 5 (2012) 1130003 (32 pages)c© World Scientific Publishing Company
DOI: 10.1142/S0217984911300031
BIOPHYSICAL APPLICATIONS OF SCANNING ION
CONDUCTANCE MICROSCOPY (SICM)
FRANKLIN ANARIBA∗ and JOON HYUNG ANH†
Department of Materials Science and Engineering, Nanyang Technological University,
Block N4.1, #01-30, 50 Nanyang Avenue, Singapore 639798∗[email protected]
GOO-EUN JUNG
Research & Development Center, Park Systems Corp, Suwon 443-270, Korea
NAM-JOON CHO
Department of Materials Science and Engineering, Nanyang Technological University,
Block N4.1, #01-30, 50 Nanyang Avenue, Singapore 639798
SANG-JOON CHO‡
Research & Development Center, Park Systems Corp, Suwon 443-270, Korea
Received 17 December 2011Revised 16 January 2012
Scanning probe microscopy (SPM) techniques represent one of the most promising ap-proaches to probe the physical and chemical properties of nanoscale materials. Thegrowing convergence of physics and biology has demanded nanotechnology tools to un-derstand the fundamental physics of biological systems. Despite the advantages of SPMtechniques, there have been challenges with its application to characterization of biologi-cal specimens. In recent times, the development of one class of SPM technique, scanning
ion conductance microscopy (SICM), has overcome these limitations and enabled nonin-vasive, nanoscale investigation of live cells. In this review article, we present the theorybehind the SICM operating principles and data modeling. Based on this framework,we discuss recent research advances where the SICM technique has proven technicallysuperior. SICM applications discussed herein include imaging of cell topography, moni-toring of live cell dynamics, mechanical stimulation of live cells, and surface patterning.Additional findings on the combination of SICM with other SPM techniques as well aspatch clamp electrophysiology are presented in the context of building integrated knowl-edge on the structure and function of live cells. In summary, SICM bridges physics andbiology to enable a range of important biomedical applications.
Keywords: Ion conductance microscopy, live cell, noninvasive, biophysical applications,imaging.
‡Corresponding author.
1130003-1
Mod
. Phy
s. L
ett.
B 2
012.
26. D
ownl
oade
d fr
om w
ww
.wor
ldsc
ient
ific
.com
by S
TA
NFO
RD
UN
IVE
RSI
TY
on
12/1
2/12
. For
per
sona
l use
onl
y.

January 30, 2012 11:1 WSPC/147-MPLB S0217984911300031 2–32
F. Anariba et al.
1. Introduction
1.1. Scanning probe microscopy (SPM)
Nearly three decades after the introduction of the first scanning probe microscopy
(SPM) technique called scanning tunneling microscopy (STM),1–4 and twenty-five
years since the introduction of atomic force microscopy (AFM), SPM techniques
are some of the most common and important analytical tools in the field of surface
science and materials characterization. The popularity of SPM techniques is based
on their superb high resolution, ease of implementation, and the possibility to survey
various phenomena (i.e., chemical, magnetic, capacitance, thermal, and current)
by readily interchanging appropriate probes with minor electronic adjustments. In
addition, SPM techniques have also been used for molecular engineering endeavors,
especially in bottom-up molecular assembly and surface patterning.
The fundamental principle of all SPM techniques is the use of the interaction
between a probe and the surface of a sample to map local physical properties. A map
of the sample is built by sweeping the probe across its surface, and scanning line
by line with a piezoelectric actuator or scanner. The scanner should ideally be able
to control the relative position of the probe to within the resolution limit imposed
by the interaction. During the rastering process, the probe-sample interaction is
recorded directly or, more commonly, a feedback loop keeps one parameter (i.e.,
volts) at a setpoint by varying the probe-sample distance. The voltage correction
to the distance is then used to form a topographical image of the substrate.
With a range of SPM techniques now available and widely utilized, each tech-
nique is mainly defined based on the specific phenomena being detected. For exam-
ple, scanning tunneling microscopy (STM)2 works by measuring a weak electrical
current that flows between a sample and a very sharp metal wire tip that is used
as a probe, exploiting an effect known as “tunneling,” which is a quantum mechan-
ical effect whereby electrons penetrate through an energy barrier.5 Atomic force
microscopy (AFM) is capable of individual atom resolution on both conducting
and insulating surfaces while employing a force-sensitive cantilever stylus that is
scanned in a raster pattern over the surface sample. The force interacting between
the sample surface and the tip causes minute deflections in the position of the can-
tilever, which can be detected by an optical detection system.6 Near-field scanning
optical microscope (NSOM)7 strongly relies on scanning a subwavelength aperture
on a substrate which is held at a closer distance than the wavelength of radiation.
Evanescent waves penetrate through the aperture and interact with the substrate.5
The wavelength of radiation and aperture size are critical in determining image
resolution, which in some instances can reach down to 20 nm.8 Each technique has
its own particular imaging capabilities, advantages and disadvantages related to its
application, that largely depend on the sample of interest. Table 1 presents a list of
selected SPM techniques and their measuring interactions, all of which are variants
of either STM or AFM.
1130003-2
Mod
. Phy
s. L
ett.
B 2
012.
26. D
ownl
oade
d fr
om w
ww
.wor
ldsc
ient
ific
.com
by S
TA
NFO
RD
UN
IVE
RSI
TY
on
12/1
2/12
. For
per
sona
l use
onl
y.

January 30, 2012 11:1 WSPC/147-MPLB S0217984911300031 3–32
Biophysical Applications of Scanning Ion Conductance Microscopy
Table 1. List of selected SPM techniques and their measurement properties.
SPM technique Acronym/variant Measuring interaction Remarks
Ballistic electron emissionmicroscopy9
BEEM/STM Electron current Unfeasible for imag-ing biological samples
Chemical force microscopy10 CFM/AFM Van der Waalsinteractions
Complex tippreparation
Conductive atomic forcemicroscopy11
C-AFM/AFM Current–voltagecurves
Used on conductiveand semiconductingsurfaces
Electrochemical scanningtunneling microscopy12
ECSTM/STM Redox reactions Used in electroplatingand batteries
Electrostatic force micro-scopy13
EFM/AFM Electrostatic force Sample can be im-mersed in solution
Magnetic force microscopy14 MFM/AFM Magneticinteractions
Used on magneticsamples
Photothermal microscopy15 PTM/AFM Infrared Fouriertransform
Poor image resolution
Scanning electrochemical
microscopy16SECM/AFM Electrochemical
activity
Poor image resolution
Scanning capacitancemicroscopy17
SCM/AFM Capacitance betweenprobe and sample
Requires a conduct-ing surface
Scanning ion conductancemicroscopy18
SICM/AFM Ion conductancejust above sample
Feasible for imaginglive cells in solution
1.2. Shortcomings of SPM methods in imaging biological samples
In recent times, the increasing integration of physics and biology has demanded
the introduction of tools capable of probing the physics of biological systems in
a noninvasively manner. Within the framework of real-time investigation of live
cells in solution, most SPM techniques possess intrinsic shortcomings. Scanning
tunneling microscopy confronts several challenges for imaging live cells: First, bi-
ological samples have low conductivities and, secondly, it is nontrivial to reliably
place the sample on a flat conducting surface, rendering it far from the noninvasive
method needed to image live cell processes. Finally, the quantum mechanical effect
of tunneling is well understood in a vacuum, but not under solution conditions.
In the case of the AFM, there are three traditional imaging configurations: con-
tact mode, tapping mode, and noncontact mode. In the invasive contact mode, the
sharp tip is dragged along the substrate commonly damaging soft biological tissue,
as shown by Henderson et al.19 and You et al.20 In the less intrusive tapping mode,
the tip oscillates at amplitudes above 100 nm causing the tip to intermittently
contact the sample, which can damage soft biological tissue. In the noninvasive
noncontact mode, the tip does not contact the sample and sample imaging mostly
relies on van der Waals interactions between the tip and the surface. Since the
tip is usually oscillating above its resonant frequency at amplitudes of less than
1130003-3
Mod
. Phy
s. L
ett.
B 2
012.
26. D
ownl
oade
d fr
om w
ww
.wor
ldsc
ient
ific
.com
by S
TA
NFO
RD
UN
IVE
RSI
TY
on
12/1
2/12
. For
per
sona
l use
onl
y.

January 30, 2012 11:1 WSPC/147-MPLB S0217984911300031 4–32
F. Anariba et al.
Table 2. Capabilities of several SPM techniques in characterizing living cells.
Imaging of Image Damage to
SPM technique Sample live cells resolution sample
STM Conducting No — —
AFM Conducting and insulating Yes High Yes
NSOM Conducting and insulating Yes Poor No
SICM Conducting and insulating Yes High No
1 mm
100 µm
10 µm
1 µm
100 nm
10 nm
1 nm
1
Tissue
Single Cell
Organelles
Macromolecules
Atoms
Optical
microscopyElectro-
physiology
Electron
microscopyContact/Tapping
AFMNon-Contact
AFM
SICM
Invasive Noninvasive
Fig. 1. Depiction of various SPM techniques currently used to characterize biological specimensin an invasive and noninvasive manner. The scale on the left indicates the image resolution ofthe techniques. Notice that noncontact AFM and SICM are two techniques available for the highresolution imaging of live cells.
10 nm, the tip has a tendency to “stick” to biological samples, making the imaging
process a rather difficult endeavor. In addition, for both noncontact and tapping
modes, imaging of live cells is carried out under solution conditions, which con-
volutes data interpretation due to perturbations and artifacts introduced by the
liquid environment.
As for NSOM, in general, the technique provides poor image resolution when the
sample is under solution due to shortcomings in controlling the distance between
the near-field aperture and the sample under solution conditions.8 Table 2 sum-
marizes the clear advantages of scanning ion conductance microscopy (SICM) for
characterizing live cells under physiological conditions over more widely use SPM
techniques, such as STM, AFM, and NSOM.
Figure 1 depicts various SPM techniques currently available to characterize bi-
ological specimens in an invasive and noninvasive manner. Noncontact AFM and
SICM are two analytical tools available for studying biological samples noninva-
sively. However, scanning ion conductance microscopy (SICM) is a more promising
1130003-4
Mod
. Phy
s. L
ett.
B 2
012.
26. D
ownl
oade
d fr
om w
ww
.wor
ldsc
ient
ific
.com
by S
TA
NFO
RD
UN
IVE
RSI
TY
on
12/1
2/12
. For
per
sona
l use
onl
y.

January 30, 2012 11:1 WSPC/147-MPLB S0217984911300031 5–32
Biophysical Applications of Scanning Ion Conductance Microscopy
technique than noncontact AFM, for it is capable of providing reliable, truly non-
invasive, high resolution topographical images of both soft biological samples and
live cells.
1.3. Scanning ion conductance microscopy: A promising
bioimaging technique
1.3.1. Principle and composition
Scanning ion conductance microscopy (SICM) was first developed by Hansma et al.
in 1989.18 Unlike other SPM techniques, SICM was designed specifically to probe
biological systems by providing information about the topography of soft noncon-
ducting samples, such as cell membranes under physiological conditions. The mea-
surement principle of SICM is based on monitoring changes in ion conductance
between two electrodes. Figure 2 displays a schematic view of a SICM system.
Control
System
Current
Amp.
Z
Mod.
Nano Pipette
Live Cells in the buffer
solution
Ag / AgCl electrode
Fig. 2. Schematic view of a SICM system, depicting the nanopipette, Ag/AgCl electrodes, currentamplifier, control system, and piezoelectric element (Z mod).
In general, SICM employs a glass nanopipette filled with electrolytic solution
as a probe, and the sample to be analyzed is placed in a reservoir of electrolytic
solution. There are two electrodes, one inside the nanopipette and another in the
reservoir solution. An applied bias is then introduced between the two-electrode
electrochemical cell. The nanopipette is then lowered towards the sample while the
ion conductance between an electrode inside the nanopipette and another electrode
located in the reservoir solution is observed. The position of the nanopipette tip
in relation to the surface strongly affects the observed ion conductance between
1130003-5
Mod
. Phy
s. L
ett.
B 2
012.
26. D
ownl
oade
d fr
om w
ww
.wor
ldsc
ient
ific
.com
by S
TA
NFO
RD
UN
IVE
RSI
TY
on
12/1
2/12
. For
per
sona
l use
onl
y.

January 30, 2012 11:1 WSPC/147-MPLB S0217984911300031 6–32
F. Anariba et al.
Faraday Cage
A
Over Load Indicator
Z Scanner
Hatch Clip
Pipette Holder
Pipette
XY Scanner
Petri Dish
Sample Bias
B
Fig. 3. (A) Complete SICM system including a Faraday cage. (B) Description of a scanning headfor a SICM instrument (XE-Bio from Park Systems Corp.).
the two electrodes. As the nanopipette tip is brought closer to the surface of the
sample, the space through which ions flow is minimized, causing the ionic current
between the two electrodes to decrease. Subsequently, the nanopipette is scanned
in a rastering manner across the surface while a feedback loop adjusts the vertical
position to keep the ion conductance constant by either lowering or raising the
nanopipette tip, enabling the topography of the surface to be mapped with very
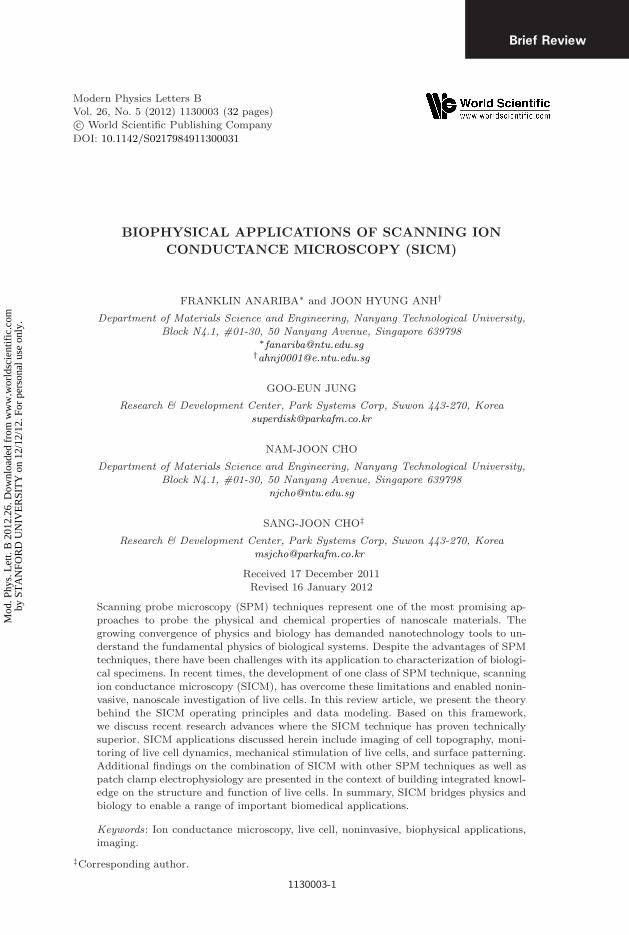
high resolution.18 Figure 3(A) shows a SICM platform containing a Faraday cage to
protect against environmental, static and electromagnetic interference. Panel (B) in
Fig. 3 depicts the various mechanical parts of a SICM instrument head, including
the Z and XY scanners, pipette, hatch clip, and pipette holder.
1.3.2. Modes of operation
There are three main scanning modes of SICM operation: Direct current (DC)
mode, alternating current (AC) mode, and hopping mode, also known as Approach-
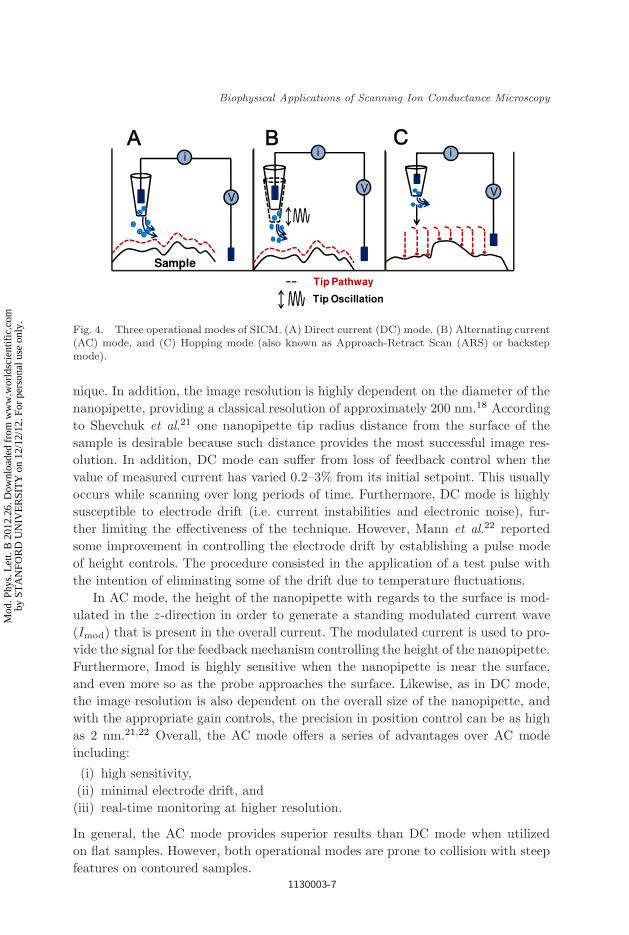
Retract Scan (ARS) and backstep mode. Figure 4 depicts the various operational
modes of SICM. Figure 4(A) depicts the DC mode while Fig. 4(B) shows a schematic
of the AC mode. Figure 4(C) illustrates the working mechanism of the hopping
mode, whereby the current drift, prevalent in DC and AC modes, is nullified, al-
lowing for the imaging of live cells in solution at high resolution over long periods
of time.
In DC mode, the nanopipette is scanned laterally over the contours of the sur-
face by maintaining the ionic current through the nanopipette tip at a constant
value through continuous adjustments of the z-axis. In DC mode, the ionic current
monitored is greater farther away from the surface, but decreases as the nanopipette
approaches the surface of the sample, greatly diminishing the sensitivity of the tech-
1130003-6
Mod
. Phy
s. L
ett.
B 2
012.
26. D
ownl
oade
d fr
om w
ww
.wor
ldsc
ient
ific
.com
by S
TA
NFO
RD
UN
IVE
RSI
TY
on
12/1
2/12
. For
per
sona
l use
onl
y.
January 30, 2012 11:1 WSPC/147-MPLB S0217984911300031 7–32
Biophysical Applications of Scanning Ion Conductance Microscopy
Tip Pathway
i
Sample
Tip Oscillation
V
i i
VV
Fig. 4. Three operational modes of SICM. (A) Direct current (DC) mode. (B) Alternating current(AC) mode, and (C) Hopping mode (also known as Approach-Retract Scan (ARS) or backstepmode).
nique. In addition, the image resolution is highly dependent on the diameter of the
nanopipette, providing a classical resolution of approximately 200 nm.18 According
to Shevchuk et al.21 one nanopipette tip radius distance from the surface of the
sample is desirable because such distance provides the most successful image res-
olution. In addition, DC mode can suffer from loss of feedback control when the
value of measured current has varied 0.2–3% from its initial setpoint. This usually
occurs while scanning over long periods of time. Furthermore, DC mode is highly
susceptible to electrode drift (i.e. current instabilities and electronic noise), fur-
ther limiting the effectiveness of the technique. However, Mann et al.22 reported
some improvement in controlling the electrode drift by establishing a pulse mode
of height controls. The procedure consisted in the application of a test pulse with
the intention of eliminating some of the drift due to temperature fluctuations.
In AC mode, the height of the nanopipette with regards to the surface is mod-
ulated in the z-direction in order to generate a standing modulated current wave
(Imod) that is present in the overall current. The modulated current is used to pro-
vide the signal for the feedback mechanism controlling the height of the nanopipette.
Furthermore, Imod is highly sensitive when the nanopipette is near the surface,
and even more so as the probe approaches the surface. Likewise, as in DC mode,
the image resolution is also dependent on the overall size of the nanopipette, and
with the appropriate gain controls, the precision in position control can be as high
as 2 nm.21,22 Overall, the AC mode offers a series of advantages over AC mode
including:
(i) high sensitivity,
(ii) minimal electrode drift, and
(iii) real-time monitoring at higher resolution.
In general, the AC mode provides superior results than DC mode when utilized
on flat samples. However, both operational modes are prone to collision with steep
features on contoured samples.1130003-7
Mod
. Phy
s. L
ett.
B 2
012.
26. D
ownl
oade
d fr
om w
ww
.wor
ldsc
ient
ific
.com
by S
TA
NFO
RD
UN
IVE
RSI
TY
on
12/1
2/12
. For
per
sona
l use
onl
y.
January 30, 2012 11:1 WSPC/147-MPLB S0217984911300031 8–32
F. Anariba et al.
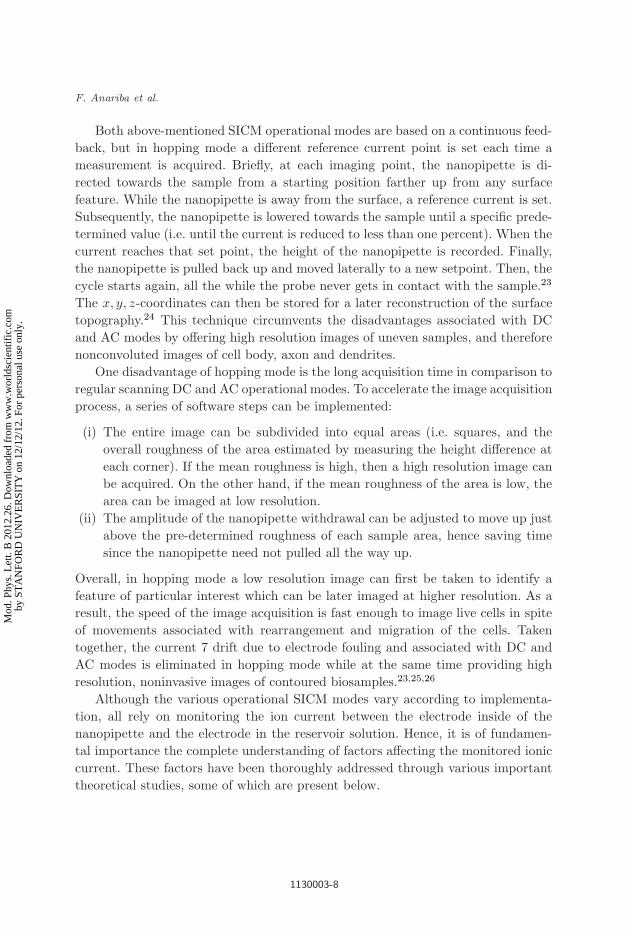
Both above-mentioned SICM operational modes are based on a continuous feed-
back, but in hopping mode a different reference current point is set each time a
measurement is acquired. Briefly, at each imaging point, the nanopipette is di-
rected towards the sample from a starting position farther up from any surface
feature. While the nanopipette is away from the surface, a reference current is set.
Subsequently, the nanopipette is lowered towards the sample until a specific prede-
termined value (i.e. until the current is reduced to less than one percent). When the
current reaches that set point, the height of the nanopipette is recorded. Finally,
the nanopipette is pulled back up and moved laterally to a new setpoint. Then, the
cycle starts again, all the while the probe never gets in contact with the sample.23
The x, y, z-coordinates can then be stored for a later reconstruction of the surface
topography.24 This technique circumvents the disadvantages associated with DC
and AC modes by offering high resolution images of uneven samples, and therefore
nonconvoluted images of cell body, axon and dendrites.
One disadvantage of hopping mode is the long acquisition time in comparison to
regular scanning DC and AC operational modes. To accelerate the image acquisition
process, a series of software steps can be implemented:
(i) The entire image can be subdivided into equal areas (i.e. squares, and the
overall roughness of the area estimated by measuring the height difference at
each corner). If the mean roughness is high, then a high resolution image can
be acquired. On the other hand, if the mean roughness of the area is low, the
area can be imaged at low resolution.
(ii) The amplitude of the nanopipette withdrawal can be adjusted to move up just
above the pre-determined roughness of each sample area, hence saving time
since the nanopipette need not pulled all the way up.
Overall, in hopping mode a low resolution image can first be taken to identify a
feature of particular interest which can be later imaged at higher resolution. As a
result, the speed of the image acquisition is fast enough to image live cells in spite
of movements associated with rearrangement and migration of the cells. Taken
together, the current 7 drift due to electrode fouling and associated with DC and
AC modes is eliminated in hopping mode while at the same time providing high
resolution, noninvasive images of contoured biosamples.23,25,26
Although the various operational SICM modes vary according to implementa-
tion, all rely on monitoring the ion current between the electrode inside of the
nanopipette and the electrode in the reservoir solution. Hence, it is of fundamen-
tal importance the complete understanding of factors affecting the monitored ionic
current. These factors have been thoroughly addressed through various important
theoretical studies, some of which are present below.
1130003-8
Mod
. Phy
s. L
ett.
B 2
012.
26. D
ownl
oade
d fr
om w
ww
.wor
ldsc
ient
ific
.com
by S
TA
NFO
RD
UN
IVE
RSI
TY
on
12/1
2/12
. For
per
sona
l use
onl
y.

January 30, 2012 11:1 WSPC/147-MPLB S0217984911300031 9–32
Biophysical Applications of Scanning Ion Conductance Microscopy
2. Theoretical Modeling of SICM
Theoretical modeling of the resistance or ionic current observed in SICM derives
from earlier semi-analytical modeling carried out in the Allen Bard group during the
introduction of the scanning electrochemical microscopy (SECM)16 and subsequent
work by Nitz and coworkers,27 in which a mathematical model is presented to
describe the relationship between observed ionic currents and tip-sample distances
when a nanopipette approaches a planar surface. In brief, the full analytical model
separates the overall resistance into three components: resistance of the nanopipette
(Rp), a distance dependent resistance (Rz), and the resistance of the electrolyte
solution outside the nanopipette radius (Rr). In general terms, the resistance of the
nanopipette is given by Eq. (1):
Rp =1
k
h
πreri, (1)
where h is the nanopipette height; k is the conductance of the electrolyte solution;
ri is the inner radius of the nanopipette opening, and re is the radius of external
electrode. The overall observed ion current as a function of tip sample distance
dependence along the z-axis can be approximated by Eq. (2):
IDC ≈ Isat
(
1 +3/2 ln(ro/ri)reri
dh
)
−1
(2)
where ro is the outer radius of the nanopipette, d is the nanopipette tip to sample
separation, and Isat is given as:
Isat =V
Rp
(3)
where V is the applied votage.27,28 Pastre et al.29 approximated the decrease of
observed ionic current in a conical shape nanopipette as a function of tip-sample
distance (z-axis):
IDC ≈ Isat
(
1 +3 ln(ro/ri)riro
3dL
)
−1
, (4)
where L is the distance between the electrode and the nanopipette opening. Close
examination of Eqs. (2) and (4) reveals differences in the approximations, most
likely the result of differences in the mathematical approach. When the SICM
instrument is operated in alternating current (AC) mode, the amplitude of the
modulated current as a function of tip-distance (z-axis) is given by Eq. (5):
IAC =
∫ T
0
IDC(d+ a sin[2πft)) sin(2πft)dt] (5)
where T is the modulation period, f is the modulation frequency, IDC is the cur-
rent due to the DC component, and a is the modulation amplitude of the AC
component.29 A plot of observed IDC and IAC versus tip-sample distance (z-axis)
reveals that the DC component decreases monotonically, while the AC component
1130003-9
Mod
. Phy
s. L
ett.
B 2
012.
26. D
ownl
oade
d fr
om w
ww
.wor
ldsc
ient
ific
.com
by S
TA
NFO
RD
UN
IVE
RSI
TY
on
12/1
2/12
. For
per
sona
l use
onl
y.

January 30, 2012 11:1 WSPC/147-MPLB S0217984911300031 10–32
F. Anariba et al.
displays a sharper decline. For instance, experimental data indicates that when the
nanopipette is 30 nm away from the surface, the slope of the AC approach curve is
three times more sensitive than that of the DC approach curve. This observation is
reasonable considering that the AC approach curve is similar to the first derivative
of the DC approach curve.29
Edwards et al.28 also presented a detailed 2D simulation when the nanopipette
is perpendicular to a planar surface using finite element modeling (FEM). The
current was calculated by integrating the flux on the boundary of the electrode, Ω:
π = 2πk
∫
Ω
r · ∇V · n , (6)
where n is the unit normal to the edge, V is the potential, and ∇V is related to
the equation given below:
∇2V =∂2V
∂r2+
1
r
∂V
∂r+
∂2V
∂z2= 0 , (7)
where r and z are the radial and axial components in the cylindrical polar coordinate
system. In order to simplify the solution, the authors made a series of assumptions:
The electrolyte conductivity, k, and the potential V are set to unity. The solution
is calculated by solving Eq. (8):
i =
∫ 2π
0
∫ γ
0
(
− β
ro2
)
kro2 sinϕdϕdθ , (8)
where γ is the semiangle of the conical section of nanopipette and ϕ < γ and both
are portions within the bounds of the nanopipette in the 2D cylindrically symmetric
simulation, and β is given below:
β =rori
ri − ro, (9)
where ri is the inner radius of the nanopipette and ro is the outer radius of the
nanopipette. Upon integration of Eq. (8), the current is given by Eq. (10):
i = 2πβ(1− cos γ) . (10)
In addition, the authors also carried out 3D simulations to study the effects of
various nanopipette geometries, including for a tip above a planar surface, a tip
near a step edge, and a tip over a cylindrical pit. The equation used to calculate
the observed ionic current is analogous to Eq. (6):
i = 2k
∫
Ω
r · ∇V · n , (11)
where Ω represents the boundary surface of the electrode. The novelty of the FED
simulations was the introduction of the nanopipette angle of approach as an im-
portant variable.
C.-C. Chen and L. Baker30 noticed that previous theoretical studies lacked com-
plementary experimental data to support the validity of the presented mathematical
1130003-10
Mod
. Phy
s. L
ett.
B 2
012.
26. D
ownl
oade
d fr
om w
ww
.wor
ldsc
ient
ific
.com
by S
TA
NFO
RD
UN
IVE
RSI
TY
on
12/1
2/12
. For
per
sona
l use
onl
y.

January 30, 2012 11:1 WSPC/147-MPLB S0217984911300031 11–32
Biophysical Applications of Scanning Ion Conductance Microscopy
models. As a result, the authors further developed the ability to quantify the mea-
surements of localized conductance, through experiments and models, by examining
ion current profiles and the effects of probe-sample distance with SICM. Specifically,
their theoretical model affords to provide additional information in relation to ion
currents in regions of nonuniformed electrolyte conductance around a nanopore in
a porous membrane by adopting a disk shape as the source of ions, instead of the
standard hemispherical geometry. The magnitude of the ion currents recorded with
SICM is given by the total resistance between the electrode inside the nanopipette
and the electrode located on the opposite side of the porous membrane. This way,
the total resistance (RT ) is the sum of nanopipette resistance (Rp), the access re-
sistance (RAC) and the membrane resistance (Rm). The nanopipette resistance is
approximated by Eq. (12):
Rp∼=
ω cot
(
θ
2
)
πri, (12)
where ω is the specific resistance of the electrolyte inside the nanopipette, θ is the
cone angle of the nanopipette tip and ri is the radius of the nanopipette tip opening.
The access resistance is represented by Eq. (13):
RAC ≈3/2 ln
(
rori
)
kπd, (13)
where ro and ri are the outer and inner radius of the nanopipette opening, k is the
electrolyte conductivity and d is the probe-sample separation. The resistance of the
membrane is described by Eq. (14):
Rm =
(
1
k′N
)(
l
πb2+
1
2b
)
, (14)
where k is the electrolyte conductivity within the pore of the membrane, l is the
membrane thickness, b is the radius of the pore opening, and N is the number of
cylindrical pores in the membrane. However, the membrane resistance is negligible
in comparison to Rp and RAC, hence RT is given by only these two terms. The
overall current magnitude is estimated by Eq. (15):
I =V
RT
=V
Rp +RAC
, (15)
where V is the applied voltage. For further considerations, such as the dependence
of RAC on the local conductivity established by the ion flux emanating for the pore,
and the validation of the mathematical modeling, the reader is referred to Ref. 30
in this review.
In another study, Rheinlaender and Schffer31 also used FEM to investigate the
image resolution and formation process, specifically the height measurements of
small particles on a planar surface, and discern particle image resolution. They de-
fined lateral resolution of SICM as the smallest distance at which two small particles
1130003-11
Mod
. Phy
s. L
ett.
B 2
012.
26. D
ownl
oade
d fr
om w
ww
.wor
ldsc
ient
ific
.com
by S
TA
NFO
RD
UN
IVE
RSI
TY
on
12/1
2/12
. For
per
sona
l use
onl
y.

January 30, 2012 11:1 WSPC/147-MPLB S0217984911300031 12–32
F. Anariba et al.
can be clearly resolved from each other in an image. Such a distance is reported to
be 3ri, or three times the inner radius of the nanopipette tip opening. In addition,
the authors also calculated that particles with a lateral width below approximately
6ri will display heights that are only a fraction of the actual magnitude, and that
for two low particles close in distance to each other the image can appear rotated
by 90. Taken together, factors affecting image resolution need to be taken into
considerations accordingly.
3. Factors Influencing Image Resolution of SICM
There are several influential factors of particular interest involved in higher res-
olution imaging that are worth mentioning. The first factor of interest is the
nanopipette size. In studies carried by Korchev et al.32 it was demonstrated through
experimental current-distance curves that nanopipettes fabricated with smaller
tip radius display higher sensitivity. In other words, employing finer nanopipettes
means surveying the surface at a closer distance, which implies higher resolution
imaging, especially when operating SICM in AC mode. For instance, a nanopipette
of a diameter smaller than 20 nm leads to an image resolution in the order of less
than 30 nm.
A second factor in determining the image resolution is the working distance
of the probe to the surface. For DC mode whereby the current drops when the
probe approaches the surface, it has been calculated that the optimum distance
corresponds to a value of 0.2ri for a nanopipette angle of approach of 3, where riis the inner radius of the nanopipette.31 The effect of the angle of the nanopipette on
the surface is another important factor determining the image resolution. Edwards
et al.28 calculated that increasing the angle over a flat surface resulted in a steeper
drop of sensitivity as the probe approached the surface. The authors calculated
probe sensitivity for angles of 3, 5, 10, and 15 and explained the results in
terms of the internal resistance of the nanopipette as a function of a large constant
resistance in series, whereby the larger the resistance of the probe, the smaller the
resistance outside the nanopipette. That is to say, it is advantageous to increase the
angle of approach of the nanopipette to reduce its resistance contribution, hence
increasing overall sensitivity of the probe close to the surface of the sample.28,31
This phenomenon is even more pronounced in AC mode.28 Finally, the effect of
increasing the ratio of the outer nanopipette radius to the inner nanopipette radius
(R = ro/ri) has a similar effect as increasing the nanopipette angle of approach to
the surface. However, the drop in observed ionic current with decreasing tip-sample
distance is a more significant factor than utilizing nanopipettes with larger R values
or increasing angle of approach of the probe.28
All of the above-mentioned factors contribute to the overall observed current. In
a more simplified version, the current observed can be explained in terms of Ohms
law, whereby the overall resistance in series is a contribution of the resistance of
the nanopipette plus the ionic resistance in the bath solution. Ohms law can then
1130003-12
Mod
. Phy
s. L
ett.
B 2
012.
26. D
ownl
oade
d fr
om w
ww
.wor
ldsc
ient
ific
.com
by S
TA
NFO
RD
UN
IVE
RSI
TY
on
12/1
2/12
. For
per
sona
l use
onl
y.

January 30, 2012 11:1 WSPC/147-MPLB S0217984911300031 13–32
Biophysical Applications of Scanning Ion Conductance Microscopy
be expressed as in Eq. (16):
l =V
Rp
+V
Rd
, (16)
where V is the applied bias, Rp is the nanopipette resistance, and Rd is the ionic
resistance along the path from the reservoir solution to the tip opening. Rd de-
pends on the distance between the probe and the sample, geometry of sample, and
electrochemical properties of the surface.33
It is important to note that live cells undergo constant cellular activity at the
cell surface, which may affect the electrolytic local concentration. This can have an
impact in the image resolution by affecting height detection. In other words, cellular
equilibrium dynamics can affect the dimensions of observed features. Happel and
Dietzel24 calculated the time required for cells to reach local equilibrium. In brief,
let us assume the conductance of the electrolytic solution is controlled by sodium
chloride, with a concentration given by Co and a diffusion coefficient in water at
room temperature of ∼ 10−9 m2/s. Next, at the interface of the sample surface
we assume an area depleted of sodium chloride given by a cube with edge length
of l = 1. Defining the coordinate x = 0 as the position of the interface between
the cube (located at x > 0) and the reservoir solution at x < 0 in one dimension,
Ficks second law describes the sodium chloride diffusion into the cube, and so the
average concentration at location x inside the cube at time t is given the following
differential equation:
C(t) =1
l
∫ l
0
c(x, t)dx , (17)
where c(x, t) is the concentration at position x at time t. To solve the equation the
authors make a series of assumptions with regard to the concentration inside and
outside the cube. At t = 0 sec, c = 0 mM inside the cube, and outside the cube
c = Co. For locations far away and t > 0, the same boundaries conditions apply,
c = 0 mM, and c = Co. The solution yields Eq. (18) shown below:
C(t) =
√Dt
π· Co
l(18)
which upon further simplification results in C(t = 0.001 sec) = Co, or about
10 msec. The authors concluded that cellular concentration changes occur about
60 times less than the time required to acquire an image using SICM, thus demon-
strating that the technique affords imaging live cells without compromising on
resolution.
4. Applications of SICM
Recently, SICM has been applied to answer fundamental questions in important
areas of cell biology. Specifically, the technique affords imaging live cells with high
resolution without causing any damage to the sample, and capturing cell activity
1130003-13
Mod
. Phy
s. L
ett.
B 2
012.
26. D
ownl
oade
d fr
om w
ww
.wor
ldsc
ient
ific
.com
by S
TA
NFO
RD
UN
IVE
RSI
TY
on
12/1
2/12
. For
per
sona
l use
onl
y.

January 30, 2012 11:1 WSPC/147-MPLB S0217984911300031 14–32
F. Anariba et al.
by monitoring membrane dynamics in real time. In addition, the probe can be
used to stimulate cell activity and capture the various cell responses. Moreover, the
nanopipette is also capable of serving as a delivery vehicle for drug administration.
All of the above-mentioned techniques are covered in some detail below.
4.1. Noninvasive topographical imaging of live cells
Further SICM applications in the noninvasive imaging of stem cells34–36 and living
cardiovascular cells36 have previously been summarized. One of the first applications
of SICM in the biological field was reported by the Yuri Korchev group. In one study,
they successfully imaged live cells of the type of murine melanocyte line melan-b
because they are small, flat and dendritic, ideal for SICM investigation in DC and
AC modes. The acquired SICM images provided a full plethora of common features
usually observed in melanocytes. These included cell alignments, nuclear areas,
cell borders with short processes, longer branching processes, nonadherent adjacent
cells, and possibly cell junctions. Furthermore, other observations consisted of cell
contact with apparent filaments, a ruffle membrane of one cell overlapping another,
and apparently processes containing specialized organelles called melanosomes.32
In a subsequent report, Korchev and coworker33 demonstrated the noninvasive
nature of SICM by acquiring a series of high resolution images of human colon
cancer cells for a period of eight hours, during which the cell remained viable.
The most important finding was that surface features on cell membranes, usually
only observed by SEM after fixation and staining, were imaged through SICM.
Figure 5 [Panels (A), (B), (D)–(F)] displays SICM real time images of a confluent
monolayer of a human colon cancer cell line (Caco-2) in a 1:1 mixture of phosphate
buffered saline and culture medium. The cell remained viable for eight hours of
continuous scanning. Panels (A) and (B) illustrate movements of the “junction”
between five cells. Panels (D) and (E) were taken at higher resolution and show
a wide range of surface morphologies, such as filamentous architectures. Panel (F)
displays numerous projections, which appear to be a developing brush border, and
panel (C) represents a scanning electron micrograph of mammary carcinoma cells
(Rama 25), which self-assemble in a monolayer, similar to human colon cancer cells.
In another example of advantages of SICM over AFM, analysis of the images in
Fig. 5(E) shows a series of filamentous structures, which under higher magnification
appeared as furrows, possibly due to the interaction between internal filaments and
cell membrane. This observation contrasted with AFM studies which had shown
that the filamentous structures were directed upward, most likely the result of tip-
induced deformation.33,37
Gorelik et al.38 imaged live Xenopus kidney epitheilial A6 cells. The authors
listed a series of important observations gained from the SICM images. First, nu-
merous nanoscale features were observed on the cells. In one instance a cell with
sparse microvilli generating ridges was spotted and, in other images, cell changes
including lateral expansions and contractions of the cell membrane and rearrange-
1130003-14
Mod
. Phy
s. L
ett.
B 2
012.
26. D
ownl
oade
d fr
om w
ww
.wor
ldsc
ient
ific
.com
by S
TA
NFO
RD
UN
IVE
RSI
TY
on
12/1
2/12
. For
per
sona
l use
onl
y.

January 30, 2012 11:1 WSPC/147-MPLB S0217984911300031 15–32
Biophysical Applications of Scanning Ion Conductance Microscopy
Fig. 5. Panels (A), (B), (D)–(F) are SICM real time images of a confluent monolayer of a humancolon cancer cell line (Caco-2). The cells remained viable and motile during the eight hours ofcontinuous scanning. Panels (A) and (B) exhibit images taken 140 min apart, and exemplifymovements of the “junction” between five cells. (C) SEM of mammary carcinoma cells (Rama
25) in culture. Arrows in Panels (B) and (C) appear to show cell boundaries. Reprinted withpermission from Ref. 33. Copyright 1997 Elsevier.
ment of the microvilli pattern were distinguished. Secondly, SICM images were
acquired while the cells were viable and motile under physiological conditions, a
clear advantage over scanning electron microscopy (SEM), which requires the cells
to be fixed for imaging. As an example, the images taken on the fixed cells were
comparable to SEM images in that both lack observable cell activity, strongly sug-
gesting the rearrangements observed in live cell images were due to cellular activity
and not a result of stimulation due to the SICM imaging process. Finally, live A6
cells grown on membrane filters were characterized for a period of 10 hours, with
each scanning taking 20 min to acquire. Significant cell changes were witnessed,
such as the reshaping of cell borders, and changes in cell volume and height.
In another contribution to the application of SICM, Shevchuk et al.39 acquired
high resolution SICM images of proteins in living cell membranes. They first calcu-
lated the resolution of the SICM instrument by imaging a monolayer of cell surface
layer proteins from Bacillus Sphaericus CCM2177 on a mica surface. Concurrent
scans of the same sample provided identical images, suggesting the protein layer was
not degraded by the nanopipette. The resolution was calculated by taking a SICM
high resolution image, computing a fast Fourier transform (FFT) on the same im-
age, and finally applying a FFT filtering process. Since discreet spots between three
and six nm rings were observed, the lateral resolution was surmised to be in the
1130003-15
Mod
. Phy
s. L
ett.
B 2
012.
26. D
ownl
oade
d fr
om w
ww
.wor
ldsc
ient
ific
.com
by S
TA
NFO
RD
UN
IVE
RSI
TY
on
12/1
2/12
. For
per
sona
l use
onl
y.
January 30, 2012 11:1 WSPC/147-MPLB S0217984911300031 16–32
F. Anariba et al.
range of 3-6 nm. This way, high resolution images of the head and anterior midpiece
of a live boar spermatozoa that had undergone a spontaneous acrosome reaction
in a buffer solution, revealed protrusions that appear as projecting particles. By
taking two images 10 min apart on the same region, stable regions were witnessed
between these two scans. Thus, the combination of high resolution imaging with
the ability to repeatedly scan the same location at close time intervals is highly
advantageous for the functional mapping of ion channels and the investigation of
other cell dynamics.
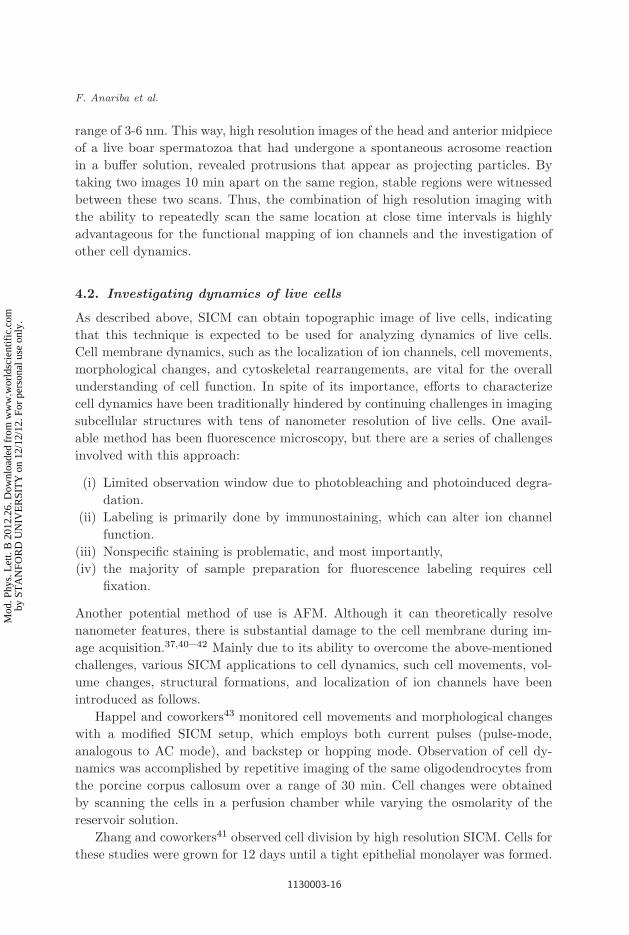
4.2. Investigating dynamics of live cells
As described above, SICM can obtain topographic image of live cells, indicating
that this technique is expected to be used for analyzing dynamics of live cells.
Cell membrane dynamics, such as the localization of ion channels, cell movements,
morphological changes, and cytoskeletal rearrangements, are vital for the overall
understanding of cell function. In spite of its importance, efforts to characterize
cell dynamics have been traditionally hindered by continuing challenges in imaging
subcellular structures with tens of nanometer resolution of live cells. One avail-
able method has been fluorescence microscopy, but there are a series of challenges
involved with this approach:
(i) Limited observation window due to photobleaching and photoinduced degra-
dation.
(ii) Labeling is primarily done by immunostaining, which can alter ion channel
function.
(iii) Nonspecific staining is problematic, and most importantly,
(iv) the majority of sample preparation for fluorescence labeling requires cell
fixation.
Another potential method of use is AFM. Although it can theoretically resolve
nanometer features, there is substantial damage to the cell membrane during im-
age acquisition.37,40–42 Mainly due to its ability to overcome the above-mentioned
challenges, various SICM applications to cell dynamics, such cell movements, vol-
ume changes, structural formations, and localization of ion channels have been
introduced as follows.
Happel and coworkers43 monitored cell movements and morphological changes
with a modified SICM setup, which employs both current pulses (pulse-mode,
analogous to AC mode), and backstep or hopping mode. Observation of cell dy-
namics was accomplished by repetitive imaging of the same oligodendrocytes from
the porcine corpus callosum over a range of 30 min. Cell changes were obtained
by scanning the cells in a perfusion chamber while varying the osmolarity of the
reservoir solution.
Zhang and coworkers41 observed cell division by high resolution SICM. Cells for
these studies were grown for 12 days until a tight epithelial monolayer was formed.
1130003-16
Mod
. Phy
s. L
ett.
B 2
012.
26. D
ownl
oade
d fr
om w
ww
.wor
ldsc
ient
ific
.com
by S
TA
NFO
RD
UN
IVE
RSI
TY
on
12/1
2/12
. For
per
sona
l use
onl
y.

January 30, 2012 11:1 WSPC/147-MPLB S0217984911300031 17–32
Biophysical Applications of Scanning Ion Conductance Microscopy
Fig. 6. Five hour time-lapse SICM observations of A6 cell division process. An A6 cell, markedby asterisk in the upper left corner Panel (0:00 hour), is undivided, but has started to show signsof cell division. Subsequent frames monitored the progress of the cell division of the asterisked cell,from 0:00 hours to 4:45 hours. Reprinted with permission from Ref. 41. Copyright 2005 NaturePublishing Group.
Time-lapse SICM images were taken for a period of five hours as shown in Fig. 6. A
series of twelve images are displayed which clearly demonstrates a cell undergoing
cytokinesis, a process whereby the cytoplasm divides through a cleavage procedure.
Moreover, during such a cell division process, cells move relative to one another
and change multicellular interactions without losing epithelial monolayer integrity.
In another study, Gorelik et al.40 studied the dynamics of microvilli formation
and retraction in live Xenopus kidney epithelial A6 cell line. These cells are ideal for
this type of investigation because they form a monolayer with numerous microvillous
structures and established tight junctions. Therefore, by employing timelapse SICM
imaging for 10 hours dynamics of microvilli were consistently recorded, and only
after the addition of formaldehyde to the reservoir solution, cell dynamics effectively
stopped. After a wide range analysis which included human colon cancer cells (Caco-
2 line), murine melanocytes (melan-b line), breast cancer cells (T47D cell line), and
fibroblasts (COS-7 cell line), the authors concluded that the dynamics of microvilli
are inherent to nonspecialized microvilli, regardless of their cell origin.
Gorelik et al.44 used SICM imaging to examine changes of the surface struc-
ture of cell membranes in cultured ventricular cardiomyocytes after the detubula-
tion with formamide. The authors confirmed the loss of T-tubule openings in the
formamide-treated cells. The cardiomyocytes displayed increasing disorganization
and loss of the T-tubule pattern as a function of time. Correspondingly, Duclohier45
reported the identification of cardiac voltage-dependent sodium channels (VDSC)
near T-tubules openings in ventricular heart cells.
1130003-17
Mod
. Phy
s. L
ett.
B 2
012.
26. D
ownl
oade
d fr
om w
ww
.wor
ldsc
ient
ific
.com
by S
TA
NFO
RD
UN
IVE
RSI
TY
on
12/1
2/12
. For
per
sona
l use
onl
y.
January 30, 2012 11:1 WSPC/147-MPLB S0217984911300031 18–32
F. Anariba et al.
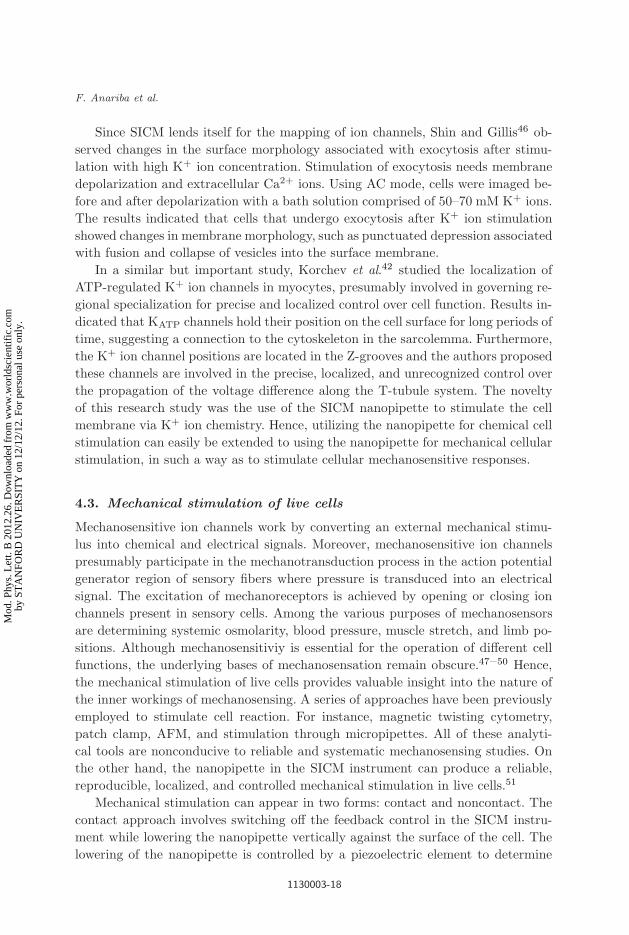
Since SICM lends itself for the mapping of ion channels, Shin and Gillis46 ob-
served changes in the surface morphology associated with exocytosis after stimu-
lation with high K+ ion concentration. Stimulation of exocytosis needs membrane
depolarization and extracellular Ca2+ ions. Using AC mode, cells were imaged be-
fore and after depolarization with a bath solution comprised of 50–70 mM K+ ions.
The results indicated that cells that undergo exocytosis after K+ ion stimulation
showed changes in membrane morphology, such as punctuated depression associated
with fusion and collapse of vesicles into the surface membrane.
In a similar but important study, Korchev et al.42 studied the localization of
ATP-regulated K+ ion channels in myocytes, presumably involved in governing re-
gional specialization for precise and localized control over cell function. Results in-
dicated that KATP channels hold their position on the cell surface for long periods of
time, suggesting a connection to the cytoskeleton in the sarcolemma. Furthermore,
the K+ ion channel positions are located in the Z-grooves and the authors proposed
these channels are involved in the precise, localized, and unrecognized control over
the propagation of the voltage difference along the T-tubule system. The novelty
of this research study was the use of the SICM nanopipette to stimulate the cell
membrane via K+ ion chemistry. Hence, utilizing the nanopipette for chemical cell
stimulation can easily be extended to using the nanopipette for mechanical cellular
stimulation, in such a way as to stimulate cellular mechanosensitive responses.
4.3. Mechanical stimulation of live cells
Mechanosensitive ion channels work by converting an external mechanical stimu-
lus into chemical and electrical signals. Moreover, mechanosensitive ion channels
presumably participate in the mechanotransduction process in the action potential
generator region of sensory fibers where pressure is transduced into an electrical
signal. The excitation of mechanoreceptors is achieved by opening or closing ion
channels present in sensory cells. Among the various purposes of mechanosensors
are determining systemic osmolarity, blood pressure, muscle stretch, and limb po-
sitions. Although mechanosensitiviy is essential for the operation of different cell
functions, the underlying bases of mechanosensation remain obscure.47–50 Hence,
the mechanical stimulation of live cells provides valuable insight into the nature of
the inner workings of mechanosensing. A series of approaches have been previously
employed to stimulate cell reaction. For instance, magnetic twisting cytometry,
patch clamp, AFM, and stimulation through micropipettes. All of these analyti-
cal tools are nonconducive to reliable and systematic mechanosensing studies. On
the other hand, the nanopipette in the SICM instrument can produce a reliable,
reproducible, localized, and controlled mechanical stimulation in live cells.51
Mechanical stimulation can appear in two forms: contact and noncontact. The
contact approach involves switching off the feedback control in the SICM instru-
ment while lowering the nanopipette vertically against the surface of the cell. The
lowering of the nanopipette is controlled by a piezoelectric element to determine
1130003-18
Mod
. Phy
s. L
ett.
B 2
012.
26. D
ownl
oade
d fr
om w
ww
.wor
ldsc
ient
ific
.com
by S
TA
NFO
RD
UN
IVE
RSI
TY
on
12/1
2/12
. For
per
sona
l use
onl
y.
January 30, 2012 11:1 WSPC/147-MPLB S0217984911300031 19–32
Biophysical Applications of Scanning Ion Conductance Microscopy
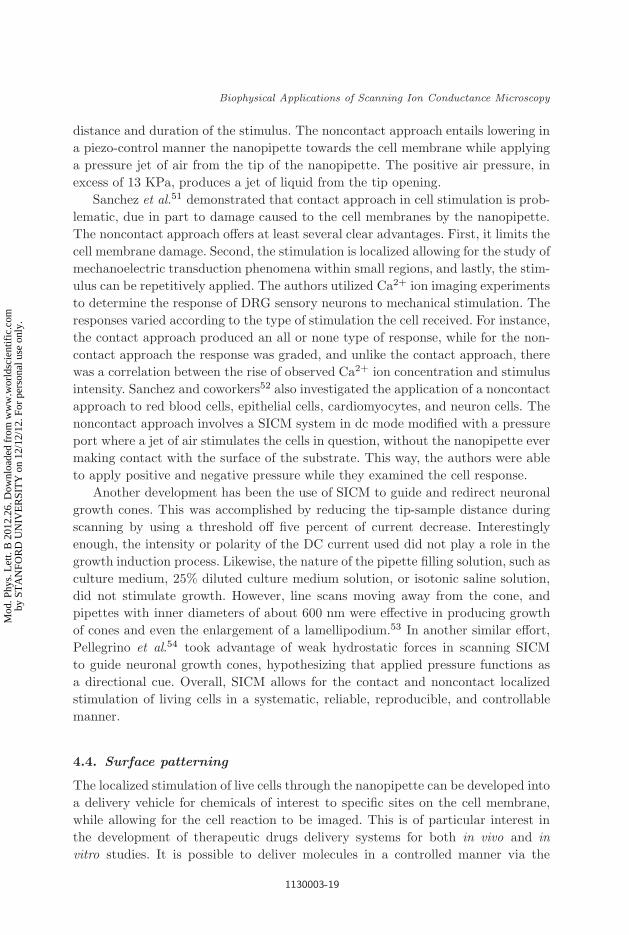
distance and duration of the stimulus. The noncontact approach entails lowering in
a piezo-control manner the nanopipette towards the cell membrane while applying
a pressure jet of air from the tip of the nanopipette. The positive air pressure, in
excess of 13 KPa, produces a jet of liquid from the tip opening.
Sanchez et al.51 demonstrated that contact approach in cell stimulation is prob-
lematic, due in part to damage caused to the cell membranes by the nanopipette.
The noncontact approach offers at least several clear advantages. First, it limits the
cell membrane damage. Second, the stimulation is localized allowing for the study of
mechanoelectric transduction phenomena within small regions, and lastly, the stim-
ulus can be repetitively applied. The authors utilized Ca2+ ion imaging experiments
to determine the response of DRG sensory neurons to mechanical stimulation. The
responses varied according to the type of stimulation the cell received. For instance,
the contact approach produced an all or none type of response, while for the non-
contact approach the response was graded, and unlike the contact approach, there
was a correlation between the rise of observed Ca2+ ion concentration and stimulus
intensity. Sanchez and coworkers52 also investigated the application of a noncontact
approach to red blood cells, epithelial cells, cardiomyocytes, and neuron cells. The
noncontact approach involves a SICM system in dc mode modified with a pressure
port where a jet of air stimulates the cells in question, without the nanopipette ever
making contact with the surface of the substrate. This way, the authors were able
to apply positive and negative pressure while they examined the cell response.
Another development has been the use of SICM to guide and redirect neuronal
growth cones. This was accomplished by reducing the tip-sample distance during
scanning by using a threshold off five percent of current decrease. Interestingly
enough, the intensity or polarity of the DC current used did not play a role in the
growth induction process. Likewise, the nature of the pipette filling solution, such as
culture medium, 25% diluted culture medium solution, or isotonic saline solution,
did not stimulate growth. However, line scans moving away from the cone, and
pipettes with inner diameters of about 600 nm were effective in producing growth
of cones and even the enlargement of a lamellipodium.53 In another similar effort,
Pellegrino et al.54 took advantage of weak hydrostatic forces in scanning SICM
to guide neuronal growth cones, hypothesizing that applied pressure functions as
a directional cue. Overall, SICM allows for the contact and noncontact localized
stimulation of living cells in a systematic, reliable, reproducible, and controllable
manner.
4.4. Surface patterning
The localized stimulation of live cells through the nanopipette can be developed into
a delivery vehicle for chemicals of interest to specific sites on the cell membrane,
while allowing for the cell reaction to be imaged. This is of particular interest in
the development of therapeutic drugs delivery systems for both in vivo and in
vitro studies. It is possible to deliver molecules in a controlled manner via the
1130003-19
Mod
. Phy
s. L
ett.
B 2
012.
26. D
ownl
oade
d fr
om w
ww
.wor
ldsc
ient
ific
.com
by S
TA
NFO
RD
UN
IVE
RSI
TY
on
12/1
2/12
. For
per
sona
l use
onl
y.

January 30, 2012 11:1 WSPC/147-MPLB S0217984911300031 20–32
F. Anariba et al.
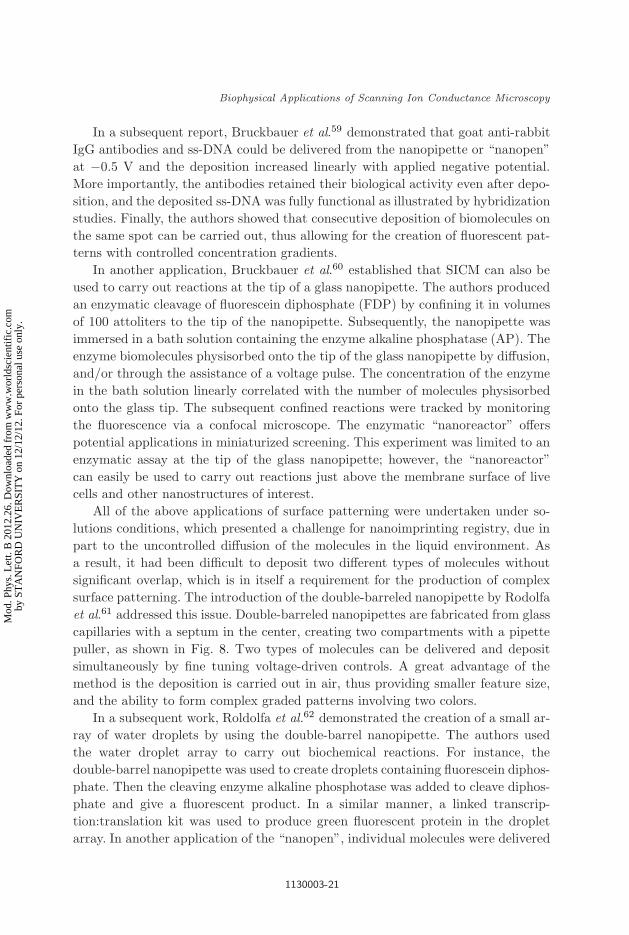
Fig. 7. (A) Fluorescence images of 25 dots of biotinylated ss-DNA deposited for 10 seconds eachonto a streptavidin-coated glass surface. (B) Line scan of the bottom row in panel (A). (C) Squaresof biotinylated ss-DNA, ranging from 4 µm to 17 µm, written one square over the other to createa pattern with rising intensities. (D) Dots of protein G on a positively charged glass surface.Reprinted with permission from Ref. 58. Copyright 2002 American Chemical Society.
nanopipette. The delivery through the tip opening is controlled by various factors
such as electro-osmotic flow, electrophoresis, and dielectrophoresis, depending on
the size, charge and polarizability of the molecules of interest. For instance, applying
a negative bias to the counter electrode relative to the nanopipette produces no
noticeable flow of DNA out of the tip orifice, but when setting a positive bias on
the same counter electrode, molecules flow out of the tip opening and this flow has
been shown to be linear with applied voltage.55–57
In this manner, Bruckbauer et al.58 were able to deliver fluorophore labeled
single-stranded DNA (ss-DNA) in a controlled manner, forming various single com-
ponent fluorescent patterns on a streptavidin-coated glass substrate. The authors
used the fluorescence of Rhodamine Green-labeled ss-DNA monitored by scanning
confocal microscopy to observe imprinted patterns caused by the deposition of the
ss-DNA on streptavadin-coated glass surfaces. The potential was kept at +0.6 V,
providing a flux of molecules in the range of 4000 molecules per second. Curiously,
protein G was deposited inside the nanopipette tip opening upon the application of
a negative potential in the counter electrode relative to the nanopipette, which is
contrary to the negative potentials used for ss-DNA deposition. Figure 7 illustrates
the various patterns formed by the voltage-controlled deposition of ss-DNA and
protein on a functionalized glass surface.
1130003-20
Mod
. Phy
s. L
ett.
B 2
012.
26. D
ownl
oade
d fr
om w
ww
.wor
ldsc
ient
ific
.com
by S
TA
NFO
RD
UN
IVE
RSI
TY
on
12/1
2/12
. For
per
sona
l use
onl
y.
January 30, 2012 11:1 WSPC/147-MPLB S0217984911300031 21–32
Biophysical Applications of Scanning Ion Conductance Microscopy
In a subsequent report, Bruckbauer et al.59 demonstrated that goat anti-rabbit
IgG antibodies and ss-DNA could be delivered from the nanopipette or “nanopen”
at −0.5 V and the deposition increased linearly with applied negative potential.
More importantly, the antibodies retained their biological activity even after depo-
sition, and the deposited ss-DNA was fully functional as illustrated by hybridization
studies. Finally, the authors showed that consecutive deposition of biomolecules on
the same spot can be carried out, thus allowing for the creation of fluorescent pat-
terns with controlled concentration gradients.
In another application, Bruckbauer et al.60 established that SICM can also be
used to carry out reactions at the tip of a glass nanopipette. The authors produced
an enzymatic cleavage of fluorescein diphosphate (FDP) by confining it in volumes
of 100 attoliters to the tip of the nanopipette. Subsequently, the nanopipette was
immersed in a bath solution containing the enzyme alkaline phosphatase (AP). The
enzyme biomolecules physisorbed onto the tip of the glass nanopipette by diffusion,
and/or through the assistance of a voltage pulse. The concentration of the enzyme
in the bath solution linearly correlated with the number of molecules physisorbed
onto the glass tip. The subsequent confined reactions were tracked by monitoring
the fluorescence via a confocal microscope. The enzymatic “nanoreactor” offers
potential applications in miniaturized screening. This experiment was limited to an
enzymatic assay at the tip of the glass nanopipette; however, the “nanoreactor”
can easily be used to carry out reactions just above the membrane surface of live
cells and other nanostructures of interest.
All of the above applications of surface patterning were undertaken under so-
lutions conditions, which presented a challenge for nanoimprinting registry, due in
part to the uncontrolled diffusion of the molecules in the liquid environment. As
a result, it had been difficult to deposit two different types of molecules without
significant overlap, which is in itself a requirement for the production of complex
surface patterning. The introduction of the double-barreled nanopipette by Rodolfa
et al.61 addressed this issue. Double-barreled nanopipettes are fabricated from glass
capillaries with a septum in the center, creating two compartments with a pipette
puller, as shown in Fig. 8. Two types of molecules can be delivered and deposit
simultaneously by fine tuning voltage-driven controls. A great advantage of the
method is the deposition is carried out in air, thus providing smaller feature size,
and the ability to form complex graded patterns involving two colors.
In a subsequent work, Roldolfa et al.62 demonstrated the creation of a small ar-
ray of water droplets by using the double-barrel nanopipette. The authors used
the water droplet array to carry out biochemical reactions. For instance, the
double-barrel nanopipette was used to create droplets containing fluorescein diphos-
phate. Then the cleaving enzyme alkaline phosphotase was added to cleave diphos-
phate and give a fluorescent product. In a similar manner, a linked transcrip-
tion:translation kit was used to produce green fluorescent protein in the droplet
array. In another application of the “nanopen”, individual molecules were delivered
1130003-21
Mod
. Phy
s. L
ett.
B 2
012.
26. D
ownl
oade
d fr
om w
ww
.wor
ldsc
ient
ific
.com
by S
TA
NFO
RD
UN
IVE
RSI
TY
on
12/1
2/12
. For
per
sona
l use
onl
y.

January 30, 2012 11:1 WSPC/147-MPLB S0217984911300031 22–32
F. Anariba et al.
A B C
Fig. 8. Graphic representation of a double-barreled nanopipette. (A) The voltage applied be-tween Ag/AgCl electrodes within the two barrels of a glass nanopipette creates a direct ion current(IDC) in a droplet. (B) When the tip is brought into contact with a surface, modulation in the z-direction creates an alternating ion current (IMOD), providing the feedback signal. (C) Approachcurve for the double-barreled nanopipette acquired over a PDMS surface. It is worth mentioningthe strong dependence of (IMOD) to distance when close to the surface. Reprinted with permissionfrom Ref. 61. Copyright 2005 John Wiley and Sons.
in a controlled manner to preselected sites on the plasma membrane of a live boar
spermatozoa cell. The authors delivered fluorophore-labeled probes which they then
monitored through single molecule fluorescence tracking, this way being able to fol-
low the diffusion of membrane glycoproteins in various cell membrane domains.63
Alternate methodologies to patterning proteins and peptides utilizing SICM can be
found in a review article by Christman et al.64
5. In Tandem Applications of SICM
As part of the SPM family of techniques, SICM uses a versatile platform which
can combine with a range of complementary techniques, including patch-clamp,
scanning confocal microscopy, scanning near infrared optical microscopy, and scan-
ning electrochemical microscopy.
5.1. Patch-clamp
Patch-clamp as a sensitive technique for the study of open ionic channels on cellu-
lar membranes was first reported by Neher and Sakmann back in 1976.65 Briefly,
patch-clamp is a technique of conductance measurements of open cellular ionic
channels. The technique works by isolating an area of a cellular membrane from
which current measurements are carried out. The isolation is possible via an extra-
cellular glass pipette, which is closely sealed against the surface of the membrane.
The ion channels in the isolated patch of membrane can be chemically stimulated
1130003-22
Mod
. Phy
s. L
ett.
B 2
012.
26. D
ownl
oade
d fr
om w
ww
.wor
ldsc
ient
ific
.com
by S
TA
NFO
RD
UN
IVE
RSI
TY
on
12/1
2/12
. For
per
sona
l use
onl
y.
January 30, 2012 11:1 WSPC/147-MPLB S0217984911300031 23–32
Biophysical Applications of Scanning Ion Conductance Microscopy
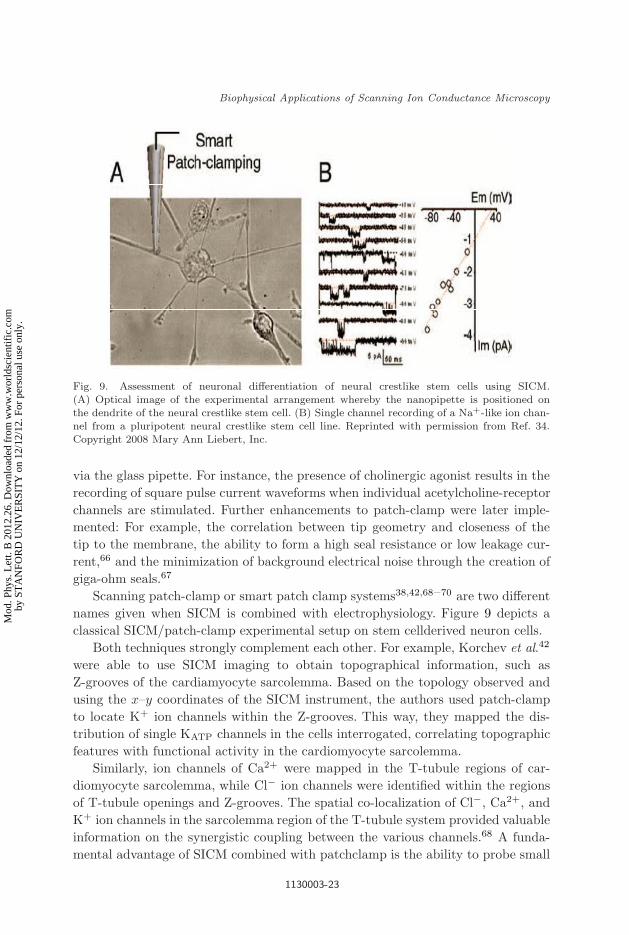
Fig. 9. Assessment of neuronal differentiation of neural crestlike stem cells using SICM.(A) Optical image of the experimental arrangement whereby the nanopipette is positioned onthe dendrite of the neural crestlike stem cell. (B) Single channel recording of a Na+-like ion chan-nel from a pluripotent neural crestlike stem cell line. Reprinted with permission from Ref. 34.Copyright 2008 Mary Ann Liebert, Inc.
via the glass pipette. For instance, the presence of cholinergic agonist results in the
recording of square pulse current waveforms when individual acetylcholine-receptor
channels are stimulated. Further enhancements to patch-clamp were later imple-
mented: For example, the correlation between tip geometry and closeness of the
tip to the membrane, the ability to form a high seal resistance or low leakage cur-
rent,66 and the minimization of background electrical noise through the creation of
giga-ohm seals.67
Scanning patch-clamp or smart patch clamp systems38,42,68–70 are two different
names given when SICM is combined with electrophysiology. Figure 9 depicts a
classical SICM/patch-clamp experimental setup on stem cellderived neuron cells.
Both techniques strongly complement each other. For example, Korchev et al.42
were able to use SICM imaging to obtain topographical information, such as
Z-grooves of the cardiamyocyte sarcolemma. Based on the topology observed and
using the x–y coordinates of the SICM instrument, the authors used patch-clamp
to locate K+ ion channels within the Z-grooves. This way, they mapped the dis-
tribution of single KATP channels in the cells interrogated, correlating topographic
features with functional activity in the cardiomyocyte sarcolemma.
Similarly, ion channels of Ca2+ were mapped in the T-tubule regions of car-
diomyocyte sarcolemma, while Cl− ion channels were identified within the regions
of T-tubule openings and Z-grooves. The spatial co-localization of Cl−, Ca2+, and
K+ ion channels in the sarcolemma region of the T-tubule system provided valuable
information on the synergistic coupling between the various channels.68 A funda-
mental advantage of SICM combined with patchclamp is the ability to probe small
1130003-23
Mod
. Phy
s. L
ett.
B 2
012.
26. D
ownl
oade
d fr
om w
ww
.wor
ldsc
ient
ific
.com
by S
TA
NFO
RD
UN
IVE
RSI
TY
on
12/1
2/12
. For
per
sona
l use
onl
y.
January 30, 2012 11:1 WSPC/147-MPLB S0217984911300031 24–32
F. Anariba et al.
cells and subcellular structures that otherwise are not possibly probed with patch-
clamp alone, partly due to the inability to observe these features under optical
microscopy: One such example are microvillous structures. Smart patch clamp can
be used to study nontransparent cell samples, including brain slice samples, hair
cells, and epithelial cultures. More importantly, the precision and feedback mecha-
nism of the SICM/patch clamp in tandem arrangement unlocks the possibility for
automated patch clamp with potential applications in drug screening.68,69 In an-
other study by Dutta et al.,70 further evidence that maxi-anion channels and ATP
release sites activities are correlated in neonatal rat cardiomyocytes are put forth.
In summary, the combination of both SICM imaging and patch-clamp is a pow-
erful in tandem configuration allowing for the correlation of cell topography with
cell activity, granting overall new insights into cell functionality.
5.2. Scanning confocal microscopy
Scanning confocal microscopy (SCM) is widely used in the biology-related fields of
science as a way to visualize or measure fluorescence from biological tissue or cells.
The combination of SICM and SCM was reported by Gorelik et al.71 and termed
scanning surface confocal microscopy (SSCM). SSCM takes advantage of the glass
nanopipette commonly used in SICM to obtain topographical information of the
surface and a laser, pinhole, and photosensor or camera to collect fluorescent images.
The relevant point worth noticing is that the laser is focused on the tip opening of
the nanopipette, thus eliminating stray light and spatially aligning topography and
fluorescence.72 The in tandem arrangement allows for the simultaneous recording
of topographic and quantitative fluorescence images of the cell membrane, all in a
single scan. Moreover, SSCM affords the imaging of live cells for both topography
and fluorescence as a function of time. The authors summarized three significant
advantages of this technique:
(i) Fluorescently-labeled particles can be directly correlated with cell structure
topography.
(ii) The measurement of quantitative fluorescence information can be accom-
plished, and
(iii) the autofluorescence usually experience in SCM is minimized, partly due to a
lower fluorescence background from the surface scan.71
Figure 10 displays a schematic of the SSCM configuration.
In another application, SSCM resolution was improved to the point of imaging
single virus particles on cell membranes, thus opening the possibility of monitoring
the entry of a virus into a cell in real time. In order to correlate topographical
features with fluorescence images, the position of fluorescence spots were mapped
and their location superimposed on the topographical image. The virus-like parti-
cles (VLPs) were observed on the cell membrane as topographical protrusions in
correspondence to fluorescence responses.73 Figure 11 compares scanning surface
1130003-24
Mod
. Phy
s. L
ett.
B 2
012.
26. D
ownl
oade
d fr
om w
ww
.wor
ldsc
ient
ific
.com
by S
TA
NFO
RD
UN
IVE
RSI
TY
on
12/1
2/12
. For
per
sona
l use
onl
y.

January 30, 2012 11:1 WSPC/147-MPLB S0217984911300031 25–32
Biophysical Applications of Scanning Ion Conductance Microscopy
Fig. 10. (A) Schematic diagram of simultaneous SICM and laser confocal microscopy. (B) Di-agram for SSCM on a contracting cardiac myocyte. When the cardiac myocyte contracts thefeedback control moves the sample stage to maintain a constant distance between the nanopipetteand the cell surface. The confocal volume probed, therefore, remains at the same point below thecell surface. Reprinted from permission from Refs. 21 and 73. Copyright 2008 Elsevier.
confocal microscopy and conventional confocal microscopy. Note that SSCM has
the advantage of correlating topographical information with fluorescence imaging.
Shevchuk and coworkers72 carried out studies of both fixed and live cells using
SSCM. Of particular relevance was their conclusion that endocytotic pits on COS-7
cells were resolved topographically for the first time, and that 89% of the detected
pits were chathrin-coated. One drawback was their SSCM scan rate was not fast
enough to elucidate endocytotic pits in live cells.
5.3. Near-field scanning optical microscopy
Near-field scanning optical microscopy (NSOM) is sometimes called near-infrared
scanning optical microscopy. In NSOM, a near-field light source with an output
aperture probe of dimensions smaller than the source wavelength is scanned above
the sample surface. In order to achieve high resolution images, the probe must be
held in the near-field regime of the surface, at a distance much smaller than the
wavelength of radiation. However, for the imaging of biological samples in liquids,
it is still difficult to reliably control the sample-probe distance, one of its principal
challenges for imaging biological samples. Korchev et al.74 built a combined NSOM-
SICM setup in order to take advantage of the latters probe-sample control mecha-
nism. This combined setup enabled dual imaging of live cardiomyocytes, where Z
lines and Z-grooves were clearly discernable. In addition, the authors suggest that
1130003-25
Mod
. Phy
s. L
ett.
B 2
012.
26. D
ownl
oade
d fr
om w
ww
.wor
ldsc
ient
ific
.com
by S
TA
NFO
RD
UN
IVE
RSI
TY
on
12/1
2/12
. For
per
sona
l use
onl
y.

January 30, 2012 11:1 WSPC/147-MPLB S0217984911300031 26–32
F. Anariba et al.
Fig. 11. Surface confocal and conventional confocal microscopy comparison. (A) SSCM configura-tion, whereby the dotted line indicates the position of the optical image of the cell surface acquiredin a single scan. (B) Overlay of simultaneously acquired topographic and fluorescence images.(C) A conventional scanning confocal microscope configuration whereby the dotted lines repre-sent the multiple optical cross-sections needed to generate an image. (D) Image generated by theaddition of eight cross sections of the same sample as shown in panel (B). (E) Image generated bya single cross section scan of the same sample as shown in panel (B). Reprinted with persmissionfrom Ref. 71. Copyright 2002 The National Academy of Sciences.
the decrease in light intensity which occurs when using a smaller nanopipette for
higher resolution scans can be compensated by a higher numerical aperture ob-
jective and an improved photon counting setup. In a related study, Shevchuk and
coworkers21 used SICM in AC mode, coupled with NSOM, to acquire simultaneous
images of cardiomyocytes. However, in this case, the Z-grooves were clearly visible
on both images, but the NSOM image resolution was only modest, suggesting that
the design of the combined setup is important for optimizing imaging capabilities.
In another combined SICM-NSOM study, Mannelquist et al.75 utilized the
higher image resolution capabilities of this setup to correlate topographical and
fluorescence information of polystyrene beads adsorbed on a glass surface under
liquid conditions. Given the precise control of NSOM probe-sample distance offered
by this method, the authors also identified that NSOM provides higher resolution
images than SICM, since the maximum laser power used under solution conditions
is no longer limited to < 10 mW, as is the case under ambient conditions. Further
refinements enable a direct correlation of the SICM and NSOM images, and SICM
showed higher resolving power of the surface features of the observed closely-packed
micron-scale beads.76
1130003-26
Mod
. Phy
s. L
ett.
B 2
012.
26. D
ownl
oade
d fr
om w
ww
.wor
ldsc
ient
ific
.com
by S
TA
NFO
RD
UN
IVE
RSI
TY
on
12/1
2/12
. For
per
sona
l use
onl
y.

January 30, 2012 11:1 WSPC/147-MPLB S0217984911300031 27–32
Biophysical Applications of Scanning Ion Conductance Microscopy
Rothery et al.77 also assembled a hybrid SICM-NSOM instrument and imaged
for the first time fixed urchin sperm flagella and calculated resolutions on the order
of 220 and 190 nm for SICM and NSOM, respectively. Subsequent imaging of live
A6 cells displayed a good correlation between topographical and optical data. It
is worthwhile to mention that the images were acquired under physiological con-
ditions, whereby the advantage of using a hybridized version of SICM-NSOM was
strongly demonstrated.
5.4. Scanning electrochemical microscopy (SECM)
SECM is a valuable technique for surveying the chemical reactivity of material
surfaces at microscopic scales by placing an ultramicroelectrode (UME) just above
the surface of interest. The technique functions by immersing the sample and UME
in an electroactive solution. When the UME is biased, a current is generated. As
the UME approaches the surface, the current generated at the tip of the UME
changes based on the redox activity of the surface, hence mapping the redox activ-
ity of the substrate. Generally, an amperometric mode of detection is used,78 but
later refinements have included a potentiometric detection system.79 Another re-
cent development has been the fabrication of borosilicate micropipettes containing
a gold ring electrode with the added advantage of determining the position of the
tip relative to the sample with nanometer accuracy.80
Takahashi and coworkers81 fabricated and characterized a similar probe to that
of Comstock et al.82 (gold ring UME) to acquire simultaneous images by SECM
and SICM. With this combined setup, they were also able to image deposits of
Horse Radish Peroxidase enzyme that were immobilized on a glass substrate. Addi-
tionally, using the hybridized apparatus in hopping mode, they obtain topograph-
ical and electrochemical information on superior cervical ganglion, A6 live cells,
and cardiomiocytes, where varicosities, veins responsible for the neuron transduc-
tion and axon formation, were clearly visualized. Furthermore, by monitoring the
Faradaic current for O2, (K4[Fe(CN)6]), and FcCH2OH on cardiomyocytes, they
demonstrated for the first time the simultaneous characterization of the localized
permeation property of a live cell membrane.
6. Outlook
In recent years, the SICM technique has become an increasingly versatile tool in
the biological sciences, addressing a number of important questions at the level
of the cellular membrane. Indeed, the membrane interface supports a wide range
of biological processes including selective transport, cellular recognition, cytoskele-
ton anchorage, cellcell junctions, and signal transduction pathways, in addition to
serving as a protective barrier and separating the biochemical activities of different
cellular compartments. With the capability to study these structures and functions
in a non-contact, liquid format with nanoscale resolution, there are many oppor-
1130003-27
Mod
. Phy
s. L
ett.
B 2
012.
26. D
ownl
oade
d fr
om w
ww
.wor
ldsc
ient
ific
.com
by S
TA
NFO
RD
UN
IVE
RSI
TY
on
12/1
2/12
. For
per
sona
l use
onl
y.

January 30, 2012 11:1 WSPC/147-MPLB S0217984911300031 28–32
F. Anariba et al.
tunities for the SICM technique to improve upon current measurement capabilities
in the biomedical sciences.
Among the possibilities, there is great potential for characterizing the microvilli
of cell surfaces, which are important for absorption, secretion, and mechanotrans-
duction. In Fig. 12, time-lapse SICM imaging of COS-1 monkey kidney cells fol-
lowed the dynamics of microvilli, establishing a platform upon which the pathology
of diseases involving microvilli can be explored. Moreover, the increased presence
of microvilli on the cell surface is a hallmark feature of many types of transformed
cancer cells versus normal cells.83–85
SICM imaging is able to detect the formation of microvilli from ciliary mem-
branes of hepatic cancer cells, as shown in Fig. 13. Unlike the AFM technique for
which imaging of soft micro-projections is very difficult, SICM is uniquely able to
follow the formation of these structures on live cell surfaces and may therefore play
an important role in understanding cancer pathogeneses.
Another area where the SICM technique can improve functional analysis is the
assessment of drug activity in live cells. The SICM pipette enables the controlled
delivery of drugs to a single cell. Based on this capability, the effects of drug ad-
ministration can be monitored by characterizing the changes in morphology and
membrane structure which occur in the primary cell as well as nearby cells. These
studies could enable early in vitro analysis of drug toxicity, mechanisms of action,
A
B C D E
Fig. 12. SICM images of live COS-1 Monkey Kidney cells. Panel (A) is a 20 × 20 µm image ofKidney cells. Panel (B) is a 10 × 10 µm inset of panel (A). Panels (B)–(E) are 10 × 10 µm imagesthat illustrate cell dynamics. The arrows in panel (B) indicate the dynamics of microvilli on liveCOS-1 cells for a period of four hours.
1130003-28
Mod
. Phy
s. L
ett.
B 2
012.
26. D
ownl
oade
d fr
om w
ww
.wor
ldsc
ient
ific
.com
by S
TA
NFO
RD
UN
IVE
RSI
TY
on
12/1
2/12
. For
per
sona
l use
onl
y.

January 30, 2012 11:1 WSPC/147-MPLB S0217984911300031 29–32
Biophysical Applications of Scanning Ion Conductance Microscopy
A
B
C
20 × 20 µm
5 × 5 µm
5 × 5 µm
Fig. 13. (A) 20 × 20 µm SICM image of microvilli formation from ciliary membrane on surfaceof hepatic cancer cell under physiological conditions. (B) Depiction of 5 × 5 µm inset of panel (A)that clearly shows microvilli formation. (C) Three-dimensional image of panel (B).
and efficacy in order to reduce the time and resources required for clinical drug
development.
Taken together, there are many important applications in the biomedical sci-
ences where a balance between imaging resolution, method of sample preparation,
and measurement principle must be achieved in order to functionally probe the
membrane interfaces of live cells. The imaging capabilities of the SICM lend the
technique significant potential to achieve this balance, and reveal physiologically
relevant insights for clinical diagnosis, molecular toxicology, and pharmaceutical
drug development.
To date, there has not been a widely available SICM instrument, thereby limiting
the number of potential users as well as making it difficult to directly compare
results obtained on different instruments. With the recent development of the XE-
Bio model by Park Systems Corp., which combines AFM, SICM, and inverted
optical microscopy, there is now the opportunity for a wider range of users to
take advantage of the SICMs measurement capabilities, to establish a standardized
framework for sample imaging and analysis, and for confirming findings within the
field. In doing so, we can move beyond technology development, and towards the
identification of new applications in the biomedical sciences where the SICM can
answer questions intractable to current methods, and bridge the gap between the
basic and clinical sciences.
Acknowledgments
We thank Tatsuo Ushiki for reading this manuscript and for his valuable com-
ments and suggestions. We gratefully acknowledge funding support from the
National Research Foundation (NRF — NRFF2011-01), and from the Industrial
1130003-29
Mod
. Phy
s. L
ett.
B 2
012.
26. D
ownl
oade
d fr
om w
ww
.wor
ldsc
ient
ific
.com
by S
TA
NFO
RD
UN
IVE
RSI
TY
on
12/1
2/12
. For
per
sona
l use
onl
y.

January 30, 2012 11:1 WSPC/147-MPLB S0217984911300031 30–32
F. Anariba et al.
Source Technology Development Programs (ISTDP10033633) in the Ministry of
Knowledge Economy in Korea.
References
1. G. Binnig, H. Rohrer, C. Gerber and E. Weibel, Appl. Phys. Lett. 40 (1982) 178.2. G. Binning, H. Rohrer, C. Gerber and E. Weibel, Phys. Rev. Lett. 49 (1982) 57.3. G. Binnig, H. Rohrer, C. Gerber and E. Weibel, Physica B & C 109 (1982) 2075.4. G. Binnig, H. Rohrer, C. Gerber and E. Weibel, Phys. Rev. Lett. 50 (1983) 120.5. K. D. Jandt, Mater. Sci. Eng. R 21 (1998) 221.6. F. Anariba, Fabrication and Electrical Characterization of Molecular Junctions: A
Robust Platform for Electron Transport Studies in Molecular Electronics (VDM Ver-lag, 2010).
7. A. Lewis, M. Isaacson, A. Harootunian and A. Muray, Ultramicroscopy 13 (1984) 227.8. M. Edidin, Traffic 2 (2001) 797.9. W. J. Kaiser and L. D. Bell, Phys. Rev. Lett. 60 (1988) 1406.
10. C. D. Frisbie, L. F. Rozsnyai, A. Noy, M. S. Wrighton and C. M. Lieber, Science 265
(1994) 2071.11. L. Zhang, T. Sakai, N. Sakuma, T. Ono and K. Nakayama, Appl. Phys. Lett. 75 (1999)
3527.12. S. R. Higgins and R. J. Hamers, J. Vac. Sci. Technol. B 14 (1996) 1360.13. J. M. R. Weaver and D. W. Abraham, J. Vac. Sci. Technol. B 9 (1991) 1559.14. U. Hartmann, J. Appl. Phys. 64 (1988) 1561.15. A. M. Mansanares, T. Velinov, Z. Bozoki, D. Fournier and A. C. Boccara, J. Appl.
Phys. 75 (1994) 3344.16. A. J. Bard, F. R. F. Fan, J. Kwak and O. Lev, Anal. Chem. 61 (1989) 132.17. J. R. Matey and J. Blanc, J. Appl. Phys. 57 (1985) 1437.18. P. K. Hansma, B. Drake, O. Marti, S. A. Gould and C. B. Prater, Science 243 (1989)
641.19. E. Henderson, P. G. Haydon and D. S. Sakaguchi, Science 257 (1992) 1944.20. H. X. You, J. M. Lau, S. Zhang and L. Yu, Ultramicroscopy 82 (2000) 297.21. A. I. Shevchuk, J. Gorelik, S. E. Harding, M. J. Lab, D. Klenerman and Y. E. Korchev,
Biophys. J. 81 (2001) 1759.22. S. A. Mann, G. Hoffmann, A. Hengstenberg, W. Schuhmann and I. D. Dietzel,
J. Neurosci. Methods 116 (2002) 113.23. P. Novak, C. Li, A. I. Shevchuk, R. Stepanyan, M. Caldwell, S. Hughes, T. G. Smart,
J. Gorelik, V. P. Ostanin, M. J. Lab, G. W. Moss, G. I. Frolenkov, D. Klenerman andY. E. Korchev, Nat. Methods 6 (2009) 279.
24. P. Happel and I. D. Dietzel, J. Nanobiotechnol. 7 (2009) 7.25. Y. Takahashi, Y. Murakami, K. Nagamine, H. Shiku, S. Aoyagi, T. Yasukawa,
M. Kanzaki and T. Matsue, Phys. Chem. Chem. Phys. 12 (2010) 10012.26. P. Happel, F. Wehner and I. D. Dietzel, in Modern Research and Educational Topics
in Miscroscopy, eds. A. Mendez-Vilas and J. Diaz, Vol. 2 (Formatex, 2007), p. 968.27. H. Nitz, J. Kamp and H. Fuchs, Probe Microsc. 1 (1998) 187.28. M. A. Edwards, C. G. Williams, A. L. Whitworth and P. R. Unwin, Anal. Chem. 81
(2009) 4482.29. D. Pastre, H. Iwamoto, J. Liu, G. Szabo and Z. Shao, Ultramicroscopy 90 (2001) 13.30. C. C. Chen and L. A. Baker, Analyst 136 (2011) 90.31. J. Rheinlaender and T. E. Schaffer, J. Appl. Phys. 105 (2009) 094905.
1130003-30
Mod
. Phy
s. L
ett.
B 2
012.
26. D
ownl
oade
d fr
om w
ww
.wor
ldsc
ient
ific
.com
by S
TA
NFO
RD
UN
IVE
RSI
TY
on
12/1
2/12
. For
per
sona
l use
onl
y.
January 30, 2012 11:1 WSPC/147-MPLB S0217984911300031 31–32
Biophysical Applications of Scanning Ion Conductance Microscopy
32. Y. E. Korchev, M. Milovanovic, C. L. Bashford, D. C. Bennett, E. V. Sviderskaya,I. Vodyanoy and M. J. Lab, J. Microsc. 188 (1997) 17.
33. Y. E. Korchev, C. L. Bashford, M. Milovanovic, I. Vodyanoy and M. J. Lab, Biophys.J. 73 (1997) 653.
34. J. Gorelik, N. N. Ali, S. H. Sheikh Abdul Kadir, M. Lab, P. Stojkovic, L. Armstrong,E. V. Sviderskaya, Y. A. Negulyaev, D. Klenerman, D. C. Bennett, M. Lako, S. E.Harding, M. Stojkovic and Y. E. Korchev, Tissue Eng: Part C Methods 14 (2008)311.
35. S. E. Harding, N. N. Ali, M. Brito-Martins and J. Gorelik, Pharmacology & Thera-
peutics 113 (2007) 341.36. M. Miragoli, A. Moshkov, P. Novak, A. Shevchuk, V. O. Nikolaev, I. El-Hamamsy,
C. M. Potter, P. Wright, S. H. Kadir, A. R. Lyon, J. A. Mitchell, A. H. Chester,D. Klenerman, M. J. Lab, Y. E. Korchev, S. E. Harding and J. Gorelik, J. R. Soc.Interface 8 (2011) 913.
37. J. Rheinlaender, N. A. Geisse, R. Proksch and T. E. Schaffer, Langmuir 27 (2011)697.
38. J. Gorelik, Y. Zhang, A. I. Shevchuk, G. I. Frolenkov, D. Sanchez, M. J. Lab,I. Vodyanoy, C. R. Edwards, D. Klenerman and Y. E. Korchev, Mol. Cell Endocrinol.
217 (2004) 101.39. A. I. Shevchuk, G. I. Frolenkov, D. Sanchez, P. S. James, N. Freedman, M. J. Lab,
R. Jones, D. Klenerman and Y. E. Korchev, Angew. Chem. Int. Ed. Engl. 45 (2006)2212.
40. J. Gorelik, A. I. Shevchuk, G. I. Frolenkov, I. A. Diakonov, M. J. Lab, C. J. Kros,G. P. Richardson, I. Vodyanoy, C. R. Edwards, D. Klenerman and Y. E. Korchev,Proc. Natl. Acad. Sci. 100 (2003) 5819.
41. Y. Zhang, J. Gorelik, D. Sanchez, A. Shevchuk, M. Lab, I. Vodyanoy, D. Klenerman,C. Edwards and Y. Korchev, Kidney Int. 68 (2005) 1071.
42. Y. E. Korchev, Y. A. Negulyaev, C. R. Edwards, I. Vodyanoy and M. J. Lab, Nat.
Cell Biol. 2 (2000) 616.43. P. Happel, G. Hoffmann, S. A. Mann and I. D. Dietzel, J. Microsc. 212 (2003) 144.44. J. Gorelik, L. Q. Yang, Y. Zhang, M. Lab, Y. Korchev and S. E. Harding, Cardiovasc.
Res. 72 (2006) 422.45. H. Duclohier, Biochem. Biophys. Res. Commun. 334 (2005) 1135.46. W. Shin and K. D. Gillis, Biophys. J. 91 (2006) L63.47. C. Kung, Nature 436 (2005) 647.48. H. Cho, J. Shin, C. Y. Shin, S.-Y. Lee and U. Oh, J. Neurosci. 22 (2002) 1238.49. X. Su, R. E. Wachtel and G. F. Gebhart, J. Neurophysiol. 84 (2000) 836.50. A. Ghazi, C. Berrier, B. Ajouz and M. Besnard, Biochimie 80 (1998) 357.51. D. Sanchez, U. Anand, J. Gorelik, C. D. Benham, C. Bountra, M. Lab, D. Klenerman,
R. Birch, P. Anand and Y. Korchev, J. Neurosci. Methods 159 (2007) 26.52. D. Sanchez, N. Johnson, C. Li, P. Novak, J. Rheinlaender, Y. Zhang, U. Anand,
P. Anand, J. Gorelik, G. I. Frolenkov, C. Benham, M. Lab, V. P. Ostanin, T. E.Schaffer, D. Klenerman and Y. E. Korchev, Biophys. J. 95 (2008) 3017.
53. M. Pellegrino, P. Orsini and F. De Gregorio, Neurosci. Res. 64 (2009) 290.54. M. Pellegrino, P. Orsini, M. Pellegrini, P. Baschieri, F. Dinelli, D. Petracchi,
E. Tognoni and C. Ascoli, Neurosci. Res. 69 (2011) 234.55. L. Ying, A. Bruckbauer, A. M. Rothery, Y. E. Korchev and D. Klenerman, Anal.
Chem. 74 (2002) 1380.56. L. Ying, S. S. White, A. Bruckbauer, L. Meadows, Y. E. Korchev and D. Klenerman,
Biophys. J. 86 (2004) 1018.
1130003-31
Mod
. Phy
s. L
ett.
B 2
012.
26. D
ownl
oade
d fr
om w
ww
.wor
ldsc
ient
ific
.com
by S
TA
NFO
RD
UN
IVE
RSI
TY
on
12/1
2/12
. For
per
sona
l use
onl
y.

January 30, 2012 11:1 WSPC/147-MPLB S0217984911300031 32–32
F. Anariba et al.
57. L. Ying, A. Bruckbauer, D. Zhou, J. Gorelik, A. Shevchuk, M. Lab, Y. Korchev andD. Klenerman, Phys. Chem. Chem. Phys. 7 (2005) 2859.
58. A. Bruckbauer, L. Ying, A. M. Rothery, D. Zhou, A. I. Shevchuk, C. Abell, Y. E.Korchev and D. Klenerman, J. Am. Chem. Soc. 124 (2002) 8810.
59. A. Bruckbauer, D. Zhou, L. Ying, Y. E. Korchev, C. Abell and D. Klenerman, J. Am.
Chem. Soc. 125 (2003) 9834.60. A. Bruckbauer, D. J. Zhou, L. M. Ying, C. Abell and D. Klenerman, Nano Lett. 4
(2004) 1859.61. K. T. Rodolfa, A. Bruckbauer, D. Zhou, Y. E. Korchev and D. Klenerman, Angew.
Chem. Int. Ed. Engl. 44 (2005) 6854.62. K. T. Rodolfa, A. Bruckbauer, D. Zhou, A. I. Schevchuk, Y. E. Korchev and
D. Klenerman, Nano Lett. 6 (2006) 252.63. A. Bruckbauer, P. James, D. Zhou, J. W. Yoon, D. Excell, Y. Korchev, R. Jones and
D. Klenerman, Biophys. J. 93 (2007) 3120.64. K. L. Christman, V. D. Enriquez-Rios and H. D. Maynard, Soft Matter 2 (2006) 928.65. E. Neher and B. Sakmann, Nature 260 (1976) 799.66. E. Neher, B. Sakmann and J. H. Steinbach, Pflugers Arch. 375 (1978) 219.67. O. P. Hamill, A. Marty, E. Neher, B. Sakmann and F. J. Sigworth, Pflugers Arch.
391 (1981) 85.68. Y. Gu, J. Gorelik, H. A. Spohr, A. Shevchuk, M. J. Lab, S. E. Harding, I. Vodyanoy,
D. Klenerman and Y. E. Korchev, FASEB J. 16 (2002) 748.69. J. Gorelik, Y. Gu, H. A. Spohr, A. I. Shevchuk, M. J. Lab, S. E. Harding, C. R.
Edwards, M. Whitaker, G. W. Moss, D. C. Benton, D. Sanchez, A. Darszon,I. Vodyanoy, D. Klenerman and Y. E. Korchev, Biophys. J. 83 (2002) 3296.
70. A. K. Dutta, Y. E. Korchev, A. I. Shevchuk, S. Hayashi, Y. Okada and R. Z. Sabirov,Biophys. J. 94 (2008) 1646.
71. J. Gorelik, A. Shevchuk, M. Ramalho, M. Elliott, C. Lei, C. F. Higgins, M. J. Lab,D. Klenerman, N. Krauzewicz and Y. Korchev, Proc. Natl. Acad. Sci. 99 (2002) 16018.
72. A. I. Shevchuk, P. Hobson, M. J. Lab, D. Klenerman, N. Krauzewicz and Y. E.Korchev, Pflugers Arch. 456 (2008) 227.
73. A. I. Shevchuk, P. Hobson, M. J. Lab, D. Klenerman, N. Krauzewicz and Y. E.Korchev, Biophys. J. 94 (2008) 4089.
74. Y. E. Korchev, M. Raval, M. J. Lab, J. Gorelik, C. R. Edwards, T. Rayment andD. Klenerman, Biophys. J. 78 (2000) 2675.
75. A. Mannelquist, H. Iwamoto, G. Szabo and Z. F. Shao, Appl. Phys. Lett. 78 (2001)2076.
76. A. Mannelquist, H. Iwamoto, G. Szabo and Z. Shao, J. Microsc. 205 (2002) 53.77. A. M. Rothery, J. Gorelik, A. Bruckbauer, W. Yu, Y. E. Korchev and D. Klenerman,
J. Microsc. 209 (2003) 94.78. A. J. Bard, F. R. Fan, D. T. Pierce, P. R. Unwin, D. O. Wipf and F. Zhou, Science
254 (1991) 68.79. C. Wei, A. J. Bard, G. Nagy and K. Toth, Anal. Chem. 67 (1995) 1346.80. D. A. Walsh, J. L. Fernandez, J. Mauzeroll and A. J. Bard, Anal. Chem. 77 (2005)
5182.81. Y. Takahashi, A. I. Shevchuk, P. Novak, Y. Murakami, H. Shiku, Y. E. Korchev and
T. Matsue, J. Am. Chem. Soc. 132 (2010) 10118.82. D. J. Comstock, J. W. Elam, M. J. Pellin and M. C. Hersam, Anal. Chem. 82 (2010)
1270.83. G. B. Kolata, Science 188 (1975) 819.84. K. R. Porter, G. J. Todaro and V. Fonte, J. Cell Biol. 59 (1973) 633.85. M. C. Willingham and I. Pastan, Proc. Natl. Acad. Sci. 72 (1975) 1263.
1130003-32
Mod
. Phy
s. L
ett.
B 2
012.
26. D
ownl
oade
d fr
om w
ww
.wor
ldsc
ient
ific
.com
by S
TA
NFO
RD
UN
IVE
RSI
TY
on
12/1
2/12
. For
per
sona
l use
onl
y.