Embed Size (px)
Citation preview

Biophysics of Immunology
Complementary Chapter to Sackmann/Merkel ’Lehrbuch der Biophysik’
Copyright Erich Sackmann, Physics Department Technical University Munich.
The text can be freely downloaded via the website www.biophy.de.
1

39.1 Introduction/Synopsis
In the ’Lehrbuch für Biophysik’ (in particular in the chapter ’Kapitel 9’) on cell adhesion
we have occasionally considered examples of immune reactions to demonstrate how complex
biological processes are controlled by the physics of the composite cell envelope. To limit
the text we did not go into details. In the present complementary chapter we concentrate
on an early immunological process: the stimulation of naive T-cells by a specific class of
infected, antigen exposing cells, such as dendritic cells (DC) and macrophages, called antigen
presenting cells (APC). As described in ’Kapitel 13’, the stimulation is assumed to be triggered
by adhesion-induced domains called ’immunological synapses’ [Dustin]. In this supplementary
chapter we describe a model which can explain the stimulation of clone formation by naive
T-cells through step-wise switching through the cell cycle. In the second part starting at Ch. 39.3
we extend the model to describe the mechanical stabilization of global reaction spaces between
cells (such as cytotoxic and infected cells) by the reorganization and interplay of the actin and
the microtubule based macromolecular scaffolds. In the third part, starting with Chapter 39.9,
we show that adhesion induced microdomains can transform analog into digital signals or store
and integrate information.
From the educational point of view one major purpose of the chapter is to show how adhesion-
induced microdomains in membranes can act as local reaction centers, controlling the access
of reactants, inhibitors and activators. The second purpose is to show how, by interplay of the
actin cytoskeleton and the microtubule-aster, cells can be polarized to generate global reaction
spaces which are isolated from the extracellular space. Here we apply the unique mechanical
properties of membranes and semi-flexible filaments. This chapter is organized as follows. We
first introduce fundamental concepts of the primary immune reaction mediating the activation
and proliferation of naïve T-cells (lymphocytes). Then three fundamental experiments providing
insights into the reactions mediated by encounters between the naive T-cells and dendritic cells
are described which suggest that the T-cells may integrate information collected during short
2

term and long lasting encounters with DC. In the last part two models are presented which
can explain the integration of signals by short time memories based on allosteric reactions and
membrane micro domains (such as immunological synapses).
To facilitate reading the following text, we assembled in the Glossary ’Immune Reactions’ infor-
mation on the main proteins and some elementary processes involved.
39.2 A short introduction into the primary immune reaction
of naïve T-cells
Immunology is a huge field which is described in books on cell biology in several chapters.
The adaptive immune system saves our lives by fighting hostile intruders (generally called
pathogens) causing infections in the body of all vertebrates [Alberts 2002] [Lodish 2007]. It can
recognize novel pathogens (say viruses) which have never before infested our body and develop
strategies for their destruction. Moreover it can develop memories of earlier infections and can
thus rapidly recognize and fight pathogens intruding our body for the second time.
The adaptive immune reactions are mainly carried out by two classes of lymphocytes: B-cells
and T-cells. An enormous number of this class of blood cells, altogether about 2 · 1012 copies,
circulate in our body. B-cells differentiate in the bone marrow and produce a nearly unlimited
number of antibodies that circulate in the blood and other body fluids (such as lymph vessels).
They fight intruders, such as viruses or bacteria, by forming caps on their surfaces, thus
preventing their binding to host cells. Another strategy is to mark the surface of infected cells or
intruders that they are recognized and destroyed by white blood cells (macrophages or cytotoxic
T-cells). The T-cells are formed in the Thymus and circulate the blood vessels, the lymphatic
capillaries interconnecting the lymph nodes (see [Alberts 2002], Ch. 24) and the tissue, such
as the skin. Two types of T-lymphocytes fulfilling different tasks are formed by differentiation:
3
helper cells and cytotoxic cells (also called killer cells).
T helper cells (also called effector-T-cells) help other white blood cells in various ways. They
can stimulate the maturation of B cells into plasma B-cells and memory B cells. Another task
is the activation of cytotoxic T cells and macrophages. Moreover they help B-cells to switch
the class of antibodies. T-helper cells are also called C4+-cells since they expose a special
cell surface protein CD4 (where CD stands cluster of differentiation). In fact, the activated
T-lympoctes can differentiate in two types of helper cells: TH1 and TH2, which secrete different
types of cytokines. TH1 secrete interferon γ and tumor necrosis factor (TNS) which stimulate
macrophages and cytotoxic cells to kill pathogens. Moreover, it activates B-cells to secrete
specific types of antibodies. TH2 cells secrete interleucine and stimulate B-cells to make most
classes of AB, including IgE involved I allergic reactions. With the help of the two types of
helper cells the body can decide whether to fight intruders via macrophages or antibodies.
Cytotoxic T cells (or killer cells) destroy virally infected cells and tumor cells, or are involved in
transplant rejection. Another name is C8+T-cells, since killer cells expose a special cell surface
protein CD8 which recognizes major histocompatibility complexes class I (MHC-1) exposed by
nucleated blood cells).
Another class of T-lymphocytes comprises memory T cells. These antigen-specific T cells per-
sist a long time after an infection has decayed, (ideally during the whole lifetime of animals).
They rapidly proliferate into a large numbers of effector T cells if they encounter cells exposing
cognate antigen ( see Glossary for definition) after a new infection. They provide the immune
system with ’memory’ of past infections.
T-cells develop in the thymus, a specialized organ of the immune system (hence their name).
Matured T-cells leave the thymus and constantly circulate the body, including the lymph nodes.
They are called naïve as long as they have not been exposed to antigen exposing cells. The
4

naïve cells can only be stimulated by encounters with a special type of antigen presenting cells:
namely dendritic cells (DC) and some types of macrophages. These cells expose antigens which
are coupled to the major histocompatibility complex of class II (abbreviated as MHC-II, see
Glossary).
Fig.39.1.: (a) Small T-cell contacting the dendritic cell. Source [Gunzer 20XX], reproduced with
permission of the authors.
(b) Small T-cell and stimulated cell in blast- state which are surrounded by red blood cells for
comparison of the cell sizes. Fig (a) Courtesy of Prof. M. Gunzer.
On the origin and life of dendritic cells
The dendritic cells (DC) are born in the bone marrow by differentiation of precursor cells. Mature
DC constantly patrol the tissue (including the skin) searching for pathogens such as viruses and
bacteria. After encounters with pathogens DC become activated, they internalize the intruders by
phagocytosis, degrade the proteins into small pieces and expose them at the surface together with
the MHC II receptors. These matured DC move to the lymph node (see Fig. 39.2). Dendritic
cells perform also other regulatory functions by expressing co-receptors such as CD 80 (which
are found also on activated B cells). CD80 acts as ligand for two types of receptors exposed
by T cells: CD28 and CTLA-4. The former plays a key role for the complete activation of T-
cells while the latter is responsible the down-regulation of the T-cell activity, which is essential
to avoid over-activation of the immune system. Cells start to express the cell surface protein
CTLA4 during the initial activation process. This co-receptor binds to the CD 80 receptor (or
5

CD 86) and inhibits further T-cell responses, which is due to the fact that CTLA 4 binds much
stronger to CD 80 than CD 28.
39.3 Phenomenology of primary immune responses triggered
by naïve T-cell-DC encounters.
The population of naive T cell express a broad palette of antigen specific T-cell receptors which
can recognize a substantial number of distinct Ag-MHC-2-complexes. Due to this diversity only
one out of 106 T-cells is expected to bind to an infected DC (residing in the lymph nodes) and to
become stimulated. The activation of single cells can be observed early on (in vivo and in vitro)
due to the expression of a specific cell surface glycoprotein CD 69. This cell adhesion molecula
helps to retain the activated cell in the lymph node, enabling them to mature and to become
fully activated [Hendricksen 2008]. In contrast, the non-activated cells migrate continuously
between the lymph node and the tissue. The activation of lymphocytes encounters with antigen
presenting cells (APC is one of the best studied processes of the immune response (see [Freiberg
2002], [Dustin [2005], [Dustin 2006] [Sackmann 2011]). An essential consequence of the T-cell
activation is the expression and secretion of interleukin-2 (IL-2). These growth factors are
recognized by specific receptors, the interleucine-2 receptor, which triggers the proliferation
of lymphocytes after an incubation time of about one day. Most importantly, for the present
discussion, is that the IL-2 also induces the mitosis of the generating cell itself. In fact, the
generation of IL-2 is a paradigm of the control of genetic expression by external signals.
A second consequence is the differentiation of the activated T-cells either into helper cells
(TH) which support other cells, such as the B-lymphocytes, in their fight against pathogens,
or into cytotoxic cells, which destroy antigen carrying cells. The helper cells decay in two
fractions, TH1 and TH2, which secrete different types of cytokines. TH1 secrete interferon
γ and tumor necrosis factor (TNS) which stimulate macrophages and cytotoxic cells to kill
6

pathogens. Finally it activates B-cells to secrete specific types of antibodies. TH2 cells secrete
interleucines and stimulate B-cells to generate most classes of AB, including IgE. With the help
of the two types of helper cells the body can decide whether to fight intruders via macrophages
or antibodies.
This complementary chapter to ’Kapitel 13’ of the textbook deals with the physical basis of
two essential membrane mediated events of the immune response: first, the naïve lymphocyte
activation by immunological synapses and second, the destruction of antigen presenting cells
by cytotoxic T-cells (also called killer cells). Both processes are closely related to the physics
of cell adhesion and the adhesion induced reorganisation of the actin cortex and its control by
actin-microtubule crosstalk. Part of the model has been published in New J. Phys. [Sackmann
2011].
The activation of the T-cells by the APC is controlled by a palette of cell surface proteins and
associated helper proteins, the most important of which are shown in Fig.39. The T-cell-APC
adhesion is mediated by two pairs of cell-adhesion molecules: first, the integrin LFA-1 recog-
nizing ICAM-1 and second, the T-cell receptor binding specifically to the AG-MHCII complex
expressed on the APC surface. To induce a full immune reaction, binding between CD28 and
CD80 is required as will be shown later. Knock-out of this connection results in an incomplete
reaction called anergic. In the course of the reaction, the receptor CTLA-4 is expressed on the
surface of the T-cell. It binds to the co-receptor CD80, very strongly, thus blocking the access of
CD 28. This results in the down regulation of the full immune reaction and anergic reactions.
The membrane bound primary immune reaction is controlled by tyrosine kinase LcK with the
associated phosphatase CD 45, the protein kinase ZAP and the scaffolding protein LAT in a
manner described below. The last cell surface protein of T-cells to be mentioned is the receptor
IL-2R for the cytokine interleucine-2.
7

Fig. 39. 2:Summary of molecules involved in T-Cell activation during encounters with DC. The
APC express (i) the major histocompatibility complex (class II) exposing the antigen and (ii) the
intracellular adhesion molecule (ICAM) a counter-receptor of the integrins (see Kapitel 13). The
T-cells express the T-Cell receptor (TCR) which recognizes the antigen bound to MHC-II and
is closely associated with a co-receptor CD 3 that exposes tyrosine segments at the associated
ζ-chain that are phosphorylated by the Lck-kinase. Other cell surface receptors are CD 28 and
CTL-A4, the function of which is described in the text. The lymphocyte-APC adhesion induces
the sequential activation of two kinases, Lck and ZAP-70 as described in the text.
The membrane penetrating protein LAT (synonym for Linker of Activated T-cells) acts as scaf-
folding protein. It exhibits several binding sites for the effector proteins (activators) which stim-
ulate two transcription pathways I and II (described in Figure 39.4). The LAT binding sites are
activated by ZAP by phosphorylation of tyrosine side chains. The bottom part of the image shows
that the binding of the MHC-AG complex to the T-cell receptor triggers the genetic expression
of the cytokine interleukine-2 (IL-2) recognized by the IL-2- receptor and of the co-receptor
CTLA-4.
Binding of IL-2 to the IL-receptor (IL-R) triggers the cell division of the generating cell (au-
8
tocrine stimulation) as well as other T-cells (endocrine stimulation). The T-cell activation is con-
trolled by the phosophatase CD 45 which removes phosphate groups from CD3 and is therefore
an inhibitor of the T-cell activator Lkc.
39.4 Three fundamental experiments yield insight into the
mechanism of T-cell activation at the membrane level.
Over the last ten years powerful new methods providing new insights into the molecular
processes of T-cell stimulation at the cellular level have been developed. In vitro experiments are
performed with immortalized Jurka cells which can synthesize IL-2. By making use of lymph
nodes of transgenic mice, observations of T-cell-DC encounters under physiological conditions
have become feasible more recently [Hendricksen 2008].
The early phase of T-cell stimulation can be observed by the expression of the glycoprotein
CD 69 (see Glossary) which is the first glycoprotein synthesized by activated T-cells. To
observe the CD69 expression cells are transfected with GFP-carrying CD69-genes. By
separating the cell populations by flow cytometry stimulated and resting cells can be distin-
guished by fluorescence analysis. The later stage of the T-cell stimulation is monitored by the
formation of lymphocyte blasts. These large cells, just prior to mitosis, can be easily distin-
guished from the small non-stimulated cells by their large nucleus (see Glossary and Figure 39.1)
M. Dustin and co-workers [Dustin 2005 and 2006] studied the long time stimulation of T-cells
by phantom APCs which are mimicked by solid supported membranes doped with MHC II
exposing antigenic peptide (denoted as MHC-AG complex in the following) and ICAM-1
receptors (see Figure 39.3). Both constituents are anchored in the fluid supported membrane
by the lipid anchor glycosylphosphatidylinositol (GPI anchor) and thus are mobile within the
9

bilayer. T-cells from the spleen of trans-genetic mice were used to label the T-cell based proteins
with green or red fluorescent proteins (GFP and RFP). The interaction of the T-cell with the
phantom cell is observed by total internal reflection microscopy (TIRF) enabling the analy-
sis of the distribution of fluorescent labeled proteins at the cell-cell interface with high resolution.
In the sequential encounter experiment by Gunzer et al. [Gunzer 2000, 2004], dendritic cells
exposing antibodies were mixed with T-cells from the spleen of transgenic mice and cultured
in a three dimensional collagen matrix. In this way the formation of large cell aggregates was
avoided and the single T-cells could by observed (by video microscopy) moving through the
matrix for several days. The T-cells moved rigorously through the matrix adhered transiently
on the dendritic cells and moved from APC to APC for several days. The duration of the
adhesive states till the activation of the T-cells was measured. The activation was observed by
monitoring the formation of blasts (see Glossary). Remarkably, the duration of the cell-cell
contacts (ranging between 5 and 7 min) was about the same in the presence and absence of the
antibodies.
In the third type of in vitro experiments, the molecular organisation within the contact zone,
between the T-cell and the APC is studied by immuno-fluorescence microscopy ([Combs 2006]
[Freiberg 2002]). The distribution of membrane- associated and cytoskeletal proteins are ob-
served by labelling with antibodies which are visualized by decoration with fluorescent anti-
antibodies. The temporal evolution of the protein distribution is observed by fixing the cells at
different times after contact formation. An advantage of this technique is that the distribution of
the constituents involved can be observed both at the cell-cell contact zone and in the cytoplas-
mic space. In particular, actin, talin and MT could be visualized yielding important insight into
the reorganisation of the actin cortex and the actin-MT coupling during the T-cell stimulation.
10

Fig. 39.3: a) The continuous interaction of the T-cell with a supported membrane mimicking
the APC is studied. The phantom APC is doped with MHC II exposing the antigen (denoted as
MHC-AG) and the cell adhesion molecule ICAM. The distribution of the fluorescent constituents
in the contact zone of the cells is evaluated by total internal reflection fluorescence microscopy
(TIRF) which captures all fluorescent components up to a distance of 200 nm above the solid
surface. Experiments were performed with Jurka cells, an immortal strain of T-lymphocytes that
express IL-2 and are frequently used to study immune reaction.
b) Observation of transient contacts of the T-cell with ACPs distributed in a three dimensional
collagen matrix. The contact is observed by phase contrast microscopy. The residence time of a
T-cell on an APC is 7-12 minutes. Right side: The upper image shows a T-cell (encircled by a
broken line) adhering on a dendritic cell while the lower images shows a cartoon illustrating the
transient random walk of the T-cell on the DC. Images reproduced from movie in [Gunzer et al
11

2000] with permission of the authors.
c) Histology image of lymph node showing capillaries lined by endothelial cells and lympho-
cytes that have been penetrated the tissue. The right side shows a fluorescence micrograph of a
dendritic cell (in red) adhering on a large lymphocyte (green). The yellow territory shows the
area of the close contact between the DC and the lymphocyte (see also Figure 39.8 below). d)
Typical path of a cell exhibiting large fluctuations in mobility. The grey bars indicate the cell
cell-cell contacts. Please note that the velocity decays at the beginning of each contact but the
cells are not immobilized.
In physiologically more relevant studies, the T-cell activation is directly observed in the lymph
node of transgenic mice which carry cells exposing a TCR specific for a selected antigen (see
Figure 39.3 and [Hendrickson 2008]). These experiments were performed with CD8-cells,
that are cytotoxic cells which bind to MHC class I complexes. To stimulate T-cells the DC
are isolated from the bone marrow of transgenic mice and cultured. Then the DC culture
is incubated with a solution of the antigen for several days, resulting in the expression of
antigen-MHC-2 complexes at their surface, a process called pulsing. The pulsed DCs are then
injected into the mice which were incubated for about a day. By blocking the escape of the
T-cells from the lymph node their locomotion and transient adhesion on DC can be observed
by phase contrast or fluorescence microscopy as in the experiments by Gunzer et al. [Gunzer
2000, 2004]. An example of a DC adhering strongly on a T-cell is shown in Figure 39.3c. The
successful activation can be monitored at an early state through the expression of the glycopro-
tein CD 69. As noted above this cell adhesion molecule prevents the rapid escape of activated
T-cells from the lymph node. Its expression can be visualized by fluorescence labelling with GFP.
The in vitro study in the collagen matrix [Gunzer 2000] and the in vivo experiment in the lymph
node showed some remarkably similar results.
In the case of T-cells migrating through the artificial collagen matrix, the T-cells adhere on DCs
12

for 5-10 minutes, but they move over the cell surface during this time, before they escape and
search for other DCs. During each encounter the Ca++-level in the T-cell rises transiently about
60 sec after contact formation. As shown in Fig. 39.3d the local T-cell motility is slowed down
by a factor of 2-3 during adhesion but it not abolished during 72 hours. The average velocity of
the T-cells varies between 4 and 8 µms and is even slightly larger for T-cells exposing the cognate
antigen than for control cells. The contact time (between 5 and 10 min) does not change during
the three days. On the average the T-cells encounter one DC in two hour which corresponds to a
total adhesion time of two hours per day. Very similar behavior is found during the early phase
of the T-cell activation in vivo [Hendrickson 2008]. Further below we will describe possible
consequences of the T-cell DC encounters on the molecular level during the short encounters.
The T-cells become activated after visiting a minimum number of cells.
In the lymph node three phases of T-cell-DC interactions are observed (see [Hendricksen 2008]).
During the early stage after T-cell entry into the lymph node, the T-cells also adhere briefly (≤ 10
min) on the DC and the average mobility is not remarkably reduced compared to the situation in
tissue with antigen free DC. After 6-8 hours a second phase sets in, in which the residence time
of the T-cells on the DC is much longer (up to 60 min). This phase lasts for 12 hours and the
CD69 markers (indicating the initiation of the activation) are up-regulated. Most importantly,
the production of Interferon and Interkeukine-2 indicates that the T-cells have become activated.
Finally, after 24 h cells a new phase begins. The T-cell-DC encounters become short again and
under physiological conditions the lymphocytes leave the lymph node. During the incubation
about 300 dendritic cells were present in the lymph node. The major results of the detailed study
may be summarized as follows:
1. The effect of the binding affinity of the antigen-TCR complex on the kinetics of T-
cell activation was studied by evaluating the behavior of DC exposing a weakly (peptide
C) and strongly binding antigen (peptide M ), which differ in binding affinity by a factor
of 250. In both cases the mobility was slowed down after 4-6 h, but the T-cells entered the
13

immobilisation phase 2 much faster if the DC were loaded with the antigen M (see Figure 39.4a).
2. The kinetics of the T-cell activation depends remarkably on both the strength of the antigen-
TCR binding and the density of the cognate complexes on the DC as follows (see Figure 39.4b):
- If T-cells interact with DC exposing weakly binding peptides (peptide C), they undergo the
three phases of activation described above, provided each DC exposes a minimum of nAGC ≈ 130
C-MHC complexes, which corresponds to a total of 40,000 complexes in the lymph node
(containing 300 DC).
- However, if the DC are loaded with the strongly binding peptide AG-M the T-cell activation is
an all-or nothing process. They are not activated below a threshold number nAGM ≈ 60, while
above this limit they go immediately over into the phase 2 (with T-cells making long contacts
with the DC). The total number of M-MHC complexes on the 300 DC in the lymph is about 20
000. There is no change in the kinetics of the activation if the DC are loaded with more than 60
M- complexes.
3. A third important result of the in vivo experiment is the stimulation of the T-cells in the
presence of two populations of DC, one with a sub-threshold number of AG-MHC complexes
and a second exposing a high number of AG-MHC, exceeding the threshold. In this case the
transition of the T-cells to phase 2 is greatly accelerated.
In summary, the above experiments suggest that the T-cell are able to integrate signals acquired
during their serial encounters with DC, thus confirming the result of the in vitro experiments in
collagen matrix [Gunzer 2000].
14

Fig. 39.4: (a) On the mobility and activation of T-cells in lymph nodes containing about 300 DC
after [Hendricksen 2008]. The DC are loaded with about 3000 AG-MHC complexes per cell,
that is the total number of antigens in the lymph node (with 300 DC) was 106 copies. Note that
the cells are much faster immobilized in the presence of the peptide M.
(b) Temporal variation of percentage of proliferating T-cells interacting with DC exposing
weakly (peptide C) and strongly binding peptides (peptide M). On the abscissa the peptide con-
centration cP used for pulsing of the DC is plotted. The number nAG of peptide-C-MHC com-
plexes on the DC increases about linearly with the incubation concentration during pulsing the
DC. In the case of the strong peptide M it is nAGM = 30(3000) for cP = 100pM (10µM). For the
weakly binding peptide C it is nAGC = 130 per DC for cp = 10µM. Note the different behavior
for the two peptides (C and M). When the DC are loaded with C-MHC, the number of T-cells
activated increases linearly with cp (and thus with the number of C-MHC complexes exposed per
DC). In contrast, nearly all T-cells are activated if the DC are loaded with a threshold number of
nAGM ≥ 30 of the strongly binding M peptide.
15

39.5 The Activation of the T-Cell Proliferation on the Level of
the Genom
Before we discuss the molecular mechanism triggered by the T-cell-DC encounters, we summa-
rize in this section the essential steps leading to the genetic expression of IL-2 (and interferons).
In fact, the IL-2 generation is a paradigm of control of genetic expression by transcription
factors, which are activated or de-activated by cell signalling mediated by cytokines. As
noted above an essential step of T-cell stimulation is the expression of interleukin-2 (IL-2).
However, it was also mentioned that the full activation requires in addition a co-stimulation
signals mediated by binding of the CD 28 co-receptor to CD 80 cell surface proteins on the
target cell. Suppression of this pathway leads to a immunologically inactive state: called clonal
anergy. T-cell anergy is supposed to play a key role for the tolerance of self MHC-complexes
and self-antigens by our immune system. The anergic T-cells are selected out in the Thymus a
process termed negative selection [Macian 2004] .
The switching-on of the IL-2 expression which initiates the T-cell proliferation is assumed
to be mediated by the cooperative interaction of transcription factors activated by the cal-
cium/calcineurin mediated and the MAPK controlled pathways (see Figure 39.4 and [Culkien
2002], [Zhang 1998] ,[Bonello 2004], [Sackmann 2011])
- The first signalling pathway is triggered by the activation of phospholipase γ which results
in the opening of the calcium-storage vesicles by binding of IP3 to Ca-channels. The bursts
of Ca++ entering the cytoplasm activate the transfer of the general transcription factor NFAT
into the nucleus as follows. In the resting state of the T-cells, NFAT is prevented from entering
the nucleus by phosphate groups which are removed by the phosphatase Calcineurin after its
activation by the Ca/Calmodulin-complex.
16

- The opening of the MARK-pathway is triggered by phosphorylation of the first member of the
MAPK-cascade by the serine/threonine kinase Raf, which is switched on by the Rac GTPase.
This biochemical switch is triggered by GTP binding through the guanine exchange factor SOS.
SOS is activated by recruitment to the membrane through electrostatic and hydrophobic forces
binding and this important process will be discussed extensively below (Chapter 39.9). The
major function of the MAPK-pathway is the activation of the transcription factor AP1 which
triggers the IL-2- expression in combination with NFAT as described below.
Fig. 39. 5.: Simplified view of the calcium and MAPK mediated pathway of genetic expres-
sion of interleukine-2 (IL-2) triggered by antigen-TCR binding. The ZAP kinase is activated
17

through binding to phosphorylated tyrosine groups of the ζ-chain of the CD3-complex (hence
its name zeta associated protein). ZAP activates several binding sites at the scaffolding protein
LAT (synonym for linker for activation of T cells), which is recruited to the immune synapses a
few seconds after adhesion. The phosphorylated sites of LAT bind various effector (or actuator)
proteins resulting in their activation. These include phospholipase C-γ (PLC-γ) which gener-
ates the inositol-triphosphate (IP3), which opens the Ca-channels of the Ca-storage vesicles.
Together with calmodulin the second messenger activates the phosphatase calcineurin which re-
moves phosphate groups from NFAT enabling its transfer into the nucleus.
The phospholipase is further activated by the SLP-76 bound to the scaffolding protein LAT. The
MAPK pathway is triggered by Rac (GTP-Rac) which is recruited to the plasma membrane and
thereby activated by the membrane-associated guanine exchange protein SOS. As described in
detail below (see Chapter SOS) this requires the diacylglycerol (DAG) as second messenger and
therefore the PLC-γ and the RAC mediated pathways of genetic activation are coupled. The
bottom part of the image shows the activation of the IL-2 expression by interplay of the two
pathways.
After decondensation of the chromatin (mediated by NFAT), NFAT and AP-1 form a supra-
molecular complex which binds strongly to the DNA and switches on the expression of IL-2.
The roles of some of the proteins involved are also described in the Glossary.
The cooperation of the two pathways of transcription is necessary for the following reason. The
members of the NFAT family (see Glossary) play a key role for the activation of most genes
coding the T-cell cytokines. But they bind only strongly to DNA in combination with other
TF such as AP1. Since members of NFAT are involved in many transcription processes it is
assumed that they play a role for the chromatin remodelling (see Glossary and [Macian 2005]).
AP-1 is a heterodimer consisting of two parts called c-jun and c-fos. They both exhibit specific
DNA binding domains but can only trigger the transcription of IL-2 in combination with NFAT
(see Fig.1). NFAT, AP1 and the specific DNA stretch form a stable complex which activates the
transcription of the m-RNA of IL-2.
18

A closer inspection of Figure 39.4 shows that the two pathways of transcription are closely
coupled through the second messenger Ca and diacylglycerol (DAG) which are both generated
by PLC-γ. As discussed in the separate Chapter on the electro-hydrophobic binding of proteins
to membranes, the molecular switch Rac is activated by binding to DAG enriched microdomains
of the T-cell plasma membrane. Further below we will provide evidence that the coupling of the
two pathways of transcription could play an essential role for the integration of the sequential
signals provided by the immunological synapses.
39.6 Immunological synapses (IS) as membrane-bound bio-
chemical reaction centres stimulating the gene expres-
sion
In this chapter we show that adhesion domains can act as selective biochemical platform.
According to Figure 39.4 both pathways mediating the genetic transcription are triggered by
the phosphorylation of the LAT scaffolding protein through the kinase ZAP, which results in
the membrane recruitment and activation of the IP3 generating phospholipase PLC-γ as well
as Rac-GTPase, which triggers the MAPK-cascade. The ZAP kinase is switched-on by the
phosphorylation of the ζ-chains of the TCR-CD3-complex through the tyrosine kinase Lck
(see Glossary for more information on Lck). The Lck function is, however, continuously
counteracted by the tyrosine phosphatase CD45 which decouples phosphate groups from the
ζ-chain of CD3. The elegant and pioneering in vitro experiments by M-Dustin and co-workers
described below, showed that the inhibitory function of CD45 is abolished in adhesion-induced
micro-domains formed during the T-cells-DC encounters ([Dustin 1904, Dustin 1905 ], c.f. also
[Sackmann2011]).
By using TIRF microscopy, the distribution of several of the major players involved in the T-cell
activation were observed within the adhesion zone as a function of time after contact formation.
19

These included several of the proteins shown in Fig 1, such as CD3, Lck, ZAP-70, CD45, LAT.
By using cells from transgenic mice two sets of the proteins labelled with green (GFP) and red
(RFP) fluorescent protein, respectively, could be observed simultaneously. The adhesion process
occurs in three phases. Two of these are shown in Figure 39.6, where the distribution of CD3
and the ZAP-kinase after 3 and 30 min are presented. The third phase leading to the generation
of global reaction spaces by the polarisation of the T-cell and APC is shown and described below
(see Figure 39.7).
- During the first stage of the T-cell-APC encounters, the cell spreads on the supported
membrane acting as phantom APC. The radius of the contact zone growths linearly with time
and reaches a maximum within 2-3 min. The adhesion is mediated by the formation of small
(∼ 1µm diameter) domains enriched in the TCR-CD3 complex, phosphorylated Lck (which
are not shown) and ZAP 70 [Sackmann 2011]. Each microdomain contains between 40 and
100 TCR-CD3complexes [Dustin 2005]. Clearly, during the growth phase the domain-like
distribution of Lck, ZAP-70 and CD3 are strictly correlated (c.f. Figure 39.4a top right sides).
- After about 5-10 min the domains enriched in TCR-CD3-complexes move towards the centre
of the adhesion disc with average velocities of about 7 nms , whereas the kinases ZAP-70 and
Lck remain stationary but escape slowly from the adhesion zone. After about 20 min the T-cell
receptor and the CD3-complex are assembled in the centre forming the c-SMAC (exhibiting a
diameter of 2− 3µm, cf. Figure 39.7) while Lck and ZAP-70 become more randomly distributed
by lateral diffusion of the membrane anchored molecules. The diffusivity of the lipid anchored
Lck is D ≈ 0.26µm2
s , suggesting that this enzyme is randomized on the time scale of minutes.
The ZAP-70 protein can randomize by diffusion within the cytoplasm.
- Even after the formation of the central SMAC new microdomains are continuously formed at
the periphery of the SMACs, strongly suggesting that they act as immunological synapses which
maintain sustained activation of the transcription factors via the PLC-g and the Rac triggered
20

pathways. In this picture the SMAC serves the continuous recycling of the TCR-CD3 complexes
and membrane clusters (enriched in DAG generate by PLC-g) as was also postulated by Dustin
et al. [Dustin 2005].
- The key inhibitory protein, the phosphatase CD45, is also dynamically reorganized during the
first phase of the immune response. Due to its large extracellular domain it is expected to be
expelled by steric forces from the adhesion domains. This was indeed observed experimentally
([Dustin 2005], [Freiberg 2002]). The phosphatase becomes associated again with the CD3-
enriched microdomains after their fusion with the c-SMAC.
21

Fig. 39.6.: a) Top image: clusters of co-receptor CD3 and the kinase ZAP-70 labelled with
green (GFP) and red (RGP) fluorescent proteins, respectively, are observed (3 min after contact
formation) by total internal reflection fluorescence microscopy (TIRF). (Image modified after
Reference [Dustin 2005]). The TIRF technique captures all fluorescent molecules located up to
about 250 nm above the substrate surface. The right side shows the distributions of the kinase
ZAP (red) and the CD3 complex (blue) along a section AA’ 3 min (top) and 30 min (bottom) after
adhesion of the cell on the supported membrane. Clearly, the domains are in register until about 3
min after onset of adhesion. Thereafter, the TCR-CD3 complexes move towards the centre while
the fluorescent ZAP-70 fades by lateral randomisation (see middle image and [Dustin 2005]).
b)Model of activation of T-cells by micro-cluster formed during the initial phase of T-cell-APC
adhesion. The 70 kDa kinase ZAP-70 is activated by binding to the tyrosine groups of the CD3
ζ-chains phosphorylated by the Lck Kinase. The top image shows the situation before and the
bottom after adhesion domain formation. Before adhesion sets in (top), ZAP-70 is not activated,
due to the continuous de-phosphorylation of CD3 by CD45. After formation of tight adhesion
domains by lateral aggregation of bound TCR-AG-MHC pairs the inhibitor CD45 is expelled
from the reaction zone by steric forces and ZAP is activated. The small adhesion domains thus
act as immunological synapses
22

Taken together, the in-vitro experiments lead to the following picture of the IS function [Sack-
mann 2011]. The extracellular domain of CD45 is about 40 nm long, and thus much longer than
the inter-membrane distance enabling the formation of strong TCR-MHC-peptide bonds (which
is ∼ 15nm). Therefore, CD45 plays a twofold role: it inhibits the CD3-phosphorylation and acts
as buffer molecule counteracting adhesion (together with other glycoproteins of the glycocalix).
It is therefore expelled from the adhesion domains formed by TCR-MHC-peptide aggregation,
resulting in the effective phosphorylation of the CD3 ζ-chain and thus the activation of the
ZAP-70 kinase.
The major experimental evidence for the model was provided in beautiful experiments by
Choudhuri et al. [Choudhuri 2005]. These authors changed the lengths of the extracellular
domains of both the CD45 and the T-cell receptor and showed that the immune response is
suppressed if the length of the extracellular part of CD45 is comparable to or shorter than that of
the TCR-MHC-peptide complex. As mentioned above the second evidence was provided by the
observation CD45 is not found in the early formed microdomains.
An intermediate summary and conclusions
The adhesion domains can play a twofold role for T-cell activation. First, they enable cells to
adhere strongly by commitment of only a small number of CAMs (typically ∼ 10, 000) as shown
in Kapitel 13 and [Bruinsma 2000]). Secondly, they can form biochemical reaction platforms
which are able to control the access of a selected fraction of membrane bound reactants and
exclude inhibitors, such as CD45. Previous experimental and theoretical studies showed that the
repulsive interfacial forces by the long extracellular domain of the CD45 phosphatase inevitably
leads to the formation of adhesion domains [Bruinma 2000].
Most importantly, the adhesion domain model can reconcile the (seemingly) contradictory
23

observation that lymphocytes can be activated by continuous T-cell-APC contact as in the
experiments by Dustin et al. and by sequential contacts in a collagen matrix [Gunzer 2004 ]
or in the lymph node [Hendricksen 2008]). We postulated that each adhesion domain formed
by lateral segregation of tightly formed TCR-MHC-peptide pairs can act as signalling platform
which stimulates the genetic expression of a burst of IL-2 mediating the turn-over of a certain
number IL-2 receptors (see Glossary) which drive the cells sequentially through the G1 → S
transition (see [Schmidt 2006], [Sackmann 2010]). As judged from the experiments by Dustin
et al. each domain can signal for several minutes until it is recycled in the SMACs. Below (in
Chapter 39.9.2) we will discuss two possibilities of signal integration. The situation is very
similar to the firing of nerve cells after receiving a minimum number of depolarising signals (in
parallel and in sequence) from many different synapses ending on its dendrites.
Evidence for the sequential stimulation model is also provided by the observation that T-cell
activation may be mediated by interrupted signalling. This was shown most clearly in elegant
experiments through periodic addition and removal of inhibitors of src-kinases (such as Lck).
Although the IS are periodically destroyed and reformed, T cells were eventually activated and
produced interferon γ [Faroudi 2003].
39.7 Secondary immune responses: the formation of global
reaction spaces and cell polarisation are guided by MT-
actin cross-talk
The observation of the molecular organisation in the cell-cell contact zone by immuno-
fluorescence microscopy (see [Freiberg 2002], [Combs 2006], [Stinchcombe 2006 ]) reveals a
more complex picture of the adhesion process. By observing the distribution of talin and Lck
by fluorescent antibody labelling (at different times after contact formation) it was shown that
24

two types of adhesion domains are actually formed during the first 10 minutes: clusters enriched
in Lck and in talin, respectively. The former are attributed to the immunological synapses and
the later to domains enriched in bound integrin-ICAM pairs [Sackmann 2011].for the following
reason. Talin is known to play a twofold role: it activates the initially weakly binding integrins
b generating high affinity states [Critchley 2008] and in addition mediates the coupling between
the plasma membrane and the actin cortex. Thus, talin reflects the distribution of the integrin
(LFA-1).
Figure 39.7a shows the recruitment of the actin-membrane coupling protein talin to the inner
surface of the T-cell. During the first stage of the reaction (t < 5 min after starting the adhesion),
talin forms small (slightly elongated) clusters of about 1µm diameter. These coexist with the
microdomains enriched in TCR-CD3 complexes and are sometimes close to these. After about 3
minutes, talin reorganizes and forms a ring-like organisation with radius R ≈ 8µm which agrees
rather well with the radius of the dome-like distribution of Zap 70 in Figure 39.6. Since the
talin reflects the distribution of strongly adhering integrins, its ring like distribution suggest that
during the second phase of the reaction the T-cells adhere strongly on the APC by the formation
of a ring-like zone of tight adhesion. Experiments by Wuefling et al. provide evidence that
the co-receptor ICAM is assembled at the nascent adhesion ring by active transport [Wuefling
1998]. Interestingly, in the experiments by [Freiberg 2002], the clusters of talin and ZAP-70
appear to be not completely in register suggesting that the microdomains enriched in TCR and
integrin (LFA-1) are separated. However it could be a technical artefact.
The transition from the weakly to the strongly adhesion state is also demonstrated by Normarski
microscopy. The contours of the cells observed by this technique are shown in Figure 39.6a. It
is seen that the contact area between the T-cell and the APC is small during the first 5 minutes
after the adhesion starts and the T-cell is only slightly deformed. After 30 min the T-cell has
spread over the curved surface of the APC. It is strongly deformed and forms a conical shape,
similar to the French ’bonnet rouge’. The shape change is due to the polarization of the T-cell
25

mediated by coupling of microtubules emanating from the centrosome to the ring like actin
assembly. The spider leg like assembly of the microtubules has been directly visualized by
immuno fluorescence by Combs and coworkers (see Fig 39.6).
Fig: 39. 7.: (a) Schematic view of the reorganisation of the actin network and cell polarisa-
tion by actin-microtubule cross talk during the secondary immune reaction. Two-stage model of
reorganisation of T-cell-APC adhesion zone is suggested by visualisation of talin and Lck dis-
tribution through immuno-fluorescence [Freiberg 2002]. The top image shows the situation 45
sec. and the bottom 23 min. after contact formation. Note first, that the initially statistically
distributed clusters of talin move towards the rim of the contact zone and stabilize the ring-like
adhesion domain (called p-SMAC in the cell biology literature. Note second that the contact area
between the cells growths by about 20 %, whereby the originally nearly spherical cell assumes a
deformed pear-like (or bonnet rouge) shape. (b) Formation of supramolecular adhesion complex
(called central SMAC) within the ring-like zone of tight adhesion. The SMAC coexists with
small adhesion domains which are constantly formed at the periphery of the actin ring [Dustin
2006]. It serves the recycling of the TCR-CD3 complexes which are embedded in membrane
clusters enriched with diacylglycerol (DAG) that is generated by the PLC-γ activity (see Fig
39.11). (c) Visualisation of spiderleg-like assembly of microtubules emanating from centrosome
and binding to the actin cortex, most likely via Dynein motors. The actin membrane crosstalk
polarises the T-cell. Image reproduced from [Combs 2006].
The ring-like zone of tight adhesion forms a gasket which separates the membrane territory
26

within the ring and the outside space thus generating a closed global reaction space. This
polarization of the T-cell is necessary for the stabilization of the SMACs. The major role of this
structure is the recycling of the T-cell-CD3 complexes embedded the microdomains enriched
in diacylglycerol (DAG) which is produced by the PLC-γ. Evidence for the internalisation
of the TCR-CD3-complexes by the T-cells was demonstrated by the observation that the
SMAC formation is accompanied by the enrichment of lyso-bisphosphatidic acid (LBPA). This
unconventional lipid is known to mediates the formation of multi-lamellar endosomes mediating
the degradation or recycling of the exhausted microclusters (see [Matsumo 2004], [Dustin
2005]).
The role of microdomains formed by Integrin-ICAM links is not clear yet. It has been shown,
however, that removal of F-actin by latrunculin abolishes the formation of new microdomains
and their movement towards the center [Dustin 2005], whereas the stability of the existing IS
is not reduced. This suggests the following role for talin and actin. The binding energy of the
TCR-AG-MHC bond is too weak or the concentration of these CAMs is too small to drive the
adhesion process by domain formation. The adhesion is therefore triggered by the formation
of integrin-ICAM bonds, after the binding affinity of the integrin for ICAM is increased, which
occurs by binding of talin to the ζ-chain of integrin (see section on cell adhesion and [Critchley
2008]). This brings the two cell membranes close enough to enable the formation of clusters of
TCR-AG-MHC.
39.8 Models of adhesion mediated formation of local and
global reaction centres
Many aspects of immune synapse (IS) and SMAC formation can be explained by the interplay
of specific forces generic interfacial forces and membrane elasticity (see Kapitel 13, [Weikel
27

2004] [Groves 2001] [Bruinsma 2000]). Comparative studies of the adhesion of vesicles and
cells provide strong evidence that cell adhesion is a biphasic process:
- The initial phase consists in the formation of micro-domains of tight contact (in the following
called adhesion domains) that are formed by lateral segregation of bound pairs of cell adhesion
molecules (CAM) interacting via specific (lock-and-key) forces.
- The second stage consists in the stabilisation of the adhesion domains by coupling of actin
gel clusters to the intracellular side of the receptor domains. In nucleated blood cells, such as
leukocytes, this coupling is mediated by talin. Most importantly, the binding of talin to the
cytoplasmic domains of the receptors increases the adhesion strength in two ways:
First, the binding affinity of integrin receptors increases by coupling of the talin head group to
the intracellular domain of the ζ-chain, which induces a transition of the extracellular binding
pocket from a weak to a high affinity conformation [[Critchley 2008]]. Second, the adhesion
strength is increased by stiffening of the cell envelope [Simson 1998].
Numerous model membrane studies suggest that the domain formation is a consequence of the
interplay of specific attraction forces between the CAM-CAM pairs and several generic forces
which include:
- medium range steric repulsions exerted by membrane proteins exposing very large head groups
(length >30 nm) called spacer proteins or buffers.
- elastic stresses associated with membrane bending deformations between the rim of the
adhesion domains and the non-adhering zones which extend over a persistence length ζ (see
[Bruinsma 2000 ]).
28

- entropic disjoining pressure generated by pronounced bending excitations which generate an
entropic repulsion pressure (pdis j) between the cell surfaces and which exerts two effects: it
inhibits the non-specific adhesion by van der Waals attraction and simultaneously promotes
formation of adhesion domains by pushing the membranes together [Sackmann 1996], [Pierre
2008].
The primary immune response discussed above is a localized process, which is mainly mediated
by the composite cell envelope. It involves essentially components of the lipid-protein bilayer
(such as the proteins of the glycocalix, the CAMs and LAT), membrane associated proteins
(such as Lck, ZAP and PLC-γ) and the actin filaments directly coupled to the intracellular
domains of the CAMs. In contrast, the decomposition of the T-cell-APC adhesion zone into the
central c-SMAC and the ring of tight adhesion (also called p-SMAC) is associated with a global
shape change and the polarisation of the lymphocyte as indicated by the strong deformation of
the T-cell after 20 min (see Fig. S.39.6a, bottom). This requires the large scale restructuring of
the actin cortex as well as the participation of the microtubule scaffold [Sackmann 2010]. A
similar mechanical cell polarisation is observed during the destruction of antigen bearing cells
by cytotoxic cells (see Figure 39.7a,). The T-cell envelope contacting the infected cell forms a
dome like shape with the rim tightly fixed to the target cell. In this way a closed reaction space
is formed into which the lytic protein (such as perforin) can be ejected, while the loss of the
toxic molecules is minimized.
In the following we introduce a model of the generation and stabilisation of global reaction
platforms such as c-SMACs or Mexican hats (see Figure 39.7). The adhesion ring formation can
be controlled by two processes: first, the influx of the co-receptor ICAM-1 into the periphery of
the adhesion ring and second, the increase of the integrin LFA-1 affinity by binding of talin to
the integrins:
29

- Evidence for the first mechanism was provided by observations that the co-receptor ICAM-1 is
transported actively towards the nascent adhesion ring [Wuelfling 1998]. From the finding that
both motions are impeded by dismantling of the actin cortex by cytochalasin or by inhibition
of myosin motors suggests that the active transport is driven by actin-myosin II motors.
Interestingly, the movement of ICAM is initiated by the initial fast Ca influx, while no ICAM-1
redistribution occurs before the Ca-level of the T-cells becomes elevated. This could explain the
delayed formation of the ring of strong adhesion.
- Evidence for the second mechanism was provided by model membrane studies show that coex-
isting ring like adhesion zones encircling assemblies of small adhesion microdomains can also
form by dynamic self-organisation in the presence of two sets of CAM-CAM pairs of different
adhesion strength. Figure 39.7c shows giant vesicles doped with glycolipids (Lewis-X- factors)
adhering on solid surfaces covered with high selectin densities. At high receptor densities a ring-
like adhesion zone is formed while the inner region of the adhesion zone forms a dome. After
reducing the receptor density (corresponding to a reduction of the adhesion strength), small ad-
hesion domains are formed, which can dissolve and reform due to thermally excited bending
excitations [Reister-Gottfried 2008].
30

Fig. 39.8.: (a) Mexican hat like reaction space formed by cytotoxic cells adhering on antigen
exposing target cells (such as infected macrophages). The reaction space is isolated from the
extracellular space by a ring-like zone of tight adhesion acting as gasket. The global shape is
stabilized by microtubules which link the actin cortex to the centrosome. A second fraction of
MT exhibits dangling ends which can dynamically shrink and grow [Kaverina 2002] [Combs
2006]. Note that in this way secretory vesicles (or endosomes) can be transported to the site of
secretion (or to the Golgi complex) by dynein and kinesin motors moving towards the minus -
and plus-ends of the MT, respectively [Stinchcombe 2006].
(b) Mechanical stabilization of the Mexican-Hat-like shape of strongly adhering cells (such as
killer cells) and cell polarisation by elastic stresses induced in the membrane and the microtubule.
The adhesion induced tension of the cell envelope is balanced by the Laplace pressure P. The
tensile stress Σ in the MT is determined by the contact angle θc and the contact curvature R−1c , as
described in the text. The tensile stress can be generated indirectly by the binding of the MT to
the actin cortex or directly by dynein motors walking in the direction of the MT-minus end (as
shown by Combs et al [Combs2006]. The tensile stress in the MT is balanced by the tangential
tension induced in the actin cortex, as shown in the inset of (a).
(c) Model system demonstrating the control of the formation of ring-like and circular adhesion
domains via adhesion strength visualized by reflection interference microscopy (RICM). The
image shows the RICM interferogram of giant vesicles loaded with Lewis X-factor adhering on
solid surface covered with selectins. At high adhesion strengths of > 10kBT (or high receptor
densities) ring-like adhesion zones are formed while small adhesion domains are generated at
random sites if the receptor density or the CAM-CAM binding strength is reduced below 10kBT .
With increasing concentration of CAM-CAM-pairs the adhesion ring broadens until the total
contact zone is tightly covered.
The mechanical properties of quiescent and non-adhering lymphocytes (such as naïve T-cells
exhibiting a small nucleus) are described by the shell string model developed earlier [Heinrich
2006]. The model is based on magnetic-tweezer micro-rheometry studies of macrophages
showing that the cytoplasm is a soft viscoplastic body which is mechanically stabilized by
31

coupling of a fraction of the microtubules (typically 10) with their plus ends to the actin cortex
and with their minus ends to the centrosome. If a MT of length L is compressed by a force
couple (f, -f) acting parallel to its axis it buckles above a critical value Fc (called the Euler
buckling force)
f ≥ Fcr =4π2B
L2
(1)
The microtubules exhibit a bending stiffness of B ≈ 2 · 10−23Nm and the critical force of a 5µm
long filament is thus of the order Fc ≈ 5pN. Under many physiological conditions forces in
cells are two to three orders of magnitude larger. Therefore, cells have to be designed in such a
way that the MTs are only subjected to large tensile stresses. This is achieved by coupling of the
several µm long MT filaments with their plus ends to the actin cortex and with their minus ends
to the centrosome [Gundersen 1988], [Kaverina 2002]. Since the actin cortex is a viscoelastic
shell strong external force pulses (of the order of nN) on a MT can be balance by interplay of
the tensile forces in the MTs coupled to actin and the shear stress in the viscoelastic actin cortex
as shown in Figure 39.8. The mechanical coupling between different MT is mediated by the
centrosome which thus acts both as force centre and as global cell organizer (hence the name
’microtubule organisation centre’ (MTOC)). The response of the cell to force pulses on the MT
is astonishingly fast. Mechanical equilibrium is re-established within a fraction of a second
(∼ ∆0.2s according to [Heinrich 2006]).
It is important to emphasize that only a fraction (∼ 10%) of the MT is fixed to the actin
cortex while the rest exhibits dangling ends and is subjected to continuous decomposition and
reconstruction. These dangling MT can serve the rapid active bidirectional transport of secretory
vesicles and endosomes between the Golgi complex and the TCR-APC contact (See Figure 39.
32

8a and [Stinchombe 2006]).
We discuss now the mechanical stabilisation of the Mexican hat shape by interplay of the
elasticity forces of the composite cell envelope and the microtubules bound to the actin cortex.
We consider first the role of the membrane tension and the bending elasticity. Many features
of adhesion can be explained quantitatively in terms of the balance of membrane tension and
bending moments at the cell-cell contact zone [Bruinsma 2000]. The equilibrium of tension
at the rim of the adhering membrane (called the contact line L) is determined by the classical
Young equation
∆gad = σ(1 − cos θc)
(2a)
where ∆gadis the so called spreading pressure (which is equal to the work of adhesion per unit
area). Due to the finite bending modulus κ of the membrane, the transition from the adherent to
the free membrane at the contact line L is smooth exhibiting a finite radius of curvature Rc which
is related to ∆gad by:
∆gad =12κ
R2c
(2b)
The geometric parameters Rc and θc define the contour of the cell envelope. They can be
measured by interference microscopy as described extensively in [Simson 1998], enabling
measurements of the spreading pressure ∆gad.
In general, the number of CAMs is so small that only a ring like adhesion zone can be formed
(as in Figure 39.6c). In this case the tensions and the bending moments have to be balanced both
33

at the outer (radius ρo in Fig. 6) and the inner boundary (radius ρi) of the rim. For that reason a
dome like shape is formed in the centre of the adhesion zone. The outer boundary condition is
determined alone by Equation 2a with the contact angle (θc). The boundary condition at the inner
contact line is determined by the Young equation and the Laplace pressure Π = 2ΣRh
, where Rh is
the radius of curvature of the indentation. The membrane tension σ and the additional tension Σ
determined by the Laplace pressure balance partially and the inner contact angle θci changes as
follows:
∆gad = (σ − Σ)(1 − cos θci)
(3)
This equation predicts that the contact angle at the inner rim of the adhesion zone is smaller than
that at the outer one which is indeed observed in the left image of Fig 39.6c.
Since the ring-like adhesion zone is also controlled by the tensed MT we consider now their
force balance. The following consideration shows that single MTs may balance tensions of
several ten pN. To estimate this tension we use the same method as above. Due to the binding
to the actin cortex the MT tend to maximize the length (L) of coupled segments which generates
the tensile force. The only difference is that we have to consider adhesion energies per unit
length and forces instead of forces per unit length. We assume now that the MT is bound to
the actin cortex over a length L (see Figure 39. 6a inset) and that the binding energy per unit
length is w (measured in Jm ). The tensile force Σ in the filament is then determined by the one
dimensional Young equation:
w = σ(1 − cos Θc)
(4)
34

where θc is the contact angle defined in Figure 39.6. To estimate w we assume that the average
distance between the actin-MT linkers mediating the coupling of a MT to an actin filament is
about 10 nm and the binding energy about 20kBT (10−19J) one obtains w ∼ 10 − 11 Jm ). For a
contact angle θc ≈ 30 one expects a tension of σ ≈ 40pn.
Several proteins mediating the coupling of MT to the actin cortex are known. One is the
so-called end-protein (END-1) which can also mediate the formation of MT bundles [Combs
2006], [Kaverina 2002]. As shown recently for the case of lymphocytes, the coupling is
mediated by dynein through the adaptor protein ADAP which has been shown to bind to the MT
along the whole length [Combs 2006]. Since the dynein motor tends to walks towards the minus
end of the MT it generates a tensile force in the MT and a counteracting shear stress on the actin
cortex.
It should be noted that the symmetric MT arrangement in Figure 39.7 is not necessary to
establish mechanical equilibrium. The only stability condition is that the tensile forces of the
assembly of MT must be balanced. Thus, the components parallel to the contact zone must
cancel∑
i Σi sin θi = 0. Moreover, the net force of the MT in the normal direction pulls the
centrosome towards the cell envelope. Finally, several force centres can be formed which are
controlled by different centrosomes.
35

39.9 Analog-to-digital conversion and transient memories of
cell signals. RAS-GTPase switching mediated by the
guanine exchange factor SOS
39.9.1 Synopsis
In Section 39.1 to 39.8 we described in vitro and in vivo experiments showing that the
T-cell proliferation could be induced by adhesion-induced micro-domains acting as reaction
centers that stimulate the T-cells to produce small aliquots of cytokines, such as interleukine
II (IL-2) and interferons. These pulses of cytokines drive the cells sequentially through the
cell cycle. The integration of the signals sent by the immunological synapses is reminiscent
of the stimulation of nerve cell firing by the integration of signals received from numerous
synapses, hence the reaction domains are called immunological synapses. In fact, the T-cell
stimulation is a paradigm of the stimulation of gene expression by micro-domains formed by
membrane-associated supra-molecular protein complexes.
In this section we address a second problem not considered yet. We saw in Chapter 39.2 that the
genetic expression of cytokines is mediated by parallel action of two cell signaling processes,
namely the calcineurin and the MAPK/ERK mediated pathway. The former is initiated by
the phospholipase Cγ (PLC-γ ) and the later by the Rac GTPase which activates the MAPK
signaling cascade. Since the two signaling pathways are not strictly coordinated, some memory
is required which maintains the signaling by each pathway active for some time, in order to
supply the two transcription factors simultaneously to the operator of the cytokine genes. There
are several strategies to generate memories. Information can be stored first, by switching of
systems (say membranes) between two states separated by an activation barrier or secondly,
by coupled biochemical reactions involving allosteric effects [Bhalla 1999], [Barkai 2000].
Examples of the former mechanism is nerve excitation by depolarization of nerve cells below
36

a threshold value or the formation of membrane based reaction centers, such as the immuno-
logical synapses which are active for several minutes (several minutes, according to Figure 39.1).
In the first part of this chapter (39.9.2) we show that the activation of the MAPK-mediated
pathway of T-cell stimulation by Rac GTPases is an example of the first type of memory
generating mechanism. We will see that the biochemical switching system can be maintained in
the activated state for extended periods of time and sum-up sequentially received information
[Yadaf 2010]. In addition it can act as analog-to digital transformer of external cues (such
as mechanical forces or hormones [Das 2009]). In the second part (39.9.3) we show that
microdomains generated by the activity of phospholipase C-γ can serve as medium term
memory and coordinate the activation of the NFAT and the MAPK mediated pathways of genetic
transcription
39.9.2 The Rac-SOS system can digitalize analog cell signals
The MARKS signal cascade is triggered by the threonine serine kinase RAF after its activation
by the excited GTP-Ras (see Figure 39.1). This molecular switch can be activated by two
enzymes: the guanine exchange factor SOS and a guanine release protein (GRP; see glossary).
They are linked to the reaction center in different ways. SOS is recruited to the scaffolding
protein LAT via the adaptor Grb2, while GRP 1 binds to the diacylglycerol (DAG). In this
way the membrane binding of the two GEF depends on the activation of both the LAT-and the
phospholipase C-γ.
Characteristic features of SOS
The memory of the Rac-SOS based signaling system is based on a unique property of SOS.
37

It is an allosteric enzyme which can be switched from an inactive (or very weakly active) to
a high activity state by binding of GTP-Ras to a specific induction binding pocket. SOS is a
huge protein composed of six domains with specific functions (see Fig. S.9.8). The C-terminal
serves the coupling of SOS to phosphorylated tyrosine groups of the scaffolding protein LAT
via the adaptor protein Grb2 binding. The Cd25 domain exhibits the enzymatic binding site
for GDP-Ras, while the adjacent REM contains the allosteric binding pocket for the excited
GTP-Ras. The REM sequence is followed by two coupled motifs: a DH and a pleckstrin
homology (PH) domain. We summarize now the specific physical and biochemical properties of
SOS function.
The SOS-activity is switched by membrane binding mediated by electrostatic forces. In the
resting state of cells SOS is auto-inhibited by binding of the PH to the DH domain and the SOS
resides in the cytoplasm. The PH-DH interaction blocks the access of GTP Ras to the allosteric
binding site and thus the activity of SOS [Soisson 1998]. As revealed by X-ray structure
analysis, SOS is switched-on by simultaneous binding of the H- and the PH-domain to the
inner leaflet of the plasma membrane, whereby the H- and the PH-domain bind specifically to
phosphatdic acid and PIP2 lipids, respectively. The switching is mediated by a conformational
transition of the SOS protein which opens the allosteric binding site and amplifies the guanine
exchange activity of SOS [Gureaskoa 2010].
The H-domain (also called ’histone domain’ due to its structural similarities with histones)
exhibits three clusters of basic residues which interact electrostatically with phosphatidic acid
(PA) but not with PS [Yada 2010]. The three clusters surround a negatively charged center and
this specific structure is conserved. The important role of this basic surface is demonstrated
by finding that replacement of basic amino acids by neutral ones abolishes membrane binding.
SOS-H domains bind to SOPC vesicles containing 10 mole % PA with a dissociation constant
of Kd = 200nM which is 600 times larger than for PC containing vesicles. The binding of
SOS to PIP2 containing vesicles was Kd ≈ 1.5µM which is similar to the Kd-value of isolated
38

PH-domains of phopholipases to membranes.
There are other possibilities of feedback mechanisms between the Ras-SOS- mediated activation
of the MAPK and other biochemical reactions. The specific interaction of the H-domain with
PA and of PH with phosphoinositides link the excitation of the Ras-SOS-molecular switch to
the activity of other enzymes involved in the cell signaling. First, the binding of SOS to PA
depends on the generation of PA by phospholipase D. Secondly, it has been shown that the
activation of SOS can be accelerated by PIP3 [Das 2000] which couples the Rac-SOS activity to
the production of the PI-3-kinase.
39

Fig. 39.9.:(a) A simplified view of the linkage of receptor tyrosine kinase (RTK) to the SOS-
Rac-GTPase pathway via the adaptor Grb. The binding is mediated by SH3-homology domains
located at the C-terminus of the GEF.
(b) Domain organisation of the guanine exchange factor SOS. The domain histone (abbreviated
H) mediates the electrostatic binding of SOS to the membrane together with the PH-domain. The
DH and PH domains are part of a switch which can block the activation of SOS by mutual binding
(as shown). REM and Cdc25 comprise the enzymatically active section. The C-terminus couples
to the adaptor protein Grb2 which links the SOS to the phosphorylated sites of the receptor
tyrosine kinase (RTK).
(c) Ribbon Diagram of SOS reproduced from [Gureasko 2010].(d) Surface electrostatic potential
map of the H-domain. H stands for ’histone’ due to structural similarity of the domain with
histones. The birds view on the charged surface of the H-domain (seen through the membrane)
shows an assembly of three clusters of basic amino acids surrounding a negatively charged patch.
It mediates the electrostatic binding of SOS to phosphatidic acid.
40
In this section we consider the coupled biochemical processes which generate activated Ras-
GTP through the allosteric guanine exchange factor SOS. We will see under which conditions
coupled reactions interconnected by positive feedback mechanisms can generate catalytic cycles
with memory. We describe the basic concept of the model proposed by Das et al. [Das 2009]
which is a minimal model of biochemical cycles with memory. It is suggested by the follow-
ing observation. Binding of ground state GDP-Ras to the allosteric pocket results in a 5-fold
increase in GEF activity, whereas binding of the excited GTPase GTP-Ras increase leads to an
amplification factor of 75.
The model is based on the classical Michaelis-Menton theory of enzyme reactions and yields
average values of the Ras-GTP concentrations which could be measured by studying cell
populations. In single cell studies the concentrations of Ras-GTP would fluctuate strongly from
cell to cell and a rigorous analysis of the experiments would require the application of statistical
theories of chemical reactions. However, the basic concept of the generation of memory by
coupled reactions of allosteric enzymes can be more easily understood on the basis of the
classical theory of chemical reactions. We also skip the detailed presentation of the molecular
conformational changes responsible for the allosteric effect of SOS. The interested reader is
referred to the work of Freedman et al [Freedman 2006] and Gureasko et al. [Gureasko 2010].
The model of Das et al. [Das 2009] is based on the following assumption: The GTPase is
switched from the nearly inactive state to the highly active state by binding of GTP-Ras. This
activated switch is, however, generated by the non-allosteric exchange factor GRP, and not
by SOS, which is initially very weakly active. The assumption is justified by the theoretical
analysis of the chemical reaction in terms of the Michaelis-Menton-model of coupled reactions
which will be described now. A further assumption is that the turnover of the reaction is further
accelerated by catalytic deactivation of Ras-GTP by the guanine activation factor GAP. As
discussed in Kapitel 18 (Fig 18.13) the lifetime of the excited GTPases is rather long. They have
to be deactivated again in order to down-regulate the signaling process again and to maintain the
Ras-GTP level in the cell low. The situation is quite similar to the cells ability to maintain of the
41

Ca concentration in the µM range.
Fig 39.10.: (a) Schematic view of generation of activated Ras-GTP catalyzed by the geuanine
exchange factor SOS : Top: reaction scheme with unoccupied allosteric binding site. Middle:
reaction with allosteric site occupied by Ras-GDP. Bottom: Synthesis of Ras-GTP catalyzed by
non-allosteric GEF,termed guanine release factor (GRP). This GEF is activated by binding to
diacylglycerol (DAG) which is generated by phospholipases. It generates the initial population
of GTP-Ras which binds to the allosteric site and switches on the positive feedback loop.
(b) The reactions equations show the turnover of SOS with the non-activated Ras (RasGDP) and
the activated Ras (RasGTP) bound to the allosteric site of SOS.
(c) Variation of Ras-GTP production with increasing SOS concentration (represented by param-
eter α) corresponds to the total SOS concentration. The red section of the [Ras-GTP]-vs-α plots
42

correspond to the stable stationary states, while the blue sections mark the non-stationary so-
lutions of the reaction equations. Curve I (in green) shows the generation of GTP-Ras if the
allosteric site of SOS is inactivated by mutation. The increase of the GTP-Ras production with
α corresponds to normal dose-response curves of cooperative processes. Curve II and III show
the GTP-Ras production for SOS with functional allosteric sites for two concentrations of the
auxiliary exchange factor GRP. Please note that the threshold of the first order transition from
the inactive to the active state is shifted to higher values of α with decreasing GRP activity and
that the transition becomes simultaneously sharper.
For the application of the Michaelis-Menton model it is assumed that the Ras activation occurs at
the C-terminal sections comprising REM, Cdc25 and the Grb-binding domain which we denote
by S OS cat (were the index ’cat’ stands for catalytic reaction). To simplify the presentation of
the reaction equation, we introduce the following abbreviation for the reaction partners involved
in the process:
S ≡ S OS cat ; RD ≡ Ras − GDP ; RT ≡ Ras − GT P ; S RD ≡ S OS cat − Ras − GDP; S RT ≡
S OS − Ras −GT P; GAP ≡ Ras −GAP.
The non-enzymatic reaction equation describing the occupation of the allosteric binding sites
(equation (1) and (2)) are presented in Fig S.9.10. The enzymatic reactions are expressed in
terms of the well-known Michaelis-Menton equations:
E + S
kn
⇔
k−n
ES
knP
⇒ E + P (MM)
kn, k−n are the binding and unbinding rates of the substrate (S)-to-enzyme (E) binding and
knP is the rate of product formation from the excited substrate enzyme complex. The index
n stands for the type of reaction. We have to consider three enzymatic reactions, namely the
43

Ras-GTP production with the allosteric site of SOS occupied (Michaelis-Menton-constant K3m)
or not-occupied (MM-constant K4m) and finally the de-activation of GTP-Ras mediated by GAP
(MM-constant K5m). The Michaelis-Mention constants are:
K3m =k3P + k−3
k3
;
K4m =k4P + k−4
k4
;
K5m =k5P + k−5
k5
Here kn and k−n are the binding and unbinding reaction rates of the substrate to the enzyme and
knP are the production rate of the reaction n.
The kinetic equations describing the production of Ras-GTP for the three situations of the
allosteric site un-occupied, and occupied by Ras-GDP and Ras-GTP, respectively can now be
written down as follows:
The turnover of the SOS with the allosteric sites occupied by activated and non-activated Ras
can be expressed as
d[S ]dt
= −k1[S ][RD] + k−1[S RD] − k2[S ][RT ] + k−2[S RT ]
(5a)
Eq. (5a) follows from the fact that the time dependent concentration of the SOS occupied by
activated Ras is for instance given by
44

d[S RT ]dt
= k2 [S ][RT ] − k−2 [S RT ]
(5b)
The production of the excited Ras (Ras-GTP ≡ RT) can finally be expressed as:
d[RT ]dt
= k2 [S ][RT ] − k−2 [S RT ] +k3P[RD] [S RT ]
K3m + [RD]+
k4P[RD] [S RD]K4m + [RD]
+k5P[RT ] [GAP]]
K5m + [RT ]
(6)
The first two terms account for the turnover of the SOS with excited Ras bound to the catalytic
site while the allosteric site is unoccupied. This process is illustrated in the top row of Fig 39.10a.
The third and the fourth term account for the modification of the production rates of the excited
Ras if the allosteric sites are occupied by Ras-GTP (transition rate k3) and Ras-GDP (transition
rate k4), respectively. Please remember that the production rate is increased by a factor of 75 if
the allosteric site becomes occupied by Ras-GTP. The last reaction is illustrated in Fig S.39.10a
(at the right side). It accounts for the rapid down regulation of the level of activated Ras-GTP.
The last three expressions in Eq.(6) are easily verified by noting that the modification of the
production rate of a product P by formation of an enzyme substrate complex [ES] is given by the
Michaelis Menton model (see Appendix A Exercise 39.2)
dPdt
= k′i[E0][S ]
KM + [S ]
(7)
45

The reaction equations (5) and (6) are coupled differential equation, since they are interconnected
by the conditions of mass conservation for the SOS
α = [S ] + [S RT ] + [S RD]
(8a)
and for the Ras
β = [RD] + [RT ] + [S RD] + [S RT ]
(8b)
The system of reaction equations (1) to (4) is a classical example of allosteric reactions which
yield simple cooperative dose-response curves such as the green curve I. If we assume now
that the activation of Ras by the catalytic site of SOS is very small if the allosteric SOS is
only occupied with inactive Ras (Ras-GTP), the production of Ras-GTP will be very low. The
situation changes dramatically if another Ras-GTP generating enzyme comes into play which
triggers the allosteric reaction of SOS. This triggering Ras-GTP is produced by the second
GEF-protein involved in the process, namely the non-allosteric GRP-protein. A specific feature
of this membrane based reaction is that GRP is activated by binding to the diacylglycerol lipid
(DAG). Indeed, the numerical simulations by Das et al. [Das 2009] show that this auxillary
guanine exchange reaction determines the character of the Ras-activation that is whether it is
continuous or discontinuous. The reaction can be expressed, as follows:
DAG/GRP + Ras −GDP↔ DAG/GRP − Ras −GDP→ DAG/GRP + Ras −GT P
The reader should keep in mind, that the modulation of the SOS-mediated Ras-GTP production
by GRP introduces a new aspect. Since the DAG is generated by phopholipases, such as
46

PLC-γ. The SOS-mediated activation of Ras is therefore coupled to membrane based reactions
generating DAG. The consequences of this aspect will be discussed below (see Ch.39.3).
We discuss now the most pertinent results of the Das-model [Das 2009]. The non-linear
MM-reactions were solved numerically and the production of Ras-GTP was calculated as a
function of the total concentration of SOS (defined as α in Equation 4a). The details of the
numerical solutions are well presented in the Supplementary Material of the Das paper. Figure
39.10 shows three characteristic solutions of the Ras-GTP concentration of the steady state of
the coupled reaction equations (5) to (8):
1. The green curve corresponds to the situation when the allosteric pocket is mutated in such a
way that it cannot bind Ras-GTP or Ras-GDP. The activated Ras production is determined by
the non-allosteric reaction rate which is 75 times smaller than the reaction rate of the wild type
SOS, resulting in a sigmoid dose response curve typical for cooperative processes.
2. The two red-blue curves show the Ras-GTP production with occupied allosteric sites. Both
curves show typical non-stable behavior. If α is increased form zero, the Ras-GTP concentration
increases slightly with α. Above a threshold value α* (indicated by the arrow A) the system is
unstable and jumps to the top red branch of the [Ras-GTP]-versus α curve. The blue section
determines the formal solution of the unstable regime. Please note that the threshold of the
transition is shifted to higher values of α and the transition becomes sharper with decreasing
concentration of GRP. The reader familiar with cooperative transitions, the Nagumo model of
nerve action potentials (Kapitel 16), or the Kittel-Changeaux model of cooperative transitions
will recognize the astonishing analogy between the Ras activation and two-state-models of
phase transitions.
What are the advantages of the dynamic memory? A First advantage of the two state systems
47

generated by coupled non-linear dynamic reactions (such as the kinetic equations 5-7) is the
robustness against fluctuations of the input signal (such as the number of SOS coupled to LAT).
If the operation point of the system is set far away from the transition between the two states,
large fluctuations of the input (such as the total SOS concentration α) changes the Ras-GTP
level only slightly (see Fig. 39.10c). Secondly, the operation point can be set by the parameter α
or by the concentration of the auxiliary exchange factor GRP.
The transient memory of the two-state control system can play a critical role for the activation of
the immune response for the following reason. To activate the expression of cytokines (say IL-2)
both pathways (that is the MAPK- and the calcineurin-mediated process) have to be excited.
Since the first is triggered by the burst of Ras-GTP and the second by a transient Ca-pulse the
two pathways are not expected to be synchronized. Therefore the transcription of the m-RNA
requires that the bursts of calcineurin and AP1 transcription factors (RC(t) and RAP(t − τ)) of the
parallel pathways live so long that the correlation function between the TF concentrations in the
nucleus
K(τ) =
∫ ∞
−∞
dt[RI(t)][RII(t − τ)]
exceed a threshold value K(t)∗.
39.9.3 On the role of microdomains as medium term memories for bio-
chemical reactions.
The most prominent effect of the T-cells APC encounters is the increase of the intracellular
Ca-level, by about 50 % over the basal level, mediated by the activation of PLC-γ. Experiments
with B-lymphocytes showed that the Ca-bursts can consist of single peaks (lasting ∼ 1min),
oscillations or broad bands lasting about 10 min [Agrawal 1995]. Statistical analyses showed
48

that only about 10 AG-MHC-2 complexes are required to elicit the Ca-bursts. Interestingly, the
duration and amplitude of the Ca-bursts can control the types of TF activated. Thus, NFAT is
activated by a sustained but small rise of the Ca++ level, while NF-κβ, the TF which is activated
via the MAPK-pathway, is selectively activated by a large transient rise of the calcium level.
Interestingly, the 10 min. duration of these sustained Ca-burst agrees with the lifetime of the
immunological synapses in the Dustin experiment (≥ 5min), before they fuse with the c-SMAC.
These experiments suggest that the immunological synapses can maintain high levels the
transcription factors NFAT and AP-1 over time periods of several minutes and thus activate
the transcription of m-RNA of the cytokines (such as IL-2) by the cooperation of these TF.
The two transcriptional pathways are intimately linked in at least two ways: Firstly, through
the simultaneous increases of the Ca-level and generation of diacylglycerol (DAG) by PLC-γ.
Second, through the production of acidic lipids, such as phosphatidic acid (PA) and PIP3.
PA is essential for the recruitment and activation of SOS [Das 2009]. PA is generated by
phospholipase D which requires both Ca++ and DAG to be activated (see Supplemental Chapter
S.9). The DAG-lipid provides also the binding sites for PI-3K. This kinase comes into play
since its product, the sevenfold negatively charged phophoinositol PIP3, enhances the activity of
PLC-γ [Falasca 1998].
The DAG rich domains, formed as a consequence of the PLC-γ activation, can serve two pur-
poses: First, they help to recruit several proteins involved in the activation of the transcriptional
pathways to the membrane, such as the phospholipases the GRP guanine exchange factor and
the protein kinase C (see Supplementalal Chapter S.9). Secondly, due to their lifetime of several
minutes they can serve as medium term memories enabling the integration of signals received
either sequentially by one or simultaneously by several IS. It should also be noted that the
recruitment of the proteins exhibiting polybasic side chains is enhanced in non-specific way by
phosphatidlserine (PS) as discussed in Supplement S.9.
49

Fig 39.11.: DAG enriched microdomains as reaction center with medium term memories and in-
tegrator of sequential signals. The two transcriptional pathways of the primary immune reaction
are intimately connected by the generation of diacylglycerol (DAG) through phospholipase- γ.
DAG plays a key role for the membrane recruitment of phospholipase D, generating phosphatidic
acid (PA) (which activates the allosteric guanine exchange factor SOS) and PI-3K (generating the
sevenfold charged PIP3) as well as its antagonist PTEN. DAG recruits the guanine exchange fac-
tor GRP which triggers the allosteric reaction of SOS. The activity of the reaction center is down
regulated by endocytosis.
39.9.4 On the growth kinetics and recycling of microdomains
In this short section we estimate the growth rate of adhesion induced microdomains by appli-
cation of the Smoluchowsky theory of coagulation in two dimensional systems. The flux of
molecules into a cylindrical reaction domain of radius R can be estimated by the asymptotic
Jaeger-Naqiv equation for large reaction times (corresponding to large values of α = DtR2 ) derived
in Appendix A
50

Φ ≈8πD c0
ln{
4D tR2
}− 2γ
(39.7)
Where γ is the Euler number: γ = 0.5772.
For the estimation of the microdomain growth rate, we assume that the kinetics of adhesion
induced domain formation is determined by the density of MHC complexes on the dendritic
cells. According to [Hendrickson 2009] the total number of MHC loaded with antigens is
5 · 104. The cell diameter is 2R ≈ 10µm and thus the MHC density is c0 ≈ 2 · 1014m−2 to
1015 1m2 . The diffusion coefficient of MHC complexes in lymphocytes is 2 · 10−14 m2
s (compared
to 50 − 100 · l0−14 m2
s in lipid vesicles [Edidin 1984]). With the above data we find for the influx
of MHC complexes dPdt = 16 MHC
s , where we used the value of α calculated in the Appendix A.
By assuming a MHC diameter of 5nm, the area of the domain formed within the first 60sec
by diffusion would be 960x25nm2 corresponding to a diameter of 150 nm. This result agrees
reasonably well with the diameter of the domains observed by immuno fluorescence [Freiberg
2002] and in the model membrane studies using supported membranes as phantom APC [Dustin
2004].The diameter is by a factor of 5 larger but it contains also the other proteins assembled
in the microdomains. It appears that the size of the domains is determined by the reservoir of
MHC as follows from the following consideration. The distance between the IS is about 1µm
and the number of MHC in a disc of 1µm radius is about 300.
Let us now have a brief look on the influx of the substrate of PLC-γ. The diffusion coefficient
is by a factor of 100 larger: D = 10−12 m2
s . The typical concentration is about 1 mole%, and the
logarithmic term in Eq 39.7 is about 14, resulting in an influx of 2 · 104s−1.The generation of the
messenger is IP3 and DAG-lipids is thus very fast after the recruitment of the phospholipase to
the membrane. In the experiments with supported membranes microclusters are continuously
51

formed at the periphery of the adhesion disc while the matured domains (enriched in TCR)
move to the c-SMAC where they are internalized and degraded. This has been demonstrated
by the observation that the exotic lipid lysobisphosphatidic acid (LBPA) accumulates within
or close to the c-SMAC. LBPA promotes the accumulation of the membrane bound proteins
within multilammellar endosomes. The continuous recycling may serve two purposes. It helps
to remove membrane destabilizing lipids (such as DAG) and mediates down regulation of the
T-cell activity after each encounter with APC.
On the time sequence of protein activation in immunological synapses-test of models
Before reading the following text it is recommended to have a look at Fig. 39.11. An important
albeit complicated question concerns the time sequence of switching the activity of the different
members of signaling cascades. It provides the guidlines for the development of theoretical
models of signaling cascades. The chronology of enzyme switching in immunological synapses
has been explored in elegant experiments by Houtman et al. [Houtman 2005]. They studied
the phosphorylation of the kinesis ZAP, the scaffolding protein LAT and the phospholipase-γ
(PLC-γ). The present model asserts that ZAP is activated by binding to phosphorylated ζ-chains
of the CD3-coreceptor. It catalyzes then the phosphorylation of several binding sites of the
integral membrane protein LAT. This scaffolding protein serves as docking station for several
effector proteins which are activated if the docking-sites are phosphorylated. One such protein
is the SLP 76 protein which triggers the activation of PLC-γ, the generator of the second
messenger lipid diacylglycerol (DAG) and the Ca-channel opener inositol-triphosphate (IP3).
PLC-γ itself is switched-on by phsphorylation of a specific tyrosine group through the tyrisin
kinase Irk which is activated by the SP76 switch (seefig 39.5).
To observe the time evolution of the phosphorylation of tyrosin groups the cells were incubated
with antibodies recognizing specific phosphorylated tyrosin groups of ZAP-70, LAT, SLP-76,
and PLC-γ. Fig 39.12 clearly shows that ZAP is activated first, while the switching of the scaf-
52

folding protein LAT is delayed by about 5sec and that of the phospholipase by ∼ 10sec.
Fig S.39.12.: Time evolution of activation of three major enzymes of immunological synapses.
39.10 Appendix 39.A
Diffusion controlled reactions in two dimensions-modified Smoluchowsky theory.
The quantitative analysis of diffusion controlled biochemical reactions in membranes is a
complex problem since the time dependent two-dimensional diffusion equation cannot be solved
analytically. Therefore it is difficult to apply the classical theory of diffusion controlled reactions
such as the Smoluchowsky theory of coagulation. Only rapid processes, such as photochemical
reactions (energy transfer and formation of excimers) or lipid diffusion can be solved with
good approximation (see Kapitel 11). On the other side, many membrane processes, such as
the formation of biochemical reaction centres by lateral phase separation are slow diffusion
controlled processes, requiring more sophisticated techniques. In detailed studies of heat
53

conduction approximate method to solve the problem have been developed which will be briefly
introduced in this appendix. [Jaeger 1940]
The classical theory of Smoluchowsky (see also [Collins 1949]) describes the process of coag-
ulation in three dimensions and is based on the following two assumptions. First, all molecules
diffusing into the reaction space (assumed to be a sphere in 3D and a cylindrical disc of radius
ρ in 2D) react, resulting in the boundary condition that c(ρ) = 0, that is the reaction space is
considered as a black hole. Second, the reactants are distributed homogeneously in the infinite
spaces, that is the number of reactants is only a function of ∆t. The classical Smolukovsky
theory can also be applied to diffusion limited enzymatic reactions, such as the IP3 generation
by PLC-γ) by assuming that the head group of the lipid is irreversibly cleaved each time a PIP2
approaches the enzyme to a distance R. The area πR2 is called the reaction area. The reaction of
the substrate (S) with the enzyme (E) is:
S + E
k+
⇔
k−
P + E
The production rate dPdt (molecules generated per sec) of IP3 can be expressed as dP
dt = k+c, where
j is the flux of molecules entering the reaction space per unit time. j has the dimension [moleculess·area ]
in 3D and [moleculess·length ] in 2D. In general the diffusive flux of molecules j(r, t) is given by
j(r, t) = D grad {c (r, t)}
(39.A1)
Where c(r.t) is the concentration of the reactant (PIP2) in the membrane. The total in-flux (di-
mension [moleculess ]) into a cylindrical reaction space of radius R is Φ2D = 2πR j, while into a
54

spherical space it would be Φ3D = 4πR2 j. For rough estimates of the diffusion limited produc-
tion rate one can assume ∇c(r) ∼ c0R , resulting in Φ2D = 2πDc0 and Φ3D = 4πPDc0 for the
molecules arriving per unit time at the surface of the reaction space. The production rates in 2D
and 3D are given by:
dP3D
dt≈ 4πR D c
anddP2D
dt≈ 2πD c
For the general situation one has to consider the diffusion of the reactants distributed over the
whole area (of the cell) towards the reaction centre. Assuming that the molecules are evenly
distributed in an isotropic membrane the on-diffusion is determined by the diffusion equation
∂C(r, t)∂t
= −D∂2 C(r, t)∂r2
(39.A.2a)
With the boundary conditions
c(r, 0) = c0 ; c(∞, t) = c0 ; c(r ≤ ρ, t) = 0
(39.A2b)
The time dependent diffusion equation can be solved analytically for three dimensions (see
[Collins 1949] for a detailed solution) but not for two dimensional systems. In a seminal
paper Razi Naqvi provided approximate solutions by modifying the classical theory of heat
conduction in 2D-systems by Jaeger and Clarke [Jaeger 1943]. The diffusion equation in the
55

two dimensional space can be solved by application of the LaPlace transformation
u(r) =
∫ ∞
0dt c(r, t) exp{−s t}
q2 =sD
(39.A3a)
By assuming circular symmetry we obtain a time independent differential equation:
d2u(r)dr2 +
1r
dudr− q2u = −
c0
D
(39.A3b)
The solution of the differential equation for u(r) is:
u =c0
s
[1 −
K0(qr)K0(qR)
]where Ko is the Bessel Function of the second kind of order zero. In order to determine the
flux Φ into the reaction space of Radius R one must form the inverse Fourier Transform of the
above equation. As shown by Jaeger and Clarke this is possible but it leads to the following
problem. The flux Φ (or j) decreases continuously with time and no stationary solution is
possible. The reason for this is that the general solution of the diffusion equation is of the form
c(r) = (Aln(r) + B). Thus, the average concentration must be infinite to obtain a steady state
solution (Naqvi 1974).
56

A way out of the above problem has been pointed out by Collins and Kimball. Based on the
classical work of Jaeger they argued that the boundary condition c(r ≤ ρt) = 0 is has to be
changed [Collins 1949] if not all molecules arriving at the reaction space undergo a reaction.
They propose to use the following boundary condition:
k cR = D(∂c∂r
)r=R
(39.4)
where the right side is equal to the flux j(r) of molecules at the surface of the reaction space.
Dimensional analysis shows that k is a reaction rate constant of dimension [k] = molecules·ms . The
equation (39.A3b) has been solved by Carslaw and Jaeger [Jaeger 1943 ] for the boundary
condition (39.4) and discussed by Naqvi. We present here only the solution for the flux Φ
(dimension molecules per unit time) into the reaction space.
Φ = 4πk c0 R I(π
2√
a−1 ;π
2√
a ;α)
(39.5a)
With
α =DR2 t
and
a = Rk
D
(39.5b)
57

Note that α and a are dimensionless times and reaction rates. With the new boundary condition,
the flux remains now finite for t → 0 . In principle the function I and thus the flux Φ can be
numerically calculated enabling the measurement of reaction rates under general conditions.
To gain insight into differences between the flux Φ in 3D and 2D we consider two limiting cases
for the Smoluchowsky boundary condition (39.A.2b). For this situation Carslaw and Jaeger
expressed the flux in terms of the following interpolation equation [Jaeger 1943]:
Φ =16π
D c0 I(0, 1;α)
This equation follows from the more general equation (39.5a) for the reaction rate k = 0 (see Eq.
(39.4)). The function I (0, 1,α) interpolates between two limiting cases we consider below:
- For small values of α ( DtR2 << 1) or small times t:
Φ ≈ 16πD c0
(
1πα
)1/2
+12−
14
(α
π
)1/2+α
8− • • •
(39.6)
If we consider only the first term (1/2) on the right side and use the boundary condition 39.4 we
obtain the following equation for the reaction rate k:
k = Φ/c0R = 8πD/R
which corresponds to the Smoluchowsky equation in 2D. Equation 39.6 predicts that the reaction
rates k are larger in 2D systems.
58

- For large values of α (corresponding to large values of Dt) one obtains the following asymptotic
equation:
Φ = 8πD c0
{1y−
γ
y2 +π2/6 − γ2
y3 + O(y4)}
(39.7)
Where γ is the Euler number: γ = 0.5772 and
y = ln{
4D tR2
}− 2γ
Considering again the boundary condition (39.4) the reaction rate k becomes
k ≈8πD/R
ln{
4D tR2
}− 2γ
For large values of α, the reaction rates decreases logarithmically with time. This can lead
to large errors if kinetic experiments are analyzed with the classical Smoluchowsky equation.
This has been clearly demonstrated for diffusivity measurements by the excimer technique (see
Kapitel 10). At molecular probe concentrations of 10% the diffusion coefficients differ by a
factor of two (see [Merkel 1994]).
To estimate the effect of dimensionality we consider the enzymatic reactions with lipids and
proteins (say TCR) as ligands. The diffusion coefficient of the lipid (say PIP2) is D ≈ 10−12 m2
s
and for protein (say TCR), D ≈ 10−14 m2
s . We then obtain for the lipid: α = 10−12
10−16 t = 104t
yielding y = 4 ln {40} − 1.1 Thus at t = 1sec y ≈ 13
59

For the protein: α = 10−14
10−16 t ≈ 102t yielding y = 2ln(10) − 1.1. Thus y ≈ 6.
This analysis shows that slow processes are slowed down in 2D systems, in contrast to the
situation for small times t < 10−4 for lipids and t < 10−2 for proteins).
We will apply the modified Smoluchowsky equation to estimate the growth rate of IS formation.
39.11 Appendix 39. B
Estimation of Binding Energies from Equilibrium Constants
Many qualitative studies of protein binding to membranes mediated by electrohydrophobic
forces have been published, while only few quantitative kinetic studies are available. Below a
method for the estimation of free energies of protein adsorption to membranes is described. We
start by considering the complex formation between two proteins.
A + B⇔ C
(1)
The energy associated with the complex formation is:
∆G = NAµA + NBµB + NCµC
(2)
60

Here Ni are number of molecules and µi the chemical potentials of the species in the water
phase. If one of the proteins is bound to membranes, µ would be its chemical potential in the
membrane phase.
At low concentrations the chemical potentials can be expressed as
µi = kBT ln νici + µst
(3),
where νi is the molecular volume of the species i, which could be equal to its Van der Waals
Eigenvolume. Note that νi ci is equal to the probability to find Ni Moles (or 6 · 1023Ni molecules)
of the species i in the volume V and ci = NiV . µst is the unknown ’standard chemical potential’. It
is a function of temperature and pressure and can only be determined empirically.
We consider now a small change of the number of molecules, say δNA(= δNB = δNC = δN)
which results in the following variation of the free energy:
∆G = (µC − µA − µB) δN
(4)
∆G is called the standard free energy change of chemical reactions. The stability condition of
thermodynamic equilibrium requires that ∆G = 0 leading to
Keq =[A] [B]
[C]=
1ν
exp{−δgkBT
}61

(5a)
With ν = νAνBνC
and δg = µA + µB − µC
Equation (5a) is a thermodynamic definition of the principle of chemical reactions which
provides a link between the equilibrium constant Keq of complex formation and the free energy
turnover
Keq =1ν
exp{−∆g(p,T )
kBT
}(6)
Keq and ∆g can be determined by measuring the chemical equilibrium constant as a function
of temperature. The parameter ν has the dimension of volume with the following meaning for
diffusion-limited reactions. If the proteins A and B encounter within a volume of the order of n
the reaction will proceed.
The energy of reaction DG can be estimated from the measured equilibrium constant according to
∆g = kBT ln{νKeq
}(7)
For the estimation of ∆g one has to consider that Keq is measured in units of [Keq] = lM = m3
1000M
(see Eq 5a). For proteins the radius of the reaction volume will typically be of the order of
R ∼ 10nm.
62

Let us consider the following example from the work of R. Stahelin et al. (J. Biol. Chem.28,
39396 (2006). For the binding of PI-3K to membranes composed of an 78:20 mixture of
SOPC and SOPS containing 2 mole% Ins(4,5)P2 a value Keq ∼ 10−9 Ml = 10−6 M
m3 was
found. The reaction volume is ν ∼ ( 4π3 )10−24m3 (for R ∼ 5nm). Therefore, δg ∼
kBTln10−24m3 · 10−6 · 6 · 1023m − 3 ∼ kBTln610−7 ∼ −7kBTln6 ∼ 12kBT . This is of the order
of the binding energy of MARCKS (c.f. table I).
39.12 Appendix 39.C Exercises:
Exercise 39.1: Estimate the critical number of IL-2/IL-2R complexes required for the T-cell
to reach the point of no return if the number of receptors initially present on the cell surface is
nIR−2R ≈ 750 and the life time of the IL-2/IL-2R complex (before it is taken up by the cells)
is t 12
= 15min. Consider further the experimental result that 50 % of the cells are triggered to
proliferate after 11h. Help: Consider the rate of IR-2R synthesis required to maintain stationary
equilibrium [Smith 2004] .
Solution: The number of receptors initially present on the cell surface is Nss = 750 Rcell . The
rate of recycling of IL-2/IL2R complexes is t 12
= 15min and is much shorter than the lifetime of
the IR-2/IR-2R complex. To maintain IL-2R at a steady state the rate of IR-2R synthesis would
have to be k = ln215 min = 4.67 · 10−2min.- According to the experiments, after 11 hours (660 min.)
of exposure 50 % of cells are triggered to undergo a cell cycle.
The mean number of triggered IL2Rs necessary for maintaining the stationary state (Nss per
cell) is: N( Rcell ) = k · Nss = 4.67 · 10−2min−1 · 750 R
cell = 35 Rcell·min · 660min = 23, 100 triggered R
cell .
Assume that the mean steady state number of IR-2R is half as large (Nss ≈ 375 Rcell ), 22 hours
would be required.
63
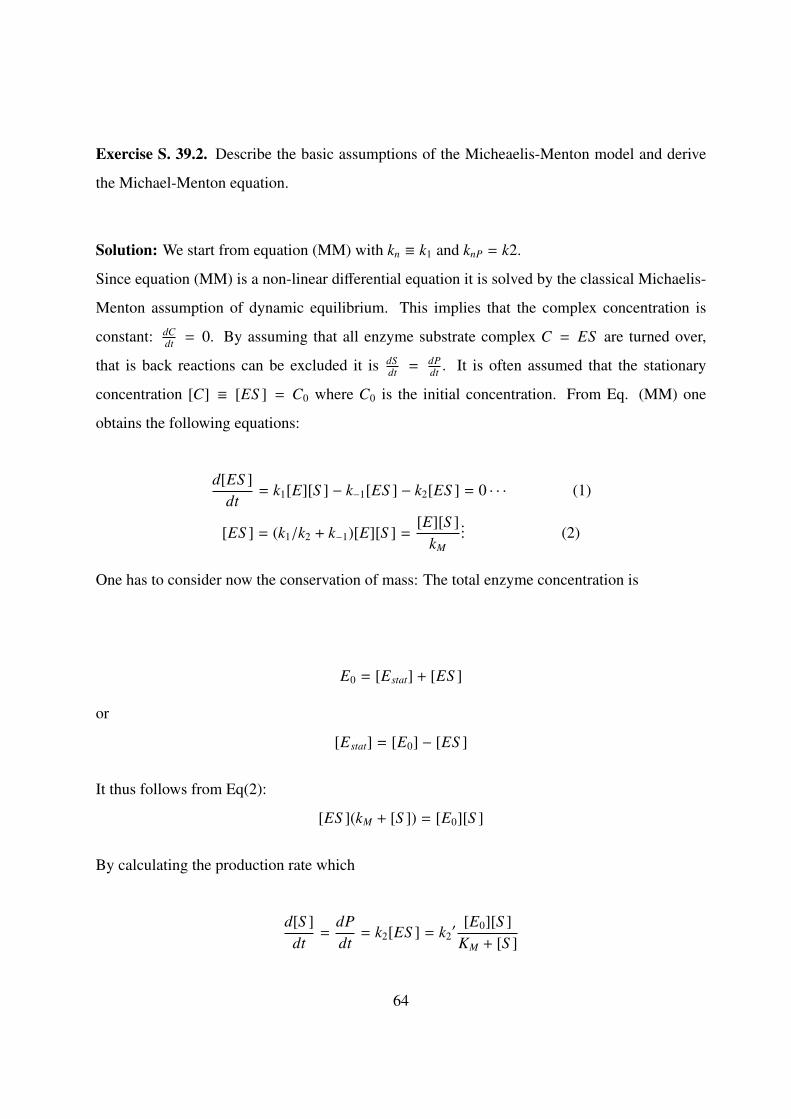
Exercise S. 39.2. Describe the basic assumptions of the Micheaelis-Menton model and derive
the Michael-Menton equation.
Solution: We start from equation (MM) with kn ≡ k1 and knP = k2.
Since equation (MM) is a non-linear differential equation it is solved by the classical Michaelis-
Menton assumption of dynamic equilibrium. This implies that the complex concentration is
constant: dCdt = 0. By assuming that all enzyme substrate complex C = ES are turned over,
that is back reactions can be excluded it is dSdt = dP
dt . It is often assumed that the stationary
concentration [C] ≡ [ES ] = C0 where C0 is the initial concentration. From Eq. (MM) one
obtains the following equations:
d[ES ]dt
= k1[E][S ] − k−1[ES ] − k2[ES ] = 0 · · · (1)
[ES ] = (k1/k2 + k−1)[E][S ] =[E][S ]
kM
... (2)
One has to consider now the conservation of mass: The total enzyme concentration is
E0 = [Estat] + [ES ]
or
[Estat] = [E0] − [ES ]
It thus follows from Eq(2):
[ES ](kM + [S ]) = [E0][S ]
By calculating the production rate which
d[S ]dt
=dPdt
= k2[ES ] = k2′ [E0][S ]KM + [S ]
64

(3)
We obtain the celebrated solution of the Michaelis Menton equation.
39.13 References
[Agrawal 1995] Agrawal, N., Linderman, J. 1995 Ca- response helper T-lymphocytes to antigen
presenting cells in a single cell assay. Biophys. J. 69 1178-1190
[Alonso 2003] Alonso, A. et al. 2003 Tyrosine phosphorylation of VHR phosphatase by
ZAP-70. Nature Immunol. 4 46-50.
[Barkai 2000] Barkai, N., and Leibler, S. (2000). Circadian clocks limited by noise. Nature 403:
267-268.
[Bhalla 1999] Bhalla, US., Iyengar, R. (1999) Emergent properties of networks of biological
signaling pathways. Science 283.: 381-386.
[Bonello 2004] Bonello, G. et al. 2004 Dynamic recruitment of the adaptor protein LAT: LAT
exists in two distinct intracellular pools and controls its own recruitment. J. Cell Science 117
1009-1016.
[Bruisma 2000] (a) Bruinsma, R., Behrisch, A., Sackmann, E. 2000 Adhesive switching of
membranes: Experiment and theory. Phys. Rev. E. 61 8984.
65

[Chen 1997] R.-H. Chen, S. Corbalan-Garcia and D. Bar-Sagi (1997) The role of the PH domain
in the signal-dependent membrane targeting of Sos. The EMBO J. 16: 1351 - 1359
[Choudhuri 2005] Choudhuri, K. et al. 2005 T-cell receptor triggering is critically dependent on
the dimensions of its peptide-MHC ligand. Nature 436 578-582
[Combs 2006] Combs, J. et al. 2006 Recruitment of dynein to the Jurkat immunological
synapse. Proc. Natl. Acad. Sci. USA 103 14883-14888
[Critchley 2008]. Critchley D, Gingras A. 2008 Talin at a glance. J. Cell Sci. 121 1345-47
[Culkien 2002] Cullen P. Lockyer, PJ. 2002 Integration of calcium and RAS signalling. Nature
Rev. Mol. Cell Biol. 3 339-348.
[Das 2000] Das. B. (2000) Control of intramolecular interactions between the pleckstrin
homology and Dbl homology domains of Vav and Sos1 regulates Rac Binding. J. Biol. Chem.
275: 5074-15081.
[Das 2009] Das, J., Ho, M., Zikherman, J. et al. 2009 Digital signaling and hysteresis character-
ize Ras activation in lymphoid cells. Cell 136 337-351
[Dolmetch 1997] Dolmetsch R, Lewis R, Goodnow C and Healy J 1997 Differential activa-
tion of transcription factors induced by Ca2+ response amplitude and duration Nature 386: 855-8
[Dustin 2005] Yokosuka, T. Sakata-Sogawa, K., Kobayashi, W. et al. 2005 Newly generated
T-cell receptor microclusters initiate and sustain T-cell activation by recruitment of ZAP-70 and
66

SLP-76. Nature Immunology 6 1253-1262.
[Dustin 2006] R. Varma, Campi, G., Tadashi,. Yokosuka, D., Takashi, S., Dustin, M. 2006.
T-cell receptor proximal signals are sustained in peripheral microclusters and terminated in the
central supramolecular activation cluster. Immunity 25 117-127
[Ebinu 1998] Ebinu JO et al. (1998) RasGRP, a Ras guanyl nucleotide- releasing protein with
calcium- and diacylglycerol-binding motifs. Science. 280: 1082-6.
[Falasca 1998]M. Falasca, M., et al. (1998) Activation of phospholipase Cγ by PI 3-kinase-
induced PH domain-mediated membrane targeting. EMBO Journal 17: 414 - 422
[Faroud 2003] Faroud, M., Zaru, R., Paule P., Müller, S,. Valitutti, S. J. 2003 Cutting edge: T
lymphocyte activation by repeated immunological synapse formation and intermittent signalling.
Immunology 171 1128-1132.
[Freedman 2006] Freedman, T.S. (2006). A Ras-induced conformational switch in the Ras
activator Son of sevenless. PNAS 103: 16692-16697.
[Freiberg 2002] Freiberg, B., Kupfer, H., Maslanik, W., Delli, J. Kappler, J., Zaller D., Kupfer,
A. 2002 Staging and resetting T cell activation in SMACs . Nature Immunology 3 911-917
(b) S. Goennenwein et al. 2003 Functional incorporation of integrins into solid supported
membranes on ultrathin films of cellulose: Impact on adhesion. Biophys. J. 85 646-655
[Groves 2001] Qi, S., Groves, T., Chakraborty. K. 2001. Synaptic pattern formation during
67

cellular recognition. Proc. Natl. Acad. Sci. USA. 98 6548-6553.
[Gundersen 1988] Gundersen G, Bulinski J. 1988 Selective stabilization of microtubules
oriented toward the direction of cell migration. Proc. Natl. Acad. Sci. USA 85 5946-5950
[Gunzer 2000 ] (a)Gunzer, M., Schaefer, A., Borgmann, S. et al. (2000) Antigen presentation
in extracellular matrix interactions of T cells with dendritic cells are dynamic, short lived, and
sequential Immunity, 13: 323-332
[Gureaskoa 2010] Gureaskoa, J. et al. (2010) Role of the histone domain in the autoinhibition
and activation of the Ras activator Son of Sevenless PNAS 107: 3430-3435
[Gunzer 2004] Gunzer, M. et al (2004) A spectrum of biophysical interaction modes between T
cells and different antigen-presenting cells during priming in 3-D collagen and in vivo. Blood
104: 2801-2809.
[Heinrich 2006] Heinrich, D., Sackmann, E. 2006 Ative mechanical stabilisation of the
viscoplastic intracellular space of Dictyostelia cells by microtubule actin cross talk. Acta
Biomaterialia 2: 619-631
[Hendrickson 2008] Hendrickson S. et al. (2008) T-cell sensing of antigen dose governs
interactive behaviour with dendritic cells and set the threshold for T-cell activation. Nature
Immunology 9:282 291
[Houtman 2005] Houtman, JR. et al (2005) Early Phosphorylation Kinetics of Proteins Involved
in Proximal TCR-Mediated Signaling Pathways. J. of Immunology. 175: 2449-2458
68

[Kaverina 2002] Kaverina I, Krylyshkina O, Small, V. 2002 Regulation of substrate adhesion
dynamics during cell motility. Internat. J. Biochem. Cell Biol. 34 746-61
[Khoöodenko 2002] Kholodenko, B.N., et al. (2002) Untangling the wires: a strategy to trace
functional interactions in signaling and gene networks. Proc. Natl. Acad. Sci. USA 99:
12841-12846.
[Lee 2008]( a) Lee, S., Hori, Y., Groves, J., Dustin, M., Chakraborty A. K. 2002. Correlation of
a dynamic model for immunological synapse formation with effector functions: two pathways
to synapse formation. Trends Immunol. 23 492-499.
(b) Lee, K-H., Holdorf, AD., Dustin, M., Chan, A., Allen, P., Shaw, A. 2003 T Cell Receptor
Signaling Precedes Immunological Synapse Formation. Science 302 1218 - 1222
[Lodish 2007]. Lodish, H. et al. 2007 Molecular Cell Biology 6th edition. W.H. Freeman & Co.
New York 2007.
[Lorenzo 2000] Lorenzo, P. (2000) The Guanine Nucleotide Exchange Factor RasGRP Is a
High-Affinity Target for Diacylglycerol and Phorbol Esters. Mol. Pharmacology 57: 840-846.
[Macian 2004] Macián, F. et al. (2004). T-cell anergy. Curr Opin Immunol. 16:209-16.
[Macian 2005](a) Macian, F. 2005 NFAT proteins: key regulators of T-cell development and
function. Nature Rev. Immunology 5 472-484.
69

[Matsumo 2004] Matsuo, H. et al (2004) Role of LBPA and Alix in multivesicular liposome
formation and endosome organization. Science 303: 531-534.
[Monks 1998] Monks, CR., Freiberg BA. Three-dimensional segregation of supramolecular
activation clusters in T-cells Nature: 82-86
[Sackmann 2011)] Sackmann, E. (2011) Quantal concept of T-cell activation: adhesion domains
as immunological synapses New Journal of Physics 13: 065013
[Sackmann 2006] a) E. Sackmann, 2006 Thermo-elasticity and adhesion as regulators of cell
membrane architecture and function. J. Phys. Condens. Matter 18 R785-R825.
(b) Smith, A., Sackmann, E., 2009 Progress in Mimetic Studies of Cell Adhesion and the
Mechanosensing. ChemPhysChem 10 66- 78
[Simson 1998] R. Simson et al. 1998 Membrane bending modulus and adhesion energy of
wild-type and mutant cells of Dictyostelium lacking lalin or cortexillins. Biophys. J. 74 514-522
[Smith 2006] (a) Smith KA 2006 The quantal theory of immunity. Cell Res. 16: 11-9
(b) Smith KA. The quantal theory of how the immune system discriminates between ’self and
non-self. Medical Immunology 2004, (Open Access) 3:3
[Soisson 1998] Soisson, S. M., et al. (1998). Crystal structure of the Dbl and pleckstrin
homology domains from the human son of sevenless protein. Cell 95: 259-268.
70

[Springer 1990] Springer TA. 1990 Adhesion receptors of the immune system. Nature. 346
425-34.
[Stinchcombe 2006] Stinchcombe, J., Majorovits E., Bossi, G., Fuller S. and Griffiths, G. 2006
Centrosome polarization delivers secretory granules to the immunological synapse Nature 443
462-465
[Pierres 2008] Pierres A, Benoliel A, Touchard D, Bongrand P. 2008. How Cells tiptoe on
adhesive surfaces before sticking. Biophys. J. 94 4114-4122.
[Reister-Gottfried 2008] Reister-Gottfried, E., Sengupta, K., Lorz, B., et al. (2008) Dynamics of
specific vesicle-substrate adhesion: from local events to global dynamics. Phys. Rev. Letters
101: 208103.
[Weiklc2004] Weikl, Th., Lipowsky, R. 2004 Pattern formation during T-cell activation.
Biophys. J. 87 3665-3578.
[Wuelfling 1998] Wuelfling, Ch., Ch., Sjaastad, M., Davis, M. 1998 Visualizing the dynamics of
T cell activation: Intracellular adhesion molecule ICAM-1 migrates rapidly to the T-cell/B cell
interface and acts to sustain calcium levels Proc. Natl. Acad. Sci. USA. 95 6302-6307
[Yadav 2010] Yadav, KK. (2010) Allosteric gating of Son of sevenless (SOS) activity by the
histone domain. PNAS. 107: 3436-3440.
[Zhang 1998] Zhang, W., Sloan-Lancaster, J., Kitchen, J., Trible, RP., Samelson, LE. 1998 LAT:
the ZAP-70 tyrosine kinase substrate that links T cell receptor to cellular activation. Cell: 92
71

83-92.
[Zimmermann 2010] Zimmermann, L. et al. 2010 Direct observation and quantitative analysis
of Lck exchange between plasma membrane and cytosol in living cells J. Biol. Chem. 285
6063-6070
39.14 References A
[Collins 1949] Collins, FC., Kimball J. (1949) Diffusion controlled reaction rates. Colloid
Science 4: 425-437.
[Jaeger 1943] (a) Jaeger, JC., Clarke, M. (1943) Proc. Roy. Soc. Edinburgh A61:229. (b)
Carslaw, HS. Jaeger, JC. (1940) Proc. London Math. Society. 46:361
72