Embed Size (px)
Citation preview

BIOREACTOR LANDFILLS: BIOREACTOR LANDFILLS: GEOTECHNICAL ASPECTS OF GEOTECHNICAL ASPECTS OF
STABILITY EVALUATIONSTABILITY EVALUATION
Presented byPresented by
James LawJames LawSCS EngineersSCS Engineers
Master Class ISWA Congress 2009Master Class ISWA Congress 2009LisbonLisbon
10 October 200910 October 2009

PRESENTATION OVERVIEWPRESENTATION OVERVIEWLandfill Slope Stability OverviewLandfill Slope Stability Overview
Typical MSW Typical MSW GeotechnicsGeotechnics & Shear strengths& Shear strengths
Bioreactor LandfillBioreactor Landfill
MSW Material PropertiesMSW Material Properties
MSW Moisture Content MSW Moisture Content
Impact on StabilityImpact on Stability
Recommendations and ConclusionsRecommendations and Conclusions
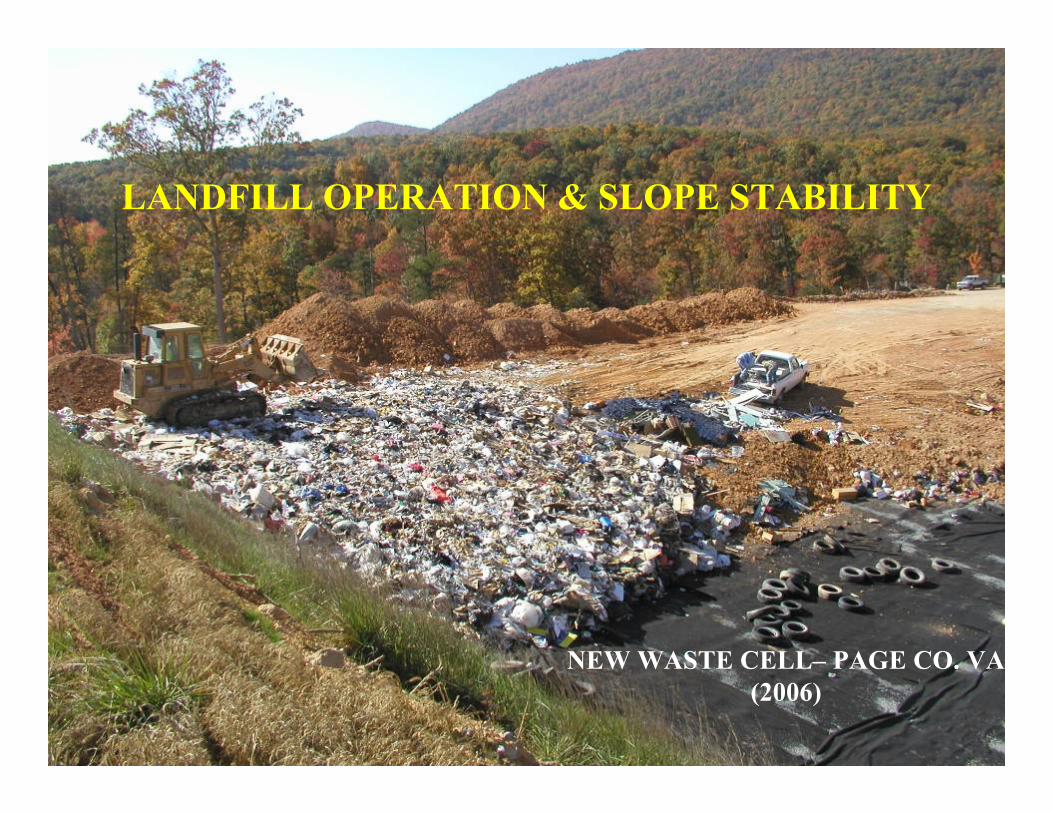
LANDFILL OPERATION & SLOPE STABILITY
NEW WASTE CELL– PAGE CO. VA (2006)

Principal Stability Considerationsfor Modern Sanitary Landfills
Analyze critical sideslopes for stability at 3 stages:(1) construction, (2) operations and (3) final load conditions
1. Excavation slopes2. Interim waste slopes3. Exterior (Final) slopes
a. Deep seatedb. Veneer
Waste settlement
Foundation (subgrade)
Final cover
Bottom liner1. Excavation
3b. Veneer Stability3b. Veneer Stability3a. Deep Seated Stability3a. Deep Seated Stability
2. Interim Slopes

Critical Shear Surfaces
STABILITY MODELING:Limit equilibrium models(e.g., PCSTABL, UTEXAS3, XSTABL, etc.)Drained and Undrained conditions (pore pressures)Other Loadings (equipment)
FACTORS OF SAFETY:FS > 1.5 for Static final (peak)FS > 1.3 for Static interim FS > 1.0 for Seismic (peak)Or, deformation analysis (e.g., Newmark’s)
Foundation (subgrade)
Veneer StabilityVeneer StabilityDeep Seated Stability Deep Seated Stability (Circular)(Circular)
Deep Seated Stability Deep Seated Stability (Block)(Block)
Final cover
WASTE
Bottom liner

Veneer Stability Models
Infinite Slope Finite Slope

Veneer Instability During Closure
Following Heavy Rain (aka. Ernesto)
Leachate Recirculation Facility
24 inches of soil cover
Soil erosion…
LFG buildup under liner….gas bubbles

Global StabilityTwoTwo--dimensional Limit Equilibrium modelsdimensional Limit Equilibrium models
Computer models based on Spencer, Bishop, Janbu, et alComputer models based on Spencer, Bishop, Janbu, et alMethod of slicesMethod of slices33--D modelsD models
Search for shear surface with lowest Search for shear surface with lowest ““Factor of SafetyFactor of Safety”” (FS)(FS)StaticStaticSeismic (a= xSeismic (a= x·· g)g)
Key Material propertiesKey Material propertiesWasteWaste friction, cohesion & density friction, cohesion & density waste & operation specificwaste & operation specificSoilSoil shear strengths & density shear strengths & density site specificsite specificSoil/Geosynthetic interfaceSoil/Geosynthetic interface strength strength material specificmaterial specificLiquid/Liquid/leachateleachate levels levels
Waste
Soil

The Classical Factor of SafetyActual Shear Strength, Actual Shear Strength, ΤΤactact
Shear Strength for Equilibrium, Shear Strength for Equilibrium, ΤΤeqeq
= = [[CCactact + (N+ (N--μμ))•• tan(tan(ØØactact)])] ÷÷ [[CCeqeq + (N+ (N--μμ))•• tan(tan(ØØeqeq))]]ØØ=friction angle=friction angleC=cohesion (equivalent)C=cohesion (equivalent)N=normal stress and N=normal stress and μμ=pore pressure=pore pressure
FS=1.5 means 50% more strength than required for equilibriumFS=1.5 means 50% more strength than required for equilibriumFS=1.2 means 20% FS=1.2 means 20% ““
FS =FS =Sh
ear S
tres
s Peak Strength
Shear Displacement
Residual Strength
[ [
FS FS

(Hiriya Landfill, Tel Aviv, 2002)
MSW STRENGTH BASED ON TESTS
& OBSERVATIONS
Non-Bioreactor LFs

Waste Shear Strength:Assume Mohr – Coulomb Behavior (bi-linear) like a compressible soil
Friction equivalent, ǾCohesion equivalent, CVaries with
Waste typeCompactionLiquids additionsDaily coverDensityMoisture contentAge, time-dependent
Heterogeneous, anisotropic, changes with time
C
N = Normal StressΤ=
Shea
r Str
engt
h
Ǿ
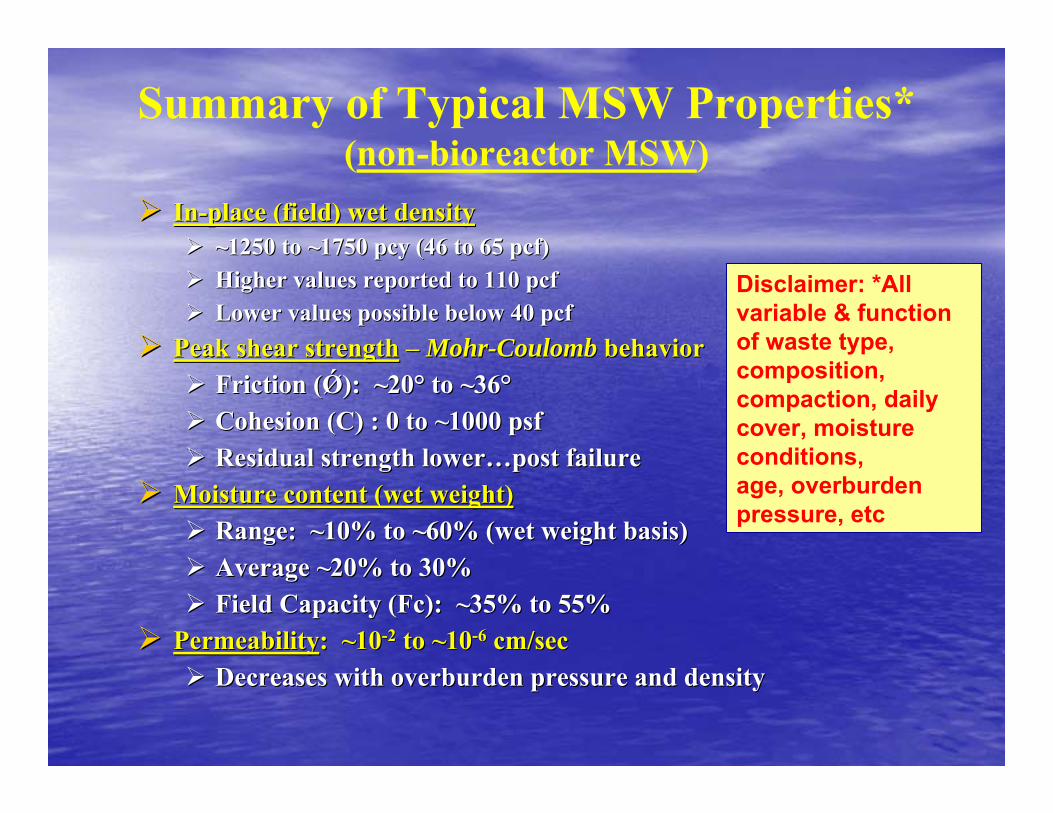
Summary of Typical MSW Properties*(non-bioreactor MSW)
InIn--place (field) wet densityplace (field) wet density~1250 to ~1750 pcy (46 to 65 ~1250 to ~1750 pcy (46 to 65 pcfpcf))Higher values reported to 110 Higher values reported to 110 pcfpcfLower values possible below 40 Lower values possible below 40 pcfpcf
Peak shear strengthPeak shear strength –– MohrMohr--CoulombCoulomb behaviorbehaviorFriction (Friction (ǾǾ): ~20): ~20°° to ~36to ~36°°Cohesion (C) : 0 to ~1000 psf Cohesion (C) : 0 to ~1000 psf Residual strength lowerResidual strength lower……post failure post failure
Moisture content (wet weight)Moisture content (wet weight)Range: ~10% to ~60% (wet weight basis)Range: ~10% to ~60% (wet weight basis)Average ~20% to 30%Average ~20% to 30%Field Capacity (Field Capacity (FcFc): ~35% to 55%): ~35% to 55%
PermeabilityPermeability: ~10: ~10--22 to ~10to ~10--66 cm/seccm/secDecreases with overburden pressure and densityDecreases with overburden pressure and density
Disclaimer: *All variable & function of waste type, composition, compaction, daily cover, moisture conditions,age, overburden pressure, etc

WET WASTE (~5 m)
DRY TO MOIST WASTE (~1 m)
Relatively Dry, Partially
Decomposed Non-Bioreactor
MSW

WET TO SATURATED WASTE (NEAR LEACHATE LEVELS)
Relatively Wet, Well Decomposed Non-Bioreactor
MSW

MSW Shear Strength “Envelope”(Singh & Murphy, 1990)
Rumpke LF Slope Failure

FS~1.05-1.10**5% to 10% more shear strength than needed for stability
0.67
1.0
1.2
1.0
MSW is strong and can stand on steep slopes…..

Hiriya Landfill Slope Failure (1997)
Waste Mass Slippage
…..until there’s too much water.
Good Reference: Koerner & Soong, “Stability Assessment of Ten Large Landfill Failures,” 2000

MSW Strength Back Calculation using PCSTABL
Circular Shear Surface
BACK-CALCULATED MSW PEAK SHEAR
STRENGTH:
Ǿ=33°C=167 psf
PCSTABL5M MODEL
SECTION AA - HIRIYA

Hiriya MSW vs. Recommended Range
Hiriya, 2002
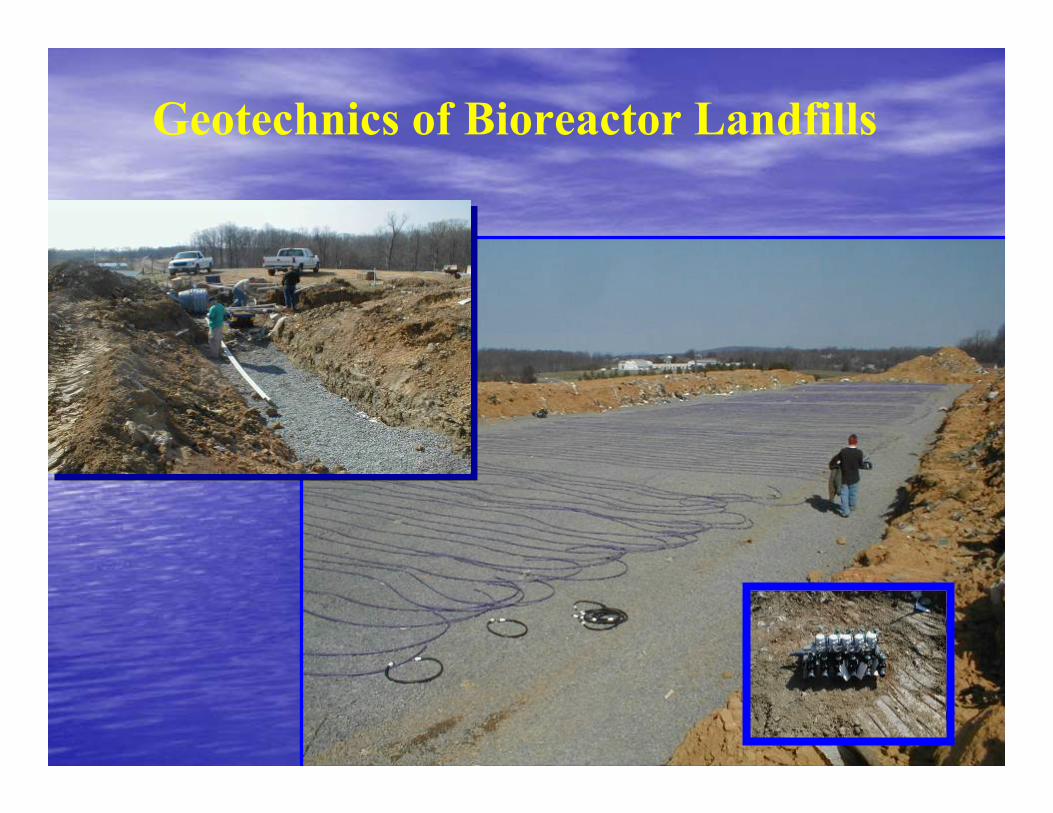
Geotechnics of Bioreactor Landfills

Leachate Recirculation System - Phase 2
RECIRCULATION PIPING
HORIZONTAL COLLECTORS
LFG COLLECTION SYSTEM
EXTRACTION WELLS
STORAGE TANK/PUMP

Landfill Sections
Phase 3 and 4 Installation
Phase 1 and 2 Installation
RECIRCULATION PIPING
HORIZONTAL COLLECTORS

Definitions of Moisture Content
1. Volumetric = 1. Volumetric = WWvolvol = Vol. Liquid = Vol. Liquid ÷÷Vol. WasteVol. Waste•• liquid balance models (e.g., HELP)liquid balance models (e.g., HELP)
2. Gravimetric = Wt. Liquid 2. Gravimetric = Wt. Liquid ÷÷Wt. Waste*Wt. Waste*2A. 2A. WWdrydry==““DryDry”” Weight Basis*Weight Basis*
•• geotechnical applications; constitutive relationship geotechnical applications; constitutive relationship in soil mechanicsin soil mechanics
OROR2B. 2B. WWwetwet= = ““WetWet”” Weight Basis*Weight Basis*
•• Waste water applicationsWaste water applications•• Default for bioreactorsDefault for bioreactors

Compare the Methods•• Initial Assumptions:Initial Assumptions:
–– Dry waste density = 800 Dry waste density = 800 pcypcy–– Liquid contentLiquid content = 400 = 400 pcypcy–– Wet waste density = 800+400Wet waste density = 800+400 = 1200 = 1200 pcypcy
33.0%33.0%=400/1200=400/12002B. Wet Weight, 2B. Wet Weight, WWwetwet
50.0%50.0%=400/800=400/8002A. Dry Weight ,2A. Dry Weight ,WWdrydry
23.7%23.7%=400/(62.4*27)=400/(62.4*27)1. Volumetric, 1. Volumetric, WWvolvol
ResultResultCalculationCalculationMoisture Content Moisture Content BasisBasis
Air (voids)
Liquid
Solid Waste
1 Cubic Yard:
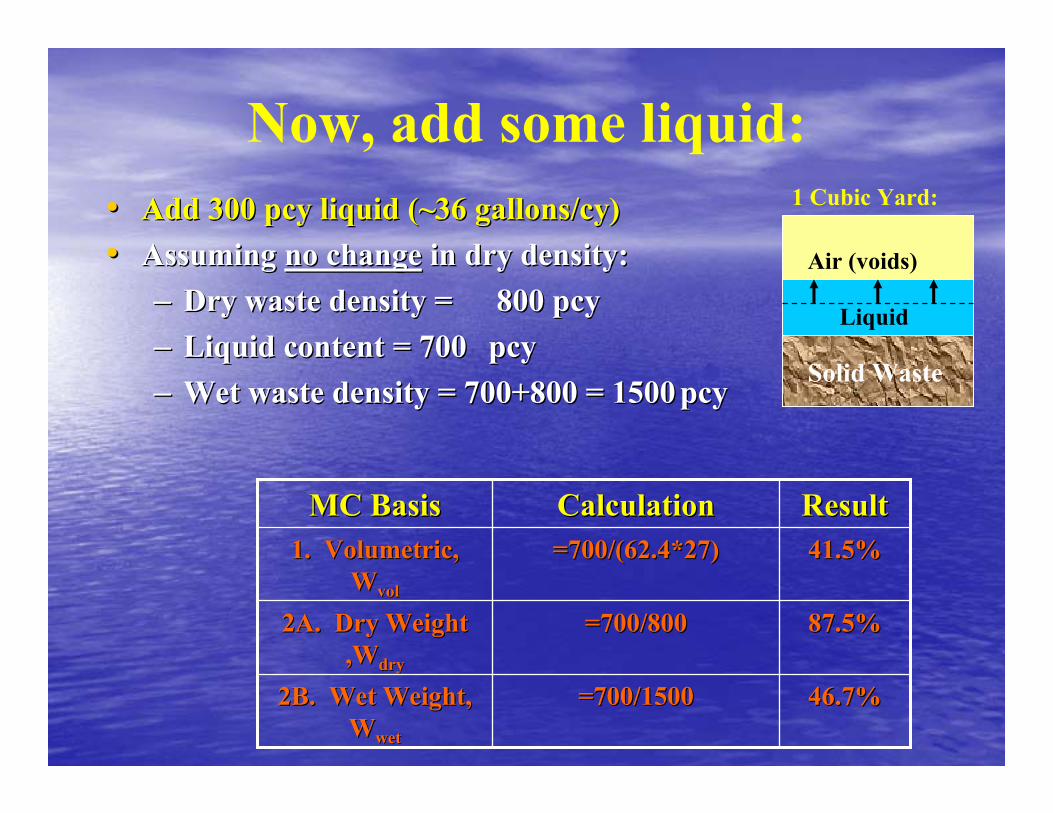
Now, add some liquid:•• Add 300 Add 300 pcypcy liquid (~36 gallons/cy)liquid (~36 gallons/cy)•• Assuming Assuming no changeno change in dry density:in dry density:
–– Dry waste density =Dry waste density = 800 800 pcypcy–– Liquid content Liquid content = 700= 700 pcypcy–– Wet waste density = 700+800 = 1500Wet waste density = 700+800 = 1500 pcypcy
46.7%46.7%=700/1500=700/15002B. Wet Weight, 2B. Wet Weight, WWwetwet
87.5%87.5%=700/800=700/8002A. Dry Weight 2A. Dry Weight ,,WWdrydry
41.5%41.5%=700/(62.4*27)=700/(62.4*27)1. Volumetric, 1. Volumetric, WWvolvol
ResultResultCalculationCalculationMC BasisMC Basis
Air (voids)
Solid Waste
1 Cubic Yard:
Liquid
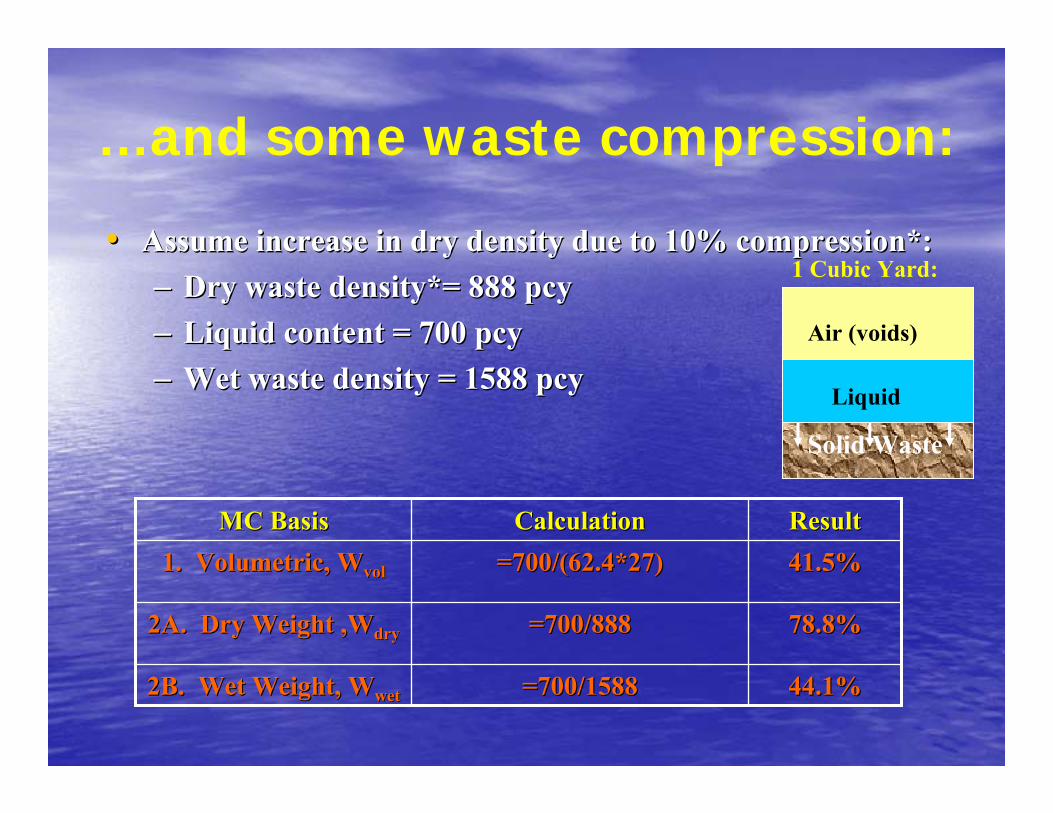
…and some waste compression:
•• Assume increase in dry density due to 10% compression*:Assume increase in dry density due to 10% compression*:–– Dry waste density*= 888 Dry waste density*= 888 pcypcy–– Liquid content = 700 Liquid content = 700 pcypcy–– Wet waste density = 1588 Wet waste density = 1588 pcypcy
44.1%44.1%=700/1588=700/15882B. Wet Weight, 2B. Wet Weight, WWwetwet
78.8%78.8%=700/888=700/8882A. Dry Weight ,2A. Dry Weight ,WWdrydry
41.5%41.5%=700/(62.4*27)=700/(62.4*27)1. Volumetric, 1. Volumetric, WWvolvol
ResultResultCalculationCalculationMC BasisMC Basis
Air (voids)
Solid Waste
1 Cubic Yard:
Liquid

0%
10%
20%
30%
40%
50%
60%
70%
80%
90%
0% 10% 20% 30% 40% 50% 60% 70% 80% 90% 100%
Moisture Content by Dry Wt.
Moi
stur
e Co
nten
t by
Wet
Wt a
nd V
olum
eMoisture Content - Wet Basis %Moisture Content - Volume Basis %
Wet Waste density = 1400 pcy
Wwet= 40%
Wdry= 66.6%
Wvol= 55.3%
0%
10%
20%
30%
40%
50%
60%
70%
0% 10% 20% 30% 40% 50% 60% 70% 80% 90% 100%
Moisture Content by Dry Wt.
Moi
stur
e C
onte
nt b
y W
et W
t and
Vol
ume
Moisture Content - Wet Basis %Moisture Content - Volume Basis %
Wet Waste density = 1000 pcy
Wwet= 40%
Wdry= 66.6%
Wvol= 39.5%
MOISTURE CONTENT COMPARISON CHARTS

Field Capacity (Fc) of MSW
•• FcFc = = ““moisture contentmoisture content”” that waste will store that waste will store within pores by capillary stress; less than within pores by capillary stress; less than saturationsaturation–– ““one drop in, one drop outone drop in, one drop out””–– FcFc influenced by waste composition, age, density and influenced by waste composition, age, density and
porosityporosity–– Reported Reported FcFc values (volumetric basis): 15% to 44%values (volumetric basis): 15% to 44%
Q: So, what does Q: So, what does FcFc = 40% really mean?= 40% really mean?A: It depends on how you calculate it.A: It depends on how you calculate it.

How Many Gallons Should We Add?•• Assume:Assume:
–– 5 acre cell, 30 feet of waste (average depth)5 acre cell, 30 feet of waste (average depth)•• 242,000 cy waste mass242,000 cy waste mass
–– 200 200 pcypcy initialinitial liquid contentliquid content–– Wet (field) density of 1000 Wet (field) density of 1000 pcypcy–– Calculate liquid needed to achieve Calculate liquid needed to achieve ““40%40%”” for each for each
MC basis*MC basis*
9,670,000 gal (40 9,670,000 gal (40 gpcygpcy))40%40%200 200 pcypcy(20%)(20%)
2B. Wet Weight, 2B. Wet Weight, WWwetwet
3,481,000 gal (14 3,481,000 gal (14 gpcygpcy))40%40%200 200 pcypcy(25%)(25%)
2A. Dry Weight 2A. Dry Weight ,,WWdrydry
13,749,000 gal (57 13,749,000 gal (57 gpcygpcy))40%40%200 200 pcypcy(12%)(12%)
1. Volumetric, 1. Volumetric, WWvolvol
Water To Be AddedWater To Be AddedFinal* Final* Initial Initial MC BasisMC Basis

Points to Ponder•• Read literature carefully; define termsRead literature carefully; define terms•• Numerical differences between moisture content Numerical differences between moisture content
calculation methods are calculation methods are significantsignificant–– More liquid needed (allowed) to reach 40% More liquid needed (allowed) to reach 40% ““wet weightwet weight””
than 40% than 40% ““dry weightdry weight””•• Maintain max. 30 cm hydraulic head on liner per Maintain max. 30 cm hydraulic head on liner per
Subtitle D (check via H.E.L.P. Model), avoid slopes Subtitle D (check via H.E.L.P. Model), avoid slopes and perched zonesand perched zones
••Reference: Reference: ““Retention of Free Liquids in Landfills Retention of Free Liquids in Landfills Undergoing Vertical Expansion,Undergoing Vertical Expansion,”” ZornbergZornberg, et al, , et al, ASCE ASCE GeotechGeotech. Journal, July, 1999). Journal, July, 1999)

In Situ (wet) Waste Density* will increaseIn Situ (wet) Waste Density* will increaseIncreased moisture contentIncreased moisture content……...more on this later...more on this laterCompression or settlement from 5% to 30% (Sowers, 1973)Compression or settlement from 5% to 30% (Sowers, 1973)
Raveling (particle reRaveling (particle re--orientation)orientation)Accelerated decomposition of organic componentsAccelerated decomposition of organic components
Waste shear strength (Waste shear strength (ΤΤ) will change) will changeΤΤ = C + (= C + (NN--μμ))··tan tan ǾǾ
C = C = ““cohesioncohesion”…”…actually itactually it’’s more like internal s more like internal reinforcement reinforcement ǾǾ = internal friction angle= internal friction angleN = normal (overburden) stressN = normal (overburden) stressμμ = pore pressure (if any)= pore pressure (if any)
Key Q: Does Waste get stronger? weaker? the same? Key Q: Does Waste get stronger? weaker? the same?
Bioreactor Waste Property Changes:

In Situ Waste Density:
γwet = = inin--situ density (not airspace utilization)situ density (not airspace utilization)
Increases with depth (overburden)Increases with depth (overburden)++
““ with compaction effortwith compaction effort++
““ with soil daily coverwith soil daily cover++
““ with time and settlementwith time and settlement++
““ with moisture content additionwith moisture content addition
Cumulative effects are significantCumulative effects are significant~40% to ~70% increase possible~40% to ~70% increase possible
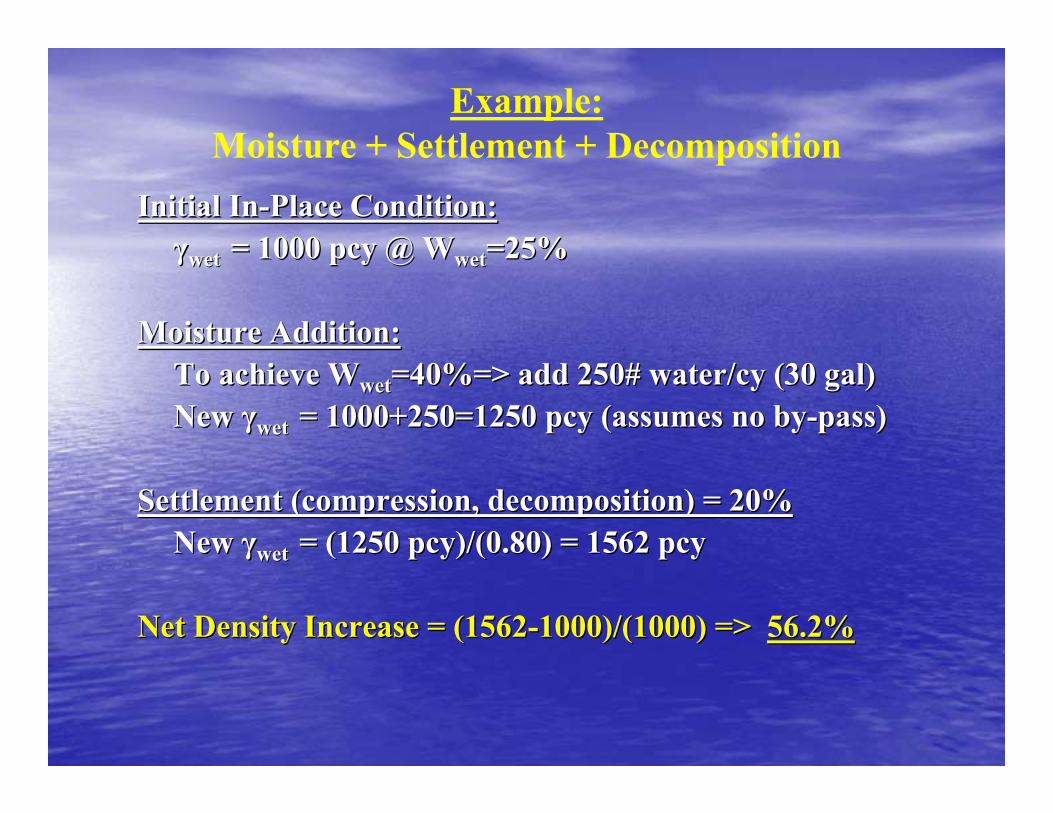
Example:Moisture + Settlement + Decomposition
Initial InInitial In--Place Condition:Place Condition:γγwet wet = 1000 = 1000 pcypcy @ @ WWwetwet=25%=25%
Moisture Addition:Moisture Addition:To achieve To achieve WWwetwet=40%=> add 250# water/cy (30 gal)=40%=> add 250# water/cy (30 gal)New New γγwet wet = 1000+250=1250 = 1000+250=1250 pcypcy (assumes no by(assumes no by--pass)pass)
Settlement (compression, decomposition) = 20%Settlement (compression, decomposition) = 20%New New γγwet wet = (1250 pcy)/(0.80) = 1562 = (1250 pcy)/(0.80) = 1562 pcypcy
Net Density Increase = (1562Net Density Increase = (1562--1000)/(1000) => 1000)/(1000) => 56.2%56.2%

Bioreactor Waste Shear Strength :
Testing evolvingLaboratory tests on processes samples
Large Triaxial cells – difficult and expensiveDirect simple shear boxes (6”x6” to 12”x12”)Waste particles are large compared to testing devices
Field tests – few reported; site specificVane shear, plate loadingPenetration testing (SPT and Cone)
Forensic stability analysisBack-calculation of Ø and CFrom slope failures (known conditions similar to bioreacted waste)
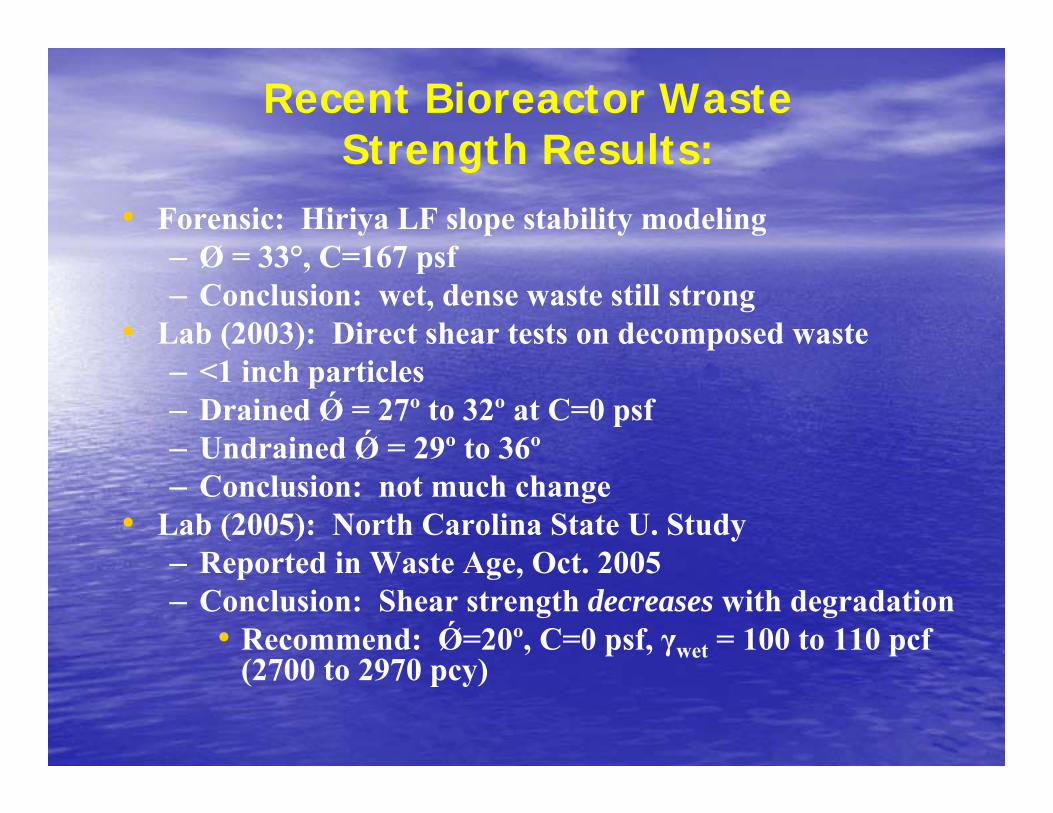
Recent Bioreactor Waste Strength Results:
• Forensic: Hiriya LF slope stability modeling– Ø = 33°, C=167 psf– Conclusion: wet, dense waste still strong
• Lab (2003): Direct shear tests on decomposed waste– <1 inch particles– Drained Ǿ = 27º to 32º at C=0 psf– Undrained Ǿ = 29º to 36º– Conclusion: not much change
• Lab (2005): North Carolina State U. Study– Reported in Waste Age, Oct. 2005– Conclusion: Shear strength decreases with degradation
• Recommend: Ǿ=20º, C=0 psf, γwet = 100 to 110 pcf(2700 to 2970 pcy)

Key A to Key Q:Based on review of available test data and on the performance ofbioreactor landfills, it is likely that controlled bioreacted waste maintains a similar shear strength to non-bioreacted waste. The shear strength gained from increased density (lower void ratio, higher internal friction, and improved packing) may be offset bythe increase in moisture content and decomposition of organic components that would tend to lower shear strength. Under some circumstances bioreacted MSW may become weaker than non-bioreacted MSW including highly organic and well decomposed waste, very wet to saturated waste, or waste that is bioreactedwithout proper controls. Predicting a significant shear strength increase would not be considered conservative without substantial evidence, while predicting a significant decrease would be potentially over-conservative. The designer should select MSW strength values based on specific waste composition, placement and operation methods and considering the margin for error defined by Factor of Safety.

How Sensitive is FS to Shear Strength?
LAYER
BioType: DENSITY
O III FRICTION
O III COHESION
O III Upper (newest)
45 pcf 79 pcf 26º 18º 200 psf 40 psf
Middle (average)
55 pcf 96 pcf 30º 22º 250 psf 50 psf
Lower (oldest)
65 pcf 114 pcf 34º 26º 300 psf 60 psf
Foundation (subgrade)
Bottom liner
Upper (newest)
Middle (average)
Lower (oldest)
31
2%
5%
140 f
eet

Bioreactor “Types” Used on Sensitivity Model
75%
50%
25%
0%
Density Increase
Heavy recirculation; at Fc field capacity
Moderate, controlled recirculation(below field capacity)
Limited or intermittent recirculation
Baseline; non-bioreactor
General Description “TYPE”
III
II
I
0

Summary for Circular Failure
TYPE BASE LINE
Δ∅=2° ΔC=40-60 psf
Δ∅=4° ΔC=80-120 psf
Δ∅=6° ΔC=120-180 psf
Δ∅=8°ΔC=160-240 psf
O 2.88 2.59 2.26 1.95 1.52
I 2.74 2.46 2.17 1.89 1.47
II 2.66 2.38 2.11 1.84 1.43
III 2.59 2.33 2.07 1.78 1.39

Summary for Block Failure(smooth liner: Interface Ǿ=8º)
TYPE BASE LINE
Δ∅=2° ΔC=40-60 psf
Δ∅=4° ΔC=80-120 psf
Δ∅=6° ΔC=120-180 psf
Δ∅=8°ΔC=160-240 psf
O 1.59 1.51 1.43 1.35 1.26
I 1.55 1.48 1.40 1.33 1.24
II 1.52 1.45 1.38 1.31 1.23
III 1.50 1.43 1.38 1.30 1.22
*bioreactor retrofits with smooth liners (low interface friction)have higher potential for instability

Based on all the above….in Design:FS>1.5 is achievable with proper design and operations
FS<1.5 possible for bioreacted wasteselect FS values based on risk and sensitivity
Consider Block and Circular failure modes
Waste shear strength is the most critical parameter and will change over time
Waste density increases are significant (40% to 70% or more), but have limited impact on FS compared to shear strength
Calculate liquids additions carefully and limit to below Fc and prevent pore pressure build-up
RECOMMENDATIONS

Based on all the above….in Operations:
• Develop and follow an operations plan based on design criteria and monitor liquids, sludges or other additions continuously
• Keep liquids injection away from slopes (outside shear surfaces)
RECOMMENDATIONS
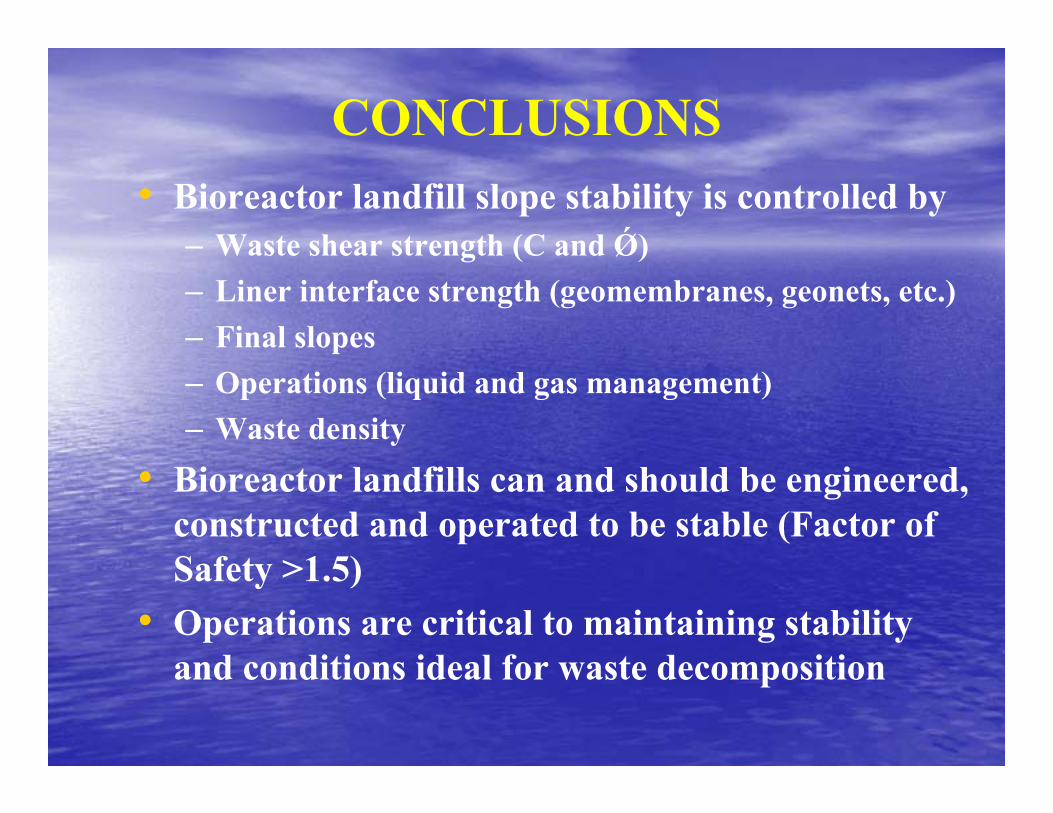
CONCLUSIONS• Bioreactor landfill slope stability is controlled by
– Waste shear strength (C and Ǿ)– Liner interface strength (geomembranes, geonets, etc.)– Final slopes– Operations (liquid and gas management)– Waste density
• Bioreactor landfills can and should be engineered, constructed and operated to be stable (Factor of Safety >1.5)
• Operations are critical to maintaining stability and conditions ideal for waste decomposition

QUESTIONS AND COMMENTSQUESTIONS AND COMMENTS