Embed Size (px)
Citation preview
Bios 101 Lecture 6: Test of Significance
Shankar Viswanathan, DrPHDivision of Biostatistics, DEPHDecember 6, 2011
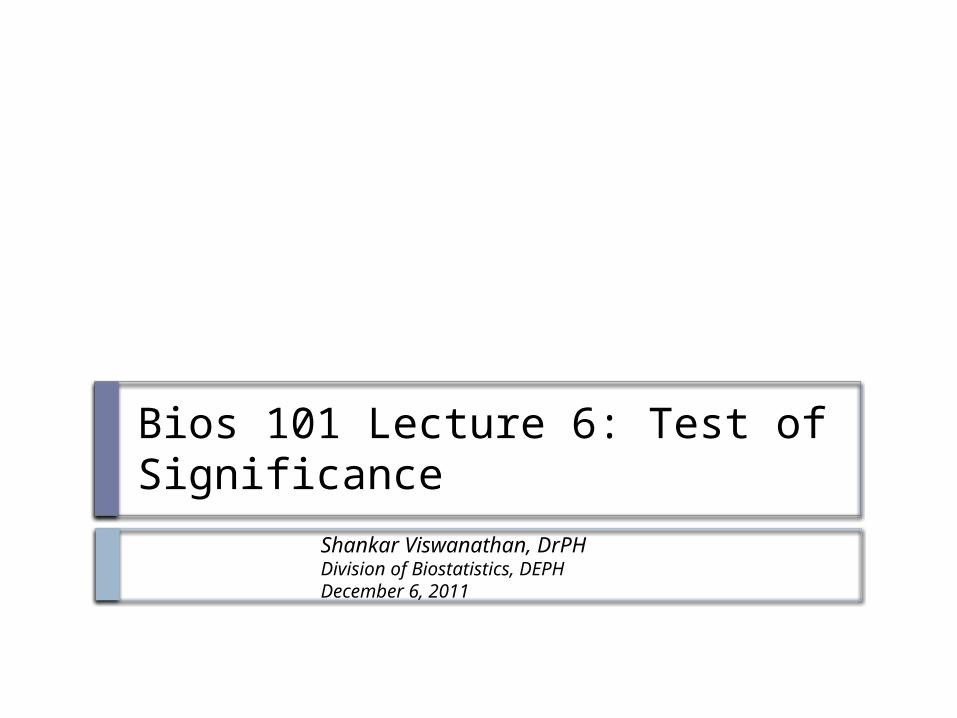
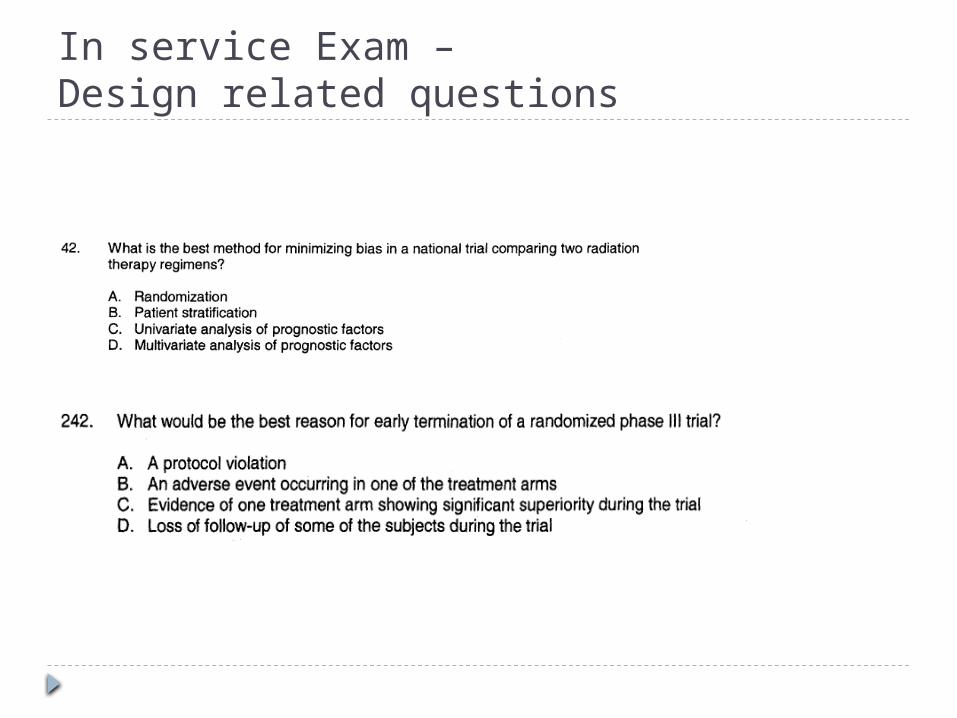
In service Exam –Design related questions

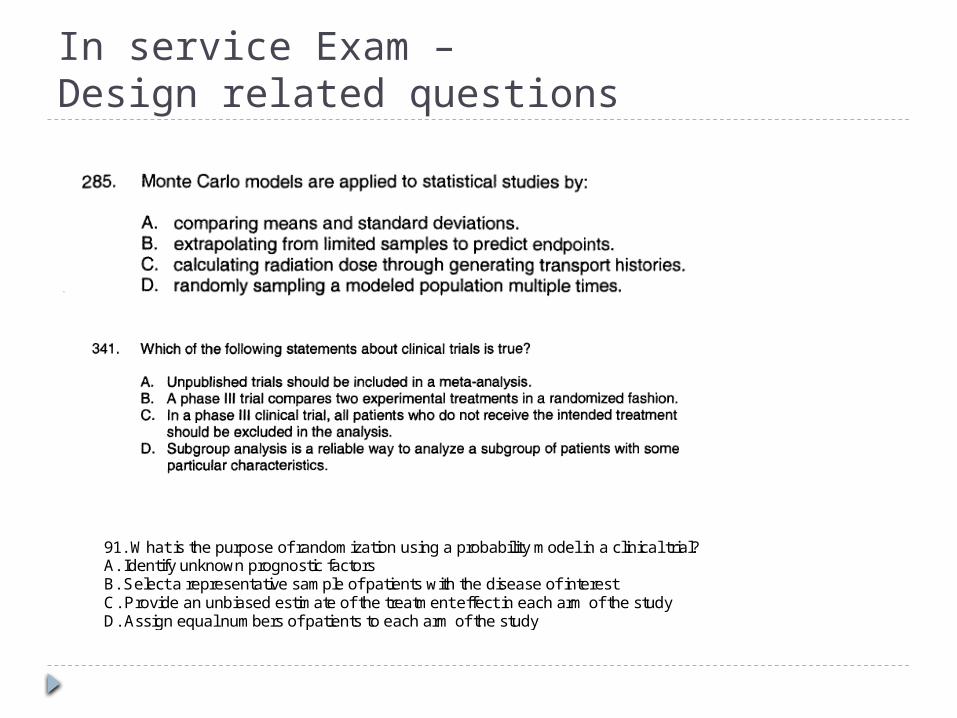
In service Exam –Design related questions

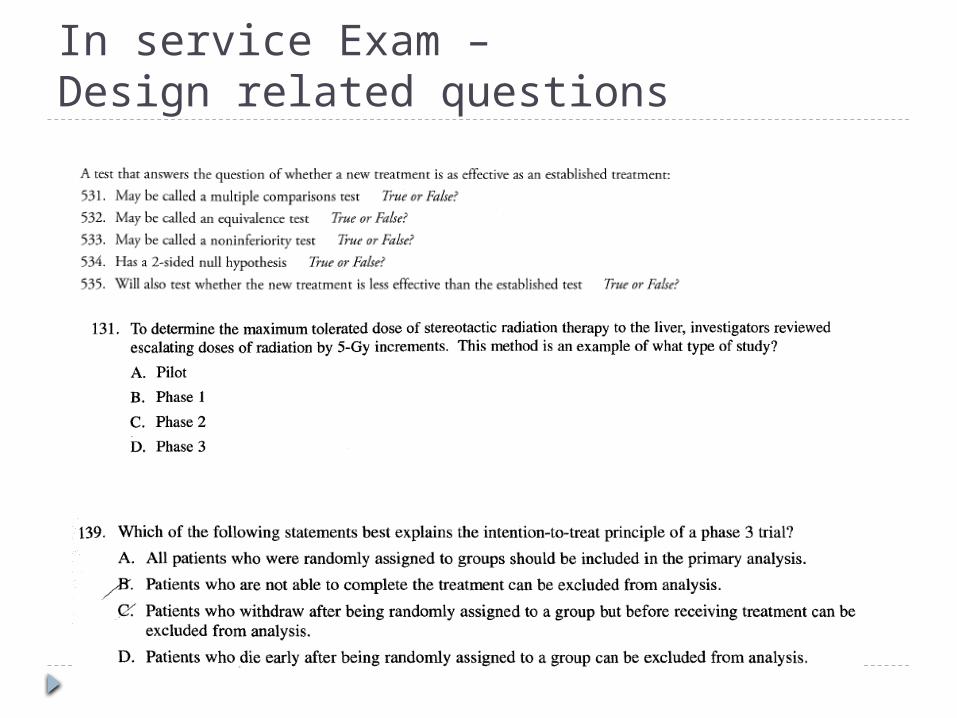
In service Exam –Design related questions
In service Exam –Design related questions
In service Exam –Design related questions
In service Exam –Design related questions
91. What is the purpose of randomization using a probability model in a clinical trial? A. Identify unknown prognostic factors B. Select a representative sample of patients with the disease of interest C. Provide an unbiased estimate of the treatment effect in each arm of the study D. Assign equal numbers of patients to each arm of the study

In service Exam –Design related questions
183. Which of the following terms applies to a clinical trial in which each group of subjects receives two or more treatments but in different sequences? A. Cross-over study B. Cross-sectional study C. Cross-validation procedure D. Cross-product ratio
120. Which of the following statements best describes an intent-to-treat analysis? A. A randomized patient who is later found to be ineligible for the study may be disregarded at analysis. B. Patients are included in the analysis of the study arm to which they were randomized. C. Patients who withdraw from the study before completion should be analyzed separately. D. Patients who are noncompliant with treatment should be dropped from analysis.
187. A clinical trial must have which of the following characteristics? A. A control group B. A prospective plan that involves human subjects C. A predetermined, fixed sample size D. Treating physicians or patients blinded to treatment received

In service Exam –Design related questions
51. Which method best describes a retrospective study designed to correlate vitamin B6 dietary intake with the development of lung cancer based on the health histories of patients with and without the disease? A. Cohort study B. Case-control study C. Hazard ratio analysis D. Relative risk ratio
51. Which method best describes a retrospective study designed to correlate vitamin B6 dietary intake with the development of lung cancer based on the health histories of patients with and without the disease? A. Cohort study B. Case-control study C. Hazard ratio analysis D. Relative risk ratio
67. Which statistical technique is used when recent trial outcomes of partial breast irradiation are compared to previously published outcomes of whole-breast irradiation? A. Cohort analysis B. Univariate analysis C. Historical control D. Case control
Is particular medicine more effective than another?...
Researcher would be interested in studies involving comparison of groups say Treatment Vs Control, Treatment A, versus Treatment B etc.
• Chance Variation
• Effect Variation
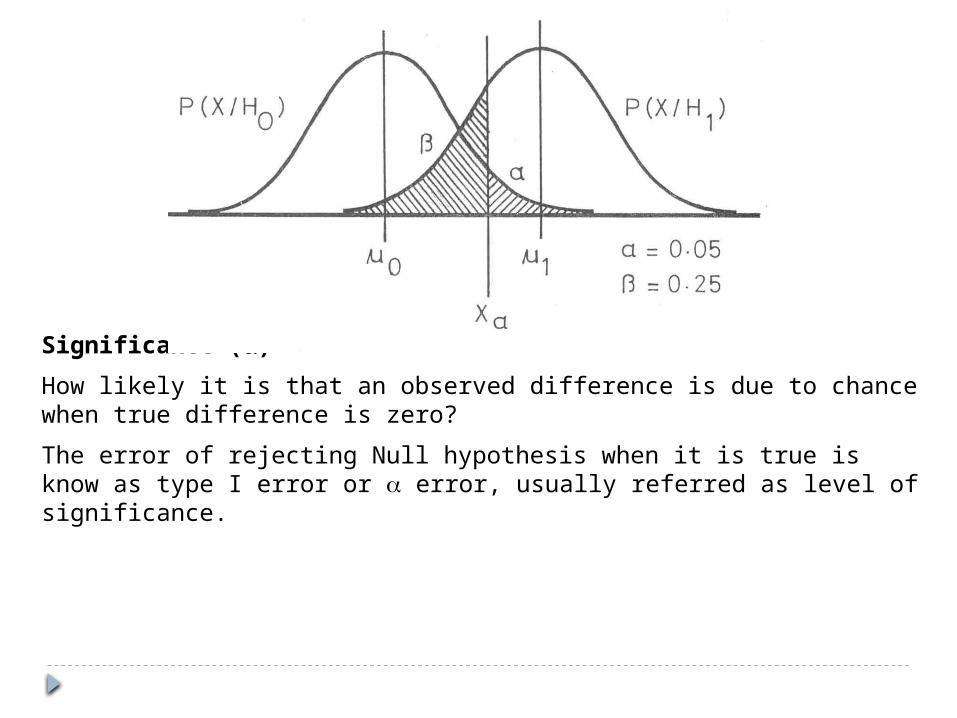
Significance ()
How likely it is that an observed difference is due to chance when true difference is zero?
The error of rejecting Null hypothesis when it is true is know as type I error or error, usually referred as level of significance.
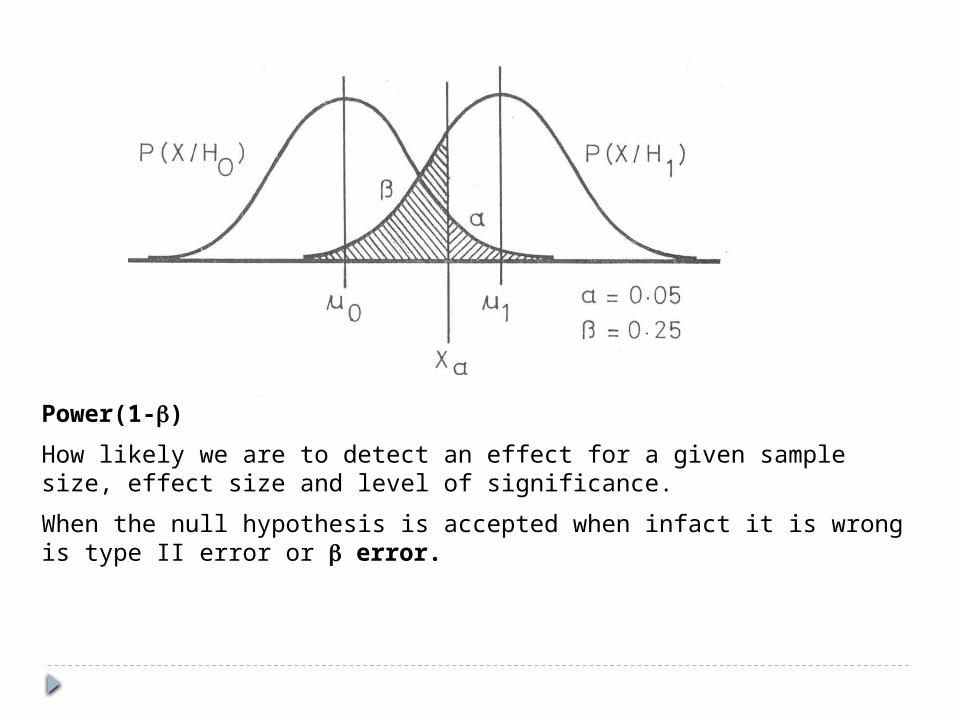
Power(1-)
How likely we are to detect an effect for a given sample size, effect size and level of significance.
When the null hypothesis is accepted when infact it is wrong is type II error or error.
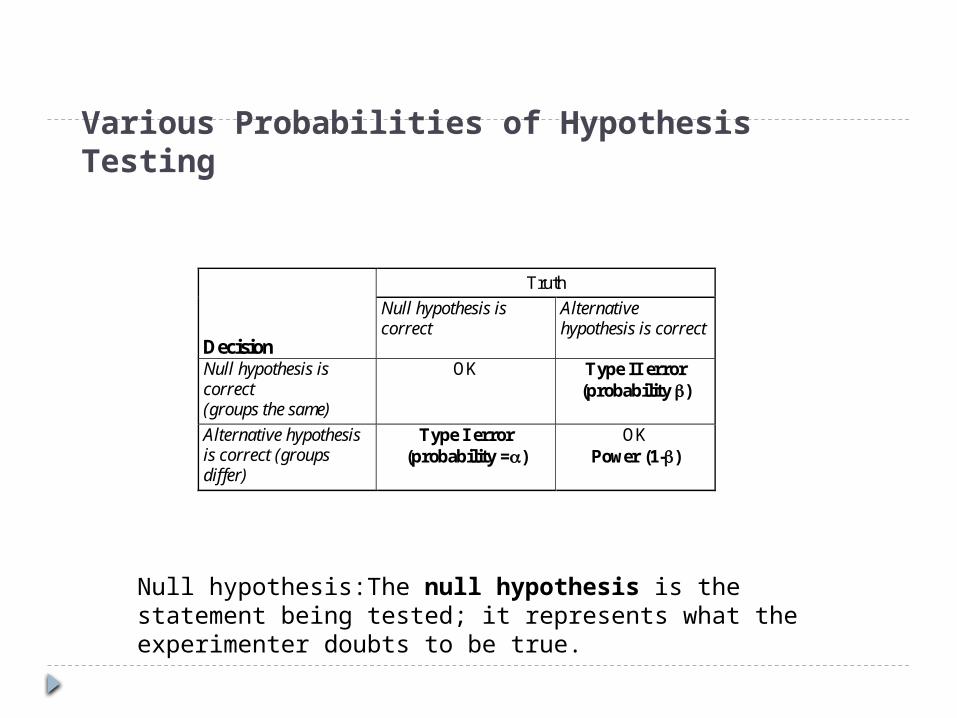
Various Probabilities of Hypothesis Testing
Decision
Truth Null hypothesis is correct
Alternative hypothesis is correct
Null hypothesis is correct (groups the same)
OK Type II error (probability )
Alternative hypothesis is correct (groups differ)
Type I error (probability =)
OK Power (1-)
Null hypothesis:The null hypothesis is the statement being tested; it represents what the experimenter doubts to be true.
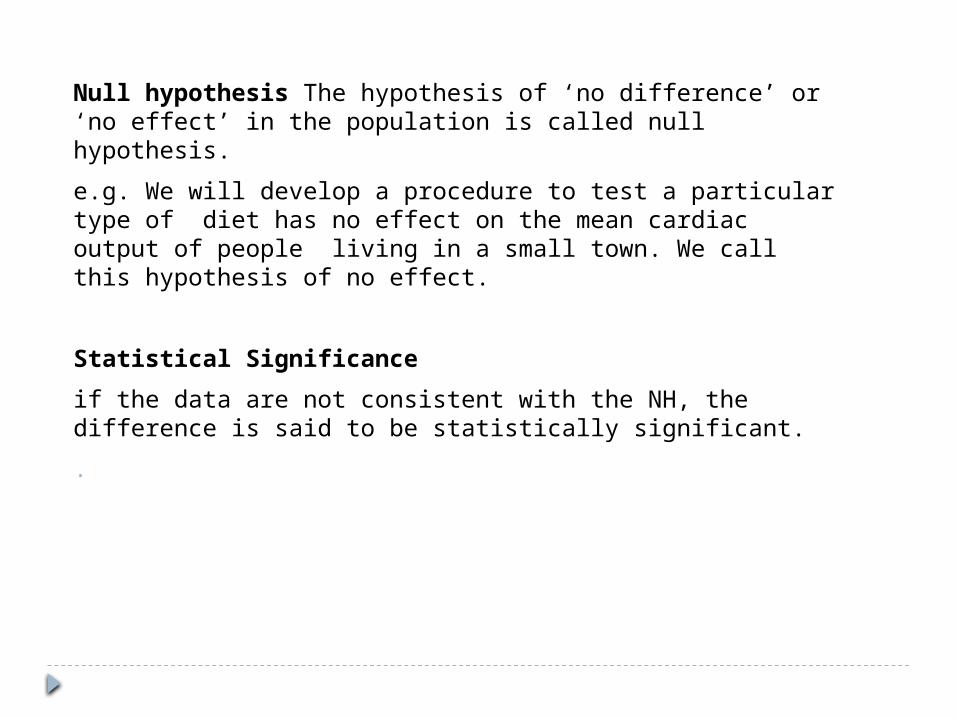
Null hypothesis The hypothesis of ‘no difference’ or ‘no effect’ in the population is called null hypothesis.
e.g. We will develop a procedure to test a particular type of diet has no effect on the mean cardiac output of people living in a small town. We call this hypothesis of no effect.
Statistical Significance
if the data are not consistent with the NH, the difference is said to be statistically significant.
.
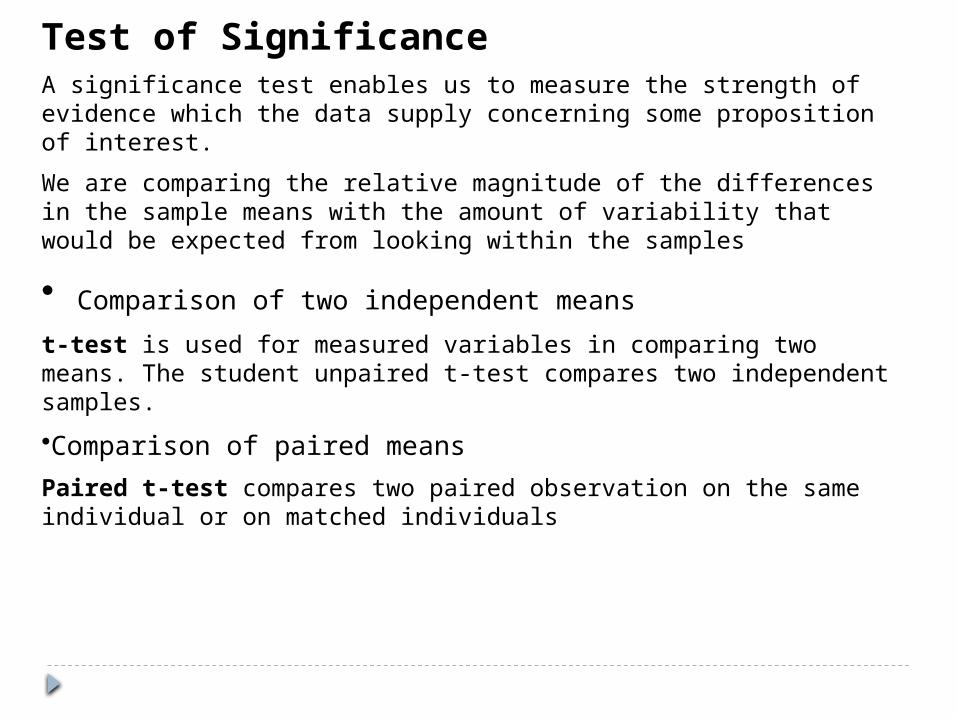
Test of SignificanceA significance test enables us to measure the strength of evidence which the data supply concerning some proposition of interest.
We are comparing the relative magnitude of the differences in the sample means with the amount of variability that would be expected from looking within the samples
• Comparison of two independent means
t-test is used for measured variables in comparing two means. The student unpaired t-test compares two independent samples.
•Comparison of paired means
Paired t-test compares two paired observation on the same individual or on matched individuals
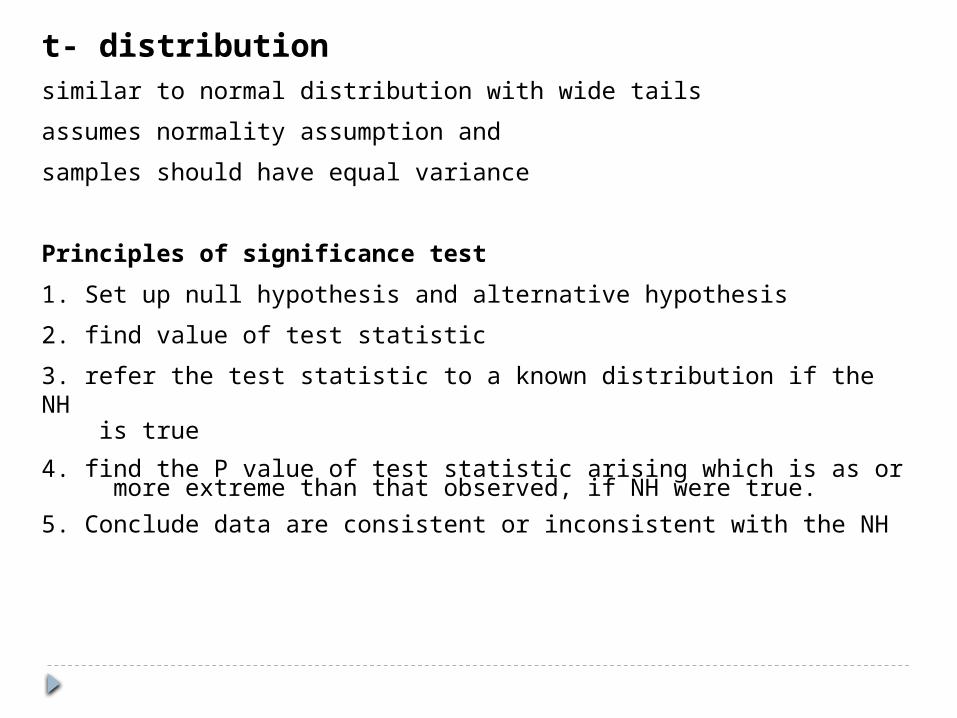
t- distributionsimilar to normal distribution with wide tails
assumes normality assumption and
samples should have equal variance
Principles of significance test
1. Set up null hypothesis and alternative hypothesis
2. find value of test statistic
3. refer the test statistic to a known distribution if the NH is true
4. find the P value of test statistic arising which is as or more extreme than that observed, if NH were true.
5. Conclude data are consistent or inconsistent with the NH
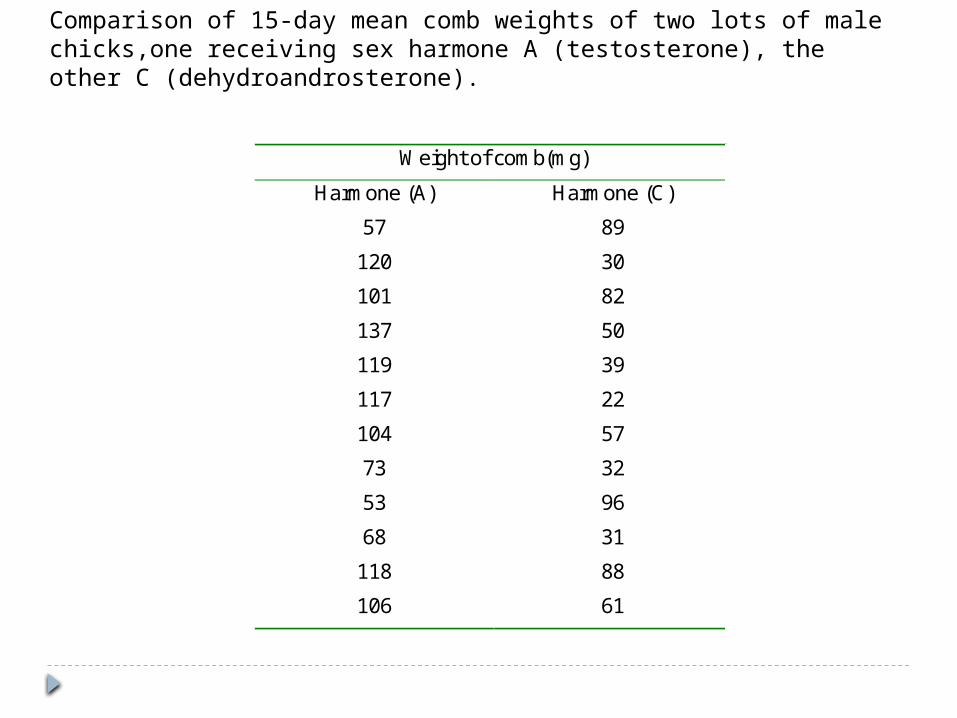
Weight of comb(mg)
Harmone (A) Harmone (C)
57 89
120 30
101 82
137 50
119 39
117 22
104 57
73 32
53 96
68 31
118 88
106 61
Comparison of 15-day mean comb weights of two lots of male chicks,one receiving sex harmone A (testosterone), the other C (dehydroandrosterone).
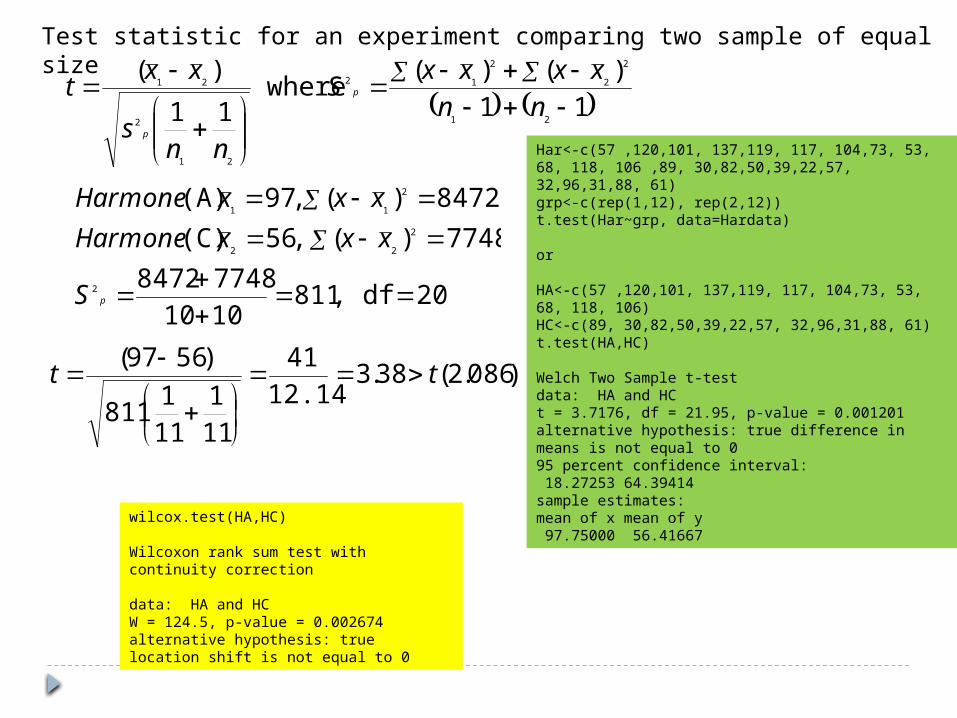
Test statistic for an experiment comparing two sample of equal size
11
)()( where
11
)(
21
2
2
2
12
21
2
21
nn
xxxxS
nns
xxt p
p
)086.2(38.312.14
41
11
1
11
1811
)5697(tt
20df ,8111010
77488472
7748)( ,56(C)
8472)( ,97(A)
2
2
22
2
11
pS
xxxHarmone
xxxHarmone
Har<-c(57 ,120,101, 137,119, 117, 104,73, 53, 68, 118, 106 ,89, 30,82,50,39,22,57, 32,96,31,88, 61)grp<-c(rep(1,12), rep(2,12))t.test(Har~grp, data=Hardata)
or
HA<-c(57 ,120,101, 137,119, 117, 104,73, 53, 68, 118, 106)HC<-c(89, 30,82,50,39,22,57, 32,96,31,88, 61)t.test(HA,HC)
Welch Two Sample t-testdata: HA and HC t = 3.7176, df = 21.95, p-value = 0.001201alternative hypothesis: true difference in means is not equal to 0 95 percent confidence interval: 18.27253 64.39414 sample estimates:mean of x mean of y 97.75000 56.41667
wilcox.test(HA,HC)
Wilcoxon rank sum test with continuity correction
data: HA and HC W = 124.5, p-value = 0.002674alternative hypothesis: true location shift is not equal to 0
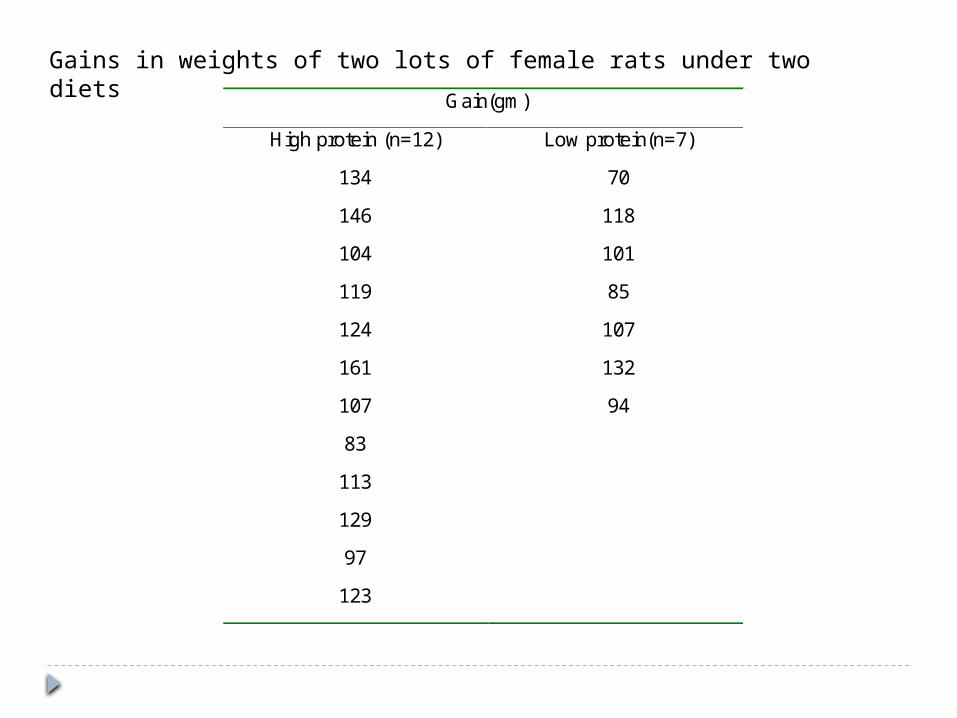
Gain(gm)
High protein (n=12) Low protein(n=7)
134 70
146 118
104 101
119 85
124 107
161 132
107 94
83
113
129
97
123
Gains in weights of two lots of female rats under two diets
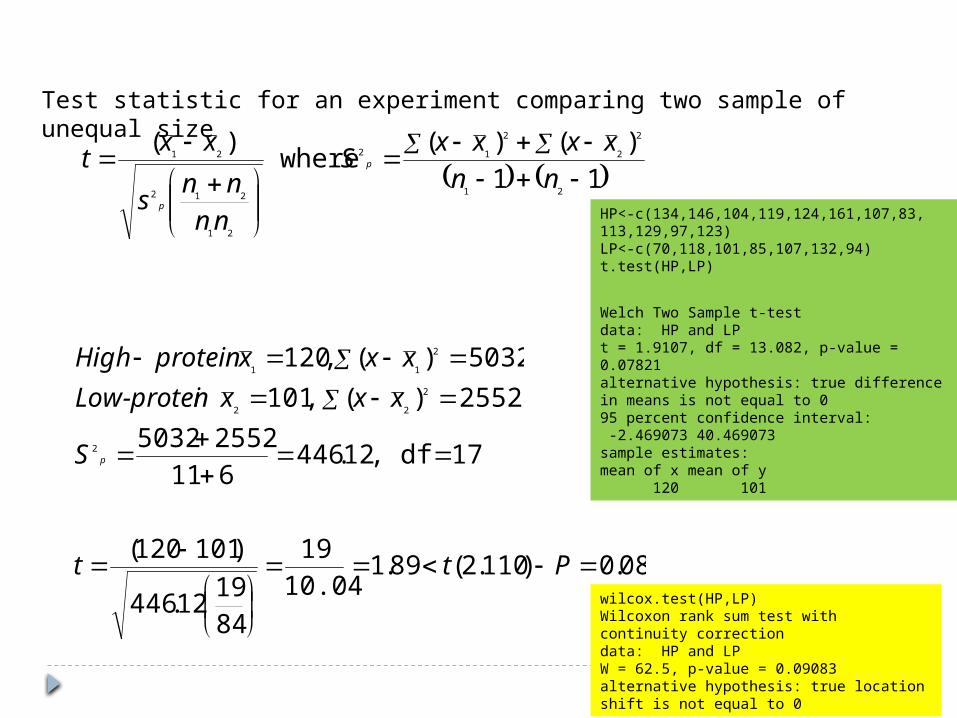
Test statistic for an experiment comparing two sample of unequal size
11
)()( where
)(
21
2
2
2
12
21
212
21
nn
xxxxS
nn
nns
xxt p
p
08.0)110.2(89.110.04
19
84
1912.446
)101120(
Ptt
17df ,12.446611
25525032
2552)( ,101
5032)( ,120
2
2
22
2
11
pS
xxxn Low-protei
xxxproteinHigh
HP<-c(134,146,104,119,124,161,107,83,113,129,97,123)LP<-c(70,118,101,85,107,132,94)t.test(HP,LP)
Welch Two Sample t-testdata: HP and LP t = 1.9107, df = 13.082, p-value = 0.07821alternative hypothesis: true difference in means is not equal to 0 95 percent confidence interval: -2.469073 40.469073 sample estimates:mean of x mean of y 120 101
wilcox.test(HP,LP)Wilcoxon rank sum test with continuity correctiondata: HP and LP W = 62.5, p-value = 0.09083alternative hypothesis: true location shift is not equal to 0
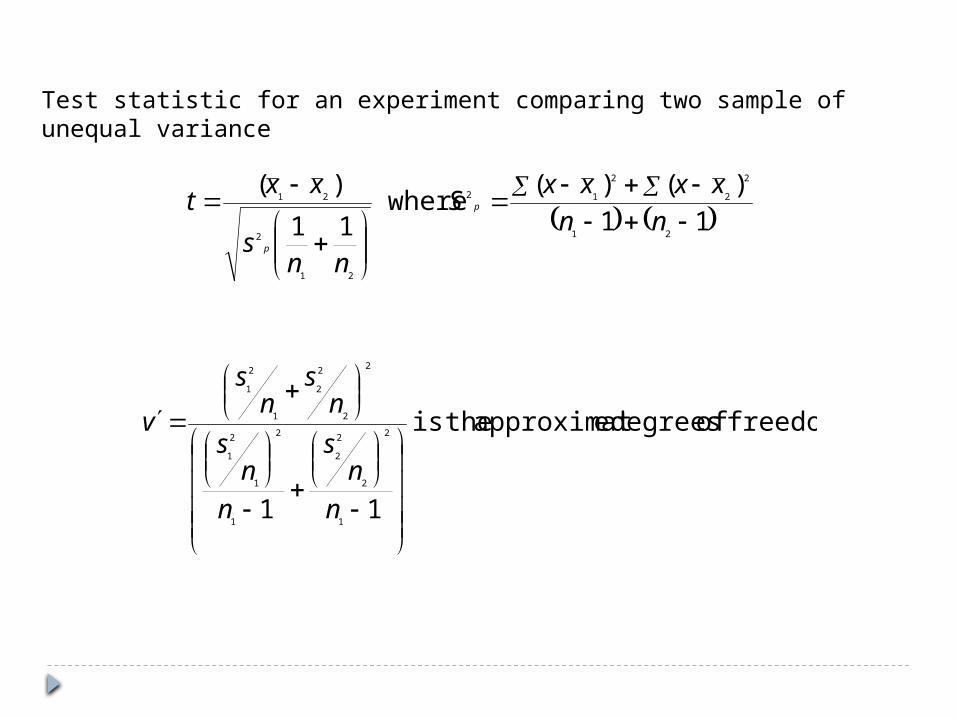
Test statistic for an experiment comparing two sample of unequal variance
11
)()( where
11
)(
21
2
2
2
12
21
2
21
nn
xxxxS
nns
xxt p
p
freedom of degrees eapproximat theis
111
2
2
2
2
1
2
1
2
1
2
2
2
2
1
2
1
n
ns
n
ns
ns
ns
v
Comparison of Paired Data (Correlated data)
Twelve pre-school children were given a supplement of multipurpose food for a period four months. their skin fold thickness (in mm) were measured before the program and after the end of program.
The question is whether there is any difference in the skin fold thickness between pre and post measurements.
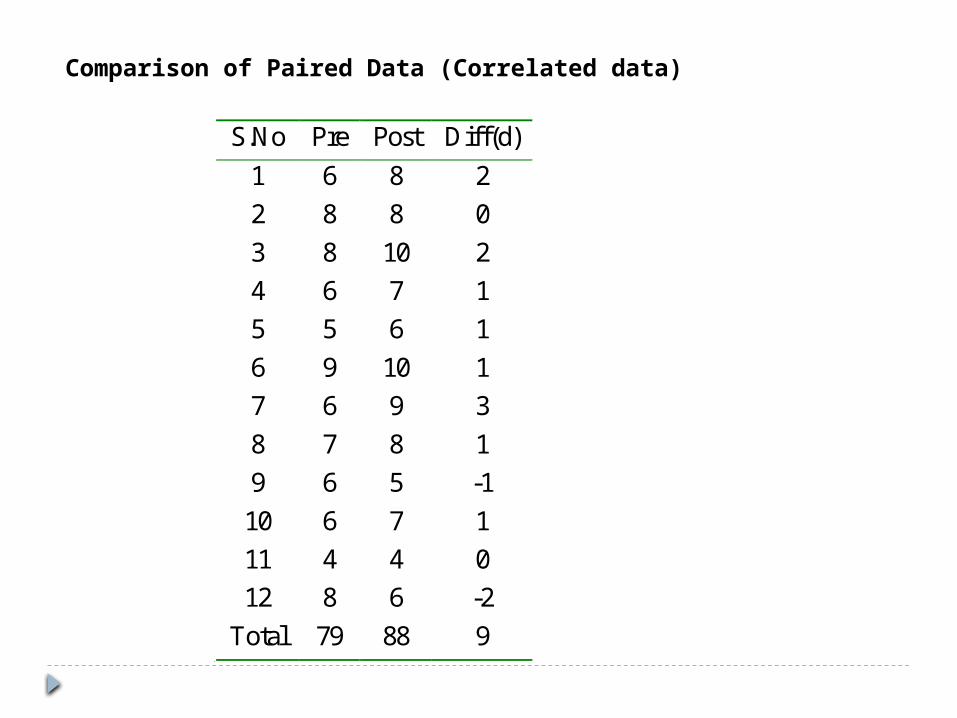
S.No Pre Post Diff(d)
1 6 8 2
2 8 8 0
3 8 10 2
4 6 7 1
5 5 6 1
6 9 10 1
7 6 9 3
8 7 8 1
9 6 5 -1
10 6 7 1
11 4 4 0
12 8 6 -2
Total 79 88 9 01
Comparison of Paired Data (Correlated data)
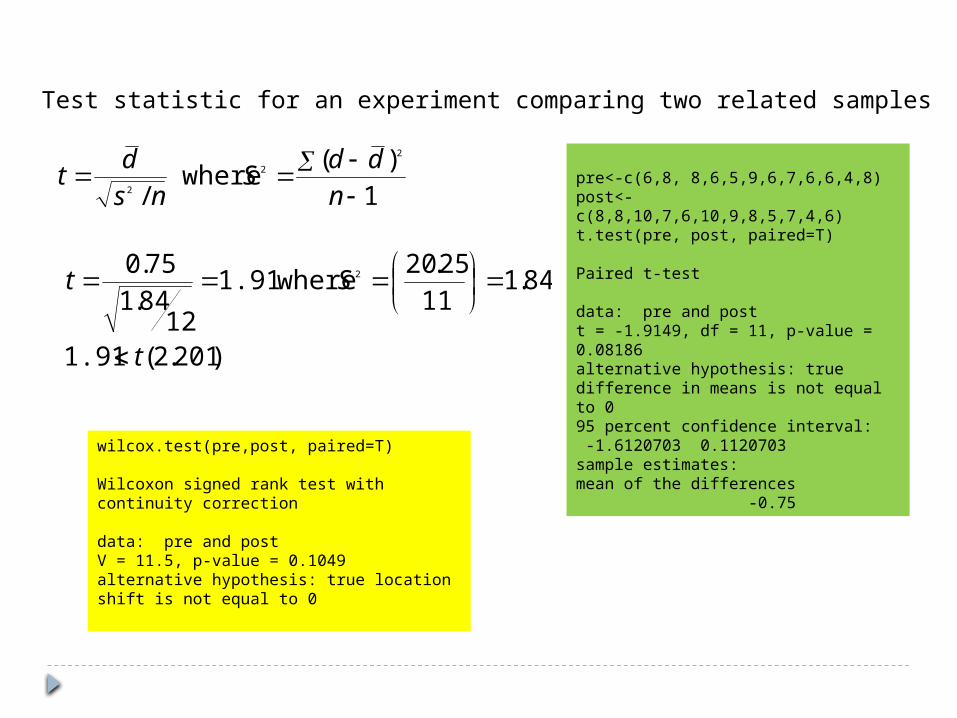
Test statistic for an experiment comparing two related samples
1
)( where
/
2
2
2
n
ddS
ns
dt
)201.2(1.91
84.111
25.20 where1.91
1284.1
75.0 2
t
St
pre<-c(6,8, 8,6,5,9,6,7,6,6,4,8)post<-c(8,8,10,7,6,10,9,8,5,7,4,6)t.test(pre, post, paired=T) Paired t-test
data: pre and post t = -1.9149, df = 11, p-value = 0.08186alternative hypothesis: true difference in means is not equal to 0 95 percent confidence interval: -1.6120703 0.1120703 sample estimates:mean of the differences -0.75
wilcox.test(pre,post, paired=T) Wilcoxon signed rank test with continuity correction
data: pre and post V = 11.5, p-value = 0.1049alternative hypothesis: true location shift is not equal to 0
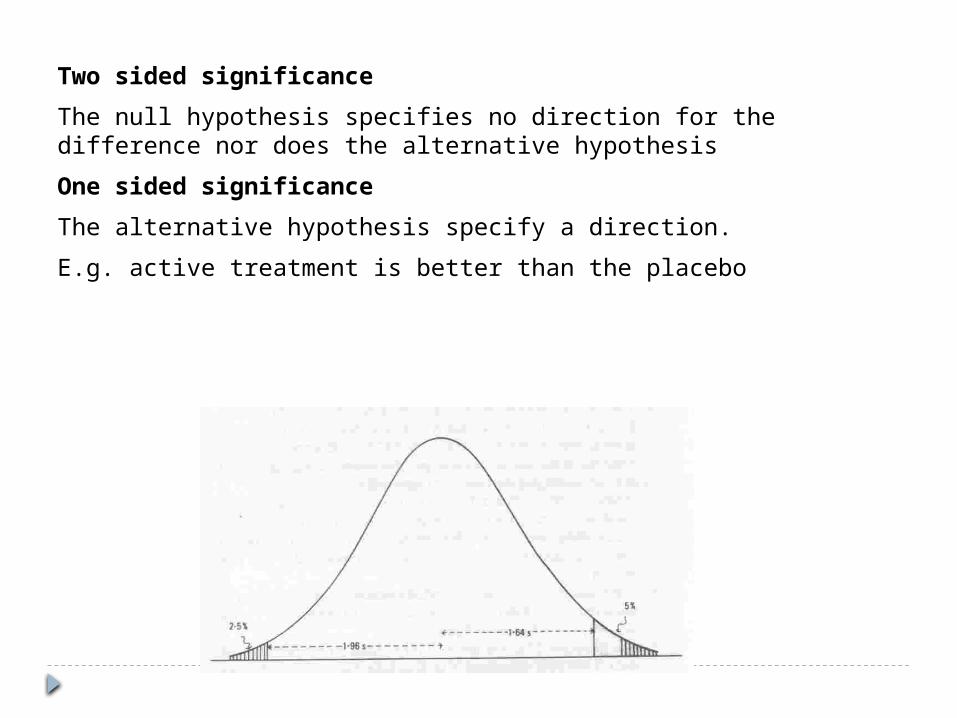
Two sided significance
The null hypothesis specifies no direction for the difference nor does the alternative hypothesis
One sided significance
The alternative hypothesis specify a direction.
E.g. active treatment is better than the placebo
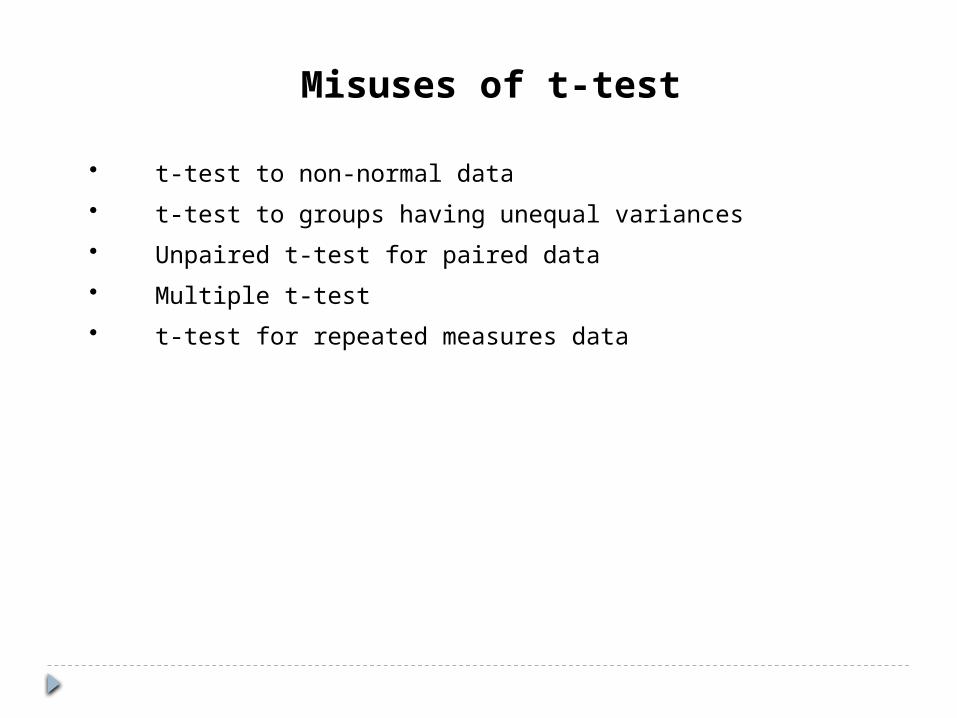
Misuses of t-test
• t-test to non-normal data
• t-test to groups having unequal variances
• Unpaired t-test for paired data
• Multiple t-test
• t-test for repeated measures data
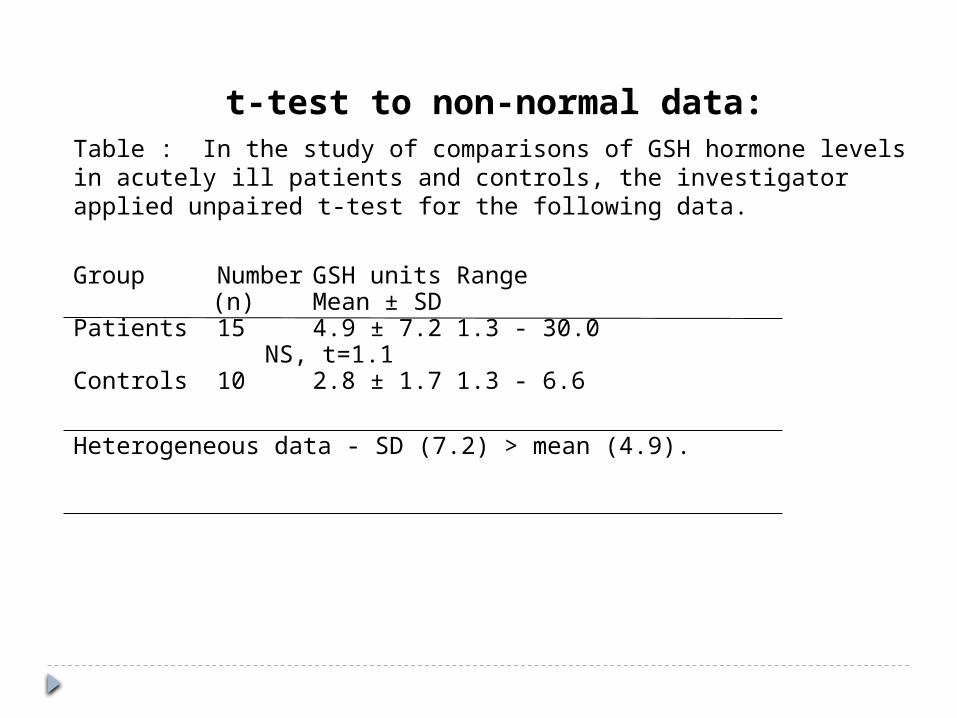
t-test to non-normal data:Table : In the study of comparisons of GSH hormone levels in acutely ill patients and controls, the investigator applied unpaired t-test for the following data.
Group Number GSH units Range (n) Mean ± SD
Patients 15 4.9 ± 7.21.3 - 30.0NS, t=1.1
Controls 10 2.8 ± 1.71.3 - 6.6
Heterogeneous data - SD (7.2) > mean (4.9).
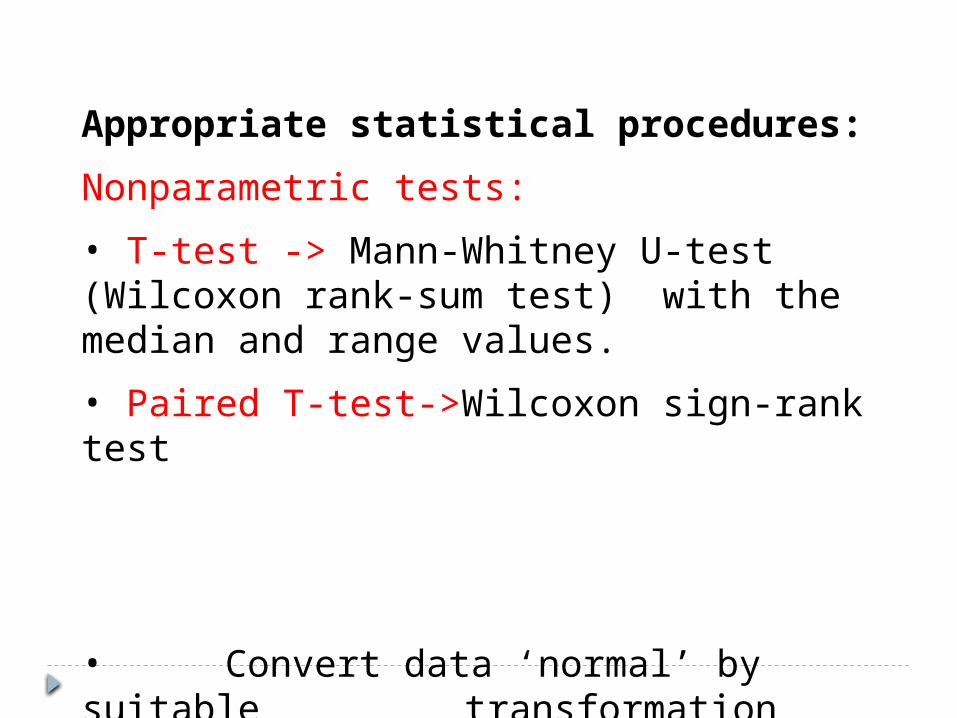
Appropriate statistical procedures:
Nonparametric tests:
• T-test -> Mann-Whitney U-test (Wilcoxon rank-sum test) with the median and range values.
• Paired T-test->Wilcoxon sign-rank test
• Convert data ‘normal’ by suitable transformation (logarithmic, square root and inverse, etc.) and then apply t-test.
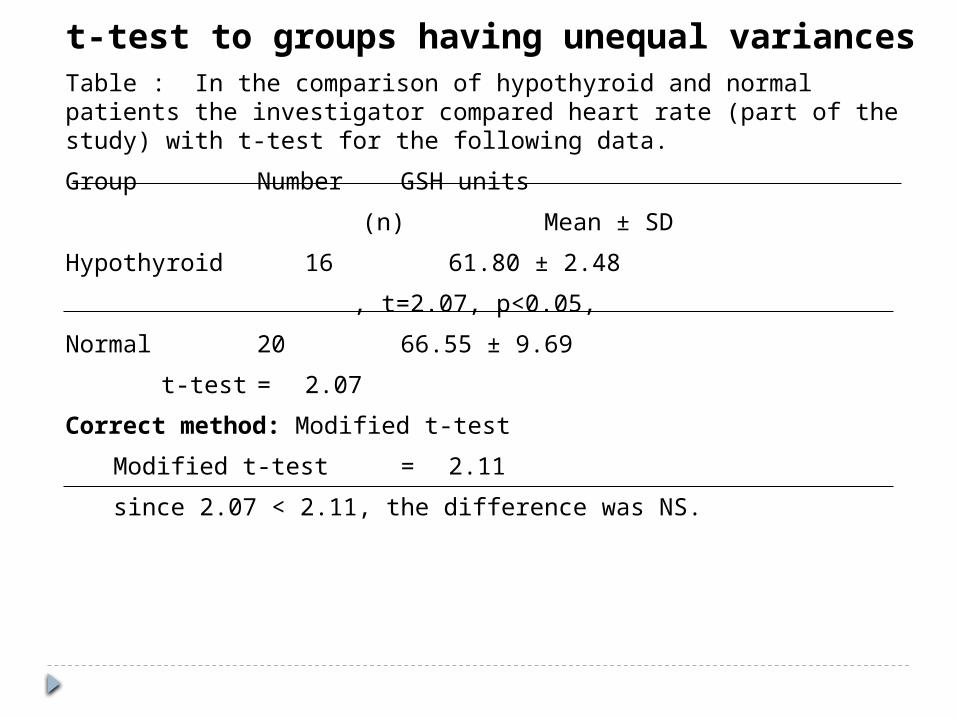
t-test to groups having unequal variancesTable : In the comparison of hypothyroid and normal patients the investigator compared heart rate (part of the study) with t-test for the following data.
Group Number GSH units
(n) Mean ± SD
Hypothyroid 16 61.80 ± 2.48
, t=2.07, p<0.05,
Normal 20 66.55 ± 9.69
t-test = 2.07
Correct method: Modified t-test
Modified t-test = 2.11
since 2.07 < 2.11, the difference was NS.
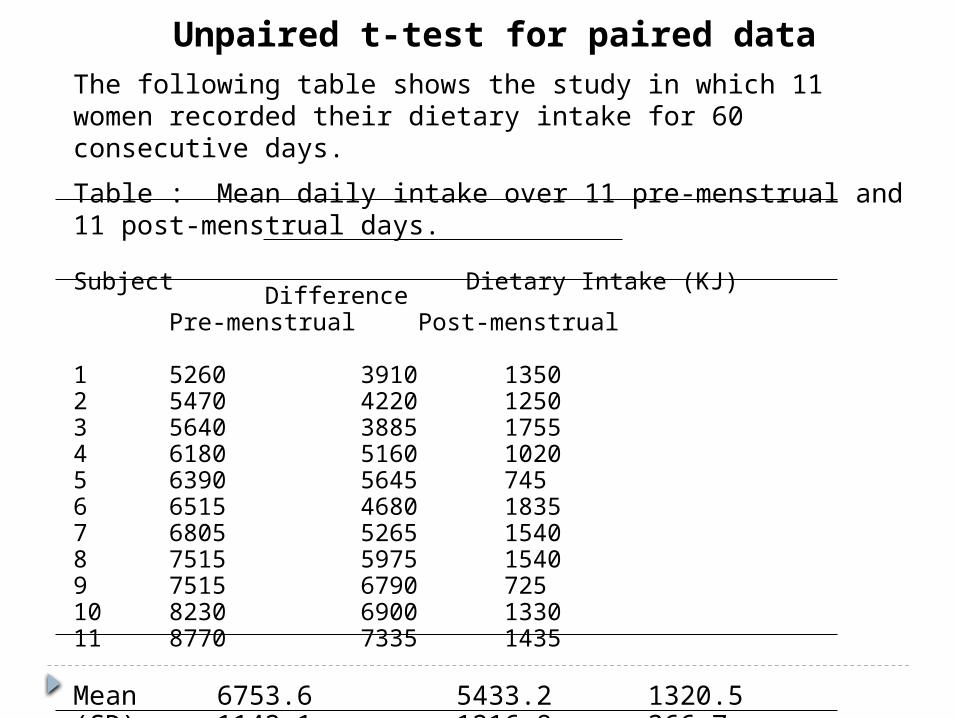
Unpaired t-test for paired dataThe following table shows the study in which 11 women recorded their dietary intake for 60 consecutive days.
Table : Mean daily intake over 11 pre-menstrual and 11 post-menstrual days.
Subject Dietary Intake (KJ) Difference
Pre-menstrual Post-menstrual
1 5260 3910 13502 5470 4220 12503 5640 3885 17554 6180 5160 10205 6390 5645 7456 6515 4680 18357 6805 5265 15408 7515 5975 15409 7515 6790 72510 8230 6900 133011 8770 7335 1435
Mean 6753.6 5433.2 1320.5(SD) 1142.1 1216.8 366.7
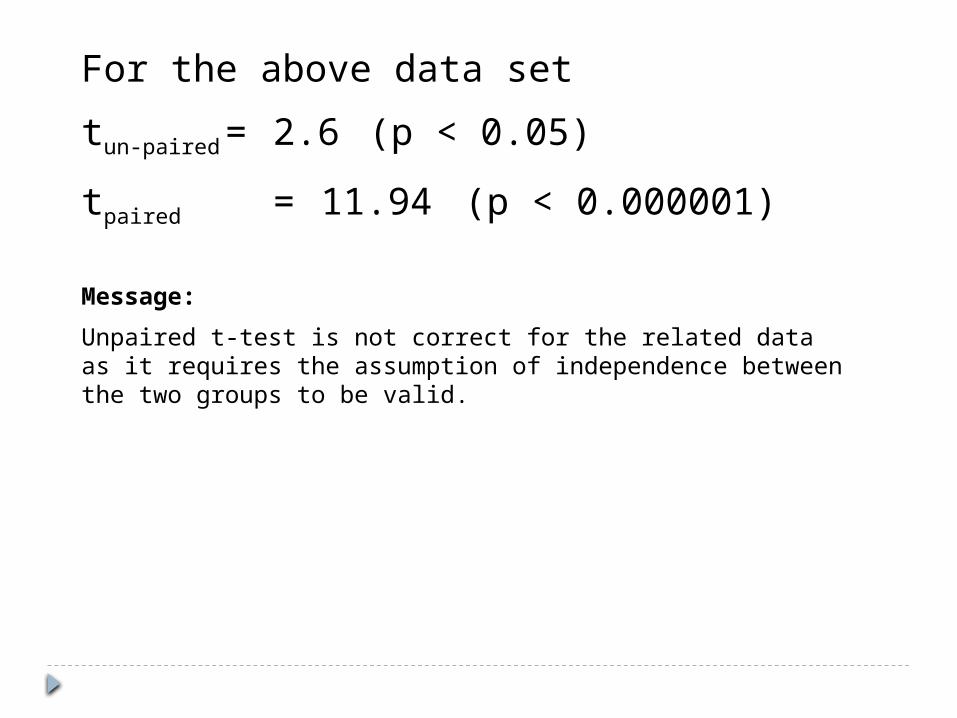
For the above data set
tun-paired = 2.6 (p < 0.05)
tpaired = 11.94 (p < 0.000001)
Message:
Unpaired t-test is not correct for the related data as it requires the assumption of independence between the two groups to be valid.
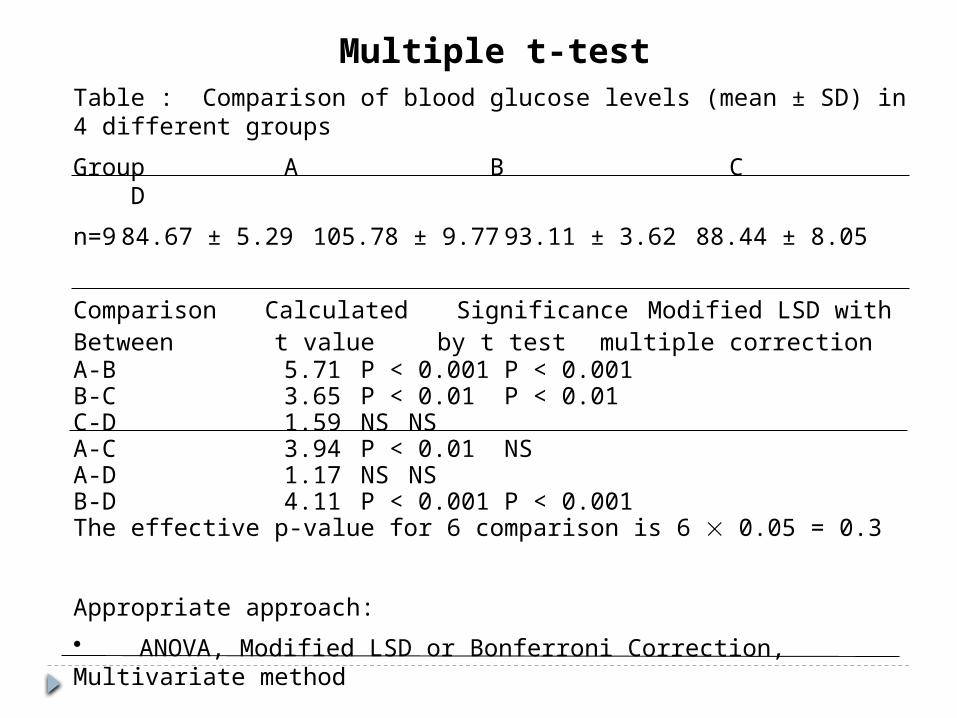
Multiple t-testTable : Comparison of blood glucose levels (mean ± SD) in 4 different groups
Group A B C D
n=9 84.67 ± 5.29 105.78 ± 9.77 93.11 ± 3.62 88.44 ± 8.05
Comparison Calculated Significance Modified LSD withBetween t value by t test multiple correctionA-B 5.71 P < 0.001 P < 0.001B-C 3.65 P < 0.01 P < 0.01C-D 1.59 NS NSA-C 3.94 P < 0.01 NSA-D 1.17 NS NSB-D 4.11 P < 0.001 P < 0.001The effective p-value for 6 comparison is 6 0.05 = 0.3
Appropriate approach:
• ANOVA, Modified LSD or Bonferroni Correction, Multivariate method
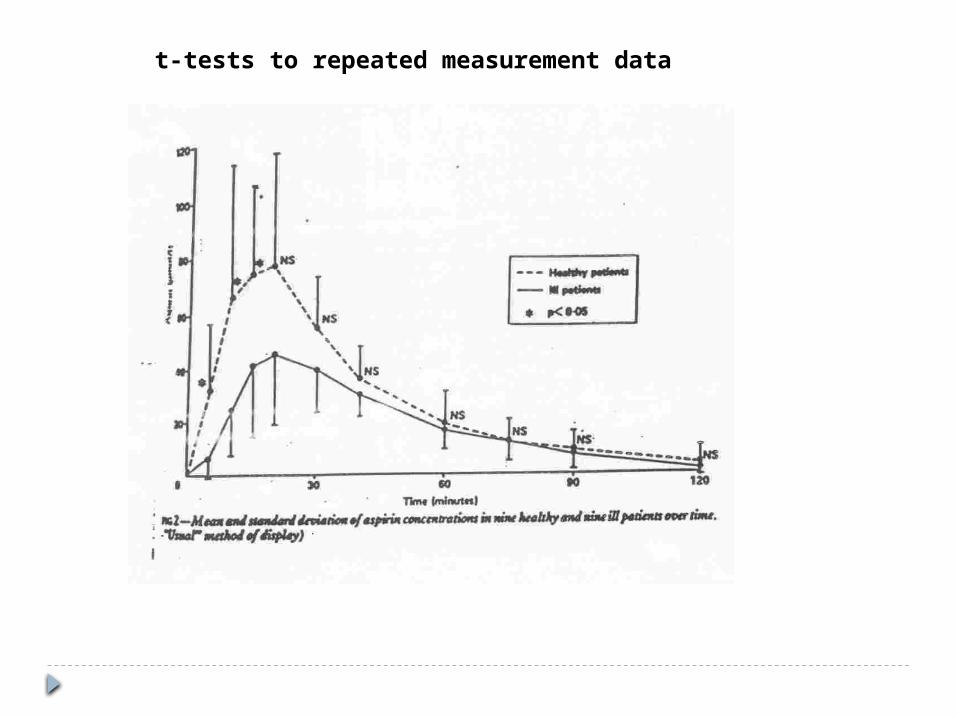
t-tests to repeated measurement data
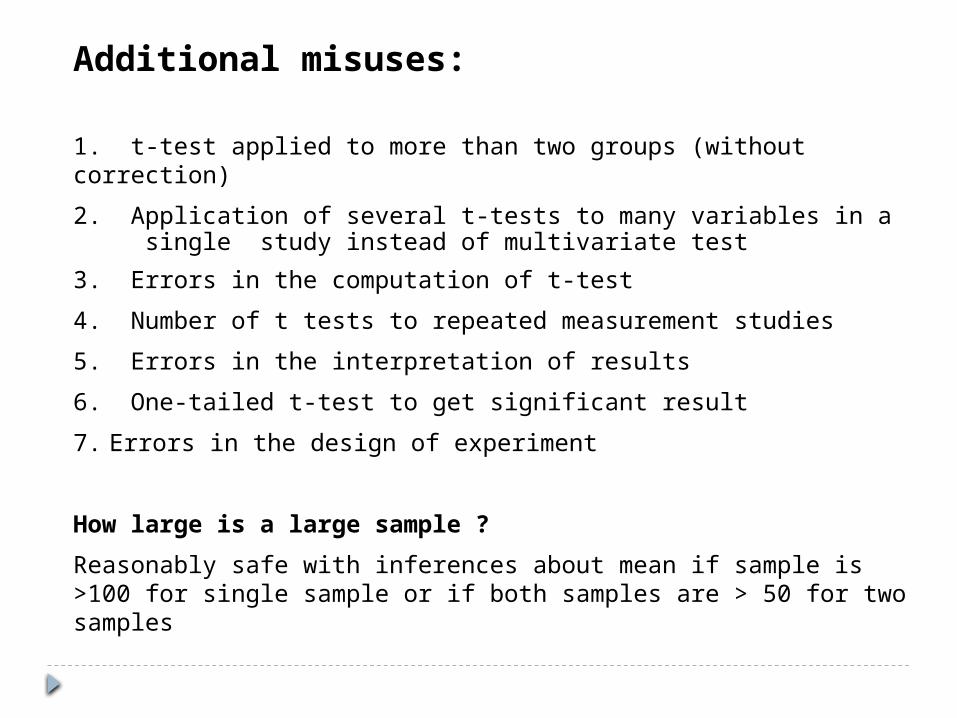
Additional misuses:
1. t-test applied to more than two groups (without correction)
2. Application of several t-tests to many variables in a single study instead of multivariate test
3. Errors in the computation of t-test
4. Number of t tests to repeated measurement studies
5. Errors in the interpretation of results
6. One-tailed t-test to get significant result
7. Errors in the design of experiment
How large is a large sample ?
Reasonably safe with inferences about mean if sample is >100 for single sample or if both samples are > 50 for two samples