Embed Size (px)
Citation preview

1
BIOSCIENCE AND
HEALTH TECHNOLOGY
SECTOR STATISTICS
2018
May 2019

2
© Crown copyright 2019 This publication is licensed under the terms of the Open Government Licence v3.0 except where otherwise stated. To view this licence, visit nationalarchives.gov.uk/doc/open-government-licence/version/3 or write to the Information Policy Team, The National Archives, Kew, London TW9 4DU or email: [email protected]. Where we have identified any third-party copyright information you will need to obtain permission from the copyright holders concerned. The responsible statistician for this publication is Kayley Vanlint. Any enquiries regarding this publication should be sent to: [email protected]

3
Biotechnology and Health technology Sector Statistics 2018
Contents Introduction ........................................................................................................................... 6
Terminology .......................................................................................................................... 7
1. Industry overview .............................................................................................................. 8
1.1. Core sectors ................................................................................................................... 9
1.2. Service & Supply sectors ............................................................................................. 10
2. Sector overviews – Key facts .......................................................................................... 11
2.1 Biopharma sector .......................................................................................................... 11
2.2. Biopharma – Core businesses ..................................................................................... 11
2.3. Biopharma – Service & Supply chain ........................................................................... 12
2.4. Med Tech sector (including digital health) .................................................................... 12
2.5. Med Tech – Core businesses ....................................................................................... 12
2.6. Med Tech – Service & Supply chain ............................................................................. 13
3. Geographical analysis ..................................................................................................... 14
4. Digital health and Genomics ........................................................................................... 19
4.1. Digital health ........................................................................................................ 19
4.1. Genomics ............................................................................................................ 20
5. Industry and sector trends 2009-2018 ............................................................................. 21
5.1. Life sciences industry trends ........................................................................................ 22
5.2. Core Biopharma and Med Tech sector trends .............................................................. 24
5.3. Service & Supply sector trends .................................................................................... 25
5.4 Geographical trends ...................................................................................................... 26
Annex 1 – Full data partners acknowledgement statement ................................................. 28
Annex 2 – Methodology ...................................................................................................... 29
Annex 3 - Company Ownership……………………………………………….…………………..35
Annex 4 - Segmentation Codes…………………………………………………………..…….....36
Annex 5 - Data quality principles ..................................................................................................... 37

4
Key Messages
The UK life sciences industry employs 248,400 people in 5,8701 businesses and generates a turnover of £73.8bn.
The Core Biopharma and Core Med Tech sectors contain businesses involved in the discovery, development and marketing of therapeutics, and medical devices respectively. The Core Med Tech sector is the largest by employment (97,600 or 39% of the industry) and Core Biopharma is the largest by turnover (£33.4bn or 45% of the industry).
The Core sectors are supported by two Service & Supply sectors that supply materials, equipment and specialist services. These two sectors employ 87,500 in 2,580 businesses with a turnover of £21.7bn.
The largest segment within the industry is small molecules, consisting of businesses with the majority of their activity developing and marketing therapeutics based on this technology. The segment employs 48,900 (20% of the industry) and generates a turnover of £27.8bn (38% of the industry total).
Along with small molecules, the Top 3 Core segments in the industry include digital health (the largest segment by employment in Core Med Tech with 11,100 employees) and in vitro diagnostics (9,000 employees). The Top 3 Core segments in the industry by turnover are small molecules, in vitro diagnostics, and therapeutic proteins and total account for 43% of industry turnover.
Within the two Service & Supply sectors, the two largest segments contain businesses that supply contract manufacturing and research services, and that supply reagents and equipment. In Biopharma, these two segments employ 30,100 with a turnover of £11bn; in Med Tech, these segments employ 11,600 with a turnover of £2.3bn.
80% of the businesses in the industry are SMEs; these employ 23% of the industry total and generate 10% of the turnover. The Core Biopharma sector has a higher percentage of non-SME businesses at 31% compared to 18-19% for all other sectors. The Top 25 Global Pharmaceutical companies with activity in the UK (and are non-SMEs) employ 58% of the Core Biopharma sector.
The South East of England contains the largest population of life sciences industry jobs with a total employment across all four sectors of 58,400 or 24%. The East and North West of England together with the South East are the Top 3 regions by employment.
1 The number of business counts at the industry level is lower than the count at the sector level because in the latter analysis some businesses are counted in more than one sector where they have activity in, for example, Core Biopharma and Core Med Tech, which can be the case for larger companies

5
Employment in the Core Biopharma sector is concentrated in the South East and East of England, and London with 66% of all sector employees, compared to 39% for Core Med Tech employment.
Trend Data
Between 2009 and 2018, the industry increased employment by 17,400 an increase of 8% at a compound annual growth rate of 0.8%. Over the period, all sectors except for Core Biopharma increased employment. This is compared to employment growth in all industries2 of 12% since 2009 at a CAGR of 1.3%.
The employment decreases in Core Biopharma (8,300 in total over the period) was concentrated between 2010-2014, when a number of the large pharmaceutical companies underwent re-structuring.
Total industry turnover increased by £2.0bn between 2009 to 2018. This was driven by the
Service & Supply sectors (£5.9bn) offsetting decreases in Core Biopharma (£3.3bn) and
Med Tech (£0.7bn).
Between 2009 and 2018, the single-use technology and orthopaedic devices segments replaced hospital hardware and ophthalmic devices in the industry’s top 5 core segments by employment. By turnover, therapeutic proteins replaced vaccines in the top 5 segments over the same period.
Between 2009 and 2018, most regions in England, Wales, and Northern Ireland have seen a net increase in employment in the life sciences industry. The South East of England and West Midlands were exceptions to this, seeing large decreases in employment relating to large pharma restructuring in the South East and decreases across sectors in the West Midlands.
2 UK employment (all industries) taken from HI00 Regional labour market: Headline Labour Force Survey indicators for all regions 19th March 2019 release

6
Introduction
This report contains analysis of trends in the UK life science industry, covering the Biopharma
and Med Tech sectors3. The three main measures of economic contribution and industry
structure are:
• employment - the number of people employed by life science businesses
• turnover - the amount of money taken by businesses within scope of life science sector
activities
• number of businesses – the number of life science businesses and their sites
registered in the UK
It contains analyses of the industry looking at the economic activity of businesses that market
therapeutic products and medical devices as well as the specialist Service & Supply chains
that are key parts of the ecosystem. A segmentation approach is applied that enables a
detailed analysis of the product and service categories that make up the industry4.
The analysis is based on the 2018 database of sites and businesses updated between
October and December 20185 using the methodology summarised in Annex 2.
The year referred to in this report is the year of the update rather than the year of the turnover
and employment figures; turnover and employment are for the latest 12 months available. For
the majority of sites, these figures will have been derived from latest accounts submitted by
businesses to Companies House; the figures may be submitted up to 9 months after the end
of the accounting period (which itself may vary between businesses).
The data, charts, figures, and maps used in this document, plus separate infographics can be
found at
https://www.gov.uk/government/collections/bioscience-and-health-technology-database-
annual-reports
3 The data does not include industrial biotechnology, animal health, not-for-profit organisations, public funded institutions or universities 4 See Annex 3 for a list of the segmentation categories

7
Terminology
Industry: used to collectively describe all Sectors covered in the analysis
Sector: used to describe Core Biopharma, Core Med Tech, Biopharma Service & Supply or Med
Tech Service & Supply
Segment: used to describe the individual product or service groups within a Sector (see Annex 3
for a detailed list of segments)
Core Biopharma: includes all businesses involved in developing and/or producing their own
pharmaceutical products - from small, research and development (R&D) focused biotechs to
multinational Big Pharma
Biopharma Service & Supply: comprises businesses that offer goods and services to Core
Biopharma businesses including, for example, Contract Research and Manufacturing
Organisations (CRMOs), and suppliers of consumables and reagents for R&D facilities
Core Med Tech: includes all businesses whose primary business involves developing and
producing Med Tech products, ranging from single-use consumables to complex hospital
equipment, including digital health products
Med Tech Service & Supply: comprises businesses that offer services to Core Med Tech
businesses including, for example, CRMOs, and suppliers of consumables and reagents for R&D
facilities
Digital health: includes businesses involved in making products for both hospitals and consumers
including products such as hospital information systems and mobile medical devices and apps. It
is a segment wholly within the Core Med Tech Sector.
Genomics: an interdisciplinary field focusing on the study of the human genome and the application
of resulting knowledge to human health. It is a cross-cutting categorisation across all four sectors.
Business: used to describe an entity that is the legal owner of a group of trading addresses or sites
and legal entities. A business may consist of more than one site or registered company. The term
business is used in this document when discussing the whole life sciences industry and the four
sectors.
There are 49 businesses that are active in more than one sector which means there is a small
difference in the count of businesses at the industry level (5,543) compared to the sector level
(5,592). There is no difference in the sums of employment or turnover at the different levels of
analysis. See Annex 2 for more detail.
Sites: used when referring to the data at the segment or geographical level. All data in the
spreadsheets that accompany this document are analysed at the site level. This is the level at which
all data entries (6,340 records) are held and analysed in the database. A single site is segmented
and has employment and turnover assigned to it. As a business can have multiple sites and can
operate in more than one segment, the total counts of sites at segment level is greater than the
count of businesses referred to at sector level.
SME status: based on the European definition of Small and Medium-sized Enterprises (SMEs) and
refers to businesses with fewer than 250 employees and which either have annual turnover up to
and including €50m and/or have an annual balance sheet total up to and including €43m.
8
1. Industry overview
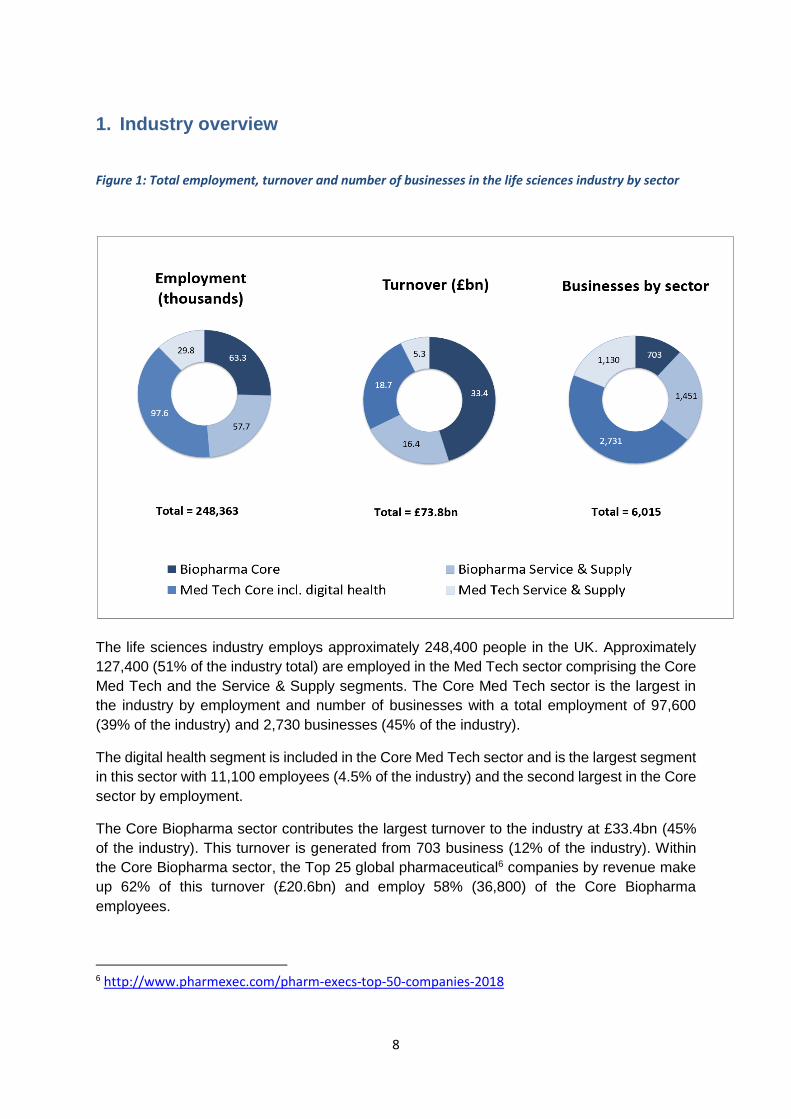
Figure 1: Total employment, turnover and number of businesses in the life sciences industry by sector
The life sciences industry employs approximately 248,400 people in the UK. Approximately
127,400 (51% of the industry total) are employed in the Med Tech sector comprising the Core
Med Tech and the Service & Supply segments. The Core Med Tech sector is the largest in
the industry by employment and number of businesses with a total employment of 97,600
(39% of the industry) and 2,730 businesses (45% of the industry).
The digital health segment is included in the Core Med Tech sector and is the largest segment
in this sector with 11,100 employees (4.5% of the industry) and the second largest in the Core
sector by employment.
The Core Biopharma sector contributes the largest turnover to the industry at £33.4bn (45%
of the industry). This turnover is generated from 703 business (12% of the industry). Within
the Core Biopharma sector, the Top 25 global pharmaceutical6 companies by revenue make
up 62% of this turnover (£20.6bn) and employ 58% (36,800) of the Core Biopharma
employees.
6 http://www.pharmexec.com/pharm-execs-top-50-companies-2018

9
The Service & Supply companies that support the Core Biopharma and Med Tech sectors
have a combined employment of 87,500 compared to 160,900 for the two Core sectors, while
turnover is £21.7bn compared to £52.1bn.
1.1. Core sectors
The two Core segments of the industry contain an estimated 3,400 businesses, with the
majority in the Med Tech sector (80%). The businesses in these two sectors focus on the
discovery, development and marketing of new therapies and medical devices.
• On average, a Biopharma sector business has a turnover six times of that of a Med
Tech business and employs twice as many people.
• 31% of Biopharma sites have a turnover greater than £5m compared to 19% for Med
Tech.
• 8% of Biopharma sites have 250 or more employees compared to 2% for Med Tech.
The global Top 30 Core Med Tech businesses by revenue7 employ 19% of the total Core Med
Tech sector and their revenue accounts for 27% of the sector total.
The global Top 25 Core Biopharma businesses by revenue8 employ 58% of the total Core
Biopharma sector and their revenue accounts for 62% of the sector total.
The largest segment in the Core Biopharma sector by employment is small molecules,
employing 77% of the Core Biopharma sector. In contrast, in Core Med Tech, the largest
segment is Digital Health that employs 11% of the sector total. The top 14 of 20 segments
employ 90% of the Core Med Tech sector.
The five largest employment segments in the two Core sectors combined employ 85,500 or
53% of the total in the Core sectors. Of the five largest segments, all but small molecules are
segments within Core Med Tech. The top five segments in the two Core sectors by turnover
(small molecules, in vitro diagnostics, therapeutic proteins, single use technology, and
orthopaedic devices) have a combined turnover of £34.8bn or 67% of the total Core sectors;
£27.8bn of which is from the small molecules segment.
Of the businesses in Core Biopharma 69% are SMEs compared to 81% in the Core Med Tech
sector.
7 The Top 30 ranking as based on https://www.mpo-mag.com/issues/2018-07-01/view_features/the-2018-top-30-global-medical-device-companies 8 The Top 25 ranking based on http://www.pharmexec.com/pharm-execs-top-50-companies-2018

10
1.2. Service & Supply sectors
Both the Core Biopharma and Med Tech businesses are supported by large specialist UK
based Service & Supply sectors.
The Biopharma Service & Supply sector employs 57,700 people in 1,450 businesses and
generates a turnover of £16.4bn. The largest segments by employment in this sector are
contract manufacturing and research, reagent & equipment suppliers, and clinical research
organisation that together employ 39,300 people and account for 83% (£13.6bn) of the sector
turnover.
The Med Tech Service & Supply chain sector employs 29,800 people in 1,130 businesses,
with a turnover of £5.3bn. The largest segments in this sector are reagent & equipment
suppliers, contract manufacturing and research, and specialist consultants (excluding
regulatory) that together employ 15,300 people and account for 51% (£2.7bn) of the sector
turnover.

11
2. Sector overviews – Key facts
2.1. Biopharma sector
• In total, the sector employs 118,000 people; 63,300 in Core Biopharma businesses and 54,700 in Service & Supply businesses. The combined turnover of the sector is £50bn.
• Employment in the sector is concentrated in the south east and North West of England, and in Scotland.
• Large non-SME businesses are the major employers in Core Biopharma (92% of all employment in the sector). In the Service & Supply sector, the majority (81%) of the businesses are SMEs and employ 22% of the sector.
2.2. Biopharma – Core businesses
Overall the Core Biopharma sector contains 703 businesses employing 63,300 people and a
turnover of £33.4bn in 2018.
The sector breakdown shows that businesses whose main economic activity involves small
molecule therapeutics form the largest segment, accounting for 67% (585) of sites, 77% of
employees (48,900) and 83% (£27.8bn) of turnover. Antibodies, therapeutic proteins and
vaccines are the next largest segments, together making up 19% (12,000) and 15% (£4.9bn)
of employment and turnover respectively.
Geographical analysis of employment shows Core Biopharma businesses in all areas of
the UK with the greatest concentration in the South East, East of England, London, and the
North West of England which together account for 80% (50,650) of Core Biopharma
employment.
Analysing the size of the businesses shows 31% (220) of Core Biopharma businesses are
non-SMEs. These large businesses employ 58,000 people (92% of Core Biopharma
employment) and account for £32.4bn of turnover (97% of Core Biopharma turnover). They
represent 44% of total life sciences industry turnover and 23% of employment.

12
2.3. Biopharma – Service & Supply chain
Overall the Biopharma Service & Supply chain consists of 1,450 businesses employing
57,700 people with a turnover of £16.4bn in 2018.
The sector breakdown shows the largest employing segment is contract manufacturing and
research organisations that consist of 338 sites employing 19,200 people. The largest
segment in terms of turnover is reagent & equipment suppliers, which represents 46%
(£7.6bn) of the total. Clinical research organisations completes the Top 3 Biopharma Service
& Supply segments; in total the Top 3 account for 68% (39,300) of the employment.
Geographical analysis of employment shows the South East and East of England combined
have the most Service & Supply businesses (590) and employees (39%), followed by Scotland
(11%), and the North West of England (10%).
Analysing the size of businesses shows that the Biopharma Service & Supply sector is
predominately composed of SMEs (1,180) that make up 81% of all businesses, yet they
represent only 22% of employment (12,800 people) and 9% of turnover (£1.5bn) for the sector.
2.4. Med Tech sector (including digital health)
• In total, the sector employs 127,400 people; 97,600 in Core Med Tech businesses and 29,800 in Service & Supply businesses. The combined turnover of the sector is £24bn.
• Core Med Tech employment is spread across the UK. While the South East and North West of England, and the East Midlands account for 48% of the employment in the Service & Supply sector, 61% is outside of the south east of England, the normal hub for such services.
• SMEs in both Core Med Tech and Service & Supply account for a similar proportion of businesses (81% and 82% respectively) and employment (30% and 31% respectively).
2.5. Med Tech – Core businesses
Overall the Core Med Tech sector contains 2,730 businesses, employing 97,600 people with
a turnover of £18.7bn in 2018.
The sector breakdown shows the largest segment by turnover is in vitro diagnostics followed
by single use technology, orthopaedic devices, digital health, and assistive technology. These
top five segments account for 42% (£7.8bn) of the Core Med Tech turnover. Digital health
13
technology is the largest segment by employment followed by in vitro diagnostics, single use
technology, orthopaedics, and assistive technology. These top five account for 46% (44,800)
of sector employment.
Geographical analysis of employment shows there are sites spread across the UK and
employment is less concentrated in the South East, East of England, and London. Compared
to the Core Biopharma sector where 34% of employment is outside these regions, the majority
(61%; 59,700) of Core Med Tech employment is outside of the south east of England.
Analysis of the size of businesses shows that of the 2,740 businesses in Core Med Tech,
81% (2,220) are SMEs. They represent 30% (29,600) of Core Med Tech employment and
20% (£3.7bn) of Core Med Tech turnover. Core Med Tech SMEs account for 46% of the total
number of life sciences SMEs.
2.6. Med Tech – Service & Supply chain
Overall the sector contains 1,130 businesses that employ 29,800 and generates a turnover
of £5.3bn in 2018.
The sector breakdown shows the largest segment of the sector is reagent, equipment and
consumables suppliers, which has the highest number of sites (325) and employs 24% (7,100)
of the sector’s total and 31% (£1.7bn) of its turnover. The next largest segments by
employment are contract manufacturing and research followed by specialist consultants.
Geographical analysis shows, in contrast to Core Med Tech, the top 3 areas are the South
East and North West of England, and the East Midlands. These three areas account for 48%
(14,200) of the employment and 51% (£2.7bn) of the sector turnover.
Analysis of the size of businesses shows that 82% (922) of businesses are SMEs,
employing 9,100 people (31% of Med Tech Service & Supply) and accounting for £1.2bn
(23%) of turnover.

14
3. Geographical analysis
• The South East of England contains the largest population of life sciences industry jobs with a total employment across all four sectors of 58,400 (24%). The East and North West of England together with the South East are the Top 3 regions by employment.
• The Core Biopharma sector is concentrated within the South East and East of England, particularly in an area stretching from Cambridge to Reading, and areas around Stevenage and in London. In the North West, Core Biopharma businesses are located along the corridor running from Liverpool to Manchester.
• Core Med Tech has concentrations of employment around the major cities in the Midlands and Yorkshire including Leeds, Sheffield, and Birmingham, as well as London and Reading.
• The Service & Supply sectors’ employment is distributed in a similar pattern to the sector they serve but less concentrated around the major conurbations.
The distribution of employment by sector is shown in Figure 2. The South East of England
contains the largest population of life sciences industry jobs with 58,400 (24% of the industry)
employed across all four sectors. The Top 3 regions by employment include the South East
followed by East of England, and the North West. Together these regions contain 50%
(123,000) of all life sciences industry employees.

15
Figure 2: The distribution of the industry employment by sector across the regions of England and in Northern Ireland, Scotland, and Wales
The relative contribution of the four sectors to the overall life sciences employment in the
regions is shown in Figure 3. In the East of England, the North West, and London the Core
Biopharma sector accounts for more than 30% of life sciences employment; Biopharma
Service & Supply accounts for more than 30% of employment in Scotland, the North East of
England, and Northern Ireland; Core Med Tech accounts for more than half of life sciences

16
employment in West Midlands, Yorkshire & Humber, Wales, and the South West of England;
no region has Med Tech Service & Supply employment greater than 25%.
Figure 3: Regional employment in the life science sector displayed as a percentage of the total life sciences employment in the region
Maps of the distribution of life sciences employment across the UK gives detail on the
location concentrations of employment.
The Core Biopharma sector is concentrated within the South East and East of England
particularly in an area stretching from Cambridge to Reading including areas around
Stevenage and in London. In the North West, Core Biopharma businesses are located along
the corridor running from Liverpool to Manchester.
The Biopharma Service & Supply sector, while showing similar concentrations to Core
Biopharma, is more widely distributed with 58% (compared to 80%) of the employment in the
same Top 4 regions. In particular, Scotland contains the third largest concentration of
employment representing 11% of the UK sector.

17
Figure 4: Map showing the location and relative level of employment for the Core Biopharma and Service & Supply sectors
The Core Med Tech and Service & Supply sectors employment has concentrations of employment in areas around London and in the North West of England. In contrast to the Biopharma sectors, Core Med Tech has concentrations of employment around the major cities in the Midlands and Yorkshire including Leeds, Sheffield and Birmingham.

18
Figure 5: Map showing the location and relative level of employment for the Core Med Tech and Service & Supply sectors

19
4. Digital health and Genomics
• The digital health segment employs 11,100 people and has a total turnover of £1.4bn.
• Between 2009 to 2018, the segment has increased employment by 2,100 and turnover by £152m.
• Of the businesses where the formation date is known, 59% (350) of digital health sites were formed in the last 10 years.
• The Top 3 regions for employment in the segment are London, Yorkshire and Humber, and the South East.
• Overall genomics related activity in the UK is located in 57 sites with 2,400 employees and a total turnover estimated at £1.9bn.
• The largest activity in the Genomics segment is in sequencing consumables and instruments businesses that employ 1,600 and generated £1.7bn in turnover
4.1. Digital health
The digital health segment is composed of 600 sites, the highest number of sites for a Core
segment in the life sciences industry. Digital health employs 11,100 people and has a total
turnover of £1.4bn.
The estimated turnover and employment includes only businesses where a significant
proportion (over 20%) of their economic activity is in digital health. This approach does not
include all the economic activity associated with, for example, large diversified businesses
where digital health is not their main activity.
Geographically, 28% of the sites are located in London along with 24% of the employment
in the segment. The Top 3 regions for employment in the segment are London, Yorkshire and
Humber, and the South East. These regions together employ 60% of the segment.
Analysis of the sector breakdown shows that, within digital health, hospital information
systems accounts for 37% (£510m) of turnover and 36% (4,000) of employment. The e-health
analytics and GP information system are the next largest segments and together the Top 3
sub-segments employ 7,400 people, or 67% of the segment.
Analysis of the size of businesses shows that 79% (459) of digital health businesses are
SMEs and employ 34% of digital health jobs (3,800), contributing £300m in turnover (24%) of
the digital health segment turnover.

20
Figure 6: The distribution of employment and turnover for sub-segments of Digital Health (only segments with >900 employees shown)
4.2. Genomics
Genomics is an interdisciplinary field of science and technology focused on the study of
genomes. In this analysis the focus is on the study of the human genome and the application
of the resulting knowledge to human health. Since the instigation of the Human Genome
Project in 2001, the field and its applications have grown. The global market for equipment,
reagents, and services based on genomics was estimated at over £8bn in 2015 and is forecast
to grow rapidly.9
Overall genomics related activity in the UK is located in 57 sites with 2,400 employees and
a total turnover estimated at £1.9bn10. Between 2016 and 2018 the activity has increased
employment by 590 and turnover by £0.8bn.
The largest activity in the segment is in sequencing consumables and instruments
businesses that employ 1,600 and generated £1.7bn in turnover. Within this segment, sale of
instruments is the largest activity employing 513 (68% of the genomics total) and generating
a turnover of £1.6bn (93% of the genomics total).
9 Genomics in the UK, Deloitte study for the Office of Life Sciences, Sept 2015 10 The economic activity is based primarily on businesses that have the majority of their activity in the sector either selling equipment, reagents or services. The analysis does not include in-house use or application of genomics for example for drug discovery & development

21
5. Industry and sector trends 2009-2018
In this section, the changes in employment and turnover between 2009 to 2018 are analysed
using the same methodology as that from the supplemental report11, published in 2018,
using a subset of the database records. These cover 97.7% of all 2018 records.
• Over the period 2009 to 2018, the life sciences industry increased employment by 17,400 an increase of 8% over 2009, at a compound annual growth rate (CAGR) of 0.8%
• Total industry turnover increased by £1.2bn between 2009 and 2018, which was driven by the Service & Supply sectors (£4.8bn) offsetting decreases in Core Biopharma (£3.1bn) and Med Tech (£0.5bn).
• Over the period, Core Med Tech and the two Service & Supply sectors showed overall increases in employment totalling 25,600, while the Core Biopharma sector reduced employment by 8,300.
• This decrease in the Core Biopharma sector was concentrated in the small molecule sector and over the period 2010-2014, during which time a number of the Top 25 pharmaceutical companies underwent re-structuring.
• The Core Med Tech employment grew by 10,400 between 2009 to 2018, a 12% increase.
• Both Service & Supply sectors employment grew from 2009 to 2018 by 15,300, with the largest increase in employment in the Biopharma Service & Supply sector (8,700).
• Over the 10 year period, the majority of regions in England, Wales, and Northern Ireland have seen a net increase in employment in the life sciences industry. The South East of England and West Midlands were the exception to this, seeing large decreases in employment.
11 https://assets.publishing.service.gov.uk/government/uploads/system/uploads/attachment_data/file/751210/Strength_and_Opportunity_2017_supplemental_report.pdf

22
5.1. Life sciences industry trends
Over the period 2009 to 2018, the life sciences industry increased employment by 17,400, an
increase of 8% compared to 2009, at a compound annual growth rate (CAGR)12 of 0.8%. This
is compared to employment growth in all industries13 of 12% since 2009 at a CAGR of 1.3%.
Over the period, Core Med Tech and the two Service & Supply sectors showed overall
increases in employment totalling 25,600 while the Core Biopharma sector reduced
employment by 8,300. Several of the Top 25 companies, who are the majority employers in
the segment, completed site closures and reorganisations during this period. Both Core
sectors recorded falls in employment over the last year in contrast to the Service & Supply
sectors that both recorded increases.
Figure 7: Employment by life sciences industry 2009 to 2018
Total industry turnover increased by £2.0bn between 2009 and 2018, which was the result of
increases in the Service & Supply sectors (£5.9bn) offsetting decreases in Core Biopharma
(£3.3bn) and Med Tech (£0.7bn). From 2009 to 2011, total industry turnover grew but a decline
followed until 2014 after which growth resumed. This decrease was primarily driven by
decreased revenue of £6.9bn in the Core Biopharma sector between 2010 and 2016 after
13 UK employment (all industries) taken from HI00 Regional labour market: Headline Labour Force Survey indicators for all regions 19th March 2019 release

23
which turnover has remained steady. Growth in the industry from 2014 was also positively
impacted by increases of £4.5bn from 2014 in the Biopharma Service & Supply sector.
Table 1: Employment, turnover, and number of sites for the life sciences industry 2009 to 2018
Year
2009 2010 2011 2012 2013 2014 2015 2016 2017 2018
Employment 230,130 238,660 238,450 234,790 238,250 236,810 244,000 251,040 247,580 247,480
Turnover £bn (2018 prices)
71.8 77.1 77.6 76.1 71.4 68.8 69.1 70.8 73.0 73.8
Sites 5,920 6,110 6,240 6,360 6,490 6,370 6,460 6,370 6,250 6,590
Comparing the Top 5 segments of 2018 to those of 2009:
• The Top 3 segments by employment have remained the same but fourth and fifth have
changed with single use technology and orthopaedic devices replacing hospital
hardware and ophthalmic devices.
• The Top 5 by turnover also changed, with vaccines being replaced by therapeutic
proteins in the list.
Figure 8: Top 5 segments in 2009 and 2018 in the Core sectors of Biopharma and Med Tech ranked by employment, turnover, and number of sites
24
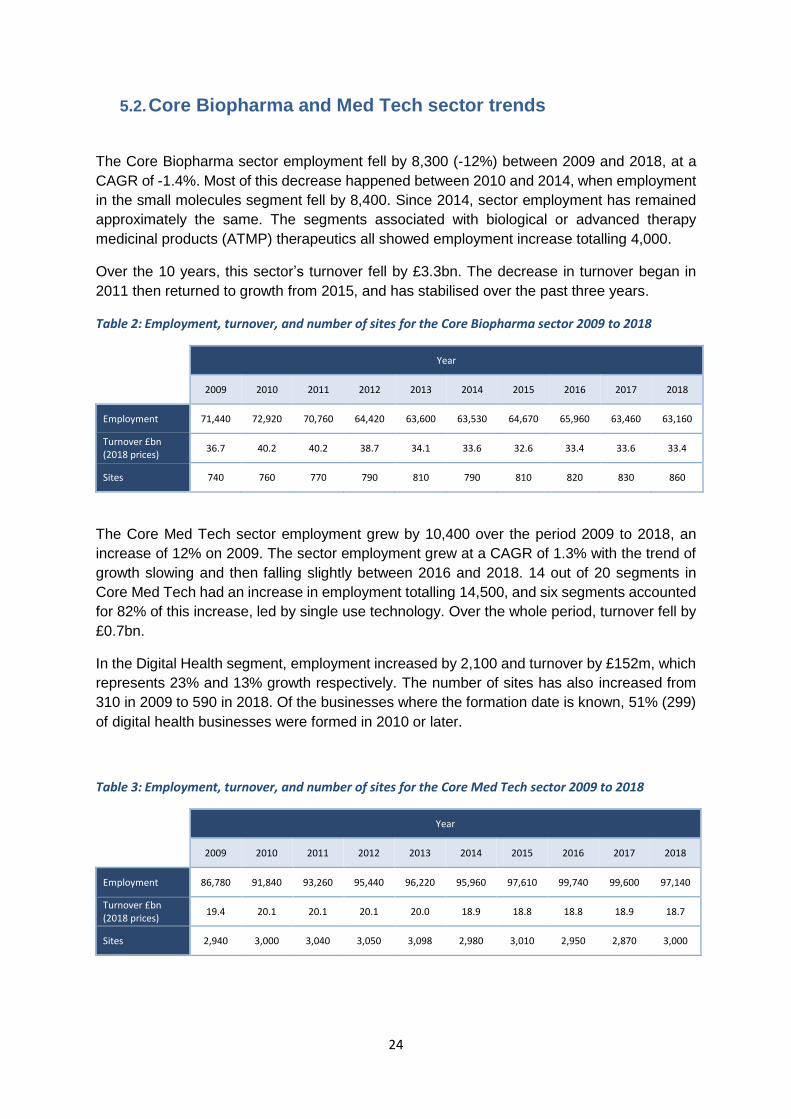
5.2. Core Biopharma and Med Tech sector trends
The Core Biopharma sector employment fell by 8,300 (-12%) between 2009 and 2018, at a
CAGR of -1.4%. Most of this decrease happened between 2010 and 2014, when employment
in the small molecules segment fell by 8,400. Since 2014, sector employment has remained
approximately the same. The segments associated with biological or advanced therapy
medicinal products (ATMP) therapeutics all showed employment increase totalling 4,000.
Over the 10 years, this sector’s turnover fell by £3.3bn. The decrease in turnover began in
2011 then returned to growth from 2015, and has stabilised over the past three years.
Table 2: Employment, turnover, and number of sites for the Core Biopharma sector 2009 to 2018
Year
2009 2010 2011 2012 2013 2014 2015 2016 2017 2018
Employment 71,440 72,920 70,760 64,420 63,600 63,530 64,670 65,960 63,460 63,160
Turnover £bn (2018 prices)
36.7 40.2 40.2 38.7 34.1 33.6 32.6 33.4 33.6 33.4
Sites 740 760 770 790 810 790 810 820 830 860
The Core Med Tech sector employment grew by 10,400 over the period 2009 to 2018, an
increase of 12% on 2009. The sector employment grew at a CAGR of 1.3% with the trend of
growth slowing and then falling slightly between 2016 and 2018. 14 out of 20 segments in
Core Med Tech had an increase in employment totalling 14,500, and six segments accounted
for 82% of this increase, led by single use technology. Over the whole period, turnover fell by
£0.7bn.
In the Digital Health segment, employment increased by 2,100 and turnover by £152m, which
represents 23% and 13% growth respectively. The number of sites has also increased from
310 in 2009 to 590 in 2018. Of the businesses where the formation date is known, 51% (299)
of digital health businesses were formed in 2010 or later.
Table 3: Employment, turnover, and number of sites for the Core Med Tech sector 2009 to 2018
Year
2009 2010 2011 2012 2013 2014 2015 2016 2017 2018
Employment 86,780 91,840 93,260 95,440 96,220 95,960 97,610 99,740 99,600 97,140
Turnover £bn (2018 prices)
19.4 20.1 20.1 20.1 20.0 18.9 18.8 18.8 18.9 18.7
Sites 2,940 3,000 3,040 3,050 3,098 2,980 3,010 2,950 2,870 3,000

25
5.3. Service & Supply sector trends
Both Service & Supply sectors increased employment and turnover between 2009 and 2018,
by 15,300 and £5.9bn respectively, with the largest increase in employment in the
Biopharma Service & Supply sector (8,700). The largest increases in these sectors were in
the Biopharma contract manufacturing and research segment (4,400), and Med Tech
training segment (1,400).
Between 2009 and 2018, the Biopharma Service & Supply sector employment and turnover
increased by 18% and by 30% (£3.8bn) respectively. With the exception of between 2013
and 2014, there was growth in employment in all years and the CAGR over the period was
1.9%.
Table 4: Employment, turnover, and number of sites for the Biopharma Service & Supply sector 2009 to 2018
Year
2009 2010 2011 2012 2013 2014 2015 2016 2017 2018
Employment 48,610 48,960 48,960 49,700 51,270 50,180 53,190 55,380 55,420 57,490
Turnover £bn (2018 prices)
12.6 13.1 13.4 13.2 13.1 11.9 13.0 13.7 15.5 16.4
Sites 1,250 1,310 1,380 1,440 1,500 1,500 1,530 1,520 1,500 1,570
Between 2009 and 2018, the Med Tech Service & Supply sector employment increased by
6,400 and turnover by £2.1bn over the period. The sector employment had a CAGR of 2.7%.
Table 3: Employment, turnover, and number of sites for the Med Tech Service & Supply sector 2009 to 2018
Year
2009 2010 2011 2012 2013 2014 2015 2016 2017 2018
Employment 23,310 24,940 25,480 25,230 27,160 27,140 28,530 29,960 29,100 29,690
Turnover £bn (2018 prices)
3.2 3.7 3.9 4.1 4.2 4.4 4.7 5.0 5.1 5.3
Sites 1,000 1,040 1,060 1,080 1,100 1,110 1,110 1,090 1,090 1,150

26
5.4. Geographical trends
When comparing geographical employment data over the 10 year period, the majority of
regions in England, Wales, and Northern Ireland have seen a net14 increase in employment in
the life sciences industry. Two regions in England, the West Midlands and the South East saw
employment fall by over 2,000 in each region, while employment in Scotland fell slightly.
The geographical net changes in employment vary by life sciences sector. These major
changes are:
1. Core Biopharma – Large decrease in employment in the South East of England and an
increase in the East of England. The main cause of the fall in employment in the South
East was the restructuring of three Top 25 Pharma businesses that resulted in closures of
a number sites in the region.
2. Core Med Tech – Increases in all regions of England except a large decrease in the West
Midlands. Increases in Northern Ireland and Wales but a large decrease in Scotland. The
fall in employment in the West Midlands is due to a mixture of causes including movement
of businesses to other UK regions and acquisition of businesses by overseas owners
leading to restructuring. The main cause of the fall in Scotland was the closure of a
manufacturing plant operated by one of the Top 30 Medical Device businesses.
3. Biopharma and Med Tech Service & Supply – Increases in the majority of regions of
England and in Northern Ireland, Scotland, and Wales. Large increase in the South East
of England in Med Tech Service & Supply and London, North West, and Northern Ireland
in Biopharma Service & Supply. The West Midlands is the only region to see decreases in
both Service & Supply sectors.
14 The net changes in employment in a region will be the result of a combination of new company formation, growth at existing companies, movement between regions, inward investment into the UK and companies reducing employment or trading.

27
Figure 9: Net changes in employment between 2009 and 2018 for the life sciences industry in regions of England, Northern Ireland, Scotland, and Wales

28
Annex 1– Full data partners acknowledgement statement
The Office for Life Sciences gratefully acknowledge the contribution of the following regional
and national organisations in the compilation of the life sciences database over the past ten
years.
The content of the database has been derived from a variety of proprietary data sources which
have been provided under license. The Office for Life Sciences would like to acknowledge the
assistance given by the owners of these data sources.
Business Information was accessed under license by Dun & Bradstreet (D&B) Limited and the
FAME database from Bureau van Dijk Electronic Publishing. More details on how this data is
used can be found in Annex 2 below.
The database construction, data integration, data analysis and commentary preparation were
completed by a consortium led by Cels Business Services (CBSL) Ltd. The consortium
included Kepier & Company Ltd and Lindum Research.
Data partners
• Association of British Healthcare Industries (ABHI)
• Association of the British Pharmaceutical Industry (ABPI)
• AXREM
• BioIndustry Association (BIA)
• BioNow
• Biopartner
• Biosciences Knowledge Transfer Network (KTN)
• British Healthcare Trade Association (BHTA)
• British In Vitro Diagnostics Association (BIVDA)
• HealthTech and Medicines Knowledge Transfer Network (KTN)
• Innovate UK
• Invest Northern Ireland
• MedCity
• Medilink East Midlands
• Medilink North of England
• Medilink South West
• Medilink West Midlands
• MediWales
• MHRA
• OBN
• One Nucleus
• Scottish Enterprise
• South East Health Technologies Alliance (SEHTA)
• TechUK
• Welsh Government
• West of England LEP

29
Annex 2 – Methodology
Summary
The annual update of the database is carried out in four main phases: compiling information
on new businesses and existing businesses; classification or segmentation of new
businesses; matching of business details with economic data from external databases; and
validation of the data set.
Information on new businesses is sourced from the data partners and also by searches of
publicly available and subscription databases. The data partners provide lists of businesses
from their internal databases, which contain both potentially new businesses (those
businesses that have been formed in the period after the last annual update) and existing
businesses (those businesses that are already in the database). For existing businesses,
this includes information the data partners have obtained on address changes, any
information on employees at a location, or suggested segmentation changes.
The information from data partners and other information sources is cleansed to remove
duplicates and records already in the database and is then segmented. Segmentation
assigns each new business and site to a sector and segment. In some cases, allocation can
be to more than one sector or segment, for example some large multi-national businesses
produce both pharmaceutical and medical devices. If, based on the information available, a
business cannot be assigned to a sector and segment, it is deemed to be not-in-scope (NIS).
Such NIS business information is retained but is not included in the data set used to analysis
the industry.
In order for a business to be classified as in-scope and their data to be included, they are
assessed against the following criteria: have a legal entity in the UK; is a private limited
company (this excludes universities, publicly owned institutions, NHS activities, and
charities); and have 20% of their total UK turnover derived from one or more of the segments
shown in Annex 315.
Businesses proposed for inclusion or identified through a search of new incorporations, are
checked for "proof of life" i.e. signs of economic activity such as employees, turnover, award
of funding, or an active website with contact details. Businesses which fail this test but
appear to be in scope are reviewed again in the next project cycle.
Once the cleansed data set is prepared, it is used to source data on turnover and employment
from either D&B or FAME, and from examination of published company reports or data. The
turnover figures will include turnover on the sale of products wholly or partially manufactured
outside the UK.
15 The focus of the economic activity included in the database is from companies that either develop or produce pharmaceuticals or medical devices sold to healthcare providers (e.g. the NHS) and companies that are part of the supply chain to these Core companies. There is also included activity from some of the larger wholesale companies that historically were involved in manufacture.
30
The data returns from D&B and FAME are carefully checked to ensure a correct match with
the business location. Further detailed validation of the data is then carried out examining
significant changes in the employment and turnover data. These changes are investigated to
detect any anomalies through verification against other sources. For example, large changes
in employment at a business site are scrutinised to see if information is available from press
releases or other information in the public domain to verify the change. In 2018, Gender Pay
Gap reporting was used both to detect potential anomalies by using the compulsory
employment band data, and to verify or update using more detailed information provided by
businesses within their own reports. The data for individual sites under one business is
examined to ensure that there is no double-counting of employment or turnover data.
Once the validation analysis is completed, the data set is “locked” for the annual update cycle,
ready for analysis for this publication.
Postcodes attached to records in the database allow geographical analysis of employment
and turnover at site level. Where available, we have validated employment data for the large
businesses by using information such as annual reports or websites to identify the number
and types of employment.
The primary allocation of turnover to location is based on the legal entity information sourced
from third party databases, validated for large businesses from annual accounts. This method
of turnover reporting is used throughout the document.
To bring the definition used for SME status in previous datasets in line with that used in the
database from 2017 onwards, we sourced information from D&B.
We used GDP deflators16 to take account of inflation across the years. We also adjusted for
population demographics to represent the changing size of the potential workforce17.
Trends Analysis
In order to create trends over the period 2009 to 2018 historical information for all businesses
which have matched company registration number (CRN) was sourced. This backfilling
approach creates a like-for-like snapshot for each year from 2009 from which we can observe
trends. Because the dataset used for the trend analysis excludes companies and records
where no CRN match was possible the 2018 employment and turnover figures in the trend
analysis do not match those in the single year 2018 analysis18
To gather additional economic information (employment and turnover), third-party sources
including Dun & Bradstreet (D&B), FAME, and published company-filed accounts or reports
are used. These are the same sources as those used to construct the main annual dataset.
Where economic data could not be sourced from company-filed accounts, an algorithm was
used to populate the dataset based on growth profile averages for individual segments.
16 GDP Deflators Spring Statement 2019 update issued 13th March 2019 17 Regional labour market statistics: HI00 Headline indicators for UK region and countries issued 19th March 2019 18 155 records did not have a matched CRN and are not included in the trend data set. These exclusdion of these records reduces the 2018 employment and turnover in the trend dataset by 879 and £32m respectively

31
To source additional segmentation information, company reports and information available via
Internet searches were used. This was necessary to align definitions, e.g. the merging of the
‘Pharmaceutical’ and ‘Medical Biotechnology’ sectors into ‘Biopharmaceuticals’ in the 2014
report.
Segmentation
The life sciences database contains information on businesses in the UK structured at the
level of trading address corresponding to the 6,740 records in the database for 2018. Using
this as the lowest level of information the data is aggregated to site and company level to give
the estimate of total number of life sciences businesses in the UK (5,871). Each trading
address or site is examined to allocate the activity carried out to one of the segments within in
a sector. As a small proportion of businesses in the database have more than one trading
address or site and can operate in more than one sector (for example can have activity in
medical technology and pharmaceuticals), the sum of number of businesses at the sector,
segment, and geographical level will be greater than the total number of businesses in the UK.
Each business and their individual sites are segmented depending on the main type of final
medicinal product or device produced. Businesses that produce products that are directly used
in healthcare are designated “Core” businesses to distinguish them from businesses that are
active only in the Service & Supply chain.
It should be noted that within in the Biopharma sector suppliers of over the counter (OTC)
medicines are included along with generic suppliers and manufacturers.
Within the database, codes are used to allocate businesses and sites to one or more
segments. Where a company has products that fall in more than one category. these are all
coded, however only the code that represents the majority of the business activity is used in
the analysis. Figure 10 breaks down the count of records in the database from the total number
of businesses in life sciences down to the allocation of sites to business activity.

32
Figure 10: The count of records in the database at each level of classification from site level through segment, sector and industry for 2018.
Segmentation was reviewed for all businesses and sites in the 2014 update. During the 2015
update a number of the businesses that have large contributions to employment and turnover
were reviewed for segmentation and their turnover in scope (TOS). The Pharmaceutical and
Medical Biotechnology sectors were also combined into a new sector: Biopharma.
Additional segmentation codes are used to further classify company activities by both product
type and business activity. For example, in vitro diagnostics is further segmented into in vitro
diagnostic products that involve clinical chemistry, immunochemistry etc. The business activity
codes are used to code businesses and sites dependent on whether they undertake R&D,
manufacturing, Service & Supply (of their products), and sales/distribution (of their products).
The codes for each sector containing Core businesses are shown in Annex 3. The Service &
Supply chain sectors that serve the Biopharma and Med Tech sectors are coded with the
prefix BP and MT respectively followed by the appropriate number to define the type of service
or supply.
Alignment with Standard Industry Classification (SIC) codes
Standard Industry Classification (SIC) codes are used to classify businesses by industry in
administrative statistics. This was last updated in 200819. This classification system has
categories for businesses whose primary activity is the manufacture of pharmaceuticals,
manufacture of types of medical equipment, and those whose primary activity is biotechnology
R&D.
19 https://www.gov.uk/government/publications/standard-industrial-classification-of-economic-activities-sic

33
The SIC system, however, does not allow identification of the full range of life sciences
businesses. A bespoke industry segmentation based on this wider range, specifically to be
used in the database, was defined with the assistance of the data partners and is summarised
in Annex 3. This is the classification system used in this report.
We have analysed the SIC codes of the businesses within the database and only 24% of
businesses in the life sciences database fall into the standard SIC codes used to identify the
life sciences industry. The remaining businesses fall into another 247 SIC codes,
demonstrating the on-going need for this report and for the life sciences database to describe
and analyse the full breadth of this industry.
For comparison, Table 6 shows the total employment and turnover for businesses in the
database with SIC codes typically used to define the life sciences industry.
Table 4: Turnover, employment, and number of sites based on the SIC codes that cover the main sectors
in the life sciences industry
SIC code description SIC Code
Number of Sites
Employment Turnover £m
Manufacture of Basic Pharmaceuticals
21100 279 43,970 20,904
Manufacture of pharmaceutical preparations
21200 113 12,184 4,312
Manufacture of Irradiation, Electromedical and Electrotherapeutic Equipment
26600 30 1,411 408
Manufacture of Medical and Dental Equipment and Supplies
32500 481 26,353 5,107
Research and Experimental Development on Biotechnology
72110 694 11,684 4,193
Total life sciences based on SIC 1,579 95,602 34,924
Total life sciences in database 6,740 248,363 73,835
The additional benefit of the segmentation approach used in the life sciences database is the
ability to make a more granular assessment of the sector, including growth rates and trends.
For example, this is the only source of definitive information that shows employment and
growth rates in digital health or allows us to understand the growth of advanced therapy
medicinal products.

34
Timeline of events
The trends described in this report should be considered in context. A short timeline of political
and life sciences-specific events is detailed below. This does not attempt to explain causality
or justify the trends detailed above and should be viewed as contextual information only.
Table 5: Timeline of political and life sciences specific events
Date Event
May 2010 UK General Election
Autumn 2010 Formation of Local Enterprise Partnerships (LEPs) in England
December 2011 Strategy for UK Life Sciences published
Duration of 2012 City Deals wave 1 (8 cities)
Duration of 2013 City Deals wave 2 (18 cities)
March 2014 Formation of the Office for Life Sciences
Late 2014 to early 2015 Devolution Deals (3 city regions)
May 2015 UK General Election
Duration of 2015 Growth Deals (39 LEPs)
June 2016 Referendum on UK leaving the European Union
June 2017 UK General Election
August 2017 Life Sciences Industrial Strategy published
December 2017 Life Sciences Sector Deal launched
December 2018 Life Science Sector Deal 2 launched

35
Annex 3 – Company Ownership
The data sources contain information on the ultimate global owner of the businesses in the
database. This information is available for 4,556 (69%) of the records in the database.
However, the businesses where the owner origin is not known have a low economic impact
as can be seen from Figures 11 and 12.
Figure 11: Distribution of sector employment between UK and Overseas life sciences businesses 2018
Figure 12: Distribution of sector turnover between UK and Overseas life sciences businesses 2018

36
Annex 4 – Segmentation codes
Biopharma Core (BP)
Code Description BPA Antibodies BPB Therapeutic Proteins BPC Advanced Therapy Medicinal Products
(ATMPs) BPD Vaccines BPE Small Molecules BPF Blood & Tissue Products
Service & Supply Chain (MX/BX) Code Description X01 Clinical Research Organisation X02 Contract Manufacturing Organisation X03 Contract Formulation Manufacturing X04 Assay developer X05 Analytical Services X06 Formulation/Drug delivery specialist X07 Reagent, Equipment & consumables
supplier X08 Regulatory Expertise X09 Patent and Legal specialist X10 Logistics & Packaging X11 Information systems specialists X12 Tissue and Biomass X13 Market Analysis/Specialist consultants X14 Contract design X15 Training X16 Recruitment X17 Investment Companies X18 Healthcare service provider
Business Activity
Code Description BAA Research & Development, including
Design BAB Manufacture BAC Sales / Distribution BAD Service & Supply Chain
Genomics
Code Main Value Chain GenA Sampling GenB Sequencing GenC Analysis GenD Interpretation GenE Application GenX N.E.C
Medical Tech Core (MT)
Code Description MTA Wound Care & Management MTB In vitro diagnostic technology MTC Radiotherapy equipment MTD Medical Imaging/Ultrasound Equipment MTE Anaesthetic and respiratory technology MTF Orthopaedic Devices MTG Cardiovascular & vascular devices MTH Neurology MTI Ophthalmic Devices/Equipment MTJ Dental and maxillofacial technology MTK Drug Delivery MTL Infection Control MTM Surgical Instruments (reusable) n.e.c. MTN Single use technology n.e.c. MTO Re-usable diagnostic or analytic equipment
n.e.c. MTP Implantable devices n.e.c. MTQ Assistive Technology MTR Mobility Access MTS Hospital hardware including ambulatory MTT Digital health
Digital Health
Code Description MTT01 Hospital information systems MTT02 GP information systems MTT03 Social Alarms/Communications devices MTT04 Personal medical records MTT05 Telemed (medical monitoring) and telediag MTT06 E-health – data analytics MTT07 Digital Medical Electronics MTT08 Professional Mobile health devices MTT09 Professional Mobile health services/apps MTT10 Consumer Mobile health devices MTT11 Consumer Mobile health services/apps MTT12 Training simulators and robotics

37
Annex 5 - Data quality principles
As an Official Statistics publication, we aim to collect data and present this report in line with
principles of the Code of Practice for Statistics20 to engender trust in our data and encourage
the use of this report as a reliable source of life sciences data.
This data quality statement covers the fourteen principles under the three pillars of the Code:
trustworthiness, quality and value.
Trustworthiness:
T1: Honesty and integrity – Data is collected, processed and quality assured by an
independent contractor. The initial technical specification is set by professional statisticians
with the Office for Life Sciences (OLS) who also engage regularly with the contractor, review
methodological aspects, and undertake further quality assurance checks before publication.
T2: Independent decision making and leadership – OLS statisticians abide by the Code of
Practice, keeping pre-publication access to the data strictly to those involved in the report’s
creation and ensuring the statistical integrity of content. The Department’s Head of Profession
for Statistics is engaged when necessary.
T3: Orderly release – Pre-publication access to the report is restricted to those involved in
the report’s creation and publication. The report meets Government Statistical Service (GSS)
standards of statistical impartiality, separating statistical commentary from any political, press
or ministerial statements. Subsequent statements by the government using data from this
report quote this source and non-governmental users are encouraged to do the same.
Unscheduled corrections are released as soon as is practicable, alongside an explanatory
note on both the cause and impact of the error, in line with the Code of Practice.
T4: Transparent processes and management – Substantial financial and administrative
resources are employed to enable this data collection and effective quality assurance,
including a proportion for further development of the report each year in light of new user
requirements or new methodology / collection possibilities. We are transparent about our
methodology and approach to quality, as evidenced in Annex 2.
T5: Professional capability – Data is collected, processed and quality assured by a consortia
contractor. Each individual has appropriate analytic capabilities, data protection awareness
and industry-specific expertise, and has been involved in the production of the report for
several years. The report ‘owners’ within OLS are professional GSS-badged statisticians.
T6: Data governance – All professionals involved in the creation, publication and storage of
this dataset are well-versed in data protection and operate in compliance with data protection
legislation. We publish the maximum amount of data available without contravening third-party
licence agreements, utilising GSS best practice for statistical disclosure control (e.g. banding
commercially sensitive variables).
20 https://www.statisticsauthority.gov.uk/code-of-practice/

38
Quality:
Q1: Suitable data sources – Full methodology including a description of third-party
administrative data sources and their suitability can be found in Annex 2. The annex also
contains a comparison between the health life sciences database and ONS SIC codes, the
main alternative source. Different segmentation levels and how these are aggregated into final
figures are explained in Annex 2, with the glossary defining key terms to ensure users are
clear at what level figures are presented (e.g. businesses vs. sites).
Q2: Sound methods – Full methodology can be found in Annex 2, alongside assumptions
made. Terminology is consistent through the report and accompanying files, with clear
descriptions in the glossary. Year-on-year trends are for real growth only based on like-for-like
data against the previous year. The method used for the real growth calculations is explained
in the Annex 2.To ensure long-term trends are calculated using the most robust methodology
and greatest level of data available, we will be undertaking extra trend analysis which will be
published in a supplemental report later in the year.
Q3: Assured quality – Rigorous quality assurance has been undertaken by the contractor,
OLS statisticians and an external business analyst within the wider Department. Quality
assurance is a significant part of the technical specification and contract tendering process
and is reviewed each year. When an unscheduled revision was necessary following the post-
publication identification of an error in a previous report, we immediately alerted users,
engaged with the Department’s Head of Profession for Statistics, and published an
explanation of the cause and impact of the error alongside the revised report, all in accordance
with the Code of Practice.
Value:
V1: Relevance to users – We review content each year based on user needs, allowing a
proportion of resource for that year’s topic of interest. In previous years this has led to the
inclusion of digital health and genomics as chapters in their own right, with a new cross-cutting
classification designed to identify businesses operating it genomics. This year the topic of
interest is a portrayal of long-term trends using an alternative methodology which will be
published in a supplemental report later in the year. In response to user feedback, this year
we have further extended the fields in the publicly available underlying businesses dataset to
include all fields for which we are not restricted by commercial licences. In particular, we now
include a unique reference number for each site.
V2: Accessibility – Data is free and equally available to all, published on gov.uk with no
restrictions to access. Underlying data is published up to the extent our commercial licenses
allow, with banded variables where we cannot provide exact figures. Commentary is objective
and a range of graphical visualisations are used to aid comprehension.
V3: Clarity and insight – Commentary on the current size and shape of the life sciences
sector is objective, focussing on impartial statistical messages. Charts and maps are used to
illustrate these. Key statistical messages are highlighted up front. A comparison between the
health life sciences database and ONS SIC codes, the main alternative source, is presented
in Annex 2. The database itself is created through collaboration with a range of industry
experts, including region-specific and sector-specific representation through trade bodies and
other network organisations.

39
V4: Innovation and improvement – We review content, presentation and methodology each
year based on user needs. Past development has primarily been around scope and how to
identify new and emerging segments of the life sciences sector, e.g. digital health and
genomics. Each new approach to scope is explored and tested with our data partners, and
the statistical impact is fully considered before implementation. Other developments have
included extending the scope of publicly available data fields.
V5: Efficiency and proportionality – Where possible, the database draws on existing
information using third party sources, such as the D&B and FAME datasets and company
accounts. All data partners are voluntary contributors. The need for this health life sciences
database and report arises from the difficulty in identifying the life sciences sector from
already-existing ONS sources since they use SIC codes, which do not encapsulate the full
extent of the life sciences. In particular, as SIC codes were last refreshed in 2008, they do not
allow easy identification of new and emerging segments within the medical technology sector,
such as digital health. The database and report provide a valuable and robust evidence base
on the size and shape of the UK life science sector.