Embed Size (px)
Citation preview
Biosensors and Bioelectronics 62 (2014) 343–349
Contents lists available at ScienceDirect
Biosensors and Bioelectronics
http://d0956-56
n CorrCooperfax: þ1
E-m1 Cu
Baylor C2 Cu
Comput
journal homepage: www.elsevier.com/locate/bios
Parallel recognition of cancer cells using an addressable arrayof solid-state micropores
Azhar Ilyas a,b,c,1, Waseem Asghar a,b,c,2, Young-tae Kim c,d, Samir M. Iqbal a,b,c,d,e,f,n
a Nano-Bio Lab, University of Texas at Arlington, Arlington, TX 76019, USAb Department of Electrical Engineering, University of Texas at Arlington, Arlington, TX 76011, USAc Nanotechnology Research Center, University of Texas at Arlington, Arlington, TX 76019, USAd Department of Bioengineering, University of Texas at Arlington, Arlington, TX 76010, USAe Joint Graduate Committee of Bioengineering Program, University of Texas at Arlington and University of Texas Southwestern Medical Center at Dallas,University of Texas at Arlington, Arlington, TX 76010, USAf Department of Urology, University of Texas Southwestern Medical Center at Dallas, Dallas, TX 75390, USA
a r t i c l e i n f o
Article history:Received 16 April 2014Received in revised form20 June 2014Accepted 24 June 2014Available online 27 June 2014
Keywords:CTCTranslocation profilePulse signalLeukocytesDetection efficiencySingle-cell measurementSingle-cell analysis
x.doi.org/10.1016/j.bios.2014.06.04863/& 2014 Elsevier B.V. All rights reserved.
esponding author at: Nano-Bio Lab, UniversityStreet, Room #217, Arlington, TX 76019,817 272 7458.ail address: [email protected] (S.M. Iqbal).rrent address: Department of Biomedical Sciollege of Dentistry, Dallas, TX 75246, USA.rrent address: Department of Computer &er Science, Florida Atlantic University, Boca R
a b s t r a c t
Early stage detection and precise quantification of circulating tumor cells (CTCs) in the peripheral bloodof cancer patients are important for early diagnosis. Early diagnosis improves the effectiveness of thetherapy and results in better prognosis. Several techniques have been used for CTC detection but arelimited by their need for dye tagging, low throughput and lack of statistical reliability at single cell level.Solid-state micropores can characterize each cell in a sample providing interesting information aboutcellular populations. We report a multi-channel device which utilized solid-state micropores arrayassembly for simultaneous measurement of cell translocation. This increased the throughput ofmeasurement and as the cells passed the micropores, tumor cells showed distinctive current blockadepulses, when compared to leukocytes. The ionic current across each micropore channel was continuouslymonitored and recorded. The measurement system not only increased throughput but also provided on-chip cross-relation. The whole blood was lysed to get rid of red blood cells, so the blood dilution was notneeded. The approach facilitated faster processing of blood samples with tumor cell detection efficiencyof about 70%. The design provided a simple and inexpensive method for rapid and reliable detection oftumor cells without any cell staining or surface functionalization. The device can also be used for highthroughput electrophysiological analysis of other cell types.
& 2014 Elsevier B.V. All rights reserved.
1. Introduction
The shedding of tumor cells in peripheral blood was initiallyreported in 1889 (Paget, 1889). The circulating tumor cells (CTCs)are believed to detach from the primary tumor and spread throughblood circulation or lymph nodes to secondary tissues (Kohn andLiotta, 1995). Patients with various types of cancers (breast,bladder, and renal) have been known to have CTCs in theirperipheral blood (Cristofanilli et al., 2004; Lianidou and Markou,2011; Loberg et al., 2004; Soria et al., 2002; Terstappen et al.,2000). Rapid recognition and accurate enumeration of CTCs in the
of Texas at Arlington, 500 S.USA. Tel.: þ1 817 272 0228;
ences, Texas A&M University,
Electrical Engineering andaton, FL 33431, USA.
peripheral blood can help in early diagnosis and to monitor thetherapeutic efficiency. Reports show that number of CTCs can riseto 5000 CTCs per ml of blood in prostate cancer patients (Stottet al., 2010). But generally, CTCs are exceedingly low in number(1–200 cells per ml) which makes it very difficult to identify andquantify them from the whole blood at earlier stages of disease(Kahn et al., 2004; Krivacic et al., 2004; Nagrath et al., 2007; Rolleet al., 2005). Ultra-low concentration of CTCs in peripheral bloodessentially calls for faster and efficient processing of blood sample.
The schemes employed for the isolation and quantification ofCTCs include microfluidic flow cytometry, polycarbonate mem-brane filtration (size-based separation), chromatographic isolationand use of immunomagnetic systems (magnetic dynabeads) (Fuet al., 1999; Nagrath et al., 2007; Vona et al., 2000; Zabaglo et al.,2003). These techniques are limited by either low-throughput orthe need for dye tags for cell quantification. Some of thesestrategies require expensive equipment and cannot be used as apoint-of-care module (Adams et al., 2008; Zabaglo et al., 2003).Recently, Hosokawa et al. (2013) have reported a microcavity array
A. Ilyas et al. / Biosensors and Bioelectronics 62 (2014) 343–349344
system for size-based isolation and fluorescence-based quantifica-tion of CTCs from blood samples of advanced lung cancer patients.Though elegant, it also required fluorescent labeling for CTCenumeration. Solid-state micropores have been used for patchclamp measurements, electroporation, cell deformability examina-tion and size based discrimination of cells (Matthews and Judy,2006; Niu and Yan, 2001; ul Haque et al., 2009). The use of solid-state micropores in such a variety of applications owes it to theirmechanical strength and thermal/chemical stability. Differenttechniques to drill micropores include deep reactive ion etching(DRIE), anisotropic etching of silicon, electrochemical etching andion/electron beam sculpting (Li et al., 2001; Pantoja et al., 2004;Sugita et al., 2013). We have reported before a single solid-statemicropore device for electrical detection of CTCs fromwhole blood(Asghar et al., 2012). Single channel detection faces a majorchallenge of high processing time. Here, we report a multi-channeldevice that utilizes multiple micropores for parallel recognition oftumor cells. As a model, an assay of two parallel micropores wasused in a Teflon device assembly for simultaneous recording ofionic current flow across each of the two micropores. The devicewas able to detect tumor cells from the blood sample with 70%detection efficiency.
The CTCs are larger in size compared to other blood based cellsand have different mechanical properties (Vona et al., 2000).Metastasis formulates them to be even more elastic since theyneed to squeeze through the surrounding tissues and enter thecirculatory system (Ward et al., 1991; Wyckoff et al., 2000).Different morphology and biomechanical properties (size, shape,elasticity, viscosity, and stiffness) of tumor cells can be exploited todiscriminate them from other cell types. The scheme reported heredistinguishes the cancer cells from whole blood in a simple,inexpensive and speedy process that does not require any cellstaining, surface functionalization or expensive equipment.
The cells were suspended in sodium chloride (0.85% w/v)solution and pushed under fluidic pressure. Separate Ag/AgClelectrode pairs were used to measure the ionic current across
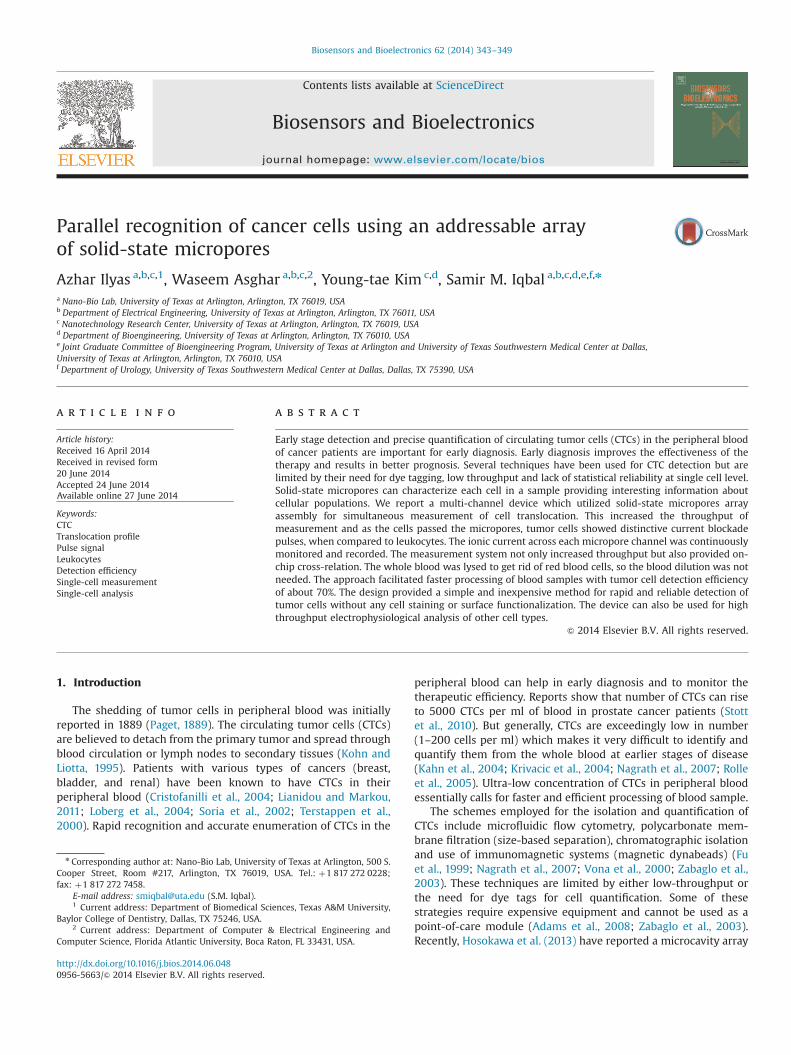
Fig. 1. Fabrication of solid-state micropores. (a) Thermally grown 200 nm thick oxide laysquare windows in the spin casted photoresist layer. (c) Transfer of square window pattTMAH which results in oxide membrane on the other side of the wafer (bottom side).
each micropore. Physical blockage of the micropore due to celltranslocating through the micropore caused a drop in ionic currentflow and an electrical pulse signal was recorded. The system wasoptimized for parallel recognition of cells and simultaneousrecording of data without missing any translocation events. Tumorcells were identified by their characteristic pulse signals. Pulsemagnitude, pulse duration and pulse shape were analyzed torecognize the cancer cells. This system can be applied to anautomated and high throughput cellular analysis.
2. Materials and methods
2.1. Micropore device fabrication
All the chemicals were purchased from Sigma-Aldrich (St Louis,MO, USA) unless stated otherwise. The micropore fabricationprocess started with thermal oxidation of a double-side polishedsilicon wafer (100 orientation). The wafer was placed in theoxidation furnace to grow a 200 nm thick oxide layer on bothsides of the wafer as shown in Fig. 1. After piranha cleaning,positive photoresist (Shipley S1813) was spin coated on one side ofthe Si wafer and conventional g-line photolightography was usedto open square windows. Photoresist layer was manually appliedto the other side (bottom) of the wafer to protect the oxide layeragainst buffered hydrofluoric (BHF) acid etch. The square windowpattern was transferred to the underside oxide layer with BHF etchfollowed by removing all the remaining photoresist in acetone.Anisotropic etching of silicon was performed using diluted (25%)tetramethylammonium hydroxide (TMAH) which was maintainedat 90 °C during the process. The silicon wafer was etched throughthe whole wafer thickness until TMAH reached the oxide layer onother side and gave 200 nm thick free-standing SiO2 membranes.An optimized dose (30 kV acceleration voltage, 1 nA millingcurrent, and 260 s exposure time) of focused ion beam (FIB) was
er on both sides of double-side polished silicon wafer. (b) Photolithography to openern to the underlying oxide layer by BHF etch. (d) Anisotropic etch of silicon usingFIB drills micropore in the membrane diaphragm.
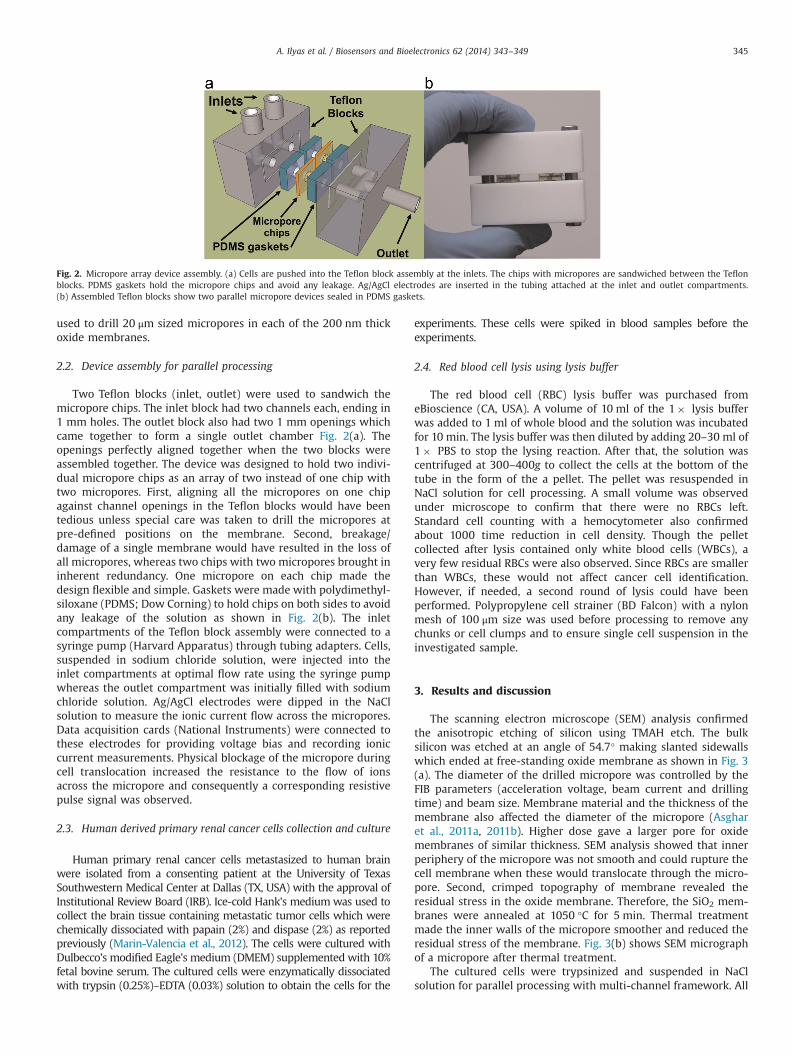
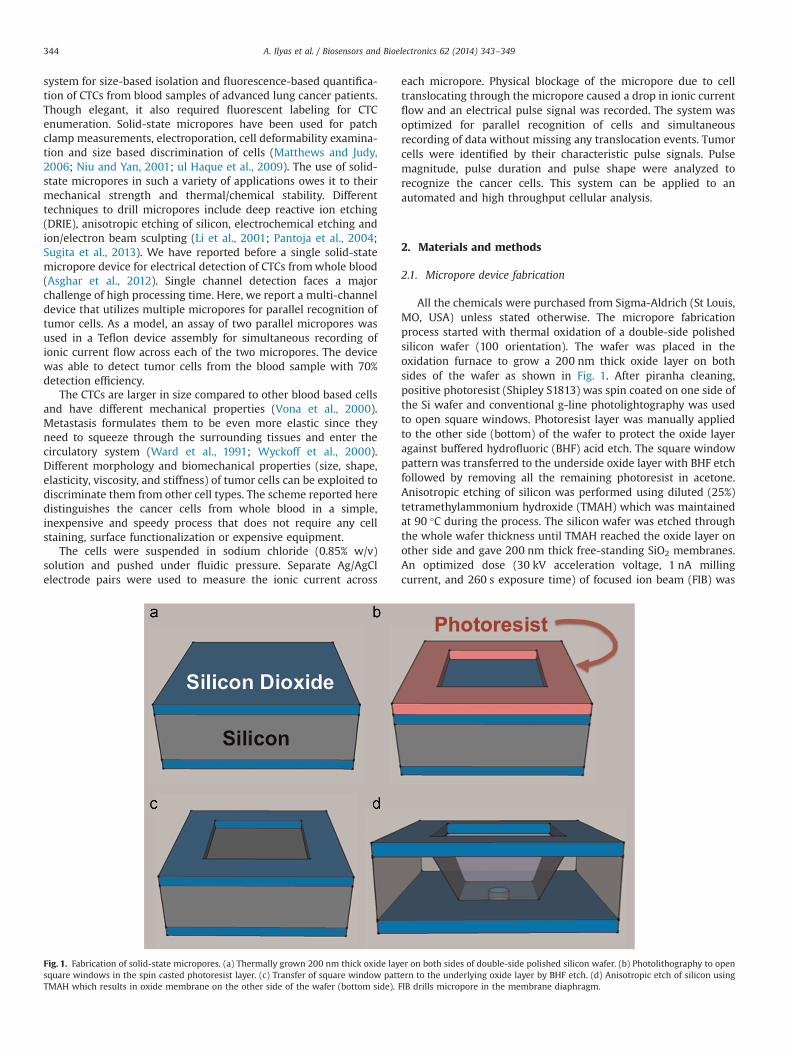
Fig. 2. Micropore array device assembly. (a) Cells are pushed into the Teflon block assembly at the inlets. The chips with micropores are sandwiched between the Teflonblocks. PDMS gaskets hold the micropore chips and avoid any leakage. Ag/AgCl electrodes are inserted in the tubing attached at the inlet and outlet compartments.(b) Assembled Teflon blocks show two parallel micropore devices sealed in PDMS gaskets.
A. Ilyas et al. / Biosensors and Bioelectronics 62 (2014) 343–349 345
used to drill 20 μm sized micropores in each of the 200 nm thickoxide membranes.
2.2. Device assembly for parallel processing
Two Teflon blocks (inlet, outlet) were used to sandwich themicropore chips. The inlet block had two channels each, ending in1 mm holes. The outlet block also had two 1 mm openings whichcame together to form a single outlet chamber Fig. 2(a). Theopenings perfectly aligned together when the two blocks wereassembled together. The device was designed to hold two indivi-dual micropore chips as an array of two instead of one chip withtwo micropores. First, aligning all the micropores on one chipagainst channel openings in the Teflon blocks would have beentedious unless special care was taken to drill the micropores atpre-defined positions on the membrane. Second, breakage/damage of a single membrane would have resulted in the loss ofall micropores, whereas two chips with two micropores brought ininherent redundancy. One micropore on each chip made thedesign flexible and simple. Gaskets were made with polydimethyl-siloxane (PDMS; Dow Corning) to hold chips on both sides to avoidany leakage of the solution as shown in Fig. 2(b). The inletcompartments of the Teflon block assembly were connected to asyringe pump (Harvard Apparatus) through tubing adapters. Cells,suspended in sodium chloride solution, were injected into theinlet compartments at optimal flow rate using the syringe pumpwhereas the outlet compartment was initially filled with sodiumchloride solution. Ag/AgCl electrodes were dipped in the NaClsolution to measure the ionic current flow across the micropores.Data acquisition cards (National Instruments) were connected tothese electrodes for providing voltage bias and recording ioniccurrent measurements. Physical blockage of the micropore duringcell translocation increased the resistance to the flow of ionsacross the micropore and consequently a corresponding resistivepulse signal was observed.
2.3. Human derived primary renal cancer cells collection and culture
Human primary renal cancer cells metastasized to human brainwere isolated from a consenting patient at the University of TexasSouthwestern Medical Center at Dallas (TX, USA) with the approval ofInstitutional Review Board (IRB). Ice-cold Hank's mediumwas used tocollect the brain tissue containing metastatic tumor cells which werechemically dissociated with papain (2%) and dispase (2%) as reportedpreviously (Marin-Valencia et al., 2012). The cells were cultured withDulbecco's modified Eagle's medium (DMEM) supplemented with 10%fetal bovine serum. The cultured cells were enzymatically dissociatedwith trypsin (0.25%)–EDTA (0.03%) solution to obtain the cells for the
experiments. These cells were spiked in blood samples before theexperiments.
2.4. Red blood cell lysis using lysis buffer
The red blood cell (RBC) lysis buffer was purchased fromeBioscience (CA, USA). A volume of 10 ml of the 1� lysis bufferwas added to 1 ml of whole blood and the solution was incubatedfor 10 min. The lysis buffer was then diluted by adding 20–30 ml of1� PBS to stop the lysing reaction. After that, the solution wascentrifuged at 300–400g to collect the cells at the bottom of thetube in the form of the a pellet. The pellet was resuspended inNaCl solution for cell processing. A small volume was observedunder microscope to confirm that there were no RBCs left.Standard cell counting with a hemocytometer also confirmedabout 1000 time reduction in cell density. Though the pelletcollected after lysis contained only white blood cells (WBCs), avery few residual RBCs were also observed. Since RBCs are smallerthan WBCs, these would not affect cancer cell identification.However, if needed, a second round of lysis could have beenperformed. Polypropylene cell strainer (BD Falcon) with a nylonmesh of 100 μm size was used before processing to remove anychunks or cell clumps and to ensure single cell suspension in theinvestigated sample.
3. Results and discussion
The scanning electron microscope (SEM) analysis confirmedthe anisotropic etching of silicon using TMAH etch. The bulksilicon was etched at an angle of 54.7° making slanted sidewallswhich ended at free-standing oxide membrane as shown in Fig. 3(a). The diameter of the drilled micropore was controlled by theFIB parameters (acceleration voltage, beam current and drillingtime) and beam size. Membrane material and the thickness of themembrane also affected the diameter of the micropore (Asgharet al., 2011a, 2011b). Higher dose gave a larger pore for oxidemembranes of similar thickness. SEM analysis showed that innerperiphery of the micropore was not smooth and could rupture thecell membrane when these would translocate through the micro-pore. Second, crimped topography of membrane revealed theresidual stress in the oxide membrane. Therefore, the SiO2 mem-branes were annealed at 1050 °C for 5 min. Thermal treatmentmade the inner walls of the micropore smoother and reduced theresidual stress of the membrane. Fig. 3(b) shows SEM micrographof a micropore after thermal treatment.
The cultured cells were trypsinized and suspended in NaClsolution for parallel processing with multi-channel framework. All
Fig. 3. Micropore fabrication and cell suspension. (a) SEM micrograph shows slanted sidewalls in bulk silicon ending at oxide membrane (center) after TMAH etch. (b) SEMmicrograph of a micropore drilled in the oxide membrane after thermal annealing. (c) Optical micrograph shows that renal cancer cells (pointed by arrow) are larger in sizethan WBCs. The disaggregated cells are seen to be healthy and hold spherical shape in suspension.
A. Ilyas et al. / Biosensors and Bioelectronics 62 (2014) 343–349346
the disaggregated cells held spherical shape in suspension andwere found healthy after trypsinization. Trypan Blue exclusion dye(0.4%) was used to assess the viability of the cells and measure-ments on hemocytometer showed that more than 94% of disso-ciated cells were viable. The optical micrograph for the mixed cellsuspension is shown in Fig. 3(c), which reveals that humanprimary renal cancer cells (pointed by arrow) are much larger insize (average diameter �30 μm) compared to the white blood cells(WBCs).
Multi-channel micropores were assembled as explained inSection 2. Micropore diameter, membrane thickness, flow rateand sampling frequency were critical parameters to optimize forthe best translocation data. Translocation profile of cells signifi-cantly changed if any of these parameters varied (except mem-brane thickness). When a cell translocated through the micropore,physical blockage of the micropore reduced the conductivity of themicropore by offering more resistance to the flow of ionic current.Resistance to the flow of current is given by R¼ρL/A where ρ is theresistivity of NaCl (0.85% w/v) solution, L denotes the thickness ofoxide membrane (length of the micropore) and A represents theeffective area of the micropore. Therefore, physical blockage of themicropore altered the effective area which consequently changedthe resistance across the micropore and a drop in ionic currentwas recorded for every translocating cell. Since the drop in current(amplitude) and the time taken by the cell to pass through themicropore (pulse width) were strongly coupled with the biome-chanical (size, shape, and stiffness) properties of the cell, char-acteristic pulse signals were observed for each cell type. Both thechannels showed similar translocation profiles for specific celltypes as shown in Fig. 4. As explained above, the pulse frequencyrepresents the cell concentration and can be used for cell counting.A high concentration (10k cells per ml) and a low concentration(100 cells per ml) of human primary renal cancer cells weresuspended separately in NaCl solution. The samples were pro-cessed separately for 30 min using the multi-channel device at
optimized settings. The number of pulses reflected the cell con-centration which illustrated the capability of the device to quantifythe cancer cells (Fig. 4(b)). It also showed high sensitivity of thedevice demonstrated by detecting a very low concentration ofcells. The translocation profile was found to be steady regardless ofthe cell concentration or the time (Fig. 4(c)). It validated theconsistency and reliability of the device for long measurements.
The key objective of parallel recognition was to increase thethroughput by rapid processing of blood samples. The exposure tolysis buffer reduced the cell concentration per ml of blood by threeorders of magnitude which eliminated the need for blood dilution.In other works, the whole blood has to be diluted as much as 10times to avoid blockage/clogging of micropore (Asghar et al.,2012). Dilution raised the sample volume by 10 times andfurthermore single micropore measurements made it a very lowthroughput system. The array scheme made it a rapid processingdevice. Moreover, cells collected from 1 ml of blood were resus-pended in 500 μl of NaCl solution which reduced the samplevolume by half while keeping the cell density still low enough tobe processed by the device without getting blocked. Thus, just byadding one extra channel, the throughput increased by 40 times.At optimized flow rate, it took only 25 min to process 1 ml ofblood.
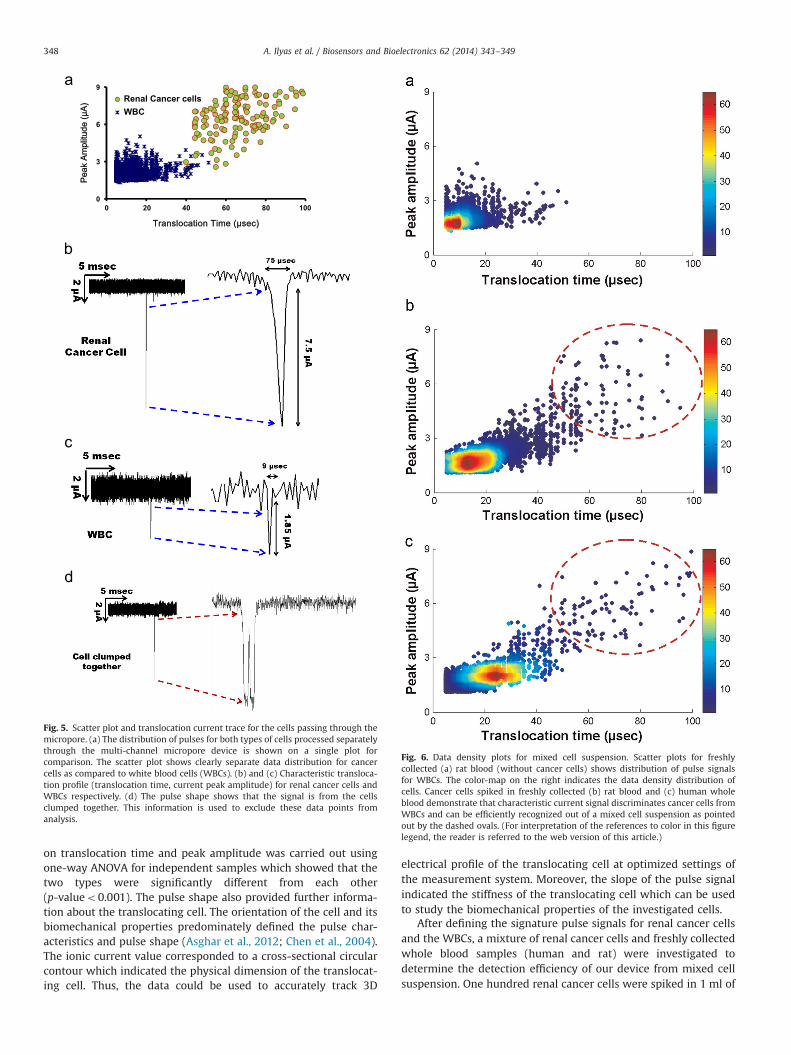
The metastatic renal cancer cells gave distinctive currentblockage statistics. As already mentioned, WBCs were smaller insize so these offered lesser physical blockage to the microporewhich showed different translocation profiles. The experimentswere repeated at least three times and similar results wereobserved. The pulse characteristics (pulse width, peak amplitude)showed that cancer cells were easily identifiable as can be seen inFig. 5(a) which displays the two scatter plots combined; one forpulse distributions for cell suspensions containing only cancerouscells and the second for only WBCs. The cell suspensions for twocell types were processed separately and the distributions ofelectrical profiles are drawn on the same plot to have a clear view
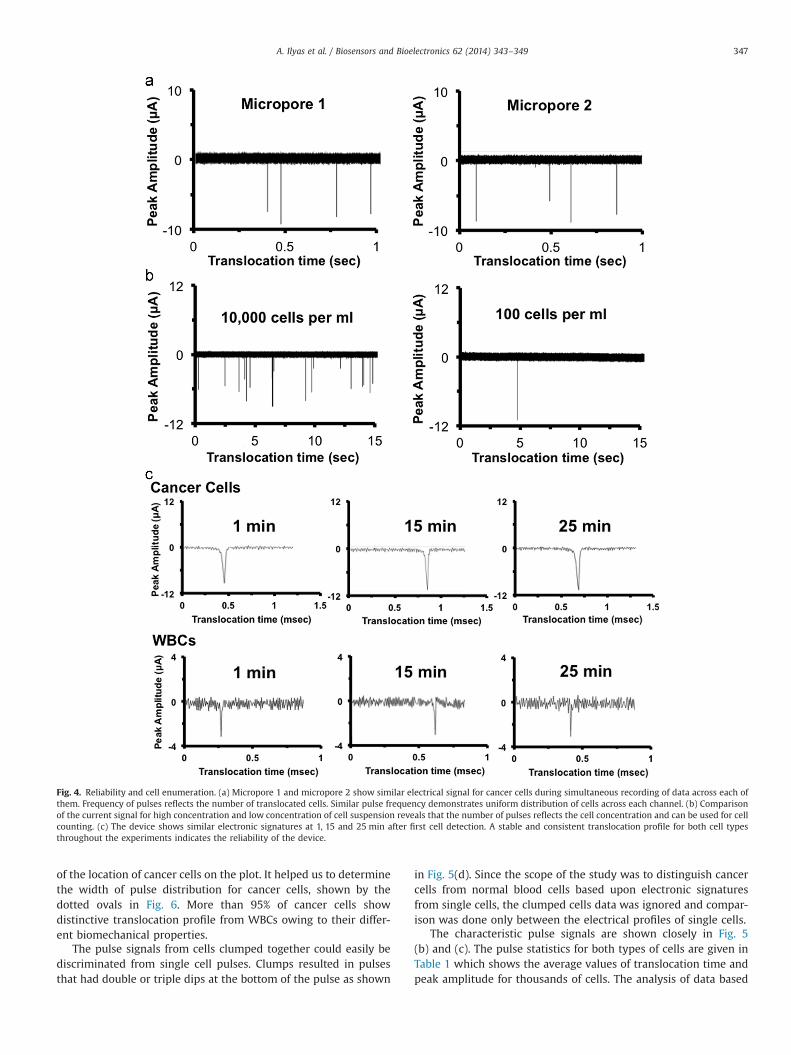
Fig. 4. Reliability and cell enumeration. (a) Micropore 1 and micropore 2 show similar electrical signal for cancer cells during simultaneous recording of data across each ofthem. Frequency of pulses reflects the number of translocated cells. Similar pulse frequency demonstrates uniform distribution of cells across each channel. (b) Comparisonof the current signal for high concentration and low concentration of cell suspension reveals that the number of pulses reflects the cell concentration and can be used for cellcounting. (c) The device shows similar electronic signatures at 1, 15 and 25 min after first cell detection. A stable and consistent translocation profile for both cell typesthroughout the experiments indicates the reliability of the device.
A. Ilyas et al. / Biosensors and Bioelectronics 62 (2014) 343–349 347
of the location of cancer cells on the plot. It helped us to determinethe width of pulse distribution for cancer cells, shown by thedotted ovals in Fig. 6. More than 95% of cancer cells showdistinctive translocation profile from WBCs owing to their differ-ent biomechanical properties.
The pulse signals from cells clumped together could easily bediscriminated from single cell pulses. Clumps resulted in pulsesthat had double or triple dips at the bottom of the pulse as shown
in Fig. 5(d). Since the scope of the study was to distinguish cancercells from normal blood cells based upon electronic signaturesfrom single cells, the clumped cells data was ignored and compar-ison was done only between the electrical profiles of single cells.
The characteristic pulse signals are shown closely in Fig. 5(b) and (c). The pulse statistics for both types of cells are given inTable 1 which shows the average values of translocation time andpeak amplitude for thousands of cells. The analysis of data based
0
3
6
9
0 20 40 60 80 100
Pea
k A
mpl
itude
(μA
)P
eak
Am
plitu
de (μ
A)
Translocation Time (μsec)Translocation Time (μsec)
Renal Cancer cellsWBC
Fig. 5. Scatter plot and translocation current trace for the cells passing through themicropore. (a) The distribution of pulses for both types of cells processed separatelythrough the multi-channel micropore device is shown on a single plot forcomparison. The scatter plot shows clearly separate data distribution for cancercells as compared to white blood cells (WBCs). (b) and (c) Characteristic transloca-tion profile (translocation time, current peak amplitude) for renal cancer cells andWBCs respectively. (d) The pulse shape shows that the signal is from the cellsclumped together. This information is used to exclude these data points fromanalysis.
Fig. 6. Data density plots for mixed cell suspension. Scatter plots for freshlycollected (a) rat blood (without cancer cells) shows distribution of pulse signalsfor WBCs. The color-map on the right indicates the data density distribution ofcells. Cancer cells spiked in freshly collected (b) rat blood and (c) human wholeblood demonstrate that characteristic current signal discriminates cancer cells fromWBCs and can be efficiently recognized out of a mixed cell suspension as pointedout by the dashed ovals. (For interpretation of the references to color in this figurelegend, the reader is referred to the web version of this article.)
A. Ilyas et al. / Biosensors and Bioelectronics 62 (2014) 343–349348
on translocation time and peak amplitude was carried out usingone-way ANOVA for independent samples which showed that thetwo types were significantly different from each other(p-valueo0.001). The pulse shape also provided further informa-tion about the translocating cell. The orientation of the cell and itsbiomechanical properties predominately defined the pulse char-acteristics and pulse shape (Asghar et al., 2012; Chen et al., 2004).The ionic current value corresponded to a cross-sectional circularcontour which indicated the physical dimension of the translocat-ing cell. Thus, the data could be used to accurately track 3D
electrical profile of the translocating cell at optimized settings ofthe measurement system. Moreover, the slope of the pulse signalindicated the stiffness of the translocating cell which can be usedto study the biomechanical properties of the investigated cells.
After defining the signature pulse signals for renal cancer cellsand the WBCs, a mixture of renal cancer cells and freshly collectedwhole blood samples (human and rat) were investigated todetermine the detection efficiency of our device from mixed cellsuspension. One hundred renal cancer cells were spiked in 1 ml of
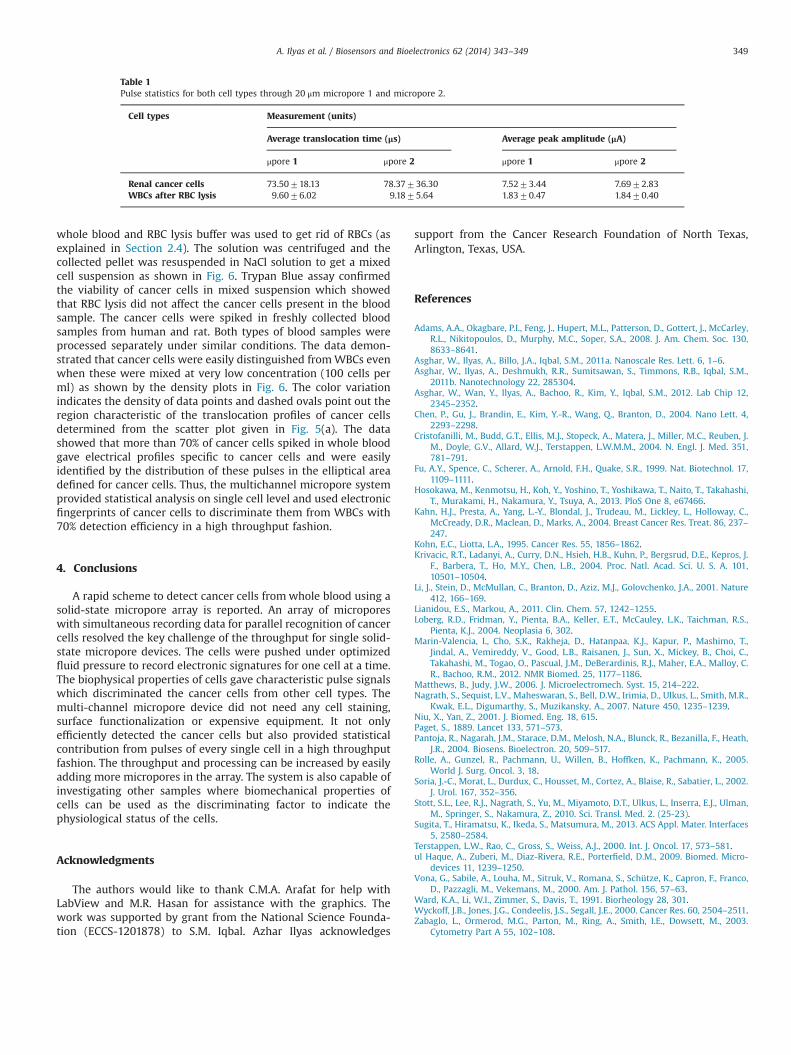
Table 1Pulse statistics for both cell types through 20 μm micropore 1 and micropore 2.
Cell types Measurement (units)
Average translocation time (μs) Average peak amplitude (μA)
μpore 1 μpore 2 μpore 1 μpore 2
Renal cancer cells 73.50718.13 78.37736.30 7.5273.44 7.6972.83WBCs after RBC lysis 9.6076.02 9.1875.64 1.8370.47 1.8470.40
A. Ilyas et al. / Biosensors and Bioelectronics 62 (2014) 343–349 349
whole blood and RBC lysis buffer was used to get rid of RBCs (asexplained in Section 2.4). The solution was centrifuged and thecollected pellet was resuspended in NaCl solution to get a mixedcell suspension as shown in Fig. 6. Trypan Blue assay confirmedthe viability of cancer cells in mixed suspension which showedthat RBC lysis did not affect the cancer cells present in the bloodsample. The cancer cells were spiked in freshly collected bloodsamples from human and rat. Both types of blood samples wereprocessed separately under similar conditions. The data demon-strated that cancer cells were easily distinguished fromWBCs evenwhen these were mixed at very low concentration (100 cells perml) as shown by the density plots in Fig. 6. The color variationindicates the density of data points and dashed ovals point out theregion characteristic of the translocation profiles of cancer cellsdetermined from the scatter plot given in Fig. 5(a). The datashowed that more than 70% of cancer cells spiked in whole bloodgave electrical profiles specific to cancer cells and were easilyidentified by the distribution of these pulses in the elliptical areadefined for cancer cells. Thus, the multichannel micropore systemprovided statistical analysis on single cell level and used electronicfingerprints of cancer cells to discriminate them from WBCs with70% detection efficiency in a high throughput fashion.
4. Conclusions
A rapid scheme to detect cancer cells from whole blood using asolid-state micropore array is reported. An array of microporeswith simultaneous recording data for parallel recognition of cancercells resolved the key challenge of the throughput for single solid-state micropore devices. The cells were pushed under optimizedfluid pressure to record electronic signatures for one cell at a time.The biophysical properties of cells gave characteristic pulse signalswhich discriminated the cancer cells from other cell types. Themulti-channel micropore device did not need any cell staining,surface functionalization or expensive equipment. It not onlyefficiently detected the cancer cells but also provided statisticalcontribution from pulses of every single cell in a high throughputfashion. The throughput and processing can be increased by easilyadding more micropores in the array. The system is also capable ofinvestigating other samples where biomechanical properties ofcells can be used as the discriminating factor to indicate thephysiological status of the cells.
Acknowledgments
The authors would like to thank C.M.A. Arafat for help withLabView and M.R. Hasan for assistance with the graphics. Thework was supported by grant from the National Science Founda-tion (ECCS-1201878) to S.M. Iqbal. Azhar Ilyas acknowledges
support from the Cancer Research Foundation of North Texas,Arlington, Texas, USA.
References
Adams, A.A., Okagbare, P.I., Feng, J., Hupert, M.L., Patterson, D., Gottert, J., McCarley,R.L., Nikitopoulos, D., Murphy, M.C., Soper, S.A., 2008. J. Am. Chem. Soc. 130,8633–8641.
Asghar, W., Ilyas, A., Billo, J.A., Iqbal, S.M., 2011a. Nanoscale Res. Lett. 6, 1–6.Asghar, W., Ilyas, A., Deshmukh, R.R., Sumitsawan, S., Timmons, R.B., Iqbal, S.M.,
2011b. Nanotechnology 22, 285304.Asghar, W., Wan, Y., Ilyas, A., Bachoo, R., Kim, Y., Iqbal, S.M., 2012. Lab Chip 12,
2345–2352.Chen, P., Gu, J., Brandin, E., Kim, Y.-R., Wang, Q., Branton, D., 2004. Nano Lett. 4,
2293–2298.Cristofanilli, M., Budd, G.T., Ellis, M.J., Stopeck, A., Matera, J., Miller, M.C., Reuben, J.
M., Doyle, G.V., Allard, W.J., Terstappen, L.W.M.M., 2004. N. Engl. J. Med. 351,781–791.
Fu, A.Y., Spence, C., Scherer, A., Arnold, F.H., Quake, S.R., 1999. Nat. Biotechnol. 17,1109–1111.
Hosokawa, M., Kenmotsu, H., Koh, Y., Yoshino, T., Yoshikawa, T., Naito, T., Takahashi,T., Murakami, H., Nakamura, Y., Tsuya, A., 2013. PloS One 8, e67466.
Kahn, H.J., Presta, A., Yang, L.-Y., Blondal, J., Trudeau, M., Lickley, L., Holloway, C.,McCready, D.R., Maclean, D., Marks, A., 2004. Breast Cancer Res. Treat. 86, 237–247.
Kohn, E.C., Liotta, L.A., 1995. Cancer Res. 55, 1856–1862.Krivacic, R.T., Ladanyi, A., Curry, D.N., Hsieh, H.B., Kuhn, P., Bergsrud, D.E., Kepros, J.
F., Barbera, T., Ho, M.Y., Chen, L.B., 2004. Proc. Natl. Acad. Sci. U. S. A. 101,10501–10504.
Li, J., Stein, D., McMullan, C., Branton, D., Aziz, M.J., Golovchenko, J.A., 2001. Nature412, 166–169.
Lianidou, E.S., Markou, A., 2011. Clin. Chem. 57, 1242–1255.Loberg, R.D., Fridman, Y., Pienta, B.A., Keller, E.T., McCauley, L.K., Taichman, R.S.,
Pienta, K.J., 2004. Neoplasia 6, 302.Marin-Valencia, I., Cho, S.K., Rakheja, D., Hatanpaa, K.J., Kapur, P., Mashimo, T.,
Jindal, A., Vemireddy, V., Good, L.B., Raisanen, J., Sun, X., Mickey, B., Choi, C.,Takahashi, M., Togao, O., Pascual, J.M., DeBerardinis, R.J., Maher, E.A., Malloy, C.R., Bachoo, R.M., 2012. NMR Biomed. 25, 1177–1186.
Matthews, B., Judy, J.W., 2006. J. Microelectromech. Syst. 15, 214–222.Nagrath, S., Sequist, L.V., Maheswaran, S., Bell, D.W., Irimia, D., Ulkus, L., Smith, M.R.,
Kwak, E.L., Digumarthy, S., Muzikansky, A., 2007. Nature 450, 1235–1239.Niu, X., Yan, Z., 2001. J. Biomed. Eng. 18, 615.Paget, S., 1889. Lancet 133, 571–573.Pantoja, R., Nagarah, J.M., Starace, D.M., Melosh, N.A., Blunck, R., Bezanilla, F., Heath,
J.R., 2004. Biosens. Bioelectron. 20, 509–517.Rolle, A., Gunzel, R., Pachmann, U., Willen, B., Hoffken, K., Pachmann, K., 2005.
World J. Surg. Oncol. 3, 18.Soria, J.-C., Morat, L., Durdux, C., Housset, M., Cortez, A., Blaise, R., Sabatier, L., 2002.
J. Urol. 167, 352–356.Stott, S.L., Lee, R.J., Nagrath, S., Yu, M., Miyamoto, D.T., Ulkus, L., Inserra, E.J., Ulman,
M., Springer, S., Nakamura, Z., 2010. Sci. Transl. Med. 2. (25-23).Sugita, T., Hiramatsu, K., Ikeda, S., Matsumura, M., 2013. ACS Appl. Mater. Interfaces
5, 2580–2584.Terstappen, L.W., Rao, C., Gross, S., Weiss, A.J., 2000. Int. J. Oncol. 17, 573–581.ul Haque, A., Zuberi, M., Diaz-Rivera, R.E., Porterfield, D.M., 2009. Biomed. Micro-
devices 11, 1239–1250.Vona, G., Sabile, A., Louha, M., Sitruk, V., Romana, S., Schütze, K., Capron, F., Franco,
D., Pazzagli, M., Vekemans, M., 2000. Am. J. Pathol. 156, 57–63.Ward, K.A., Li, W.I., Zimmer, S., Davis, T., 1991. Biorheology 28, 301.Wyckoff, J.B., Jones, J.G., Condeelis, J.S., Segall, J.E., 2000. Cancer Res. 60, 2504–2511.Zabaglo, L., Ormerod, M.G., Parton, M., Ring, A., Smith, I.E., Dowsett, M., 2003.
Cytometry Part A 55, 102–108.