Embed Size (px)
Citation preview

Biosensors for immune cell analysis—A perspectiveAlexander Revzin, Emanual Maverakis, and H.-C. Chang Citation: Biomicrofluidics 6, 021301 (2012); doi: 10.1063/1.4706845 View online: http://dx.doi.org/10.1063/1.4706845 View Table of Contents: http://bmf.aip.org/resource/1/BIOMGB/v6/i2 Published by the American Institute of Physics. Related ArticlesDeformation measurement of individual cells in large populations using a single-cell microchamber array chip Appl. Phys. Lett. 100, 173702 (2012) Flow biosensing and sampling in indirect electrochemical detection Biomicrofluidics 6, 024114 (2012) Covalently immobilized biomolecule gradient on hydrogel surface using a gradient generating microfluidic devicefor a quantitative mesenchymal stem cell study Biomicrofluidics 6, 024111 (2012) High-performance microfluidic rectifier based on sudden expansion channel with embedded block structure Biomicrofluidics 6, 024108 (2012) Microstripes for transport and separation of magnetic particles Biomicrofluidics 6, 024110 (2012) Additional information on BiomicrofluidicsJournal Homepage: http://bmf.aip.org/ Journal Information: http://bmf.aip.org/about/about_the_journal Top downloads: http://bmf.aip.org/features/most_downloaded Information for Authors: http://bmf.aip.org/authors
Downloaded 26 Apr 2012 to 129.74.161.246. Redistribution subject to AIP license or copyright; see http://bmf.aip.org/about/rights_and_permissions

Biosensors for immune cell analysis—A perspective
Alexander Revzin,1 Emanual Maverakis,2,3 and H.-C. Chang4
1Department of Biomedical Engineering, University of California Davis, 451 HealthSciences Dr. #2519, Davis, California 95616, USA2Department of Dermatology, University of California Davis, 3301 C Street, Suite 1400,Sacramento, California 95816, USA3Department of Veteran Affairs Northern California Health Care System, Sacramento,California 95655, USA4Department of Chemical Engineering, Center for Microfluidics and Medical Diagnostics,University of Notre Dame, Notre Dame, Indiana 46556, USA
(Received 27 January 2012; accepted 10 April 2012; published online 26 April 2012)
Massively parallel analysis of single immune cells or small immune cell colonies
for disease detection, drug screening, and antibody production represents a “killer
app” for the rapidly maturing microfabrication and microfluidic technologies. In
our view, microfabricated solid-phase and flow cytometry platforms of the future
will be complete with biosensors and electrical/mechanical/optical actuators and
will enable multi-parametric analysis of cell function, real-time detection of
secreted signals, and facile retrieval of cells deemed interesting. VC 2012 AmericanInstitute of Physics. [http://dx.doi.org/10.1063/1.4706845]
I. IMMUNOLOGY BACKGROUND
Technologists are in constant search for application and we think that some of the best
“killer apps” for microfluidics/microfabrication are in the rapidly evolving field of immunology.
In addition to protecting the body from pathogenic organisms, such as fungi, protozoa, hel-
minths, and bacteria, it is now known that the immune system also plays a major role in a
diverse set of physiologic and pathologic processes, including wound healing,1 cancer surveil-
lance,2 obesity,3 atherosclerosis,4 diabetes,5 responses to sunburn,6 and autoimmunity.7 How-
ever, after decades of discovery, numerous functions of the immune system still remain to be
fully characterized and this task seems as daunting as ever.
The fact that so much is now known about the immune system is quite remarkable. For
example, as recently as few decades ago, all lymphocytes were thought to be the same, since
they looked identical morphologically (small cells with circular nuclei). Subsequently, Niels
Jerne, Frank Burnet, and David Talmage contributed to the development of the clonal selection
theory.8–11 This theory, originally developed to explain the formation of specific antibodies,
states that B cells have unique antigen specificities. Upon exposure to an antigen, a specific-
immune response is selected and then expanded. Gustav Nossal’s discovery that a single B cell
produces only one antibody provided insurmountable evidence in favor of the clonal selection
theory.12 As the tools for cell analysis improved, T cells were identified as a unique population
distinct from B cells. Although the mechanism by which T cells respond to antigens was not
elucidated until much later,13,14 the clonal selection theory also applies to T cells. As one can
surmise, generating a specific (adaptive) immune response requires thousands of antigen-
specific T and B cells that originate from single cells.
There are multiple steps involved in clonal selection and expansion of lymphocytes. For T
cells, these would include: (1) the digestion of a microbial pathogen by an antigen presenting
cell (APC) (e.g., macrophage or dendtritic cell);15,16 (2) the formation of an immune synapse, a
contact between a peptide-bound major histocompatibility complex (MHC) molecule on the sur-
face of an APC and the T cell receptor (TCR) of a T cell;17 (3) proliferation of the T cell; and
(4) its polarization to secrete a certain profile of cytokines.18
1932-1058/2012/6(2)/021301/13/$30.00 VC 2012 American Institute of Physics6, 021301-1
BIOMICROFLUIDICS 6, 021301 (2012)
Downloaded 26 Apr 2012 to 129.74.161.246. Redistribution subject to AIP license or copyright; see http://bmf.aip.org/about/rights_and_permissions

The complexity of the immune system lies in part in the heterogeneity of immune cells
(leukocytes). Leukocytes reside in nearly all tissues of the body. At the most rudimentary level,
they can be subdivided based on their nuclear morphology; for example, monocytes and lym-
phocytes are “mononuclear” cells, while neutrophils are “polymophonuclear” cells. Cell surface
molecules can further subdivide the different leukocyte populations. The cluster of differentia-
tion (CD) protocol is used for identification of cell surface molecules present on leukocytes.19
Using this nomenclature, T cells can be divided into helper T cells that express CD4 and cyto-
toxic T cells that express CD8 molecules. There are currently 350 known CD molecules and all
have different expression profiles.
In addition to using CD molecules to characterize leukocytes, T cells and other leukocytes
can also be categorized based on the cytokines that they secrete. T helper type 1 (Th1), Th2,
Th9, and Th17 cells have unique cytokine secretion profiles. Each cytokine secretion profile
was likely developed to fight off a particular type of infection.
The need to characterize a large variety of immune cell types based on surface markers
and nuclear morphology spurred the development of several immunological tools including
flow cytometry—an approach for multi-parametric, single cell analysis and sorting that became
widely adopted in biological fields outside of immunology.20 The microfluidics/microfabrication
community has begun to mimic and miniaturize flow cytometers a decade ago21 and is still per-
fecting this technology today.22,23 In addition, multiple other novel technologies are being
developed for immunology applications including (1) protein microarrays,24–28 (2) biosensors
for detection of antibodies or cytokines secreted by single immune cells,29,30 (3) platforms for
creating heterotypic cell pairs,31,32 and (4) cell sorting approaches.33–35
Ultimately, understanding the intricacies of an antigen-specific immune response will ne-
cessitate single cell analysis to evaluate gene regulation, expression of cell surface molecules,
and signaling molecule secretion. Moreover, given how the immune response is orchestrated, it
is important to monitor intercellular communication between immune cells of the same type
(homotypic) and of different types (heterotypic). While analysis of cells based on gene expres-
sion and surface markers are important targets of the bioMEMS community,36 our research
interests and the focus of this perspective lie with cell function analysis and intercellular com-
munications. Below, we discuss several novel microtechnologies that are being developed for
the analysis of T- and B-cell function as well as for monitoring secreted inflammatory markers.
These technologies have applications in infectious disease diagnosis, antibody screening, and
detecting inflammation.
II. MICROTECHNOLOGIES FOR IMMUNE CELL ANALYSIS
A. Immune cell arrays
Development of immune cell arrays is a natural extension of biointerface design and sur-
face micropatterning fields.37,38 In a typical design, surfaces are modified in order to create
periodic patterns of non-fouling and cell adhesive domains. Figure 1 shows one variant of
such a surface with non-fouling regions composed of poly(ethylene glycol) (PEG) and cell ad-
hesive domains containing antibodies or other ligands.39 As highlighted by Figure 1, one
advantage of these surfaces is the periodic and well defined-placement of single cells on a sub-
strate such that individual cells have permanent address on the surface and may be monitored
over time.
The micropatterned surfaces may be viewed as solid-phase cytometry platforms, which in
contrast to flow cytometry, allow the investigator to work with cells affixed to surfaces and to
monitor for temporal changes in the phenotype of specific cells. The utility of such surfaces
was demonstrated, for example, by the Irvine group who studied interactions of T cells with
membrane components of antigen presenting cells.40
Moving beyond the capture and culture of immune cells, technologies are being developed
for massively parallel analysis of cell-secreted molecules (antibodies, cytokines, or small metab-
olites), real-time analysis of cell function, and cell sorting. In this perspective, we begin with a
brief highlight of some of the available technologies, followed by our thoughts on where new
021301-2 Revzin, Maverakis, and Chang Biomicrofluidics 6, 021301 (2012)
Downloaded 26 Apr 2012 to 129.74.161.246. Redistribution subject to AIP license or copyright; see http://bmf.aip.org/about/rights_and_permissions

technologies are heading, and conclude with our vision of the “killer apps” for the integrated
platform.
B. Detection of cell secreted molecules in the cell array
One of the more powerful microtechnologies for high-throughput single cell secretome
analysis was developed by Love and co-workers who called their approach microengrav-
ing.29,30,41,42 It employs microwells fabricated in PDMS to be large enough to house single
cells. The PDMS mold is filled with cells and is pressed against a glass slide pre-coated with
antibodies against secreted molecules. This way the immune cells become enclosed inside and
secrete signaling molecules (antibodies or cytokines) into picoliter volumes. To determine
secreting cells, the cover slip is removed and analyzed using a laser microarray scanner.
Another variant of a platform for analyzing cell-secreted proteins was reported by Kishi and
co-workers who developed microwells so as to place a single cell inside a well and then detect
secreted proteins (antibodies) on its side walls.43 This approach was used to identify production
of influenza and hepatitis B specific antibodies.
The Heath lab had a different take on analyzing the immune cell secretome. This group
micropatterned anti-cytokine antibodies on glass surfaces, enclosed these surfaces inside a
microfluidic device, then captured immune cells within the microfluidic channels, and finally
employed pneumatic actuation to segment channels into smaller, nl volume compartments.44
Based on density of cell seeding into channels, one could ensure that a fraction of chambers
contained single cells. When challenged with antigens, immune cells trapped in the microfluidic
device released cytokines, which were captured in the same small volume next to secreting
cells. This method allowed them to identify polyfunctional T cells capable of producing multi-
ple cytokines.44
Our lab has taken a slightly different angle of attack in developing leukocyte cytometry
platforms. Our original interest was in being able to capture specific leukocyte subsets (i.e.,
CD4 T-helper cells or CD8 cytotoxic T cells) from complex samples such as blood containing
multiple extraneous cell types. Therefore, we began by developing surfaces and washing proto-
cols for capturing CD4 or CD8 T cells45 and demonstrating that the proportions of cells
FIG. 1. An example of solid-phase cytometry platform. Microwells composed of non-fouling hydrogel (PEG) are fabri-
cated on glass. Dimensions of the wells are made large enough to house individual cells. Approximately 1� 106 wells may
be packed onto a standard 3� 1 in glass slide. Upon seeding onto this surface, a large fraction of wells (�70%) will contain
single cells. Reproduced by permission from Revzin et al., Lab on a Chip 5, 30–37 (2005). Copyright VC 2005 by The Royal
Society of Chemistry.
021301-3 Revzin, Maverakis, and Chang Biomicrofluidics 6, 021301 (2012)
Downloaded 26 Apr 2012 to 129.74.161.246. Redistribution subject to AIP license or copyright; see http://bmf.aip.org/about/rights_and_permissions
captured on the surface reflected those in the blood.46 Subsequently, we turned our attention to
analyzing the function of the captured cells. The logic being that in addition to cell numbers
and subset proportions, cell function could be used for diagnostic purposes. Thus, we proposed
two types of immune cell capture and cytokine detection surfaces (shown in Figure 2): (1)
arrays of antibody spots with cell capture spots printed next to cytokine detection spots47,48 and
(2) microwell arrays containing Abs for cell capture and cytokine detection.49,50
These surfaces were integrated into microfluidic devices (Figure 2(c)) and were used to
capture CD4 or CD8 T cells from minimally processed blood and then detect secreted cytokines
(IFN-c, IL-2, and TNF) from the cells. Unlike approaches taken by other groups that require
off-chip purification of T or B cells prior to analysis, we employ either whole blood or RBC-
lysed blood and perform both cell capture and cytokine detection in the same device.47,48 This
may be advantageous for applications where only small amounts of blood are available, such as
pediatric immunology or small animal research or in point of care applications where blood
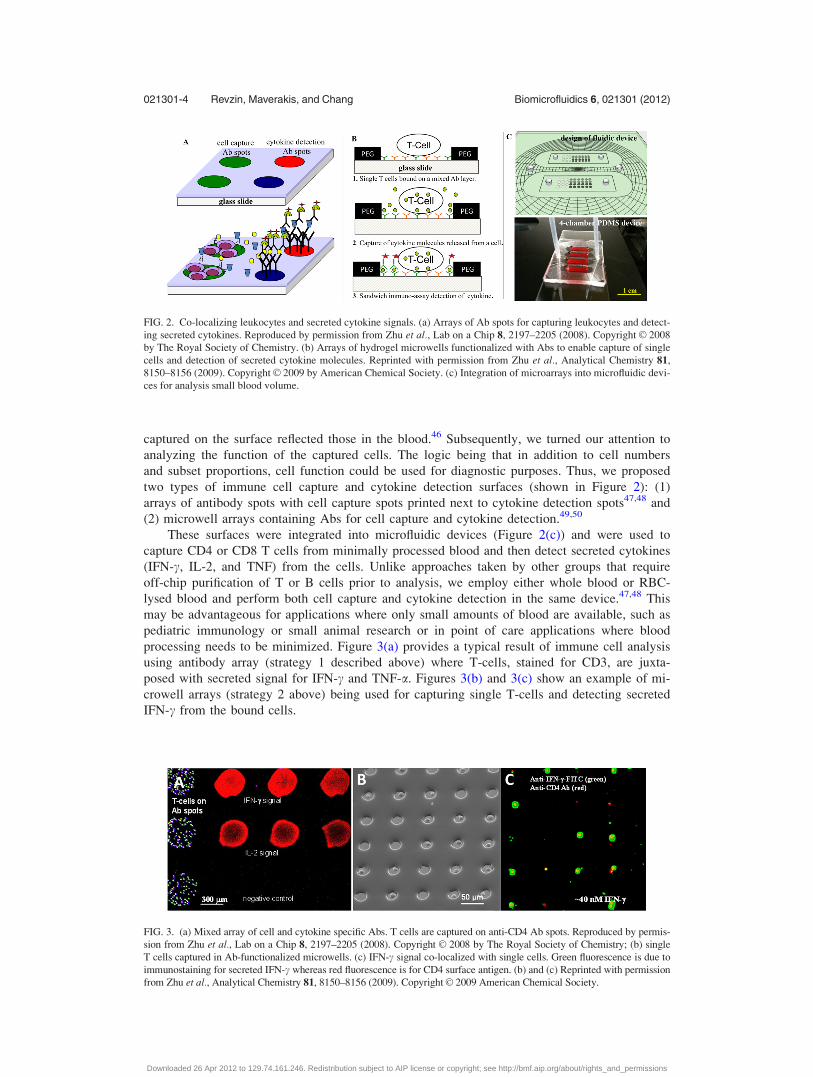
processing needs to be minimized. Figure 3(a) provides a typical result of immune cell analysis
using antibody array (strategy 1 described above) where T-cells, stained for CD3, are juxta-
posed with secreted signal for IFN-c and TNF-a. Figures 3(b) and 3(c) show an example of mi-
crowell arrays (strategy 2 above) being used for capturing single T-cells and detecting secreted
IFN-c from the bound cells.
FIG. 2. Co-localizing leukocytes and secreted cytokine signals. (a) Arrays of Ab spots for capturing leukocytes and detect-
ing secreted cytokines. Reproduced by permission from Zhu et al., Lab on a Chip 8, 2197–2205 (2008). Copyright VC 2008
by The Royal Society of Chemistry. (b) Arrays of hydrogel microwells functionalized with Abs to enable capture of single
cells and detection of secreted cytokine molecules. Reprinted with permission from Zhu et al., Analytical Chemistry 81,
8150–8156 (2009). Copyright VC 2009 by American Chemical Society. (c) Integration of microarrays into microfluidic devi-
ces for analysis small blood volume.
FIG. 3. (a) Mixed array of cell and cytokine specific Abs. T cells are captured on anti-CD4 Ab spots. Reproduced by permis-
sion from Zhu et al., Lab on a Chip 8, 2197–2205 (2008). Copyright VC 2008 by The Royal Society of Chemistry; (b) single
T cells captured in Ab-functionalized microwells. (c) IFN-c signal co-localized with single cells. Green fluorescence is due to
immunostaining for secreted IFN-c whereas red fluorescence is for CD4 surface antigen. (b) and (c) Reprinted with permission
from Zhu et al., Analytical Chemistry 81, 8150–8156 (2009). Copyright VC 2009 American Chemical Society.
021301-4 Revzin, Maverakis, and Chang Biomicrofluidics 6, 021301 (2012)
Downloaded 26 Apr 2012 to 129.74.161.246. Redistribution subject to AIP license or copyright; see http://bmf.aip.org/about/rights_and_permissions
III. NEW DIRECTIONS IN IMMUNE CELL BIOSENSORS
A. Measuring dynamics of cytokine release
Microtechnologies for detecting cytokines and other proteins released by immune cells are
evolving and improving. However, these technologies employ antibodies as biorecognition ele-
ments and therefore, reveal limited information about release dynamics. We see several reasons
for dynamic monitoring of molecules secreted by cells. (1) At the present time, no tools exist
that allow establishing cytokine release vs. time in activated immune cells. It is likely that
potentiation of immune cells—how fast and how strong their secretory response is—carries val-
uable diagnostic information that is currently untapped. (2) Immune cells communicate with
each other via release of cytokines and monitoring local changes in cytokine levels over time
would shine light on cellular interaction in the context of injury or disease. (3) Intercellular
communication may be asymmetric and directional51 and thus, it is valuable to monitor where
and when signals appear. (4) Frequently, intercellular communications are reciprocal and occur
via the same signaling molecules. Deconvolving which cells secreted original signal and which
cells reciprocated requires both spatial and temporal detection.
What is the way forward to dynamic and local monitoring of protein release in cells in
general and immune cells in particular? Several groups are employing Ab-modified surfaces in
conjunction with detection technologies, such as surface plasmon resonance (SPR) to monitor
protein release from cells.52,53 This is a promising direction for dynamic, label-free sensing, but
the problem of expensive instrumentation will need to be addressed and detection of specific
cell-secreted proteins has yet to be demonstrated. Other approaches utilize networks of micro-
fluidic channels to sample extracellular space at different time points and detect cell secreted
proteins using antibodies.54,55 While this is an excellent approach, fluidic circuitry required for
such analyses is fairly complex.
Aptamers provide an exciting opportunity to develop biosensors for continuous monitoring
of cell function. Aptamers, first described in the early 1990s,56,57 are nucleic acid molecules
(RNA or DNA) that offer a number of advantages compared to Abs. The primary advantage, in
our opinion, is the structural simplicity of aptamers that allow one to engineer beacons where
molecular conformation changes upon analyte binding, providing the basis for signal genera-
tion.58,59 Both optical and electrochemical aptasensors have been described in the literature.59,60
Our team has become interested in immobilizing fluorescent and electrochemical aptamer bea-
cons on surfaces for use in cell analysis.61–63 Surfaces for cell analysis are built based on
micropatterning approaches described in Figures 1, 3(b) and 3(c) where hydrogel photolithogra-
phy was used to define non-fouling regions of the surfaces and Ab immobilization is used to
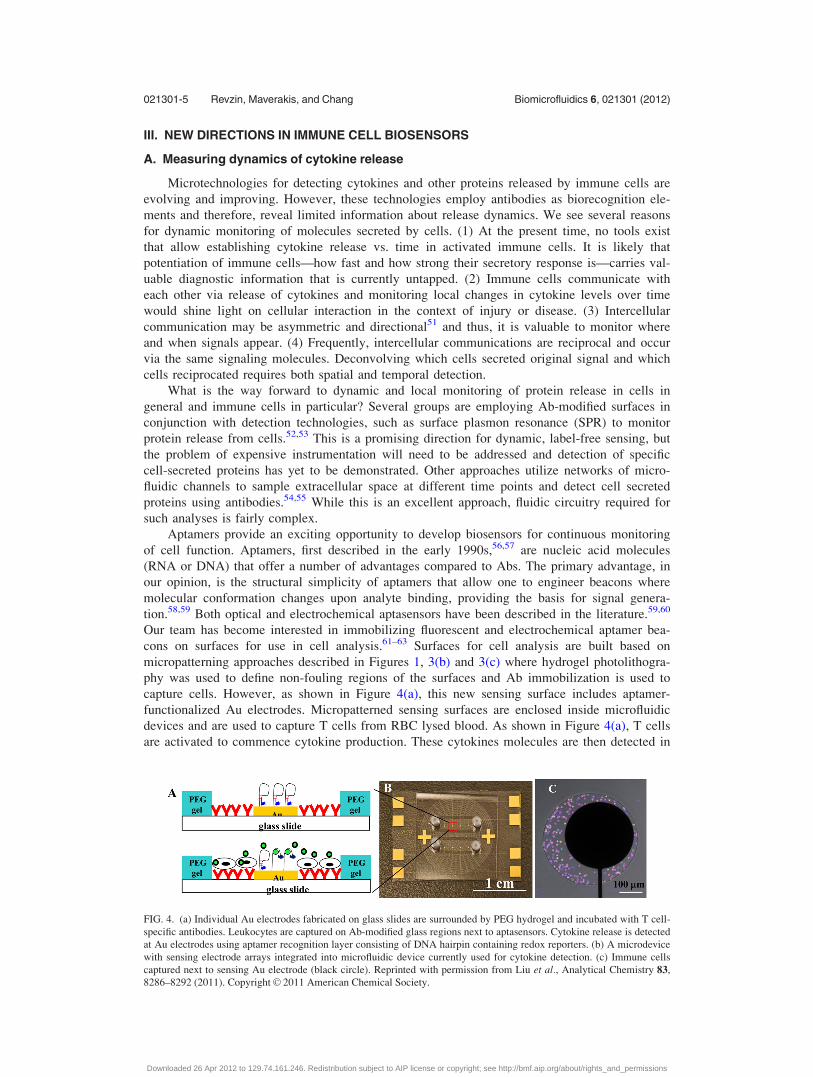
capture cells. However, as shown in Figure 4(a), this new sensing surface includes aptamer-
functionalized Au electrodes. Micropatterned sensing surfaces are enclosed inside microfluidic
devices and are used to capture T cells from RBC lysed blood. As shown in Figure 4(a), T cells
are activated to commence cytokine production. These cytokines molecules are then detected in
FIG. 4. (a) Individual Au electrodes fabricated on glass slides are surrounded by PEG hydrogel and incubated with T cell-
specific antibodies. Leukocytes are captured on Ab-modified glass regions next to aptasensors. Cytokine release is detected
at Au electrodes using aptamer recognition layer consisting of DNA hairpin containing redox reporters. (b) A microdevice
with sensing electrode arrays integrated into microfluidic device currently used for cytokine detection. (c) Immune cells
captured next to sensing Au electrode (black circle). Reprinted with permission from Liu et al., Analytical Chemistry 83,
8286–8292 (2011). Copyright VC 2011 American Chemical Society.
021301-5 Revzin, Maverakis, and Chang Biomicrofluidics 6, 021301 (2012)
Downloaded 26 Apr 2012 to 129.74.161.246. Redistribution subject to AIP license or copyright; see http://bmf.aip.org/about/rights_and_permissions
the form of redox signal at the neighboring electrode. Figure 4(b) shows a cytokine sensing de-
vice which consists of electrode arrays integrated into microfluidic channels with 4 electrodes
per channel. As seen in Figure 4(c), a cell detection site contains T cells captured next to a
cytokine sensing electrode. At the present time, we are able to detect IFN-c (Ref. 64) and TNF
(unpublished) using aptasensors.
The microdevice described in Figure 4 has been used for detection of IFN-c and TNF from
a small group of cells (�50 to 100 cells) with signals observed only minutes after activation of
immune cells. Cytokine fluxes are present in the vicinity of the cells but are undetectable a
short distance (�2 mm) away, highlighting the importance of placing sensors next to cells.
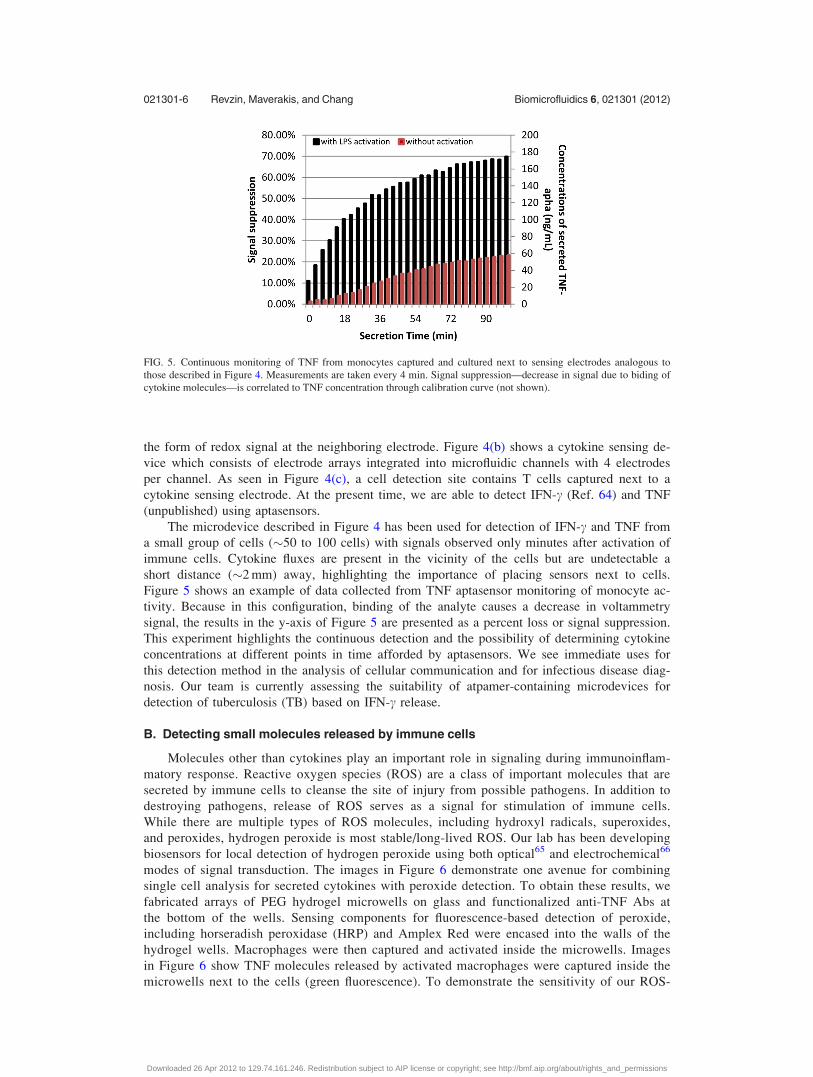
Figure 5 shows an example of data collected from TNF aptasensor monitoring of monocyte ac-
tivity. Because in this configuration, binding of the analyte causes a decrease in voltammetry
signal, the results in the y-axis of Figure 5 are presented as a percent loss or signal suppression.
This experiment highlights the continuous detection and the possibility of determining cytokine
concentrations at different points in time afforded by aptasensors. We see immediate uses for
this detection method in the analysis of cellular communication and for infectious disease diag-
nosis. Our team is currently assessing the suitability of atpamer-containing microdevices for
detection of tuberculosis (TB) based on IFN-c release.
B. Detecting small molecules released by immune cells
Molecules other than cytokines play an important role in signaling during immunoinflam-
matory response. Reactive oxygen species (ROS) are a class of important molecules that are
secreted by immune cells to cleanse the site of injury from possible pathogens. In addition to
destroying pathogens, release of ROS serves as a signal for stimulation of immune cells.
While there are multiple types of ROS molecules, including hydroxyl radicals, superoxides,
and peroxides, hydrogen peroxide is most stable/long-lived ROS. Our lab has been developing
biosensors for local detection of hydrogen peroxide using both optical65 and electrochemical66
modes of signal transduction. The images in Figure 6 demonstrate one avenue for combining
single cell analysis for secreted cytokines with peroxide detection. To obtain these results, we
fabricated arrays of PEG hydrogel microwells on glass and functionalized anti-TNF Abs at
the bottom of the wells. Sensing components for fluorescence-based detection of peroxide,
including horseradish peroxidase (HRP) and Amplex Red were encased into the walls of the
hydrogel wells. Macrophages were then captured and activated inside the microwells. Images
in Figure 6 show TNF molecules released by activated macrophages were captured inside the
microwells next to the cells (green fluorescence). To demonstrate the sensitivity of our ROS-
FIG. 5. Continuous monitoring of TNF from monocytes captured and cultured next to sensing electrodes analogous to
those described in Figure 4. Measurements are taken every 4 min. Signal suppression—decrease in signal due to biding of
cytokine molecules—is correlated to TNF concentration through calibration curve (not shown).
021301-6 Revzin, Maverakis, and Chang Biomicrofluidics 6, 021301 (2012)
Downloaded 26 Apr 2012 to 129.74.161.246. Redistribution subject to AIP license or copyright; see http://bmf.aip.org/about/rights_and_permissions

detection system, we added exogenous hydrogen peroxide (1 lM), which resulted in appear-
ance of red fluorescence signal. Figure 6(b) shows proof-of-concept sensing surfaces for si-
multaneous detection of cytokine molecules and ROS. Our goal in the future is to demonstrate
the concept of simultaneous detection with endogenous (cell-secreted) peroxide and TNF.
C. Novel strategies for sensor regeneration and signal amplification
Ideally, biosensors should be responsive and regenerable on the time scales relevant for
cellular communication and should be able to select an analyte of interest in a complex biologi-
cal fluid out of a plethora of interfering substances. Sensor regeneration is particularly impor-
tant. In Sec. III A of this perspective, we highlighted the need to develop biosensors for
dynamic and continuous monitoring of signaling molecules secreted by the immune cells. One
question that has yet to be effectively addressed is how to design affinity biosensors based ei-
ther on antibodies or aptamers that would be sensitive down to nM or pM analyte concentration
while simultaneously allowing for detection of fluctuations in the level of cell-secreted mole-
cules. Sensitivity implies high affinity for the analyte of interest and slow dissociation kinetics.
This means that while increase in concentration of cell-secreted molecules is detectable, down-
ward trends in concentrations are difficult to monitor. We see one solution, whereby affinity
detection will be combined with regeneration of the sensor in a sequence of detect-regenerate-
detect steps.
What would these regenerable sensors look like? While optical, particularly SERS, sensing
has matured significantly, its lM detection limit67 does not allow it to detect signal proteins
from single cells or small colonies. Its complex peripheral instrumentation also discourages
integration with small wells like those in Figure 1. Finally, the nanocrystals may interact with
the cells and trigger unwanted responses. Certain fluorescent detection methods have shown un-
precedented resolution (single receptor binding event) and sensitivity (single cytokine)68 but are
not suitable for a practical assay platform. In contrast, electrochemical sensing represents a
more promising platform from the stand point of low cost, simplicity, and practicality. Some of
the widely used biosensors are based on field effect transistors and electrochemical impedance
spectroscopy (EIS). While promising, these approaches suffer from multiple drawbacks includ-
ing signal drifts, irreproducible signals, ionic strength sensitivity, and interaction of probes with
counterions, all of which are common problems for these sensors.69–71
Cheng laboratory has developed a microfluidic regeneration strategy for any sensing plat-
form involving probes.72 Bipolar membranes with cation and anion-selective features are syn-
thesized on silica chips using UV photosynthesis methods. The bipolar membrane behaves like
FIG. 6. Merged brightfield/fluorescence image showing integration of hydrogel-based H2O2 sensor with TNF sensor.(a)
Macrophages were treated with LPS for 3 h and the sample was stained with biotinylated anti-TNF Ab and neutravidin-
FITC. The green fluorescence indicates secreted TNF from cells. (b) The addition of 1 lM of H2O2 and Amplex Red
resulted in appearance of red fluorescence signal in the PEG hydrogel walls.
021301-7 Revzin, Maverakis, and Chang Biomicrofluidics 6, 021301 (2012)
Downloaded 26 Apr 2012 to 129.74.161.246. Redistribution subject to AIP license or copyright; see http://bmf.aip.org/about/rights_and_permissions

a semi-conductor diode, with the electrons and holes replaced by anions and cations. Like a
diode, when a reverse DC bias is applied across the bipolar membrane, mobile charges are
depleted at the junction. Since both membranes are highly ion-selective, whose mobile ions are
all counterions at equilibrium, the application of a DC field can deplete all mobile ions at the
junction. This ion depletion effect reduces the electrolyte conductivity at the junction and,
hence, amplifies the local electric field by orders of magnitude. In a recent paper,72 we showed
that the electric field can exceed 1 MV/cm at the junction such that water molecules at the junc-
tion can be dissociated into proton and hydroxyl ions by the so-called Wien effect.73 The result-
ing proton and hydroxyl ions migrate through their respective ion-selective membranes and are
therefore, separated to two sides of the bipolar membrane. By using two such bipolar mem-
branes, we are able to produce two controllable proton and hydroxyl ion actuators on the chip
and, with a down-stream static mixer, the generated ions are mixed into a solution of a specific
pH between 2 and 11 with high precision as shown in Figure 7. This chip generated a high pH
spike that can be used to dehybridize the captured molecules and regenerate the probe.
The quantification of molecules secreted is often necessary for immune cell analysis. How-
ever, signals from electrochemical sensors based on Faradaic reactions (or field-effect transistor
sensors based on charge sensing74) are often sensitive to local pH and ionic strengths. The
above pH actuation device can be used to control the pH near the sensor for a large culture. To
FIG. 7. An on-chip bipolar membrane pH actuator. The image in (a) shows how a DC field across a bipolar membrane can
dissociate water and generate protons and hydroxyl ions at a controllable rate. Two such bipolar membranes are fabricated
up stream of a flow channel and the protons/hydroxyl ions are mixed by a static mixer into a buffer of a specific pH between
2 and 10 in (b). The mixed streams are shown in (c) with a color chart for the universal pH dye.
FIG. 8. (a) Optical microscopic image of a charge-selective membrane based preconcentrator. (b) Concentration of fluores-
cently labeled molecules taking place 10 s after applying a voltage bias of 10 V. The scale bars represent 50 lm.
021301-8 Revzin, Maverakis, and Chang Biomicrofluidics 6, 021301 (2012)
Downloaded 26 Apr 2012 to 129.74.161.246. Redistribution subject to AIP license or copyright; see http://bmf.aip.org/about/rights_and_permissions
control the local ionic strength, we employ other features of ion-selective membranes—ion con-
centration and depletion.75–78 As shown in Figure 8, we are able to lower the local ionic
strength to deionized water level and to increase it from DI water level to mM. The same tech-
nique can be used to enhance the sensitivity of the molecular sensor by increasing the local
concentration of the target molecules.
Another intriguing strategy to enhance the sensitivity of molecular a sensor is to mimic
excitable potential dynamics of a neuron cell—its response is much larger than the input
when the input amplitude exceeds a threshold. Their IV curves do not possess linear Ohmic
characteristics and in fact, often demonstrate negative differential resistance. Just as excitabil-
ity amplifies input action potential signals, nonlinear oscillatory cardiac neuron dynamics acts
like a clock and bistable dynamics in brain neurons allows for a binary memory device. Intra-
cell sensors have confirmed the highly nonlinear nature of action potential dynamics during
neuron signaling and cardiac oscillations.74 Such “neuron” sensors can be utilized to detect
antibody-antigen docking in our immune cell cultures, as a more direct sensor of antigen
docking onto a single cell. In fact, one can imagine an artificial membrane unit that can com-
municate with a real immune cell by converting cytokine signals to electronic signals and
vice-versa.
Analogously, a promising strategy for external signal protein detection is to replace the lin-
ear electrochemical sensing techniques with a nonlinear one based on ion currents instead of
Faradaic currents from electron-transfer reactions. The usual paradigm of linear EIS spectros-
copy must be modified in the process. For example, the phase-lag between input and output is
locked at a frequency-independent value for nonlinear sensors. In Chang’s lab, several on-chip
nanoporous membrane and nanoslot real-time nucleic acid and signal protein sensors have been
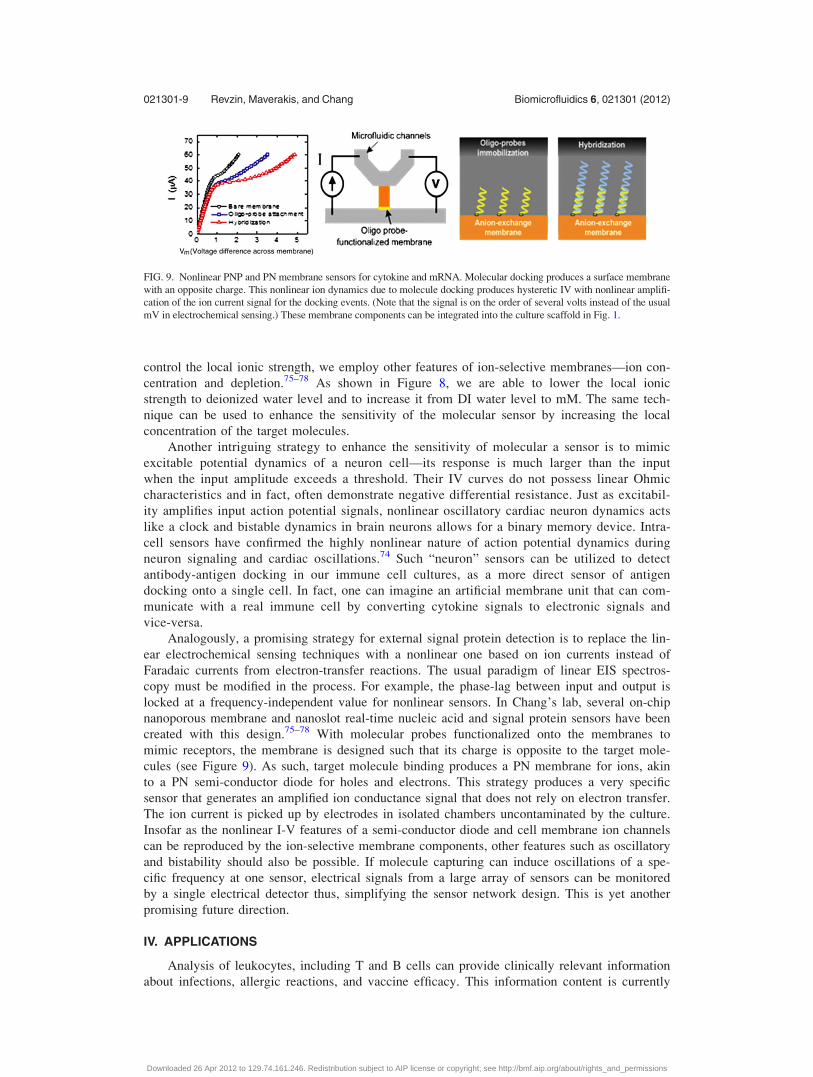
created with this design.75–78 With molecular probes functionalized onto the membranes to
mimic receptors, the membrane is designed such that its charge is opposite to the target mole-
cules (see Figure 9). As such, target molecule binding produces a PN membrane for ions, akin
to a PN semi-conductor diode for holes and electrons. This strategy produces a very specific
sensor that generates an amplified ion conductance signal that does not rely on electron transfer.
The ion current is picked up by electrodes in isolated chambers uncontaminated by the culture.
Insofar as the nonlinear I-V features of a semi-conductor diode and cell membrane ion channels
can be reproduced by the ion-selective membrane components, other features such as oscillatory
and bistability should also be possible. If molecule capturing can induce oscillations of a spe-
cific frequency at one sensor, electrical signals from a large array of sensors can be monitored
by a single electrical detector thus, simplifying the sensor network design. This is yet another
promising future direction.
IV. APPLICATIONS
Analysis of leukocytes, including T and B cells can provide clinically relevant information
about infections, allergic reactions, and vaccine efficacy. This information content is currently
FIG. 9. Nonlinear PNP and PN membrane sensors for cytokine and mRNA. Molecular docking produces a surface membrane
with an opposite charge. This nonlinear ion dynamics due to molecule docking produces hysteretic IV with nonlinear amplifi-
cation of the ion current signal for the docking events. (Note that the signal is on the order of several volts instead of the usual
mV in electrochemical sensing.) These membrane components can be integrated into the culture scaffold in Fig. 1.
021301-9 Revzin, Maverakis, and Chang Biomicrofluidics 6, 021301 (2012)
Downloaded 26 Apr 2012 to 129.74.161.246. Redistribution subject to AIP license or copyright; see http://bmf.aip.org/about/rights_and_permissions

“harvested” by sophisticated techniques such as flow cytometry, ELISpot, or ELISA or less so-
phisticated approaches such as skin tests for allergic reactions and TB detection. Complexity of
the first group of approaches limits broader use of immune analysis, while simplicity and crude-
ness of the second category of approaches contribute to false results and poor patient compli-
ance. We see several untapped applications for immune cell biosensors.
A. Analysis of antigen-specific T cell responses
Immunologists commonly query disease-specific T cell responses using flow cytometry and
ELISpot in academic settings. However, in the clinic, these techniques are secondary or even
tertiary to other detection methods that look for presence of pathogens or pathogen-specific
antibodies. There are cases like TB detection where pathogen biomarkers are not yet available
and interferon-(IFN)-c production by T cells is used in diagnosis of latent TB.79 If made simple
and inexpensive, detection of antigen-specific T cell responses may be used for early pathogen
detection in cases where pathogen-specific antibodies are not yet produced (sero-negative indi-
viduals) or when the pathogen has not yet proliferated in the host.
B. Analysis of antigen-specific B cell responses
B cells express antibodies against specific pathogens on their cell surface and secrete the
same antibody molecules upon pathogen binding. The ability of B cells to recognize and
respond to pathogens makes them ideally suited for biosensing. While there have been reports
of genetically engineered B cells that “light-up” in the presence of specific pathogens,80 recent
advances in the field describe single cell platforms for detection of pathogen specific antibody
production in unmanipulated primary B cells.43,81
C. Isolation of cancer-specific T cells
Immunotherapy for cancer has recently received significant attention in the medical litera-
ture. Initial studies demonstrated that the adoptive transfer of cancer-specific T cells can induce
prolonged remission and newer strategies with engineered T cells appear very promising.82,83
An important finding from these groundbreaking studies is that there is considerable heteroge-
neity in cancer-specific T cells, with some working much better than others. Thus, a microflui-
dic device that can isolate and characterize cancer-specific T cells prior to their labor-intensive
expansion and adoptive transfer will have a profound clinical impact.
D. Characterization of the autoreactive T cells responsible for autoimmunity
T cells play a central role in many forms of autoimmunity.7,84 However, the pathogenic popu-
lation likely comprises only a small fraction of the peripheral T cell repertoire. Recently, protocols
have been developed to directly isolate putatively pathogenic T cells from the peripheral circula-
tion of patients with autoimmunity.85 However, low cell numbers make analysis of these virtually
clonal populations difficult. In addition, in vitro expansion of the T cells will likely lead to
changes in their effector phenotype.86 Thus, once isolated from the peripheral circulation, micro-
fabrication and microfluidic technologies will be essential to rapidly characterizing these T cells.
E. Screening for potential allergens
There are numerous screening strategies for identifying food and environmental allergens.
The very common radioallergosorbent test (RAST test) detects specific IgE antibodies to sus-
pected allergens. In this test, the patients’ serum is added to suspected insoluble allergens. If
allergen-specific IgE antibodies exist in the serum, they will bind to the insoluble allergens.
Bound IgE molecules are then detected with a secondary radiolabeled anti-IgE antibody. How-
ever, allergic responses can also have a cellular component that cannot be detected by the
assays, which are focused purely on detecting anti-allergen IgE titers. Contact allergies are
021301-10 Revzin, Maverakis, and Chang Biomicrofluidics 6, 021301 (2012)
Downloaded 26 Apr 2012 to 129.74.161.246. Redistribution subject to AIP license or copyright; see http://bmf.aip.org/about/rights_and_permissions
often due to allergen-specific T cells, with no or low corresponding IgE titers. Novel
approaches to identify allergin-specific T-cells will have considerable impact on the field.
F. Cellular communication via secreted signals
It should be noted that in addition to T and B cells there are other important cellular partic-
ipants of the immune system including granulocytes, monocytes, dendritic cells, etc. These cells
release cytokines, reactive oxygen species, or other signaling molecules in response to patholo-
gies. However, because these cells are not designed to mount pathogen-specific immune
responses, they are more challenging to use in disease diagnosis. This said, inflammation—gen-
eral state of immune cell activation—has emerged as an important factor in cancer, tissue
injury, and regeneration. Therefore, sensitive, temporal analysis of inflammatory markers will
likely become more and more significant as understanding of biological mechanisms evolves.
In fact, we see biosensors and microfluidic platforms as being a key to improving mecha-
nistic understanding of immuno-inflammatory responses. Given the key role of paracrine signals
and the involvement of multiple cell types in generating these signals, there is a clear need to
develop platforms for monitoring heterotypic cellular signaling.87 While the development of
first microfabrication approaches for heterotypic cell cultures dates back to over a decade
ago,88,89 the use of reconfigurable microfluidic chambers now allows to sequester individual
cell types and to actively control how and when communication happens.90,91 Integration of
such cell culture systems with biosensors for local and continuous monitoring of secreted sig-
nals will help to elucidate which cell type the signals originate from and how reciprocal com-
munication propagates.
V. CONCLUSION
This paper describes current trends in biosensors for immune cell analysis and suggests
future directions for development of this field. Microfabrication, microfluidics, and multiplexing
are particularly important in leukocyte analysis where individual cells are frequently unique in
terms of function and response to stimulation. Exciting technologies to analyze immune cells
have been proposed and developed, yet the opportunities for new technology development
remain ample. These opportunities are outlined in the paper.
ACKNOWLEDGMENTS
A.R. and H.-C. Chang acknowledge financial support provided by the National Science Foun-
dation (EFRI Grant No. 0937997). E.M. is supported by early career awards from the Howard
Hughes Medical Institute and the Burroughs Wellcome Fund.
1S. Werner and R. Grose, Physiol Rev. 83, 835–870 (2003).2M. J. Smyth, G. P. Dunn, and R. D. Schreiber, Adv Immunol. 90, 1–50 (2006).3S. Nishimura, I. Manabe, M. Nagasaki, K. Eto, H. Yamashita, M. Ohsugi, M. Otsu, K. Hara, K. Ueki, S. Sugiura, K.Yoshimura, T. Kadowaki, and R. Nagai, Nat. Med. 15, 914–920 (2009).
4G. K. Hansson, A. K. Robertson, and C. Soderberg-Naucler, Annu Rev Pathol. 1, 297–329 (2006).5D. L. Kaufman, M. Clare-Salzler, J. Tian, T. Forsthuber, G. S. Ting, P. Robinson, M. A. Atkinson, E. E. Sercarz, A. J.Tobin, and P. V. Lehmann, Nature 366, 69–72 (1993).
6E. Maverakis, Y. Miyamura, M. P. Bowen, G. Correa, Y. Ono, and H. Goodarzi, J. Autoimmun. 34, J247–J257 (2010).7P. V. Lehmann, T. Forsthuber, A. Miller, and E. E. Sercarz, Nature 358, 155–157 (1992).8N. K. Jerne, Proc. Natl. Acad. Sci. U. S. A. 41, 849–857 (1955).9N. K. Jerne, Ann. Immunol. (Paris). 125C, 373–389 (1974).
10F. M. Burnet, Aust. J. Sci. 20, 67–69 (1957).11D. W. Talmage, Science 129, 1643–1648 (1959).12G. J. Nossal and J. Lederberg, Nature 181, 1419–1420 (1958).13B. Benacerraf and H. O. McDevitt, Science 175, 273–279 (1972).14B. Benacerraf, J. Immunol. 120, 1809–1812 (1978).15E. E. Sercarz and E. Maverakis, Nat. Rev. Immunol. 3, 621–629 (2003).16E. S. Trombetta and I. Mellman, Annu. Rev. Immunol. 23, 975–1028 (2005).17D. N. Garboczi, P. Ghosh, U. Utz, Q. R. Fan, W. E. Biddison, and D. C. Wiley, Nature 384, 134–141 (1996).18T. R. Mosmann and R. L. Coffman, Annu. Rev. Immunol. 7, 145–173 (1989).
021301-11 Revzin, Maverakis, and Chang Biomicrofluidics 6, 021301 (2012)
Downloaded 26 Apr 2012 to 129.74.161.246. Redistribution subject to AIP license or copyright; see http://bmf.aip.org/about/rights_and_permissions
19H. Zola, B. Swart, A. Banham, S. Barry, A. Beare, A. Bensussan, L. Boumsell, D. B. C, H. J. Buhring, G. Clark, P. Engel,D. Fox, B. Q. Jin, P. J. Macardle, F. Malavasi, D. Mason, H. Stockinger, and X. Yang, J. Immunol. Methods 319, 1–5(2007).
20C. D. Jennings and K. A. Foon, Blood 90, 2863–2892 (1997).21A. Y. Fu, C. Spence, A. Scherer, F. H. Arnold, and S. R. Quake, Nat. Biotechnol. 17, 1109–1111 (1999).22N. Hashemi, J. S. Erickson, J. P. Golden, K. M. Jackson, and F. S. Ligler, Biosens. Bioelectrons. 26, 4263–4269 (2011).23N. Hashemi, J. S. Erickson, J. P. Golden, and F. S. Ligler, Biomicrofluidics 5, 032009 (2011).24L. Belov, O. de la Vega, C. G. dos Remedios, S. P. Mulligan, and R. I. Christopherson, Cancer Res. 61, 4483–4489
(2001).25L. Belov, P. Huang, J. S. Chrisp, S. P. Mulligan, and R. I. Christopherson, J. Immunol. Methods 305, 10–19 (2005).26P. B. Ellmark, L. Belov, P. Huang, C. S. Lee, M. J. Solomon, D. K. Morgan, and C. Christopherson, Proteomics 6,
1791–1802 (2006).27D. S. Chen, Y. Soen, T. B. Stuge, P. P. Lee, J. S. Weber, P. O. Brown, and M. M. Davis, PLoS Med. 2, 1018–1030
(2005).28Y. Soen, D. S. Chen, D. L. Kraft, M. M. Davis, and P. O. Brown, PLoS Biol. 1, 429–438 (2003).29Q. Han, E. M. Bradshaw, B. Nilsson, D. A. Hafler, and J. C. Love, Lab Chip 10, 1391–1400 (2010).30J. C. Love, J. L. Ronan, G. M. Grotenbreg, A. G. van der Veen, and H. L. Ploegh, Nat. Biotechnol. 24, 703–707 (2006).31A. M. Skelley, O. Kirak, H. Suh, R. Jaenisch, and J. Voldman, Nat. Methods 6, 147–152 (2009).32S. Y. Cui, Y. P. Liu, W. Wang, Y. Sun, and Y. B. Fan, Biomicrofluidics 5, 032003 (2011).33H. Shadpour, J. S. Zawistowski, A. Herman, K. Hahn, and N. L. Allbritton, Anal. Chim. Acta. 696, 101–107 (2011).34P. C. Gach, Y. L. Wang, C. Phillips, C. E. Sims, and N. L. Allbritton, Biomicrofluidics 5, 032002 (2011).35S. H. Nam, H. J. Lee, K. J. Son, and W. G. Koh, Biomicrofluidics 5, 032001 (2011).36T. Kalisky and S. R. Quake, Nat. Methods 8, 311–314 (2011).37G. M. Whitesides, E. Ostuni, S. Takayama, X. Jiang, and D. E. Ingber, Annu. Rev. Biomed. Eng. 3, 335–373 (2001).38A. Folch and M. Toner, Annu. Rev. Biomed. Eng. 2, 227 (2000).39A. Revzin, K. Sekine, A. Sin, R. G. Tompkins, and M. Toner, Lab Chip. 5, 30–37 (2005).40J. Doh and D. J. Irvine, Proc. Natl. Acad. Sci. U.S.A. 103, 5700–5705 (2006).41E. M. Bradshaw, S. C. Kent, V. Tripuraneni, T. Orban, H. L. Ploegh, D. A. Hafler, and J. C. Love, Clin. Immun. 129,
10–18 (2008).42C. M. Story, E. Papa, C. C. A. Hu, J. L. Ronan, K. Herlihy, H. L. Ploegh, and J. C. Love, Proc. Natl. Acad. Sci. U.S.A.
105, 17902–17907 (2008).43A. Jin, T. Ozawa, K. Tajiri, T. Obata, S. Kondo, K. Kinoshita, S. Kadowaki, K. Takahashi, T. Sugiyama, H. Kishi, and A.
Muraguchi, Nat. Med. 15, 1088–U146 (2009).44C. Ma, R. Fan, H. Ahmad, Q. H. Shi, B. Comin-Anduix, T. Chodon, R. C. Koya, C. C. Liu, G. A. Kwong, C. G. Radu, A.
Ribas, and J. R. Heath, Nature Medicine. 17, 738–U133 (2011).45K. Sekine, A. Revzin, R. G. Tompkins, and M. Toner, J. Immunol. Methods 313, 96–109 (2006).46H. Zhu, M. Macal, M. D. George, S. Dandekar, and A. Revzin, Anal. Chim. Acta. 608, 186–196 (2008).47H. Zhu, G. S. Stybayeva, M. Macal, M. D. George, S. Dandekar, and A. Revzin, Lab Chip. 8, 2197–2205 (2008).48G. Stybayeva, O. Mudanyali, S. Seo, J. Silangcruz, M. Macal, E. Ramanculov, S. Dandekar, A. Erlinger, A. Ozcan, and
A. Revzin, Anal. Chem. 82, 3736–3744 (2010).49J. H. Seo, L. J. Chen, S. V. Verkhoturov, E. A. Schweikert, and A. Revzin, Biomaterials 32, 5478–5488 (2011).50H. Zhu, G. S. Stybayeva, J. Silangcruz, J. Yan, E. Ramanculov, S. Dandekar, M. D. George, and A. Revzin, Anal. Chem.
81, 8150–8156 (2009).51M. Huse, E. J. Quann, and M. M. Davis, Nat. Immunol. 10, 1105–1111 (2008).52G. Stybayeva, M. Kairova, E. Ramanculov, A. L. Simonian, and A. Revzin, Colloids Surf., B 80, 251–255 (2010).53S. Milgram, S. Cortes, M. B. Villiers, P. Marche, A. Buhot, T. Livache, and Y. Roupioz, Biosens. Bioelectron. 26,
2728–2732 (2011).54J. G. Shackman, G. M. Dahlgren, J. L. Peters, and R. T. Kennedy, Lab Chip. 5, 56–63 (2005).55J. F. Dishinger, K. R. Reid, and R. T. Kennedy, Anal. Chem. 81, 3119–3127 (2009).56C. Tuerk and L. Gold, Science 249, 505–510 (1990).57A. D. Ellington and J. W. Szostak, Nature 346, 818–822 (1990).58N. Hamaguichi, A. D. Ellington, and M. Stanton, Anal. Biochem. 294, 126–131 (2001).59J. J. Li, X. Fang, and W. Tan, Biochem. Biophys. Res. Commun. 292, 31–40 (2002).60Y. Xiao, A. A. Lubin, A. J. Heeger, and K. W. Plaxco, Angew. Chem., Int. Ed. 44, 5456–5459 (2005).61N. Tuleuova, C. N. Jones, J. Yan, E. Ramanculov, Y. Yokobayashi, and A. Revzin, Anal. Chem. 82, 1851–1857 (2010).62N. Tuleuova and A. Revzin, Cell. Mol. Bioeng. 3, 337–344 (2010).63Y. Liu, N. Tuleuova, E. Ramanculov, and A. Revzin, Anal. Chem. 82, 8131–8136 (2010).64Y. Liu, J. Yan, M. C. Howland, T. Kwa, and A. Revzin, Anal Chem. 83, 8286–8292 (2011).65J. Yan, Y. H. Sun, H. Zhu, L. Marcu, and A. Revzin, Biosens. Bioelectron. 24, 2604–2610 (2009).66J. Yan, V. A. Pedrosa, J. Enomoto, A. L. Simonian, and A. Revzin, Biomicrofluidics 5, 032008 (2011).67J. C. Trefry, J. L. Monahan, K. M. Weaver, A. J. Meyerhoefer, M. M. Markopolous, Z. S. Arnold, D. P. Wooley, and I. E.
Pavel, J. Am. Chem. Soc. 132, 10970–10972 (2010).68W. Zhao, S. Schafer, J. Choi, Y. J. Yamanaka, M. L. Lombardi, S. Bose, A. L. Carlson, J. A. Phillips, W. Teo, I. A. Drou-
jinine, C. H. Cui, R. K. Jain, J. Lammerding, J. C. Love, C. P. Lin, D. Sarkar, R. Karnik, and J. M. Karp, Nat. Nanotech-nol. 6, 524–31 (2011).
69A. Poghossian, A. Cherstvy, S. Ingebrandt, A. Offenhausser, and M. J. Schoning, Sens. Actuators B 111, 470–480(2005).
70E. Stern, R. Wagner, F. J. Sigworth, R. Breaker, T. M. Fahmy, and M. A. Reed, Nano Lett. 7, 3405–3409 (2007).71I. Suni, Trends Analyt. Chem. 27, 604–611 (2008).72L. J. Cheng and H. C. Chang, Biomicrofluidics 5, 46502 (2011).73L. Onsager and R. M. Fuoss, J. Phys. Chem. 36, 2689–2778 (1932).
021301-12 Revzin, Maverakis, and Chang Biomicrofluidics 6, 021301 (2012)
Downloaded 26 Apr 2012 to 129.74.161.246. Redistribution subject to AIP license or copyright; see http://bmf.aip.org/about/rights_and_permissions
74Y. M. Chi, T. Jung, and G. Cauwenberghs, IEEE Rev. Biomed. Eng. 3, 106–119 (2010).75S. Basuray, S. Senapati, A. Aijian, A. R. Mahon, and H. C. Chang, ACS Nano 3, 1823–30 (2009).76H. C. Chang and G. Yossifon, Biomicrofluidics 3, 12001 (2009).77S. Senapati, S. Basuray, Z. Slouka, L. J. Cheng, and H. C. Chang, Top. Curr. Chem. 304, 153–69 (2011).78G. Yossifon, Y. C. Chang, and H. C. Chang, Phys. Rev. Lett. 103, 154502 (2009).79K. Dheda, R. V. Smit, M. Badri, and M. Pai, Curr. Opin. Pulm. Med. 15, 188–200 (2009).80T. H. Rider, M. S. Petrovick, F. E. Nargi, J. D. Harper, E. D. Schwoebel, R. H. Mathews, D. J. Blanchard, L. T. Bortolin,
A. M. Young, J. Z. Chen, and M. A. Hollis, Science 301, 213–215 (2003).81A. Jin, T. Ozawa, K. Tajiri, T. Obata, H. Kishi, and A. Muraguchi, Nat. Protoc. 6, 668–676 (2011).82M. E. Dudley, J. R. Wunderlich, P. F. Robbins, J. C. Yang, P. Hwu, D. J. Schwartzentruber, S. L. Topalian, R. Sherry, N.
P. Restifo, A. M. Hubicki, M. R. Robinson, M. Raffeld, P. Duray, C. A. Seipp, L. Rogers-Freezer, K. E. Morton, S. A.Mavroukakis, D. E. White, and S. A. Rosenberg, Science 298, 850–854 (2002).
83D. L. Porter, B. L. Levine, M. Kalos, A. Bagg, and C. H. June, N. Engl. J. Med. 365, 725–33 (2011).84E. Bettelli, M. Oukka, and V. K. Kuchroo, Nat. Immunol. 8, 345–350 (2007).85W. Zhang, Y. Ono, Y. Miyamura, C. L. Bowlus, M. E. Gershwin, and E. Maverakis, J Autoimmun. 37, 71–78 (2011).86J. L. Baron, J. A. Madri, N. H. Ruddle, G. Hashim, and C. A. Janeway, Jr., J. Exp. Med. 177, 57–68 (1993).87I. K. Zervantonakis, C. R. Kothapalli, S. Chung, R. Sudo, and R. D. Kamm, Biomicrofluidics 5, 013406 (2011).88S. N. Bhatia, U. J. Balis, M. L. Yarmush, and M. Toner, FASEB J. 13, 1883–1900 (1999).89S. N. Bhatia, M. L. Yarmush, and M. Toner, J. Biomed. Mater. Res. 34, 189–199 (1997).90J. Kim, M. Hegde, and A. Jayaraman, Lab Chip. 10, 43–50 (2010).91Y. D. Gao, D. Majumdar, B. Jovanovic, C. Shaifer, P. C. Lin, A. Zijlstra, D. J. Webb, and D. Y. Li, Biomed. Microdevi-
ces 13, 539–548 (2011).
021301-13 Revzin, Maverakis, and Chang Biomicrofluidics 6, 021301 (2012)
Downloaded 26 Apr 2012 to 129.74.161.246. Redistribution subject to AIP license or copyright; see http://bmf.aip.org/about/rights_and_permissions