Embed Size (px)
Citation preview
Lecture 1: Regression Setting January 6, 2014
Biost 518 / 515 Applied Biostatistics II WIN 2014 1
1
Biost 518 / Biost 515Applied Biostatistics II / Biostatistics II
Scott S. Emerson, M.D., Ph.D.Professor of BiostatisticsUniversity of Washington
Lecture 1:Course Structure;
Regression Setting
January 6, 2014

Lecture 1: Regression Setting January 6, 2014
Biost 518 / 515 Applied Biostatistics II WIN 2014 2
2
The Use of Statistics to Answer Scientific Questions
Scott S. Emerson, M.D., Ph.D.
Professor of Biostatistics
University of Washington
Lecture 1: Regression Setting January 6, 2014
Biost 518 / 515 Applied Biostatistics II WIN 2014 3
3
General Philosophy
“Everything should be as simple as possible, but no simpler.”
- A. Einstein (paraphrased)
Lecture 1: Regression Setting January 6, 2014
Biost 518 / 515 Applied Biostatistics II WIN 2014 4
4
Lecture Outline
• Course Structure
• Course Overview
• Regression Setting– Typical chronology of investigation– Role of screening studies– Effect of multiple comparisons
Lecture 1: Regression Setting January 6, 2014
Biost 518 / 515 Applied Biostatistics II WIN 2014 5
5
Course Structure
Lecture 1: Regression Setting January 6, 2014
Biost 518 / 515 Applied Biostatistics II WIN 2014 6
6
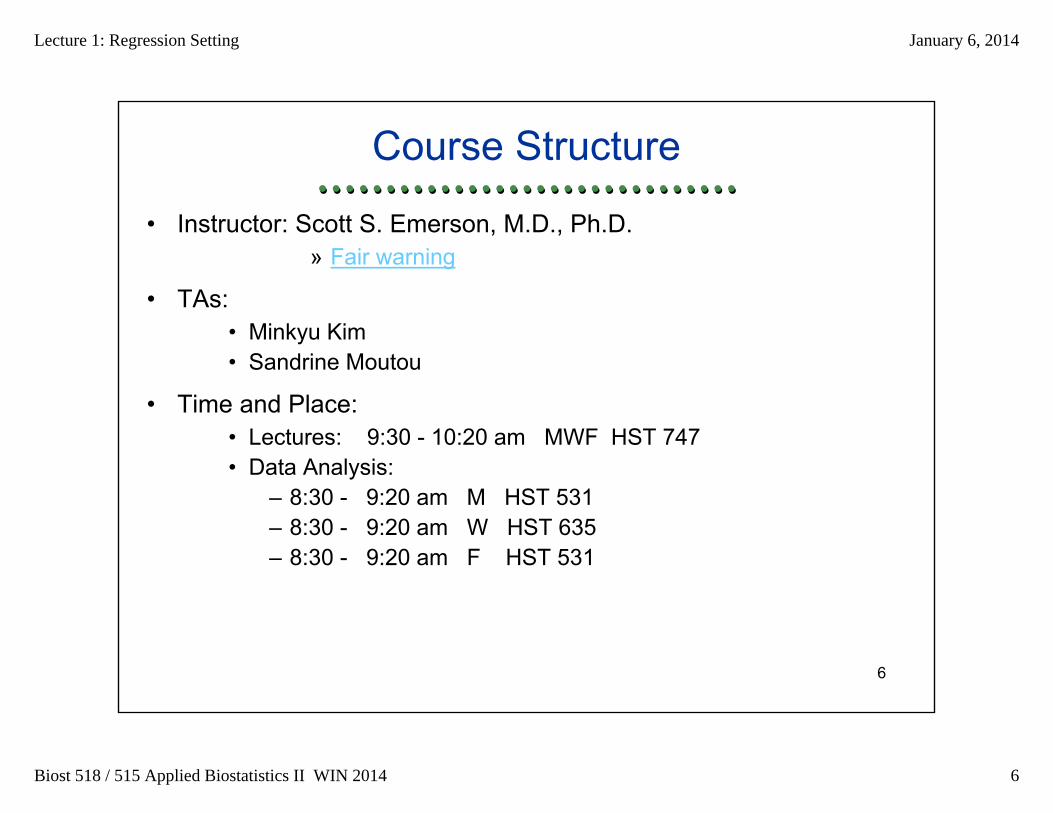
Course Structure
• Instructor: Scott S. Emerson, M.D., Ph.D.» Fair warning
• TAs: • Minkyu Kim• Sandrine Moutou
• Time and Place:• Lectures: 9:30 - 10:20 am MWF HST 747• Data Analysis:
– 8:30 - 9:20 am M HST 531– 8:30 - 9:20 am W HST 635– 8:30 - 9:20 am F HST 531
Lecture 1: Regression Setting January 6, 2014
Biost 518 / 515 Applied Biostatistics II WIN 2014 7
7
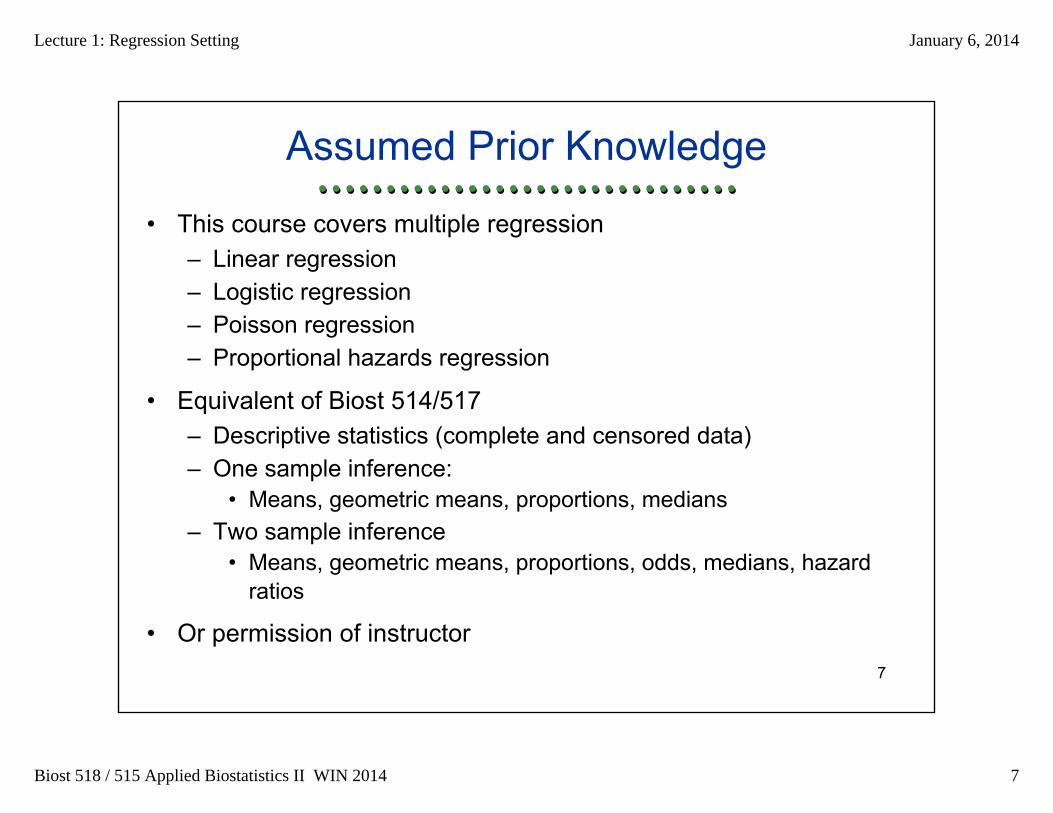
Assumed Prior Knowledge
• This course covers multiple regression– Linear regression– Logistic regression– Poisson regression– Proportional hazards regression
• Equivalent of Biost 514/517– Descriptive statistics (complete and censored data)– One sample inference:
• Means, geometric means, proportions, medians– Two sample inference
• Means, geometric means, proportions, odds, medians, hazard ratios
• Or permission of instructor
Lecture 1: Regression Setting January 6, 2014
Biost 518 / 515 Applied Biostatistics II WIN 2014 8
8
Recording of Lectures
• Camtasia– Audio and computer video on web– Posted approximately 24 hours after class
• No guarantees: “Mistakes happen”– However, lectures from 2008 are also posted on the web pages
Lecture 1: Regression Setting January 6, 2014
Biost 518 / 515 Applied Biostatistics II WIN 2014 9
9
Textbooks
• Optional references– Vittinghoff, Glidden, Shiboski, McCulloch: Regression Methods…– Kleinbaum, Kupper Muller, Nizam: Applied Regression…– Kleinbaum: Logistic Regression…– Kleinbaum: Survival Analysis…
Lecture 1: Regression Setting January 6, 2014
Biost 518 / 515 Applied Biostatistics II WIN 2014 10
10
Computer Software
• Extensively used for data analysis
• Students may use any program that will do what is required, however– Stata is used heavily in Biostat 537, 540– Stata commands will be provided in lecture– R is free, but harder to use
• Some R functions will be provided on the website– Help will presume the use of Stata or (for the very brave) R
Lecture 1: Regression Setting January 6, 2014
Biost 518 / 515 Applied Biostatistics II WIN 2014 11
11
Stata
• Extremely flexible statistical package– Interactive– Excellent complement of biostatistical methods
• Graphical, report capabilities suboptimal
• Available in microcomputer lab
• Supplementary info on web page
• Syntax introduced in lectures as needed
Lecture 1: Regression Setting January 6, 2014
Biost 518 / 515 Applied Biostatistics II WIN 2014 12
12
R
• The ultimate in flexible statistical languages– Interactive– Many user-supplied functions
• Graphical functions generally very good
• Open source and free
• Supplementary info on web page
• Syntax provided (sometimes) as supplemental materials on webpages
• A collection of functions that I have written will be made available on the webpages– Caveat emptor
Lecture 1: Regression Setting January 6, 2014
Biost 518 / 515 Applied Biostatistics II WIN 2014 13
13
Computer Software: Comments
• Designed for people who know statistics, but do not want to write basic functions
• Tries to be all things to all people– Much output that you will not want– Much output that I will recommend against
Lecture 1: Regression Setting January 6, 2014
Biost 518 / 515 Applied Biostatistics II WIN 2014 14
14
Guiding Principles
• This is a course in biostatistics, not statistical software
• I will tell you how you can get the statistics I teach you to use– There are often multiple ways– I tend to teach one of them
• I will not explain every number that appears on the printout
Lecture 1: Regression Setting January 6, 2014
Biost 518 / 515 Applied Biostatistics II WIN 2014 15
15
Written Homeworks
• Homeworks approximately every week: analysis of real data– Questions directed toward specific analyses
• But questions will still be stated in as scientific terms (as opposed to statistical) terms as possible
– Work handed in is expected to be organized scientifically• I expect nicely formatted tables, figures• Stata / R code totally unacceptable• Unedited Stata / R output is totally unacceptable
• Homeworks must be submitted:– Electronically– On-time (exceptions only in the most dire circumstances)– Anonymized
• You must use ID codes supplied for each homework• It is your responsibility to ensure no indication of your identity as
document author, etc.
Lecture 1: Regression Setting January 6, 2014
Biost 518 / 515 Applied Biostatistics II WIN 2014 16
16
Lecture 1: Regression Setting January 6, 2014
Biost 518 / 515 Applied Biostatistics II WIN 2014 17
17
Errors to Avoid
• Unedited Stata / R output is TOTALLY unacceptable
• Any assignments that are handed in should be only your work
• Electronically submitted homeworks should be anonymized– Use ID code provided to you– Remove identifying information from your files– Name file appropriately
• Submission of homeworks and grades must be on time.

Lecture 1: Regression Setting January 6, 2014
Biost 518 / 515 Applied Biostatistics II WIN 2014 18
18
Peer Grading
• Keys to the homeworks will be generally be available on the web pages after the deadline for submission– My answers will typically go beyond what I expected you to do
• Extra information will be identified in special fonts• You are responsible for any new information that I provide in the
homework keys, even if that information is not otherwise presented in class
• Annotated Stata / R output will often be included
• Each student is expected to use the key to grade another student’s paper– Double blind: both submitted homework and comments should be
anonymous– Appeals of grades are decided by TAs and instructor

Lecture 1: Regression Setting January 6, 2014
Biost 518 / 515 Applied Biostatistics II WIN 2014 19
19
Quizzes and Lecture Discussion
• Approximately weekly the first part of lecture will be used to take a brief quiz on the subject matter– Basic knowledge / judgment
• Students will hand in written answers that will be graded as part of “Quizzes and discussion”– There is no way to make up a missed quiz– You are allowed to miss one, no questions asked
• We will then discuss the reasoning that should be used to answerthe quiz questions and current homework assignments– Participation in the discussion is required
Lecture 1: Regression Setting January 6, 2014
Biost 518 / 515 Applied Biostatistics II WIN 2014 20
20
Discussion Section
• Data analysis to answer scientific questions
• You will be given a scientific question and a data set which wascollected to try to answer that question– Setting is more realistic than that which is given on written
homeworks
• We will discuss the approach to the whole problem
• Nothing to hand in, but participation in discussion is required– I will often call on students at random
• It is okay to be wrong, but not okay to be inattentive– You must inform me if you are attending a different discussion
section
Lecture 1: Regression Setting January 6, 2014
Biost 518 / 515 Applied Biostatistics II WIN 2014 21
21
Grading
• 20% Homeworks and peer grading (approx 10)
• 10% Quizzes and discussion
• 25% One Midterm (in class, closed book)
• 20% Data Analysis and Report
• 25% Final Exam (in class, closed book)

Lecture 1: Regression Setting January 6, 2014
Biost 518 / 515 Applied Biostatistics II WIN 2014 22
22
Course Web Pages
• Address: www.emersonstatistics.com/b518/
• Content– Syllabus– Lecture handouts– Recordings of lectures (and discussions if I think it worthwhile)– Homework assignments and keys– Datasets– Supplemental materials not discussed in class
• Handouts, noteworthy emails
Lecture 1: Regression Setting January 6, 2014
Biost 518 / 515 Applied Biostatistics II WIN 2014 23
23
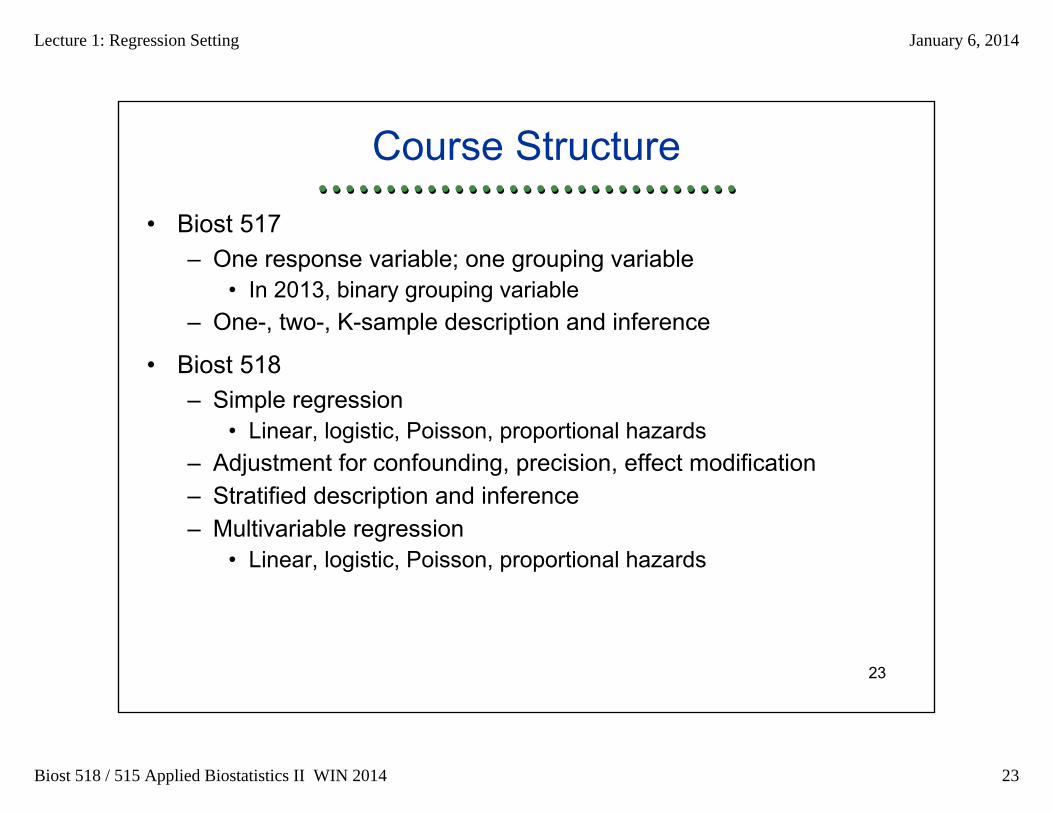
Course Structure
• Biost 517– One response variable; one grouping variable
• In 2013, binary grouping variable– One-, two-, K-sample description and inference
• Biost 518– Simple regression
• Linear, logistic, Poisson, proportional hazards– Adjustment for confounding, precision, effect modification– Stratified description and inference– Multivariable regression
• Linear, logistic, Poisson, proportional hazards
Lecture 1: Regression Setting January 6, 2014
Biost 518 / 515 Applied Biostatistics II WIN 2014 24
24
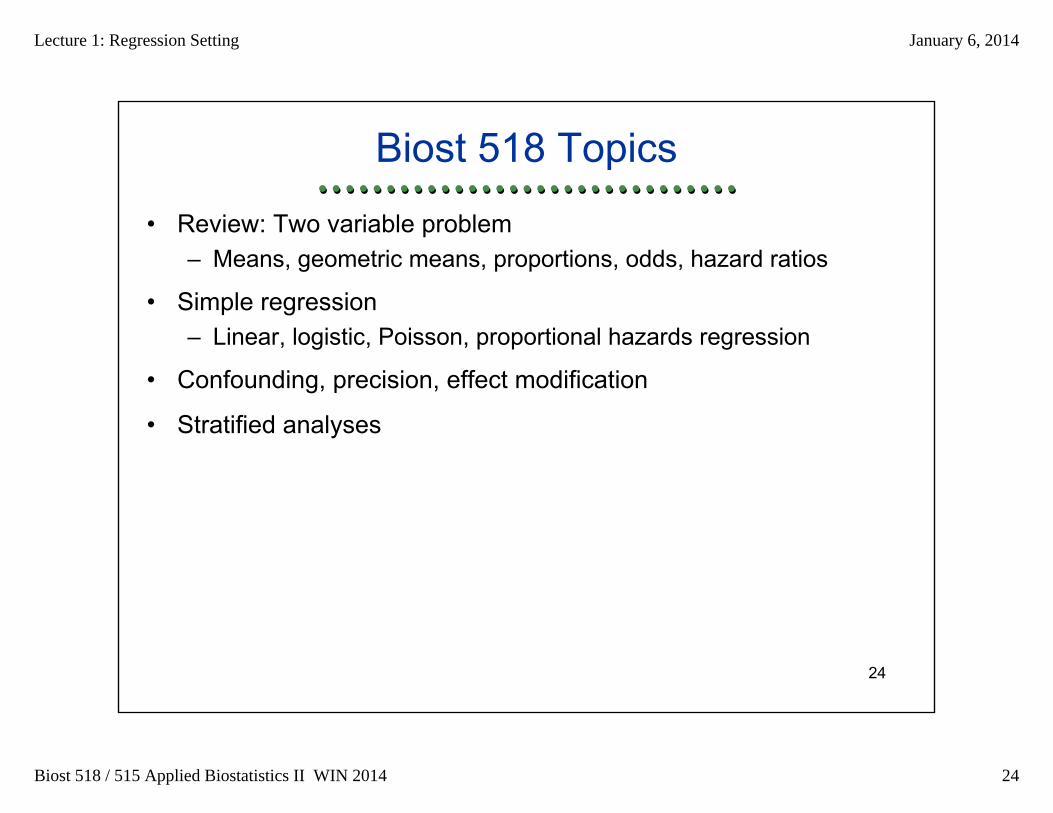
Biost 518 Topics
• Review: Two variable problem– Means, geometric means, proportions, odds, hazard ratios
• Simple regression– Linear, logistic, Poisson, proportional hazards regression
• Confounding, precision, effect modification
• Stratified analyses
Lecture 1: Regression Setting January 6, 2014
Biost 518 / 515 Applied Biostatistics II WIN 2014 25
25
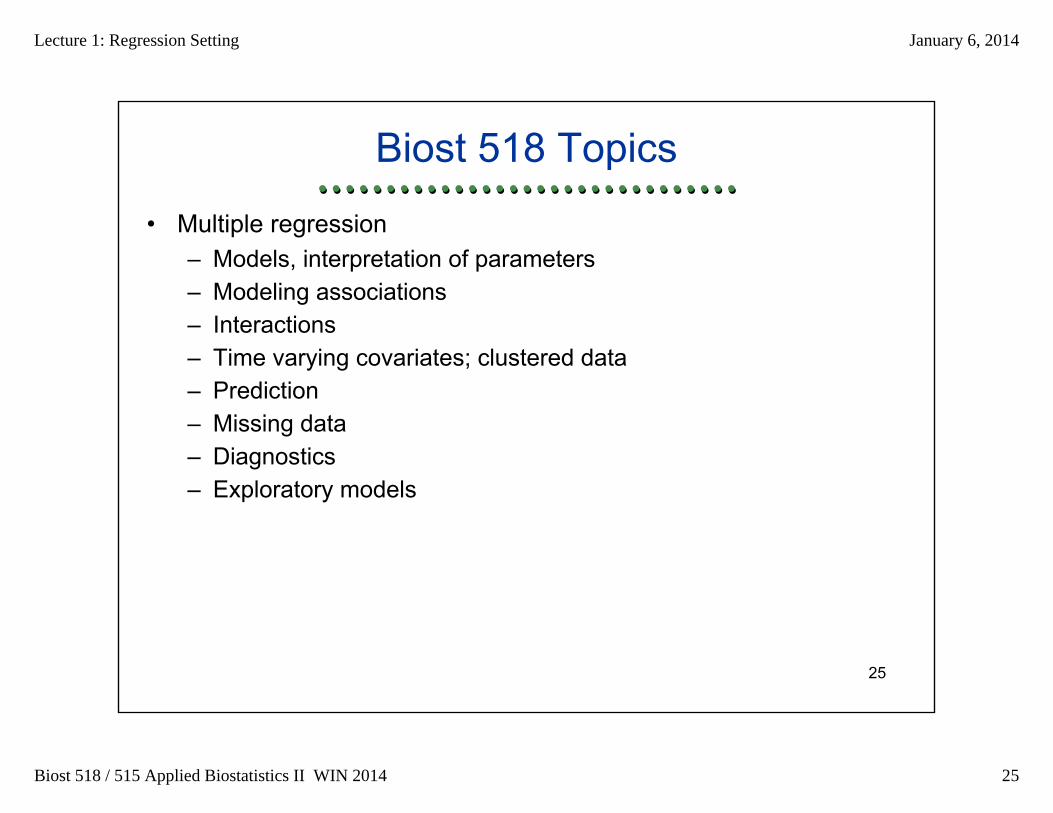
Biost 518 Topics
• Multiple regression– Models, interpretation of parameters– Modeling associations– Interactions– Time varying covariates; clustered data– Prediction– Missing data– Diagnostics– Exploratory models
Lecture 1: Regression Setting January 6, 2014
Biost 518 / 515 Applied Biostatistics II WIN 2014 26
26
Overview of Setting
Scientific Method
Lecture 1: Regression Setting January 6, 2014
Biost 518 / 515 Applied Biostatistics II WIN 2014 27
27
Purpose of Statistics
• Statistics is about science– (Science in the broadest sense of the word)
• Science is about proving things to people– (The validity of any proof rests solely on the willingness of the
audience to believe it)
Lecture 1: Regression Setting January 6, 2014
Biost 518 / 515 Applied Biostatistics II WIN 2014 28
28
First Stage of Scientific Investigation
• Hypothesis generation
• Observation
• Measurement of existing populations
• Disadvantages:– Confounding– Limited ability to establish cause and effect
Lecture 1: Regression Setting January 6, 2014
Biost 518 / 515 Applied Biostatistics II WIN 2014 29
29
Further Stages of Scientific Investigation
• Refinement and confirmation of hypotheses
• Experiment: Intervention
• Elements of experiment– Overall goal– Specific aims (hypotheses)– Materials and methods– Collection of data– Analysis– Interpretation; Refinement of hypotheses
Lecture 1: Regression Setting January 6, 2014
Biost 518 / 515 Applied Biostatistics II WIN 2014 30
30
Do You Need Statistics?
• Two question test (Both must be YES)
• In a deterministic world, do YOU know how to answer your question?– Is the question answerable in the real world?– How do you use a number to answer the scientific question?
• In a world subject to variation, do YOU know how you would answer your question if you had the entire population?
Lecture 1: Regression Setting January 6, 2014
Biost 518 / 515 Applied Biostatistics II WIN 2014 31
31
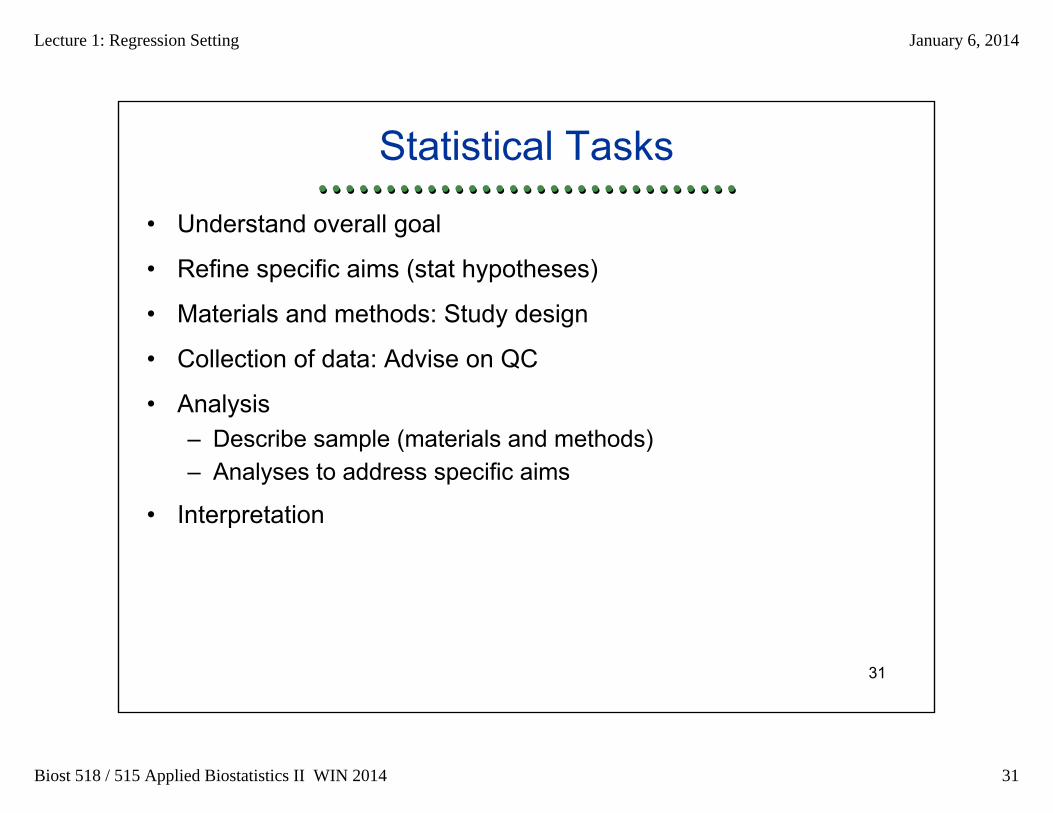
Statistical Tasks
• Understand overall goal
• Refine specific aims (stat hypotheses)
• Materials and methods: Study design
• Collection of data: Advise on QC
• Analysis– Describe sample (materials and methods)– Analyses to address specific aims
• Interpretation
Lecture 1: Regression Setting January 6, 2014
Biost 518 / 515 Applied Biostatistics II WIN 2014 32
32
Statistical Tasks
Statistical Hypotheses
Lecture 1: Regression Setting January 6, 2014
Biost 518 / 515 Applied Biostatistics II WIN 2014 33
33
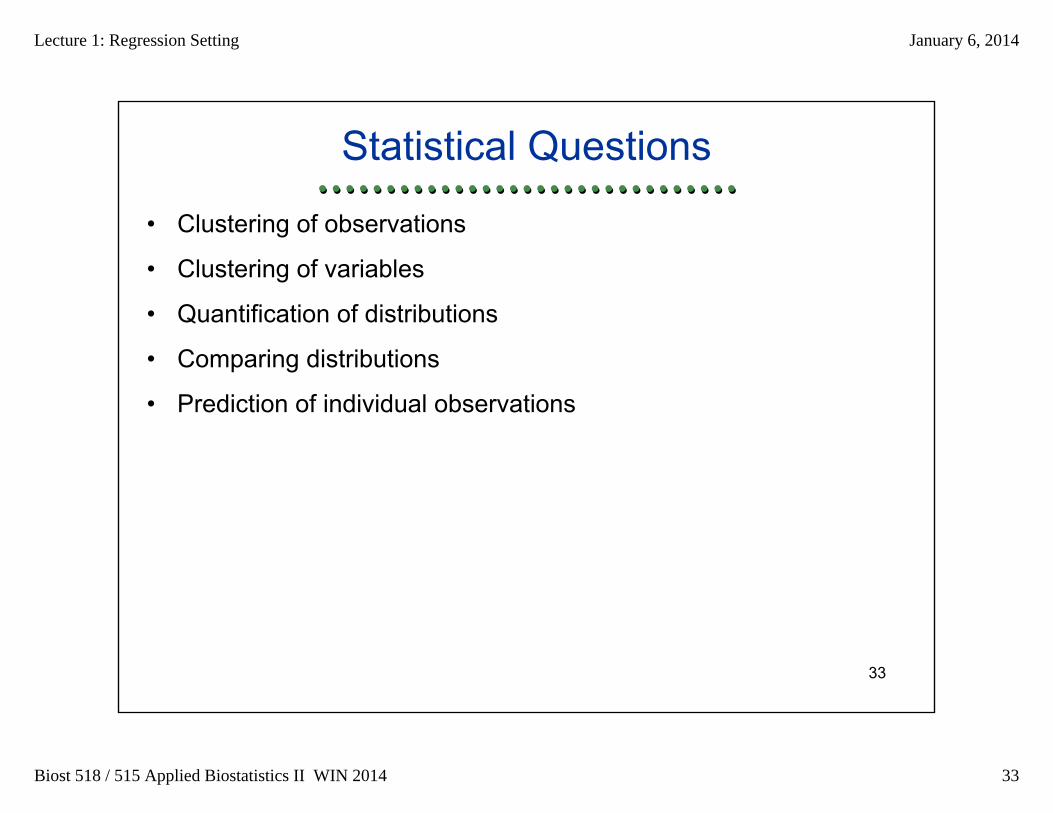
Statistical Questions
• Clustering of observations
• Clustering of variables
• Quantification of distributions
• Comparing distributions
• Prediction of individual observations
Lecture 1: Regression Setting January 6, 2014
Biost 518 / 515 Applied Biostatistics II WIN 2014 34
34
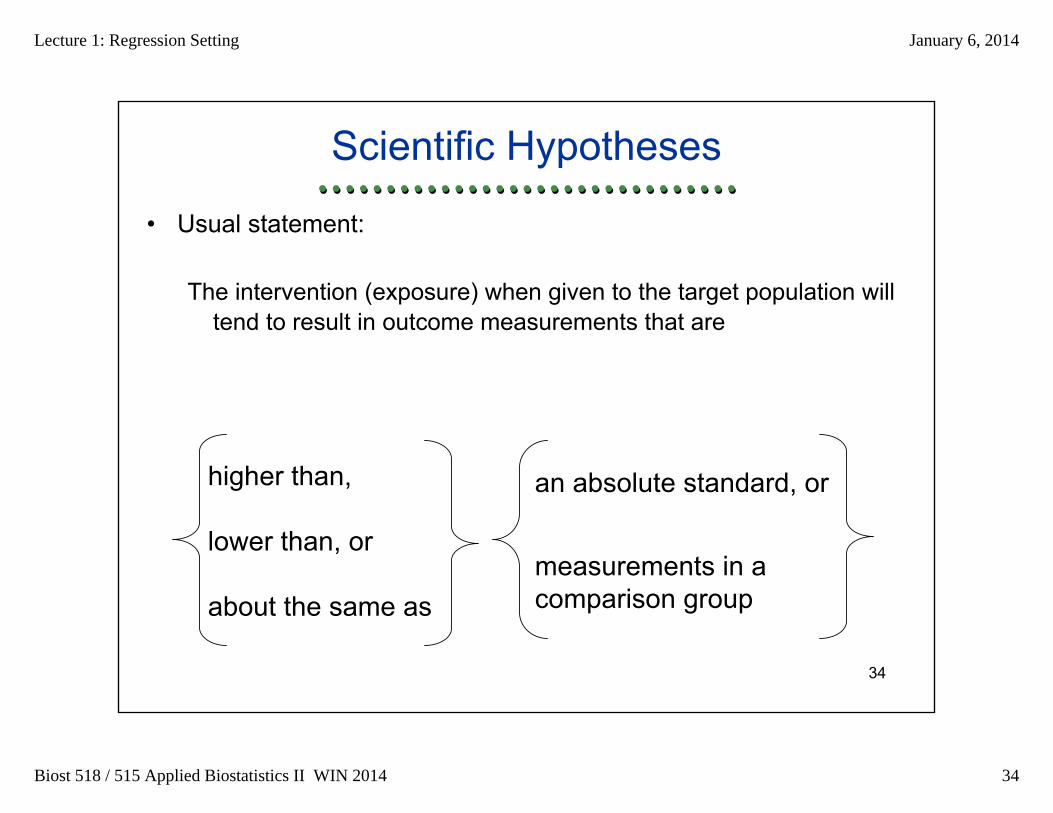
Scientific Hypotheses
• Usual statement:
The intervention (exposure) when given to the target population will tend to result in outcome measurements that are
higher than,
lower than, or
about the same as
an absolute standard, or
measurements in a comparison group
Lecture 1: Regression Setting January 6, 2014
Biost 518 / 515 Applied Biostatistics II WIN 2014 35
35
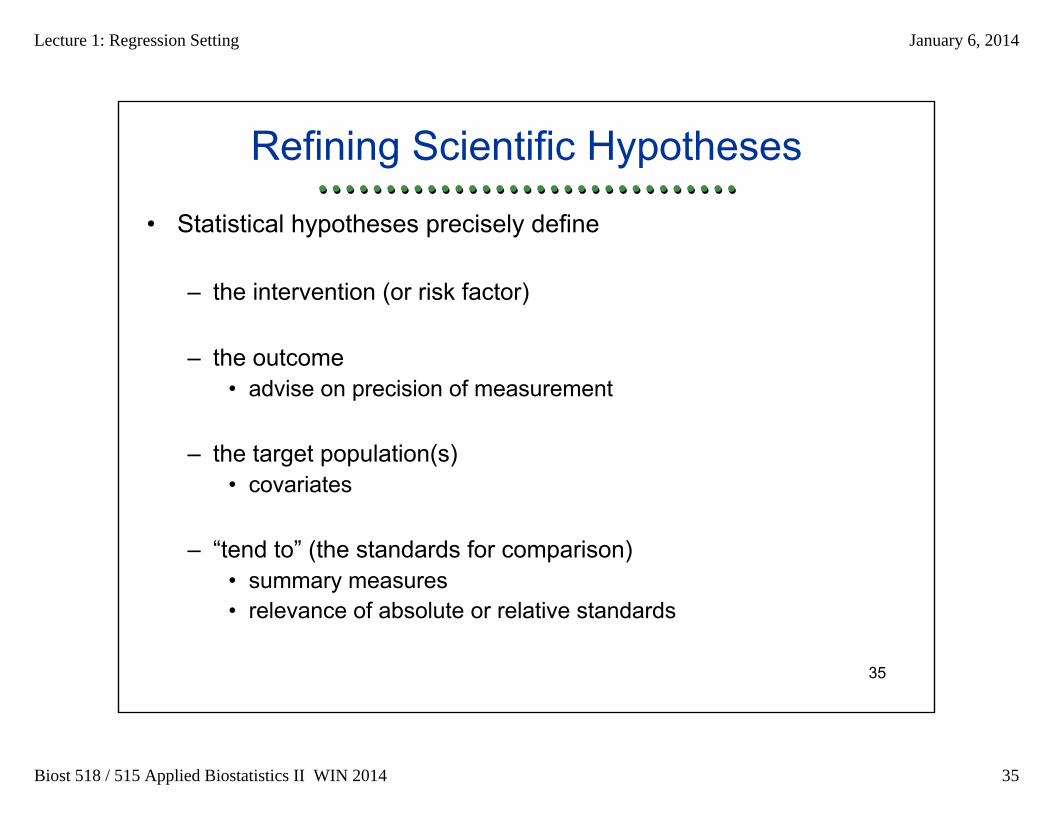
Refining Scientific Hypotheses
• Statistical hypotheses precisely define
– the intervention (or risk factor)
– the outcome• advise on precision of measurement
– the target population(s)• covariates
– “tend to” (the standards for comparison)• summary measures• relevance of absolute or relative standards
Lecture 1: Regression Setting January 6, 2014
Biost 518 / 515 Applied Biostatistics II WIN 2014 36
36
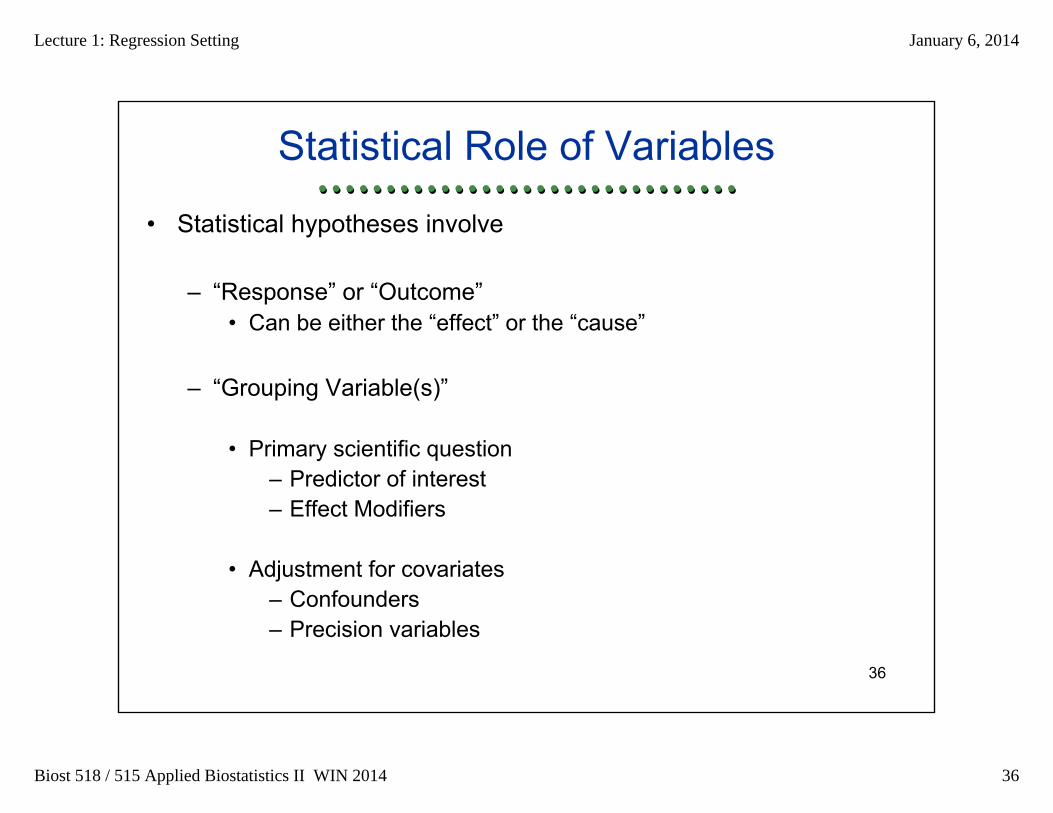
Statistical Role of Variables
• Statistical hypotheses involve
– “Response” or “Outcome”• Can be either the “effect” or the “cause”
– “Grouping Variable(s)”
• Primary scientific question– Predictor of interest– Effect Modifiers
• Adjustment for covariates– Confounders– Precision variables
Lecture 1: Regression Setting January 6, 2014
Biost 518 / 515 Applied Biostatistics II WIN 2014 37
37
An Aside:
Ability to
Detect Associations

Lecture 1: Regression Setting January 6, 2014
Biost 518 / 515 Applied Biostatistics II WIN 2014 38
38
Definition of an Association
• The distributions of two variables are not independent
• Independence: Equivalent definitions
– Probability of outcome and exposure is product of• Overall probability of outcome, and• Overall probability of exposure
– Distribution of exposure is the same across all outcome categories
– Distribution of outcome is the same across all exposure categories
Lecture 1: Regression Setting January 6, 2014
Biost 518 / 515 Applied Biostatistics II WIN 2014 39
39
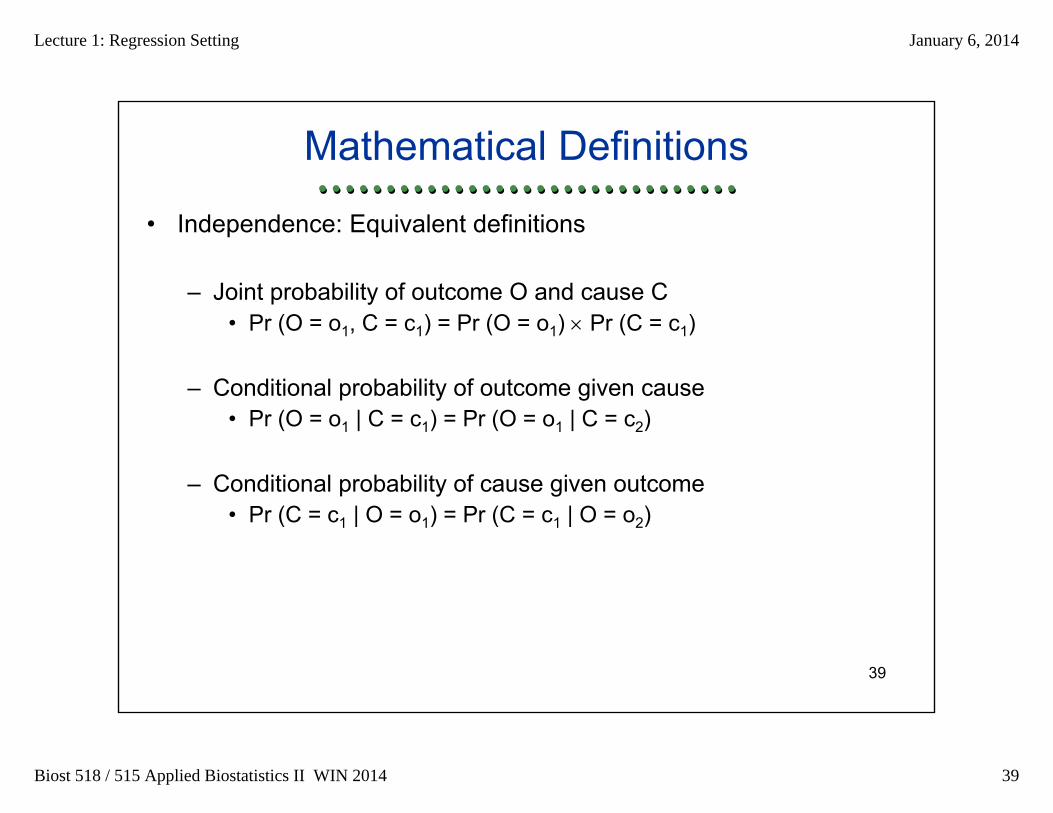
Mathematical Definitions
• Independence: Equivalent definitions
– Joint probability of outcome O and cause C• Pr (O = o1, C = c1) = Pr (O = o1) Pr (C = c1)
– Conditional probability of outcome given cause• Pr (O = o1 | C = c1) = Pr (O = o1 | C = c2)
– Conditional probability of cause given outcome• Pr (C = c1 | O = o1) = Pr (C = c1 | O = o2)
Lecture 1: Regression Setting January 6, 2014
Biost 518 / 515 Applied Biostatistics II WIN 2014 40
40
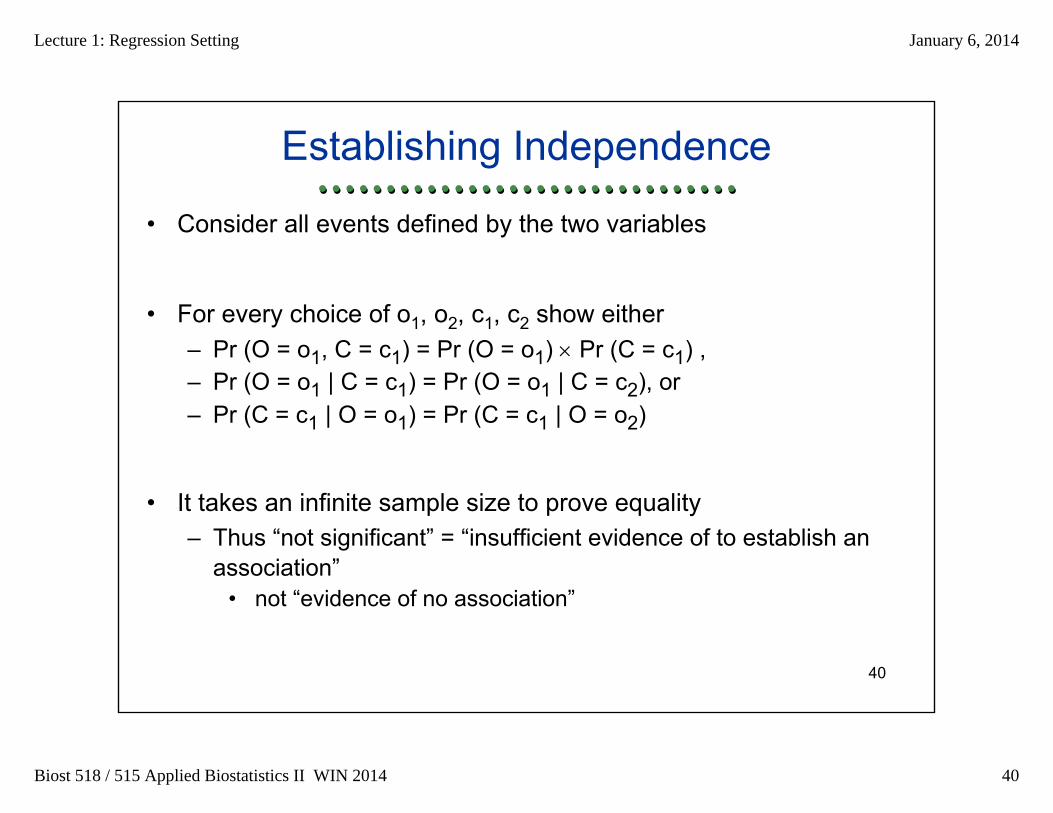
Establishing Independence
• Consider all events defined by the two variables
• For every choice of o1, o2, c1, c2 show either– Pr (O = o1, C = c1) = Pr (O = o1) Pr (C = c1) , – Pr (O = o1 | C = c1) = Pr (O = o1 | C = c2), or– Pr (C = c1 | O = o1) = Pr (C = c1 | O = o2)
• It takes an infinite sample size to prove equality– Thus “not significant” = “insufficient evidence of to establish an
association”• not “evidence of no association”
Lecture 1: Regression Setting January 6, 2014
Biost 518 / 515 Applied Biostatistics II WIN 2014 41
41
Detecting Associations
• Hence, we do not try to show no association
• Instead, we detect associations by showing that two variables are not independent
• Thus, we show that two distributions are different
Lecture 1: Regression Setting January 6, 2014
Biost 518 / 515 Applied Biostatistics II WIN 2014 42
42
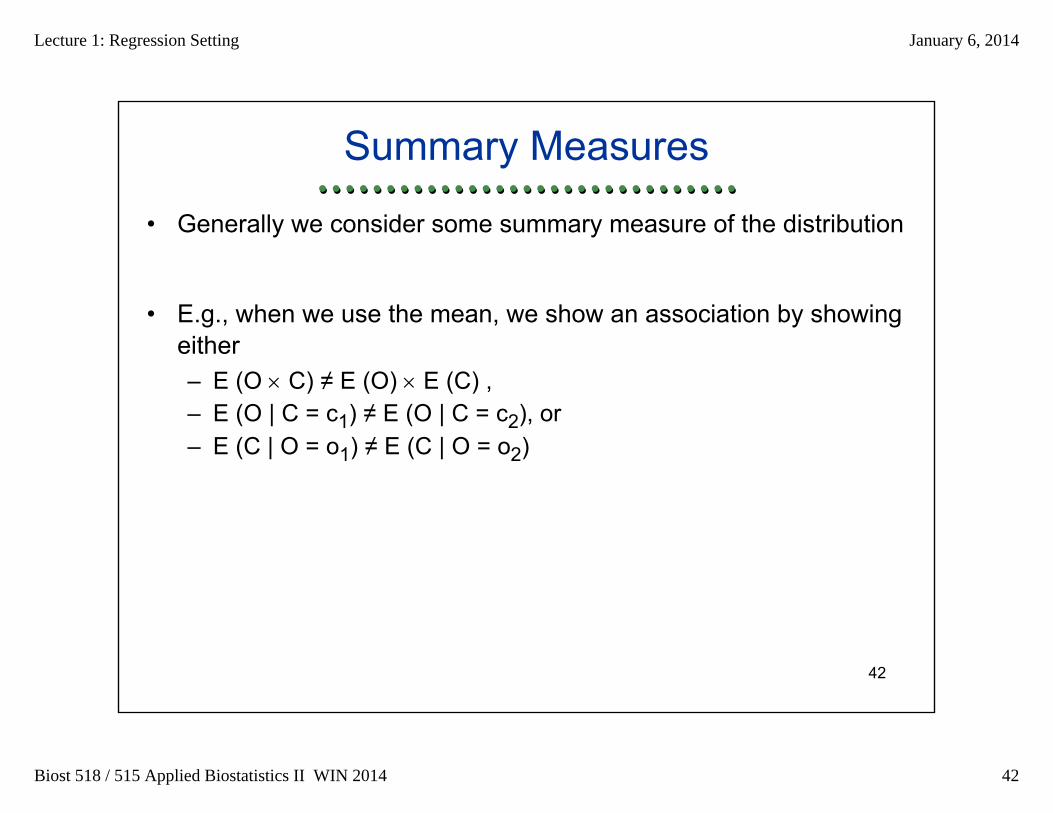
Summary Measures
• Generally we consider some summary measure of the distribution
• E.g., when we use the mean, we show an association by showing either– E (O C) ≠ E (O) E (C) , – E (O | C = c1) ≠ E (O | C = c2), or– E (C | O = o1) ≠ E (C | O = o2)
Lecture 1: Regression Setting January 6, 2014
Biost 518 / 515 Applied Biostatistics II WIN 2014 43
43
Justification
• This works, because if two distributions are the same, ALL summary measures should be the same
• If some summary measure is different, then we know the distributions are different
Lecture 1: Regression Setting January 6, 2014
Biost 518 / 515 Applied Biostatistics II WIN 2014 44
44
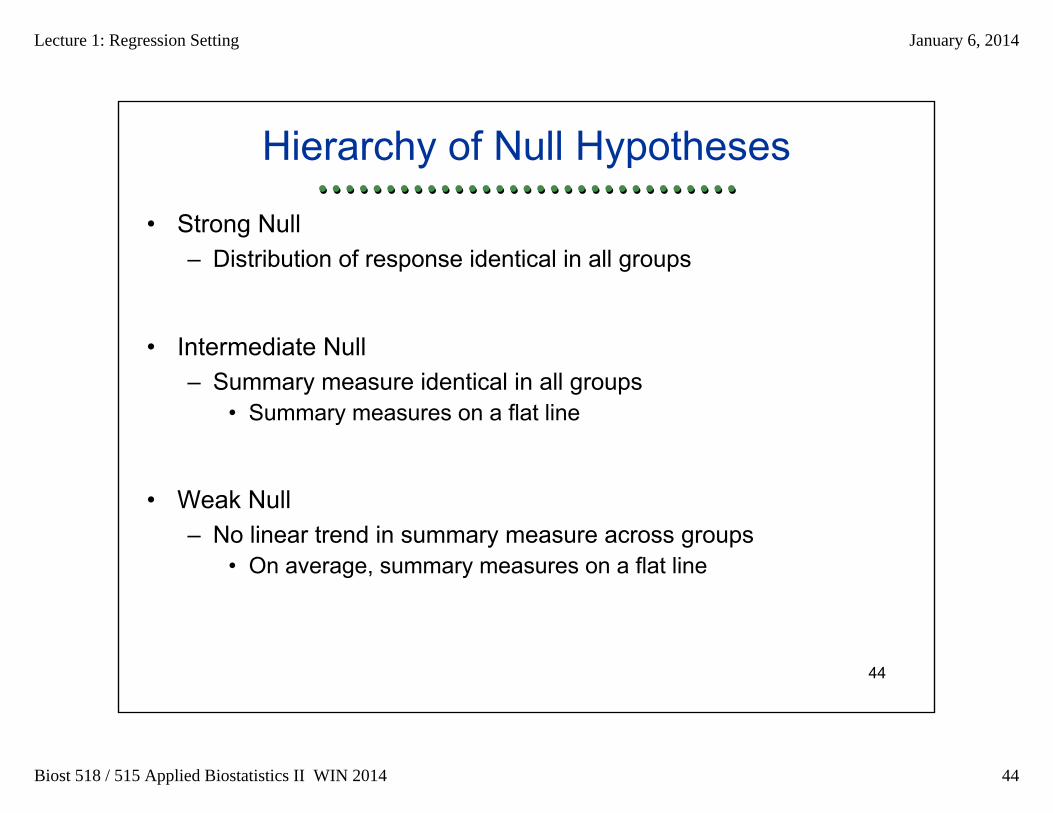
Hierarchy of Null Hypotheses
• Strong Null– Distribution of response identical in all groups
• Intermediate Null– Summary measure identical in all groups
• Summary measures on a flat line
• Weak Null– No linear trend in summary measure across groups
• On average, summary measures on a flat line
Lecture 1: Regression Setting January 6, 2014
Biost 518 / 515 Applied Biostatistics II WIN 2014 45
45
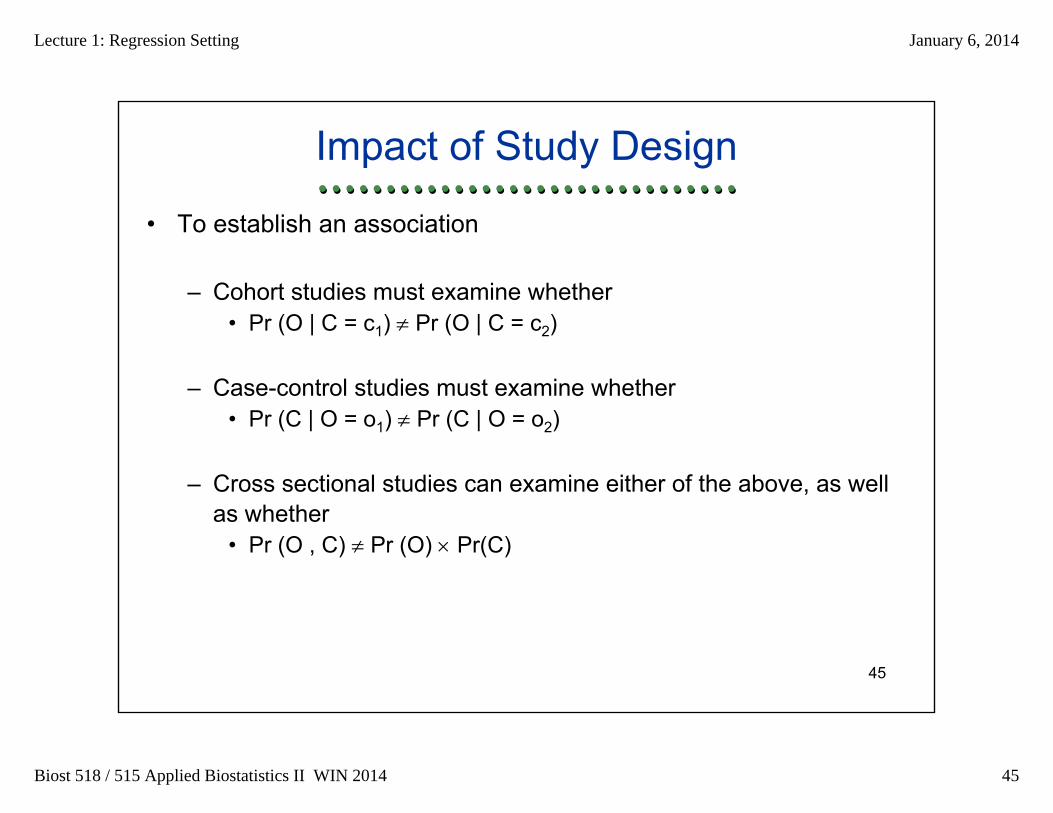
Impact of Study Design
• To establish an association
– Cohort studies must examine whether• Pr (O | C = c1) Pr (O | C = c2)
– Case-control studies must examine whether• Pr (C | O = o1) Pr (C | O = o2)
– Cross sectional studies can examine either of the above, as wellas whether
• Pr (O , C) Pr (O) Pr(C)
Lecture 1: Regression Setting January 6, 2014
Biost 518 / 515 Applied Biostatistics II WIN 2014 46
46
Summary Measures
Lecture 1: Regression Setting January 6, 2014
Biost 518 / 515 Applied Biostatistics II WIN 2014 47
47
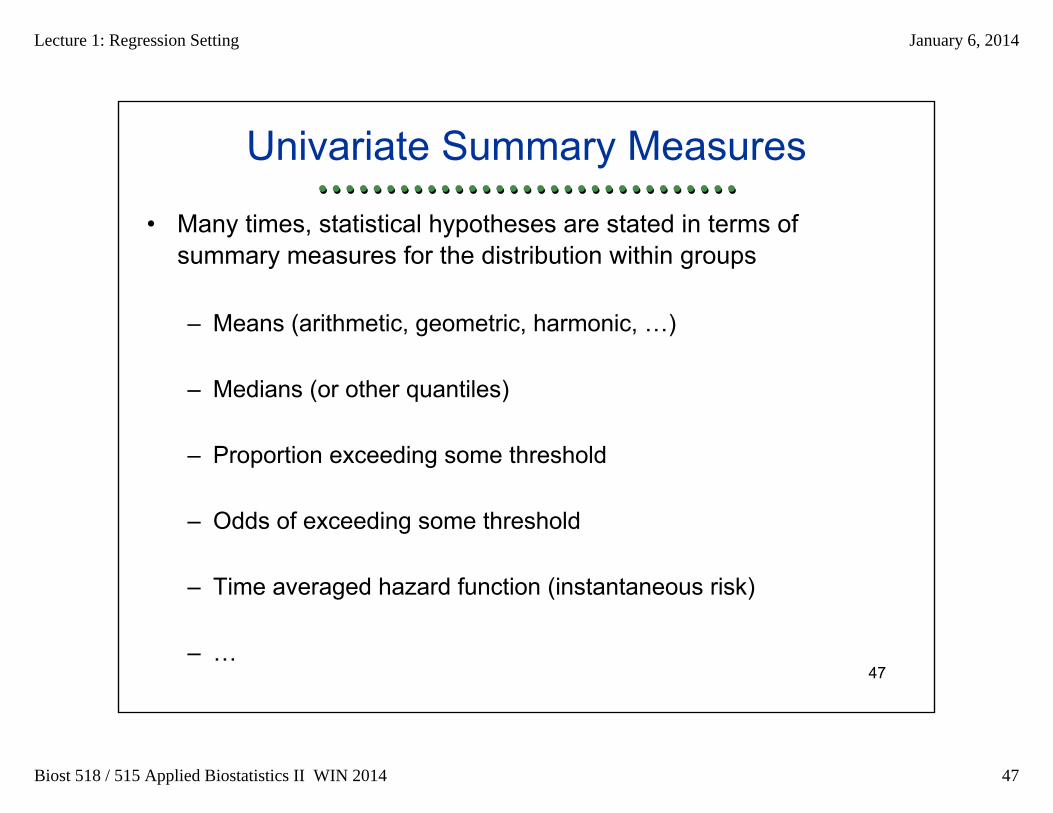
Univariate Summary Measures
• Many times, statistical hypotheses are stated in terms of summary measures for the distribution within groups
– Means (arithmetic, geometric, harmonic, …)
– Medians (or other quantiles)
– Proportion exceeding some threshold
– Odds of exceeding some threshold
– Time averaged hazard function (instantaneous risk)
– …
Lecture 1: Regression Setting January 6, 2014
Biost 518 / 515 Applied Biostatistics II WIN 2014 48
48
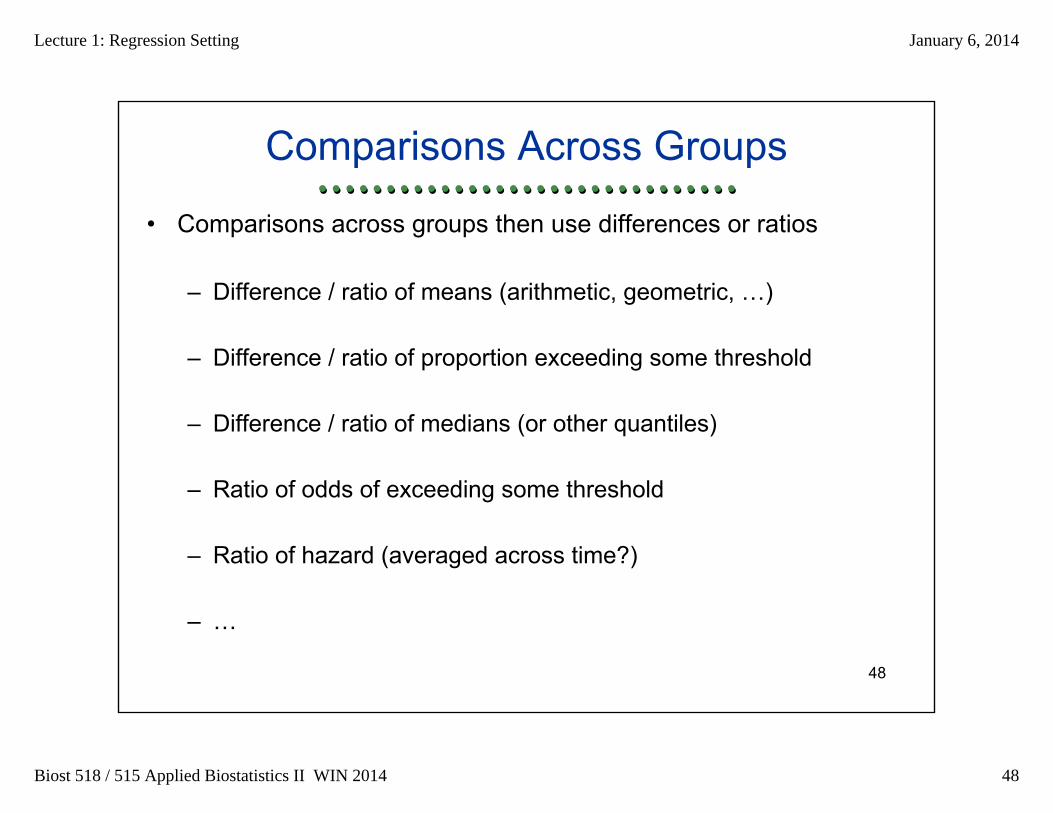
Comparisons Across Groups
• Comparisons across groups then use differences or ratios
– Difference / ratio of means (arithmetic, geometric, …)
– Difference / ratio of proportion exceeding some threshold
– Difference / ratio of medians (or other quantiles)
– Ratio of odds of exceeding some threshold
– Ratio of hazard (averaged across time?)
– …
Lecture 1: Regression Setting January 6, 2014
Biost 518 / 515 Applied Biostatistics II WIN 2014 49
49
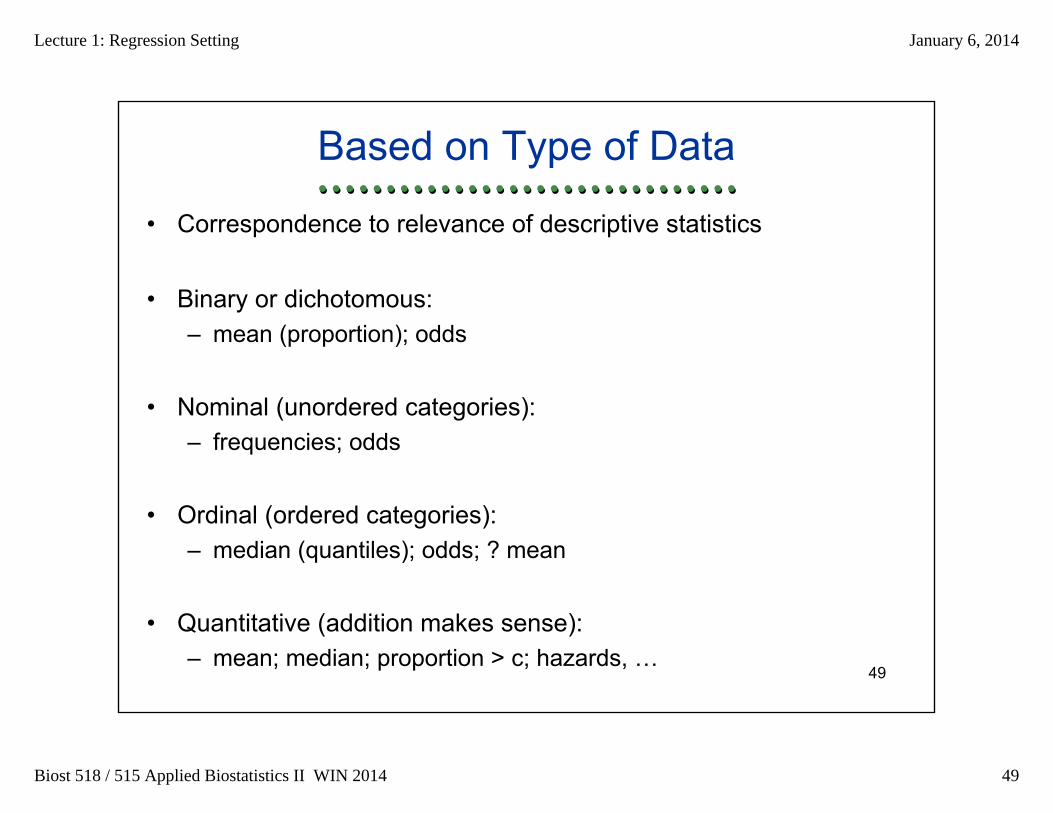
Based on Type of Data
• Correspondence to relevance of descriptive statistics
• Binary or dichotomous: – mean (proportion); odds
• Nominal (unordered categories): – frequencies; odds
• Ordinal (ordered categories): – median (quantiles); odds; ? mean
• Quantitative (addition makes sense): – mean; median; proportion > c; hazards, …
Lecture 1: Regression Setting January 6, 2014
Biost 518 / 515 Applied Biostatistics II WIN 2014 50
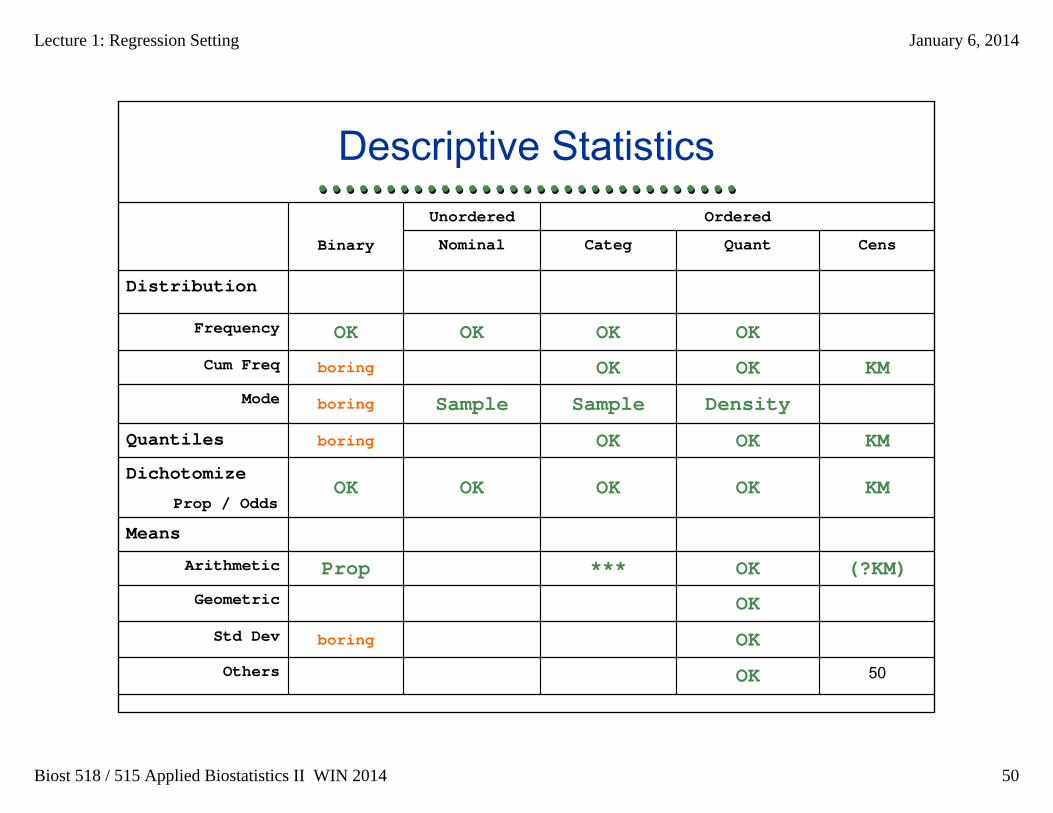
50OKOthers
OKboringStd Dev
OKGeometric
(?KM)OK***PropArithmetic
Means
KMOKOKOKOKDichotomize
Prop / Odds
KMOKOKboringQuantiles
DensitySampleSampleboringMode
KMOKOKboringCum Freq
OKOKOKOKFrequency
Distribution
CensQuantCategNominalBinary
OrderedUnordered
Descriptive Statistics
Lecture 1: Regression Setting January 6, 2014
Biost 518 / 515 Applied Biostatistics II WIN 2014 51
51
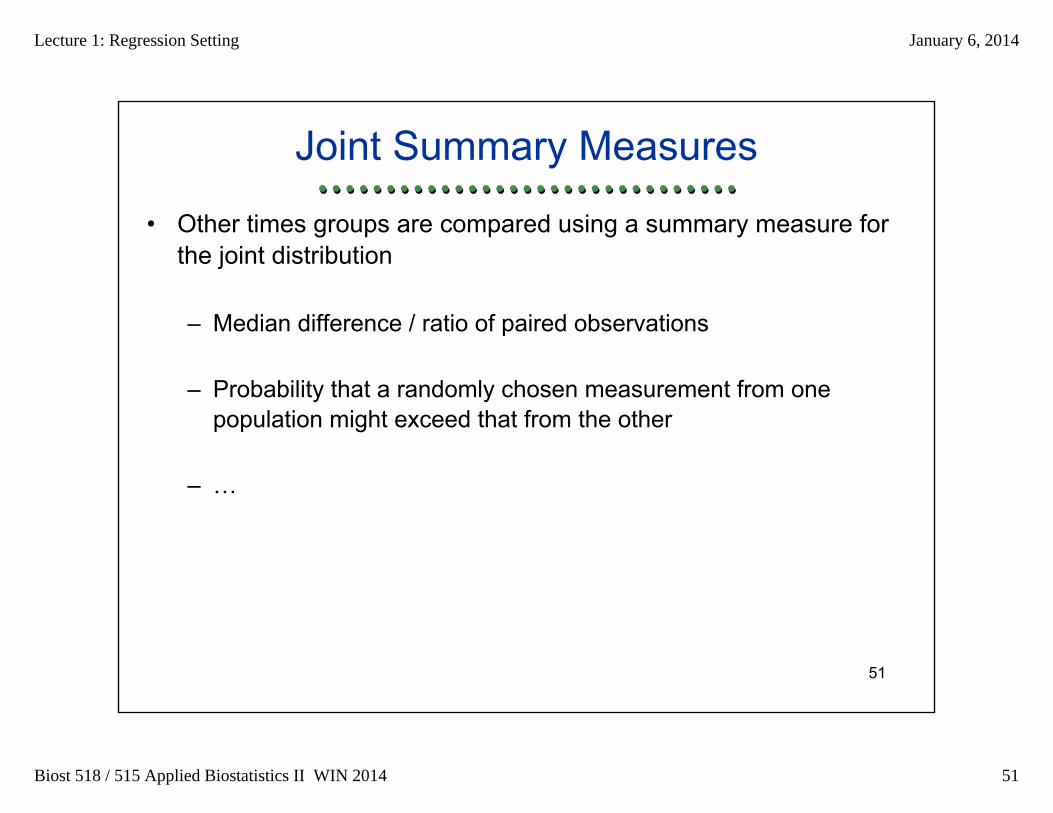
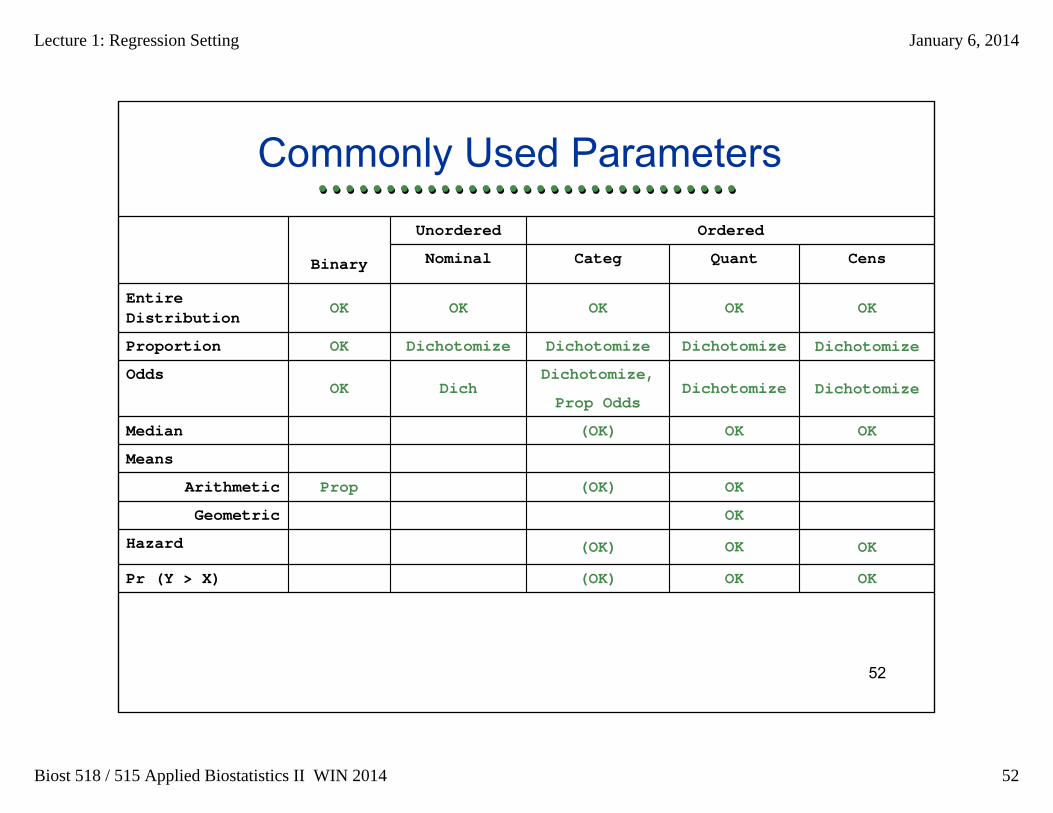
Joint Summary Measures
• Other times groups are compared using a summary measure for the joint distribution
– Median difference / ratio of paired observations
– Probability that a randomly chosen measurement from one population might exceed that from the other
– …
Lecture 1: Regression Setting January 6, 2014
Biost 518 / 515 Applied Biostatistics II WIN 2014 52
52
OK OK OK OKOK
OKOK(OK)Pr (Y > X)
OKOK(OK)Hazard
OKGeometric
OK(OK)PropArithmetic
Means
OKOK(OK)Median
DichotomizeDichotomizeDichotomize,
Prop OddsDichOK
Odds
DichotomizeDichotomizeDichotomizeDichotomizeOKProportion
Entire Distribution
CensQuantCategNominalBinary
OrderedUnordered
Commonly Used Parameters
Lecture 1: Regression Setting January 6, 2014
Biost 518 / 515 Applied Biostatistics II WIN 2014 53
53
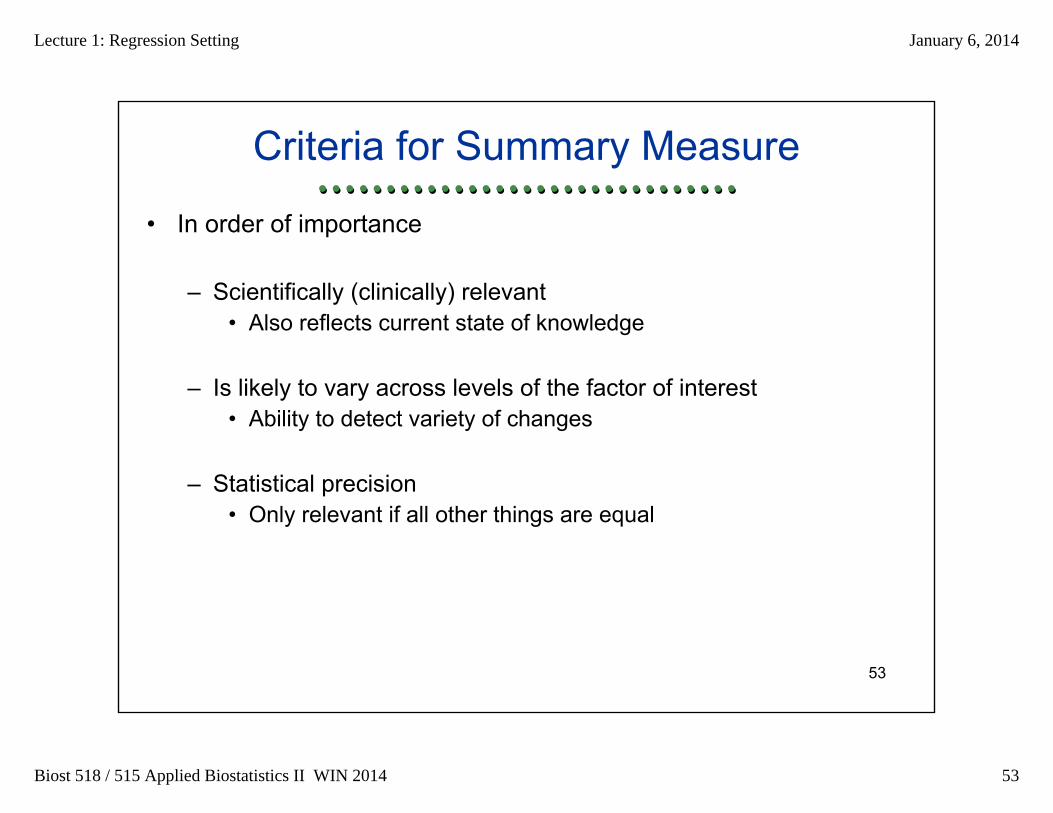
Criteria for Summary Measure
• In order of importance
– Scientifically (clinically) relevant• Also reflects current state of knowledge
– Is likely to vary across levels of the factor of interest• Ability to detect variety of changes
– Statistical precision• Only relevant if all other things are equal
Lecture 1: Regression Setting January 6, 2014
Biost 518 / 515 Applied Biostatistics II WIN 2014 54
54
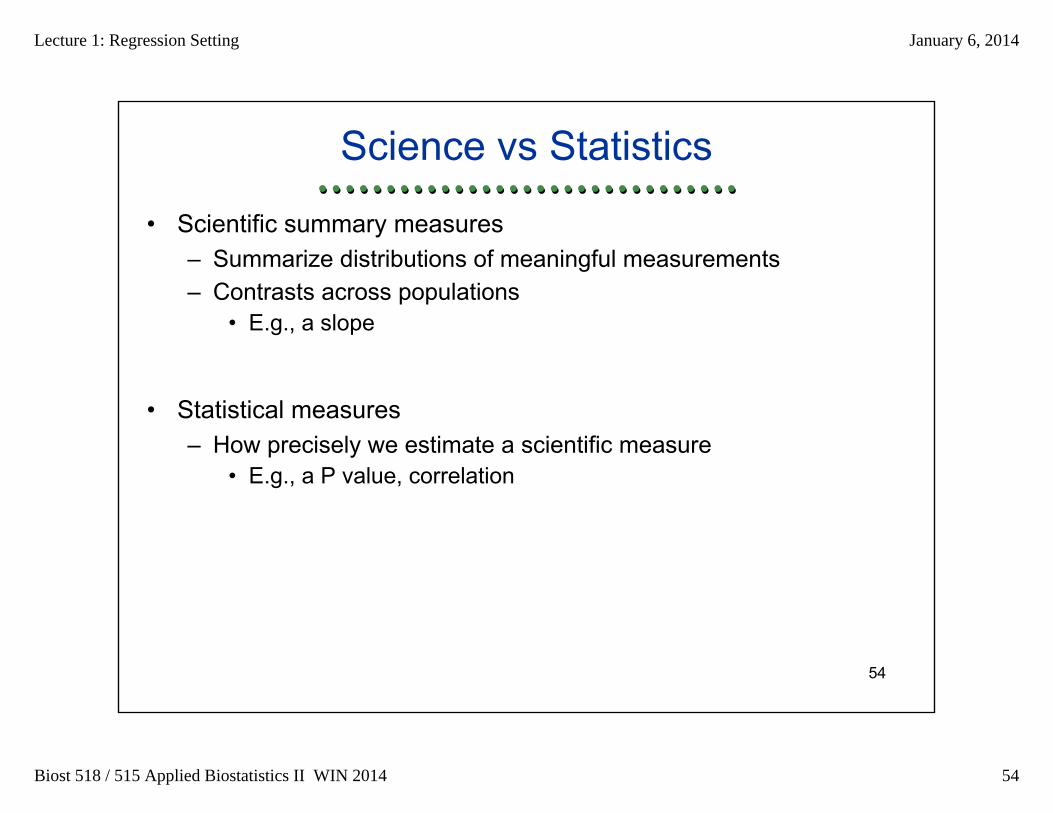
Science vs Statistics
• Scientific summary measures– Summarize distributions of meaningful measurements– Contrasts across populations
• E.g., a slope
• Statistical measures– How precisely we estimate a scientific measure
• E.g., a P value, correlation
Lecture 1: Regression Setting January 6, 2014
Biost 518 / 515 Applied Biostatistics II WIN 2014 55
55
Statistical Tasks
Data Analysis
Lecture 1: Regression Setting January 6, 2014
Biost 518 / 515 Applied Biostatistics II WIN 2014 56
56
Descriptive Statistics
• Description of a sample
• Identification of measurement or data entry errors
• Characterize materials and methods
• Validity of analysis methods– Assess scientific and statistical assumptions
• (Straightforward estimates of effects-- inference)
• Hypothesis generation (inference-- estimation)
Lecture 1: Regression Setting January 6, 2014
Biost 518 / 515 Applied Biostatistics II WIN 2014 57
57
Inference
• Generalizations from sample to population
• Estimation – Point estimates– Interval estimates
• Decision analysis (testing)– Quantifying strength of evidence
Lecture 1: Regression Setting January 6, 2014
Biost 518 / 515 Applied Biostatistics II WIN 2014 58
58
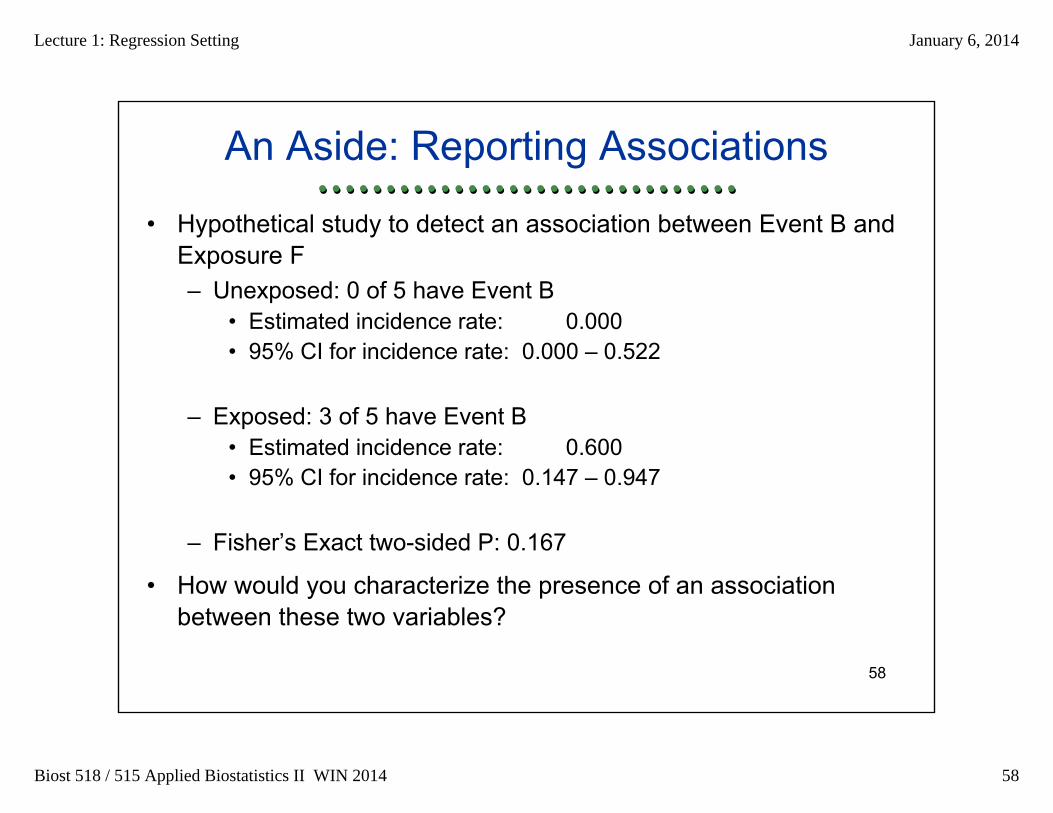
An Aside: Reporting Associations
• Hypothetical study to detect an association between Event B and Exposure F– Unexposed: 0 of 5 have Event B
• Estimated incidence rate: 0.000• 95% CI for incidence rate: 0.000 – 0.522
– Exposed: 3 of 5 have Event B• Estimated incidence rate: 0.600• 95% CI for incidence rate: 0.147 – 0.947
– Fisher’s Exact two-sided P: 0.167
• How would you characterize the presence of an association between these two variables?
Lecture 1: Regression Setting January 6, 2014
Biost 518 / 515 Applied Biostatistics II WIN 2014 59
59
WRONG Criteria
• Incorrect criteria for stating the existence of a statistically significant association
– “Because the confidence intervals overlap, there is no association.”
– (We need to use a P value. The use of confidence intervals in this manner is more complicated.)
Lecture 1: Regression Setting January 6, 2014
Biost 518 / 515 Applied Biostatistics II WIN 2014 60
60
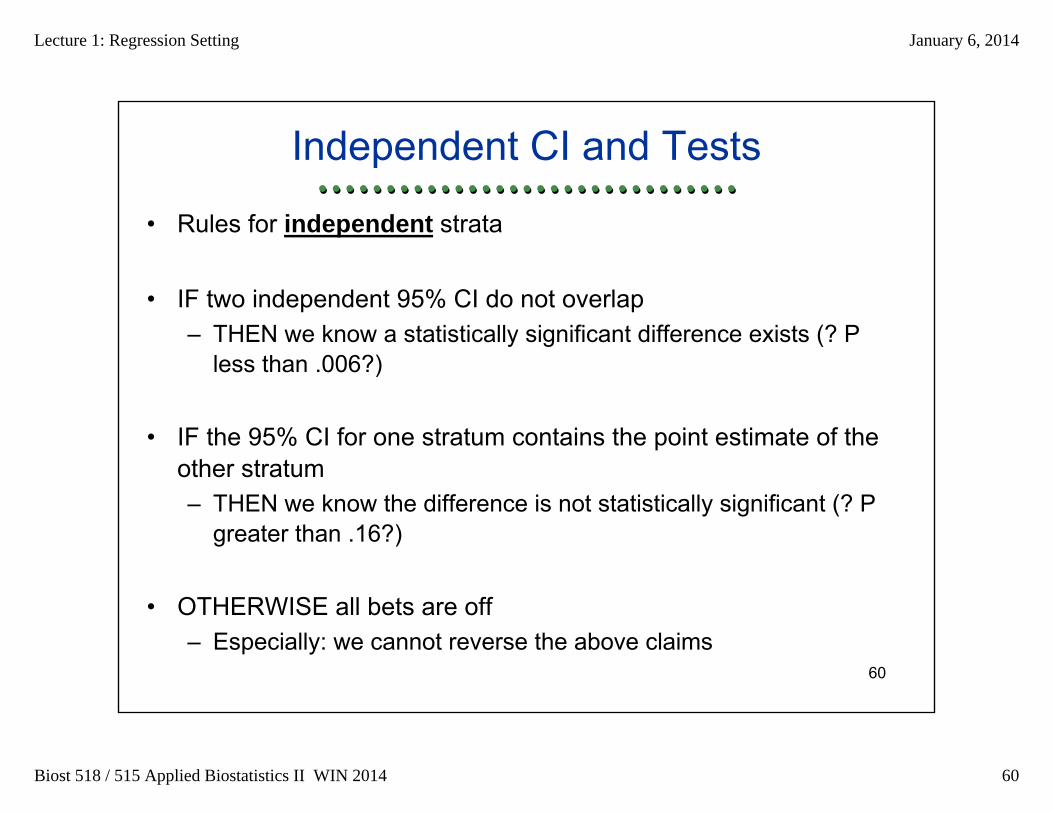
Independent CI and Tests
• Rules for independent strata
• IF two independent 95% CI do not overlap– THEN we know a statistically significant difference exists (? P
less than .006?)
• IF the 95% CI for one stratum contains the point estimate of theother stratum– THEN we know the difference is not statistically significant (? P
greater than .16?)
• OTHERWISE all bets are off– Especially: we cannot reverse the above claims
Lecture 1: Regression Setting January 6, 2014
Biost 518 / 515 Applied Biostatistics II WIN 2014 61
61
WRONG
• An overstated, purely statistical report
– “As the P value is greater than 0.05, we conclude that there is no association between exposure F and event B.”
• (We should not conclude that there is no association, because welacked precision to rule out differences that might be of interest.)
Lecture 1: Regression Setting January 6, 2014
Biost 518 / 515 Applied Biostatistics II WIN 2014 62
62
Scientifically USELESS
• A correctly stated, purely statistical report
– “As the P value is greater than 0.05, we conclude that there is not sufficient evidence to rule out the possibility of no association between exposure F and event B.”
• (Stated correctly, but gives no idea of whether we had ruled outdifferences that we cared about or we had merely done an abysmal study.)
Lecture 1: Regression Setting January 6, 2014
Biost 518 / 515 Applied Biostatistics II WIN 2014 63
63
CORRECT and USEFUL
• Scientific estimates and quantification of statistical evidence
– “Incidence rates of 60% in the exposed (95% CI: 15% - 95%) and 0% in the unexposed (95% CI: 0% - 52%). Unfortunately, the precision was not adequate to demonstrate that such a large difference in incidence rates would be unlikely in the absence of a true association (P = 0.17).”
• (These data are not atypical of setting in which F= female and B= giving birth.)
Lecture 1: Regression Setting January 6, 2014
Biost 518 / 515 Applied Biostatistics II WIN 2014 64
64
Take Home Message
• Ideal: Always give 4 numbers– Point estimate– Confidence interval (lower, upper bound)– P value
• Even when not significant: Give 4 numbers– Arguably, it is more important to provide them when not
significant
• Be forewarned– My job is to improve science into the future– If your advisor or the journals you publish in are wrong on this
point, I want to make sure you know they are wrong
Lecture 1: Regression Setting January 6, 2014
Biost 518 / 515 Applied Biostatistics II WIN 2014 65
65
Statistical Tasks
Analysis Methods
Lecture 1: Regression Setting January 6, 2014
Biost 518 / 515 Applied Biostatistics II WIN 2014 66
66
Biost 517
• We described tests (and sometimes CI) for comparing parameters across groups
• Not all are implemented in statistical software, though with a little work they can be obtained in most software packages
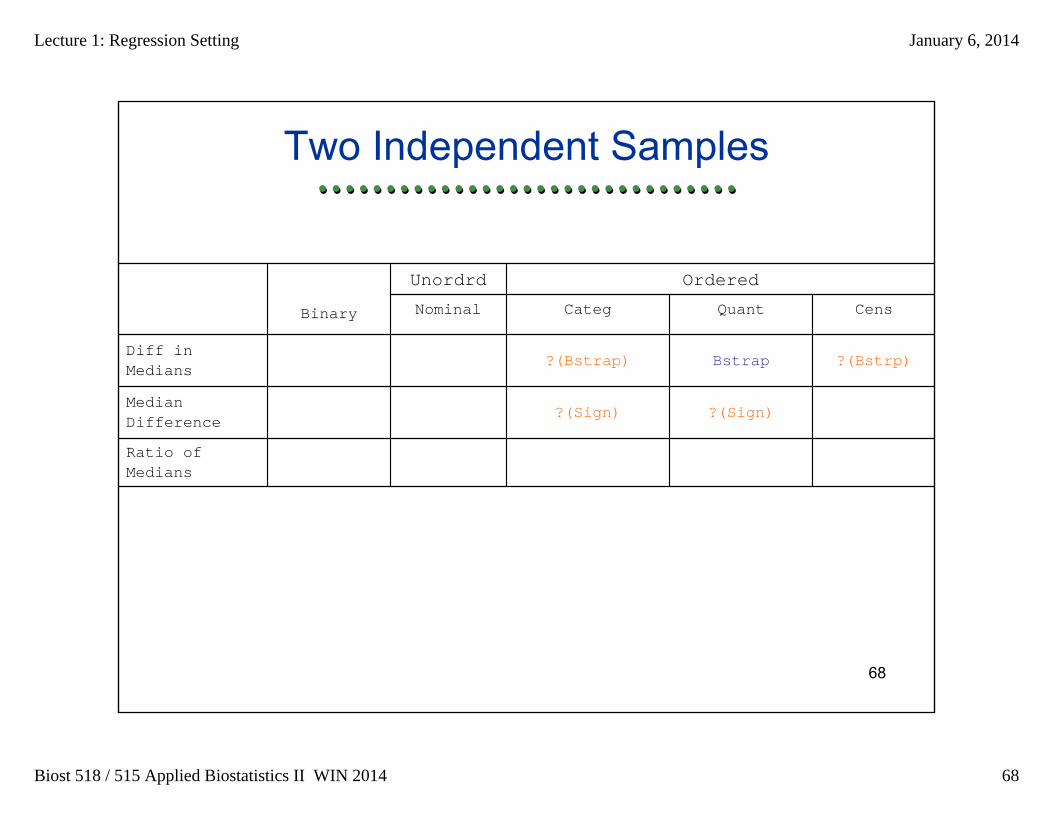
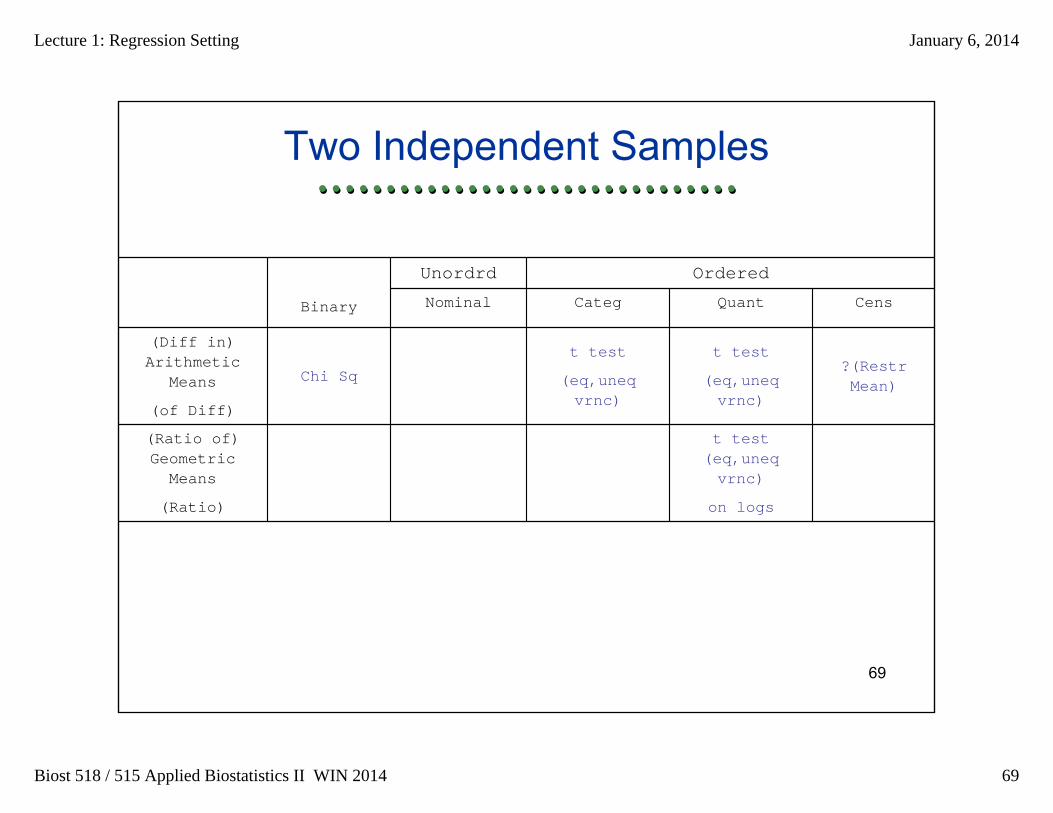
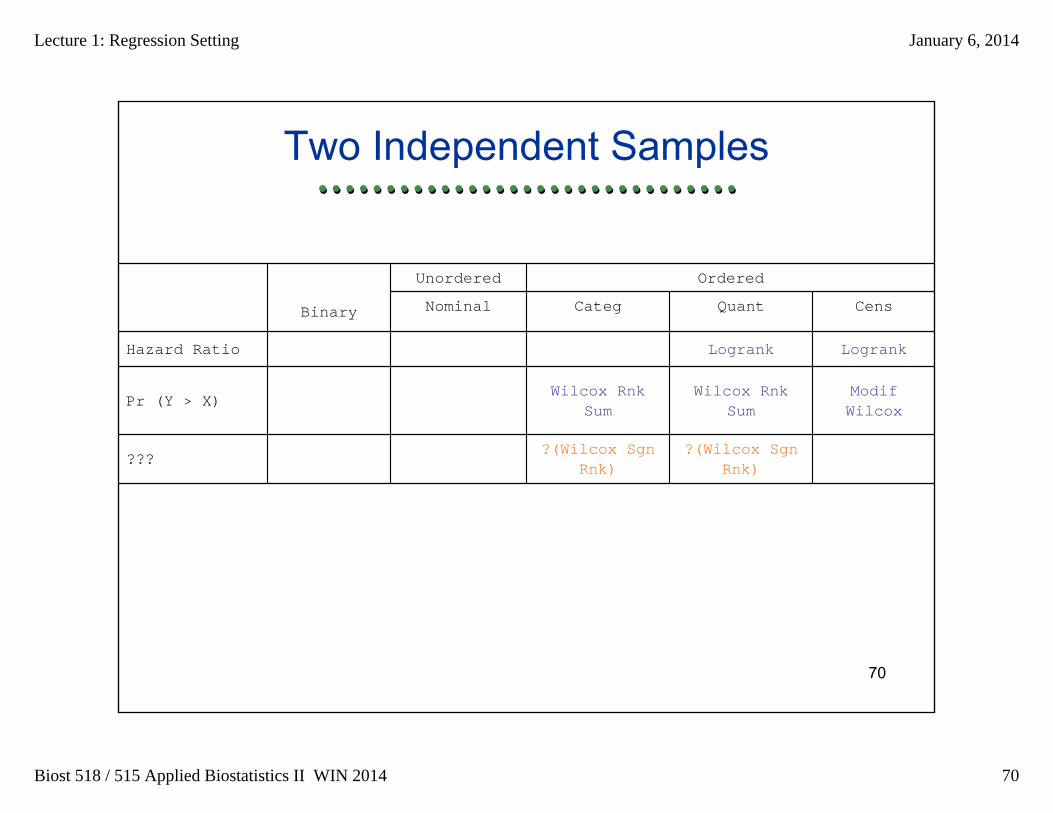
• There are some tests which technically could be applied in certain situations, but it is not very often seen (or recognized)– (I have denoted these cases with ?)
Lecture 1: Regression Setting January 6, 2014
Biost 518 / 515 Applied Biostatistics II WIN 2014 67
67
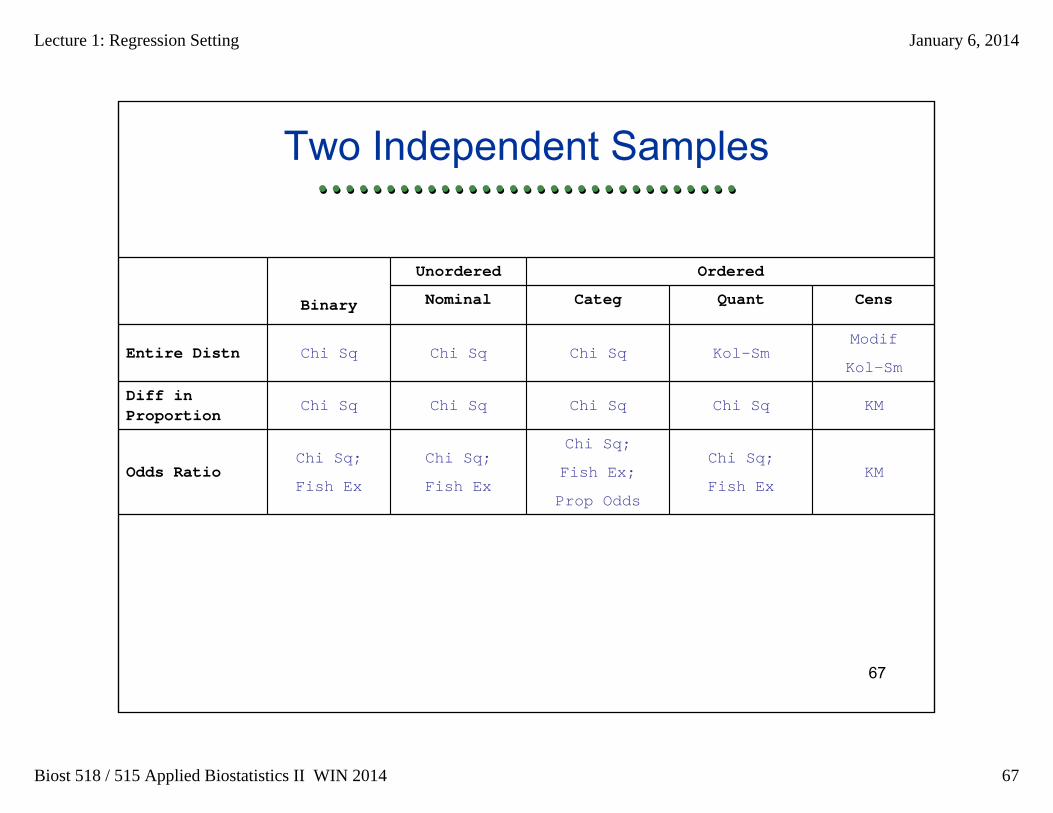
Chi Sq Chi Sq Kol-SmModif
Kol-SmChi Sq
KMChi Sq;
Fish Ex
Chi Sq;
Fish Ex;
Prop Odds
Chi Sq;
Fish Ex
Chi Sq;
Fish ExOdds Ratio
KMChi SqChi SqChi SqChi SqDiff in Proportion
Entire Distn
CensQuantCategNominalBinary
OrderedUnordered
Two Independent Samples
Lecture 1: Regression Setting January 6, 2014
Biost 518 / 515 Applied Biostatistics II WIN 2014 68
68
Ratio of Medians
?(Sign)?(Sign)Median Difference
?(Bstrp)Bstrap?(Bstrap)Diff in Medians
CensQuantCategNominalBinary
OrderedUnordrd
Two Independent Samples
Lecture 1: Regression Setting January 6, 2014
Biost 518 / 515 Applied Biostatistics II WIN 2014 69
69
t test (eq,uneqvrnc)
on logs
(Ratio of) Geometric
Means
(Ratio)
?(RestrMean)
t test
(eq,uneqvrnc)
t test
(eq,uneqvrnc)
Chi Sq
(Diff in) Arithmetic
Means
(of Diff)
CensQuantCategNominalBinary
OrderedUnordrd
Two Independent Samples
Lecture 1: Regression Setting January 6, 2014
Biost 518 / 515 Applied Biostatistics II WIN 2014 70
70
?(Wilcox SgnRnk)
?(Wilcox SgnRnk)
???
ModifWilcox
Wilcox RnkSum
Wilcox RnkSum
Pr (Y > X)
LogrankLogrankHazard Ratio
CensQuantCategNominalBinary
OrderedUnordered
Two Independent Samples
Lecture 1: Regression Setting January 6, 2014
Biost 518 / 515 Applied Biostatistics II WIN 2014 71
71
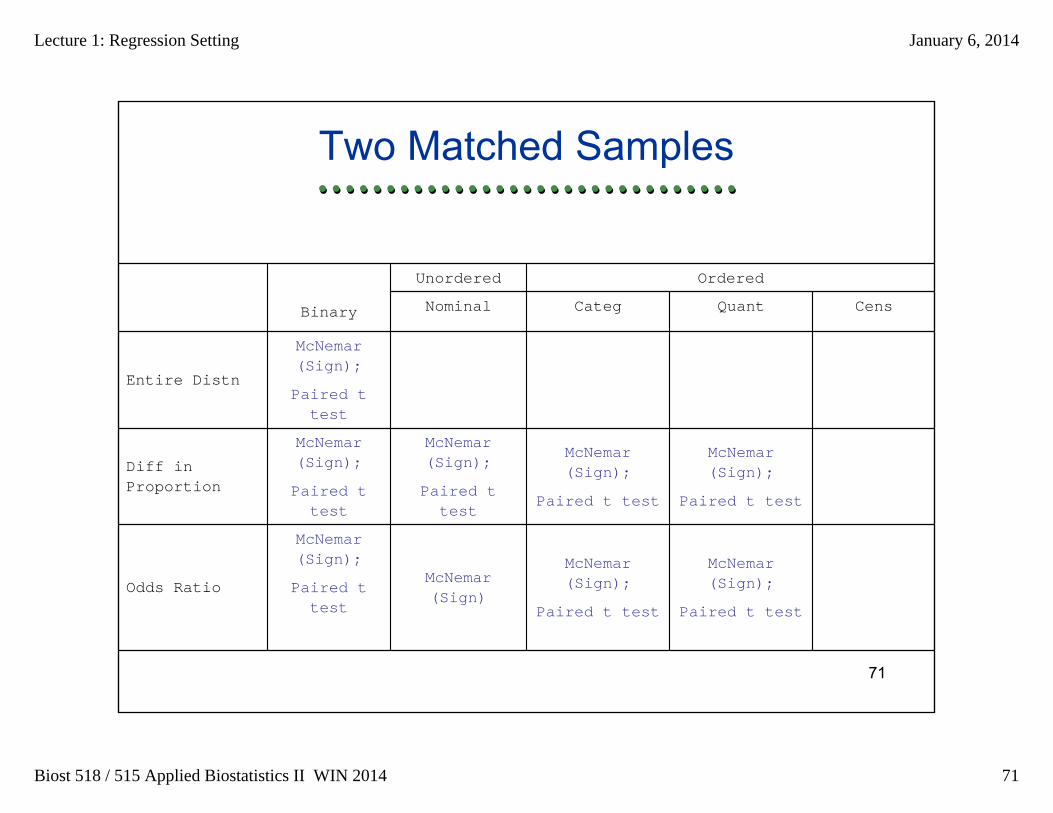
McNemar(Sign);
Paired t test
McNemar(Sign);
Paired t test
McNemar(Sign);
Paired t test
McNemar(Sign)
McNemar(Sign);
Paired t test
Odds Ratio
McNemar(Sign);
Paired t test
McNemar(Sign);
Paired t test
McNemar(Sign);
Paired t test
McNemar(Sign);
Paired t test
Diff in Proportion
Entire Distn
CensQuantCategNominalBinary
OrderedUnordered
Two Matched Samples
Lecture 1: Regression Setting January 6, 2014
Biost 518 / 515 Applied Biostatistics II WIN 2014 72
72
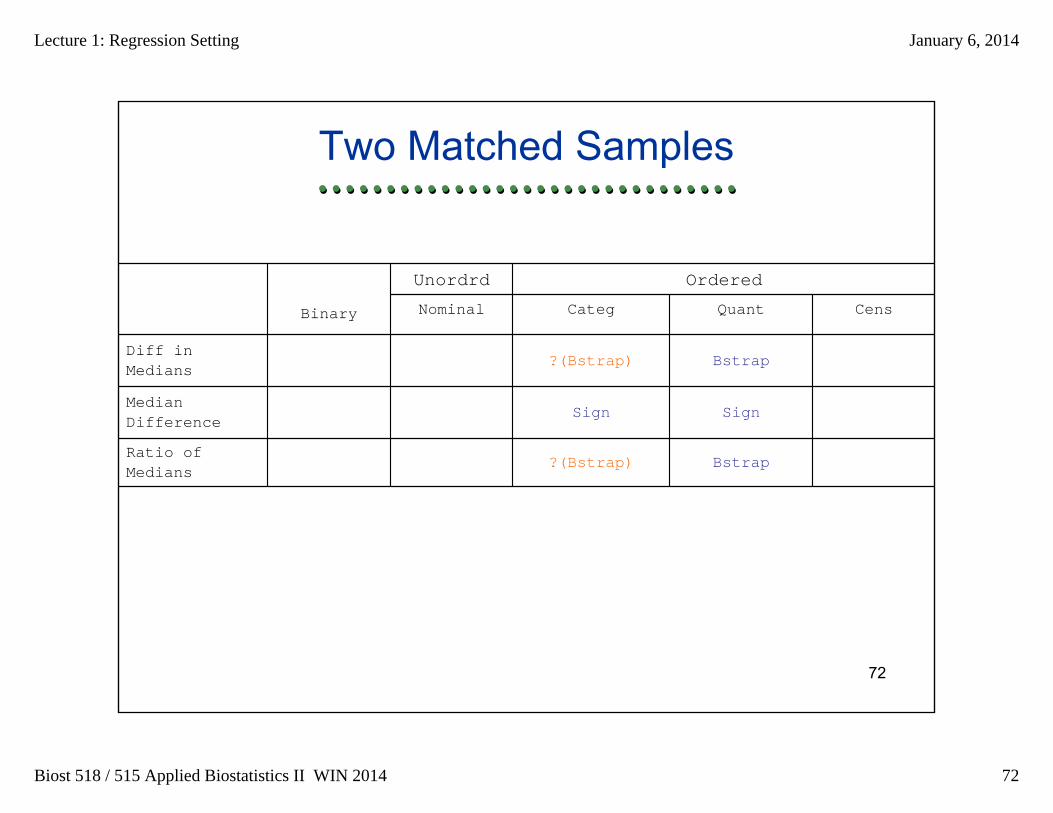
Bstrap?(Bstrap)Ratio of Medians
SignSignMedian Difference
Bstrap?(Bstrap)Diff in Medians
CensQuantCategNominalBinary
OrderedUnordrd
Two Matched Samples
Lecture 1: Regression Setting January 6, 2014
Biost 518 / 515 Applied Biostatistics II WIN 2014 73
73
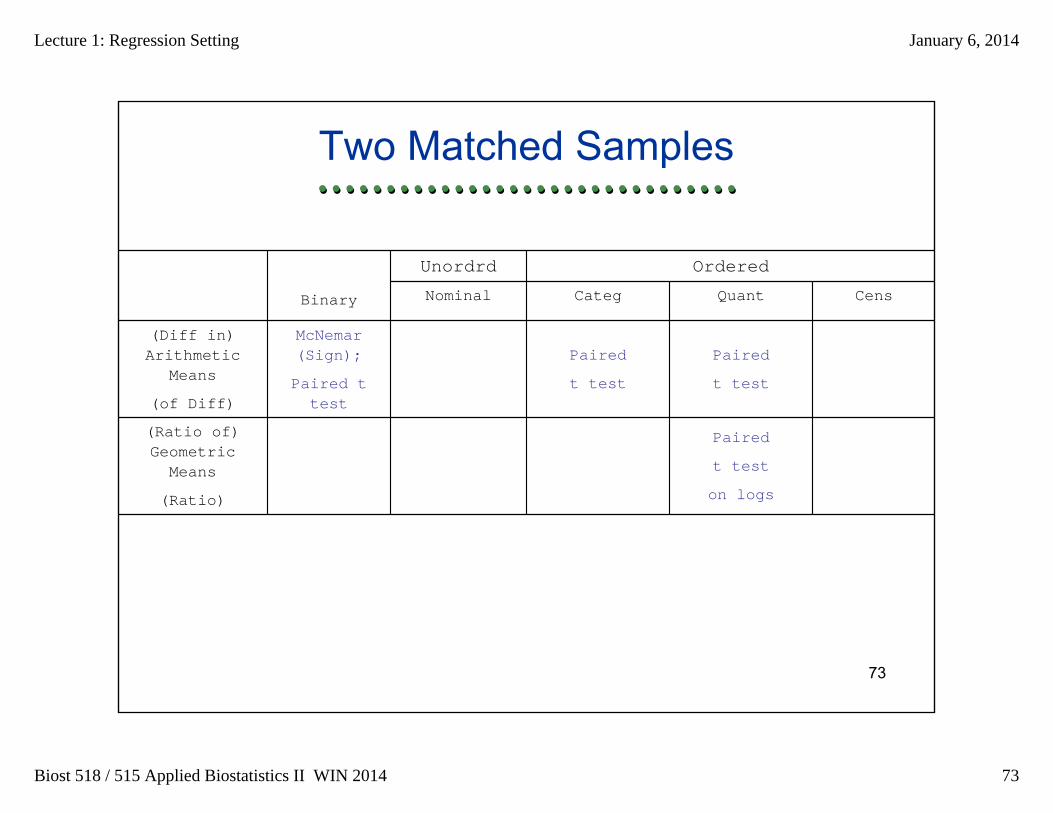
Paired
t test
on logs
(Ratio of) Geometric
Means
(Ratio)
Paired
t test
Paired
t test
McNemar(Sign);
Paired t test
(Diff in) Arithmetic
Means
(of Diff)
CensQuantCategNominalBinary
OrderedUnordrd
Two Matched Samples
Lecture 1: Regression Setting January 6, 2014
Biost 518 / 515 Applied Biostatistics II WIN 2014 74
74
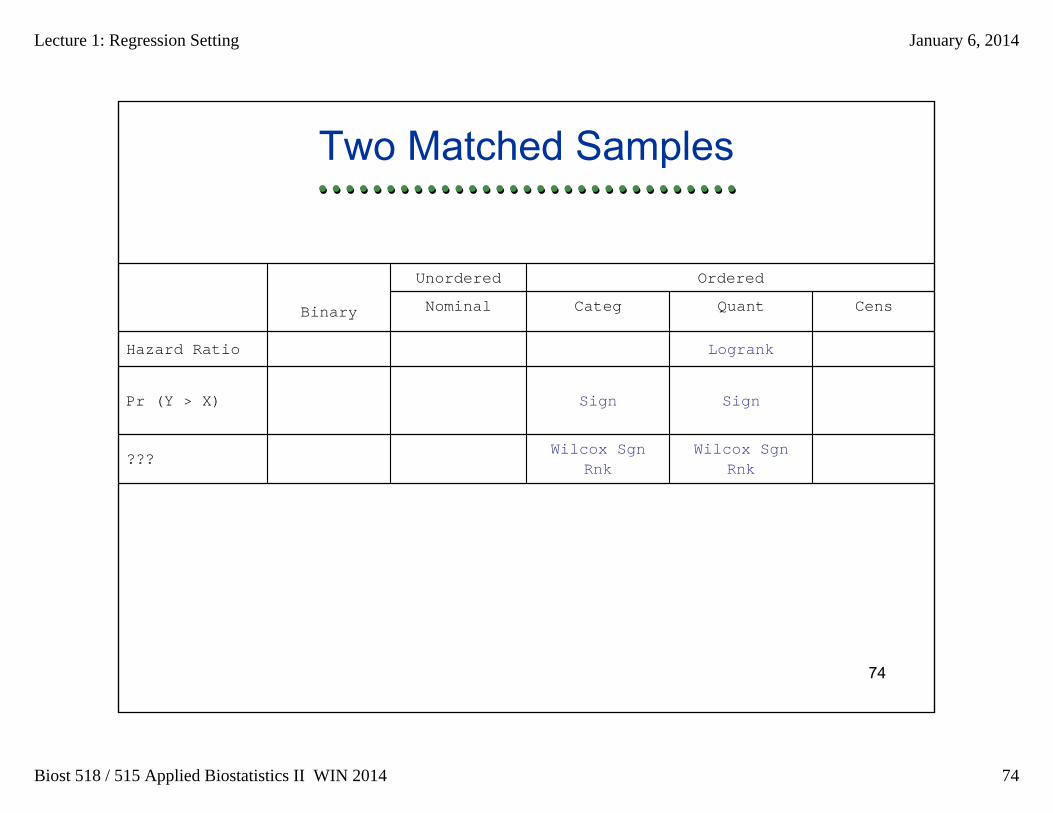
Wilcox SgnRnk
Wilcox SgnRnk
???
SignSignPr (Y > X)
LogrankHazard Ratio
CensQuantCategNominalBinary
OrderedUnordered
Two Matched Samples
Lecture 1: Regression Setting January 6, 2014
Biost 518 / 515 Applied Biostatistics II WIN 2014 75
75
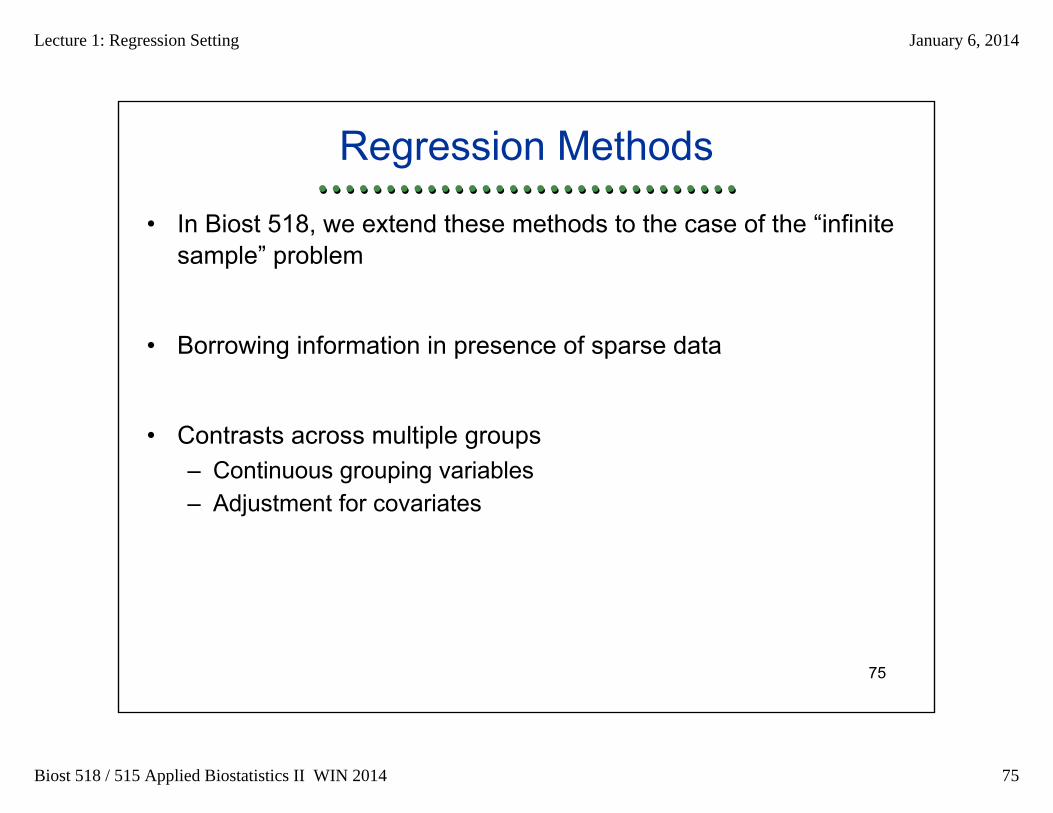
Regression Methods
• In Biost 518, we extend these methods to the case of the “infinite sample” problem
• Borrowing information in presence of sparse data
• Contrasts across multiple groups– Continuous grouping variables– Adjustment for covariates
Lecture 1: Regression Setting January 6, 2014
Biost 518 / 515 Applied Biostatistics II WIN 2014 76
76
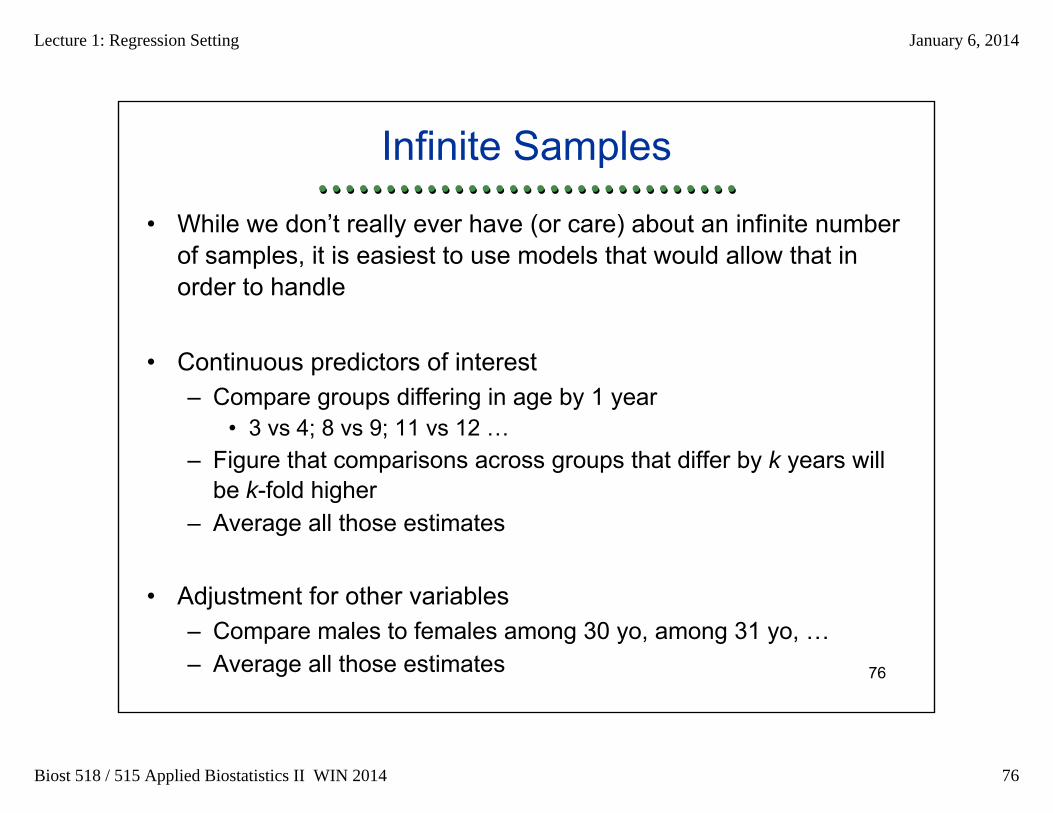
Infinite Samples
• While we don’t really ever have (or care) about an infinite number of samples, it is easiest to use models that would allow that inorder to handle
• Continuous predictors of interest– Compare groups differing in age by 1 year
• 3 vs 4; 8 vs 9; 11 vs 12 …– Figure that comparisons across groups that differ by k years will
be k-fold higher– Average all those estimates
• Adjustment for other variables– Compare males to females among 30 yo, among 31 yo, …– Average all those estimates
Lecture 1: Regression Setting January 6, 2014
Biost 518 / 515 Applied Biostatistics II WIN 2014 77
77
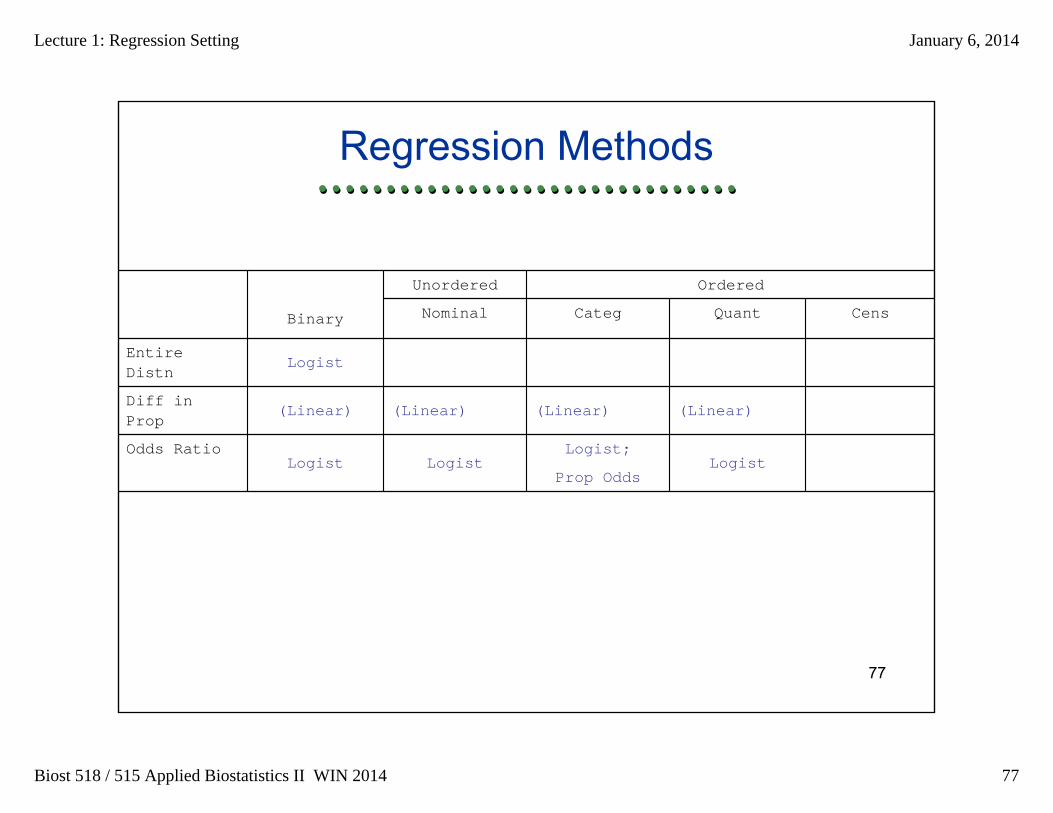
Logist
LogistLogist;
Prop OddsLogistLogist
Odds Ratio
(Linear)(Linear)(Linear)(Linear)Diff in Prop
Entire Distn
CensQuantCategNominalBinary
OrderedUnordered
Regression Methods
Lecture 1: Regression Setting January 6, 2014
Biost 518 / 515 Applied Biostatistics II WIN 2014 78
78
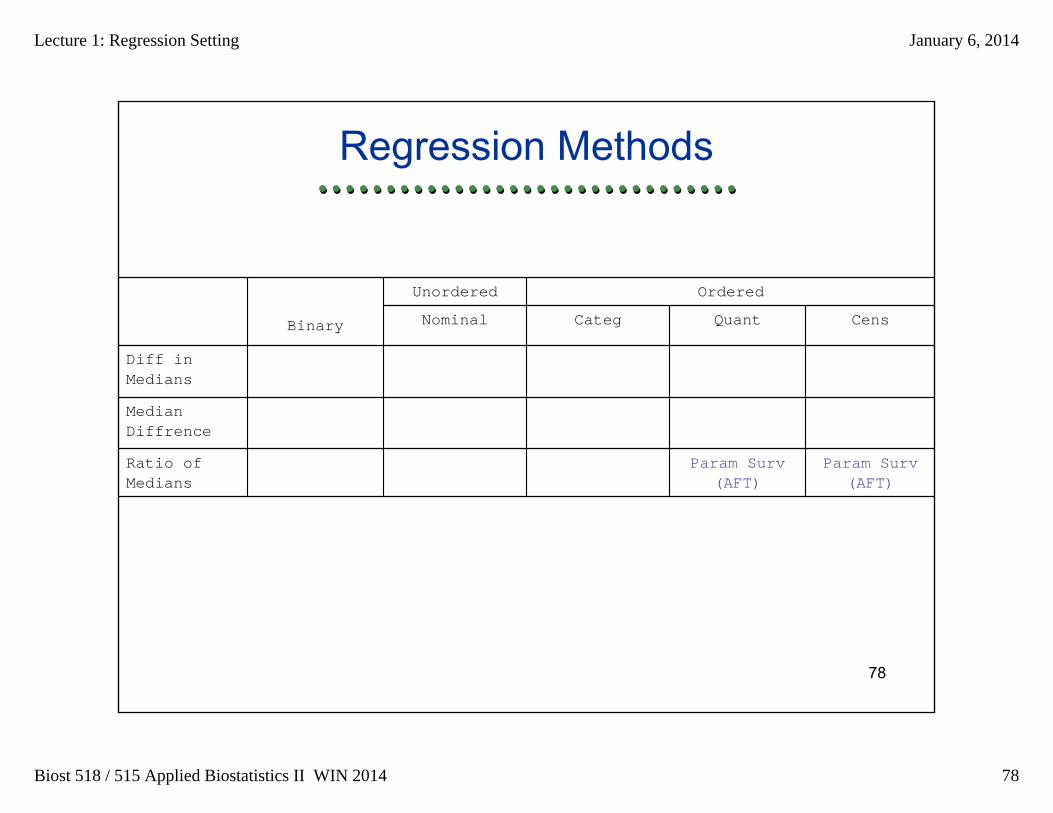
Param Surv(AFT)
Param Surv(AFT)
Ratio of Medians
Median Diffrence
Diff in Medians
CensQuantCategNominalBinary
OrderedUnordered
Regression Methods
Lecture 1: Regression Setting January 6, 2014
Biost 518 / 515 Applied Biostatistics II WIN 2014 79
79
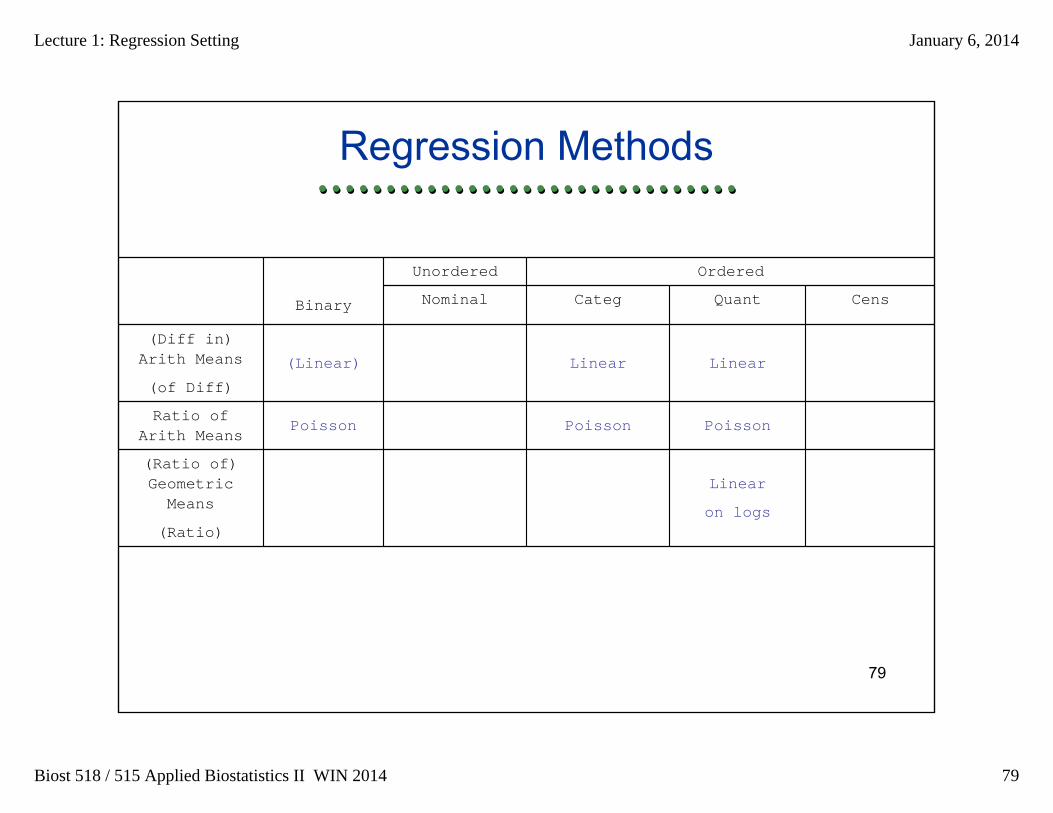
PoissonPoissonPoissonRatio of
Arith Means
Linear
on logs
(Ratio of) Geometric Means
(Ratio)
LinearLinear(Linear)
(Diff in) Arith Means
(of Diff)
CensQuantCategNominalBinary
OrderedUnordered
Regression Methods
Lecture 1: Regression Setting January 6, 2014
Biost 518 / 515 Applied Biostatistics II WIN 2014 80
80
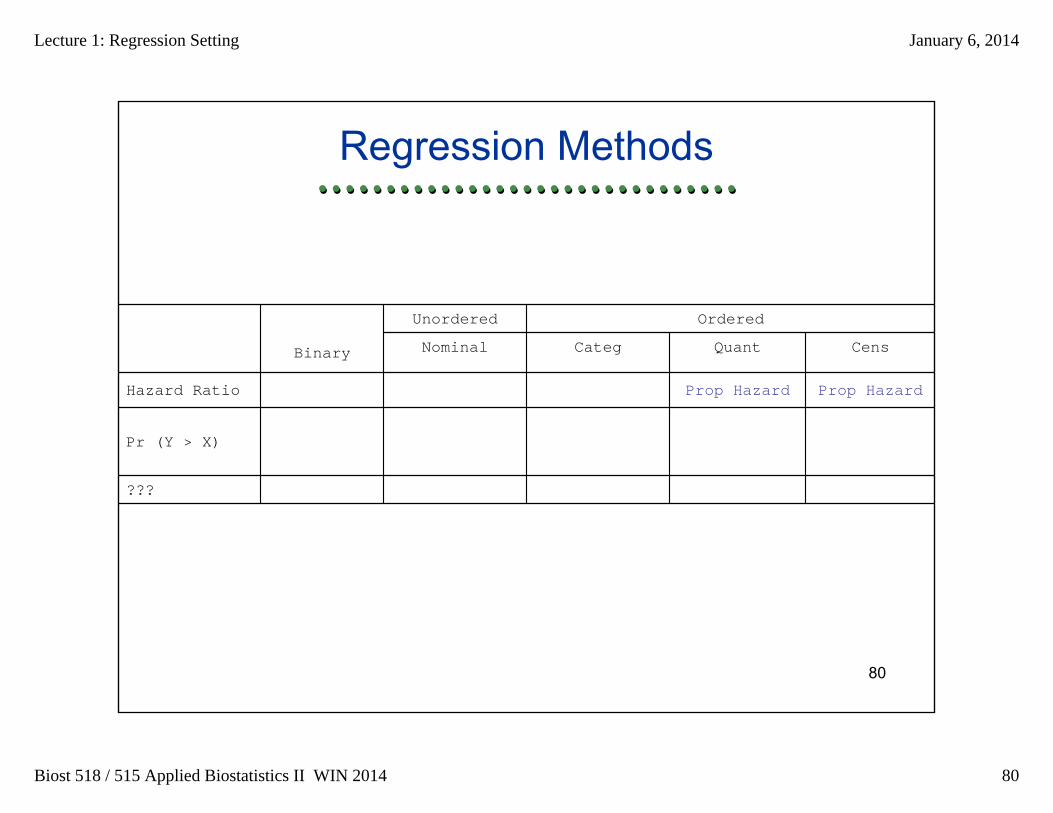
???
Pr (Y > X)
Prop HazardProp HazardHazard Ratio
CensQuantCategNominalBinary
OrderedUnordered
Regression Methods
Lecture 1: Regression Setting January 6, 2014
Biost 518 / 515 Applied Biostatistics II WIN 2014 81
81
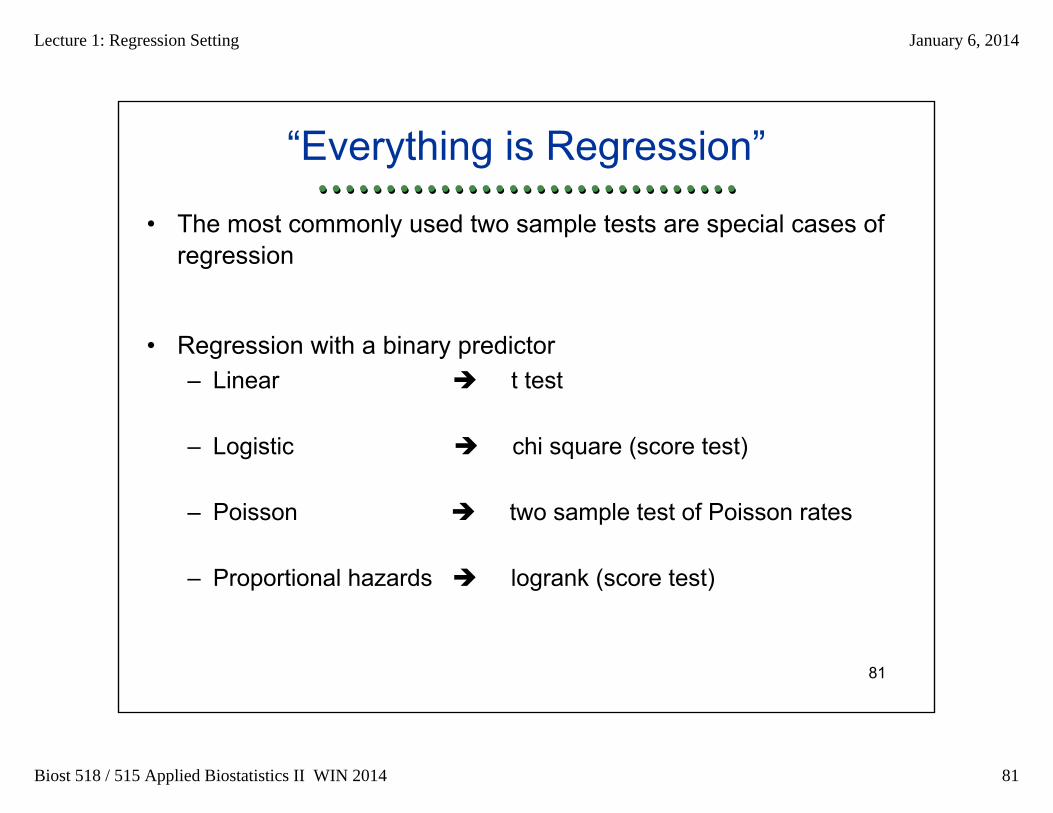
“Everything is Regression”
• The most commonly used two sample tests are special cases of regression
• Regression with a binary predictor– Linear t test
– Logistic chi square (score test)
– Poisson two sample test of Poisson rates
– Proportional hazards logrank (score test)