Embed Size (px)
Citation preview

Biostatistics Case Studies 2014Session 6
An Overview of Missing Data
Youngju Pak
Biostatistician
http://research.labiomed.org/biostat

Goals for this talk
Familiarize with conceptual and analytical issues on missing data
Raise the awareness of issues relevant to statistical inference when some data is missing
Introduce general methods to prevent and treat missing data, including multiple imputation.

Contents
When and why data are missing Consequences Prevention strategies when design studies Classification Diagnosis Statistical methods Final remarks

What is missing data?
The term missing data means that we are missing some type of information about the phenomena in which we are interested.
Usually leave blank cells in data sets.
Should be distinguished from “Not Applicable”.

The prevalence of missing data.
Among 3 years of publications (about 300) within a prominent psychological journal, about 90% of the articles had missing data.
Average amount of missing data is above 30%. (Source: McKinght, PE et al. 2007, p.3)

When do we miss the data in the research process?
Participant recruitment Survey non-response
Randomization & Implementation of the treatment Preference toward a particular group Refuse to participate in the study after their assignment of the
group. Data collection & Maintenance
Subject drop out in longitudinal studies Biological samples get contaminated
Data entry Data analysis and reporting

Some consequences of missing data
Reliability of measurements with multiple items # of item ↓ → inaccuracy of the variance and covariance of items ↑
Validity of study results (Sample selection) Difference in characteristics
between participants and non-participants → Selection bias → Unrepresentative sample
(Randomization) Data missing differentially → Initial nonequivalence (Data analysis) Sample size ↓ → Power ↓
Generalizability of results Any or all of the above → difficulty with statistical inference and
interpretation of findings → inaccurate knowledge base → Misinformed and possibly misleading policy recommendations

“The best solution to handlemissing data is to have NONE”. R.A. Fisher

How to Prevent missing data?
Overall study design Characteristics of the target population and
the sample Data collection and measurement Treatment implementation Data entry
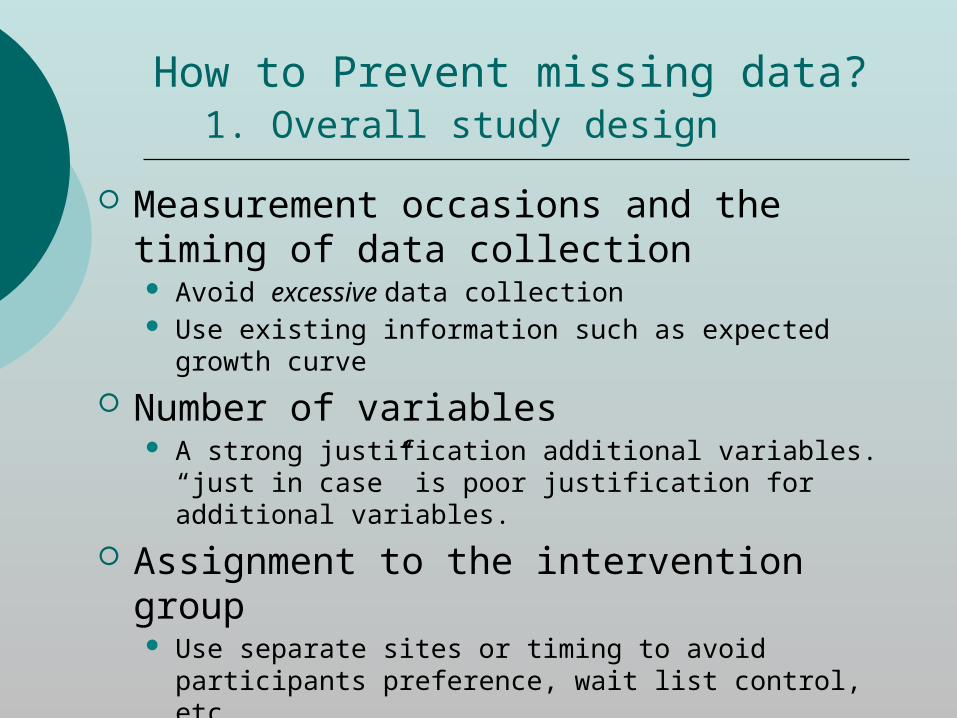
How to Prevent missing data? 1. Overall study design
Measurement occasions and the timing of data collection Avoid excessive data collection Use existing information such as expected growth curve
Number of variables A strong justification additional variables. “just in case” is poor
justification for additional variables.
Assignment to the intervention group Use separate sites or timing to avoid participants preference, wait
list control, etc. Increase incentives as the study progress to avoid the drop out
due to improvement or adverse results.

How to Prevent missing data? 1. Overall study design cont.
Attrition and retention strategy Differences between participants with complete data
and participant with missing data can introduce bias in parameter estimates
Multiple retention strategies Detailed record Creating a project identity Developing a screening measures to identify
individuals with high risk of drop out Training and monitoring of research staffs, etc

How to Prevent missing data? 2. Characteristics of the target population
Some strategies In a survey, use appropriate words for the target
population. e.g., use “did not finish” instead of “dropped out” for a group of native Americans
Translate questionnaires into the dominant language or face to face interview with low English proficiency.
Provide the breaks during the interview for seniors Assure the confidentiality for the sensitive topics
(Singer 1995)

How to Prevent missing data? 3. Data collection and measurement
Physiological indices e.g., blood samples-equipment error To prevent
Firm protocols Random check Develop solution prior to data collection
Observation of the behavior e.g., Facial expressions To Prevent
Close enough distance Multiple observers.
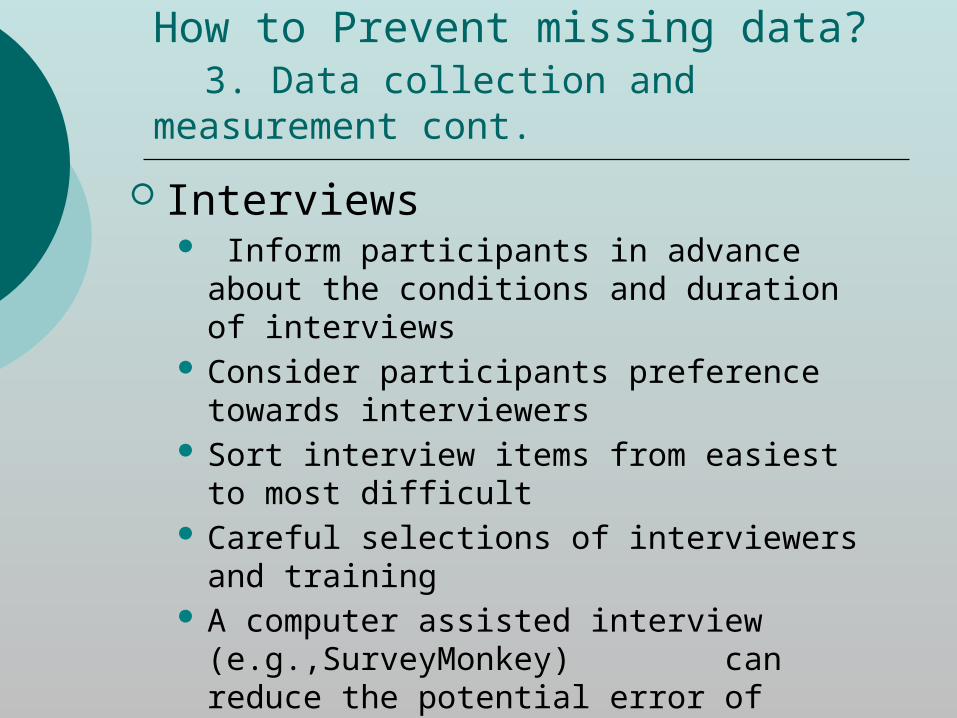
How to Prevent missing data? 3. Data collection and measurement cont.
Interviews Inform participants in advance about the
conditions and duration of interviews Consider participants preference towards
interviewers Sort interview items from easiest to most difficult Careful selections of interviewers and training A computer assisted interview (e.g.,SurveyMonkey)
can reduce the potential error of missing data

How to Prevent missing data? 4.Treatment implementation & Data entry
Reduce the treatment burden e.g., multiple sessions with short intervals might be more burden some than long-term intervention with less frequency
Improve treatment administration Consider the characteristic of providers
e.g., if providers are viewed as unskilled or unfriendly, participants are more likely to drop out
Avoid circumstances that subjects do not like such as a parking lot that is far from the study site
Data entry Double entry or random cross checking

How to Prevent missing data? -Summary Most have to do with reducing the burden of
participants in studies. Feasibility must also taken into consideration along
with the costs and benefits, when selection prevention strategies. e.g., shorter questionnaires → less missing → the breadth or depth of knowledge ↓
Should design interventions to facilitate adherence and to prevent attrition.
More details can be found in McKnight, et al. 2007, Chapter 4)

Missing Data Classification How to best carry out statistical
inference in the presence of missing data depends on the missing data “mechanism”.
The most widely used missing data classification system was introduced by Rubin, Donald (1976)
Three distinct missing data type based on missing data mechanism
1. Missing Completely At Random (MCAR) 2. Missing At Random (MAR) 3. Not Missing At Random (NMAR)

Missing data classification 1. Rubin’s categories of missing data
(Source: McKnight, et al. 2007)

Rubin’s categories of missing data- An example
Suppose interest centers on determining if the following factors effect plasma of beta-carotene Age Gender Current smoking status BMI Alcohol use (average # of drinks/week) Dietary beta-carotene as a covariate (mcg/day)
(Source: StatLib data, Dept of Statistics, Carnegie Mellon University)

Rubin’s categories of missing data- An example cont.
Possibly MCAR Some plasma carotene levels are missing
e.g., Some blood samples lost in transport Some dietary carotene missing
e.g., Subjects recruited on a day when the dietician doing the diet-inventory interview calls in sick
Some items missing “here and there” due to erratic scanning of data collection forms
Graduate students have not slept very well the night before the work day

Rubin’s categories of missing data- An example cont.
Possibly MAR Missing demographics
Perhaps females tend to omit reporting weight & age Missing dietary beta-carotene
Overweight individuals tend to refuse the beta-carotene dietary-inventory.
Clearly not MCAR May be MAR as missing is related to other available
variable

Rubin’s categories of missing data- An example cont.
Possibly MNAR Heavy drinkers tend not to respond to drinks per
week questions Smokers reluctant to admit such Elderly subjects skip demographic items, such as
age, due to poor design of data collection forms Any variable that the probability of an variable
being missing is related to the value of that item

Missing data classification 2. Dimension of Missing Data
Missing on the variable (item nonresponses) Missing on the occasions (wave nonresponses) Missing on the individual (unit nonresponses)
Individuals
Variables/Items
Occasions
Cattell’s data box (1966)

Missing data classification 3.Mechanism or Dimension?
Less missing data (m.d) is better, in general A large proportion of MCAR might be better
than smaller amount of MAR or MNAR, for parameter estimation. Nonetheless, statistical power will be lower
The amount of m.d, in combination with the reason, dimension, and mechanism should be considered in diagnosis and treatments of m.d

Diagnostic procedure Diagnosis plays important role in selecting the
appropriate missing data techniques as well as interpretation of study findings (inferential limitation)
MCAR diagnostics Two sample t-test
Not effective for multivariate data Little’s MCAR test (1988)
A type of chi-square test A significant p-value means data is not MCAR. Available in SPSS
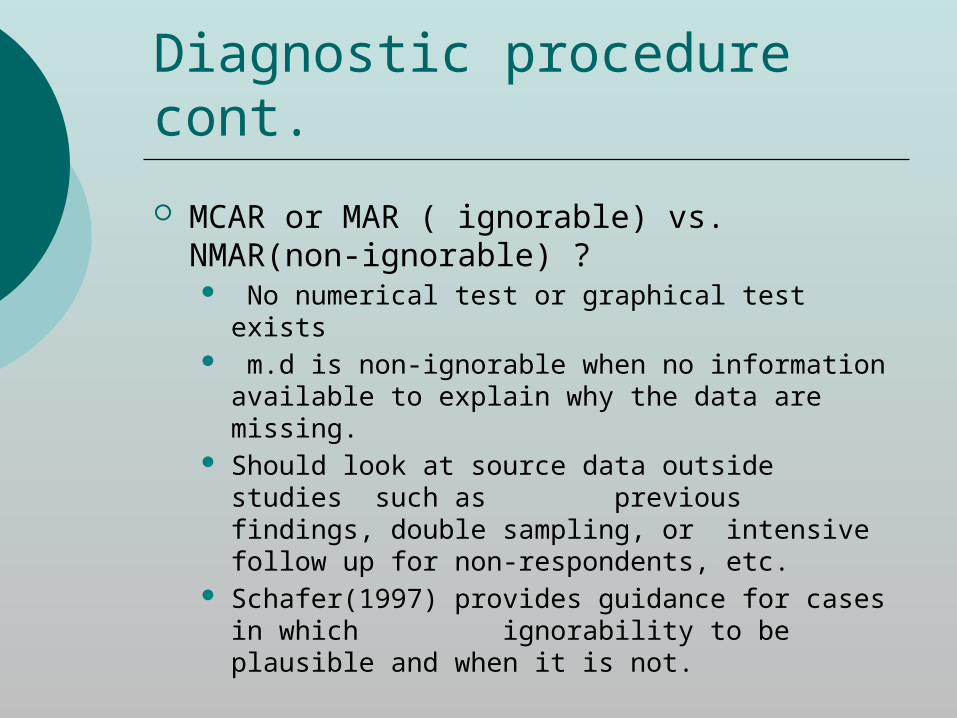
Diagnostic procedure cont.
MCAR or MAR ( ignorable) vs. NMAR(non-ignorable) ? No numerical test or graphical test exists m.d is non-ignorable when no information available to
explain why the data are missing. Should look at source data outside studies such as
previous findings, double sampling, or intensive follow up for non-respondents, etc.
Schafer(1997) provides guidance for cases in which ignorability to be plausible and when it is not.
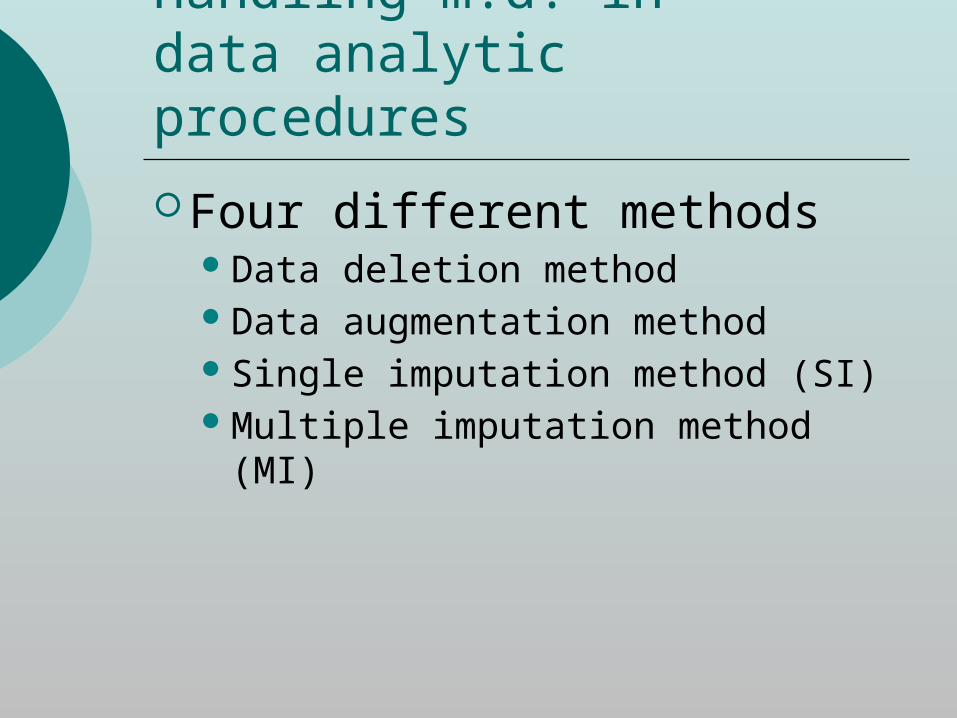
Handling m.d. in data analytic procedures
Four different methodsData deletion methodData augmentation methodSingle imputation method (SI)Multiple imputation method (MI)

Handling m.d. in data analytic procedures cont. - Data deletion method
Complete case method (listwise deletion) Discard observations with any missing value & only include
complete cases Easy to implement If MCAR, parameter estimates are unbiased Can reduce the power substantially
Available case method (pairwise deletion) Discard data only at the level of the variable Can preserve larger portion of the sample If MCAR, parameter estimates are unbiased Results in different sample size per variables such as
correlations → stability ↓

Handling m.d. in data analytic procedures cont. 2. Data Augmentation
Avoid many of the inherent problems of deletion methods.
Does not explicitly replace missing values. Instead, an algorithm is invoked that takes into account the observed data, the missing data, the relationship among observed data, and some underlying statistical assumptions when estimating parameters.
Maximum likelihood (ML) , Expectation and Maximization (EM), Markov Chain Monte Carlo (MCMC), dummy variable method, and weighting method.
Note: SPSS has default program for listwise, pairwise, EM and regression methods for estimation ( Analyze Missing Value Analysis )

Handling m.d. in data analytic procedures cont. 3. Single Imputation (SI)
Replace a missing value with a single value Replace with - Constant: zero, mean , median
- Randomo Hot deck : Randomly selecting a value from the observed data o Cold deck : Use another data set to replace missing values
- Nonrandom o Last Observation Carried Forward (LOCF)o Next Observation Carried Backward (NOCB)o Regression predictions

Handling m.d. in data analytic procedures cont. 3. Single Imputation (SI) cont.
SI generally OK with a small amount ( < 5%) of m.d. SI tend to underestimate standard errors, increasing
type I error Ignores the uncertainty in imputed values Performance may depend on variability of items with missing
value SI tend to perform poorly even the missing data
mechanism is ignorable. MI are considered to be superior alternative, particularly
MAR case.

Handling m.d. in data analytic procedures Cont. 4. Multiple Imputation (MI).
MI replace each missing value with a set of plausible values that are drawn from a assumed distribution.
Multiple imputations (from 3 to 10 times), repeat analysis with complete data, aggregate results from the analyses.
Pros Provide sound parameter estimates Most highly praised methods for statistically handling missing data
(Allison 2002, Rubin 1996, Schafer & Graham 2002) Cons
Require substantial sample size Optimal choice of technique is often unclear May be difficult for less experience researchers due to the specification
of the distribution along with assumptions. Sensitivity analysis recommended

Handling m.d. in data analytic procedures Cont. 4. Multiple Imputation (MI) cont.
Plasma Beta-Carotene Example Dependent variable: Natural log of plasma beta-carotene concentration Independent variables: age, gender, current smoking status, BMI, alcohol use, dietary beta carotene
(logged) Complete data N=314 Second data set with data MAR
N=216 complete data cases Regression Analysis
Complete Data Listwise deletion Multiple Imputation
# of imputation (M): 10 times

Handling m.d. in data analytic procedures Cont. 4. Multiple Imputation (MI) cont.
Complete Data (N = 315)
ParameterParameterEstimate
StandardError
t Value Prob t
Intercept4.01 0.516 7.78 <.0001
Age0.007 0.0028 2.41 0.016
Female0.356 0.1236 2.90 0.004
CurSmoker-0.348 0.116 -3.01 0.003
BMI-0.037 0.007 -5.70 <.0001
Alcohol-0.005 0.008 -0.65 0.517
LBeta_Diet0.178 0.059 3.00 0.003
Listwise deletion(N = 216)
Parameter
Parameter
Estimate
Standard
Error
t Valu
e Prob t
Intercept3.69 0.602 6.12 <.000
1
Age0.009 0.003 2.62 0.009
Female0.394 0.138 2.85 0.004
8
CurSmoker-0.134 0.153 -
0.870.383
BMI-0.034 0.007 -
4.71<.000
1
Alcohol-0.012 0.009 -
1.190.234
LBeta_Diet0.190 0.071 2.68 0.008
Plasma Beta-Carotene Example cont.

Handling m.d. in data analytic procedures Cont. 4. Multiple Imputation (MI) cont.
Complete Data Results
Parameter
Parameter
Estimate
Standard
Errort
Value Prob t
Intercept4.01 0.516 7.78 <.0001
Age0.007 0.0028 2.41 0.016
Female0.356 0.1236 2.90 0.004
CurSmoker-0.348 0.116 -3.01 0.003
BMI-0.037 0.007 -5.70 <.0001
Alcohol-0.005 0.008 -0.65 0.517
LBeta_Diet0.178 0.059 3.00 0.003
Multiply Imputed Analysis (M = 10)
Estimate
Standard
Error Min Max
t Valu
e Prob t
3.878 0.528 3.682 4.019 7.34 <.0001
0.007 0.003 0.006 0.008 2.35 0.019
0.354 0.123 0.332 0.376 2.88 0.004
-0.312 0.122 -0.342 -0.285 -2.56 0.010
-0.037 0.007 -0.041 -0.034 -5.60 <.0001
-0.005 0.008 -0.008 -0.001 -0.62 0.536
0.197 0.062 0.178 0.224 3.19 0.0014
Plasma Beta-Carotene Example cont

Recommend readings for MI
UW-Madison Social Science computing cooperative
http://www.ssc.wisc.edu/sscc/pubs/stata_mi_readings.htm
UCLA : Institute for Digital Research and Education http://www.ats.ucla.edu/stat/stata/seminars/missing_data/mi_in_stata_pt1.htm
Final Remarks
No recipe for the single best approach ! An optimal solution for a particular analysis
requires consideration of: Dimensions of missing data The missing data mechanism Reasons for missing data Data types of variables that are missing Objectives of studies

Final Remarks cont.
Try to minimize missing data when design studies
Nonetheless, some data can be missing. When data are missing, investigate the reason,
dimension, and mechanism to choose the appropriate treatment.
Deletion methods are sometimes OK (e.g., MCAR with the amount of missing < 5%) but often are suboptimal (e.g., MAR with amount of missing > 5%).

Final Remarks cont.
Multiple imputation is known to perform well in many cases.
Distributional assumptions along with data types are key component for MI, thus might hard to implement for less experienced researchers.
Recommend to seek professional help when you consider complicated methods such as multiple imputation.
Reference McKinght, PE, et al.(2007) Missing Data: A Gentle Introduction.
The Guilford Press, NY. Allison, PD (2002). Missing Data. Thousand Oaks, CA:Sage Little, RL & Rubin, DB. (2002). Statistical analysis with missing
data, 2nd. New York: Wiley. Rubin, DB (1976). Inference and missing data. Biometrika, 63,
581-592. Rubin, DB (1987). Multiple imputation for nonresponse in
surveys. New York: Wiley. Schafer, JL. (1997). Analysis of Incomplete Multivariate Data.
London: Chapman & Hall. White, Royston & Woods(2011). Multiple imputation using
chained equations: Issues and guidance for practice, Statistics in Medicine
Van Buuren (2007). Multiple imputations of discrete and continuous data by fully conditional specification, Statistics in Medical Research


![Borko Jovanovic, MS, PhD Biostatistician [email protected]](https://img.pdfslide.net/doc/110x75/61fb98b72e268c58cd600e97/borko-jovanovic-ms-phd-biostatistician-emailprotected.jpg)


