Embed Size (px)
Citation preview
STUDY REPORT FOR THE SUMMER 2004 BIOTURBATION
MEASUREMENT PROGRAM ON THE PALOS VERDES SHELF
July 2005
Prepared for:
U.S. Army Corps of Engineers Los Angeles District
915 Wilshire Boulevard Los Angeles, CA 90017
U.S. Environmental Protection Agency Region IX
Superfund Division (SFD-7-1) 75 Hawthorne Street
San Francisco, CA 94105
Prepared by:
Science Applications International Corporation 10260 Campus Point Drive
San Diego, CA 92121
SAIC Report Number 679
Study Report for the Summer 2004 Bioturbation Measurement Program
Conducted on the Palos Verdes Shelf
Prepared for:
U.S. Army Corps of Engineers Los Angeles District
915 Wilshire Boulevard Los Angeles, CA 90017
July 2005
Prepared by
Science Applications Interna10260 Campus Poi
San Diego, CA 9
SAIC Report Num
U.S. Environmental Protection AgencyRegion IX
Superfund Division (SFD-7-1) 75 Hawthorne Street
San Francisco, CA 94105
:
tional Corporation nt Drive 2121
ber 679
TABLE OF CONTENTS
LIST OF FIGURES .....................................................................................................................................iiiLIST OF TABLES........................................................................................................................................ vLIST OF APPENDICES..............................................................................................................................vi1.0 INTRODUCTION ........................................................................................................................... 12.0 METHODS ...................................................................................................................................... 6
2.1 BIO DATA.................................................................................................................................... 62.2 SEDIMENT MIXING/BIOTURBATION RATES............................................................................... 102.3 OTHER DATA SOURCES ............................................................................................................. 14
2.3.1 SPI and Plan-View Data........................................................................................................ 142.3.2 LACSD Data ......................................................................................................................... 162.3.3 Bioturbation Literature Search .............................................................................................. 16
3.0 RESULTS ...................................................................................................................................... 173.1 LARGE BIO ................................................................................................................................ 17
3.1.1 Community Overview........................................................................................................... 173.1.2 Key Species........................................................................................................................... 30
3.2 SPI AND PLAN-VIEW ................................................................................................................. 303.3 SEDIMENT MIXING AND BIOTURBATION RATES ....................................................................... 403.4 LACSD INFAUNAL DATA.......................................................................................................... 453.5 BIOTURBATION LITERATURE SEARCH....................................................................................... 45
4.0 DISCUSSION................................................................................................................................ 484.1 BIOLOGICAL COMMUNITY PATTERNS ....................................................................................... 514.2 SEDIMENT MIXING AND BIOTURBATION RATES ....................................................................... 55
5.0 SUMMARY AND CONCLUSIONS ............................................................................................ 57REFERENCES ........................................................................................................................................... 59
Final Study Report for the Summer 2004 Bioturbation Measurement Program Conducted on the Palos Verdes Shelf
ii
LIST OF FIGURES
Figure 1.1-1. General Study Area Location.
Figure 2.1-1. Station Locations for BIO, Vertical Mixing Rates/Bioturbation, SPI/Plan-View Photographs, and LACSD Data Collections on the Palos Verdes Shelf.
Figure 3.1-1. Mean Number of BIO Taxa by Core Depth Interval, July/August 2004.
Figure 3.1-2. Mean Abundance of BIO by Core Depth Interval, July/August 2004.
Figure 3.1-3. Mean Biomass (g) of BIO by Core Depth Interval, July/August 2004.
Figure 3.1-4. Relationship Between Mean Abundance and Biomass (g) of BIO by Station and Core Depth Interval, July/August 2004.
Figure 3.1-5. Mean Abundance (“head” count) of the Ghost Shrimp, Neotrypaea, by Core Depth Interval, July/August 2004.
Figure 3.1-6. Mean Abundance (“head” count) of the Polychaete, Marphysa, by Core Depth Interval, July/August 2004.
Figure 3.1-7. Mean Biomass (g; all specimens combined) of the Ghost Shrimp, Neotrypaea, by Core Depth Interval, July/August 2004.
Figure 3.1-8. Mean Biomass (g; all specimens combined) of the Polychaete, Marphysa, by Core Depth Interval, July/August 2004.
Figure 3.1-9. Mean Abundance versus Mean Biomass (g) of the Ghost Shrimp, Neotrypaea, by Core Depth Interval, July/August 2004.
Figure 3.1-10. Mean Abundance versus Mean Biomass (g) of the Polychaete, Marphysa, by Core Depth Interval, July/August 2004.
Figure 3.1-11. Mean Abundance versus Mean Total Length (mm; all specimens combined) of the Ghost Shrimp, Neotrypaea, by Core Depth Interval, July/August 2004.
Figure 3.1-12. Mean Abundance versus Mean Total Length (mm; all specimens combined) of the Polychaete, Marphysa, by Core Depth Interval, July/August 2004.
Figure 3.3-1. Excess Lead-210 (dpm/g) Versus Core Depth (cm) at Four Stations on the Palos Verdes Shelf.
Figure 3.3-2. Biodiffusivity Values and Sedimentation Rates, 2004.
Figure 3.3-3. Profiles of Excess Thorium-234 Versus Depth for Replicate Stations in the Northern Portion of the Study Area.
Figure 3.4-1. Total Infaunal Abundance by LACSD Station, per 0.1 m2 Core, Summer 2003.
Final Study Report for the Summer 2004 Bioturbation Measurement Program Conducted on the Palos Verdes Shelf
iii
Figure 3.4-2. Total Infaunal Biomass (g) by LACSD Station, per 0.1 m2 Core, Summer 2003.
Figure 4.1-1. Box and Whisker Plot Summary of Number of Taxa (top), Abundance (middle), and Biomass (bottom) by Interval, Standardized to 0.1m2.
Final Study Report for the Summer 2004 Bioturbation Measurement Program Conducted on the Palos Verdes Shelf
iv
LIST OF TABLES
Table 1.1-1. DQO Process for the Bioturbation Assessment.
Table 2.1-1. Site Coordinates (UTM Zone 11N), Core Lengths, and Core Collection Dates from BIO Surveys, July/August 2004.
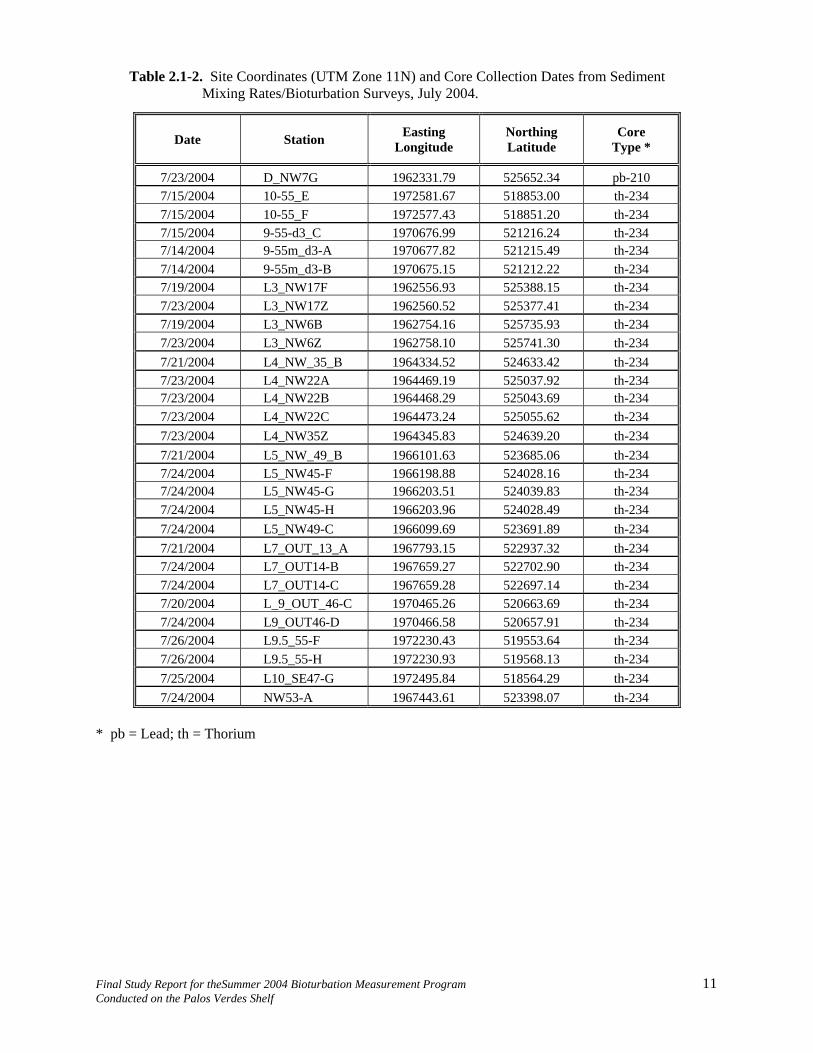
Table 2.1-2. Site Coordinates (UTM Zone 11N) and Core Collection Dates from Sediment Mixing Rates/Bioturbation Surveys, July 2004.
Table 2.1-3. Site Coordinates (UTM Zone 11N) and Collection Dates from SPI/Plan-View Surveys, July 2004.
Table 3.1-1. BIO Taxa by Phylum, July/August 2004.
Table 3.1-2. Mean Number of Taxa by Station, Core Depth Interval, and Taxonomic Group, July/August 2004.
Table 3.1-3. Mean Abundance by Station, Core Depth Interval, and Taxonomic Group, July/August 2004.
Table 3.1-4. Mean Biomass (g) by Station, Core Depth Interval, and Taxonomic Group, July/August 2004.
Table 4.1-1. Study Objectives and Approach for Box Coring and Infaunal Analyses.
Table 4.1-2. Study Objectives and Approach for Sediment Dating Analyses.
Final Study Report for the Summer 2004 Bioturbation Measurement Program Conducted on the Palos Verdes Shelf
v
LIST OF APPENDICES
Appendix A. Results Summary from Bioturbating Infaunal Organisms (BIO) Survey at Palos Verdes Shelf Stations, July/August 2004.
Table A-1. Summary of BIO Data, July/August 2004.
Table A-2. Summary of Bioturbation Literature Search Results.
Appendix B. Results Summary and Photographs from Sediment-Profile Imagery (SPI) and Plan-View Camera Survey at Palos Verdes Shelf Stations, July 2004.
Figure B-1. Photographs from Sediment-Profile Imagery (SPI) and Plan-View Camera, July 2004.
Table B-1. Summary of SPI Results, July 2004.
Table B-2. Plan-View Results, July 2004.
Appendix C. Results Summary from Sediment Mixing Rates/Bioturbation Potential Survey at Palos Verdes Shelf Stations, July 2004.
Table C-1. Total and Excess Pb-210 Results from Sediment Cores.
Table C-2. Total and Excess Th-234 Data from Detailed Stations.
Table C-3. Th-234 data from Comparison Stations, with the Resultant Calculated Biodiffusivities (Db, cm2/yr).
Final Study Report for the Summer 2004 Bioturbation Measurement Program Conducted on the Palos Verdes Shelf
vi
1.0 INTRODUCTION
Overview
The U.S. Environmental Protection Agency (EPA) and U.S. Army Corps of Engineers (USACE) approved an Investigation Work Plan (IWP) in July 2004 (SAIC 2004a) that detailed a field investigation and analyses to characterize large bioturbating infaunal organisms (BIO) and evaluate sediment mixing/ bioturbation rates on the Palos Verdes (PV) Shelf (Task 4). The IWP was developed to address questions pertaining to potential effects of bioturbation on cap integrity that were deemed high priority for the Remedial Investigation/Feasibility Study (RI/FS). Answers to these questions will benefit both the feasibility study and the engineering design of a cap intended to isolate contaminated sediments across broad areas of the PV Shelf, if capping is selected by EPA as the solution for this Superfund site. The information presented in the IWP is consistent with the preliminary technical approach for the 2004 multidisciplinary survey program, as described in the Preliminary Sampling Plan (PSP; SAIC 2004a).
The key question for this study element, as identified in the Data Quality Objectives (DQO) matrix table for the PV Shelf RI/FS, is:
Question FS-7: Will a cap be recontaminated by Effluent-Affected (EA) sediment from uncapped areas (deep regions)? From beneath the cap, due to bioturbators?
A task-level restatement of this question is: Do deep-burrowing bioturbators occur in substantial numbersand sizes/weights to contribute substantially to mixing and disturbance of sediments within the potential capping area on the PV Shelf?
In order to address this question concerning the effects of bioturbators, a baseline field study wasconducted in two phases in July and August 2004. Sediment cores were collected for evaluation of BIO and sediment mixing/bioturbation rates. Specifically, triplicate samples were targeted at 19 coring stations for large BIO, and twelve and four dating stations for thorium-234 and lead-210, respectively.
This study report, prepared by Science Applications International Corporation (SAIC) and Oregon State University (OSU), describes the study background; methods; results; discussion, including fulfillment of DQOs; and summary and conclusions for the investigation.
Background
EPA is evaluating alternatives for remediation of effluent-affected (EA) sediments on the PV Shelf off the coast of Los Angeles, CA. One remediation alternative under consideration is in-situ capping, whichinvolves placement of a cap of clean material over the EA sediment, thereby isolating the contaminated material. EPA is collaborating with the USACE to conduct field studies related to the evaluation of capping and other alternatives.
EPA conducted a pilot capping project in 2000 to demonstrate whether a cap could be placed on the PVShelf in accordance with a design described by Palermo (2000). This project was primarily an engineering test to assess cap-placement feasibility using a variety of material types and placementtechniques at sites that have different water depths and bottom slopes. Independent of the informationthat resulted from this pilot capping study, other questions that were not addressed as part of thedemonstration study concerned the feasibility and effectiveness of capping on the shelf.
Final Study Report for the Summer 2004 Bioturbation Measurement Program Conducted on the Palos Verdes Shelf
1
A USACE (1999) study on “Options for In Situ Capping of Palos Verdes Shelf Contaminated Sediments” concluded: “a cap thickness component for bioturbation of 30 cm should accommodate most concerns related to bioturbation effects on cap integrity for areas selected for isolation by the cap.” This conclusion was based in large part on “extensive monitoring of benthos in the PV Shelf area by the Los AngelesCounty Sanitation Districts (LACSD)” and recommendations by benthic ecologists familiar with the program and environmental conditions off Palos Verdes. Subsequently, however, data from a March2002 survey of the Palos Verdes pilot cap showed the existence of a surface contamination layer that may have been due in part to bioturbation (SAIC 2003).
Disturbance by large BIO may represent an important but poorly understood mechanism for mixing EAsediments into the cap layer. Existing data on the occurrence and abundance of large BIO, such as those collected historically by LACSD using Van Veen grabs, was inadequate to characterize the abundance of these species because LACSD sampling focuses on relatively shallow sediment depths (such as 15-20 cm,depending on Van Veen penetration at various stations) and data analysis focuses on benthic community characteristics. While these data provide important information on sites with relatively higher biologicalactivity (e.g., associated with higher abundance and biomass) and the occurrence of species that representBIO, the data do not permit evaluation of biological activity at deeper vertical depths, including abundance of BIO that may represent a particular consideration for capping effectiveness.
During technical meetings in 2004 of the EPA-sponsored, interagency PV Shelf project team, it was determined that additional field measurements, data analyses, and modeling efforts were needed to support EPA’s ongoing review and interpretation of the results from the Pilot Cap Monitoring Program, as well as to provide key input during preparation of the RI/FS. A key objective was to investigate whether a cap could be recontaminated by EA sediment from uncapped areas, such as by resuspension and transport, or from beneath the cap, such as due to BIO. A consideration related to potential effects from BIO was whether they occur in substantial-enough numbers and sizes/weights to contribute substantially to mixing and disturbance of sediments within the potential capping area. DQOs to focusthese efforts were developed and technical experts assembled in discipline-specific meetings to prioritize significant data gaps. As a result of these planning activities, the following studies were identified as high-priority:
• Oceanographic Measurements Program: Physical oceanographic measurements on the PV Shelf and Upper Slope to assess sediment resuspension and transport;
• Geotechnical Survey: Field measurements to assess spatial variations in geotechnical propertiesof sediments (primarily at the surface) on the PV Shelf;
• Bioturbation Assessment: Field measurements to determine the density, size, and biomass (weight) of large burrowing organisms capable of mixing and redistributing cap material and EA sediments on the PV Shelf, and collections of sediment cores to evaluate sediment mixing rates and bioturbation; and
• Sediment Resuspension Investigation: Field measurements on the existing pilot cap to assess the degree of EA-material resuspension that occurred during cap placement operations.
The subject of this study report, bioturbation assessment, was addressed by July and August 2004 field surveys and subsequent analyses of large BIO and sediment mixing /bioturbation rates in the PV Shelfregion (Section 2). The DQO process that guided the bioturbation assessment, as specified in the IWP, is presented in Table 1.1-1.
Final Study Report for the Summer 2004 Bioturbation Measurement Program Conducted on the Palos Verdes Shelf
2
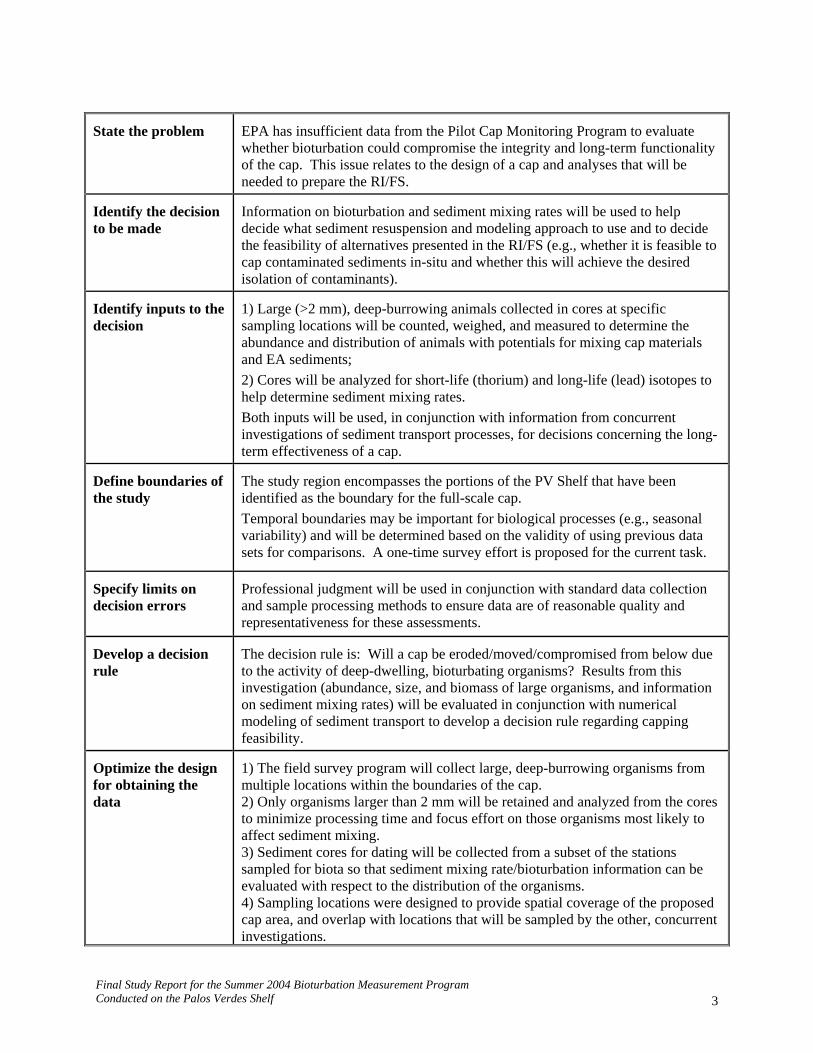
State the problem EPA has insufficient data from the Pilot Cap Monitoring Program to evaluate whether bioturbation could compromise the integrity and long-term functionalityof the cap. This issue relates to the design of a cap and analyses that will be needed to prepare the RI/FS.
Identify the decision to be made
Information on bioturbation and sediment mixing rates will be used to help decide what sediment resuspension and modeling approach to use and to decide the feasibility of alternatives presented in the RI/FS (e.g., whether it is feasible to cap contaminated sediments in-situ and whether this will achieve the desired isolation of contaminants).
Identify inputs to the decision
1) Large (>2 mm), deep-burrowing animals collected in cores at specific sampling locations will be counted, weighed, and measured to determine the abundance and distribution of animals with potentials for mixing cap materials and EA sediments; 2) Cores will be analyzed for short-life (thorium) and long-life (lead) isotopes to help determine sediment mixing rates. Both inputs will be used, in conjunction with information from concurrent investigations of sediment transport processes, for decisions concerning the long-term effectiveness of a cap.
Define boundaries of the study
The study region encompasses the portions of the PV Shelf that have been identified as the boundary for the full-scale cap. Temporal boundaries may be important for biological processes (e.g., seasonal variability) and will be determined based on the validity of using previous data sets for comparisons. A one-time survey effort is proposed for the current task.
Specify limits on decision errors
Professional judgment will be used in conjunction with standard data collection and sample processing methods to ensure data are of reasonable quality and representativeness for these assessments.
Develop a decision rule
The decision rule is: Will a cap be eroded/moved/compromised from below due to the activity of deep-dwelling, bioturbating organisms? Results from this investigation (abundance, size, and biomass of large organisms, and information on sediment mixing rates) will be evaluated in conjunction with numerical modeling of sediment transport to develop a decision rule regarding capping feasibility.
Optimize the design for obtaining the data
1) The field survey program will collect large, deep-burrowing organisms frommultiple locations within the boundaries of the cap. 2) Only organisms larger than 2 mm will be retained and analyzed from the cores to minimize processing time and focus effort on those organisms most likely to affect sediment mixing. 3) Sediment cores for dating will be collected from a subset of the stations sampled for biota so that sediment mixing rate/bioturbation information can be evaluated with respect to the distribution of the organisms. 4) Sampling locations were designed to provide spatial coverage of the proposed cap area, and overlap with locations that will be sampled by the other, concurrent investigations.
Table 1.1-1. DQO Process for the Bioturbation Assessment.
3Final Study Report for the Summer 2004 Bioturbation Measurement Program Conducted on the Palos Verdes Shelf
Study Area Overview
The PV Shelf is located within the Southern California Bight, generally offshore from Point Fermin to thenorthwest side of the PV peninsula (Figure 1.1-1). This shelf area contains contaminated sediments that arepresent on the continental shelf and continental slope. The continental shelf in this region is narrow, with a width of 1.5 to 4 kilometers (km) and a bottom slope of 1 to 4 degrees. A shelf break occurs at water depths of70 to 100 meters (m). The continental slope extends seaward from the shelf, with a width of approximately3 km and a mean slope of 13 degrees (Lee 1994), to a depth of approximately 800 m.
In general, the subtidal benthic region of the PV Shelf is characterized by hard-bottom habitat from shore to at least 20-m water depth, and soft-bottom habitat over most of the remainder of the shelf and slope region to atleast 600 m depth. The exception to this pattern is the hard-substrate, artificial-reef habitat represented by thewastewater outfall pipes that extend primarily over soft bottom to approximately 60-m depth (Figure 1.1-1),some scattered hard-bottom areas on the shelf, and more extensive hard-bottom areas along parts of the shelf break.
Soft-Bottom Subtidal Habitats
Soft-bottom habitats grading from sand to mud typify the majority of the sea bottom deeper than approximately 20 m off Palos Verdes. Key inhabitants include infaunal and epifaunal invertebrates, both ofwhich live in close association with the sediments and typically are resident (especially infauna) in localizedareas as adults. Numerous bottom-feeding fish also are characteristic of these habitats.
Infaunal Community - The infaunal community on the shelf and slope is dominated by deposit feeders, primarily polychaete worms and small bivalves, but includes the full range of feeding types, including particle/suspension feeders and predators, representing numerous phyla (LACSD 1995). This community represents an important food source for many fish species and other invertebrates.
Based on results from surveys conducted by LACSD (1995), the greatest number of individuals occurs in theoutfall area (>10,000 individuals per square meter [individuals/m2]), although the number of organisms is also high (>7,500 individuals/m2) at locations off Point Vicente, Long Point, and Portuguese Bend at depthsranging from 30 to 152 m. Fewer individuals (<2,500 individuals/m2) occur in the deeper (e.g., 305 m) areasof the slope. Biomass is enhanced near and offshore of the outfall as a result of discharges of organic material. In general, the number and diversity of taxa are highest on the shelf and lowest on the slope. Diversity is alsolower northwest of the outfall, in the general area of highest chemical contamination, although temporal trendshave shown an increase in diversity in this area. Key members of the infaunal community include several species of polychaetes belonging to the following genera: Spiophanes, Paraprionospio, Prionospio, Mediomastus, Cossura, Exogone, Glycera, Capitella, and Dorvillea; the brittlestar Amphiodia; amphipodssuch as Heterophoxus; and the bivalves Tellina and Parvilucina. Important deep-burrowing species include thalassinid shrimp (e.g., ghost shrimp) and hemichordates.
Epifaunal Invertebrate Community - Spatial patterns in the epifaunal community are primarily related to depth, sediment type, and effects from the wastewater discharge (Stull 1995). Analysis of southern California trawl data from 1971 to 1984 classified the Palos Verdes samples as having a unique low diversity assemblage. In the 1980s, this assemblage declined and was replaced by one that was more typical of shelf assemblages in other areas of the Southern California Bight (Stull 1995). The distribution and diversity of the epibenthic macroinvertebrates have increased since the 1970s. Some of the changes may be attributed to improved habitat quality, although other environmental variables such as El Niño events have had significant effects on these populations (Stull 1995). Key epifaunal community members include ophiuroids, sea pens (e.g., Stylatula), heart urchins (e.g., Brissopsis and Brisaster), other sea urchins (e.g., Lytechinus and Allocentrotus), and seastars (e.g., Astropecten and Luidia).
Final Study Report for the Summer 2004 Bioturbation Measurement Program Conducted on the Palos Verdes Shelf 4
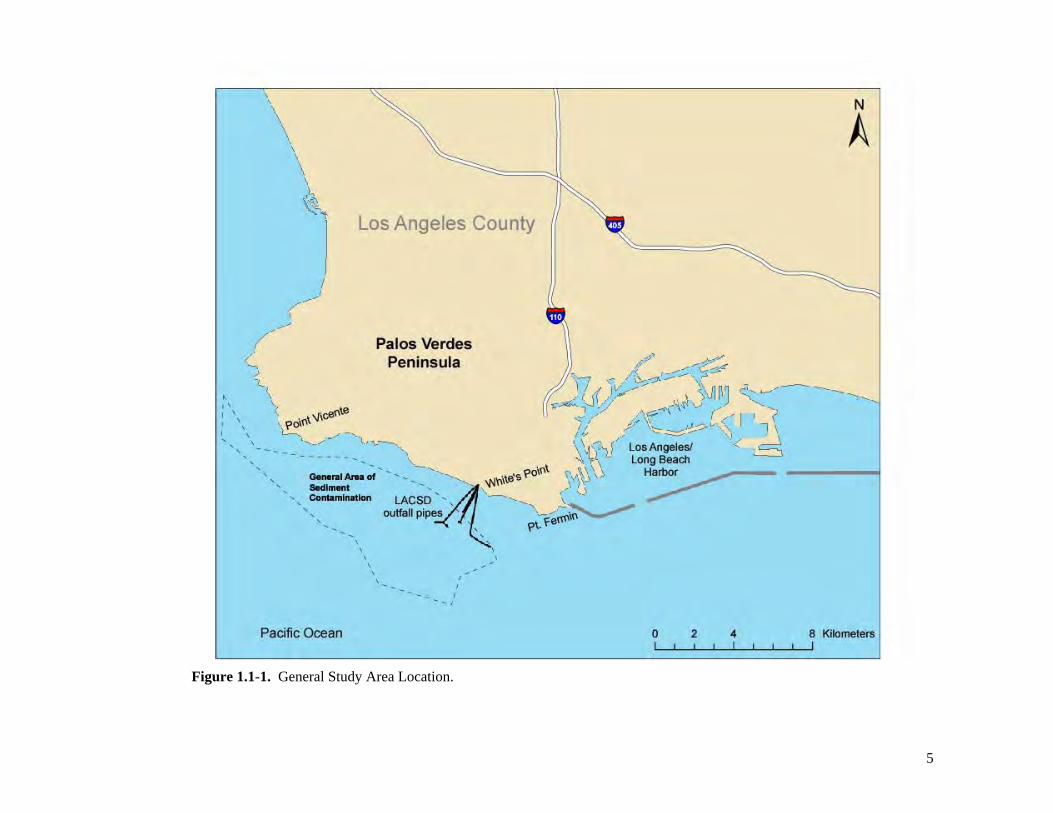
Figure 1.1-1. General Study Area Location.
5
2.0 METHODS
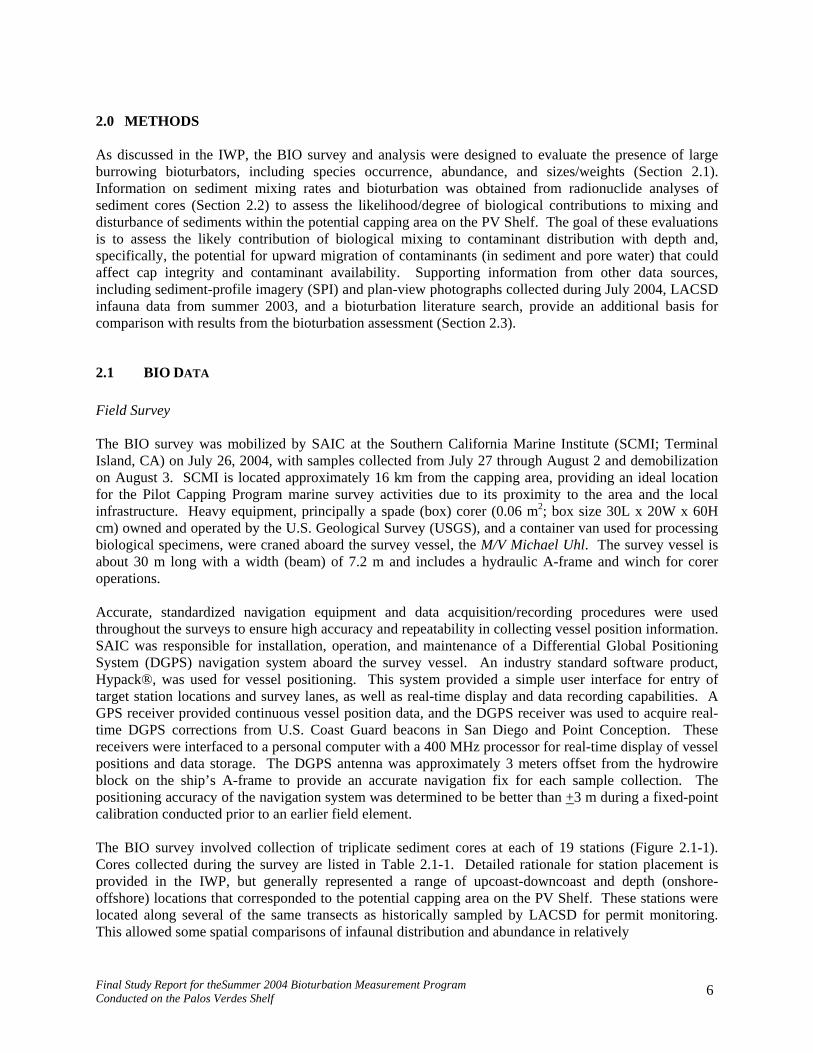
As discussed in the IWP, the BIO survey and analysis were designed to evaluate the presence of large burrowing bioturbators, including species occurrence, abundance, and sizes/weights (Section 2.1).Information on sediment mixing rates and bioturbation was obtained from radionuclide analyses ofsediment cores (Section 2.2) to assess the likelihood/degree of biological contributions to mixing and disturbance of sediments within the potential capping area on the PV Shelf. The goal of these evaluationsis to assess the likely contribution of biological mixing to contaminant distribution with depth and, specifically, the potential for upward migration of contaminants (in sediment and pore water) that couldaffect cap integrity and contaminant availability. Supporting information from other data sources,including sediment-profile imagery (SPI) and plan-view photographs collected during July 2004, LACSD infauna data from summer 2003, and a bioturbation literature search, provide an additional basis for comparison with results from the bioturbation assessment (Section 2.3).
2.1 BIO DATA
Field Survey
The BIO survey was mobilized by SAIC at the Southern California Marine Institute (SCMI; TerminalIsland, CA) on July 26, 2004, with samples collected from July 27 through August 2 and demobilizationon August 3. SCMI is located approximately 16 km from the capping area, providing an ideal locationfor the Pilot Capping Program marine survey activities due to its proximity to the area and the localinfrastructure. Heavy equipment, principally a spade (box) corer (0.06 m2; box size 30L x 20W x 60H cm) owned and operated by the U.S. Geological Survey (USGS), and a container van used for processingbiological specimens, were craned aboard the survey vessel, the M/V Michael Uhl. The survey vessel is about 30 m long with a width (beam) of 7.2 m and includes a hydraulic A-frame and winch for corer operations.
Accurate, standardized navigation equipment and data acquisition/recording procedures were usedthroughout the surveys to ensure high accuracy and repeatability in collecting vessel position information. SAIC was responsible for installation, operation, and maintenance of a Differential Global Positioning System (DGPS) navigation system aboard the survey vessel. An industry standard software product,Hypack®, was used for vessel positioning. This system provided a simple user interface for entry of target station locations and survey lanes, as well as real-time display and data recording capabilities. A GPS receiver provided continuous vessel position data, and the DGPS receiver was used to acquire real-time DGPS corrections from U.S. Coast Guard beacons in San Diego and Point Conception. These receivers were interfaced to a personal computer with a 400 MHz processor for real-time display of vesselpositions and data storage. The DGPS antenna was approximately 3 meters offset from the hydrowire block on the ship’s A-frame to provide an accurate navigation fix for each sample collection. The positioning accuracy of the navigation system was determined to be better than +3 m during a fixed-pointcalibration conducted prior to an earlier field element.
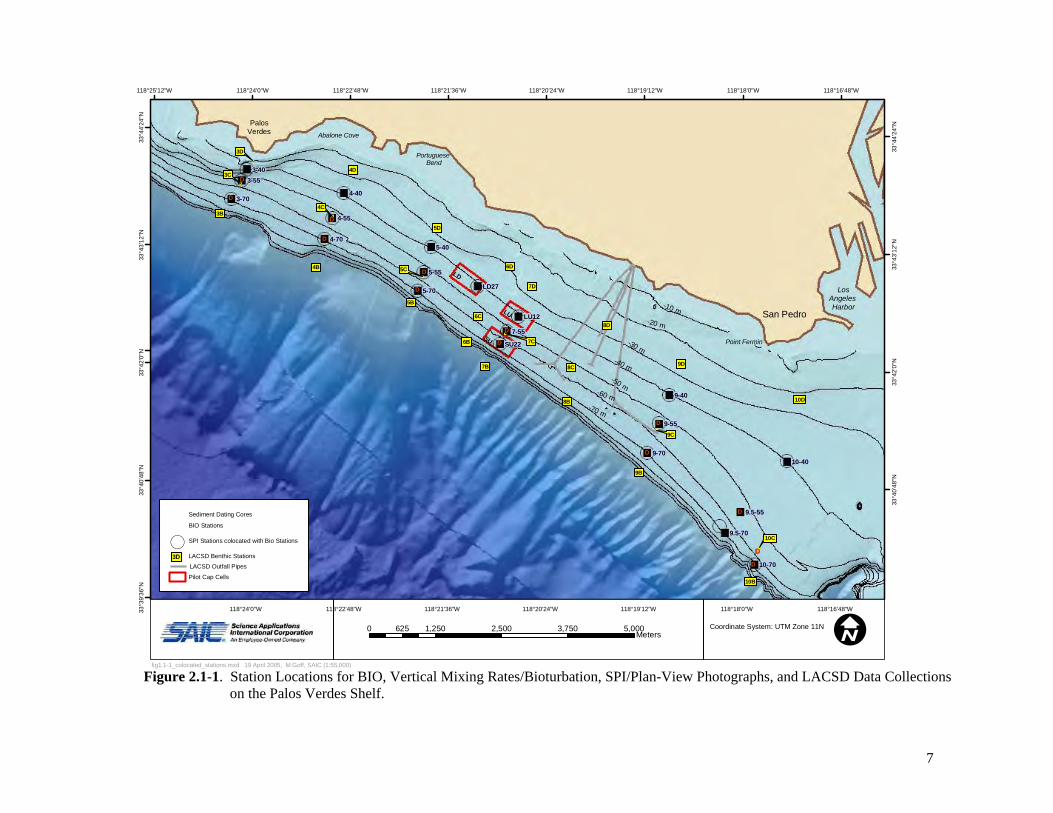
The BIO survey involved collection of triplicate sediment cores at each of 19 stations (Figure 2.1-1). Cores collected during the survey are listed in Table 2.1-1. Detailed rationale for station placement is provided in the IWP, but generally represented a range of upcoast-downcoast and depth (onshore-offshore) locations that corresponded to the potential capping area on the PV Shelf. These stations were located along several of the same transects as historically sampled by LACSD for permit monitoring. This allowed some spatial comparisons of infaunal distribution and abundance in relatively
Final Study Report for theSummer 2004 Bioturbation Measurement Program Conducted on the Palos Verdes Shelf 6
D
D
")
Figure 2.1-1. Station Locations for BIO, Vertical Mixing Rates/Bioturbation, SPI/Plan-View Photographs, and LACSD Data Collections on the Palos Verdes Shelf.
")
")
")
")
")
")D
D
D
D
D
D
D
D
D
D
D
D
D
D
"D
")
")
")
")
")
")
")
")
")
")
")
")
")
")
")
")
")
Abalone Cove
PortugueseBend
LosAngelesHarbor
PalosVerdes
San Pedro
Point Fermin
-70 m
-60 m
-50 m
-40 m
-30 m
-20 m
-10 m
LD
LU
SU
9D
9C
9B
8D
8C
8B
7D
7C
7B
6D
6C
6B
5D
5C
5B
4D
4C
4B
3D
3C
3B
10D
10C
10B
4-70
4-55
4-40
3-403-55
3-70
5-40
5-55
5-70
9-40
9-55
9-70
LD27
LU12
10-70
10-40
9.5-70
9.5-55
7-55
SU22
118°25'12"W
118°24'0"W
118°24'0"W
118°22'48"W
118°22'48"W
118°21'36"W
118°21'36"W
118°20'24"W
118°20'24"W
118°19'12"W
118°19'12"W
118°18'0"W
118°18'0"W
118°16'48"W
118°16'48"W
33°3
9'36
"N33
°40'
48"N
33°4
0'48
"N
33°4
2'0"
N
33°4
2'0"
N
33°4
3'12
"N
33°4
3'12
"N
33°4
4'24
"N
33°4
4'24
"N
0 1,250 2,500 3,750 5,000625Meters
fig1.1-1_colocated_stations.mxd 19 April 2005, M.Goff, SAIC (1:55,000)
I
Sediment Dating Cores
BIO Stations
( SPI Stations colocated with Bio Stations
") LACSD Benthic Stations
LACSD Outfall Pipes
Pilot Cap Cells
Coordinate System: UTM Zone 11N
3D
7

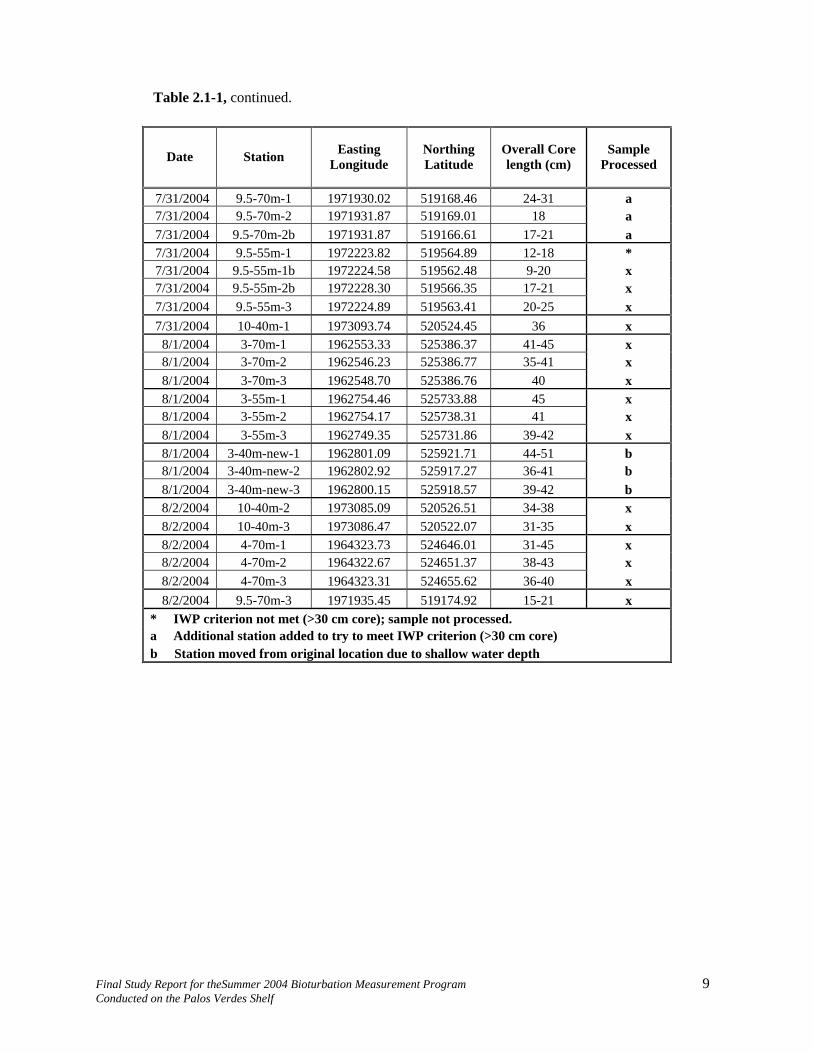
Table 2.1-1. Site Coordinates (UTM Zone 11N), Core Lengths, and Core Collection Dates from BIO Surveys, July/August 2004.
Date Station EastingLongitude
NorthingLatitude
Overall Core length (cm)
Sample Processed
7/27/2004 5-55m-1 1966197.64 524037.80 42 x 7/27/2004 5-55m-2 1966203.37 524039.81 45 x 7/27/2004 5-55m-3 1966192.39 524038.00 43.5 x 7/27/2004 5-70m-1 1966097.78 523682.08 32-41 x 7/27/2004 5-70m-2 1966085.14 523690.08 42 x 7/27/2004 5-70m-3 1966089.44 523682.67 37 x 7/27/2004 5-40m-1 1966330.82 524508.20 45 x 7/27/2004 5-40m-2 1966330.35 524505.61 41 x 7/27/2004 5-40m-3 1966332.36 524505.98 42 x 7/28/2004 LU12-1 1967998.10 523208.17 26-29 x 7/28/2004 LU12-2 1968000.43 523211.86 34 x 7/28/2004 LU12-3 1968005.23 523214.80 47-52 x 7/28/2004 LU12-4 1968002.75 523211.30 32 x 7/28/2004 SU22-1 1967656.68 522689.66 47 x 7/28/2004 SU22-2 1967650.37 522695.04 34-38 x 7/28/2004 SU22-3 1967653.13 522690.78 54 x 7/28/2004 7-55m-1 1967786.38 522929.37 34-40 x 7/28/2004 7-55m-2 1967787.60 522922.89 33-35 x 7/28/2004 7-55m-3 1967784.52 522926.60 33-35 x 7/29/2004 LD27-1 1967220.13 523777.72 43-44 x 7/29/2004 LD27-2 1967220.11 523773.28 37-42 x 7/29/2004 LD27-3 1967222.44 523777.89 37 x 7/29/2004 4-40m-1 1964683.43 525514.68 44-49 x 7/29/2004 4-40m-2 1964685.42 525508.01 41-43 x 7/29/2004 4-40m-3 1964682.18 525511.17 40-42 x 7/29/2004 4-55m-1 1964467.06 525039.25 40-42 x 7/29/2004 4-55m-2 1964465.04 525037.97 37-39 x 7/29/2004 4-55m-3 1964467.83 525038.69 35-42 x 7/30/2004 9-70m-1 1970456.82 520662.03 32-36 x 7/30/2004 9-70m-2 1970457.44 520662.22 37-40 x 7/30/2004 9-70m-3 1970458.83 520661.84 36-39 x 7/30/2004 9-55m-1 1970675.10 521219.13 36-39 x 7/30/2004 9-55m-2 1970678.98 521224.10 34-36 x 7/30/2004 9-55m-3 1970674.76 521218.56 37-42 x 7/30/2004 9-40m-1 1970867.96 521757.44 32 x 7/30/2004 9-40m-2 1970865.95 521756.16 32-37 x 7/30/2004 9-40m-3 1970863.47 521754.50 31-36 x 7/31/2004 10-70m-1 1972494.01 518571.10 28 * 7/31/2004 10-70m-1b 1972492.63 518575.17 19-25 x 7/31/2004 10-70m-2 1972492.32 518572.58 26-32 x 7/31/2004 10-70m-3 1972488.45 518573.15 24-30 x
Final Study Report for theSummer 2004 Bioturbation Measurement Program 8 Conducted on the Palos Verdes Shelf
Date Station EastingLongitude
NorthingLatitude
Overall Core length (cm)
Sample Processed
7/31/2004 9.5-70m-1 1971930.02 519168.46 24-31 a 7/31/2004 9.5-70m-2 1971931.87 519169.01 18 a 7/31/2004 9.5-70m-2b 1971931.87 519166.61 17-21 a 7/31/2004 9.5-55m-1 1972223.82 519564.89 12-18 * 7/31/2004 9.5-55m-1b 1972224.58 519562.48 9-20 x 7/31/2004 9.5-55m-2b 1972228.30 519566.35 17-21 x 7/31/2004 9.5-55m-3 1972224.89 519563.41 20-25 x 7/31/2004 10-40m-1 1973093.74 520524.45 36 x 8/1/2004 3-70m-1 1962553.33 525386.37 41-45 x 8/1/2004 3-70m-2 1962546.23 525386.77 35-41 x 8/1/2004 3-70m-3 1962548.70 525386.76 40 x 8/1/2004 3-55m-1 1962754.46 525733.88 45 x 8/1/2004 3-55m-2 1962754.17 525738.31 41 x 8/1/2004 3-55m-3 1962749.35 525731.86 39-42 x 8/1/2004 3-40m-new-1 1962801.09 525921.71 44-51 b 8/1/2004 3-40m-new-2 1962802.92 525917.27 36-41 b 8/1/2004 3-40m-new-3 1962800.15 525918.57 39-42 b 8/2/2004 10-40m-2 1973085.09 520526.51 34-38 x 8/2/2004 10-40m-3 1973086.47 520522.07 31-35 x 8/2/2004 4-70m-1 1964323.73 524646.01 31-45 x 8/2/2004 4-70m-2 1964322.67 524651.37 38-43 x 8/2/2004 4-70m-3 1964323.31 524655.62 36-40 x 8/2/2004 9.5-70m-3 1971935.45 519174.92 15-21 x
* IWP criterion not met (>30 cm core); sample not processed. a Additional station added to try to meet IWP criterion (>30 cm core) b Station moved from original location due to shallow water depth
Table 2.1-1, continued.
Final Study Report for theSummer 2004 Bioturbation Measurement Program 9 Conducted on the Palos Verdes Shelf

near-surface layers (LACSD) and large BIO collected at 15-cm intervals to the full depth of the core for the present study.
Full-length cores (i.e., IWP criterion of > 30 cm) were collected at all but two stations. At Stations 10-70 and 9.5-55, corer penetration was limited due to compacted mud and shell hash, as discussed in theAugust 2004 “Field Report for the 2004 Multidisciplinary Studies for the Palos Verdes Cap Monitoring Program: Task 4 Bioturbation Study”. An alternate station to 10-70 (9.5-70) was established during thesurvey, but the bottom conditions were similarly compacted and also resulted in less than full-lengthcores. In total, 64 drops were completed and 62 cores were processed, compared to 57 cores targeted inthe IWP. Of these processed cores, 6 were < 30 cm.
BIO cores were processed onboard the survey vessel. Core processing was initiated by longitudinalsplitting of the core into 15-cm intervals using a specially designed, stainless steel divider as detailed inthe IWP. Core intervals from top to bottom of each core were designated as interval 1 (0 to 15 cm),interval 2 (>15 to 30 cm), interval 3 (>30 to 45 cm), and interval 4 (>45 to 60 cm). Continued processing consisted of visual descriptions and photographs of each interval surface and the full length of the core;screening each interval through a 2-mm sieve; and subsequent sorting, identification, and length/weight measurements for all BIO. Digital calipers were used to measure each organism (or organism fragment)and a spring scale accurate to 0.1 g was used to weigh each organism or fragment, as specified in the IWP. Some specimens were weighed at SCMI using an Ohaus SP-402 digital scale, since boat movementprevented use of this instrument at sea due to its high accuracy (0.01 g) and consequent sensitivity to motion. A total of 297 organisms (including fragments) were processed, with approximately half retainedin a voucher collection for subsequent verification or identification. Manuscript names (e.g., “rednemertean”) were assigned to organisms that could not be identified to species during the survey.Specimens for the voucher collection were relaxed in a solution of magnesium sulfate (MgSO4) and then fixed with 10% buffered formalin. Samples were subsequently transferred to ethanol for long-term preservation. Sample jars containing organisms were shipped under chain-of-custody to MEC Weston Solutions (MEC; Carlsbad, CA). Voucher organisms were identified or verified to the lowest taxonomic level by SAIC and MEC biologists, and the manuscript names were then updated in a project database bySAIC. The SAIC Quality Assurance Officer checked all data (100%) for accuracy, and any mistakes (e.g., spelling or data entry errors) were corrected for the final database.
Analysis and QA
Data collected included three replicate core samples per interval. Means for each interval were calculatedand standardized to 0.1 m2, corresponding to the core size used by LACSD and standardizations used for many benthic studies to facilitate comparisons
Sufficient numbers of BIO did not occur in the samples (Appendix A) to justify use of statistical methods such as ANOVA and multiple range tests (SNK) for evaluations of differences among stations. Instead, means were used as the basis for among-station comparisons, primarily using GIS plots to evaluate spatial patterns. Some statistical correlations were performed using DeltaGraph software (version 5.6) and a simple linear curve fit was used to determine the correlation coefficient (r2) value.
2.2 SEDIMENT MIXING/BIOTURBATION RATES
Field Survey
Sediment cores for evaluation of vertical mixing/bioturbation rates were collected during field surveys conducted by SAIC and OSU in July 2004 (Figure 2.1-1 and Table 2.1-2). The surveys were mobilized
Final Study Report for theSummer 2004 Bioturbation Measurement Program 10 Conducted on the Palos Verdes Shelf
Date Station EastingLongitude
NorthingLatitude
Core Type *
7/23/2004 D_NW7G 1962331.79 525652.34 pb-2107/15/2004 10-55_E 1972581.67 518853.00 th-2347/15/2004 10-55_F 1972577.43 518851.20 th-2347/15/2004 9-55-d3_C 1970676.99 521216.24 th-2347/14/2004 9-55m_d3-A 1970677.82 521215.49 th-2347/14/2004 9-55m_d3-B 1970675.15 521212.22 th-2347/19/2004 L3_NW17F 1962556.93 525388.15 th-2347/23/2004 L3_NW17Z 1962560.52 525377.41 th-2347/19/2004 L3_NW6B 1962754.16 525735.93 th-2347/23/2004 L3_NW6Z 1962758.10 525741.30 th-2347/21/2004 L4_NW_35_B 1964334.52 524633.42 th-2347/23/2004 L4_NW22A 1964469.19 525037.92 th-2347/23/2004 L4_NW22B 1964468.29 525043.69 th-2347/23/2004 L4_NW22C 1964473.24 525055.62 th-2347/23/2004 L4_NW35Z 1964345.83 524639.20 th-2347/21/2004 L5_NW_49_B 1966101.63 523685.06 th-2347/24/2004 L5_NW45-F 1966198.88 524028.16 th-2347/24/2004 L5_NW45-G 1966203.51 524039.83 th-2347/24/2004 L5_NW45-H 1966203.96 524028.49 th-2347/24/2004 L5_NW49-C 1966099.69 523691.89 th-2347/21/2004 L7_OUT_13_A 1967793.15 522937.32 th-2347/24/2004 L7_OUT14-B 1967659.27 522702.90 th-2347/24/2004 L7_OUT14-C 1967659.28 522697.14 th-2347/20/2004 L_9_OUT_46-C 1970465.26 520663.69 th-2347/24/2004 L9_OUT46-D 1970466.58 520657.91 th-2347/26/2004 L9.5_55-F 1972230.43 519553.64 th-2347/26/2004 L9.5_55-H 1972230.93 519568.13 th-2347/25/2004 L10_SE47-G 1972495.84 518564.29 th-2347/24/2004 NW53-A 1967443.61 523398.07 th-234
* pb = Lead; th = Thorium
Table 2.1-2. Site Coordinates (UTM Zone 11N) and Core Collection Dates from Sediment Mixing Rates/Bioturbation Surveys, July 2004.
Final Study Report for theSummer 2004 Bioturbation Measurement Program 11 Conducted on the Palos Verdes Shelf
and demobilized at SCMI, with sample collections ranging from July 14 through 26. The survey vesselR/V Vantuna was operated by SCMI. The vessel is 20 m in length and equipped with an A-frame andwinch. Navigational positions of the survey stations were documented as described in Section 2.1 for theBIO survey.
Sediment samples were collected using a hydraulically damped piston core that is effective for collecting undisturbed cores down to 75 cm in a variety of sediment types. The corer is comprised of a 10.8-cm internal diameter by 95-cm long polycarbonate barrel, an 800-lb lead weight stand, and an aluminumsupport frame. The corer was winched through the water column at a controlled descent until bottom contact was evident by slack in the winch wire. Upon contact with the seafloor the weight-stand pushed the core barrel into the bed and simultaneously pulled a piston that forced water through a small valve. By regulating the valve opening the descent rate of the core barrel was controlled, thereby reducing the bow wave effect and minimizing disturbance of the surficial sediment layers. Its slow descent rate(typically around 4 cm/s), enabled the corer to collect an undisturbed sample with an intact sediment-water interface and sediment-free overlying water column.
Sediment subcores were vertically sectioned at different intervals consistent with the IWP sampling objectives. At four stations designated as “detailed” sampling stations (4-55, 5-55, 9-55, and 10-55), cores for thorium-234 analysis were sectioned at 1-cm intervals to a depth of 5 cm, and then at 2-cmintervals to a depth of 11 cm. Cores for thorium-234 at all other stations, designated as “comparison” stations, were sub-sampled at 0-1 cm and 1-5 cm intervals. The four detailed stations were at a near-outfall depth (55 m), while bracketing the outfall region (Transects 4, 5, 9, and 10) and covering a reasonable range of upcoast-downcoast locations within the potential capping area. The eight comparisonstations covered the remaining 55-m and 70-m transect stations. Cores for lead-210 were sampled at the same detailed stations as for thorium-234, thereby providing direct comparability and likewise covering a range of upcoast-downcoast locations, including downcoast erosional areas (Transects 9 and 10) and contrasting upcoast depositional areas. For all cores, an outer ring of approximately 0.5 cm thickness wasremoved and discarded to minimize potential contamination from the vertical displacement of particles bythe leading edge of the core tube. Samples were stored in whirl-pack bags and refrigerated during returnto the OSU laboratory for analysis.
Analysis and QA
Several steps were performed in the laboratory prior to sample counting for thorium-234 and lead-210.These steps included determinations of sample dry weight and thickness and processing for uniform sample geometry. Samples were dried in an oven at 60° C for 24 to 60 hours, depending on the sample volume and moisture content, and then ground to a uniform consistency using a mortar and pestle. The purpose was to minimize systematic differences in the sample characteristics due to down-core variationsin sediment conditions (e.g., porosity or grain size). Sediments were then transferred to pre-weighedplastic jars and weighed on a Mettler AE240 analytical balance. Sample weight was kept constant, at approximately 30 grams. The sample height was established by gently shaking the sample so that the surface was approximately level, and the height was measured using calipers at four equally spaced siteson the jar perimeter. Sample height, as discussed below, was important for a self-absorption correction step.
Samples were counted for gamma particle activity using two identical Canberra Instruments Model GL2020RS LEGe (low-energy germanium) detectors. The detectors were 20-mm thick, with active diameters of 50.5 mm, and each was equipped with 0.5 mm beryllium windows placed 5 mm from thedetector. Individual samples were counted for 24 to 48 hours over 2048 channels. The channels were linearly calibrated to energy using NIST-certified reference materials of known isotopic composition.The calibration procedure was repeated periodically in the analysis sequence. Proprietary software
Final Study Report for theSummer 2004 Bioturbation Measurement Program 12 Conducted on the Palos Verdes Shelf
associated with Canberra detectors allowed the analyst to specify regions of interest in the gamma-rayenergy spectrum (e.g., the 63.3 keV peak for thorium-234). A region of interest was defined around each isotope peak, including the peak and four channels on each side of the peak. These eight peaks were usedto determine the background gamma-ray activity at the peak’s energy. Net counts per minute were the sum of all counts in the region of interest, minus the average of the eight channels used for backgrounddetermination, multiplied by the number of channels in the peak. Activities and error estimates were calculated from the raw counts. The procedure for determining the self-absorption correction was basedon Cutshall et al. (1983). Self-absorption is the attenuation of gamma radiation emitted by a sample due to the absorption of radiation by the sample itself.
Values for excess thorium-234 and lead-210 were determined by correcting the final counts for the amount of radioactive decay that occurred between the time the sample was collected and the analysisdate. This correction was based on the procedure used by Gilmore and Hemingway (1995). In the caseof thorium-234, which decays rapidly (24.1-day half life), this correction can be substantial.
Estimates of particle mixing rates within the sediment column were based on variations in the activity of excess thorium-234 with depth below the sediment-water interface. This activity can be affected by threeprocesses: bioturbation, sedimentation, and radioactive decay. In general, the time rate-of-change for activity of a particular radionuclide is assumed to be at a steady state, representing a balance between the three processes. Under these conditions, the vertical activity profile of a short-lived radionuclide (e.g., thorium-234) is controlled by a balance between bioturbation and radioactive decay because the sedimentation rate is considered too small to affect the activity profile. Therefore, bioturbation rates (Db; cm2/yr) are determined by regressing depth (cm), the independent variable, against the natural log of the activity (A; dimensionless), which is the dependent variable. The regression equation used to calculate biodiffusivity is: ln A = ln Ao - [(lambda/ Db) exp0.5] z, where Ao is the excess activity at the sediment surface, lambda is the decay rate (1/yr), and z is depth (cm). The slope of the regression is[(lambda/Db) exp0.5], with units of [(1/yr/cm2/yr) exp0.5], which simplifies to 1/cm. This approach was used to calculate biodiffusivity values for the “detailed” station cores. For the comparison station cores,biodiffusivity rates were estimated from activity values for two core strata (0 to 1 cm and 1 to 5 cm),using the a priori assumption that the excess thorium-234 activity decreased exponentially in the upperfew centimeters of the sediment column and was the result of bioturbation and radioactive decayprocesses only, and the supply of thorium-234 to the sediment surface and mixing rates were constant(Aller et al. 1980; Wheatcroft and Martin 1996).
For longer-lived radionuclides, such as lead-210 (22.3-year half life), the sedimentation rate cannot be considered negligible. Consequently, either the sedimentation or mixing rate must be known in order tocalculate the other. The mixing rate can be estimated from thorium-234 activities; however, this requires an assumption that the mixing rate is constant over time. Alternately, when the bioturbation rate isconsidered negligible, such as at depths of several tens of centimeters in the sediment column, then theactivity profile is expected to reflect the sedimentation rate and radioactive decay, and the sedimentation rate can be determined from the slope of the line for the relationship between activity and depth in the sediment core.
Theoretical mixing rates and detection limits with sediment depth indicate that thorium-234 can extenddownward several tens of centimeters when mixing rates are high (R. Wheatcroft, OSU, personal communication). However, since mixing rates are generally low in shelf environments compared to decay rates for thorium-234, detection of this radionuclide extends only to about 10 cm, even though mixing occurs to at least the depth of deep-burrowing species. Notwithstanding, the mixing curves that can be calculated based on thorium-234 data in the top 10 cm will reflect conditions throughout the mixed layer, that is, as influenced by physical and biological processes over the sediment column. The relativelyshort decay time for thorium-234 is in sharp contrast to very long degradation time for DDT, such that
Final Study Report for theSummer 2004 Bioturbation Measurement Program 13 Conducted on the Palos Verdes Shelf
even slow mixing rates as mediated by burrowing organisms can serve to mobilize EA sediments upwardstowards the sediment surface.
2.3 OTHER DATA SOURCES
2.3.1 SPI and Plan-View Data
Field Survey
Approximately 170 SPI/Plan-View stations were occupied during the survey conducted in July 2004. Of these stations, 19 corresponded to BIO stations and served as an additional data source for evaluating biological conditions, such as community types and evidence of bioturbation, and physical conditions, such as grain size (Figure 2.1-1 and Table 2.1-3). Survey data were collected from the R/V Vantuna as described in Section 2.2, with navigational positions documented as described in Section 2.1.
Remote Ecological Monitoring of the Seafloor (REMOTS®) with a digital Sediment-Profile Imagery(SPI) camera is a benthic sampling technique that provides digital photographs of a cross-section of surface and near-surface sediments. The REMOTS® hardware consists of a Benthos Model 3731 sediment-profile camera designed to obtain undisturbed, vertical, cross-section photographs (in-situprofiles) of the upper 15 to 20 cm of the seafloor, depending on penetration. The REMOTS® frame was attached to a hydrowire and lowered and retrieved using a winch on the survey vessel. The digital sediment-profile camera system allowed nearly real-time review of the image quality and results. The high-resolution digital images were integrated directly into the computer-aided digital analysis system.
Analysis and QA
The SPI images captured sedimentary and biological conditions at the sediment-water interface to camera penetration depths ranging between 0 and 20 cm. Plan-view images provided documentation of the sediment surface (approximately 0.3 m2). Two representative sediment-profile images and onerepresentative plan-view image were selected for processing and analysis from the three replicatescollected at each sampling station. All of the sediment-profile and plan-view image data were retained inpre-formatted spreadsheets and incorporated into the project GIS and data management system. Thefollowing sub-sections provide a synopsis of the more detailed methods included in the report for the geotechnical study task (SAIC 2005).
The sediment-profile images were processed using an in-house computer-based image processingsystem (Visual Basic customized interface, with information stored in a Microsoft Access database) toconsistently characterize the images and to catalogue all relevant quantitative and qualitative results. Computer-aided analysis of each SPI image yields a suite of standard measured parameters, including sediment grain size major mode, camera prism penetration depth (an indirect measure of sediment bearingcapacity/density), depth of the apparent redox potential discontinuity (RPD; a measure of sediment aeration), infaunal successional stage, and Organism-Sediment Index (OSI; a summary parameterreflecting overall benthic habitat quality). OSI values can range from −10 (azoic with low sediment-dissolved-oxygen and/or presence of methane gas in the sediment) to +11 (healthy, aerobic environment with deep RPD depths and advanced successional stages). These values are calculated using dataassigned for the apparent RPD depth, successional status, and indicators of methane or low oxygen.
Plan-view images were analyzed to document general bottom conditions, substrate type, presence of epifauna and infauna, burrows, and bedforms. All SPI and plan-view data received 100% QA review.
Final Study Report for theSummer 2004 Bioturbation Measurement Program 14 Conducted on the Palos Verdes Shelf
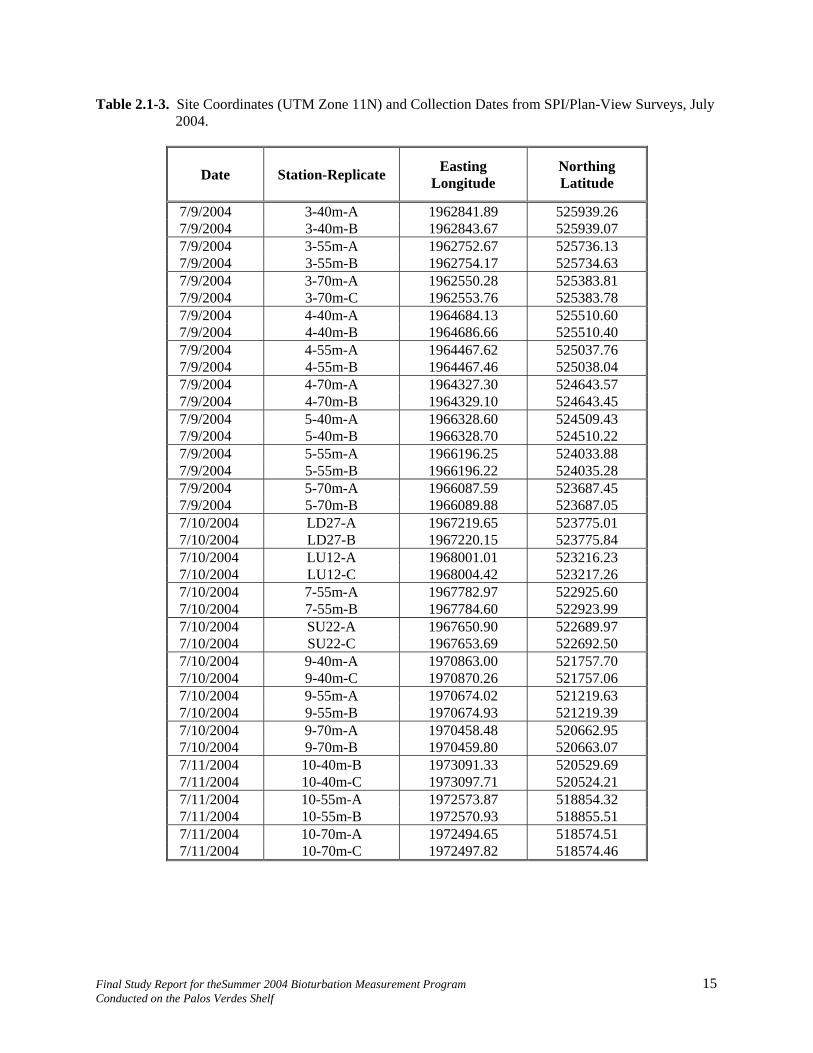
Table 2.1-3. Site Coordinates (UTM Zone 11N) and Collection Dates from SPI/Plan-View Surveys, July2004.
Date Station-Replicate Easting Longitude
Northing Latitude
7/9/2004 3-40m-A 1962841.89 525939.267/9/2004 3-40m-B 1962843.67 525939.077/9/2004 3-55m-A 1962752.67 525736.137/9/2004 3-55m-B 1962754.17 525734.637/9/2004 3-70m-A 1962550.28 525383.817/9/2004 3-70m-C 1962553.76 525383.787/9/2004 4-40m-A 1964684.13 525510.607/9/2004 4-40m-B 1964686.66 525510.407/9/2004 4-55m-A 1964467.62 525037.767/9/2004 4-55m-B 1964467.46 525038.047/9/2004 4-70m-A 1964327.30 524643.577/9/2004 4-70m-B 1964329.10 524643.457/9/2004 5-40m-A 1966328.60 524509.437/9/2004 5-40m-B 1966328.70 524510.227/9/2004 5-55m-A 1966196.25 524033.887/9/2004 5-55m-B 1966196.22 524035.287/9/2004 5-70m-A 1966087.59 523687.457/9/2004 5-70m-B 1966089.88 523687.057/10/2004 LD27-A 1967219.65 523775.017/10/2004 LD27-B 1967220.15 523775.847/10/2004 LU12-A 1968001.01 523216.237/10/2004 LU12-C 1968004.42 523217.267/10/2004 7-55m-A 1967782.97 522925.607/10/2004 7-55m-B 1967784.60 522923.997/10/2004 SU22-A 1967650.90 522689.977/10/2004 SU22-C 1967653.69 522692.507/10/2004 9-40m-A 1970863.00 521757.707/10/2004 9-40m-C 1970870.26 521757.067/10/2004 9-55m-A 1970674.02 521219.637/10/2004 9-55m-B 1970674.93 521219.397/10/2004 9-70m-A 1970458.48 520662.957/10/2004 9-70m-B 1970459.80 520663.077/11/2004 10-40m-B 1973091.33 520529.697/11/2004 10-40m-C 1973097.71 520524.217/11/2004 10-55m-A 1972573.87 518854.327/11/2004 10-55m-B 1972570.93 518855.517/11/2004 10-70m-A 1972494.65 518574.517/11/2004 10-70m-C 1972497.82 518574.46
Final Study Report for theSummer 2004 Bioturbation Measurement Program 15 Conducted on the Palos Verdes Shelf
2.3.2 LACSD Data
Infauna data on total abundance and biomass for the combined invertebrate community were obtained from LACSD for the most recently completed sampling year (2003). LACSD samples were sievedthrough 1-mm screens, compared to 2-mm screens used for the present study. These differences were related to standard, permit-specified monitoring methods for LACSD compared to the method used for focused collections of large BIO, respectively. Data units are per 0.1 m2, corresponding to the size of theVan Veen sampler used for the LACSD monitoring program. These data serve as a general basis of comparison with the large BIO data, particularly interval 1 (0-15 cm core depth) as this roughly approximates core sampling depths for the Van Veen sampler. The LACSD data were collected from stations located at three bottom depths (30, 60, and 152 m) along eight onshore-offshore transects and are useful to indicate spatial patterns of abundance and biomass along the PV Shelf (Figure 2.1-1). The BIO data were collected along six of these transects, but at depths corresponding more closely to the range ofpotential capping depths (40, 55, and 70 m). LACSD data used for the comparison consisted of summer 2003 results from single samples at each station, summed across taxonomic groups to generate total abundance and biomass values. These values were plotted using GIS to evaluate spatial patterns. Biomass for small organisms (weight <0.1g) was assigned a value of 0.05 grams for computational purposes.
2.3.3 Bioturbation Literature Search
Literature searches to identify data on bioturbation rates by infaunal organisms were conducted on theInternet and through the Scripps Institution of Oceanography Library electronic database systems(Aquatic Biology, Aquaculture & Fisheries Resources, ABAFR; BIOSIS; and Marine, Oceanographic & Freshwater Resources, MOFR). Key words, such as bioturbation, sediment reworking, bioturbation rate, burrowing rate, and burrow depth, were used to search the electronic databases. Once a reference withthe keywords was identified, abstracts were downloaded and assessed for relevant information, and full references obtained as appropriate.
Final Study Report for theSummer 2004 Bioturbation Measurement Program 16 Conducted on the Palos Verdes Shelf
3.1 LARGE BIO
3.0 RESULTS
Results are presented for large BIO (Section 3.1), including a community overview (Section 3.1.1) and key species (Section 3.1.2); SPI and plan-view photographs (Section 3.2); and sediment mixing rates/bioturbation (Section 3.3).
3.1.1 Community Overview
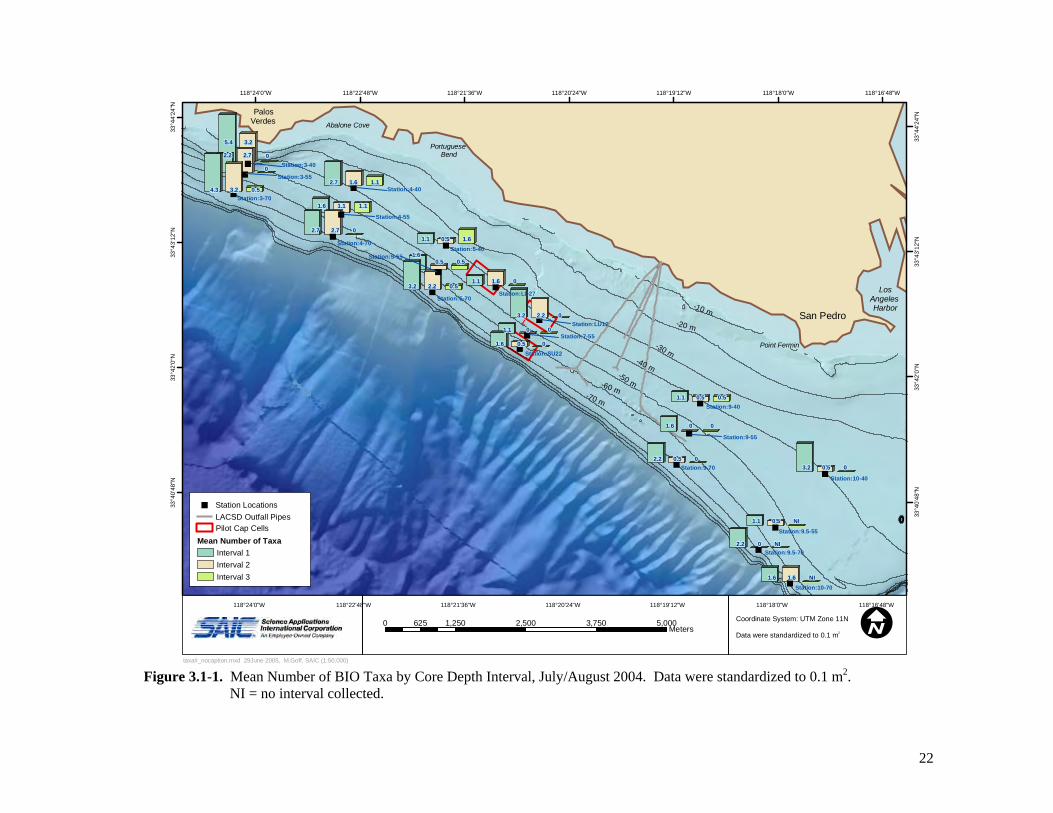
Number of TaxaOverall, 40 taxa of BIO were collected, dominated by polychaetous annelids (20 taxa), then decreasingsharply to 5 and 6 taxa, respectively, for nemertean worms and arthropods (crustaceans), and 1 to 3 taxafor the remaining phyla (Table 3.1-1). The mean number of taxa by phylum and core depth interval was low, ranging from about 1 to 5 for annelids, but less than 2 for other phyla (Table 3.1-2). As summarized in Figure 3.1-1, the distribution of mean number of taxa was generally higher northwest of the outfall, especially along Transects 3 and 4. Values for the highest mean number of taxa ranged from about 3 to 5. There were no consistent onshore-offshore trends over the relatively narrow depth range (40-70 m) for the study (Figure 3.1-1).
AbundanceOverall, 297 BIO specimens (including fragments) were collected (Appendix A, Table A-1). Mean abundance by phylum and core depth interval was low, ranging from about 1 to 13 for annelids, but less than 4 for other phyla (Table 3.1-3). Mean abundance was generally higher northwest of the outfalls, particularly along Transects 3 and 4, but also including interval 2 for Station 10-70 (Figure 3.1-2).
Organism SizeData on the size of BIO are summarized in Appendix A, Table A-1. Length data proved to provide limited useful information other than to confirm selection of appropriate large BIO. Computation of anoverall mean size of large BIO was not possible due to standard differences in size measurements fordifferent types of organisms, such as total length of polychaetes versus shell height for bivalves, and because organisms often were collected as fragments. Species-specific data on size are presented in Section 3.1-2 and summarized in Table A-1 for the predominant taxa, Neotrypaea californiensis(formerly Callianassa californiensis) and Marphysa disjuncta.
BiomassMean biomass data for BIO indicated that the highest values (e.g., about 5 to 11 g) were predominantlyassociated with core intervals 1 and 2 (0-15 cm and >15-30 cm, respectively), with the exception of one 40-m station (5-40) where interval 3 (>30 cm) was substantially higher (e.g., 1-2 orders of magnitude; Figure 3.1-3). Figure 3.1-4, showing mean abundance versus mean biomass, further emphasizes this difference between intervals. Interval 3 had low biomass at most stations, despite abundance values that were comparable to intervals 1 and 2 (Figure 3.1-2).
Spatial patterns for BIO indicated a general trend of higher biomass northwest of the outfall, compared tothe southeast (Figure 3.1-3). With the exception of Station LU12, interval 2 (10.8 g), within the LUcapping cell, the other five stations nearest the outfall (closest transects northwest and southeast) exhibited the lowest biomass (0 to 2.1 g). Overall, the main contributors to biomass for intervals 1 and 2were annelids (particularly Glycera and Marphysa due to relatively high abundance of low biomass individuals), arthropods (the ghost shrimp Neotrypaea), and echiurans (Listriolobus) (Tables 3.1-4 andA-1). The relatively high value for interval 3 at Station 5-40 was due to Neotrypaea and the molluscan
Final Study Report for theSummer 2004 Bioturbation Measurement Program 17 Conducted on the Palos Verdes Shelf
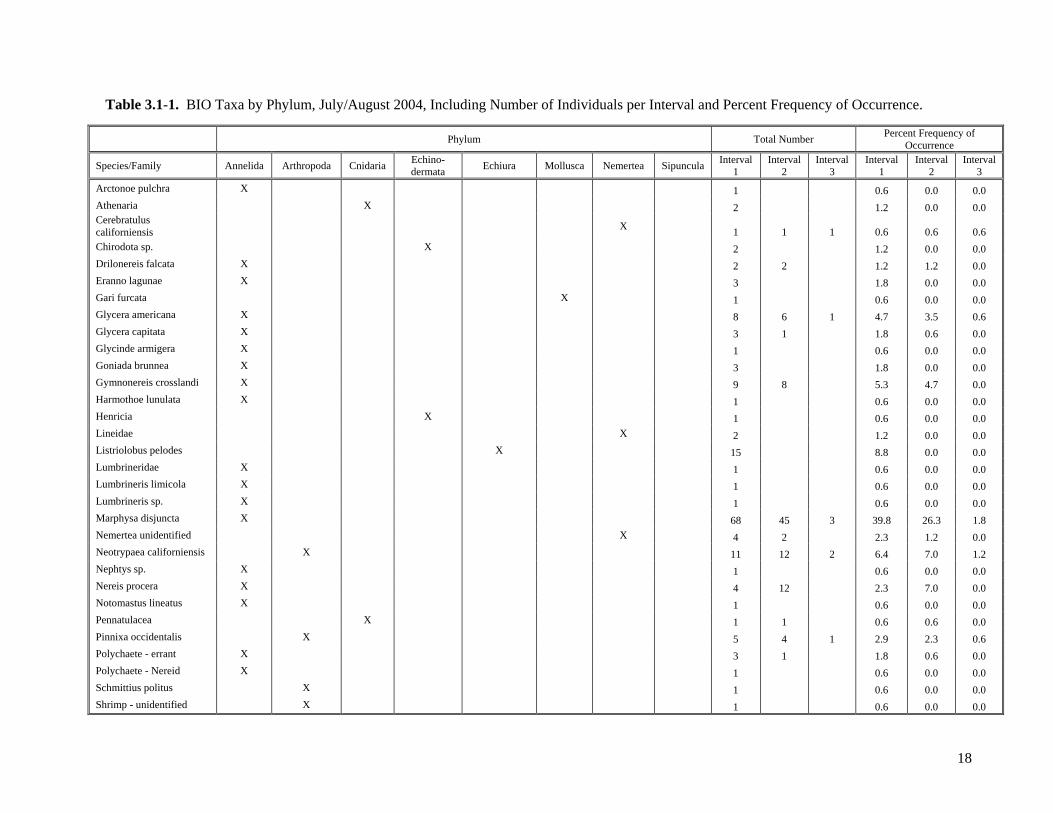
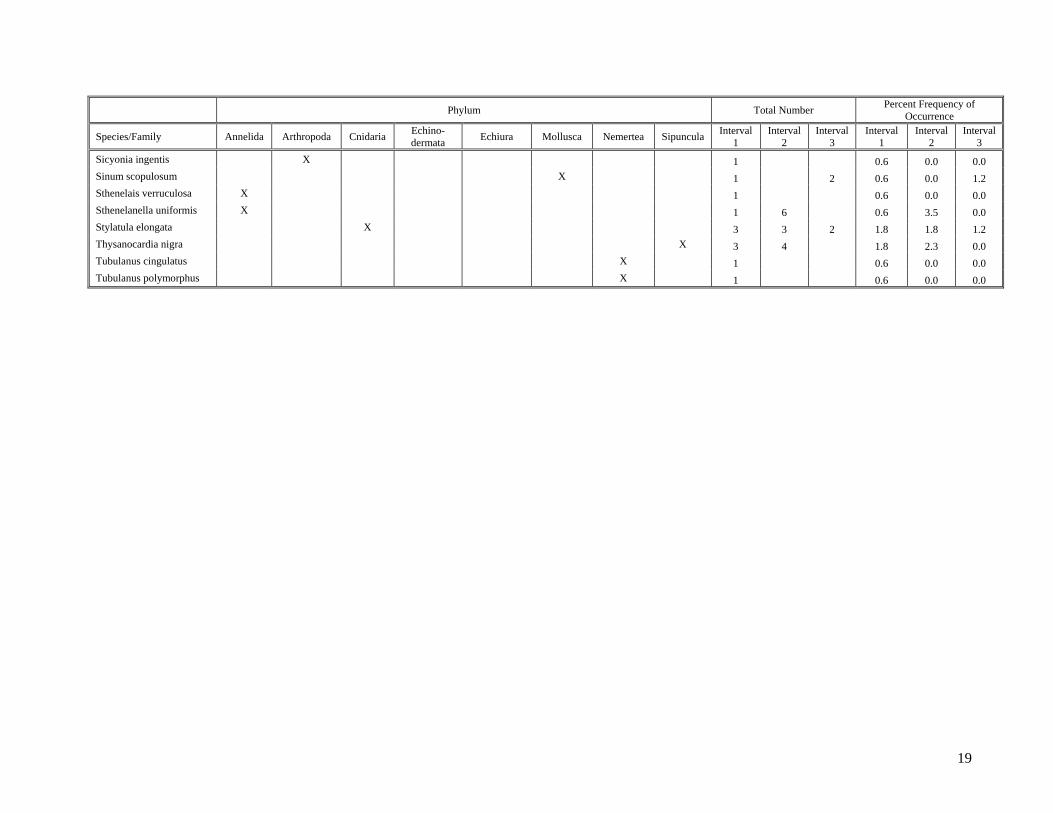
Table 3.1-1. BIO Taxa by Phylum, July/August 2004, Including Number of Individuals per Interval and Percent Frequency of Occurrence.
Phylum Total Number Percent Frequency of Occurrence
Species/Family Annelida Arthropoda Cnidaria Echino-dermata Echiura Mollusca Nemertea Sipuncula Interval
1 Interval
2 Interval
3 Interval
1 Interval
2 Interval
3 Arctonoe pulchra X 1 0.6 0.0 0.0Athenaria X 2 1.2 0.0 0.0Cerebratulus californiensis X 1 1 1 0.6 0.6 0.6Chirodota sp. X 2 1.2 0.0 0.0Drilonereis falcata X 2 2 1.2 1.2 0.0Eranno lagunae X 3 1.8 0.0 0.0Gari furcata X 1 0.6 0.0 0.0Glycera americana X 8 6 1 4.7 3.5 0.6Glycera capitata X 3 1 1.8 0.6 0.0Glycinde armigera X 1 0.6 0.0 0.0Goniada brunnea X 3 1.8 0.0 0.0Gymnonereis crosslandi X 9 8 5.3 4.7 0.0Harmothoe lunulata X 1 0.6 0.0 0.0Henricia X 1 0.6 0.0 0.0Lineidae X 2 1.2 0.0 0.0Listriolobus pelodes X 15 8.8 0.0 0.0Lumbrineridae X 1 0.6 0.0 0.0Lumbrineris limicola X 1 0.6 0.0 0.0Lumbrineris sp. X 1 0.6 0.0 0.0Marphysa disjuncta X 68 45 3 39.8 26.3 1.8Nemertea unidentified X 4 2 2.3 1.2 0.0Neotrypaea californiensis X 11 12 2 6.4 7.0 1.2Nephtys sp. X 1 0.6 0.0 0.0Nereis procera X 4 12 2.3 7.0 0.0Notomastus lineatus X 1 0.6 0.0 0.0Pennatulacea X 1 1 0.6 0.6 0.0Pinnixa occidentalis X 5 4 1 2.9 2.3 0.6Polychaete - errant X 3 1 1.8 0.6 0.0Polychaete - Nereid X 1 0.6 0.0 0.0Schmittius politus X 1 0.6 0.0 0.0Shrimp - unidentified X 1 0.6 0.0 0.0
18
Phylum Total Number Percent Frequency of Occurrence
Species/Family Annelida Arthropoda Cnidaria Echino-dermata Echiura Mollusca Nemertea Sipuncula Interval
1 Interval
2 Interval
3 Interval
1 Interval
2 Interval
3 Sicyonia ingentis X 1 0.6 0.0 0.0Sinum scopulosum X 1 2 0.6 0.0 1.2Sthenelais verruculosa X 1 0.6 0.0 0.0Sthenelanella uniformis X 1 6 0.6 3.5 0.0Stylatula elongata X 3 3 2 1.8 1.8 1.2Thysanocardia nigra X 3 4 1.8 2.3 0.0Tubulanus cingulatus X 1 0.6 0.0 0.0Tubulanus polymorphus X 1 0.6 0.0 0.0
Table 3.1-1, Continued.
19
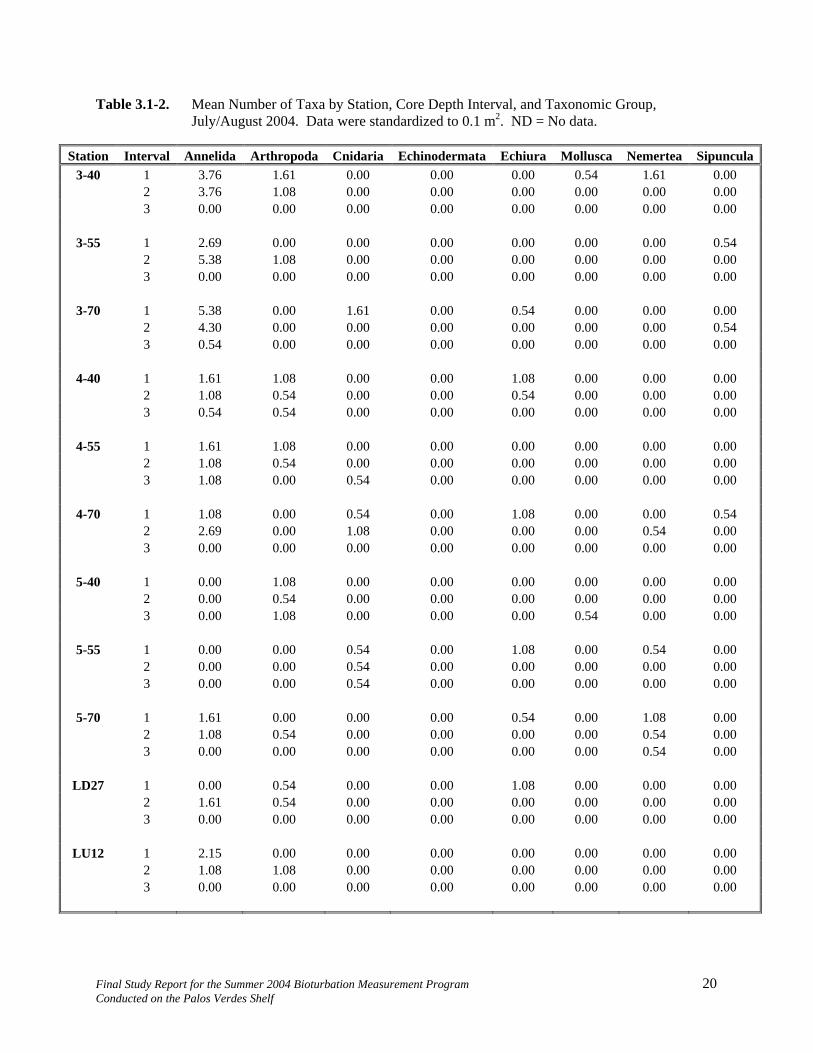
Table 3.1-2. Mean Number of Taxa by Station, Core Depth Interval, and Taxonomic Group, July/August 2004. Data were standardized to 0.1 m2. ND = No data.
Station Interval Annelida Arthropoda Cnidaria Echinodermata Echiura Mollusca Nemertea Sipuncula3-40 1 3.76 1.61 0.00 0.00 0.00 0.54 1.61 0.00
2 3.76 1.08 0.00 0.00 0.00 0.00 0.00 0.003 0.00 0.00 0.00 0.00 0.00 0.00 0.00 0.00
3-55 1 2.69 0.00 0.00 0.00 0.00 0.00 0.00 0.542 5.38 1.08 0.00 0.00 0.00 0.00 0.00 0.003 0.00 0.00 0.00 0.00 0.00 0.00 0.00 0.00
3-70 1 5.38 0.00 1.61 0.00 0.54 0.00 0.00 0.002 4.30 0.00 0.00 0.00 0.00 0.00 0.00 0.543 0.54 0.00 0.00 0.00 0.00 0.00 0.00 0.00
4-40 1 1.61 1.08 0.00 0.00 1.08 0.00 0.00 0.002 1.08 0.54 0.00 0.00 0.54 0.00 0.00 0.003 0.54 0.54 0.00 0.00 0.00 0.00 0.00 0.00
4-55 1 1.61 1.08 0.00 0.00 0.00 0.00 0.00 0.002 1.08 0.54 0.00 0.00 0.00 0.00 0.00 0.003 1.08 0.00 0.54 0.00 0.00 0.00 0.00 0.00
4-70 1 1.08 0.00 0.54 0.00 1.08 0.00 0.00 0.542 2.69 0.00 1.08 0.00 0.00 0.00 0.54 0.003 0.00 0.00 0.00 0.00 0.00 0.00 0.00 0.00
5-40 1 0.00 1.08 0.00 0.00 0.00 0.00 0.00 0.002 0.00 0.54 0.00 0.00 0.00 0.00 0.00 0.003 0.00 1.08 0.00 0.00 0.00 0.54 0.00 0.00
5-55 1 0.00 0.00 0.54 0.00 1.08 0.00 0.54 0.002 0.00 0.00 0.54 0.00 0.00 0.00 0.00 0.003 0.00 0.00 0.54 0.00 0.00 0.00 0.00 0.00
5-70 1 1.61 0.00 0.00 0.00 0.54 0.00 1.08 0.002 1.08 0.54 0.00 0.00 0.00 0.00 0.54 0.003 0.00 0.00 0.00 0.00 0.00 0.00 0.54 0.00
LD27 1 0.00 0.54 0.00 0.00 1.08 0.00 0.00 0.002 1.61 0.54 0.00 0.00 0.00 0.00 0.00 0.003 0.00 0.00 0.00 0.00 0.00 0.00 0.00 0.00
LU12 1 2.15 0.00 0.00 0.00 0.00 0.00 0.00 0.002 1.08 1.08 0.00 0.00 0.00 0.00 0.00 0.003 0.00 0.00 0.00 0.00 0.00 0.00 0.00 0.00
Final Study Report for the Summer 2004 Bioturbation Measurement Program 20 Conducted on the Palos Verdes Shelf

0.002 0.00 0.00 0.00 0.00 0.00 0.00 0.00 0.003 0.00 0.00 0.00 0.00 0.00 0.00 0.00 0.00
SU22 1 1.61 0.54 0.00 0.00 0.00 0.00 0.00 0.002 0.54 0.00 0.00 0.00 0.00 0.00 0.00 0.003 0.00 0.00 0.00 0.00 0.00 0.00 0.00 0.00
9-40 1 1.08 0.00 0.00 0.00 0.00 0.00 0.00 0.002 0.54 0.00 0.00 0.00 0.00 0.00 0.00 0.003 0.00 0.00 0.00 0.00 0.00 0.54 0.00 0.00
9-55 1 1.08 0.00 0.00 0.00 0.54 0.00 0.00 0.002 0.00 0.00 0.00 0.00 0.00 0.00 0.00 0.003 0.00 0.00 0.00 0.00 0.00 0.00 0.00 0.00
9-70 1 1.61 1.08 0.00 0.00 0.54 0.00 0.00 0.002 0.54 0.00 0.00 0.00 0.00 0.00 0.00 0.003 0.00 0.00 0.00 0.00 0.00 0.00 0.00 0.00
10-40 1 2.15 0.54 0.00 0.00 0.00 0.54 0.00 0.002 0.54 0.00 0.00 0.00 0.00 0.00 0.00 0.003 0.00 0.00 0.00 0.00 0.00 0.00 0.00 0.00
9.5-55 1 1.08 0.00 0.00 0.00 0.00 0.00 0.00 0.542 0.00 0.00 0.00 0.00 0.00 0.00 0.00 0.003 0.00 0.00 0.00 0.00 0.00 0.00 0.00 0.00
9.5-70 1 0.00 0.00 0.54 1.08 0.00 0.00 0.54 0.002 0.00 0.00 0.00 0.00 0.00 0.00 0.00 0.543 0.00 0.00 0.00 0.00 0.00 0.00 0.00 0.00
10-70 1 2.15 0.00 0.00 0.00 0.00 0.00 0.00 0.002 0.54 0.00 0.54 0.00 0.00 0.00 0.00 1.083 0.00 0.00 0.00 0.00 0.00 0.00 0.00 0.00
Table 3.1-2, continued.
Station Interval Annelida Arthropoda Cnidaria Echinodermata Echiura Mollusca Nemertea Sipuncula7-55 1 0.54 0.00 0.00 0.00 0.54 0.00 0.00
Final Study Report for the Summer 2004 Bioturbation Measurement Program 21 Conducted on the Palos Verdes Shelf
LD
U
SU
"
"
""
"
""
"
"
"
"
"
"
"
"
"
"
"
"
"
Station:LU12
Station:LD27
Station:9-70
Station:9-55
Station:9-40
Station:7-55
Station:5-70
Station:5-55Station:5-40
Station:4-70
Station:4-55
Station:4-40Station:3-70
Station:3-55
Station:3-40
Station:10-70
Station:10-40
Station:9.5-70
Station:9.5-55
Station:SU22
Abalone Cove
PortugueseBend
LosAngelesHarbor
PalosVerdes
San Pedro
Point Fermin
-70 m
-60 m
-50 m
-40 m
-30 m
-20 m
-10 m
Figure 3.1-1. Mean Number of BIO Taxa by Core Depth Interval, July/August 2004. Data were standardized to 0.1 m2. NI = no interval collected.
L
2.2 0 NI
1.6 0 0
1.6 0.5 0
3.2 2.2 0
1.1 1.6 0
1.6 1.6 NI
3.2 0.5 0
1.1 0.5 NI
2.2 0.5 0
2.7 2.7 0
2.2 2.7
0
5.4 3.2
0
1.1 0.5 0.5
3.2 2.2 0.5
1.6 0.5 0.5
1.1 0.5 1.6
1.6 1.1 1.1
2.7 1.6 1.14.3 3.2 0.5
1.1 0 0
118°24'0"W
118°24'0"W
118°22'48"W
118°22'48"W
118°21'36"W
118°21'36"W
118°20'24"W
118°20'24"W
118°19'12"W
118°19'12"W
118°18'0"W
118°18'0"W
118°16'48"W
118°16'48"W
33°4
0'48
"N
33°4
0'48
"N
33°4
2'0"
N
33°4
2'0"
N
33°4
3'12
"N
33°4
3'12
"N
33°4
4'24
"N
33°4
4'24
"N
0 1,250 2,500 3,750 5,000625Meters
taxa#_nocaption.mxd 29June 2005, M.Goff, SAIC (1:50,000)
I
" Station LocationsLACSD Outfall Pipes
Mean Number of Taxa
Interval 2Interval 3
Interval 1
Pilot Cap Cells
Coordinate System: UTM Zone 11N
Data were standardized to 0.1 m2
22
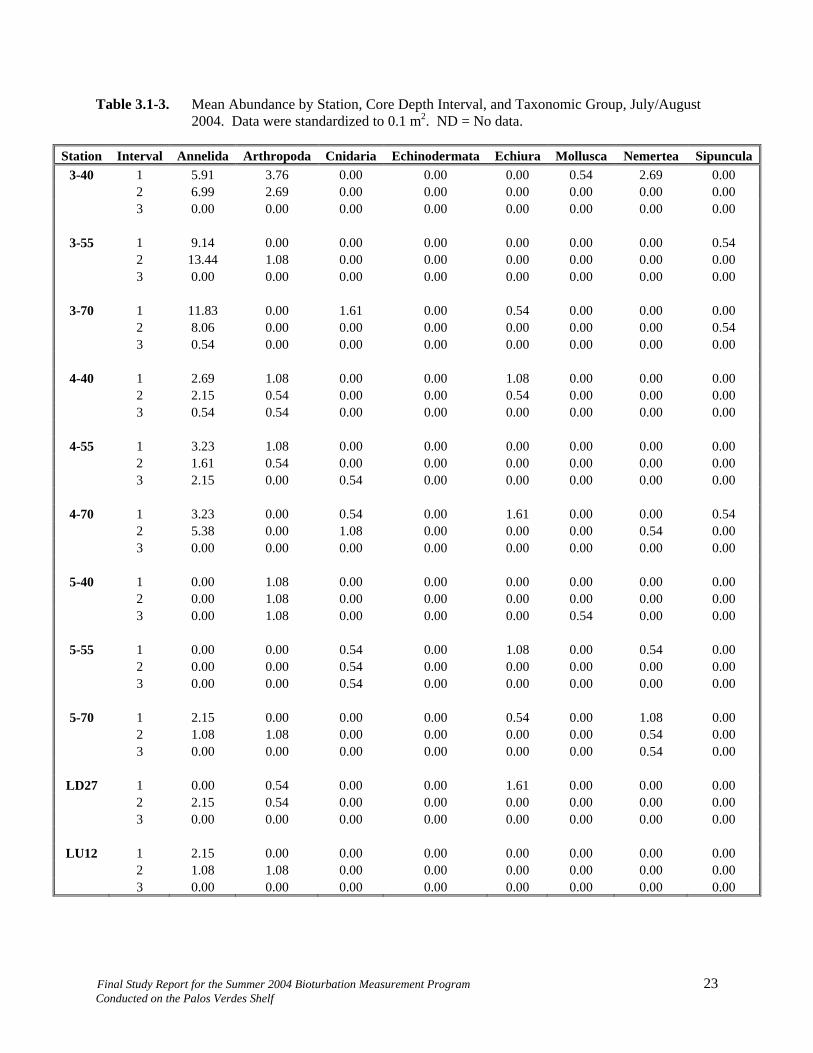
Table 3.1-3. Mean Abundance by Station, Core Depth Interval, and Taxonomic Group, July/August 2004. Data were standardized to 0.1 m2. ND = No data.
Station Interval Annelida Arthropoda Cnidaria Echinodermata Echiura Mollusca Nemertea Sipuncula3-40 1 5.91 3.76 0.00 0.00 0.00 0.54 2.69 0.00
2 6.99 2.69 0.00 0.00 0.00 0.00 0.00 0.003 0.00 0.00 0.00 0.00 0.00 0.00 0.00 0.00
3-55 1 9.14 0.00 0.00 0.00 0.00 0.00 0.00 0.542 13.44 1.08 0.00 0.00 0.00 0.00 0.00 0.003 0.00 0.00 0.00 0.00 0.00 0.00 0.00 0.00
3-70 1 11.83 0.00 1.61 0.00 0.54 0.00 0.00 0.002 8.06 0.00 0.00 0.00 0.00 0.00 0.00 0.543 0.54 0.00 0.00 0.00 0.00 0.00 0.00 0.00
4-40 1 2.69 1.08 0.00 0.00 1.08 0.00 0.00 0.002 2.15 0.54 0.00 0.00 0.54 0.00 0.00 0.003 0.54 0.54 0.00 0.00 0.00 0.00 0.00 0.00
4-55 1 3.23 1.08 0.00 0.00 0.00 0.00 0.00 0.002 1.61 0.54 0.00 0.00 0.00 0.00 0.00 0.003 2.15 0.00 0.54 0.00 0.00 0.00 0.00 0.00
4-70 1 3.23 0.00 0.54 0.00 1.61 0.00 0.00 0.542 5.38 0.00 1.08 0.00 0.00 0.00 0.54 0.003 0.00 0.00 0.00 0.00 0.00 0.00 0.00 0.00
5-40 1 0.00 1.08 0.00 0.00 0.00 0.00 0.00 0.002 0.00 1.08 0.00 0.00 0.00 0.00 0.00 0.003 0.00 1.08 0.00 0.00 0.00 0.54 0.00 0.00
5-55 1 0.00 0.00 0.54 0.00 1.08 0.00 0.54 0.002 0.00 0.00 0.54 0.00 0.00 0.00 0.00 0.003 0.00 0.00 0.54 0.00 0.00 0.00 0.00 0.00
5-70 1 2.15 0.00 0.00 0.00 0.54 0.00 1.08 0.002 1.08 1.08 0.00 0.00 0.00 0.00 0.54 0.003 0.00 0.00 0.00 0.00 0.00 0.00 0.54 0.00
LD27 1 0.00 0.54 0.00 0.00 1.61 0.00 0.00 0.002 2.15 0.54 0.00 0.00 0.00 0.00 0.00 0.003 0.00 0.00 0.00 0.00 0.00 0.00 0.00 0.00
LU12 1 2.15 0.00 0.00 0.00 0.00 0.00 0.00 0.002 1.08 1.08 0.00 0.00 0.00 0.00 0.00 0.003 0.00 0.00 0.00 0.00 0.00 0.00 0.00 0.00
Final Study Report for the Summer 2004 Bioturbation Measurement Program 23 Conducted on the Palos Verdes Shelf

Table 3.1-3, continued.
Station Interval Annelida Arthropoda Cnidaria Echinodermata Echiura Mollusca Nemertea Sipuncula
7-55 1 1.08 0.00 0.00 0.00 0.54 0.00 0.00 0.002 0.00 0.00 0.00 0.00 0.00 0.00 0.00 0.003 0.00 0.00 0.00 0.00 0.00 0.00 0.00 0.00
SU22 1 1.61 0.54 0.00 0.00 0.00 0.00 0.00 0.002 0.54 0.00 0.00 0.00 0.00 0.00 0.00 0.003 0.00 0.00 0.00 0.00 0.00 0.00 0.00 0.00
9-40 1 1.08 0.00 0.00 0.00 0.00 0.00 0.00 0.002 0.54 0.00 0.00 0.00 0.00 0.00 0.00 0.003 0.00 0.00 0.00 0.00 0.00 0.54 0.00 0.00
9-55 1 2.69 0.00 0.00 0.00 0.54 0.00 0.00 0.002 0.00 0.00 0.00 0.00 0.00 0.00 0.00 0.003 0.00 0.00 0.00 0.00 0.00 0.00 0.00 0.00
9-70 1 5.38 1.61 0.00 0.00 0.54 0.00 0.00 0.002 0.54 0.00 0.00 0.00 0.00 0.00 0.00 0.003 0.00 0.00 0.00 0.00 0.00 0.00 0.00 0.00
10-40 1 2.69 0.54 0.00 0.00 0.00 0.54 0.00 0.002 1.08 0.00 0.00 0.00 0.00 0.00 0.00 0.003 0.00 0.00 0.00 0.00 0.00 0.00 0.00 0.00
9.5-55 1 1.08 0.00 0.00 0.00 0.00 0.00 0.00 0.542 0.00 0.00 0.00 0.00 0.00 0.00 0.00 0.003 ND ND ND ND ND ND ND ND
9.5-70 1 0.00 0.00 0.54 1.61 0.00 0.00 0.54 0.002 0.00 0.00 0.00 0.00 0.00 0.00 0.00 0.543 ND ND ND ND ND ND ND ND
10-70 1 3.76 0.00 0.00 0.00 0.00 0.00 0.00 0.002 1.61 0.00 0.54 0.00 0.00 0.00 0.00 1.083 ND ND ND ND ND ND ND ND
Final Study Report for the Summer 2004 Bioturbation Measurement Program 24 Conducted on the Palos Verdes Shelf

Figure 3.1-2. Mean Abundance of BIO by Core Depth Interval, July/August 2004. Data were standardized to 0.1 m2. . NI = no interval collected
D
U
LU
"
"
""
"
""
"
"
"
"
"
"
"
"
"
"
"
"
"
9.7 14.5 0Station:3-55
Station:LU12
Station:LD27
Station:9-70
Station:9-55
Station:9-40
Station:7-55
Station:5-70
Station:5-55
Station:5-40Station:4-70
Station:4-55
Station:4-40Station:3-70
Station:10-70
Station:10-40
Station:9.5-70
Station:9.5-55
Station:SU22
Abalone Cove
Portuguese Bend
LosAngelesHarbor
PalosVerdes
San Pedro
Point Fermin
-10 m
-20 m
-30 m-40 m
-50 m-60 m-70 m
L
S
1.6 0 NI
3.2 0 0
2.2 0.5 0
2.2 2.2 0
2.2 2.7 0
3.8 3.2 NI
3.8 1.1 0
2.7 0.5 NI
7.5 0.5 0
5.9 7.0 0
12.9 9.7 0Station:3-40
1.1 0.5 0.5
3.8 2.7 0.5
2.2 0.5 0.5
1.1 1.1 1.6
4.3 2.2 2.7
4.8 3.2 1.114.0 8.6 0.5
1.6 0 0
118°24'0"W
118°24'0"W
118°22'48"W
118°22'48"W
118°21'36"W
118°21'36"W
118°20'24"W
118°20'24"W
118°19'12"W
118°19'12"W
118°18'0"W
118°18'0"W
118°16'48"W
118°16'48"W
33°4
0'48
"N
33°4
0'48
"N
33°4
2'0"
N
33°4
2'0"
N
33°4
3'12
"N
33°4
3'12
"N
33°4
4'24
"N
33°4
4'24
"N
abundance#_nocaption.mxd 29 June 2005, M.Goff, SAIC (1:50,000)
I0 1,250 2,500 3,750 5,000625Meters
" Station LocationsLACSD Outfall Pipes
Mean AbundanceInterval 1Interval 2Interval 3
Pilot Cap Cells
Coordinate System: UTM Zone 11N
Data were standardized to 0.1 m 2
25
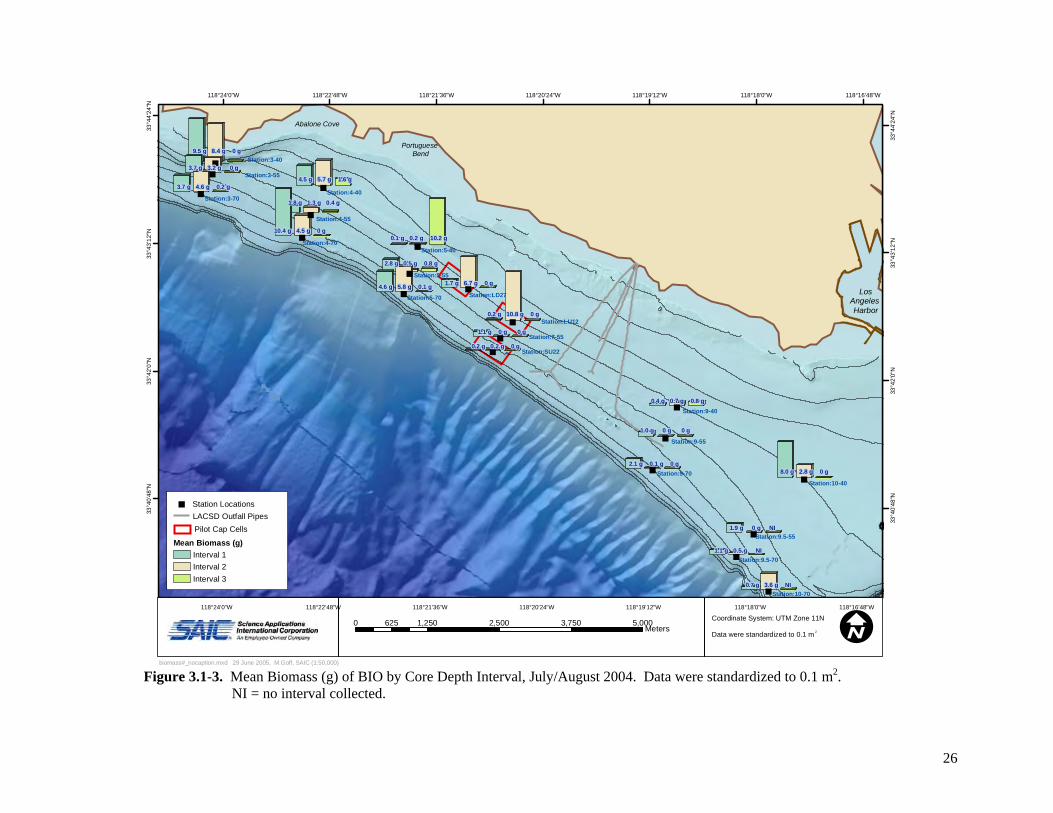
Figure 3.1-3. Mean Biomass (g) of BIO by Core Depth Interval, July/August 2004. Data were standardized to 0.1 m2. ected. NI = no interval coll
LD
LU
SU
"
"
""
"
""
"
"
"
"
"
"
"
"
"
"
"
"
"
Station:LU12
Station:LD27
Station:9-70
Station:9-55
Station:9-40
Station:7-55
Station:5-70
Station:5-55
Station:5-40Station:4-70
Station:4-55
Station:4-40Station:3-70
Station:3-55
Station:3-40
Station:10-70
Station:10-40
Station:9.5-70
Station:9.5-55
Station:SU22
Abalone Cove
PortugueseBend
LosAngelesHarbor
1.9 g 0 g NI
1.0 g 0 g 0 g
1.1 g 0 g 0 g
0.2 g 0.2 g 0 g
1.7 g 6.7 g 0 g
0.7 g 3.6 g NI
8.0 g 2.8 g 0 g
1.1 g 0.5 g NI
2.1 g 0.1 g 0 g
3.7 g 3.2 g 0 g
9.5 g 8.4 g 0 g
0.2 g 10.8 g 0 g
10.4 g 4.5 g 0 g
0.4 g 0.7 g 0.8 g
4.6 g 5.8 g 0.1 g
2.8 g 0.5 g 0.8 g
1.8 g 1.3 g 0.4 g
4.5 g 5.7 g 1.6 g3.7 g 4.6 g 0.2 g
0.1 g 0.2 g 10.2 g
118°24'0"W
118°24'0"W
118°22'48"W
118°22'48"W
118°21'36"W
118°21'36"W
118°20'24"W
118°20'24"W
118°19'12"W
118°19'12"W
118°18'0"W
118°18'0"W
118°16'48"W
118°16'48"W
33°4
0'48
"N
33°4
0'48
"N
33°4
2'0"
N
33°4
2'0"
N
33°4
3'12
"N
33°4
3'12
"N
33°4
4'24
"N
33°4
4'24
"N
0 1,250 2,500 3,750 5,000625Meters
biomass#_nocaption.mxd 29 June 2005, M.Goff, SAIC (1:50,000)
I
" Station LocationsLACSD Outfall PipesPilot Cap Cells
Mean Biomass (g)Interval 1Interval 2Interval 3
Coordinate System: UTM Zone 11N
Data were standardized to 0.1 m 2
26
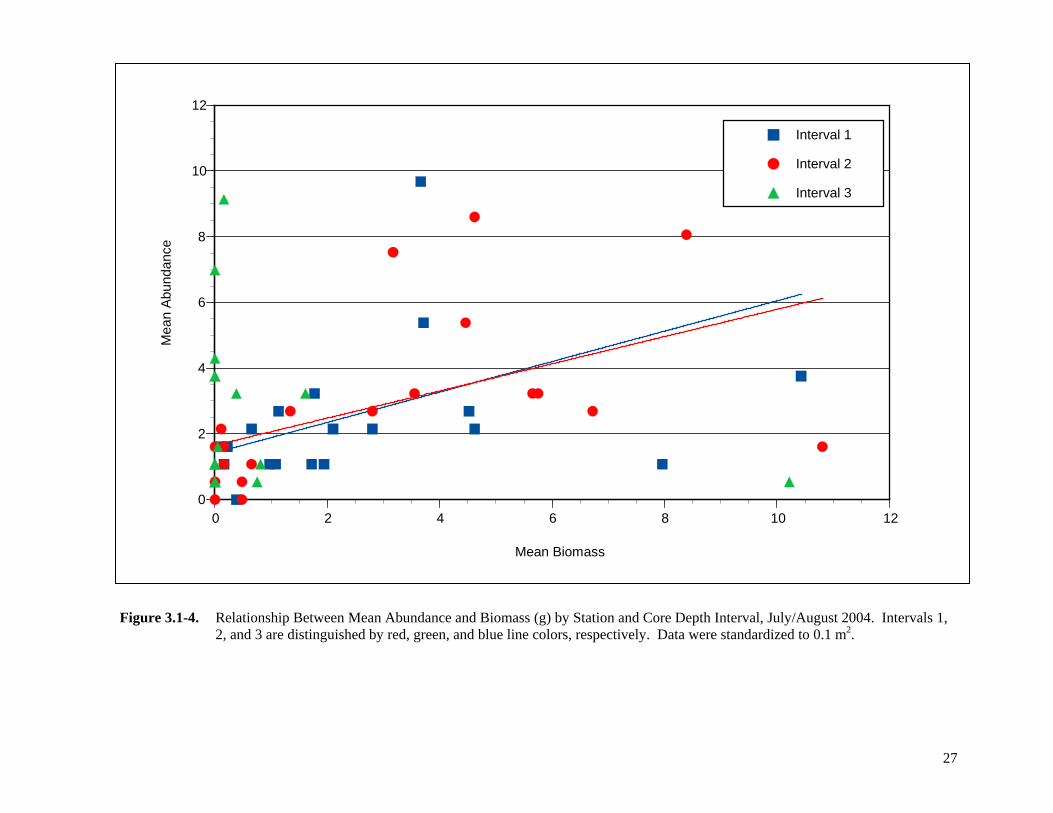
Figure 3.1-4. Relationship Between Mean Abundance and Biomass (g) by Station and Core Depth Interval, July/August 2004. Intervals 1, 2, and 3 are distinguished by red, green, and blue line colors, respectively. Data were standardized to 0.1 m2.
0
2
4
6
8
10
12
0 2 4 6 8 10 12
Mea
n Ab
unda
nce
Mean Biomass
Interval 1
Interval 2
Interval 3
27

Table 3.1-4. Mean Biomass (g) by Station, Core Depth Interval, and Taxonomic Group, July/August 2004. Data were standardized to 0.1 m2 and then normalized by core interval volume. ND = No data.
Interval Annelida Arthropoda Cnidaria Echinodermata Echiura Mollusca Nemertea Sipuncula3-40 1 1.99 6.99 0.00 0.00 0.05 0.43 0.00
2 2.15 6.24 0.00 0.00 0.00 0.00 0.00 0.003 0.00 0.00 0.00 0.00 0.00 0.00 0.00 0.00
3-55 1 3.49 0.00 0.00 0.00 0.00 0.00 0.002 2.26 0.91 0.00 0.00 0.00 0.00 0.00 0.003 0.00 0.00 0.00 0.00 0.00 0.00 0.00
3-70 1 3.28 0.00 0.32 0.00 0.11 0.00 0.00 0.002 0.00 0.00 0.00 0.00 0.00 0.00 0.323 0.23 0.00 0.00 0.00 0.00 0.00 0.00
4-40 0.54 0.11 0.00 0.00 3.87 0.00 0.00 0.002 0.81 0.54 0.00 0.00 0.00 0.00 0.003 0.19 1.71 0.00 0.00 0.00 0.00 0.00 0.00
4-55 1 1.67 0.11 0.00 0.00 0.00 0.00 0.002 1.29 0.05 0.00 0.00 0.00 0.00 0.00 0.003 0.53 0.00 0.09 0.00 0.00 0.00 0.00 0.00
4-70 1 1.72 0.00 1.13 0.00 6.99 0.00 0.002 3.06 0.00 1.34 0.00 0.00 0.00 0.05 0.003 0.00 0.00 0.00 0.00 0.00 0.00 0.00
5-40 1 0.00 0.11 0.00 0.00 0.00 0.00 0.00 0.002 0.16 0.00 0.00 0.00 0.00 0.00 0.003 0.00 8.56 0.00 0.00 0.00 0.00 0.00
5-55 0.00 0.00 0.38 0.00 2.37 0.00 0.05 0.002 0.00 0.00 0.48 0.00 0.00 0.00 0.003 0.00 0.00 0.84 0.00 0.00 0.00 0.00 0.00
5-70 1 0.22 0.00 0.00 0.54 0.00 3.87 0.002 5.54 0.11 0.00 0.00 0.00 0.00 0.11 0.003 0.00 0.00 0.00 0.00 0.00 0.00 0.09 0.00
LD27 1 0.00 0.38 0.00 0.00 1.34 0.00 0.002 0.16 6.56 0.00 0.00 0.00 0.00 0.00 0.003 0.00 0.00 0.00 0.00 0.00 0.00
LU12 1 0.22 0.00 0.00 0.00 0.00 0.00 0.002 2.85 8.61 0.00 0.00 0.00 0.00 0.003 0.00 0.00 0.00 0.00 0.00 0.00 0.00 0.00
Station0.00
0.16
0.00
4.300.00
14.30
0.00
0.59
0.00
0.003.49
10.00
0.00
0.00
0.00 0.00
0.000.00
Final Study Report for the Summer 2004 Bioturbation Measurement Program 28 Conducted on the Palos Verdes Shelf
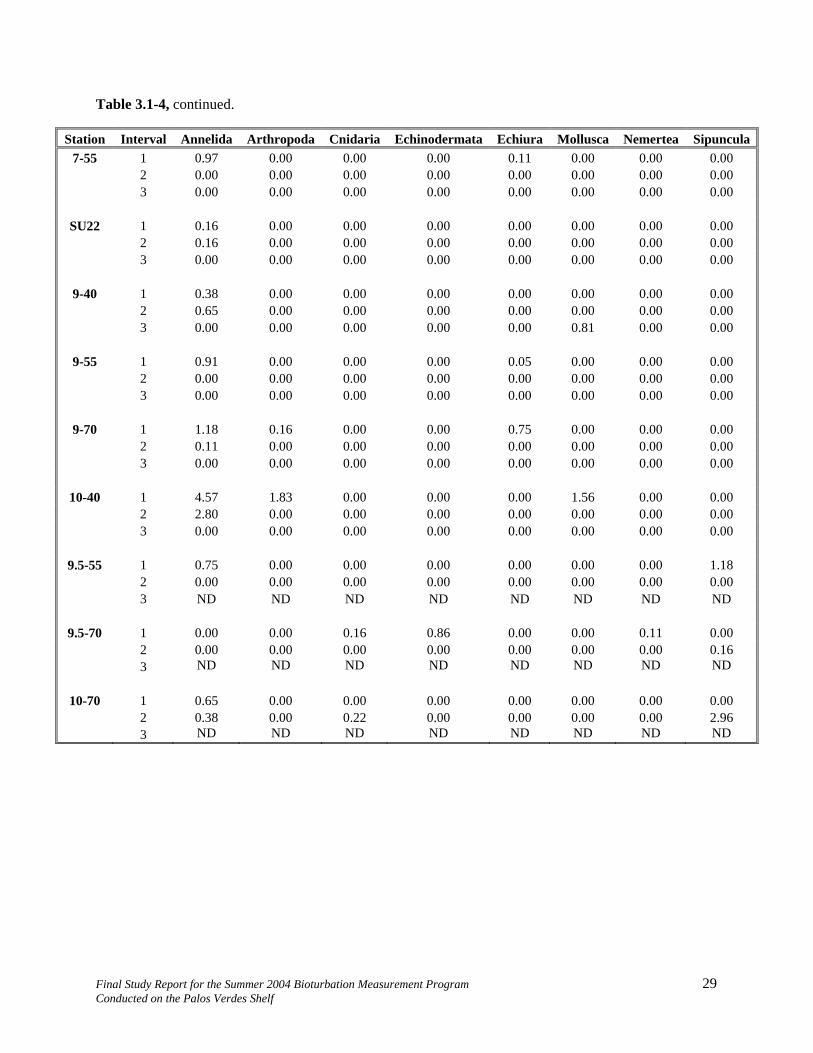
Table 3.1-4, continued.
Station Interval Annelida Arthropoda Cnidaria Echiura Mollusca Nemertea Sipuncula7-55 1 0.97 0.00 0.00 0.00 0.11 0.00 0.00 0.00
2 0.00 0.00 0.00 0.00 0.00 0.00 0.00 0.003 0.00 0.00 0.00 0.00 0.00 0.00 0.00
SU22 1 0.16 0.00 0.00 0.00 0.00 0.00 0.00 0.002 0.16 0.00 0.00 0.00 0.00 0.00 0.003 0.00 0.00 0.00 0.00 0.00 0.00
Echinodermata
0.00
0.000.00 0.00
1 0.38 0.00 0.00 0.00 0.00 0.00 0.00 0.002 0.65 0.00 0.00 0.00 0.00 0.00 0.00 0.003 0.00 0.00 0.00 0.00 0.00 0.81 0.00 0.00
1 0.91 0.00 0.00 0.00 0.05 0.00 0.00 0.002 0.00 0.00 0.00 0.00 0.00 0.00 0.00 0.003 0.00 0.00 0.00 0.00 0.00 0.00 0.00 0.00
1 1.18 0.16 0.00 0.00 0.75 0.00 0.00 0.002 0.11 0.00 0.00 0.00 0.00 0.00 0.00 0.003 0.00 0.00 0.00 0.00 0.00 0.00 0.00 0.00
1 4.57 1.83 0.00 0.00 0.00 1.56 0.00 0.002 2.80 0.00 0.00 0.00 0.00 0.00 0.00 0.003 0.00 0.00 0.00 0.00 0.00 0.00 0.00 0.00
1 0.75 0.00 0.00 0.00 0.00 0.00 0.00 1.182 0.00 0.00 0.00 0.00 0.00 0.00 0.00 0.003 ND ND ND ND ND ND ND ND
1 0.00 0.00 0.16 0.86 0.00 0.00 0.11 0.002 0.00 0.00 0.00 0.00 0.00 0.00 0.00 0.163 ND ND ND ND ND ND ND ND
1 0.65 0.00 0.00 0.00 0.00 0.00 0.00 0.002 0.38 0.00 0.22 0.00 0.00 0.00 0.00 2.963 ND ND ND ND ND ND ND ND
9-40
9-55
9-70
10-40
9.5-55
9.5-70
10-70
Final Study Report for the Summer 2004 Bioturbation Measurement Program 29 Conducted on the Palos Verdes Shelf
gastropod Sinum. Information on key species contributions to biomass is described in the following section.
3.1.2 Key Species
Key taxa from the BIO survey, based on frequency of occurrence across intervals 1 to 3, abundance, and biomass were the ghost shrimp, Neotrypaea, and the polychaete worm, Marphysa (Tables 3.1-1 and A-1). Other taxa of note included the polychaetes Glycera americana and G. capitata, Gymnonereis crosslandi, and Nereis procera; the echiuran Listriolobus pelodes; and the crab Pinnixa occidentalis, commonly co-occurring in the same samples as Neotrypaea. It is notable that the frequency of occurrence of these species was substantially higher, depending on the station, in both intervals 1 and 2 or in interval 1 alone.
Mean abundance data for ghost shrimp indicated that all the specimens were collected northwest of the outfalls, predominately at Stations 3-40, 3-55, 4-40, and 5-40, with an overall maximum of four at one station (Figure 3.1-5). No individuals were collected at any of the 70-m stations. Mean abundance data for Marphysa indicated a broader distribution, but similar predominance northwest of the outfalls, along Transects 3 and 4 (Figure 3.1-6). Station 9-70 also had relatively high abundance. The highest values forMarphysa ranged from about 5 to 8. Mean biomass data for ghost shrimp and Marphysa indicated apredictably similar distribution as observed for abundance: higher values were from stations northwest of the outfalls, but notably for Neotrypaea at Station 5-40 (interval 3) and near the center of capping cell Stations LD27 and LU12 (interval 2) (Figures 3.1-7 and 3.1-8).
Plots of mean abundance versus mean biomass for Neotrypaea and Marphysa indicated some keydifferences in the distributional characteristics of these species between the core intervals (Figures 3.1-9 and 3.1-10, respectively). Neotrypaea was mostly characterized by similar mean biomass, independent ofdepth interval and abundance. Marphysa showed a comparable pattern (i.e., non-linear) for interval 3, but a weak linear relationship for interval 2 (r2 = 0.48) and a strong relationship for interval 1 (r2 = 0.84). A similar pattern was noted for mean abundance versus mean length for the two species (Figures 3.1-11 and3.1-12, respectively), although the linear relationship for Marphysa was even stronger than noted for biomass (r2 = 0.61 for interval 2 and 0.90 for interval 1). These patterns indicate that Neotrypaea was mainly characterized by individuals of a similar range in size and weight over all three core depth intervals. Marphysa was characterized by a similar size and weight of smaller individuals in the lower interval (> 30 cm), but a much broader range in the top two intervals (< 30 cm). Patterns were not evidentfor other taxa due to the relatively few individuals that were present in the samples.
3.2 SPI AND PLAN-VIEW
Sediment-Profile Imagery
Analysis of the SPI images from the BIO stations (Figure 2.1-1) indicated that surface sediments at amajority of the stations were predominantly fine-grained, tan and gray sandy silt, with major modes of> 4 phi and 4 to 3 phi (Table B-1 and Figure B-1 series in Appendix B). The only exception was Station 3-40, which was characterized by sandier sediments (3 to 2 phi). The most common benthic habitat at these stations was classified as unconsolidated silty sediment (code UN.SI), followed by fine sand mixedwith silt (code UN.SS), and less commonly fine sand (code SA.F). This latter habitat was noted at Stations 3-40 and 10-55, located in the northwest and southeast ends of the study area, respectively. In general, mean camera penetration measurements indicated the lowest values (most compacted) at theTransect 10 stations (southeast survey area), and at Station LU12 within the LU capping cell (Table B-1).
Final Study Report for the Summer 2004 Bioturbation Measurement Program 30 Conducted on the Palos Verdes Shelf
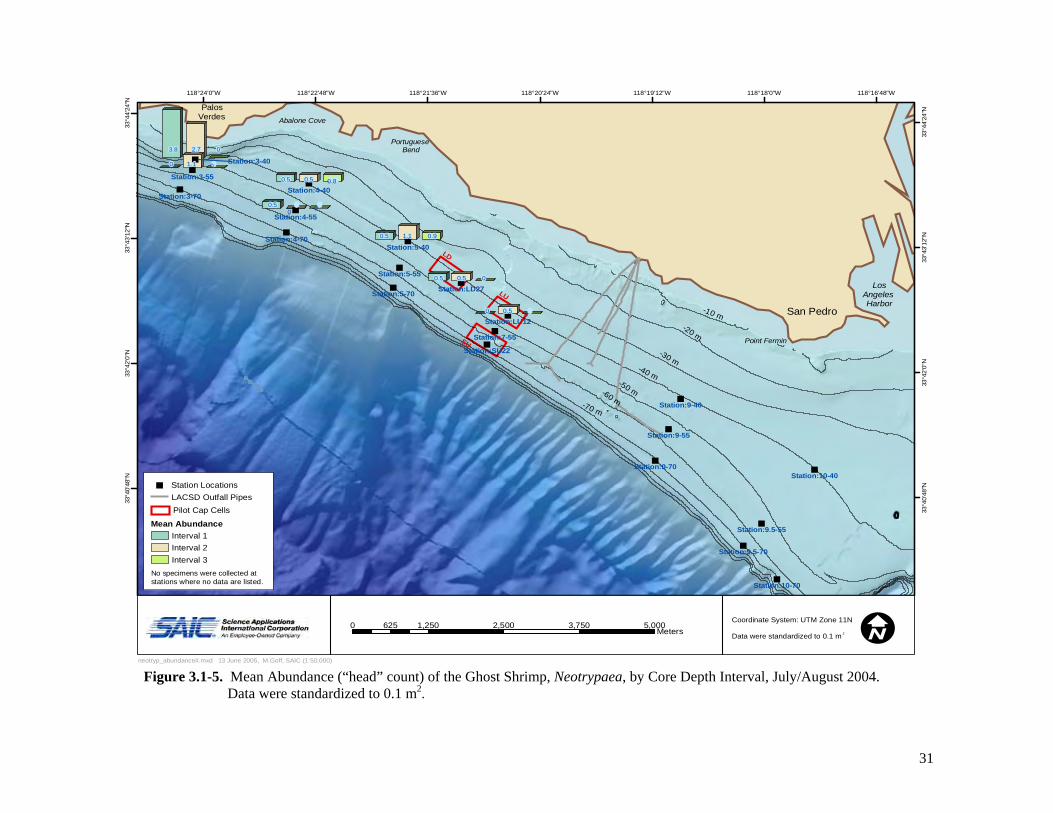
118 24'0"W 118°22'48 W 118°21'36 W 118°20 24 W 118°19 12 W 118°18'0"W 118°16'48 W
118°24'0"W 118°22'48"W 118°21'36"W 118°20'24"W 118°19'12"W 118°18'0"W 118°16'48"W
" "
" "
"
" "
"
"
"
"
"
"
"
"
"
"
"
"
"
Abalone Cove
Portuguese Bend
Los Angeles Harbor
Palos Verdes
San Pedro
Point Fermin
0 0.5 0
0.5 0 0
0 1.1 0
0.5 0.5 0
3.8 2.7 0
0.5 1.1 0.9
0.5 0.5 0.8
-10 m -20 m
-30 m-40 m
-50 m-60 m-70 m
Station:SU22
Station:LU12
Station:LD27
Station:9-70
Station:9-55
Station:9-40
Station:7-55
Station:5-70
Station:5-55
Station:5-40 Station:4-70
Station:4-55
Station:3-70
Station:3-55
Station:10-70
Station:10-40
Station:9.5-70
Station:9.5-55
Station:4-40
Station:3-40
LD
LU
SU
° " " ' " ' " "
33°4
0'48
"N
33°4
0'48
"N
33°4
2'0"
N
33°4
2'0"
N
33°4
3'12
"N
33°4
3'12
"N
33°4
4'24
"N
33°4
4'24
"N
I0 1,250 2,500 3,750 5,000 625 Meters
" Station Locations LACSD Outfall Pipes
Mean Abundance Interval 1 Interval 2 Interval 3
Pilot Cap Cells
No specimens were collected at stations where no data are listed.
Coordinate System: UTM Zone 11N
Data were standardized to 0.1 m 2
neotryp_abundance#.mxd 13 June 2005, M.Goff, SAIC (1:50,000)
Figure 3.1-5. Mean Abundance (“head” count) of the Ghost Shrimp, Neotrypaea, by Core Depth Interval, July/August 2004. Data were standardized to 0.1 m2.
31
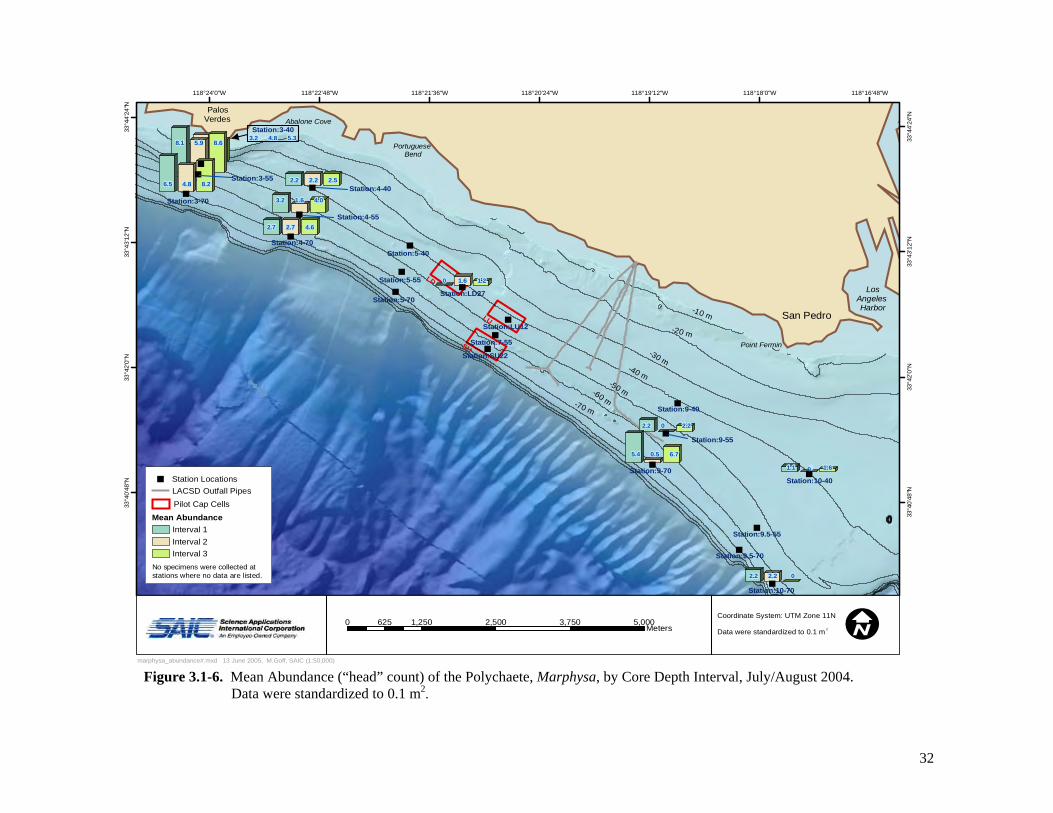
118°24'0"W 118°22'48"W 118°21'36"W 118°20'24"W 118°19'12"W 118 18'0"W 118°16 48 W
118°24'0"W 118°22'48"W 118°21'36"W 118°20'24"W 118°19'12"W 118°18'0"W 118°16'48"W
" "
" "
"
" "
"
"
"
"
"
"
"
"
"
"
"
"
"
Abalone Cove
Portuguese Bend
Los Angeles Harbor
Palos Verdes
San Pedro
Point Fermin Station:SU22
Station:LU12
Station:LD27
Station:9-70
Station:9-40
Station:7-55
Station:5-70
Station:5-40 Station:4-70
Station:3-70
Station:10-70
Station:10-40
Station:9.5-70
Station:9.5-55
Station:9-55
Station:5-55
Station:4-55
Station:4-40 Station:3-55
Station:3-40
0 1.6 1.2
2.2 0 2.2
2.2 2.2 0
1.1 0 1.6
5.4 0.5 6.7
2.7 2.7 4.6
3.2 1.6 4.0
2.2 2.2 2.5 6.5 4.8 8.2
8.1 5.9 8.6 3.2 4.8 5.3
-10 m -20 m
-30 m-40 m
-50 m-60 m-70 m
LD
LU
SU
° ' "
33°4
0'48
"N
33°4
0'48
"N
33°4
2'0"
N
33°4
2'0"
N
33°4
3'12
"N
33°4
3'12
"N
33°4
4'24
"N
33°4
4'24
"N
I0 1,250 2,500 3,750 5,000 625 Meters
" Station Locations LACSD Outfall Pipes
Mean Abundance Interval 1 Interval 2 Interval 3
Pilot Cap Cells
No specimens were collected at stations where no data are listed.
Coordinate System: UTM Zone 11N
Data were standardized to 0.1 m 2
marphysa_abundance#.mxd 13 June 2005, M.Goff, SAIC (1:50,000)
Figure 3.1-6. Mean Abundance (“head” count) of the Polychaete, Marphysa, by Core Depth Interval, July/August 2004. Data were standardized to 0.1 m2.
32
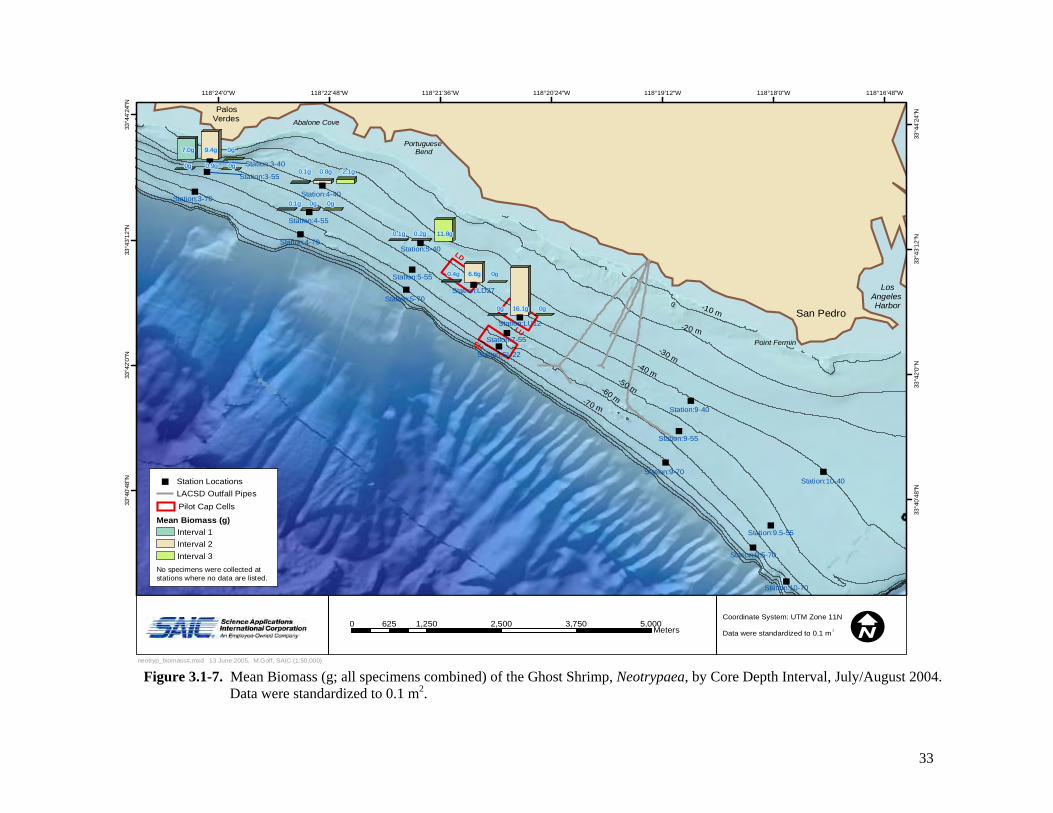
118°24'0"W 118°22'48"W 118°21 36 W 118°20 24 W 118°19'12 W 118 18 0"W 118 16 48"W
118°24'0"W 118°22'48"W 118°21'36"W 118°20'24"W 118°19'12"W 118°18'0"W 118°16'48"W
" "
" "
"
" "
"
"
"
"
"
"
"
"
"
"
"
"
"
Abalone Cove
Portuguese Bend
Los Angeles Harbor
Palos Verdes
San Pedro
Point Fermin
0.1g 0g 0g
0g 0.9g 0g
0g 16.1g 0g
0.4g 6.6g 0g
7.0g 9.4g 0g
0.1g 0.8g 2.1g
0.1g 0.2g 11.8g
-10 m -20 m
-30 m-40 m
-50 m-60 m-70 m
St
55
LD
LU SU
ation:SU22
Station:LD27
Station:9-70
Station:9-55
Station:9-40
Station:5-70
Station:5-55
Station:5-40 Station:4-70
Station:4-55
Station:4-40 Station:3-70
Station:10-70
Station:9.5-70
Station:9.5-55
Station:LU12
Station:7
Station:3-55
Station:3-40
Station:10-40
' " ' " " ° ' ° '
33°4
0'48
"N
33°4
0'48
"N
33°4
2'0"
N
33°4
2'0"
N
33°4
3'12
"N
33°4
3'12
"N
33°4
4'24
"N
33°4
4'24
"N
I0 1,250 2,500 3,750 5,000 625 Meters
" Station Locations LACSD Outfall Pipes Pilot Cap Cells
No specimens were collected at stations where no data are listed.
Mean Biomass (g) Interval 1 Interval 2 Interval 3
Coordinate System: UTM Zone 11N
Data were standardized to 0.1 m 2
neotryp_biomass#.mxd 13 June 2005, M.Goff, SAIC (1:50,000)
Figure 3.1-7. Mean Biomass (g; all specimens combined) of the Ghost Shrimp, Neotrypaea, by Core Depth Interval, July/August 2004. Data were standardized to 0.1 m2.
33
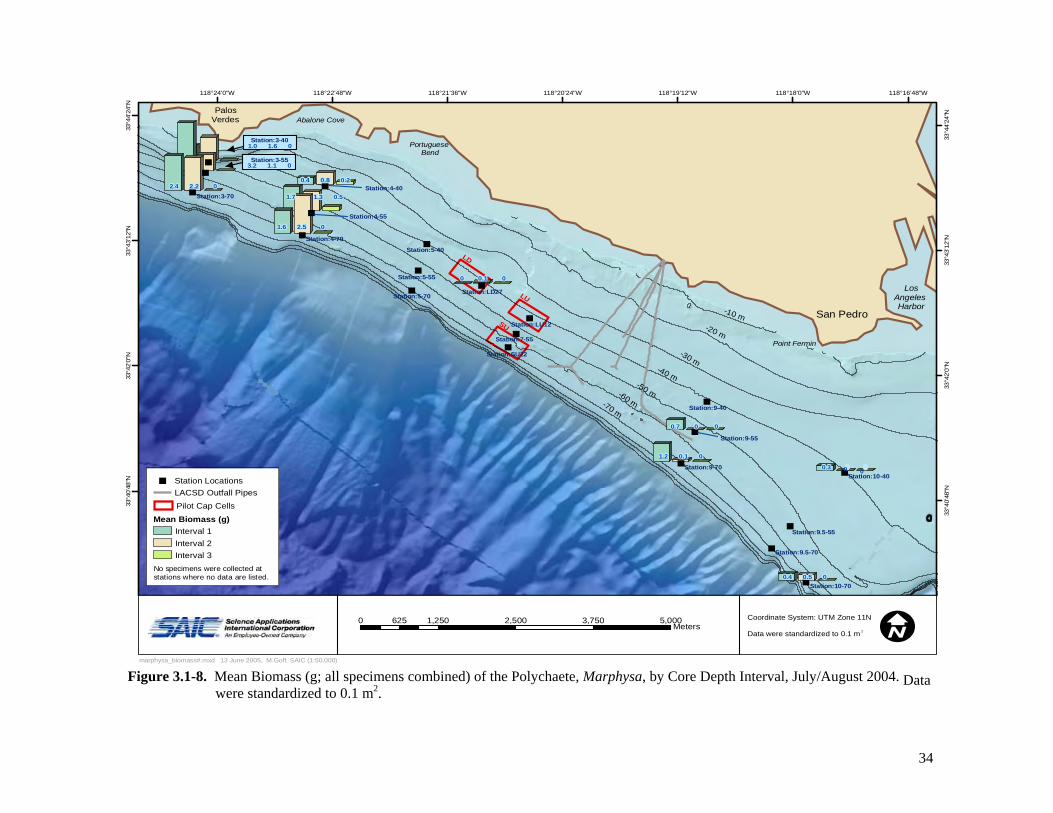
118°24'0"W 118°22'48 W 118°21'36 W 118°20'24"W 118°19'12"W 118°18'0"W 118°16'48"W
118°24'0"W 118°22'48"W 118°21'36"W 118°20'24"W 118°19'12"W 118°18'0"W 118°16'48"W
" "
" "
"
" "
"
"
"
"
"
"
"
"
"
"
"
"
"
Abalone Cove
Portuguese Bend
Los Angeles Harbor
Palos Verdes
San Pedro
Point Fermin
0 0.1 0
0.7 0 0
0.3 0 0
1.2 0.1 0
1.6 2.5 0
2.4 2.2 0
3.2 1.1 0
1.0 1.6 0
0.4 0.5 0
1.7 1.3 0.5
0.4 0.8 0.2
Station:SU22
Station:LU12
Station:LD27
Station:9-70
Station:9-40
Station:7-55
Station:5-70
Station:5-40
Station:4-70
Station:3-70
Station:3-55
Station:10-70
Station:10-40
Station:9.5-70
Station:9.5-55
Station:9-55
Station:5-55
Station:4-55
Station:4-40
Station:3-40
-10 m-20 m
-30 m-40 m
-50 m-60 m-70 m
LD
LU
SU
" "
33°4
0'48
"N
33°4
0'48
"N
33°4
2'0"
N
33°4
2'0"
N
33°4
3'12
"N
33°4
3'12
"N
33°4
4'24
"N
33°4
4'24
"N
I0 1,250 2,500 3,750 5,000625 Meters
" Station Locations LACSD Outfall Pipes Pilot Cap Cells
No specimens were collected at stations where no data are listed.
Mean Biomass (g) Interval 1 Interval 2 Interval 3
Coordinate System: UTM Zone 11N
Data were standardized to 0.1 m 2
marphysa_biomass#.mxd 13 June 2005, M.Goff, SAIC (1:50,000)
Figure 3.1-8. Mean Biomass (g; all specimens combined) of the Polychaete, Marphysa, by Core Depth Interval, July/August 2004. Data were standardized to 0.1 m2.
34
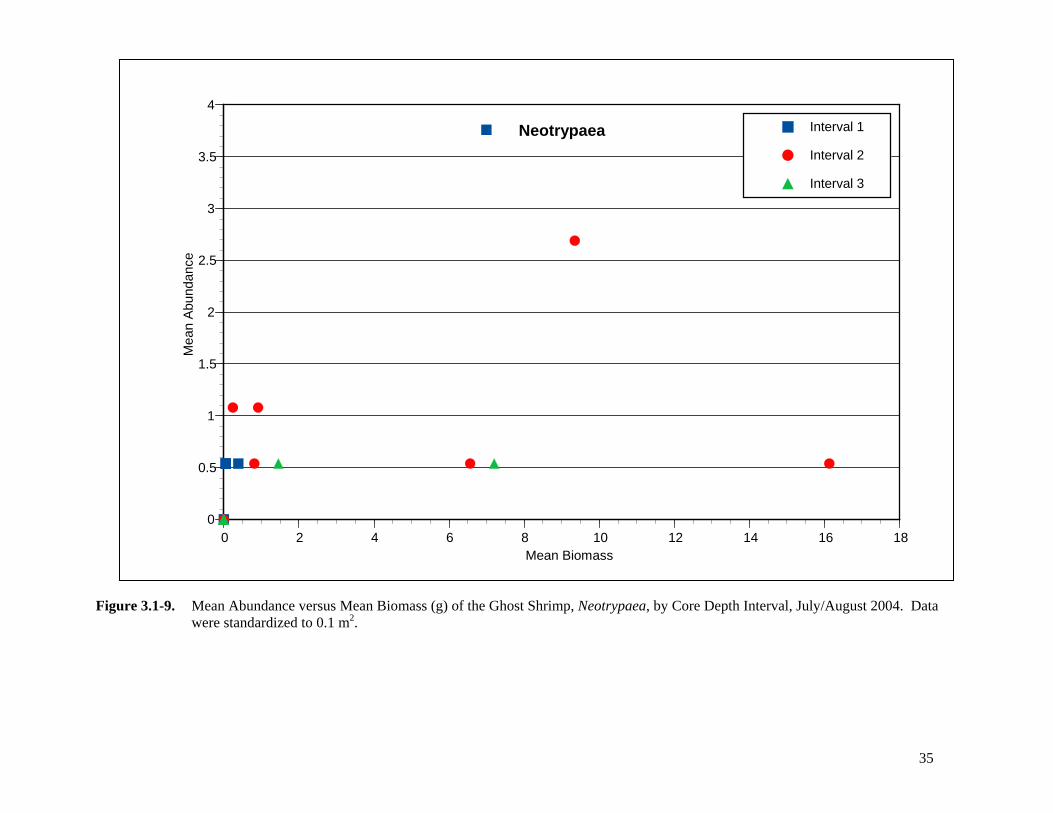
Figure 3.1-9. Mean Abundance versus Mean Biomass (g) of the Ghost Shrimp, Neotrypaea, by Core Depth Interval, July/August 2004. Data were standardized to 0.1 m2.
0
0.5
1
1.5
2
2.5
3
3.5
4
0 2 4 6 8 10 12 14 16 18
Mea
n Ab
unda
nce
Mean Biomass
Interval 1
Interval 2
Interval 3
Neotrypaea
35
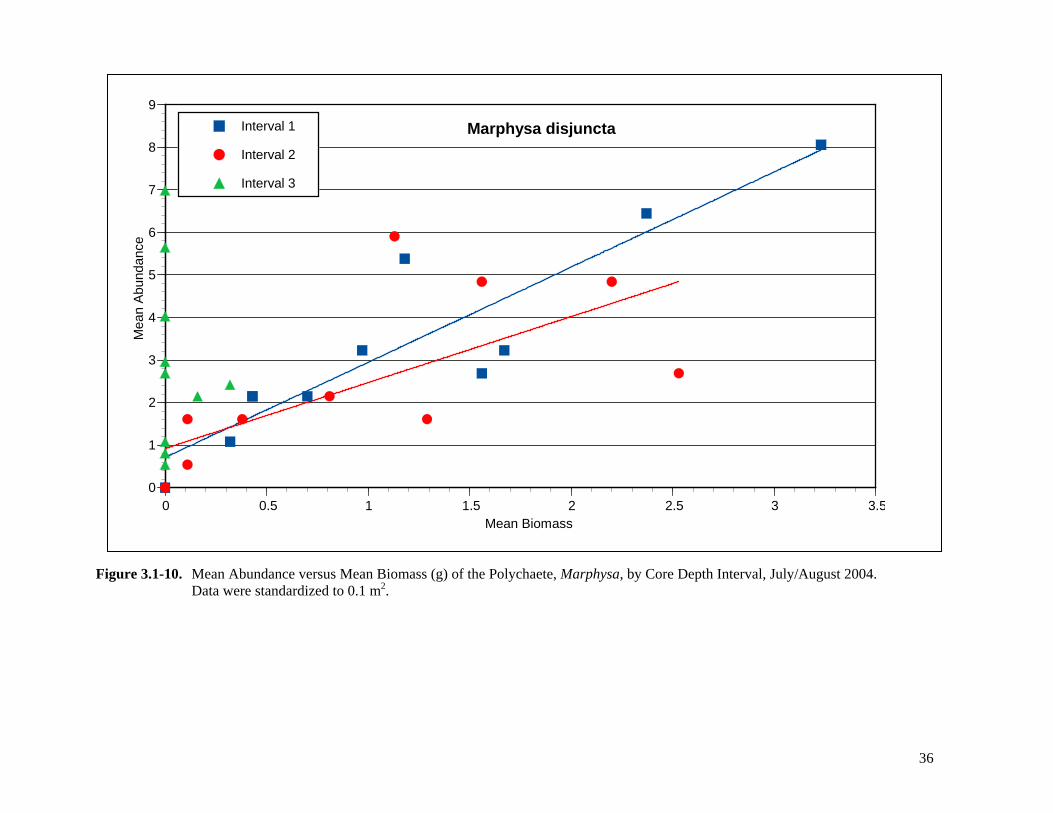
Figure 3.1-10. Mean Abundance versus Mean Biomass (g) of the Polychaete, Marphysa, by Core Depth Interval, July/August 2004.Data were standardized to 0.1 m2.
0
1
2
3
4
5
6
7
8
9
0 0.5 1 1.5 2 2.5 3 3.5
Mea
n Ab
unda
nce
Mean Biomass
Interval 1
Interval 2
Interval 3
Marphysa disjuncta
36
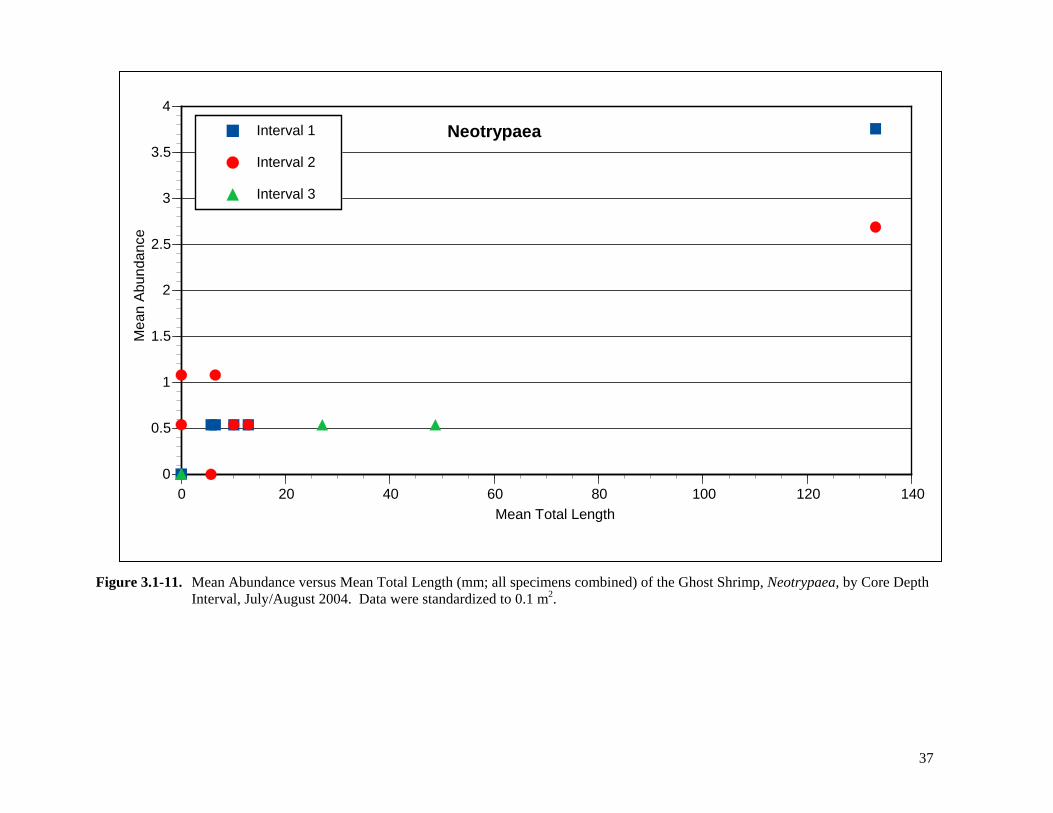
Figure 3.1-11. Mean Abundance versus Mean Total Length (mm; all specimens combined) of the Ghost Shrimp, Neotrypaea, by Core Depth Interval, July/August 2004. Data were standardized to 0.1 m2.
0
0.5
1
1.5
2
2.5
3
3.5
4
0 20 40 60 80 100 120 140
Mea
n Ab
unda
nce
Mean Total Length
Interval 1
Interval 2
Interval 3
Neotrypaea
37
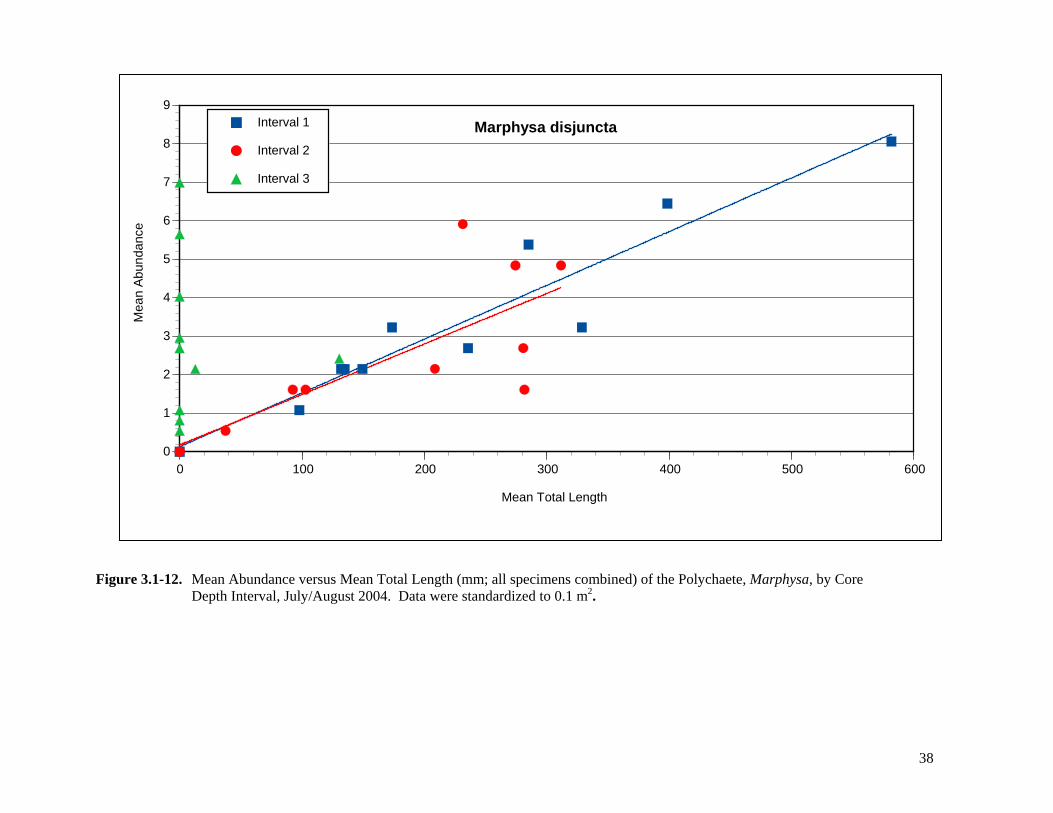
Figure 3.1-12. Mean Abundance versus Mean Total Length (mm; all specimens combined) of the Polychaete, Marphysa, by Core Depth Interval, July/August 2004. Data were standardized to 0.1 m2.
0
1
2
3
4
5
6
7
8
9
0 100 200 300 400 500 600
Mea
n Ab
unda
nce
Mean Total Length
Interval 1
Interval 2
Interval 3
Marphysa disjuncta
38
Three parameters were used to assess overall benthic habitat quality within the survey area: RPD depth, infaunal successional status, and OSI, as described in Section 2.3.1. The RPD depth measured in each image provided an estimate of the apparent depth of oxygen penetration into the surface sediment. MeanRPD depths in the study area were moderately deep, with the majority of the stations characterized byvalues between approximately 2.0 and 4.0 cm (Table B-1 and Figure B-1 series). The only exception wasa value of 1.28 cm at Station 9-40. None of the images showed any evidence of low dissolved oxygen conditions or methane gas entrained within the sediment.
The successional stage results are consistent with high mean OSI values such as 9 to 11 (Table B-1) overthe majority of the stations. Bioturbation by this community has served to irrigate and aerate the surfacesediments, resulting in RPD depths that generally exceeded 2 cm across the survey area, with evidence ofburrowing and feeding voids at least down to the approximately 10- to 20-cm SPI camera penetration depths achieved for the survey (Figure B-1 series). However, although the OSI provides a useful indicator of the relative benthic health of near-surface sediments across the PV Shelf, this index by itselfcannot be used to make broader inferences about the longer-term sediment contamination concerns thatpresently exist. Lower OSI values (e.g., 3 to 6) were observed at stations that were characterized by relatively compacted sediments and/or fine sand habitats or low mean apparent RPD, along Transect 10and at Stations 3-40 and LU12.
Plan-View Images
Based on the collective plan-view image results, and consistent with the SPI data, the study area wasmostly composed of soft, fine-grained sediments consisting of a mixture of silts/clays and fine sand (Table B-2 and Figure B-1 series). Exceptions were medium-to-fine sand at Stations 3-40 and 9-55. Changes in surface topography were usually due to physical features such as shell material or bedforms(sand ripples). In the plan-view images, the majority of the BIO stations contained some shell material (e.g., shell hash). Bedforms (sand ripples) generally occur in high-energy environments and were only observed at two of the 40-m BIO stations (4-40 and 5-40; Table B-2).
The majority of the BIO stations (14 of 19) contained no to relatively few (0 to 10) burrows (Table B-2 and Figure B-1 series). The five stations with the highest number of burrows were located to thenorthwest of the LACSD outfalls at relatively deeper depths (Stations 3-70, 4-70, 5-55, 5-70, and 7-55), all characterized by SPI results as occurring in areas of unconsolidated silty sediment (Table B-1).Invertebrates observed in the plan-view images included tube worms, sea cucumbers, sea pens, seastars, and brittle stars (Table B-2 and Figure B-1 series).
Infaunal successional status indicated the presence of an advanced benthic community across most of thestudy area. Stage I polychaetes were observed at the sediment surface together with Stage III feeding voids at depth (Stage I on III successional status) at the majority of the stations (Table B-1 and Figure B-1 series). Exceptions included Stage I-only conditions at most of the same stations characterized byrelatively compacted sediments and/or habitats types coded as fine sand (e.g., along Transect 10 and at Stations 3-40 and LU12), or low mean RPD (Station 9-40). Evidence of Stage III activity included active feeding voids produced by head-down, deposit-feeding infauna in the subsurface sediments, as well aserrant polychaetes within the sediment matrix (Figure B-1 series). When present, Stage III organisms were accompanied by Stage I polychaetes at each BIO station. This relationship is typical of productiveseafloor areas receiving relatively high inputs of organic matter, sufficient to maintain a diverse benthic population of both suspension- and deposit-feeders.
Final Study Report for the Summer 2004 Bioturbation Measurement Program 39 Conducted on the Palos Verdes Shelf
Profiles of excess thorium-234 to evaluate sediment mixing/bioturbation rates were measured for 11 cores from six stations (Figures 3.3-2 and 3.3-3 and Table C-2). In general, surface activities ranged from 3to12 disintegrations per minute per gram (dpm/g). Excess thorium-234 did not extend below 6 cm, and the log-linear plots of activity with depth yielded straight lines, indicative of biodiffusive mixing. Model fits permitted estimates of the vertical biodiffusivity, Db, at most of the stations. These values rangedfrom 3 to 23 cm2/yr (Figure 3.3-3), with an average mixing intensity of 13 ± 6 cm2/yr (n=9). This value was low compared to a mean value of 37 ± 23 cm2/yr (n=9) measured in 1992 and 1993 at LACSD stations 3C and 6C (Wheatcroft and Martin 1996).
Biodiffusivities also were estimated for an additional 15 cores from nine stations using the method ofAller et al. (1980) and employed by Wheatcroft and Martin (1996). This approach assumes biodiffusive mixing and uses the ratio of excess thorium-234 in the 0-1 and 0-5 cm depth intervals to estimate Db(Table C-3). Using this approach, the biodiffusivity values ranged from 1 to 89 cm2/yr, although most values were in the range of 5 to 25 cm2/yr (Figure 3.3-2). Note in the figure that the thorium and leaddata are distinguished using different color histogram bars and the data scales are different to better display this information. Values estimated for replicate cores varied considerably among the samplinglocations. At some stations, biodiffusivity values differed by up to one order of magnitude. The agreement between replicate values using the gradient method (e.g., Station L4-NW22 -A and -B) typically was better than results from the comparison method (e.g., Station L3_NW8 -B and -Z). The highest mixing intensities were in the northwest portion of the study area, and there was a progressive decrease toward the outfall region (Figure 3.3-2). Comparisons of biodiffusivities estimated from theprofile and “comparison” data sets yielded average biodiffusivities of 19 ± 21 cm2/yr (n=24) for thepresent survey versus 31 ± 20 cm2/yr (n=21) for the 1992/1993 results. Considering the large degree of variability, the present mixing intensity on the PV Shelf based on all thorium-234 data was roughlycomparable to values measured a decade earlier.
3.3 SEDIMENT MIXING AND BIOTURBATION RATES
Profiles of excess lead-210 were used to determine sediment accumulation rates at four stations (Figures3.3-1 and 3.3-2). The profiles were characterized by regions of high and nearly constant activityunderlain by regions of exponentially decreasing activity (Figure 3.3-1 and Table C-1 in Appendix C).The results provided a context for sediment mixing and bioturbation rate estimates using thorium-234, as presented below. The upper lead-210 profile region, which ranged in thickness from roughly 10 cm (9.5 55F) to > 50 cm (L5NW45C), probably reflected a combination of physical and biological mixing and non-steady fluxes of lead-210. Sediment accumulation rates ranged from 0.8 to 1.6 mm/yr in three ofthe four profiles. Sedimentation rates could not be determined from the L5NW45C profile because thedown-core activity of lead-210 was nearly uniform; this was likely due to a non-steady flux of lead-210(higher fluxes occurred during the 1960 to 1980 period due to the elevated mass flux from the JWPCP outfalls and the Portugese Bend landslide). These values were consistent with previous measurements ofsedimentation rates on the Palos Verdes (Wheatcroft and Martin 1994) and Santa Monica margins (Alexander and Venherm 2003) using lead-210 geochronology. There was some indication that the sediment accumulation rate was relatively lower in the southeast portion of the study area (Figure 3.3-2), although this may have been a relative pattern that reflected the addition of outfall-derived solids to the northwest. These conclusions were somewhat limited because the profiles were based on a small numberof data points.
Final Study Report for the Summer 2004 Bioturbation Measurement Program 40 Conducted on the Palos Verdes Shelf
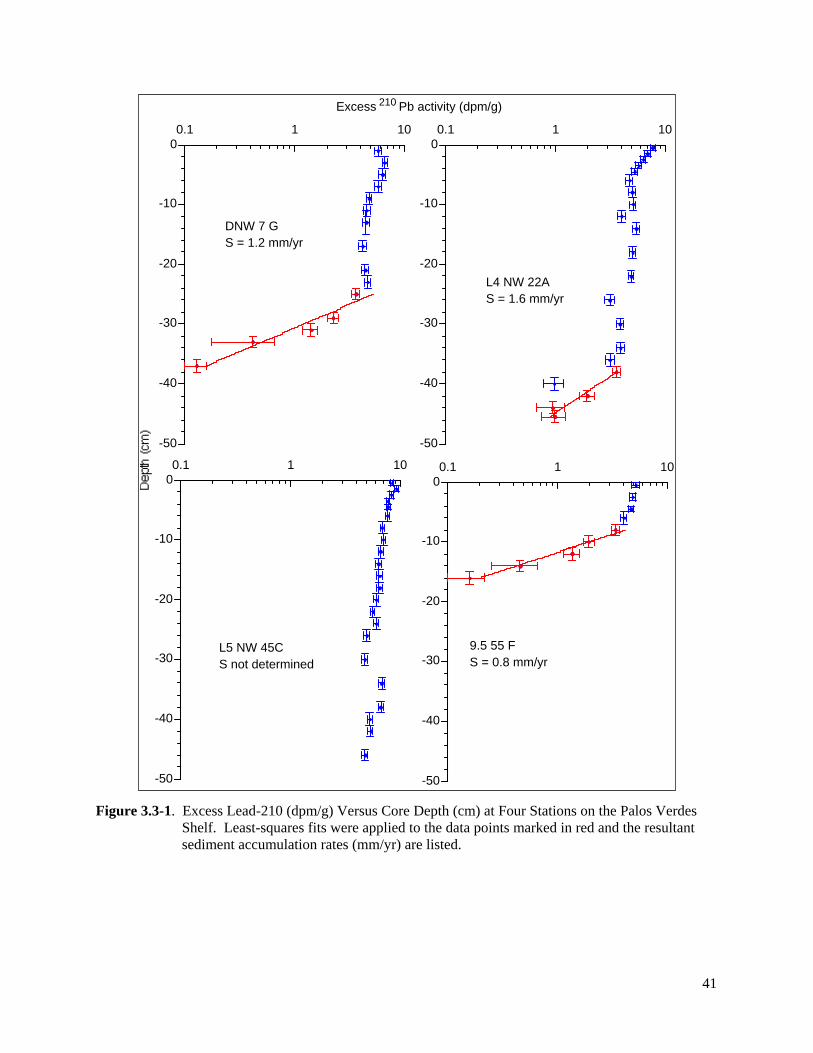
Figure 3.3-1. Excess Lead-210 (dpm/g) Versus Core Depth (cm) at Four Stations on the Palos Verdes Shelf. Least-squares fits were applied to the data points marked in red and the resultant sediment accumulation rates (mm/yr) are listed.
-50
-40
-30
-20
-10
00.1 1 10
9.5 55 FS = 0.8 mm/yr
-50
-40
-30
-20
-10
00.1 1 10
L5 NW 45CS not determined
-50
-40
-30
-20
-10
00.1 1 10
L4 NW 22AS = 1.6 mm/yr
-50
-40
-30
-20
-10
00.1 1 10
DNW 7 GS = 1.2 mm/yr
Excess 210 Pb activity (dpm/g)
41
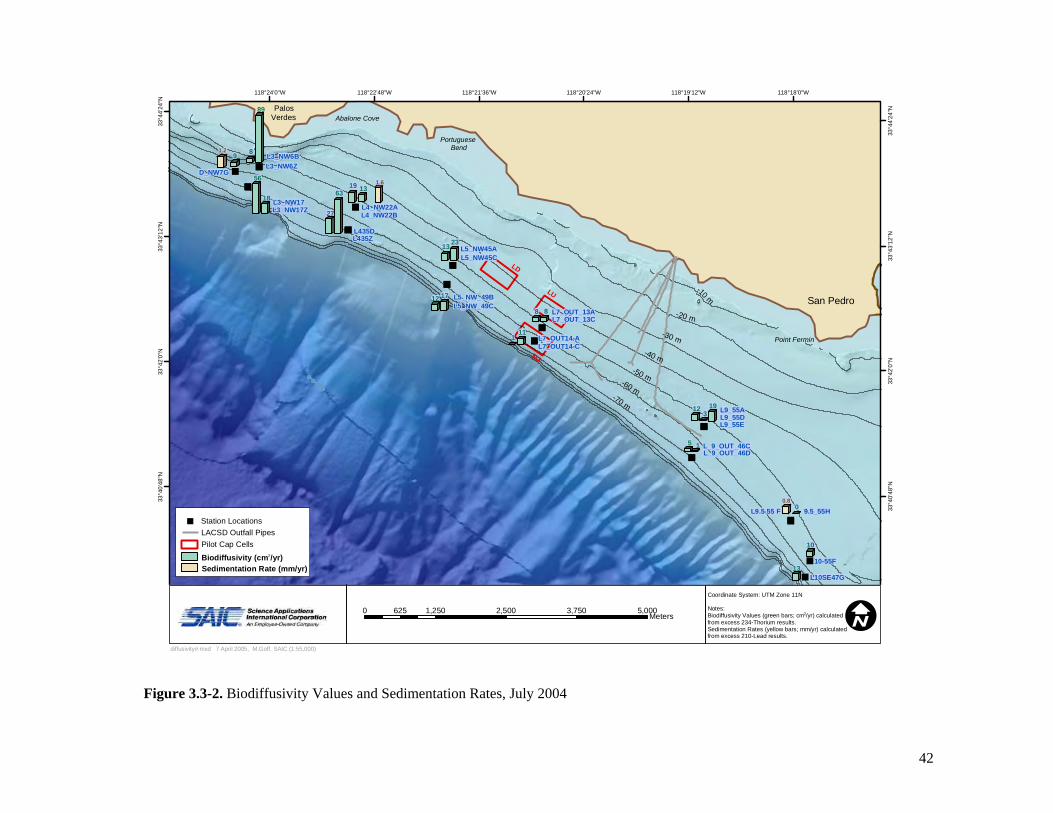
118°24'0 W 118°22'48"W 118°21'36"W 118 20'24"W 118°19'12 W 118°18'0"W
118°24'0"W 118°22'48"W 118°21'36"W 118°20'24"W 118°19'12"W 118°18'0"W
" ""
""
""
""
""
""
""
""
""
"""
"
"
""
Palos Verdes Abalone Cove
Portuguese Bend
Point Fermin
San Pedro A-10 m
-20 m
-30 m -40 m
-50 m
-70 m
-60 m
L435Z
10-55F
L9_55E
D_NW7G
9.5_55H
L3_NW17
L10SE47G
L5_NW45C
L4_NW22B
L5_NW_49C
L7_OUT14-C
L7_OUT_13C
L_9_OUT_46D
L435D
L9_55D L9_55A
L3_NW6Z L3_NW6B
L5_NW45A
L4_NW22AL3_NW17Z
L9.5 55 F
L5_NW_49B
L7_OUT14-A
L7_OUT_13A
L_9_OUT_46C
3
1
1
8
89
13
10
17
23
1363
56
89
0
5
8
1912
11
12
13
19
27
18
0.8
1.6
1.2
LD
LU
SU
" ° "
33°4
0'48
"N
33°4
0'48
"N
33°4
2'0"
N
33°4
2'0"
N
33°4
3'12
"N
33°4
3'12
"N
33°4
4'24
"N
33°4
4'24
"N
0 1,250 2,500 3,750 5,000625 Meters I
Coordinate System: UTM Zone 11N
Notes: Biodiffusivity Values (green bars; cm /yr) calculated from excess 234-Thorium results. Sedimentation Rates (yellow bars; mm/yr) calculated from excess 210-Lead results.
2
" Station Locations
Biodiffusivity (cm /yr) Sedimentation Rate (mm/yr)
2
LACSD Outfall Pipes Pilot Cap Cells
diffusivity#.mxd 7 April 2005, M.Goff, SAIC (1:55,000)
Figure 3.3-2. Biodiffusivity Values and Sedimentation Rates, July 2004
42
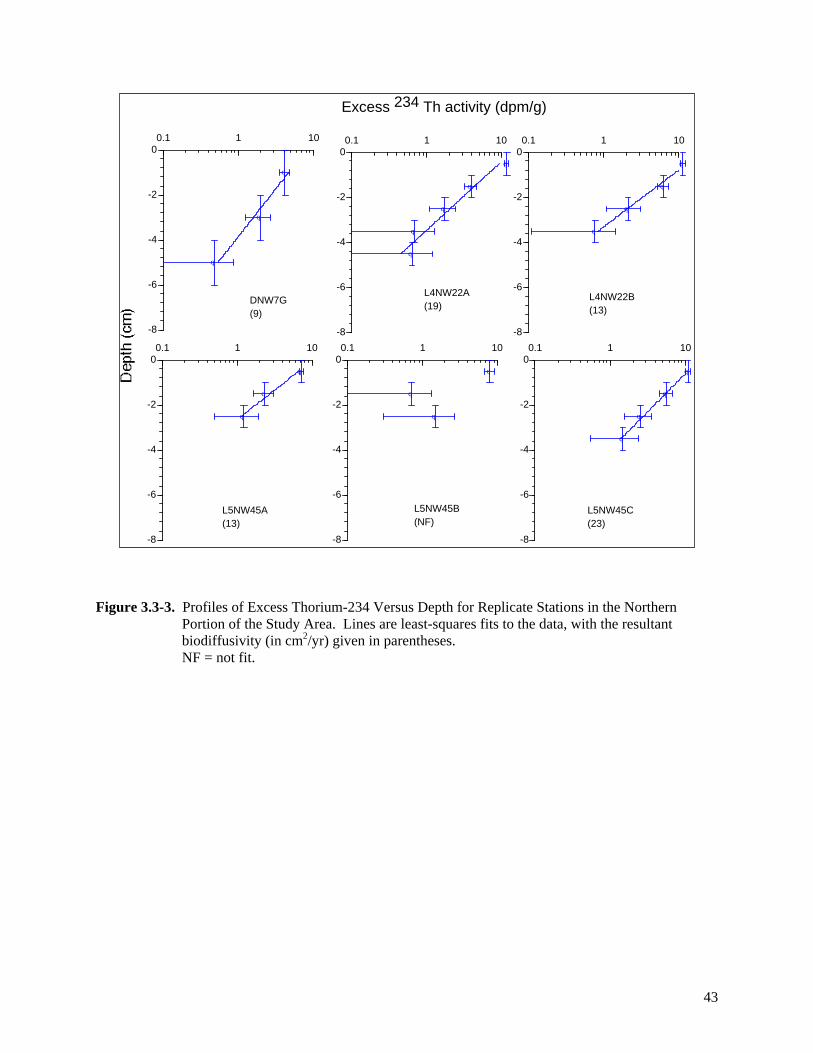
q
q
q
-8
-6
-4
-2
0 0.1 1 10
L5NW45A (13)
q
q
q
-8
-6
-4
-2
0 0.1 1 10
L5NW45B (NF)
q
q
q
q
-8
-6
-4
-2
0 0.1 1 10
Excess 234 Th activity (dpm/g)
q
q
q
q
q
-8
-6
-4
-2
0 0.1 1 10
L4NW22A (19)
q
q
q
q
-8
-6
-4
-2
0 0.1 1 10
L4NW22B (13)
q
q
q
-8
-6
-4
-2
0 0.1 1 10
DNW7G (9)
L5NW45C (23)
Figure 3.3-3. Profiles of Excess Thorium-234 Versus Depth for Replicate Stations in the Northern Portion of the Study Area. Lines are least-squares fits to the data, with the resultant biodiffusivity (in cm2/yr) given in parentheses. NF = not fit.
43

q
q
q
q
q
-8
-6
-4
-2
00.1 1 10
L9 55 A(12)
q
q
q
-8
-6
-4
-2
00.1 1 10
L955D(3)
q
q
q
q
-8
-6
-4
-2
00.1 1 10
L955E(19)
q
q
q
-8
-6
-4
-2
00.1 1 10
L9.5 55 H(NF)
q
q
q
q
-8
-6
-4
-2
00.1 1 10
L10 55 F(10)
Excess 234Th activity (dpm/g)
Figure 3.3-3(cont.). Profiles of Excess Thorium-234 Versus Depth for Replicate Stations in the SouPortion of the Study Area. Lines are least-squares fits to the data, with the resubiodiffusivity (in cm2/yr) given in parentheNF = n
thernltant
ses.ot fit.
44
3.4
)
im(30 m with
3.5
chdeter
tsp
LACSD INFAUNAL DATA
LACSD total abundance and biomass data from summer 2003 are presented in Figures 3.4-1 and 3.4-2,respectively. Principle patterns include higher abundance at the shallow (30 m) and mid-depth (60 mstations along most transects, and the highest values (e.g., over 1,000 individuals/0.1 m2) near and
mediately northwest and southeast of the outfalls. High abundance was also observed at Station 3D) located in the northwest part of the survey area. Similar patterns were observed for biomass,
the highest values ranging from about 15-43 g/0.1 m2.
BIOTURBATION LITERATURE SEARCH
Results from the literature search are presented in Table A-2 of Appendix A. In general, the searmined that there was insufficient data, particularly for common BIO collected on the PV Shelf or for
related taxa, to allow extrapolations of bioturbation rates. The most significant information related toburrow depths of ghost shrimp (e.g., up to 2-m depths for Callianassa; now Neotrypaea) and reworking rates of several hundred cubic centimeters/day for Callianassa and various polychaetes. These resulprovided additional documentation of bioturbation potential. However, even for the ghost shrimquantitative information on specimen size (e.g., length or weight) was insufficiently presented to enable meaningful extrapolations to the 2004 BIO data.
Final Study Report for the Summer 2004 Bioturbation Measurement Program 45 Conducted on the Palos Verdes Shelf
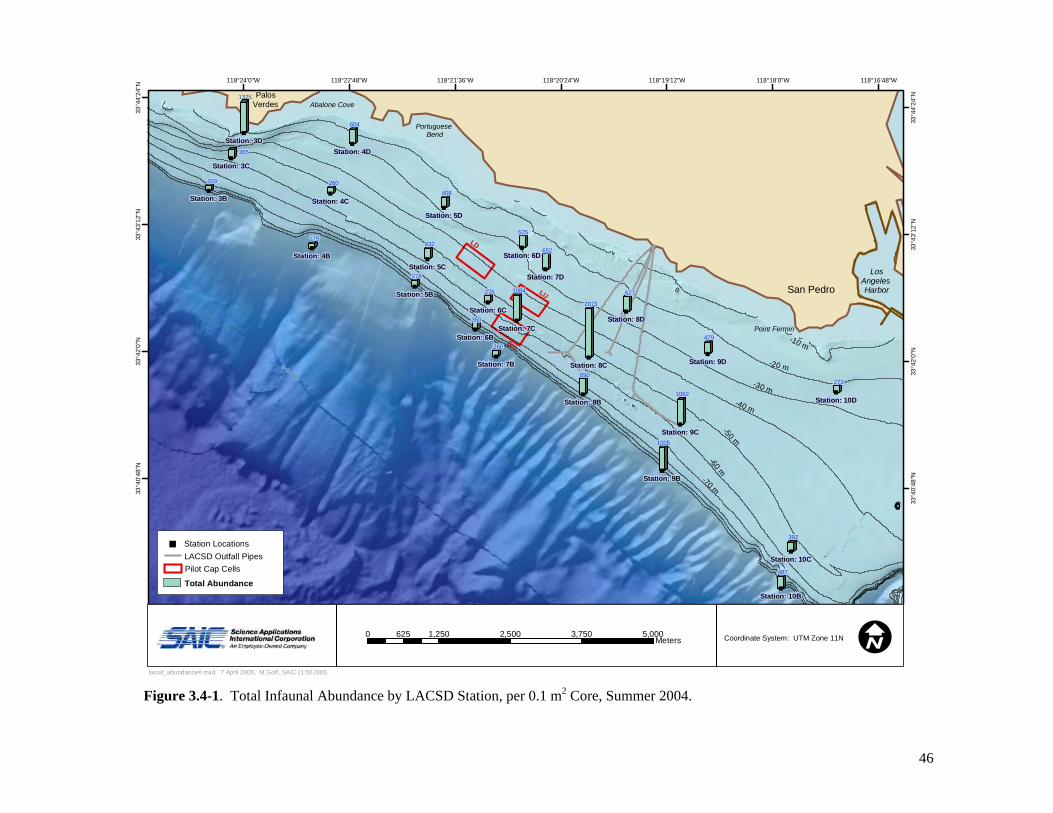
118°24'0"W 118°22'48"W 118°21'36"W 118°20'24"W 118°19'12 W 118°18'0"W 118°16'48"W
118°24'0"W 118°22'48"W 118°21'36"W 118°20'24"W 118°19'12"W 118°18'0"W 118°16'48"W
"
"
"
"
"
"
"
"
"
"
"
"
"
"
"
"
"
"
Palos Verdes Abalone Cove
Portuguese Bend
Point Fer
"
"
"
"
"
"
min
San Pedro
Los Angeles Harbor
273
392
487
479
627
690
652
260
525
276
350
408
432
278
604
260
179
365
203
1062
1005
2073
1084
1325
-20
0 m -40 m
-50 m
m
LD
LU
SU -10 m
m
-3
-70 m
-60
Station: 9D
Station: 9C
Station: 9B
Station: 8D
Station: 8B
Station: 7D
Station: 7C
Station: 7B
Station: 6C
Station: 5D
Station: 5B
Station: 4D
Station: 4C
Station: 4B
Station: 3D
Station: 3C
Station: 3B
Station: 10D
Station: 10C
Station: 10B
Station: 8C
Station: 6D
Station: 6B
Station: 5C
"
33°4
0'48
"N
33°4
0'48
"N
33°4
2'0"
N
33°4
2'0"
N
33°4
3'12
"N
33°4
3'12
"N
33°4
4'24
"N
33°4
4'24
"N
0 1,250 2,500 3,750 625 5,000Meters ICoordinate System: UTM Zone 11N
" Station Locations
Total Abundance
LACSD Outfall Pipes Pilot Cap Cells
lacsd_abundance#.mxd 7 April 2005, M.Goff, SAIC (1:55,000)
Figure 3.4-1. Total Infaunal Abundance by LACSD Station, per 0.1 m2 Core, Summer 2004.
46
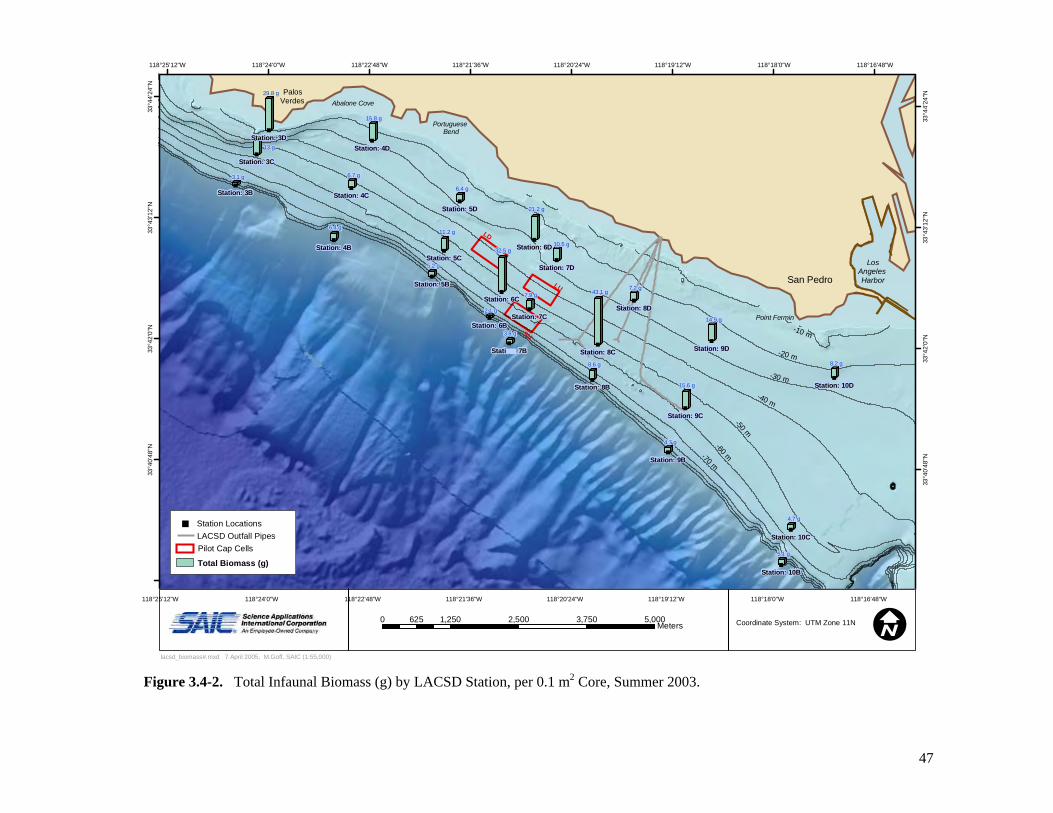
"
"
"
"
"
"
"
"
"
"
"
"
"
on:
"
"
"
"
"
"
"
"
"
"
"
Palos Verdes Abalone Cove
PortugueseBend
Point Fermin
San Pedro
LosAngeles Harbor
13 g
8.2 g
4.7 g
5.1 g
4.7 g
7.2 g
8.6 g
7.9 g
3.8 g
2.1 g
6.4 g
5.2 g
6.7 g
6.4 g
3.1 g
14.9 g
15.6 g
43.1 g
10.5 g
21.2 g
32.5 g
11.2 g
15.8 g
29.8 g
-10 m
-20 m
-30 m
-40 m
-50 m
-60 m-70 m
LD
LU
SU
Station: 9D
Station: 9C
Station: 9B
Station: 8D
Station: 8C
Station: 8B
Station: 7D
Station: 7C
Stati 7B
Station: 6C
Station: 5D
Station: 5B
Station: 4D
Station: 4C
Station: 4B
Station: 3D
Station: 3C
Station: 3B
Station: 10D
Station: 10C
Station: 10B
Station: 6D
Station: 6B
Station: 5C
118°25'12"W
118°25'12"W
118°24'0"W
118°24'0"W
118°22'48"W
118°22'48"W
118°21'36"W
118°21'36"W
118°20'24"W
118°20'24"W
118°19'12"W
118°19'12"W
118°18'0"W
118°18'0"W
118°16'48"W
118°16'48"W
33°4
0'48
"N
33°4
0'48
"N
33°4
2'0"
N
33°4
2'0"
N
33°4
3'12
"N
33°4
3'12
"N
33°4
4'24
"N
33°4
4'24
"N
0 1,250 2,500 3,750 5,000625Meters
lacsd_biomass#.mxd 7 April 2005, M.Goff, SAIC (1:55,000)
ICoordinate System: UTM Zone 11N
" Station Locations
Total Biomass (g)
LACSD Outfall PipesPilot Cap Cells
Figure 3.4-2. Total Infaunal Biomass (g) by LACSD Station, per 0.1 m2 Core, Summer 2003.
47

4.0 DISCUSSION
The 2004 Bioturbation Assessment Study involved the collection, identification, and enumeration of BIO on the PV Shelf to characterize spatial patterns of potential sediment mixing due to biotur bation. Acompanion task measured short- and long-lived radionuclides (thorium-234 and lead-210) in a series of sediment cores to characterize biodiffusion and sedimentation rates, respectively. For these tasks, Tables 4.1-1 and 4.1-2 provide respective summaries, modified from the IWP to provide post-survey and analysis information on: (1) objectives completed in support of Question FS-7, (2) study optim ization measures, and (3) how limits on decision errors were addressed for this study element. These data indicate that the IWP specifications were met or exceeded for the various elements. Results fro m this study were sufficient to characterize the types, abundance, and size of BIO, as well as rates of biodiffusive mixing throughout the PV Shelf area that will be considered for capping. Lead 210 data provided general information on sedimentation rates.
The movement, burrowing, tube-building, and deposit-feeding activities of organisms living in or on bottom sediments cause mixing of the seabed (Drake 1994). These activities can displace particles and any associated contaminants in vertical and horizontal directions, thereby altering sediment characteristics, such as texture, composition, and vertical structure within the sediment column . Time-averaged bioturbation typically is considered a diffusive process over a depth at which biological m ixing occurs (Swift et al. 1996). Biodiffusion rates reflect the intensity of biological mixing and sedim entation rates. Mixing is most intense in upper sediment layers that are characterized by the highest abundance of infaunal organisms. Decreases in biodiffusion with depth reflect the relatively lower availability of labile organic matter in subsurface sedi ment layers. Clarke et al. (2001) describe this relationship as consisting of three zones: surficial bioturbation to about 10-cm below the sediment-water interface, comprising the highest mixing by infauna; mid-depth bioturbation from about 10 to 40 cm, with decreases in sediment reworking with depth; and deep bioturbation at depths below about 40 cm, as generally influenced by larger infauna such as ghost shrimp and some polychaetes.
Deep-burrowing organisms are also capable of advective transport of sediment particles bet ween nonadjacent sediment strata or to the seafloor. An example of biologically mediated advective transport is represented by ingestion of subsurface sediment particles by head-down deposit feeders and defecation of fecal pellets at the sediment surface. This process is termed non-local mixing and generally causes unidirectional transport of particles and particle-associated contaminants. Although this process is considered potentially important, few data are available for representative species to characterize r ates fo r advective transport of sediments caused by non-local mixing (Drake 1994).
In bottom sediments with vertical gradients in contaminant concentrations, biological mixing processes can result in a net transport of contaminants into shallower or deeper strata depending on the profile of the concentration gradient (Boudreau 1998). On the PV Shelf, peak EA concentrations occur at depths up to several tens of centimeters beneath the sediment-water interface. Consequently, advective mixing processes would tend to transport contaminants upwards, into shallower strata. The rate of this biological mixing has important implications for modeling the long-term fate of sediment contaminants, as well as predicting the effectiveness of a cap layer placed on top of existing EA sediments, specifically the key points considered by Question FS-7 in the DQO matrix table for the PV Shelf RI/FS: Will a cap be recontaminated by EA sediment from uncapped areas (deep regions)? From beneath the cap, due to bioturbators?
Final Study Report on the Summer 2004 Bioturbation Measurement Program Conducted on the Palos Verdes Shelf
48

Final Study RepConducted
ort on the Summer 2004 Bioturbation Measurement Program 49 on the Palos Verdes Shelf
able 4.1-1. Study Objectives and Approach for Box Coring and Infaunal Analyses.
Survey End Use of Data Survey Limits on Decision Errors
T
Objective With Respect to Feasibility Study Qu. 7*
Approach/Design Optimization
yn,
eight of
mm) in the
egion.
The survey collected quantitative data on large BIO at 19 planned and 3 additional stations to assess occurrence and depth at each station and spatial variability (*A).
Sediment samples were collected using a deep penetrating box corer to ensure adequate sampledepth (e.g., anticipated depth of occurrence of organisms).
Direct observations of box cores were used to confirm acceptable cores for analy-sis, including adequate sediment penetration, and undisturbed sediment in the corer.
Cores were subsampled at two to three 15-cmintervals, depending on overall core length to compare depth of occurrence to potential cap thickness.
BIO size/abundance data were collected and analyzed from each station and a literature search was conducted on key ecological metrics
Transect and station locations were aligned with LACSD transects to allow comparisons of data.
Cores were processed at 15-cm intervals to correlate results with other program data (e.g., SPI/Plan-View images and radionuclide profiles).
Within-station variabilitywas assessed based on triplicate cores collected at each BIO station and evaluation of mean data for all key metrics.
Standard summarystatistics, such as mean taxa, abundance, and biomass, were utilized to evaluate spatial patterns, augmented by GIS plots.
including occurrence burrowing and sediment reworking rates. Radionuclide profiles in sediment were collected at planned stations to assess the likelihood that organisms could affect
Only deep-burrowing organisms retained on a 2-mm mesh screen were assessed to limit sample-processing time and focus on organisms with the greatest potential to
scatter plots were conducted where appropriate based on data sufficiency. More complex statistics were not warranted based on the low occurrence of BIO at most stat
with depth and the potential for upward migration of contaminants that could affect cap integrity and contaminant availability.
sediment mixing.
A voucher collection was developed for each large BIO taxon.
* End Use of the Data: To provide information pertaining to Feasibility Study Question 7: Will a cap be recontaminated by EA sediment fromuncapped areas (deep re
ioturbators occur in (Abpotential capping a
To identifdistributioabundance, and size/wlarge BIO (>2potential capping r
contaminant distribution substantively affect
Correlation analyses and
ions.
gions) and/or from beneath the cap, due to bioturbators? Question FS-7 can be clarified as follows: Do deep-burrowing ) substantial numbers and sizes/weights to (B) contribute substantially to mixing and disturbance of sediments within the
rea on the PV Shelf?
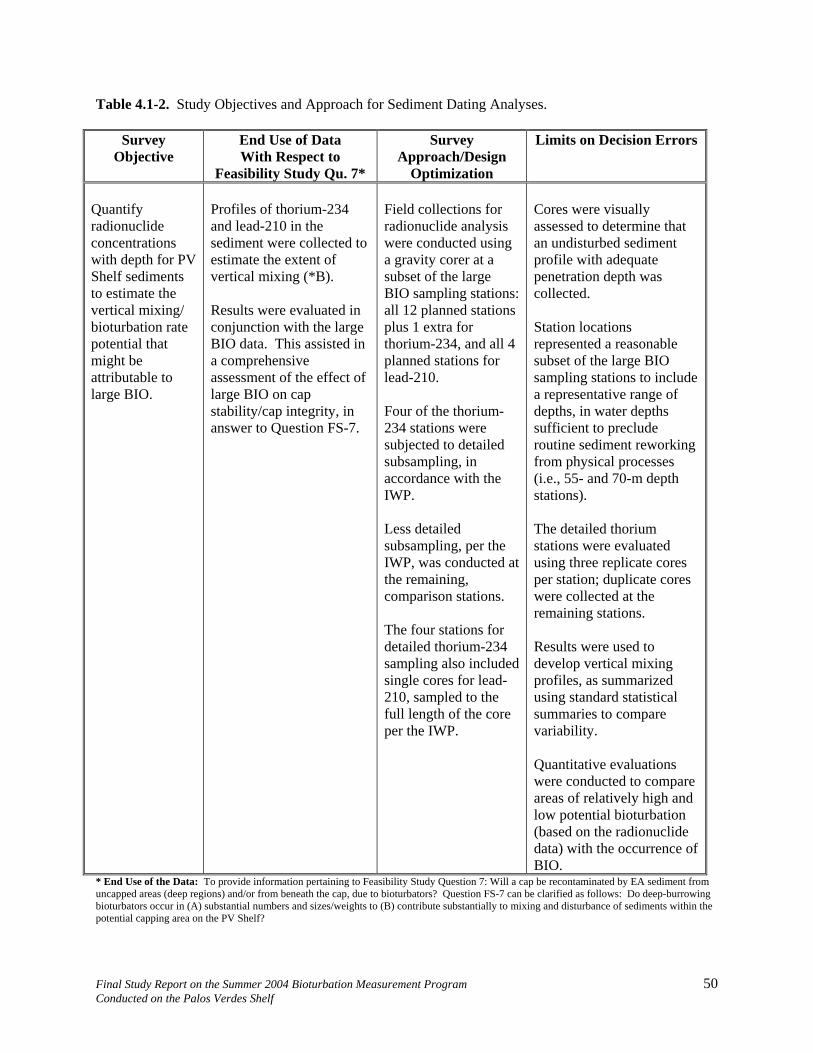
Table 4.1-2. Study Objectives and Approach for Sediment Dating Analyses.
Survey Objective
End Use of Data With Respect to
Feasibility Study Qu. 7*
Survey Approach/Design
Optimization
Limits on Decision Errors
Quantify radionuclide concentrations with depth for PShelf sedimto estimate the vertical mixing/ bioturbapm
Profiles of thorium-23and lead-210 in the sediment were collected toestimate the extent ofvertical mixing (*B).
Results were evaluated incBIO data. This assisted in a comprehensive assessment of the effect olarge BIO on cap stability/cap integranswer to Question FS-7
Field collections for radionuclide analysis were conducted using a gravity corer at a subset of the large BIO sampling stations:all 12 plannplus 1 extra fthorium-234, and allplanned stations for lead-210.
Four234 stations subjected to detailed subsampling, in accordance with the IWP.
Less detailesubsampling, per the IWP, was conducted at the remaining, comparison stations.
The four stations for detailed thorium-234 sampling also included single cores for l210, samplefull length of the coper the IWP.
Cores were visuallyassessed to determine that an undisturbed sediment profile with adequate penetration depth was collected.
Srepresented a reasonable subset of the large BIOsampling stations to includea representative rangedepths, in water depths sufficient to preclurofrom physical proce(i.e., 55- and 70-m depthstations).
The detailed thoriumstations were evaluated using three replicate coresper station; duplicawere collected at tremaining stations.
Results were used tdevelop vertical mixing profiles, as summarized using stan
BIO. * End Use of the Data: To provide information pertaining to Feasibility Study Question 7: Will a cap be recontaminated by EA sediment fromuncapped areas (deep regions) and/or from beneath the cap, due to bioturbators? Question FS-7 can be clarified as follows: Do deep-burrowing bioturbators occur in (A) substantial numb
Vents
tion rate otential thatight be
attributable to large BIO.
4
onjunction with the large
f
ity, in.
ed stations or
4
of the thorium-were
d
ead-d to the
re
tation locations
of
deutine sediment reworking
sses
te coreshe
o
dard statisticalsummaries to compare variability.
Quantitative evaluations were conducted to compare areas of relatively high and low potential bioturbation (based on the radionuclide data) with the occurrence of
ers and sizes/weights to (B) contribute substantially to mixing and disturbance of sediments within the potential capping area on the PV Shelf?
Final Study Report on the Summer 2004 Bioturbation Measurement Program 50 Conducted on the Palos Verdes Shelf

Measurements of the vertical profiles of short-lived radionuclides, such as tho
ciated wie, and the ra
s, providing a traceeen the individual
t movems in the decay series
elements in the
so decays at a constant, know
i
Based on theoccurrence ofbiodiffusion ratescommunity (Secti
4.1 BIOLOGI
Evaluatiosurveys conduabundanceg/interval), as suh
rbation assessment resulin the PV Shelf study aras indicators of act
n 4.2).
AL COMMUNITY PATTERNS
ogical communityin 2004 indicated low num
t means about 5marized in Tables 3.1-1 ththat the biological commu
esented in Section 3,a, in terms of potentiaixing intensities ac
iated physical databers of taxa
gh 3.1-4 and Figuresity in the studyage 1 on Stage III; Sof organic materiwas very low (e.g., 1lues at c
omass in interLACSD values (7 to
llections of surface interval 1. Becausemals, the large discre
Shelf area are dom
diments in the surveyur at mid-depth (>15s is used as an indicvalues for interval 3and 2 (Figur
following sections addressbioturbation (Section 4.1), and
a depth-integrated biological
the BIO and SPI/Planans about 3 to 5/interval), lohighest means about 5-1 through 3.1-3. SPI dgenerally is characte
tion 3.2) typical of productia general basis for evalu; Figure 3.1-2 and Table 3
m depths fo
also relatively low (e.g; Figure 3.4-2), as discuval communities, so are moststudy focused on collectioncy in mean abundanntary taxa (> 1 mm
ial populations of large, errantrea. When vertical sedicm) and very few occuof the maximum potenti
e., core depths >30 cmhis is genera
s, study areas with the high
g within the respective LDbiodiffusion (Section 4.2), wi
be expected if the higher mixing intensities were influenced by higher biological activity. Particularlylow values for abundance and biomass were observed at the 55-m and 70-m depth stations along Transect7 (closest northwest of the outfalls) and continuing along each transect located southeast of the outfalls.
rium-234 have been used toestimate biodiffusion rates on the PV Shelf (Wheatcroft and Martin 1996). Thorium-234 is stronglyasso th particle r for sedimen ent. It al nrat tios betw element change with time. Consequently,vertical profiles of the ratios for specific decay sediment column, combined with nformation on sedimentation rates, can be used to determine rates of biodiffusion.
biotu ts pr the theBIO e l
ual m rosso
C
n of biol and assoc from -Viewcted (highest me w
(highes to 9/interval), and low biomass ( to 11m rou 3.1 ata do,
owever, indicate n region rized byadvanced infaunal successional stages (i.e., St ec veseafloor areas receiving relatively high inputs al. As ation,mean abundance of BIO for interval 1 (0-15 cm) to 9 .1-3)compared to overall infaunal mean abundance va omparable botto r LACSD data (e.g.,260 to over 2,000; Figure 3.4-1). Consistent with the low abundance noted for the BIO community(interval 1 compared to LACSD data), mean bi val 1 was g., 0.1 to10 g; Figure 3.1-3 and Table 3.1-4) compared to 13 ssed inSection 4.2). The LACSD data represent co rcomparable to BIO sampling conducted for inte the BIO ofrelatively large (> 2 mm diameter) errant ani pan ce valuesbetween this study and the LACSD data that included errant and sede diameter)underscores that surficial sediments of the PV inated by small and/or sedentaryinvertebrates. These collective results suggest, in general, that substantinvertebrates do not occur in near-surface se a mentdistribution is considered, even fewer BIO occ -30 r deep(> 30 cm) in the sediment. Further, if biomas ator al forsediment disturbance by a BIO “community”, (i. ) weresubstantially lower than observed for intervals 1 e 3.1-3). T lly consistent withthe overall mean values (all stations combined by interval) summarized in Figure 4.1-1. These results are consistent with findings by Clarke et al. (2001).
Within the overall pattern of low abundance and biomass for BIO specie estrelative values occurred northwest of the outfalls, particularly along Transects 3 and 4, but also including shallow (40-m) Stations 5-40 and LD27 and LU12, the latter two occurrin andLU capping cells. This trend was similar to the patterns noted below for thhigher mixing intensities in the northwest part of the study area (Figure 3.3-2). These similarities would
Final Study Report on the Summer 2004 Bioturbation Measurement Program 51 Conducted on the Palos Verdes Shelf
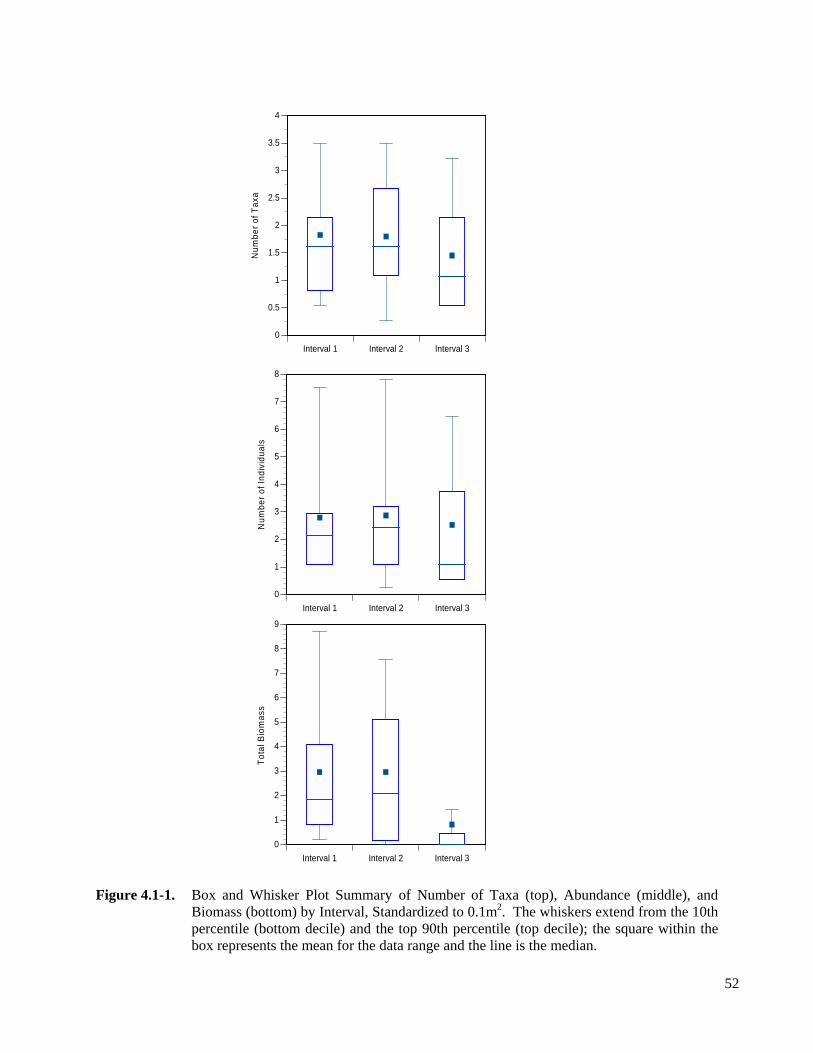
2.5
3
3.5
4
1.5
2
Num
ber o
f
Interval 1 Interval 2 Interval 3
3
4
5
6
7
8
9
Tota
l Bio
mas
s
Interval 1 Interval 2 Interval 30
1
2
3
4
5
6
7
8
Num
ber o
f Ind
ivid
uals
Interval 1 Interval 2 Interval 30
1
2
Figure 4.1-1. Box and Whisker Plot Summary of Number of Taxa (top), Abundance (middle), and Biomass (bottom) by Interval, Standardized to 0.1m2. The whiskers extend from the 10th
0
0.5
1
Taxa
percentile (bottom decile) and the top 90th percentile (top decile); the square within thebox represents the mean for the data range and the line is the median.
52
EoaLssaeA
AcpsocNdL
S(Smtyom“w3fi
BthCdns
OcpingLGoth6 to 10 cm, etc. to 34 cm, then a single interval for all cores deeper than 34 cm). In general, the
ies were broadly distributed over the range of core intervals and stations, similar to the ts. In contrast, Callianassa was only collected from shallow core intervals (6 to 10 cm at Station 3C and 6 to 10 cm at Station 1C), compared to 0 to 15, >15
valuation of 2004 data for the ghost shrimp, Neotrypaea, indicates a substantial influence of this speciesn biomass patterns. In particular, most of the highest biomass values for the BIO community weressociated with this species (compare data in Figures 3.1-3 and 3.1-7 for Stations 3-40, 5-40, LD27, and U12). Each of these stations is located at 40 m, consistent with typical limitations of this species to hallow depths (Hornig et al. 1989), although Montagne (2004, discussed below) also documented this pecies at 60-m depths in the study region. The strong relationship of biomass to Neotrypaea may serve s a useful indicator of potential bioturbation in the study region. This potential is consistent with the xtensive deep (e.g., to 1 m) burrows and high sediment reworking rates observed for this species (Table-2; Hornig et al. 1989).
bundance of Neotrypaea on the PV Shelf has fluctuated over time (D. Montagne, LACSD, pers. omm.). For example, LACSD data from recent years indicated low abundance, consistent with the resent study and general results from the 1970s. During the late 1980s to early 1990s, abundance was omewhat higher (e.g., 5 to 8 individuals/0.1m2) at some sites, compared to a maximum mean abundance f about 4 individuals/0.1m2 for the 2004 survey. This indicates the potential for higher abundance, and onsequent higher bioturbation potential, but also suggests maximum near surface densities for eotrypaea based on over 30 years of data. As a basis for comparison with these data from PV Shelfepths, maximum densities of Callianassa in optimum intertidal-to-shallow subtidal habitats (e.g., Muguagoon) for this species have been documented up to 17/0.1m2 (summarized in Ronan et al. 1981).
tations that were typified by the highest abundance and/or biomass of Neotrypaea californiensistations 3-40, 3-55, 4-40, 5-40, LD27, and LU12) correspond to areas of relatively high mixed sand and ud substrate, consistent with habitat preferences for this species (Hornig et al. 1989). These substrate pes are as documented from Sample Collection Logs in SAIC (2004b). For example, stations with no
r very low occurrences of Neotrypaea were mostly characterized by “green-black mud” or “dark-greenud”, while the stations with highest abundance and/or biomass ranged from “dark-green sandy mud” to
sand” (e.g., cap layers in interval 2 or near the bottom of interval 1 cores at Station LD27) to “green mud ith sand and shell hash”. Similarly, based on Van Veen samples collected by LACSD since the 1970s at0-m and 60-m stations on the PV Shelf, Neotrypaea is distributed in a pattern that suggests avoidance ofne sediment areas along the 60-m isobath west of the outfalls (D. Montagne, LACSD, pers. comm.).
ased on 2002 post-capping survey results (SAIC 2003), Neotrypaea occurred in areas with relativelyin and thick cap layers within the LD and LU capping cells (i.e., approximately 40-m depths; but not inell SU, approximately 70-m depths), although these were incidental, presence-absence observations thatid not provide information on core depth or organism size. In several cases, Neotrypaea occurred at or ear the interface between the bottom of the apparent cap layer and the surface of the underlying EAediments. Thus, the presence of the test cap did not exclude burrowing activities by this species.
ther incidental BIO species from 2002 that were also collected during 2004 included the burrow-reating echiuroid worm Listriolobus, the free-burrowing nemertean worm Cerebratulus, the burrowing olychaete Glycera, and the seapen Stylatula. BIO species from 2002 that were not collected during 2004 cluded “bull-dozing” gastropods such as Megasurcula. The BIO species from 2002 and 2004 are also
enerally consistent with large burrowing species collected by LACSD in 1986 (Montagne 2004, ACSD, unpublished report), including Callianassa (now Neotrypaea), Marphysa, Glycera, Nereis, ymnonereis, and Pinnixa. The 1986 study involved collection of 0.05 m2 cores at four 60-m sites, three f which (3C, 6C, and 8C; Figure 2.1-1) correspond to other LACSD data summarized in Section 3.4, andat focused on sectioning and separate processing of infauna at discrete intervals (0 to 2 cm, 2 to 6 cm,
polychaete spec2004 BIO resuland 10 to 14 cm to 30, and >30 cm
Final Study Report on the Summer 2004 Bioturbation Measurement Program 53 Conducted on the Palos Verdes Shelf
intervals for the 2004 survey. Further, the 1986 depths of occurrence were at 60 m, compared to maximal depths of 40 m in 2004. Both studies only collected this species from stations located northwest of theoutfalls.
Based on LACSD data collected since the 1970s (D. Montagne, LACSD, pers. comm.), other species withbioturbation potential on the PV Shelf include the axiid shrimp, Calocarides spinulicauda and C. quinqueseriatus (e.g., described by Pemberton and Risk 1976 for a related species, Axius serratus). These shrimp are collected occasionally on the outer shelf and upper slope, including LACSD transects 3, 4, 6, and 9, but apparentAHemisquilla ensiger. This species is large-sized (10 to 15cm long) and reportedly burrows to depths up to about two times its body length (Basch and Engle 1989). An additional BIO species from the outer PVShelf and upper slope is the stomatopod, Schmittius politus. Evaluation of 2004 length data forNeotrypaea (Table A-1) indicates a generally broad range in specimen size (e.g., approximately 12 to 90.6 mm at Station 5-40), suggesting a range of age classes. Data summarized in Hornig et al. (1989)indicate adult size ranges from about 50 to 115 mm and initial growth rates of approximately 15 to 30 mm/yr. Life span estimates are at least 3-5 years, corresponding to observed upper sizes of specimens from 2004. Hypothetically, at the pilot cap cells, smaller individuals could represent recruits from larvalsettlement after the 2000 capping experiment, while larger specimens such as the single, large (106 mmsadjacent, uncapped areas. Neotrypaea (Callianassa) californiensis has been documented to survive burialby up to at least 30 cm of sand, but also to recolonize disturbed areas by migration from unaffected areas (summarized in Ronan et al. 1981). Further, Ogden (1994) concluded that deep-burrowing species suchas ghost shrimp in San Diego Bay could compromise sediment caps up to about 1-m thick. Under these scenarios, it is possible that existing individuals could survive sand placement for a capping program, but also result in additional colonization (recruitment and/or migration) of a constructed cap at shallow- tomid-depths on the shelf (e.g., 40 to 60 m). This potential is based on the occurrence of Neotrypaea in uncapped, mixed sediment areas and at the test cell stations, although in generally low abundance. This species appears to be naturally limited in depth distribution, as noted above, so there should be less concern for colonization and subsequent bioturbation by Neotrypaea at deeper water depths. Controllingfaimportant component (summarized in Hornig et al. 1989). Water temperature is unlikely to be a direct factor since the range for ghost shrimp beds off Oregon extends down to at least 9° C (Hornig et al. 1989)and bottom temperatures in the Southern California Bight are generally above this level (Hickey 1993) over the range of potential capping depths.
The other key BIO species, Marphysa, based on abundance across three core depth-intervals for theslower than Neotrypaea (compare Figures 3.1-7 and 3.1-8). Marphysa and other relatively commonpolychaetes (e.g., Glycera, Nereis, and Gymnonereis) are predatory to omnivorous species that contributeto bioturbation while moving through sediments, but their effect would be inconsequential compared toan actively burrowing and excavating species such as ghost shrimp. These polychaetes occurred over a broader survey-depth range than Neotrypaea, but the generally low biomass across the core intervals (Table A-1) and lower bioturbation potential suggests that these species would not contributesubstantially to disturbance of a sediment cap. The only other BIO species that contributed a relativelyhigh percentage of biomass over at least several stations was the echiuroid Listriolobus (e.g., note Station 4-70 in Table A-1). However, this species is principally limited to near-surface habitats and also shouldnot represent a significant bioturbation potential for a sediment cap.
ly not in sufficient abundance to represent a significant bioturbation concern. nother potential bioturbator collected in trawls at 25-m and occasionally 60-m depths, is the stomatopod
) pecimen collected at Station LU12 may have survived the capping experiment or migrated from
ctors for depth limitations of this species are generally unknown, although predation by fish may be an
2004urvey, was characterized by mean biomass that was approximately two times to one order of magnitude
Final Study Report on the Summer 2004 Bioturbation Measurement Program 54 Conducted on the Palos Verdes Shelf
4.2 SEDIMENT MIXING AND BIOTURBATION RATES
Biodiffuswith an average of 13 ± 6 cm /yr (Section 3.3). This average value was almost a factor of three lower than the mean value of 37 ± 23 cm2/yr measured in 1992 and 1993 at LACSD Stations 3C and 6C (Wheatcroft and Martin 1996; LACSD station locations shown in Figure 2.1-1). Santschi et al. (2001)reported values for Db, based on thorium-234 profiles collected in 1996, of 18 cm2/yr at LACSD Station3C, 33 cm2/yr at Station 5C, and from 13 to 200 cm2/yr at Station 6C (Figure 2.1-1). Given the highdegree of variability in these data sets (e.g., the average biodiffusivity rate estimated from all the thorium-234 data from 2004 was 19 ± 21 cm2/yr versus 31 ± 20 cm2/yr for 1992/1993), the mixing intensity on the PV Shelf measured during the present study appeared to be comparable to values measured about a decade earlier. Swift et al. (1996) estimated Db values for the PV Shelf based on the composition and distribution of the infaunal community. However, these Db values were expressed as “relativebioturbation activity”, and could not be compared directly with those obtained from the present study. Based on excess thorium-234 values reported by Wheatcroft and Martin (1994), Sherwood et al. (1996)and Sherwood et al. (2002) used Db values of 49 cm2/yr and 23 cm2/yr to predict future bed sediment contaminant profiles at Stations 3C and 6C, respectively.
Results from the 2004 study, as well as those from Wheatcroft and Martin (1996), indicated that thehighest mixing intensities were in the northwest portion of the study area and there was a progressivedecrease toward the outfalls region. This pattern was generally consistent with spatial patterns inabundance and biomass of BIO (Section 3.1) and would be expected if the higher mixing intensities wereinfluenced by higher biological activity. In contrast, results from Santschi et al. (2001) were not consistent with this spatial pattern, instead suggesting higher but variable biodiffusivity rates at sites closer to the outfalls. However, their study was based on a limited number of sites and values from replicate cores showed high, small-scale, spatial variability.
For the present study, excess thorium results indicated biodiffusive mixing to a depth of 6 cm. Asdiscussed in Section 2.2, the vertical activity profile of a short-lived radionuclide (e.g., thorium-234) is controlled by a balance between bioturbation and radioactive decay. Bioturbation may occur at depthsbelow the mixed layer, as defined by the excess thorium profiles, but this occurs at a longer time scale than represented by the half-life of thorium-234. This is consistent with the principal verticaldistributions of infaunal organisms described by Wheatcroft (1994) and Stull et al. (1996), in which 40 to60% of the infaunal organisms occurred in the upper 2-cm layer. Similarly, Santschi et al. (2001) did notdetect excess thorium below a depth of 7 cmcores to document the presence of burrowing fauna at depths below 10 cm, and inferred that biological mixing was minimal below the surface layer because of low abundance of deep-burrowing fauna. They also concluded that model fits of radionuclide and metal profiles in sediment cores were consistent with a maximum mixing depth of 3 cm. This conclusion is similar to average RPD depths observed from 2004 SPI images (Section 3.2), and consistent with general depth distributions of the predominant infaunalcommunities on the PV Shelf (LACSD data in Section 3.4). In contrast, Swift et al. (1996) concludedthat “much of the bioturbation is due to the behavior of a few species that are incompletely sampled dueto limited core volume”, suggesting non-local mixers account for over 85% of bioturbation on the PVShelf. By extrapolation, limited core volume would mean insufficient core depths. However, based on 2004 results the Swift et al. (1996) supposition does not appear to reflect recent conditions on the PV Shelf: relatively few BIO and little sediment mixing was evident below surface layers (e.g., below 10 to 15 cm).
C
ivity values based on thorium-234 profiles from the present study ranged from 3 to 23 cm2/yr, 2
. The Santschi et al. (2001) study also used X-radiographs of
onclusions regarding the importance of non-local mixers to bioturbation rates have importantimplications for predictions concerning the potential for biological mixing of buried EA sediment layers
Final Study Report on the Summer 2004 Bioturbation Measurement Program 55 Conducted on the Palos Verdes Shelf
into a cap layer. Based on a review of infaunal commun(1concentrations and, thereby, result in upwards advection of contaminants into cleaner near-surface layers. In contrast, Santschi et al. (2001) concluded from the relative magnitudes of biodiffusivity andsedimentation rates obtained from core profiles of radionuclides that EA sediment layers should continue to move deeper over time. The 2004 bioturbation assessment indicates that the PV Shelf study regionappears to have relatively low abundance and biomass of large bioturbators, including principal speciessuch as ghost shrimp that represent the greatest potential source of deep-mixing bioturbation. Therelatively low biodiffusion rates documented in 2004 also suggest a low potential for substantial upwardmixing, consistent with a low potential for bioturbation. Realistically, the mostly likely source ofdisturbance would occur if actively burrowing species such as ghost shrimp selectively colonized the cap, via larval recruitment and/or migration, based on preferences for sandier habitat than presently exists in target capping areas of the PV Shelf. Present (2004) and historical (1986 and 2002) data on ghost shrimpoccurrence suggest a depth range from at least 40 to 60 m in the potential capping area, but include no records of occurrence from 70-m depths. The maximum mean abundance of Neotrypaea in 2004 was about 4 individuals/0.1 m2 at an uncapped station (3-40), but less than 1/0.1 m2 at Stations LD and LU that were capped in 2000 (Figure 3.1-7). Therefore, with respect to Question FS7, and assuming the LDanot appear that bioturbators would produce substantial disruption of a cap based on predicted lowabundance/biomass. This conclusion is consistent with 2004 study results indicating low sedimentmixing intensities within the survey area. However, even at hypothetically low abundance and biomass, colonization by BIO of the large potential capping area would increase the occurrence of these species inthe shelf region.
ity composition on the PV Shelf, Swift et al.996) concluded that bioturbation could extend to depths corresponding to the peak contaminant
nd LU observations are representative of likely results from other capping areas on the PV Shelf, it does
Final Study Report on the Summer 2004 Bioturbation Measurement Program 56 Conducted on the Palos Verdes Shelf
5.0 SUMMARY AND CONCLUSIONS
Overall conclusions from the bioturbation assessment study are that there was relatively low abundance and biomass of BIO, including principal species such as ghost shrimp that represent the greatest potential source of bioturbation. Sediment dating and biodiffusion results suggest a low potential for substantial upward mixing, consistent with the low potential for bioturbation. This should translate into low potential for cap disruption by these species. Detailed information on which these conclusions are based ispresented below.
The study region was characterized by relatively few BIO taxa (40), with low abundance (e.g., mean value by phylum and core depth interval of 1 to 13 for polychaetes, but less than 4 for other phyla) and biomass (e.g., highest mean values per core interval of 5 to 11 g), per 0.1 m2. Notwithstanding, based on SPI camera results the overall infaunal community was characterized by advanced successional stages(Stage 1 on Stage III) typical of productive seafloor areas receiving relatively high organic inputs.
The most common BIO taxa were polychaetes (20 taxa), followed by crustaceans (6), nemerteans (5), and other phyla (1 to 3 per phylum). Relatively higher abundance and biomass of BIO taxa generally occurred northwest of the LACSD outfalls region, with corresponding lower values to the southeast. Themajority of BIO occurred in the top two core depth intervals (0-15 cm and >15-30 cm), with substantiallyfewer at deeper intervals (>30 cm).
Key species, basedin
on frequency of occurrence and abundance across the three main core depth intervals, cluded the ghost shrimp Neotrypaea californiensis (formerly Callianassa californiensis) and the
polychaete worm Marphysa disjuncta. Other relatively common BIO taxa included the polychaetes Glycera americana, G. capitata, Gymnonereis crosslandi, and Nereis procera, and the echiuroid worm Listriolobus pelodes.
All ghost shrimp were collected northwest of the LACSD outfalls at 40-m and 55-m depth stations and represented a substantial component of many of the highest biomass values. No ghost shrimp wereobserved at 70-m stations. Highest abundance and/or biomass of this species was associated with mixed mud and sand habitats, including LU and LD capping cell stations. Marphysa had much lower biomass, higher abundance and a broader distribution, but also predominated northwest of the outfalls.
Ghost shrimp size-data and age-data extrapolations suggest a potential combination of new recruits (smaller-sized individuals) since the 2000 capping experiment, combined with larger-sized individuals that migrated from adjacent, uncapped areas or survived the capping experiment. However, for larger-sized individuals migration may be more likely since the pre-capping substrate was comparatively fine-grained, therefore representing a less-preferred habitat type. In general, recruitment or migration of ghost shrimp onto newly capped areas may result in abundance and biomass that is similar to occurrencesdocumented from the uncapped, relatively sandy stations in the northwest part of the study area.However, this occurrence would be over a broader area of the shelf, generally corresponding to shallow- to mid-depth (e.g., 40 to 60 m) regions of the capping area.
Natural history characteristics of ghost shrimp, including deep-burrowing depths (e.g., to 1 m) andextensive sediment reworking, suggests that biomass of this species may serve as a useful indicator of potential bioturbation in the study region. However, based on the low overall biomass and abundance of ghost shrimp and other BIO, there appears to be a low potential for substantial bioturbation of newcapping areas on the PV Shelf.
Final Study Report on the Summer 2004 Bioturbation Measurement Program 57 Conducted on the Palos Verdes Shelf
Banalyses, indicated low sediment mixing int
2v1.6 mm/yr).
Thorium results indicated biodiffusive mixing to about 6-cm sediment depths, generally consistent withhistorical data on the principal vertical distributions of the infaunal community.
Overall, data fromlobioturbation potential. Therefore, with respect to Question FS7, it does not appear that bioturbators have a high potential for substantial disruption of a cap in the study region, even though there would be an expanded range of occurrence for ghost shrimp and other species that prefer sandier habitats.
iodiffusivity values based on thorium-234 profiles, coupled with sedimentation rate data from lead-210 ensities (e.g., 2004 average of 19 + 21 cm2/yr versus 1992/93
alues of 31 + 20 cm /yr). Sediment accumulation rates from the lead-210 data were low (about 0.8 to
the 2004 assessment indicate low sediment mixing intensities below surface layers and w biomass and abundance of BIO, particularly for key species such as ghost shrimp that have high
Final Study Report on the Summer 2004 Bioturbation Measurement Program 58 Conducted on the Palos Verdes Shelf
REFERENCES
Alexander, C.R. and C. Venherm. 2003. Modern sedimentary processes in the Santa Monica, California continental margin: sediment accumulation, mixing and budget. Marine E
Aller, R.C., G.K. Benniger, and J.K. Cochran. 1980. Tracking particle-associated processes in nearshenvironments by use of 234Th/238U disequilibrium. Earth and Planetary Science Letters 47: 161175.
B
nvironmental Research 56: 177-204.
ore-
asch, L.V. and J.M. Engle. 1989. Aspects of the ecology and behavior of the stomatopod Hemisquilla ensigera californiensis (Gonodactyloidea: Hemisquillidae). Pp. 199-212, In: Biology of Stomatopods, E.A. Ferrero (ed.), Mucchia Editore, Selected Symposia and Monographs, Modena, Italy.
Boudreau, B.P. 1998. Mean mixed depth of sediments: The wherefore and the why. Limnol. Oceanogr. 43:524-526.
Clarke, D., M. Palermo, and T. Sturgis. 2001. Subaqueous cap design: Selection of bioturbation profiles, depths, and rates. DOER Technical Notes Collection (ERDC TN-DOER-C21). U.S. ArmyEngineer Research and Development Center, Vickburg, MS.
Cutshall, N.H., I.L. Larsen, and C.R. Olsen. 1983. Direct analysis of Pb-210 in sediment samples: self-absorption corrections. Nuclear Instrumental Methods, 206: 309-312.
Drake, D. 1994. The Natural Recovery of Contaminated Effluent-Affected Sediment on the Palos Verdes Margin: Background Information and Results of the USGS Natural Recovery Reseach. Appendix A to Predictive Modeling of the Natural Recovery of the Contaminated Effluent-Affected Sediment, Palos Verdes Margin, Southern California. Expert Report.
Gilmore, G. and J.D. Hemingway. 1995. Practical Gamma-Ray Spectrometry, John Wiley & Sons.
Hickey, B.M. 1993. Chapter 2, Physical Oceanography. In: Ecology of the Southern California Bight, Dailey, Reish, and Anderson (eds.). University of California Press. 926 pp.
Hornig, S., A. Sterling, and S. Smith. 1989. Species profiles: Life histories and environmental requirements of coastal fishes and invertebrates, Pacific Northwest – ghost shrimp and blue mud shrimp. U.S. Fish Wildl. Serv. Biol. Rep. 82 (11.93). U.S. Army Corps of Engineers, TR EL-82-4. 14 pp.
LACSD. 1995. Annual ocean water quality and bottom monitoring report for 1995. County Sanitation Districts of Los Angeles County, Los Angeles, CA.
Lee, H.J. 1994. The distribution and character of contaminated effluent-affected sediment, Palos Verdes margin, southern California. U.S. Geological Survey Expert Report, Southern California Bight Natural Resources Damage Assessment. 261 pp.
Final Study Report on the Summer 2004 Bioturbation Measurement Program 59 Conducted on the Palos Verdes Shelf
Ogden Environmental and Energy Services. 1994. B oturbation study for Convair Lagoon capping project. Report to Teledyne Ryan A iego, CA.
alermo, M. 2000. Operations and Monitoring Plan. Appendix A, In: Fredette et al. (2002), Field Pilot Study of In-Situ Capping of Palos Verdes Shelf Contaminated Sediment.
Pembera Scotia. Geological Survey of Canada. Abstracts with Programs, v. 1, p. 82.
a Bay, CA. Pacific Section SEPM Field Trip Guidebook 3:15-31.
SAIC. rch
District, and U.S. Environmental Protection Agency, Region IX.
under Contract No. GS-10f-0076J.
herwood, C.R., D.E. Drake, and P.L. Wiberg. 1996. Supplement to Predictive Modeling of the Natural
California. Additional Results from the One-Dimensional Model of Bed-Sediment
herwood, C.R., D.E. Drake, P.L. Wiberg, and R.A. Wheatcroft. 2002. Prediction of the fate of DDT in
Stull, J.
he Science of the Total Environment 179:91-107.
ieronautical, San D
P
ton, S. G. and M. J. Risk. 1976. Effects on sediment of burrowing by Axius serratus in the Strait of Canso, Nov
Ronan, T., M. Miller, and J. Farmer. 1981. Organism-Sediment Relationships on a Modern Tidal Flat, Bodega Harbor, California. In: V. Frizzell (ed.) Modern and Ancient Biogenic Structures, Bodeg
(Science Applications International Corporation). 2003. Monitoring Results from the Ma2002 Post-Cap Survey on the Palos Verdes (PV) Shelf. SAIC Report 612. Submitted to USACE and USEPA Region 9. July 2003.
SAIC. 2004a. Investigation Work Plan for the 2004 Multidisciplinary Surveys Program Bioturbation Assessment on the Palos Verdes Shelf. Prepared for U.S. Army Corps of Engineers, Los Angeles
SAIC. 2004b. Field Report for the Multidisciplinary Studies for the Palos Verdes Pilot Cap MonitoringProgram: Task 4 - Bioturbation Study. Submitted to USACE
SAIC. 2005. Data Report for the Summer 2004 Geotechnical Measurement Program Conducted on the Palos Verdes Shelf. March 2005, SAIC Report No. 676.
Santschi, P,H., L. Guo, S. Asbill, M. Allison. A.B. Kepple, and L.S. Wen. 2001. Accumulation rates and sources of sediments and organic carbon on the Palos Verdes shelf based on radioisotopic tracers (137Cs, 239,240Pu, 210Pb, 238U and 14C). Marine Chemistry 73:125-152.
SRecovery of the Contaminated Effluent-Affected Sediment, Palos Verdes Margin, Southern
Contamination Profiles. November 1996.
Ssediment on the Palos Verdes margin. Continental Shelf Research 22:1025-1088.
K. 1995. Two decades of marine biological monitoring, Palos Verdes, California, 1972 to 1992. Bull. So. Cal. Acad. Sci. 94:21-45.
Stull, J.K., D.J.P. Swift, and A.W. Niedoroda. 1996. Contaminant dispersal on the Palos Verdes continental margin: I. Sediments and biota near a major California wastewater discharge.
Swift, D.J.P., J.K. Stull, A.W. Niedoroda, C.W. Reed, and G.T.F. Wong. 1996. Contaminant dispersal on the Palos Verdes continental margin, II. Estimates of the biodiffusion coefficient, DB, fromcomposition of the benthic infaunal community. T
Final Study Report on the Summer 2004 Bioturbation Measurement Program 60 Conducted on the Palos Verdes Shelf
USACE. 1999. Technical Report EL-99-2. Waterways Experiment Station, Vicksburg, MS.
WPredictive modeling of the natural recovery of the contaminated effluent-affected sediment, Palos Verdes margin, southern California, D.E. Drake, C.R. Sherwood and P.L.
roft, R.A. and W.R. Martin. 1996. Spatial variation in short-term (234Th) sediment bioturbaintensity along an organic carbon-gradient. Journal of Marine Research, 54: 763-792.
heatcroft, R.A., W.R. Martin. 1994. Solid-phase bioturbation processes on the Palos Verdes shelf. In:
Wiberg, (eds.), Appendix E, USGS Expert Report.
Wheatc tion
Final Study Report on the Summer 2004 Bioturbation Measurement Program 61 Conducted on the Palos Verdes Shelf

APPENDICES
APPENDIX A
RESULTS SUMMARY FROM BIOTURBATING INFAUNAL ORGANISM (BIO) SURVEY AT PALOS VERDES SHELF STATIONS,
JULY/AUGUST 2004
Table A-1. Summary of BIO Data, July/August 2004.
Station Interval Replicate Date Phylum Species Number
Individuals Length (mm)
Weight (gms) Comments
3-40 1 1 8/1/2004 Annelida Harmothoe lunulata 1 6.8 0.1 w/head 3-40 1 1 8/1/2004 Nemertea Lineidae 1 28.7 0.2 3-40 1 1 8/1/2004 Nemertea Lineidae 2 78.5 0.3 3-40 1 1 8/1/2004 Annelida Marphysa disjuncta 1 66.4 0.2 w/head 3-40 1 1 8/1/2004 Annelida Marphysa disjuncta 1 65.2 0.1 w/head 3-40 1 1 8/1/2004 Arthropoda Neotrypaea californiensis 1 42.1 1.0 3-40 1 1 8/1/2004 Arthropoda Neotrypaea californiensis 1 17.4 0.1 3-40 1 1 8/1/2004 Nemertea Tubulanus cingulatus 1 28.5 0.2 3-40 1 2 8/1/2004 Annelida Glycera americana 1 74.5 1.5 w/head 3-40 1 2 8/1/2004 Annelida Marphysa disjuncta 1 63.3 0.5 w/head 3-40 1 2 8/1/2004 Annelida Marphysa disjuncta 1 74.9 0.5 3-40 1 2 8/1/2004 Annelida Marphysa disjuncta 1 27.5 0.3 w/head 3-40 1 2 8/1/2004 Annelida Marphysa disjuncta frag 25.3 0.2 no head 3-40 1 2 8/1/2004 Arthropoda Neotrypaea californiensis 1 29.1 1.5 end only 3-40 1 2 8/1/2004 Arthropoda Neotrypaea californiensis 1 28.8 1.5 3-40 1 2 8/1/2004 Arthropoda Neotrypaea californiensis 1 21.7 1.2 3-40 1 2 8/1/2004 Mollusca Sinum scopulosum 1 4.7 0.1 shell width 3-40 1 3 8/1/2004 Nemertea Nemertea 1 34.2 0.1 Unidentifiable 3-40 1 3 8/1/2004 Arthropoda Neotrypaea californiensis 1 71.1 6.6 3-40 1 3 8/1/2004 Arthropoda Neotrypaea californiensis 1 37.3 1.1 3-40 1 3 8/1/2004 Annelida Notomastus lineatus 1 103.2 0.2 3-40 1 3 8/1/2004 Annelida Sthenelais verruculosa 1 37.1 0.1 3-40 1 3 8/1/2004 Annelida Sthenelanella uniformis 1 missing data 3-40 2 1 8/1/2004 Annelida Drilonereis falcata 1 39.0 0.1 w/head 3-40 2 1 8/1/2004 Annelida Glycera capitata 1 19.1 0.1 w/head 3-40 2 1 8/1/2004 Annelida Marphysa disjuncta 1 52.3 0.5 w/head 3-40 2 1 8/1/2004 Annelida Marphysa disjuncta 1 39.5 0.4 w/head 3-40 2 1 8/1/2004 Annelida Marphysa disjuncta 1 30.5 0.3 w/head 3-40 2 1 8/1/2004 Annelida Marphysa disjuncta frag 55.4 0.3 no head 3-40 2 1 8/1/2004 Annelida Marphysa disjuncta frags 57.9 0.2 frags 3-40 2 1 8/1/2004 Arthropoda Neotrypaea californiensis 1 46.0 1.8 3-40 2 1 8/1/2004 Arthropoda Neotrypaea californiensis 1 25.7 0.3 tail only 3-40 2 1 8/1/2004 Annelida Sthenelanella uniformis 1 62.3 0.2 w/head 3-40 2 2 8/1/2004 Annelida Glycera americana 1 66.6 0.7 w/head 3-40 2 2 8/1/2004 Annelida Marphysa disjuncta 1 39.9 0.2 w/head 3-40 2 2 8/1/2004 Annelida Marphysa disjuncta frags 103.8 0.2 frags no head 3-40 2 2 8/1/2004 Arthropoda Neotrypaea californiensis 1 68.5 5.1 3-40 2 2 8/1/2004 Arthropoda Neotrypaea californiensis 1 20.2 2.0 head only 3-40 2 2 8/1/2004 Arthropoda Neotrypaea californiensis 1 39.3 2.4 3-40 2 3 8/1/2004 Annelida Marphysa disjuncta 1 151.2 0.5 w/head 3-40 2 3 8/1/2004 Annelida Marphysa disjuncta frags 49.1 0.3 no head 3-40 3 1 8/1/2004 No BIO No BIO 0 0.0 0.0 3-40 3 2 8/1/2004 No BIO No BIO 0 0.0 0.0 3-40 3 3 8/1/2004 No BIO No BIO 0 0.0 0.0 3-40 4 1 8/1/2004 No BIO No BIO 0 0.0 0.0 3-55 1 1 8/1/2004 Annelida Marphysa disjuncta 1 30.1 0.1 w/head 3-55 1 1 8/1/2004 Annelida Marphysa disjuncta 1 34.4 0.3 w/head
Notes: No BIO = No organsims collected; Frag(s) = 1 organism
Table A-1., continued.
Station Interval Replicate Date Phylum Species Number
Individuals Length (mm)
Weight (gms) Comments
3-55 1 1 8/1/2004 Annelida Marphysa disjuncta 1 51.1 0.2 w/head 3-55 1 1 8/1/2004 Annelida Marphysa disjuncta frag 35.9 0.1 no head 3-55 1 1 8/1/2004 Annelida Marphysa disjuncta frag 57.5 0.2 no head 3-55 1 1 8/1/2004 Annelida Marphysa disjuncta frags 80.9 1.1 no head 3-55 1 1 8/1/2004 Sipuncula Thysanocardia nigra 1 33.4 0.3 Dirty white 3-55 1 2 8/1/2004 Annelida Drilonereis falcata 1 62.1 0.2 no head 3-55 1 2 8/1/2004 Annelida Marphysa disjuncta 1 32.8 0.3 w/head 3-55 1 2 8/1/2004 Annelida Marphysa disjuncta frag 60.7 0.5 no head 3-55 1 2 8/1/2004 Annelida Marphysa disjuncta frag 13.4 0.1 no head 3-55 1 2 8/1/2004 Annelida Marphysa disjuncta frag 14.1 0.1 no head 3-55 1 3 8/1/2004 Annelida Eranno lagunae 1 69.7 0.3 w/head 3-55 1 3 8/1/2004 Annelida Marphysa disjuncta 1 52.0 0.3 w/head 3-55 1 3 8/1/2004 Annelida Marphysa disjuncta 1 42.2 0.2 w/head 3-55 1 3 8/1/2004 Annelida Marphysa disjuncta 1 44.8 0.3 w/head 3-55 1 3 8/1/2004 Annelida Marphysa disjuncta frag 48.9 0.2 no head 3-55 1 3 8/1/2004 Annelida Marphysa disjuncta frags 483.0 2.0 3-55 2 1 8/1/2004 Annelida Marphysa disjuncta 1 37.9 0.2 w/head 3-55 2 1 8/1/2004 Annelida Marphysa disjuncta frag 45.5 0.1 no head 3-55 2 1 8/1/2004 Annelida Marphysa disjuncta frag 70.7 0.2 no head 3-55 2 1 8/1/2004 Annelida Marphysa disjuncta frag 63.3 0.3 no head 3-55 2 1 8/1/2004 Annelida Marphysa disjuncta 1 49.2 0.1 w/head 3-55 2 1 8/1/2004 Annelida Marphysa disjuncta frag 36.1 0.1 no head 3-55 2 1 8/1/2004 Arthropoda Neotrypaea californiensis 1 17.9 0.2 3-55 2 1 8/1/2004 Annelida Nereis procera 1 13.9 0.1 w/head 3-55 2 1 8/1/2004 Annelida Nereis procera 1 34.4 0.1 w/head 3-55 2 1 8/1/2004 Annelida Nereis procera 1 24.9 0.1 w/head 3-55 2 1 8/1/2004 Annelida Sthenelanella uniformis 1 ND ND small head frag 3-55 2 2 8/1/2004 Annelida Drilonereis falcata 1 26.7 0.1 w/head 3-55 2 2 8/1/2004 Annelida Marphysa disjuncta 1 40.0 0.5 w/head 3-55 2 2 8/1/2004 Annelida Marphysa disjuncta 1 56.3 0.3 no head 3-55 2 2 8/1/2004 Annelida Marphysa disjuncta frag 10.0 0.1 no head 3-55 2 2 8/1/2004 Annelida Marphysa disjuncta frag 12.3 0.1 no head 3-55 2 2 8/1/2004 Annelida Nereis procera 1 37.2 0.2 w/head 3-55 2 2 8/1/2004 Annelida Nereis procera 1 45.8 0.5 w/head 3-55 2 2 8/1/2004 Annelida Nereis procera 1 51.6 0.3 no head 3-55 2 2 8/1/2004 Annelida Sthenelanella uniformis 1 18.2 0.1 w/head 3-55 2 3 8/1/2004 Annelida Marphysa disjuncta 1 9.1 0.1 w/head 3-55 2 3 8/1/2004 Arthropoda Neotrypaea californiensis 1 33.3 1.5 3-55 2 3 8/1/2004 Annelida Nereis procera 1 11.5 0.1 w/head 3-55 2 3 8/1/2004 Annelida Nereis procera 1 12.1 0.1 w/head 3-55 2 3 8/1/2004 Annelida Sthenelanella uniformis 1 33.5 0.1 w/head 3-55 2 3 8/1/2004 Annelida Sthenelanella uniformis frags 31.4 0.2 no head 3-55 2 3 8/1/2004 Annelida Sthenelanella uniformis frag 12.8 0.1 no head 3-55 3 1 8/1/2004 No BIO No BIO 0 0.0 0.0 3-55 3 2 8/1/2004 No BIO No BIO 0 0.0 0.0 3-55 3 3 8/1/2004 No BIO No BIO 0 0.0 0.0 3-70 1 1 8/1/2004 Annelida Gymnonereis crosslandi 1 32.5 0.2 w/head
Notes: No BIO = No organsims collected; Frag(s) = 1 organism
Table A-1., continued.
Station Interval Replicate Date Phylum Species Number
Individuals Length (mm)
Weight (gms) Comments
3-70 1 1 8/1/2004 Echiura Listriolobus pelodes 1 19.5 0.2 3-70 1 1 8/1/2004 Annelida Marphysa disjuncta 1 38.1 0.1 w/head 3-70 1 1 8/1/2004 Annelida Marphysa disjuncta frag 71.3 0.2 no head 3-70 1 1 8/1/2004 Annelida Marphysa disjuncta frag 36.4 0.2 no head 3-70 1 1 8/1/2004 Annelida Marphysa disjuncta frag 28.7 0.3 no head 3-70 1 1 8/1/2004 Cnidaria Pennatulacea 1 23.7 0.4 Fragment 3-70 1 2 8/1/2004 Cnidaria Athenaria 1 10.3 0.1 White knob, unidentified 3-70 1 2 8/1/2004 Annelida Gymnonereis crosslandi 1 42.6 0.2 w/head 3-70 1 2 8/1/2004 Annelida Gymnonereis crosslandi 1 30.0 0.1 w/head 3-70 1 2 8/1/2004 Annelida Marphysa disjuncta 1 41.7 0.7 w/head 3-70 1 2 8/1/2004 Annelida Marphysa disjuncta 1 56.3 0.6 w/head 3-70 1 2 8/1/2004 Annelida Marphysa disjuncta 1 73.1 0.6 w/head 3-70 1 2 8/1/2004 Annelida Marphysa disjuncta frags 60.9 0.4 frags 3-70 1 2 8/1/2004 Cnidaria Stylatula elongata 1 34.4 0.1 frag 3-70 1 3 8/1/2004 Annelida Eranno lagunae 1 37.3 0.1 3-70 1 3 8/1/2004 Annelida Glycinde armigera 1 40.4 0.1 w/head 3-70 1 3 8/1/2004 Annelida Gymnonereis crosslandi 1 52.8 0.2 w/head 3-70 1 3 8/1/2004 Annelida Gymnonereis crosslandi 1 39.6 0.2 w/head 3-70 1 3 8/1/2004 Annelida Gymnonereis crosslandi 1 23.9 0.1 w/head 3-70 1 3 8/1/2004 Annelida Gymnonereis crosslandi 1 83.5 0.3 w/head 3-70 1 3 8/1/2004 Annelida Gymnonereis crosslandi 1 27.6 0.2 w/head 3-70 1 3 8/1/2004 Annelida Marphysa disjuncta 1 40.4 0.3 w/head 3-70 1 3 8/1/2004 Annelida Marphysa disjuncta 1 28.8 0.2 w/head 3-70 1 3 8/1/2004 Annelida Marphysa disjuncta 1 136.0 0.4 no head 3-70 1 3 8/1/2004 Annelida Marphysa disjuncta frag 129.5 0.4 no head 3-70 2 1 8/1/2004 Annelida Lumbrineridae 1 20.5 0.1 w/head 3-70 2 1 8/1/2004 Annelida Marphysa disjuncta 1 45.7 0.3 no head 3-70 2 1 8/1/2004 Annelida Nereis procera 1 63.7 0.1 w/head 3-70 2 2 8/1/2004 Annelida Glycera americana 1 68.8 2.3 3-70 2 2 8/1/2004 Annelida Gymnonereis crosslandi 1 42.6 0.3 w/head 3-70 2 2 8/1/2004 Annelida Gymnonereis crosslandi frags 110.0 1.0 frags 3-70 2 2 8/1/2004 Annelida Marphysa disjuncta 1 74.2 0.6 w/head 3-70 2 2 8/1/2004 Annelida Marphysa disjuncta 1 23.9 0.3 w/head 3-70 2 2 8/1/2004 Annelida Marphysa disjuncta frags 138.0 1.7 no heads 3-70 2 2 8/1/2004 Sipuncula Thysanocardia nigra 1 53.2 0.6 Dirty white 3-70 2 3 8/1/2004 Annelida Gymnonereis crosslandi 1 16.3 0.1 w/head 3-70 2 3 8/1/2004 Annelida Marphysa disjuncta 1 27.2 0.3 w/head 3-70 2 3 8/1/2004 Annelida Marphysa disjuncta 1 76.4 0.3 3-70 2 3 8/1/2004 Annelida Marphysa disjuncta frags 62.8 0.2 no head 3-70 2 3 8/1/2004 Annelida Marphysa disjuncta frags 51.6 0.3 no head 3-70 2 3 8/1/2004 Annelida Marphysa disjuncta frag 10.5 0.1 no head 3-70 3 1 8/1/2004 No BIO No BIO 0 0.0 0.0 3-70 3 2 8/1/2004 Annelida Glycera americana 1 25.5 0.3 no head; branchia, parapodia 3-70 3 3 8/1/2004 No BIO No BIO 0 0.0 0.0 no head 4-40 1 1 7/29/2004 Echiura Listriolobus pelodes 1 25.9 7.0 4-40 1 1 7/29/2004 Annelida Marphysa disjuncta 1 61.0 0.2 frag w/head; in LD27 jar 4-40 1 1 7/29/2004 Annelida Marphysa disjuncta 1 40.3 0.2 frag w/head
Notes: No BIO = No organsims collected; Frag(s) = 1 organism

Table A-1., continued.
Station Interval Replicate Date Phylum Species Number
Individuals Length (mm)
Weight (gms) Comments
4-40 1 2 7/29/2004 Annelida Glycera americana 1 40.6 0.2 frag w/head 4-40 1 2 7/29/2004 Annelida Marphysa disjuncta 1 79.9 0.2 4-40 1 2 7/29/2004 Annelida Marphysa disjuncta 1 96.4 0.2 4-40 1 2 7/29/2004 Arthropoda Neotrypaea californiensis 1 18.7 0.1 frag 4-40 1 3 7/29/2004 Echiura Listriolobus pelodes 1 10.4 0.2 4-40 1 3 7/29/2004 Arthropoda Pinnixa 1 8.5 0.1 carapace width 4-40 2 1 7/29/2004 Echiura Listriolobus pelodes 1 34.2 8.0 4-40 2 2 7/29/2004 Annelida Marphysa disjuncta 1 160.0 0.2 4-40 2 2 7/29/2004 Arthropoda Neotrypaea californiensis 1 37.7 1.0 4-40 2 3 7/29/2004 Annelida Marphysa disjuncta 1 56.4 0.4 4-40 2 3 7/29/2004 Annelida Marphysa disjuncta 1 56.8 0.2 4-40 2 3 7/29/2004 Annelida Marphysa disjuncta 1 114.8 0.7 4-40 3 1 7/29/2004 Arthropoda Neotrypaea californiensis 1 50.3 2.7 4-40 3 2 7/29/2004 No BIO No BIO 0 0.0 0.0 4-40 3 3 7/29/2004 Annelida Marphysa disjuncta 1 23.6 0.3 no head 4-40 4 1 7/29/2004 No BIO No BIO 0 0.0 0.0 4-55 1 1 7/29/2004 Annelida Marphysa disjuncta 1 48.3 0.4 frag w/head 4-55 1 1 7/29/2004 Annelida Marphysa disjuncta 1 42.8 0.3 frag w/head 4-55 1 1 7/29/2004 Arthropoda Neotrypaea californiensis 1 10.6 0.1 no head 4-55 1 2 7/29/2004 Annelida Marphysa disjuncta 1 44.6 0.1 frag w/head 4-55 1 2 7/29/2004 Arthropoda Pinnixa occidentalis 1 5.8 0.1 4-55 1 3 7/29/2004 Annelida Marphysa disjuncta 1 63.0 0.7 frag w/head 4-55 1 3 7/29/2004 Annelida Marphysa disjuncta 1 74.5 0.4 frag w/head 4-55 1 3 7/29/2004 Annelida Marphysa disjuncta frags 338.0 1.2 frags 4-55 2 1 7/29/2004 Annelida Marphysa disjuncta 1 + frags 250.0 1.8 frags 4-55 2 1 7/29/2004 Arthropoda Pinnixa occidentalis 1 8.2 0.1 carapace width 4-55 2 2 7/29/2004 Annelida Marphysa disjuncta 1 99.4 0.6 4-55 2 3 7/29/2004 No BIO No BIO 0 0.0 0.0 4-55 3 1 7/29/2004 No BIO No BIO 0 0.0 0.0 4-55 3 2 7/29/2004 Annelida Marphysa disjuncta 1 + frag 39.0 0.4 frags (one with head) 4-55 3 3 7/29/2004 Annelida Marphysa disjuncta 1 + frag 122.7 0.2 no head 4-55 3 3 7/29/2004 Cnidaria Stylatula elongata 1 32.3 0.1 frag 4-70 1 1 8/2/2004 Annelida Gymnonereis crosslandi 1 22.7 0.3 w/head 4-70 1 1 8/2/2004 Cnidaria Stylatula elongata 1 228.0 2.1 frag 4-70 1 2 8/2/2004 Echiura Listriolobus pelodes 1 26.9 7.6 4-70 1 2 8/2/2004 Echiura Listriolobus pelodes 1 20.5 5.2 4-70 1 2 8/2/2004 Annelida Marphysa disjuncta 1 175.0 1.0 w/head 4-70 1 2 8/2/2004 Annelida Marphysa disjuncta 1 27.1 0.4 w/head 4-70 1 2 8/2/2004 Annelida Marphysa disjuncta 1 10.0 0.1 w/head 4-70 1 2 8/2/2004 Annelida Marphysa disjuncta 1 22.1 0.2 w/head 4-70 1 2 8/2/2004 Annelida Marphysa disjuncta frags 204.0 1.2 frags 4-70 1 3 8/2/2004 Echiura Listriolobus pelodes 1 8.5 0.2 4-70 1 3 8/2/2004 Sipuncula Thysanocardia nigra 1 67.2 1.1 4-70 2 1 8/2/2004 Annelida Gymnonereis crosslandi 1 30.7 0.2 w/head 4-70 2 1 8/2/2004 Annelida Marphysa disjuncta 1 24.2 0.4 w/head 4-70 2 1 8/2/2004 Annelida Marphysa disjuncta 1 30.9 0.4 w/head 4-70 2 1 8/2/2004 Annelida Marphysa disjuncta frags 264.0 1.7 no head
Notes: No BIO = No organsims collected; Frag(s) = 1 organism
Table A-1., continued.
Station Interval Replicate Date Phylum Species Number
Individuals Length (mm)
Weight (gms) Comments
4-70 2 1 8/2/2004 Cnidaria Stylatula elongata 1 217.0 2.2 frag 4-70 2 2 8/2/2004 Annelida Gymnonereis crosslandi 1 29.6 0.3 same as previous errant 4-70 2 2 8/2/2004 Nemertea Nemertea unidentified 1 24.3 0.1 Stripe 4-70 2 2 8/2/2004 Cnidaria Pennatulacea 1 47.3 0.3 Base only, dirty yellow 4-70 2 3 8/2/2004 Annelida Gymnonereis crosslandi 1 60.8 0.2 w/head 4-70 2 3 8/2/2004 Annelida Gymnonereis crosslandi 1 53.8 0.2 w/head 4-70 2 3 8/2/2004 Annelida Gymnonereis crosslandi frag 11.9 0.1 no head 4-70 2 3 8/2/2004 Annelida Marphysa disjuncta 1 29.1 0.3 w/head 4-70 2 3 8/2/2004 Annelida Marphysa disjuncta frags 174.0 1.9 frags 4-70 3 1 8/2/2004 No BIO No BIO 0 0.0 0.0 4-70 3 2 8/2/2004 No BIO No BIO 0 0.0 0.0 4-70 3 3 8/2/2004 No BIO No BIO 0 0.0 0.0 5-40 1 1 7/27/2004 Arthropoda Pinnixa occidentalis 1 7.1 0.1 5-40 1 2 7/27/2004 Arthropoda Neotrypaea californiensis 1 12.1 0.1 5-40 1 3 7/27/2004 No BIO No BIO 0 0.0 0.0 5-40 2 1 7/27/2004 No BIO No BIO 0 0.0 0.0 5-40 2 2 7/27/2004 Arthropoda Neotrypaea californiensis 1 25.1 0.3 5-40 2 3 7/27/2004 No BIO No BIO 0 0.0 0.0 5-40 3 1 7/27/2004 Arthropoda Neotrypaea californiensis 1 90.6 13.4 Carapace length 5-40 3 1 7/27/2004 Mollusca Sinum scopulosum 1 21.5 5.5 Shell width 5-40 3 2 7/27/2004 No BIO No BIO 0 0.0 0.0 5-40 3 3 7/27/2004 Arthropoda Pinnixa occidentalis 1 8.5 0.1 carapace width 5-55 1 1 7/27/2004 Cnidaria Stylatula elongata frag 92.5 0.7 Combined with other intervals 5-55 1 1 7/27/2004 Echiura Listriolobus pelodes 1 24.4 4.0 5-55 1 2 7/27/2004 Nemertea Tubulanus polymorphus 1 30.2 0.1 5-55 1 3 7/27/2004 Echiura Listriolobus pelodes 1 11.5 0.4 5-55 2 1 7/27/2004 Cnidaria Stylatula elongata 1 102.0 0.9 Combined with other intervals 5-55 2 2 7/27/2004 No BIO No BIO 0 0.0 0.0 5-55 2 3 7/27/2004 No BIO No BIO 0 0.0 0.0 5-55 3 1 7/27/2004 Cnidaria Stylatula elongata frag 90.3 1.4 Combined with other intervals 5-55 3 2 7/27/2004 No BIO No BIO 0 0.0 0.0 5-55 3 3 7/27/2004 No BIO No BIO 0 0.0 0.0 5-70 1 1 7/27/2004 Nemertea Cerebratulus californiensis 1 183.0 6.9 large purple-combined, 5 fragments 5-70 1 1 7/27/2004 Nemertea Nemertea unidentified 1 109.0 0.3 Skinny red 5-70 1 2 7/27/2004 Annelida Arctonoe pulchra 1 24.7 0.1 5-70 1 2 7/27/2004 Annelida Glycera americana 1 24.5 0.1 5-70 1 2 7/27/2004 Annelida Glycera capitata 1 20.0 0.1 5-70 1 2 7/27/2004 Annelida Glycera capitata 1 18.3 0.1 5-70 1 2 7/27/2004 Echiura Listriolobus pelodes 1 13.7 1.0 5-70 1 3 7/27/2004 No BIO No BIO 0 0.0 0.0 5-70 2 1 7/27/2004 Nemertea Cerebratulus californiensis 1 24.8 0.2 large purple-combined, 2 fragments 5-70 2 2 7/27/2004 Annelida Nereis procera 1 125.0 0.3 5-70 2 3 7/27/2004 Annelida Glycera americana 1 210.0 10.0 5-70 2 3 7/27/2004 Arthropoda Pinnixa occidentalis 1 7.1 0.1 5-70 2 3 7/27/2004 Arthropoda Pinnixa occidentalis 1 8.1 0.1 5-70 3 1 7/27/2004 Nemertea Cerebratulus californiensis 1 10.3 0.1 large purple 5-70 3 2 7/27/2004 No BIO No BIO 0 0.0 0.0
Notes: No BIO = No organsims collected; Frag(s) = 1 organism
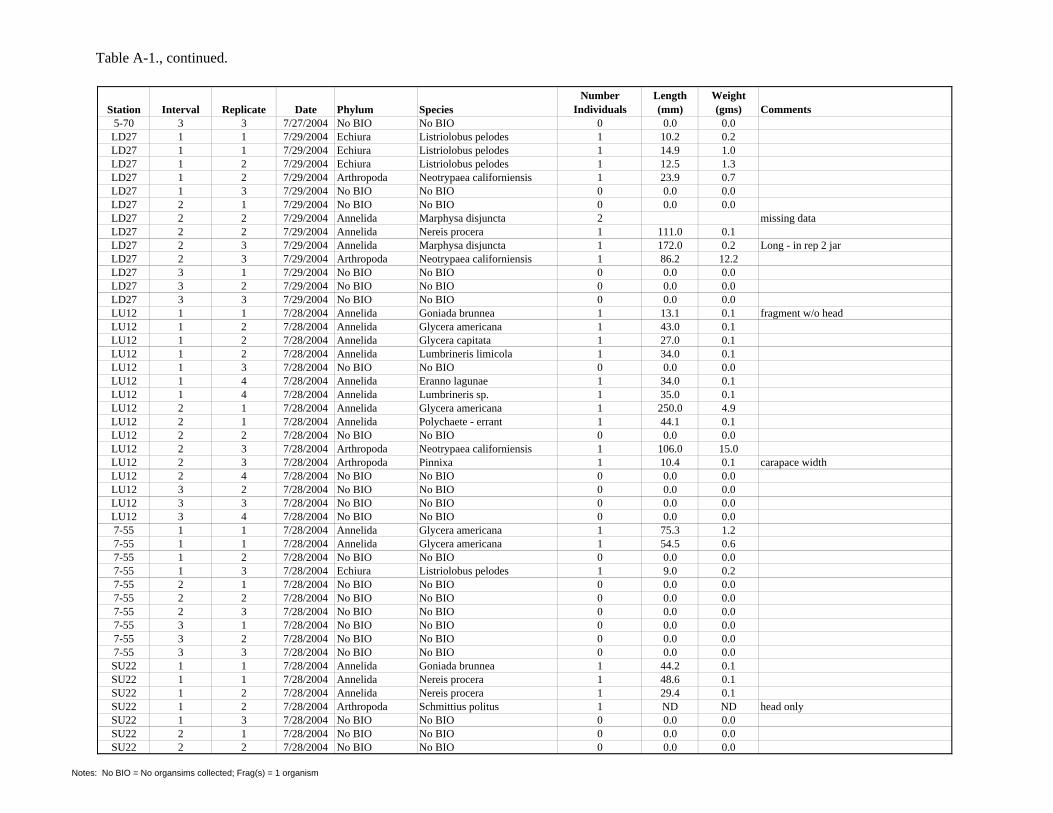
Table A-1., continued.
Station Interval Replicate Date Phylum Species Number
Individuals Length (mm)
Weight (gms) Comments
5-70 3 3 7/27/2004 No BIO No BIO 0 0.0 0.0 LD27 1 1 7/29/2004 Echiura Listriolobus pelodes 1 10.2 0.2 LD27 1 1 7/29/2004 Echiura Listriolobus pelodes 1 14.9 1.0 LD27 1 2 7/29/2004 Echiura Listriolobus pelodes 1 12.5 1.3 LD27 1 2 7/29/2004 Arthropoda Neotrypaea californiensis 1 23.9 0.7 LD27 1 3 7/29/2004 No BIO No BIO 0 0.0 0.0 LD27 2 1 7/29/2004 No BIO No BIO 0 0.0 0.0 LD27 2 2 7/29/2004 Annelida Marphysa disjuncta 2 missing data LD27 2 2 7/29/2004 Annelida Nereis procera 1 111.0 0.1 LD27 2 3 7/29/2004 Annelida Marphysa disjuncta 1 172.0 0.2 Long - in rep 2 jar LD27 2 3 7/29/2004 Arthropoda Neotrypaea californiensis 1 86.2 12.2 LD27 3 1 7/29/2004 No BIO No BIO 0 0.0 0.0 LD27 3 2 7/29/2004 No BIO No BIO 0 0.0 0.0 LD27 3 3 7/29/2004 No BIO No BIO 0 0.0 0.0 LU12 1 1 7/28/2004 Annelida Goniada brunnea 1 13.1 0.1 fragment w/o head LU12 1 2 7/28/2004 Annelida Glycera americana 1 43.0 0.1 LU12 1 2 7/28/2004 Annelida Glycera capitata 1 27.0 0.1 LU12 1 2 7/28/2004 Annelida Lumbrineris limicola 1 34.0 0.1 LU12 1 3 7/28/2004 No BIO No BIO 0 0.0 0.0 LU12 1 4 7/28/2004 Annelida Eranno lagunae 1 34.0 0.1 LU12 1 4 7/28/2004 Annelida Lumbrineris sp. 1 35.0 0.1 LU12 2 1 7/28/2004 Annelida Glycera americana 1 250.0 4.9 LU12 2 1 7/28/2004 Annelida Polychaete - errant 1 44.1 0.1 LU12 2 2 7/28/2004 No BIO No BIO 0 0.0 0.0 LU12 2 3 7/28/2004 Arthropoda Neotrypaea californiensis 1 106.0 15.0 LU12 2 3 7/28/2004 Arthropoda Pinnixa 1 10.4 0.1 carapace width LU12 2 4 7/28/2004 No BIO No BIO 0 0.0 0.0 LU12 3 2 7/28/2004 No BIO No BIO 0 0.0 0.0 LU12 3 3 7/28/2004 No BIO No BIO 0 0.0 0.0 LU12 3 4 7/28/2004 No BIO No BIO 0 0.0 0.0 7-55 1 1 7/28/2004 Annelida Glycera americana 1 75.3 1.2 7-55 1 1 7/28/2004 Annelida Glycera americana 1 54.5 0.6 7-55 1 2 7/28/2004 No BIO No BIO 0 0.0 0.0 7-55 1 3 7/28/2004 Echiura Listriolobus pelodes 1 9.0 0.2 7-55 2 1 7/28/2004 No BIO No BIO 0 0.0 0.0 7-55 2 2 7/28/2004 No BIO No BIO 0 0.0 0.0 7-55 2 3 7/28/2004 No BIO No BIO 0 0.0 0.0 7-55 3 1 7/28/2004 No BIO No BIO 0 0.0 0.0 7-55 3 2 7/28/2004 No BIO No BIO 0 0.0 0.0 7-55 3 3 7/28/2004 No BIO No BIO 0 0.0 0.0 SU22 1 1 7/28/2004 Annelida Goniada brunnea 1 44.2 0.1 SU22 1 1 7/28/2004 Annelida Nereis procera 1 48.6 0.1 SU22 1 2 7/28/2004 Annelida Nereis procera 1 29.4 0.1 SU22 1 2 7/28/2004 Arthropoda Schmittius politus 1 ND ND head only SU22 1 3 7/28/2004 No BIO No BIO 0 0.0 0.0 SU22 2 1 7/28/2004 No BIO No BIO 0 0.0 0.0 SU22 2 2 7/28/2004 No BIO No BIO 0 0.0 0.0
Notes: No BIO = No organsims collected; Frag(s) = 1 organism
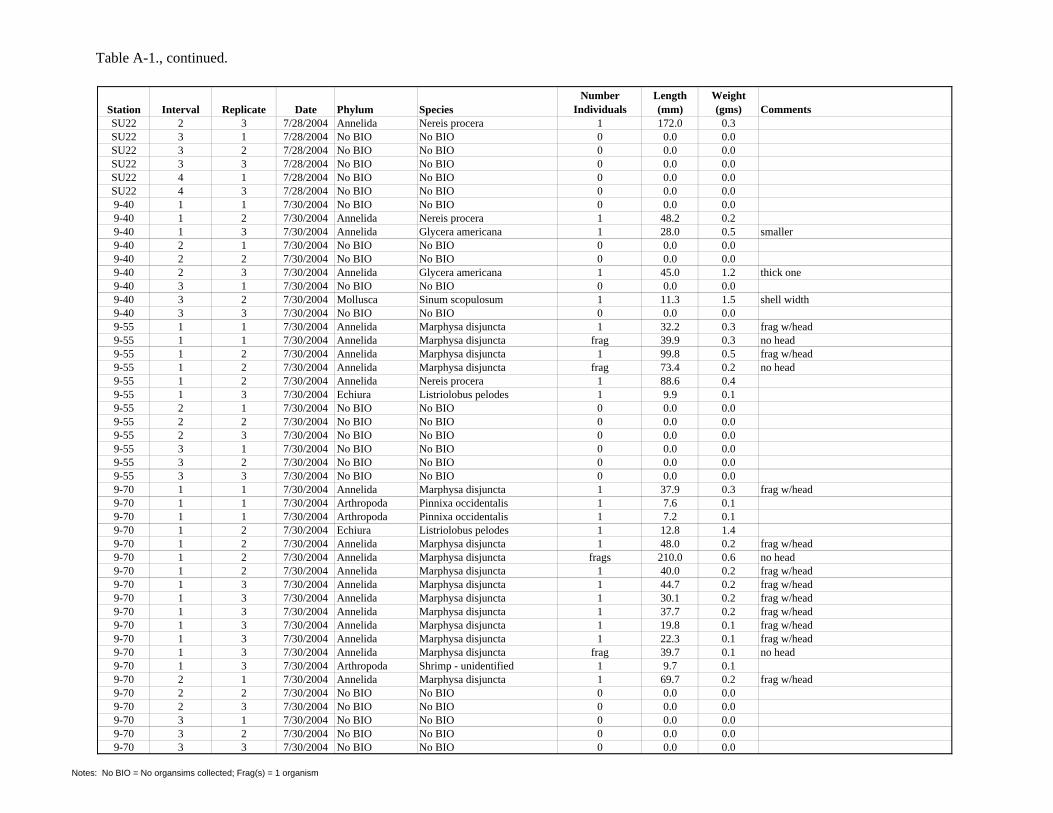
Table A-1., continued.
Station Interval Replicate Date Phylum Species Number
Individuals Length (mm)
Weight (gms) Comments
SU22 2 3 7/28/2004 Annelida Nereis procera 1 172.0 0.3 SU22 3 1 7/28/2004 No BIO No BIO 0 0.0 0.0 SU22 3 2 7/28/2004 No BIO No BIO 0 0.0 0.0 SU22 3 3 7/28/2004 No BIO No BIO 0 0.0 0.0 SU22 4 1 7/28/2004 No BIO No BIO 0 0.0 0.0 SU22 4 3 7/28/2004 No BIO No BIO 0 0.0 0.0 9-40 1 1 7/30/2004 No BIO No BIO 0 0.0 0.0 9-40 1 2 7/30/2004 Annelida Nereis procera 1 48.2 0.2 9-40 1 3 7/30/2004 Annelida Glycera americana 1 28.0 0.5 smaller 9-40 2 1 7/30/2004 No BIO No BIO 0 0.0 0.0 9-40 2 2 7/30/2004 No BIO No BIO 0 0.0 0.0 9-40 2 3 7/30/2004 Annelida Glycera americana 1 45.0 1.2 thick one 9-40 3 1 7/30/2004 No BIO No BIO 0 0.0 0.0 9-40 3 2 7/30/2004 Mollusca Sinum scopulosum 1 11.3 1.5 shell width 9-40 3 3 7/30/2004 No BIO No BIO 0 0.0 0.0 9-55 1 1 7/30/2004 Annelida Marphysa disjuncta 1 32.2 0.3 frag w/head 9-55 1 1 7/30/2004 Annelida Marphysa disjuncta frag 39.9 0.3 no head 9-55 1 2 7/30/2004 Annelida Marphysa disjuncta 1 99.8 0.5 frag w/head 9-55 1 2 7/30/2004 Annelida Marphysa disjuncta frag 73.4 0.2 no head 9-55 1 2 7/30/2004 Annelida Nereis procera 1 88.6 0.4 9-55 1 3 7/30/2004 Echiura Listriolobus pelodes 1 9.9 0.1 9-55 2 1 7/30/2004 No BIO No BIO 0 0.0 0.0 9-55 2 2 7/30/2004 No BIO No BIO 0 0.0 0.0 9-55 2 3 7/30/2004 No BIO No BIO 0 0.0 0.0 9-55 3 1 7/30/2004 No BIO No BIO 0 0.0 0.0 9-55 3 2 7/30/2004 No BIO No BIO 0 0.0 0.0 9-55 3 3 7/30/2004 No BIO No BIO 0 0.0 0.0 9-70 1 1 7/30/2004 Annelida Marphysa disjuncta 1 37.9 0.3 frag w/head 9-70 1 1 7/30/2004 Arthropoda Pinnixa occidentalis 1 7.6 0.1 9-70 1 1 7/30/2004 Arthropoda Pinnixa occidentalis 1 7.2 0.1 9-70 1 2 7/30/2004 Echiura Listriolobus pelodes 1 12.8 1.4 9-70 1 2 7/30/2004 Annelida Marphysa disjuncta 1 48.0 0.2 frag w/head 9-70 1 2 7/30/2004 Annelida Marphysa disjuncta frags 210.0 0.6 no head 9-70 1 2 7/30/2004 Annelida Marphysa disjuncta 1 40.0 0.2 frag w/head 9-70 1 3 7/30/2004 Annelida Marphysa disjuncta 1 44.7 0.2 frag w/head 9-70 1 3 7/30/2004 Annelida Marphysa disjuncta 1 30.1 0.2 frag w/head 9-70 1 3 7/30/2004 Annelida Marphysa disjuncta 1 37.7 0.2 frag w/head 9-70 1 3 7/30/2004 Annelida Marphysa disjuncta 1 19.8 0.1 frag w/head 9-70 1 3 7/30/2004 Annelida Marphysa disjuncta 1 22.3 0.1 frag w/head 9-70 1 3 7/30/2004 Annelida Marphysa disjuncta frag 39.7 0.1 no head 9-70 1 3 7/30/2004 Arthropoda Shrimp - unidentified 1 9.7 0.1 9-70 2 1 7/30/2004 Annelida Marphysa disjuncta 1 69.7 0.2 frag w/head 9-70 2 2 7/30/2004 No BIO No BIO 0 0.0 0.0 9-70 2 3 7/30/2004 No BIO No BIO 0 0.0 0.0 9-70 3 1 7/30/2004 No BIO No BIO 0 0.0 0.0 9-70 3 2 7/30/2004 No BIO No BIO 0 0.0 0.0 9-70 3 3 7/30/2004 No BIO No BIO 0 0.0 0.0
Notes: No BIO = No organsims collected; Frag(s) = 1 organism
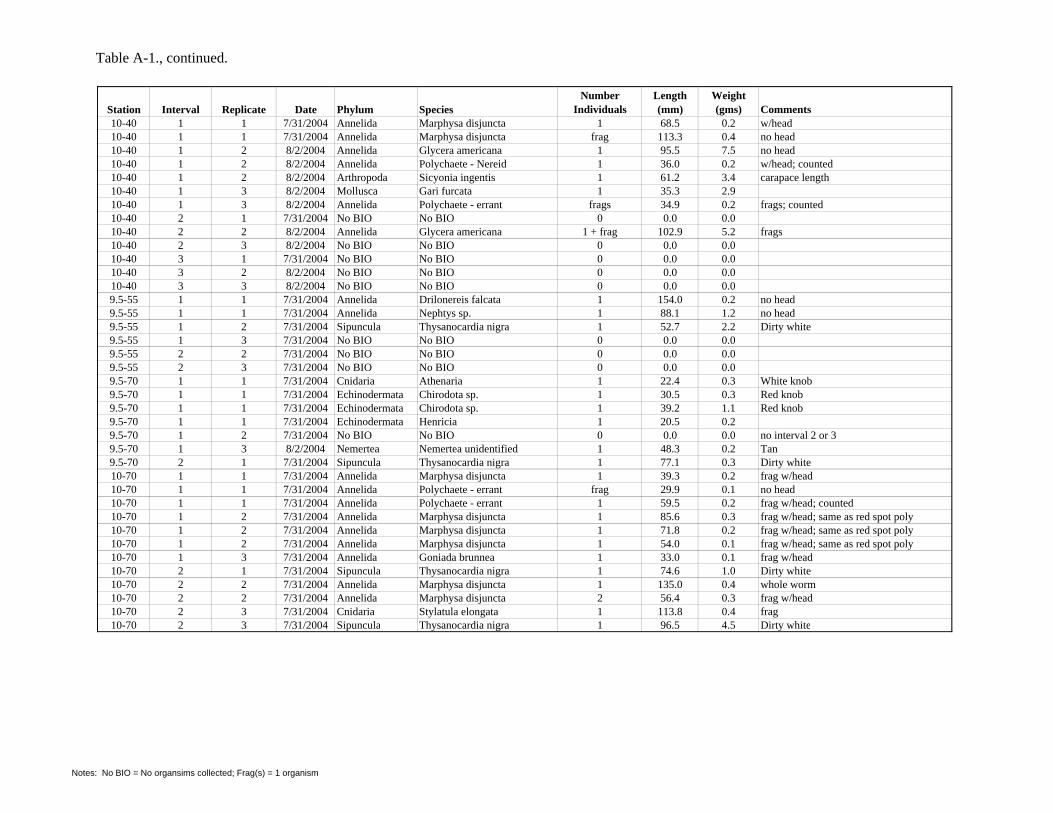
Table A-1., continued.
Station Interval Replicate Date Phylum Species Number
Individuals Length (mm)
Weight (gms) Comments
10-40 1 1 7/31/2004 Annelida Marphysa disjuncta 1 68.5 0.2 w/head 10-40 1 1 7/31/2004 Annelida Marphysa disjuncta frag 113.3 0.4 no head 10-40 1 2 8/2/2004 Annelida Glycera americana 1 95.5 7.5 no head 10-40 1 2 8/2/2004 Annelida Polychaete - Nereid 1 36.0 0.2 w/head; counted 10-40 1 2 8/2/2004 Arthropoda Sicyonia ingentis 1 61.2 3.4 carapace length 10-40 1 3 8/2/2004 Mollusca Gari furcata 1 35.3 2.9 10-40 1 3 8/2/2004 Annelida Polychaete - errant frags 34.9 0.2 frags; counted 10-40 2 1 7/31/2004 No BIO No BIO 0 0.0 0.0 10-40 2 2 8/2/2004 Annelida Glycera americana 1 + frag 102.9 5.2 frags 10-40 2 3 8/2/2004 No BIO No BIO 0 0.0 0.0 10-40 3 1 7/31/2004 No BIO No BIO 0 0.0 0.0 10-40 3 2 8/2/2004 No BIO No BIO 0 0.0 0.0 10-40 3 3 8/2/2004 No BIO No BIO 0 0.0 0.0 9.5-55 1 1 7/31/2004 Annelida Drilonereis falcata 1 154.0 0.2 no head 9.5-55 1 1 7/31/2004 Annelida Nephtys sp. 1 88.1 1.2 no head 9.5-55 1 2 7/31/2004 Sipuncula Thysanocardia nigra 1 52.7 2.2 Dirty white 9.5-55 1 3 7/31/2004 No BIO No BIO 0 0.0 0.0 9.5-55 2 2 7/31/2004 No BIO No BIO 0 0.0 0.0 9.5-55 2 3 7/31/2004 No BIO No BIO 0 0.0 0.0 9.5-70 1 1 7/31/2004 Cnidaria Athenaria 1 22.4 0.3 White knob 9.5-70 1 1 7/31/2004 Echinodermata Chirodota sp. 1 30.5 0.3 Red knob 9.5-70 1 1 7/31/2004 Echinodermata Chirodota sp. 1 39.2 1.1 Red knob 9.5-70 1 1 7/31/2004 Echinodermata Henricia 1 20.5 0.2 9.5-70 1 2 7/31/2004 No BIO No BIO 0 0.0 0.0 no interval 2 or 3 9.5-70 1 3 8/2/2004 Nemertea Nemertea unidentified 1 48.3 0.2 Tan 9.5-70 2 1 7/31/2004 Sipuncula Thysanocardia nigra 1 77.1 0.3 Dirty white 10-70 1 1 7/31/2004 Annelida Marphysa disjuncta 1 39.3 0.2 frag w/head 10-70 1 1 7/31/2004 Annelida Polychaete - errant frag 29.9 0.1 no head 10-70 1 1 7/31/2004 Annelida Polychaete - errant 1 59.5 0.2 frag w/head; counted 10-70 1 2 7/31/2004 Annelida Marphysa disjuncta 1 85.6 0.3 frag w/head; same as red spot poly 10-70 1 2 7/31/2004 Annelida Marphysa disjuncta 1 71.8 0.2 frag w/head; same as red spot poly 10-70 1 2 7/31/2004 Annelida Marphysa disjuncta 1 54.0 0.1 frag w/head; same as red spot poly 10-70 1 3 7/31/2004 Annelida Goniada brunnea 1 33.0 0.1 frag w/head 10-70 2 1 7/31/2004 Sipuncula Thysanocardia nigra 1 74.6 1.0 Dirty white 10-70 2 2 7/31/2004 Annelida Marphysa disjuncta 1 135.0 0.4 whole worm 10-70 2 2 7/31/2004 Annelida Marphysa disjuncta 2 56.4 0.3 frag w/head 10-70 2 3 7/31/2004 Cnidaria Stylatula elongata 1 113.8 0.4 frag 10-70 2 3 7/31/2004 Sipuncula Thysanocardia nigra 1 96.5 4.5 Dirty white
Notes: No BIO = No organsims collected; Frag(s) = 1 organism
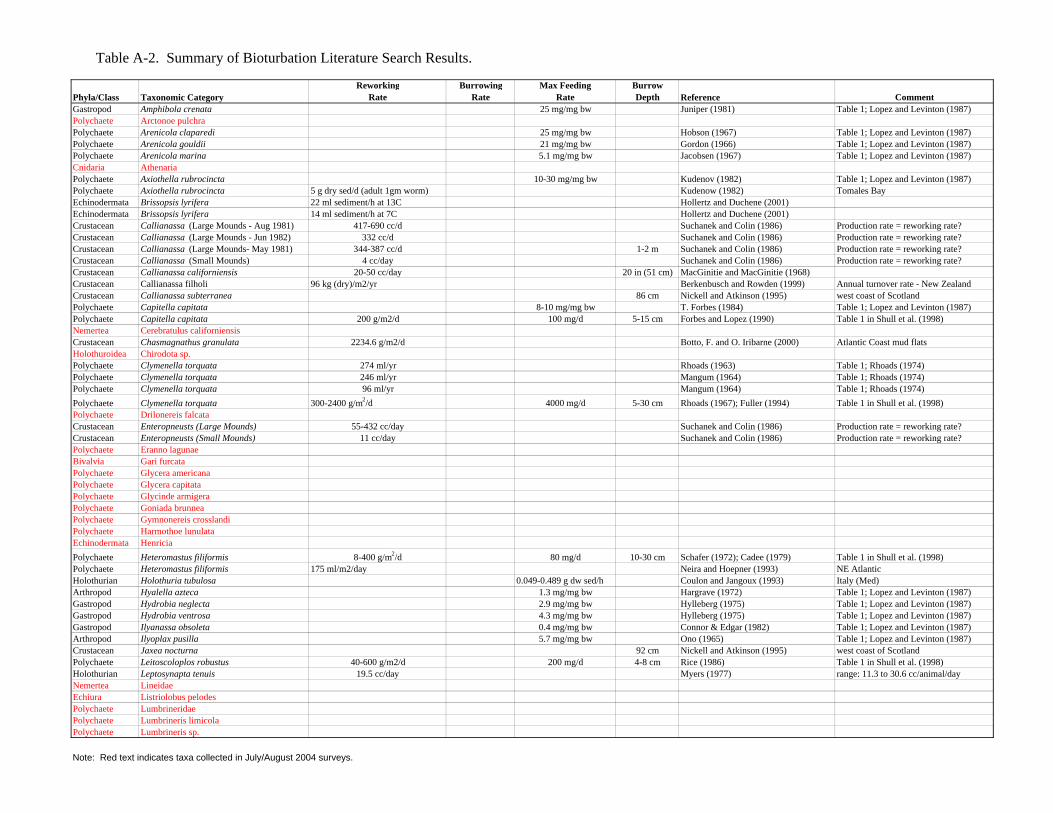
Table A-2. Summary of Bioturbation Literature Search Results.
Phyla/Class Taxonomic Category Reworking
Rate Burrowing
Rate Max Feeding
Rate Burrow Depth Reference Comment
Gastropod Amphibola crenata 25 mg/mg bw Juniper (1981) Table 1; Lopez and Levinton (1987) Polychaete Arctonoe pulchra Polychaete Arenicola claparedi 25 mg/mg bw Hobson (1967) Table 1; Lopez and Levinton (1987) Polychaete Arenicola gouldii 21 mg/mg bw Gordon (1966) Table 1; Lopez and Levinton (1987) Polychaete Arenicola marina 5.1 mg/mg bw Jacobsen (1967) Table 1; Lopez and Levinton (1987) Cnidaria Athenaria Polychaete Axiothella rubrocincta 10-30 mg/mg bw Kudenov (1982) Table 1; Lopez and Levinton (1987) Polychaete Axiothella rubrocincta 5 g dry sed/d (adult 1gm worm) Kudenow (1982) Tomales Bay Echinodermata Brissopsis lyrifera 22 ml sediment/h at 13C Hollertz and Duchene (2001) Echinodermata Brissopsis lyrifera 14 ml sediment/h at 7C Hollertz and Duchene (2001) Crustacean Callianassa (Large Mounds - Aug 1981) 417-690 cc/d Suchanek and Colin (1986) Production rate = reworking rate? Crustacean Callianassa (Large Mounds - Jun 1982) 332 cc/d Suchanek and Colin (1986) Production rate = reworking rate? Crustacean Callianassa (Large Mounds- May 1981) 344-387 cc/d 1-2 m Suchanek and Colin (1986) Production rate = reworking rate? Crustacean Callianassa (Small Mounds) 4 cc/day Suchanek and Colin (1986) Production rate = reworking rate? Crustacean Callianassa californiensis 20-50 cc/day 20 in (51 cm) MacGinitie and MacGinitie (1968) Crustacean Callianassa filholi 96 kg (dry)/m2/yr Berkenbusch and Rowden (1999) Annual turnover rate - New Zealand Crustacean Callianassa subterranea 86 cm Nickell and Atkinson (1995) west coast of Scotland Polychaete Capitella capitata 8-10 mg/mg bw T. Forbes (1984) Table 1; Lopez and Levinton (1987) Polychaete Capitella capitata 200 g/m2/d 100 mg/d 5-15 cm Forbes and Lopez (1990) Table 1 in Shull et al. (1998) Nemertea Cerebratulus californiensis Crustacean Chasmagnathus granulata 2234.6 g/m2/d Botto, F. and O. Iribarne (2000) Atlantic Coast mud flats Holothuroidea Chirodota sp. Polychaete Clymenella torquata 274 ml/yr Rhoads (1963) Table 1; Rhoads (1974) Polychaete Clymenella torquata 246 ml/yr Mangum (1964) Table 1; Rhoads (1974) Polychaete Clymenella torquata 96 ml/yr Mangum (1964) Table 1; Rhoads (1974) Polychaete Clymenella torquata 300-2400 g/m2/d 4000 mg/d 5-30 cm Rhoads (1967); Fuller (1994) Table 1 in Shull et al. (1998) Polychaete Drilonereis falcata Crustacean Enteropneusts (Large Mounds) 55-432 cc/day Suchanek and Colin (1986) Production rate = reworking rate? Crustacean Enteropneusts (Small Mounds) 11 cc/day Suchanek and Colin (1986) Production rate = reworking rate? Polychaete Eranno lagunae Bivalvia Gari furcata Polychaete Glycera americana Polychaete Glycera capitata Polychaete Glycinde armigera Polychaete Goniada brunnea Polychaete Gymnonereis crosslandi Polychaete Harmothoe lunulata Echinodermata Henricia Polychaete Heteromastus filiformis 8-400 g/m2/d 80 mg/d 10-30 cm Schafer (1972); Cadee (1979) Table 1 in Shull et al. (1998) Polychaete Heteromastus filiformis 175 ml/m2/day Neira and Hoepner (1993) NE Atlantic Holothurian Holothuria tubulosa 0.049-0.489 g dw sed/h Coulon and Jangoux (1993) Italy (Med) Arthropod Hyalella azteca 1.3 mg/mg bw Hargrave (1972) Table 1; Lopez and Levinton (1987) Gastropod Hydrobia neglecta 2.9 mg/mg bw Hylleberg (1975) Table 1; Lopez and Levinton (1987) Gastropod Hydrobia ventrosa 4.3 mg/mg bw Hylleberg (1975) Table 1; Lopez and Levinton (1987) Gastropod Ilyanassa obsoleta 0.4 mg/mg bw Connor & Edgar (1982) Table 1; Lopez and Levinton (1987) Arthropod Ilyoplax pusilla 5.7 mg/mg bw Ono (1965) Table 1; Lopez and Levinton (1987) Crustacean Jaxea nocturna 92 cm Nickell and Atkinson (1995) west coast of Scotland Polychaete Leitoscoloplos robustus 40-600 g/m2/d 200 mg/d 4-8 cm Rice (1986) Table 1 in Shull et al. (1998) Holothurian Leptosynapta tenuis 19.5 cc/day Myers (1977) range: 11.3 to 30.6 cc/animal/day Nemertea Lineidae Echiura Listriolobus pelodes Polychaete Lumbrineridae Polychaete Lumbrineris limicola Polychaete Lumbrineris sp.
Note: Red text indicates taxa collected in July/August 2004 surveys.
Table A-2., continued.
Phyla/Class Taxonomic Category Reworking
Rate Burrowing
Rate Max Feeding
Rate Burrow Depth Reference Comment
Bivalve Macoma balthica 9 mg/mg bw Kofoed unpubl. Table 1; Lopez and Levinton (1987) Bivalve Macoma balthica 2-20 g/m2/d 20 mg/d 4-6 cm Reise (1983) Table 1 in Shull et al. (1998) Bivalve Macoma nasuta 1-2 mg/mg bw Hylleburg & Gallucci (1975) Table 1; Lopez and Levinton (1987) Polychaete Marphysa disjuncta Nemertea Nemertea Nemertea Nemertea unidentified Crustacea Neotrypaea californiensis Crustacea Neotrypaea sp. Polychaete Nephtys sp. Polychaete Nereis procera Polychaete Nereis procera Polychaete Nereis succinea 3.5 mg/mg bw Cammen (1980a) Table 1; Lopez and Levinton (1987) Polychaete Notomastus lineatus Bivalve Nucula annulata 2-5 mg/mg bw Cheng (1983) Table 1; Lopez and Levinton (1987) Bivalve Nucula annulata 365 ml/yr Young (1971) Table 1; Rhoads (1974) Crustacea Oxyurostylis smithi 0.125 cc/day Myers (1977) Table 4; Myers (1977) Crustacea Paraphoxus spinosus 5.4 cc/dy Myers (1977) Table 4; Myers (1977) Polychaete Pectinaria gouldii 400 ml/yr Gordon (1966) Table 1; Rhoads (1974) Cnidaria Pennatulacea Crustacea Pinnixa Crustacea Pinnixa occidentalis Polychaete Polychaete - errant Polychaete Polychaete - Nereid Gastropod Potamopyrgus jenkensi 5.9 mg/mg bw Heywood & Edwards (1962) Table 1; Lopez and Levinton (1987) Polychaete Praxillella pacifica 164.5-636.51 mg wet/animal/d Harkantra, Yun, and Kikuchi (1989) lab work - Japan Polychaete Praxillella pacifica 84.3 kg. wet/m2 = Annual Harkantra, Yun, and Kikuchi (1989) lab work - Japan Polychaete Praxillella pacifica 164.5-636.51 mg wet/indiv/d Harkantra, Yun, and Kikuchi (1989) Japan Crustacea Schmittius politus Polychaete Scoloplos armiger 40-600 g/m2/d 200 mg/d 4-8 cm Rice (1986) Table 1 in Shull et al. (1998) Polychaete Scoloplos robustus 0.06 cc/day 0.31 cc/day Myers (1977) Table 4; Myers (1977) Polychaete Scoloplus sp. 45-120 mg/mg bw D. Rice unpubl. Table 1; Lopez and Levinton (1987) Arthropod Scopimera globosa 0.8 mg/mg bw Ono (1965) Table 1; Lopez and Levinton (1987) Crustacea Shrimp - unidentified Crustacea Sicyonia ingentis Mollusca Sinum scopulosum Polychaete Sthenelais verruculosa Polychaete Sthenelanella uniformis Cnidaria Stylatula elongata Bivalve Tellina agilis 4-6 cm Aller and Yingst (1985) Table 1 in Shull et al. (1998) Sipuncula Thysanocardia nigra Polychaete Tubifex tubifex 1.6 mg/mg bw Ivlev (1939) Table 1; Lopez and Levinton (1987) Nemertea Tubulanus cingulatus Nemertea Tubulanus polymorphus Crustacean Uca uruguayensis 678.9 g/m2/d Botto, F. and O. Iribarne (2000) Atlantic Coast mud flats Crustacean Upogebia stellata 26.5 cm Nickell and Atkinson (1995) west coast of Scotland Echiura Urechis caupo 266 + 158 ml/min Osovitz and Julian (2002) Burrowing irrigation rate Bivalve Yoldia limatula 10-20 mg/mg bw Bender & Davis (1984) Table 1; Lopez and Levinton (1987) Bivalve Yoldia limatula 257 ml/yr Rhoads (1963) Table 1; Rhoads (1974) Bivalve Yoldia limatula 6-38 g/m2/d 280 mg/d 2-4 cm Rhodes (1963); Bender & Davis (1984) Table 1 in Shull et al. (1998)
Note: Red text indicates taxa collected in July/August 2004 surveys.
APPENDIX B
RESULTS SUMMARY AND PHOTOGRAPHS FROM SEDIMENT-PROFILE IMAGERY (SPI) AND PLAN-VIEW CAMERA
SURVEY AT PALOS VERDES SHELF STATIONS, JULY 2004
FIGURE B-1
PHOTOGRAPHS FROM SEDIMENT-PROFILE IMAGERY (SPI)
AND PLAN-VIEW CAMERA, JULY 2004
(SPI viewing area is 20 cm high x 14 cm wide; plan-view area is approximately 0.3 m2)
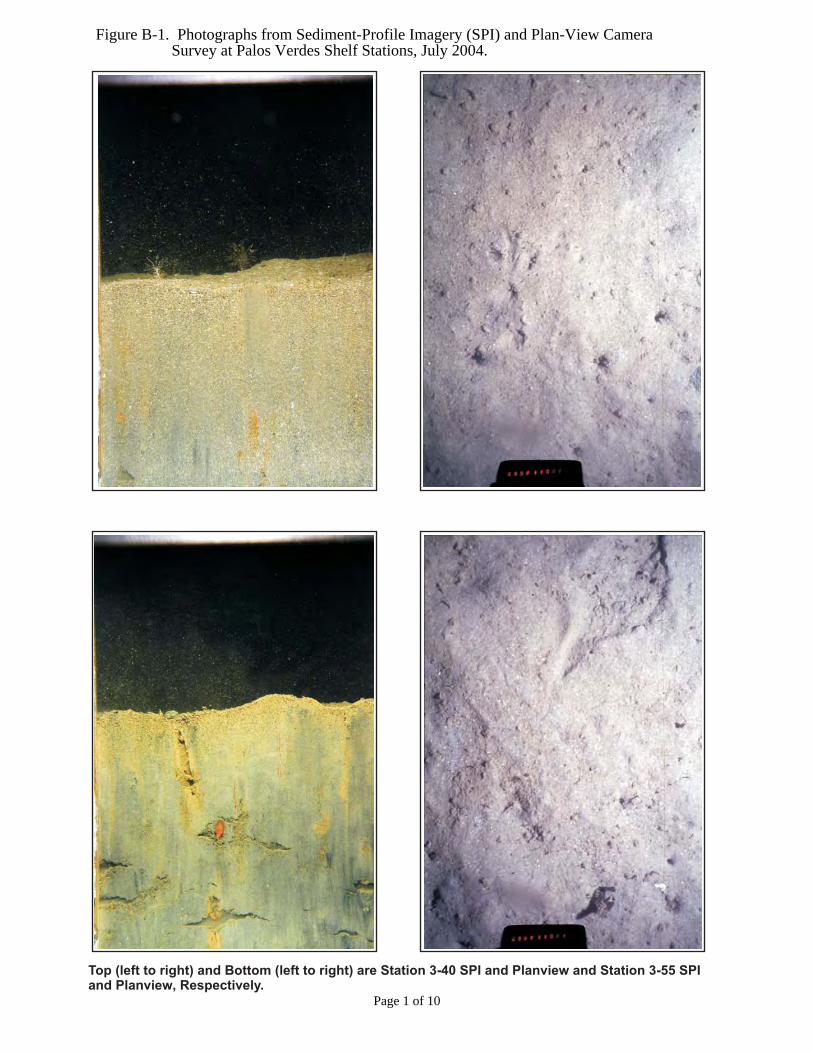
Figure B-1. Photographs from Sediment-Profile Imagery (SPI) and Plan-View Camera Survey at Palos Verdes Shelf Stations, July 2004.
Top (left to right) and Bottom (left to right) are Station 3-40 SPI and Planview and Station 3-55 SPI and Planview , Respectively.
Page 1 of 10
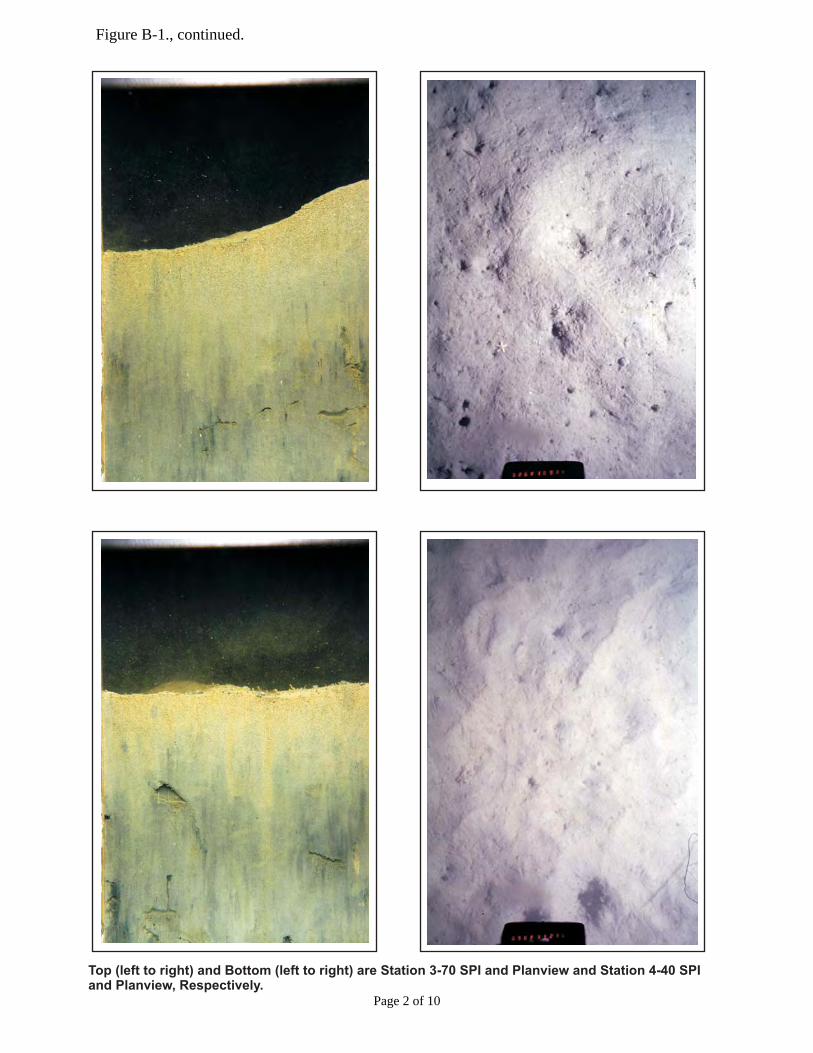
Figure B-1., continued.
Top (left to right) and Bottom (left to right) are Station 3-70 SPI and Planview and Station 4-40 SPI and Planview, Respectively.
Page 2 of 10
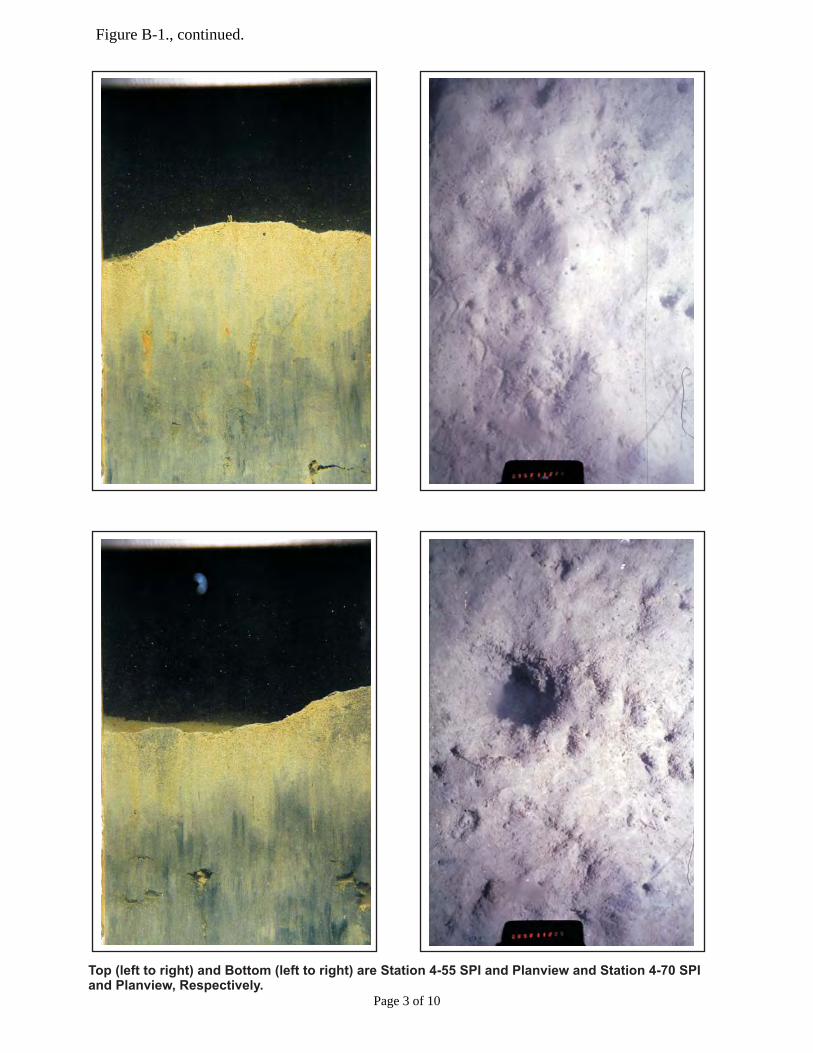
Figure B-1., continued.
Top (left to right) and Bottom (left to right) are Station 4-55 SPI and Planview and Station 4-70 SPI and Planview, Respectively.
Page 3 of 10
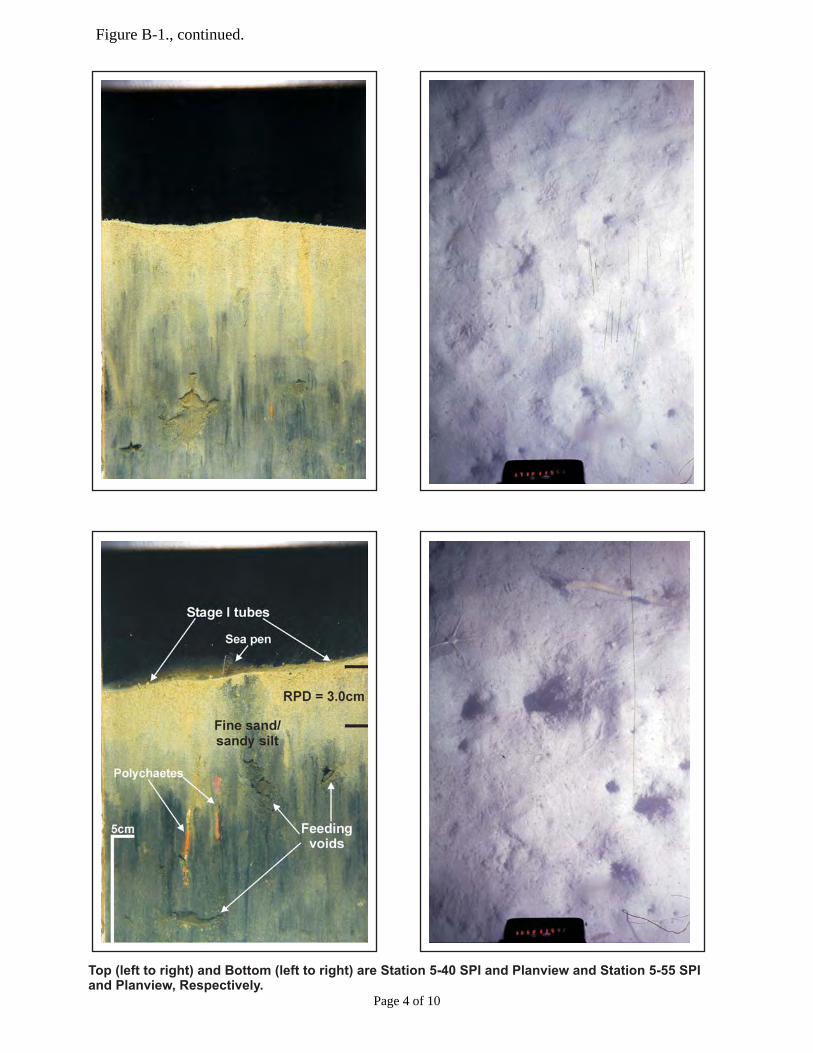
Figure B-1., continued.
Top (left to right) and Bottom (left to right) are Station 5-40 SPI and Planview and Station 5-55 SPI and Planview, Respectively.
Page 4 of 10

Figure B-1., continued.
Top (left to right) and Bottom (left to right) are Station 5-70 SPI and Planview and Station LD27 SPI and Planview, Respectively.
Page 5 of 10
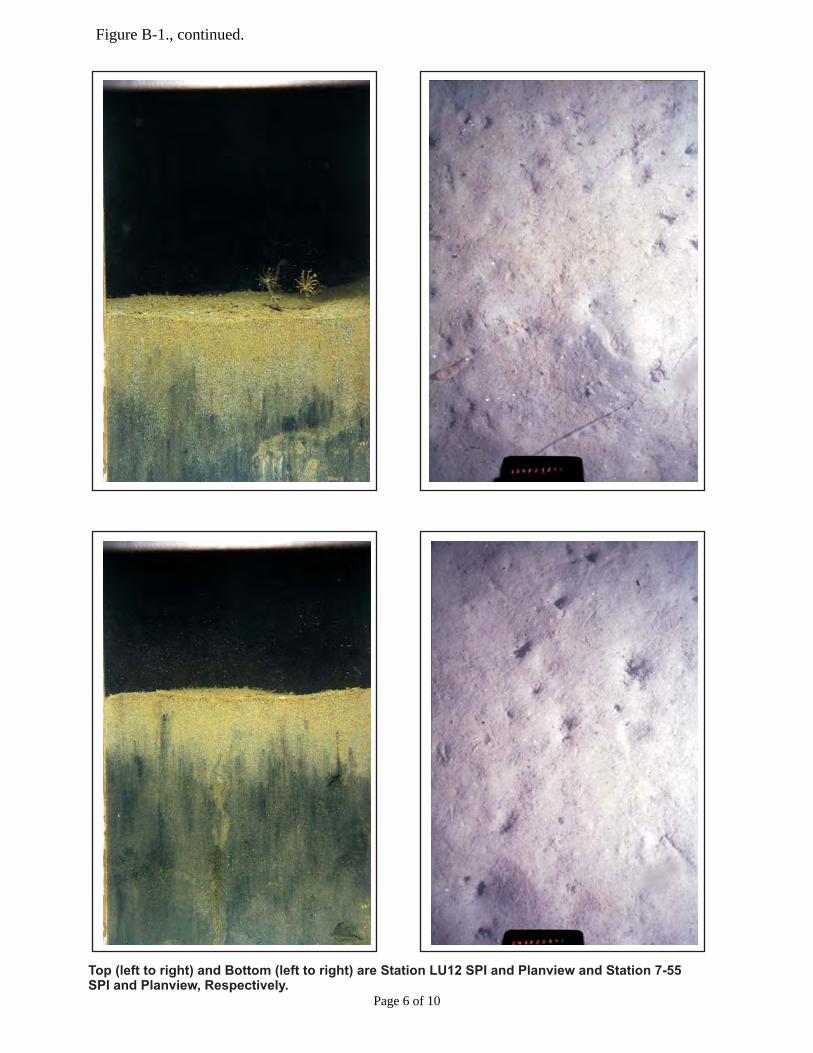
Figure B-1., continued.
Top (left to right) and Bottom (left to right) are Station LU12 SPI and Planview and Station 7-55 SPI and Planview, Respectively.
Page 6 of 10

Figure B-1., continued.
Top (left to right) and Bottom (left to right) are Station SU22 SPI and Planview and Station 9-40 SPI and Planview, Respectively.
Page 7 of 10

Figure B-1., continued.
Top (left to right) and Bottom (left to right) are Station 9-55 SPI and Planview and Station 9-70 SPI and Planview, Respectively.
Page 8 of 10

Figure B-1., continued.
Top (left to right) and Bottom (left to right) are Station 10-40 SPI and Planview and Station 10-55 SPI and Planview, Respectively.
Page 9 of 10
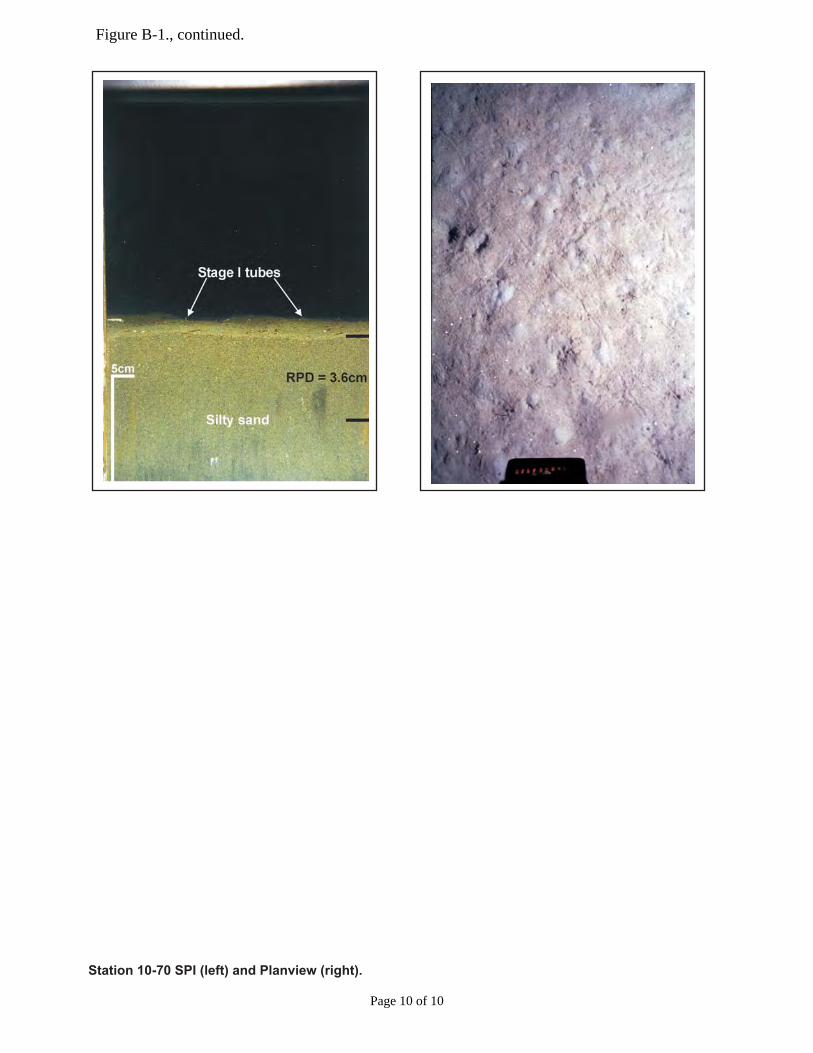
Figure B-1., continued.
Station 10-70 SPI (left) and Planview (right).
Page 10 of 10
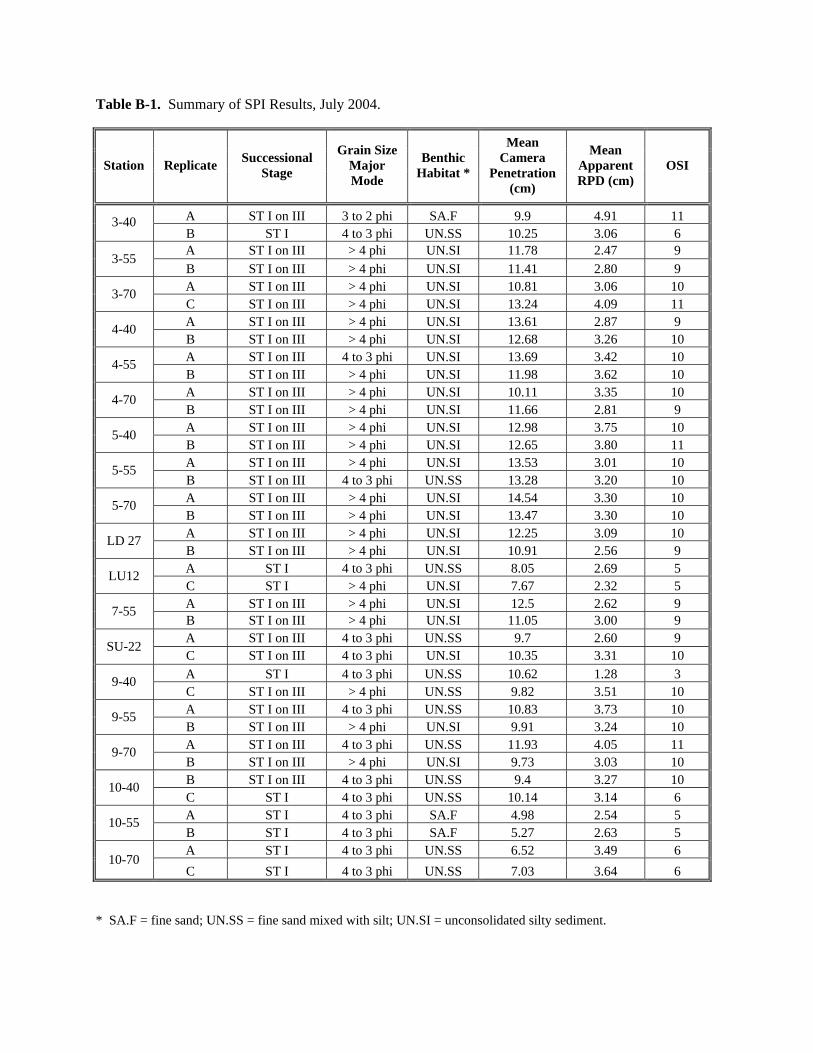
Table B-1. Summary of SPI Results, July 2004.
Station Replicate Successional Stage
Grain Size Major Mode
Benthic Habitat *
Mean Camera
Penetration (cm)
Mean Apparent RPD (cm)
OSI
3-40 A ST I on III 3 to 2 phi SA.F 9.9 4.91 11 B ST I 4 to 3 phi UN.SS 10.25 3.06 6
3-55 A ST I on III > 4 phi UN.SI 11.78 2.47 9 B ST I on III > 4 phi UN.SI 11.41 2.80 9
3-70 A ST I on III > 4 phi UN.SI 10.81 3.06 10 C ST I on III > 4 phi UN.SI 13.24 4.09 11
4-40 A ST I on III > 4 phi UN.SI 13.61 2.87 9 B ST I on III > 4 phi UN.SI 12.68 3.26 10
4-55 A ST I on III 4 to 3 phi UN.SI 13.69 3.42 10 B ST I on III > 4 phi UN.SI 11.98 3.62 10
4-70 A ST I on III > 4 phi UN.SI 10.11 3.35 10 B ST I on III > 4 phi UN.SI 11.66 2.81 9
5-40 A ST I on III > 4 phi UN.SI 12.98 3.75 10 B ST I on III > 4 phi UN.SI 12.65 3.80 11
5-55 A ST I on III > 4 phi UN.SI 13.53 3.01 10 B ST I on III 4 to 3 phi UN.SS 13.28 3.20 10
5-70 A ST I on III > 4 phi UN.SI 14.54 3.30 10 B ST I on III > 4 phi UN.SI 13.47 3.30 10
LD 27 A ST I on III > 4 phi UN.SI 12.25 3.09 10 B ST I on III > 4 phi UN.SI 10.91 2.56 9
LU12 A ST I 4 to 3 phi UN.SS 8.05 2.69 5 C ST I > 4 phi UN.SI 7.67 2.32 5
7-55 A ST I on III > 4 phi UN.SI 12.5 2.62 9 B ST I on III > 4 phi UN.SI 11.05 3.00 9
SU-22 A ST I on III 4 to 3 phi UN.SS 9.7 2.60 9 C ST I on III 4 to 3 phi UN.SI 10.35 3.31 10
9-40 A ST I 4 to 3 phi UN.SS 10.62 1.28 3 C ST I on III > 4 phi UN.SS 9.82 3.51 10
9-55 A ST I on III 4 to 3 phi UN.SS 10.83 3.73 10 B ST I on III > 4 phi UN.SI 9.91 3.24 10
9-70 A ST I on III 4 to 3 phi UN.SS 11.93 4.05 11 B ST I on III > 4 phi UN.SI 9.73 3.03 10
10-40 B ST I on III 4 to 3 phi UN.SS 9.4 3.27 10 C ST I 4 to 3 phi UN.SS 10.14 3.14 6
10-55 A ST I 4 to 3 phi SA.F 4.98 2.54 5 B ST I 4 to 3 phi SA.F 5.27 2.63 5
10-70 A ST I 4 to 3 phi UN.SS 6.52 3.49 6 C ST I 4 to 3 phi UN.SS 7.03 3.64 6
* SA.F = fine sand; UN.SS = fine sand mixed with silt; UN.SI = unconsolidated silty sediment.

Table B-2. Plan-View Results, July 2004.
Station Obscured General Bottom Description Sand Silt/Clay Epifauna Infauna Burrows Bedforms Shell
Material Other Notables
3-40 no medium to fine sand medium to fine yes no tube worms 8+ no little shell
hash Fecal mounds.
3-55 no soft fine yes no tube worms 3+ no yes Mark in sediment from fish (flatfish?) or ray. Small tube in top left corner of image.
3-70 no burrows/silt/fine sand fine yes seastar tube worms 36+ no no Seastar, fecal mound, organism tracks.
4-40 no soft/ripples fine yes no no 5+ sand ripples no Debris on slide (bottom right). Small sand ripples.
4-55 no soft fine yes no tube worms 10+ no yes Organism trail marks in mud. Debris on lens (bottom right).
4-70 no large burrow/sea
pens/soft sed w/ fine sand
fine yes sea pens sea
cucumber/ tube worms
19+ no shell hash Burrowing sea cucumber at left of image, one large burrow, possible ghost shrimp.
5-40 no soft fine yes no tube worms 6+ sand ripples no Organism trails in mud.
5-55 no large burrows/soft sed w/ fine sand fine yes brittlestars tube worms 18+ no no Brittlestar. Unknown biological feature
in upper right corner.
5-70 no brittle stars/burrows/soft sed w/ fine sand fine yes brittlestars tube worms 14+ no few shell
hash Organism tracks. Detritus on left.
LD27 no soft fine yes sea pen no 3+ no yes Sea pen (top right of image).
LU12 no soft fine yes organism? tube worm 5+ no yes Organism (left side of image). Possible dead sea pen (bottom right). Brown algal mat.
7-55 no numerous burrows/soft sed w/ fine sand fine yes no no 14+ no no Organism tracks.
SU22 no soft/brittle stars fine yes brittle stars/sea pen tube worm 3+ no yes Many brittle stars. Tube worms and
sea pen (center of image).
9-40 no soft/large tube worms fine yes no tube worms 4+ no yes Large tube worms (center of image).
9-55 no medium to fine sand medium to fine yes no tube worms 5+ no little shell
hash Discarded tube on surface at top of image.
9-70 no soft/dead sea pens fine yes sea pen tube worms 9+ no yes Dead sea pens.
10-40 no soft/large burrow fine yes no tube worms 2+ no yes Two large burrows (top left of image). Brown algal mat. Fecal mounds.
10-55 no soft sed w/ fine sand fine yes no tube worms 0 no some shell hash Fecal mounds, detritus.
10-70 no soft sed w/ fine sand fine yes no tube worms 6+ no few shell hash
Brown algal mat. Fecal mounds, organism tracks.

APPENDIX C
RESULTS SUMMARY FROM SEDIMENT MIXING RATES/BIOTURBATION POTENTIAL SURVEY AT PALOS VERDES SHELF STATIONS,
JULY 2004
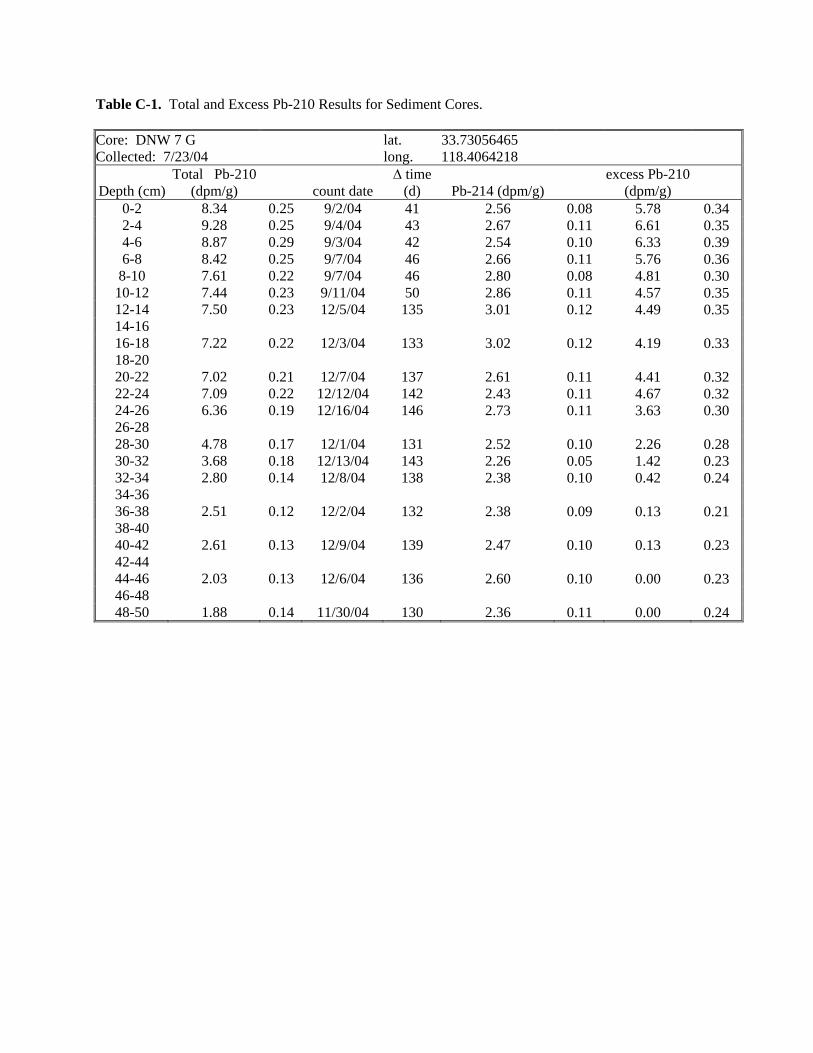
Table C-1. Total and Excess Pb-210 Results for Sediment Cores.
Core: DNW 7 G lat. 33.73056465 Collected: 7/23/04 long. 118.4064218
Total Pb-210 ∆ time excess Pb-210 Depth (cm) (dpm/g) � count date (d) Pb-214 (dpm/g) � (dpm/g) �
0-2 8.34 2-4 9.28 4-6 8.87 6-8 8.42
8-10 7.61 10-12 7.44 12-14 7.50 14-16 16-18 7.22 18-20 20-22 7.02 22-24 7.09 24-26 6.36 26-28 28-30 4.78 30-32 3.68 32-34 2.80 34-36 36-38 2.51 38-40 40-42 2.61 42-44 44-46 2.03 46-48 48-50 1.88
0.25 0.25 0.29 0.25 0.22 0.23 0.23
0.22
0.21 0.22 0.19
0.17 0.18 0.14
0.12
0.13
0.13
0.14
9/2/04 9/4/04 9/3/04 9/7/04 9/7/04 9/11/04 12/5/04
12/3/04
12/7/04 12/12/04 12/16/04
12/1/04 12/13/04 12/8/04
12/2/04
12/9/04
12/6/04
11/30/04
41 43 42 46 46 50
135
133
137 142 146
131 143 138
132
139
136
130
2.56 2.67 2.54 2.66 2.80 2.86 3.01
3.02
2.61 2.43 2.73
2.52 2.26 2.38
2.38
2.47
2.60
2.36
0.08 0.11 0.10 0.11 0.08 0.11 0.12
0.12
0.11 0.11 0.11
0.10 0.05 0.10
0.09
0.10
0.10
0.11
5.78 6.61 6.33 5.76 4.81 4.57 4.49
4.19
4.41 4.67 3.63
2.26 1.42 0.42
0.13
0.13
0.00
0.00
0.34 0.35 0.39 0.36 0.30 0.35 0.35
0.33
0.32 0.32 0.30
0.28 0.23 0.24
0.21
0.23
0.23
0.24
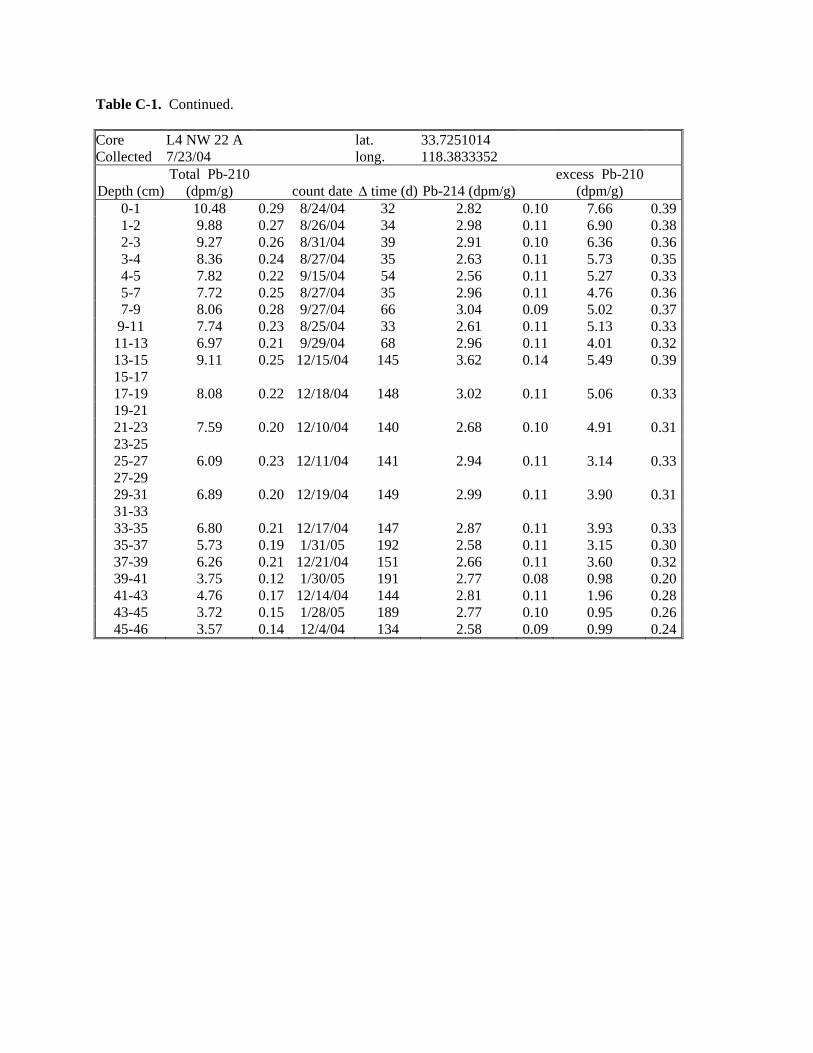
Table C-1. Continued.
Core L4 NW 22 A lat. 33.7251014 Collected 7/23/04 long. 118.3833352
Total Pb-210 excess Pb-210 Depth (cm) (dpm/g) � count date ∆ time (d) Pb-214 (dpm/g) � (dpm/g) �
0-1 10.48 1-2 9.88 2-3 9.27 3-4 8.36 4-5 7.82 5-7 7.72 7-9 8.06
9-11 7.74 11-13 6.97 13-15 9.11 15-17 17-19 8.08 19-21 21-23 7.59 23-25 25-27 6.09 27-29 29-31 6.89 31-33 33-35 6.80 35-37 5.73 37-39 6.26 39-41 3.75 41-43 4.76 43-45 3.72 45-46 3.57
0.29 8/24/04 32 2.82 0.27 8/26/04 34 2.98 0.26 8/31/04 39 2.91 0.24 8/27/04 35 2.63 0.22 9/15/04 54 2.56 0.25 8/27/04 35 2.96 0.28 9/27/04 66 3.04 0.23 8/25/04 33 2.61 0.21 9/29/04 68 2.96 0.25 12/15/04 145 3.62
0.22 12/18/04 148 3.02
0.20 12/10/04 140 2.68
0.23 12/11/04 141 2.94
0.20 12/19/04 149 2.99
0.21 12/17/04 147 2.87 0.19 1/31/05 192 2.58 0.21 12/21/04 151 2.66 0.12 1/30/05 191 2.77 0.17 12/14/04 144 2.81 0.15 1/28/05 189 2.77 0.14 12/4/04 134 2.58
0.10 0.11 0.10 0.11 0.11 0.11 0.09 0.11 0.11 0.14
0.11
0.10
0.11
0.11
0.11 0.11 0.11 0.08 0.11 0.10 0.09
7.66 6.90 6.36 5.73 5.27 4.76 5.02 5.13 4.01 5.49
5.06
4.91
3.14
3.90
3.93 3.15 3.60 0.98 1.96 0.95 0.99
0.39 0.38 0.36 0.35 0.33 0.36 0.37 0.33 0.32 0.39
0.33
0.31
0.33
0.31
0.33 0.30 0.32 0.20 0.28 0.26 0.24

Table C-1. Continued.
Core L5 NW 45 C lat. 33.71880604 Collected 7/24/04 long. 118.3746783
Total Pb-210 ∆ time excess Pb-210 Depth (cm) (dpm/g) � count date (d) Pb-214 (dpm/g) � (dpm/g) �
0-1 10.31 1-2 11.27 2-3 10.17 3-4 9.58 4-5 9.65 5-7 9.38 7-9 8.74
9-11 8.77 11-13 8.52 13-15 8.28 15-17 8.32 17-19 8.37 19-21 8.08 21-23 7.61 23-25 7.84 25-27 6.95 27-29 29-31 6.64 31-33 33-35 8.52 35-37 37-39 8.42 39-41 6.81 41-43 7.05 43-45 45-47 6.61
0.23 0.26 0.24 0.22 0.25 0.25 0.23 0.22 0.26 0.29 0.26 0.26 0.26 0.17 0.23 0.23
0.21
0.32
0.24 0.22 0.23
0.22
9/9/04 9/11/04 9/13/04 9/12/04 9/14/04 9/17/04 9/20/04 9/10/04 9/21/04 9/22/04 9/23/04 9/24/04 9/25/04 9/27/04 9/28/04 9/29/04
12/10/04
12/6/04
12/4/04 12/11/04 12/5/04
12/3/04
47 49 51 50 52 55 58 48 59 60 61 62 63 65 66 67
139
135
133 140 134
132
1.89 2.09 1.93 1.87 1.93 1.73 1.93 1.76 1.91 1.91 1.86 1.90 1.99 1.95 1.74 1.98
1.87
1.74
1.79 1.51 1.67
1.83
0.06 0.08 0.08 0.07 0.08 0.08 0.08 0.07 0.08 0.08 0.08 0.08 0.08 0.06 0.08 0.08
0.08
0.08
0.07 0.06 0.08
0.09
8.43 9.18 8.24 7.71 7.72 7.66 6.81 7.01 6.61 6.37 6.47 6.47 6.09 5.66 6.09 4.97
4.77
6.78
6.62 5.30 5.38
4.78
0.29 0.34 0.31 0.29 0.33 0.33 0.30 0.29 0.34 0.37 0.34 0.34 0.34 0.23 0.30 0.31
0.29
0.39
0.31 0.28 0.30
0.31
Table C-1. Continued.
Core L9.5 55 F lat. 33.7251014 Collected 7/23/04 long. 118.3833352
total Pb-210 ∆ time excess Pb-Depth (cm) (dpm/g) � count date (d) Pb-214 (dpm/g) � 210 (dpm/g)
0-1 7.04 1-2 2-3 6.91 3-4 4-5 6.84 5-7 6.06 7-9 5.42
9-11 4.19 11-13 3.56 13-15 2.52 15-17 2.51 17-19 1.84 19-21 1.65 21-23 23-25 1.94 25-27 27-29 1.49 29.31 31-33 1.72 33-35 35-37 1.65
0.32
0.21
0.18 0.20 0.20 0.14 0.16 0.14 0.13 0.13 0.12
0.12
0.12
0.12
0.12
12/12/04
12/18/04
12/14/04 12/23/04 12/17/04 12/26/04 12/7/04
12/22/04 12/9/04
12/24/04 12/16/04
12/19/04
12/13/04
12/15/04
12/8/04
142
148
144 153 147 156 137 152 139 154 146
149
143
145
138
1.85
2.03
2.16 2.01 2.04 2.25 2.18 2.07 2.35 1.87 2.02
2.06
1.99
2.04
2.06
0.07 5.19
0.07 4.88
0.07 4.69 0.07 4.04 0.08 3.38 0.06 1.94 0.08 1.37 0.08 0.46 0.08 0.16 0.08 0.00 0.07 0.00
0.08 0.00
0.08 0.00
0.08 0.00
0.08 0.00

Table C-2. Total and Excess Th-234 Data from Detailed Stations.
Core DNW 7 G lat. 33.73056465 Collected 7/23/04 long. 118.4064218
Total Th-234 ∆ time supported Th-234 excess Th-Depth (cm) (dpm/g) � count date (d) (dpm/g) � 234 (dpm/g) �
0-2 3.50 2-4 2.80 4-6 2.51 6-8 2.25
8-10 2.38 10-12 2.71
0.14 0.16 0.15 0.16 0.12 0.16
9/2/04 9/4/04 9/3/04 9/7/04 9/7/04 9/11/04
41 43 42 46 46 50
2.21 2.23 2.37 2.37 2.37 2.67
0.14 4.19 0.12 1.96 0.14 0.48 0.14 0.14 0.17
0.64 0.70 0.70
Core L4 NW 22 A lat. 33.7251014 Collected 7/23/04 long. 118.3833352
excess Th-Total Th-234 ∆ time supported Th-234 234
Depth (cm) (dpm/g) � count date (d) (dpm/g) � (dpm/g) � 0-1 7.00 0.21 8/24/04 32 2.30 0.16 11.78 0.65 1-2 3.82 0.18 8/26/04 34 2.33 0.17 3.97 0.66 2-3 2.79 0.15 8/31/04 39 2.21 0.17 1.77 0.69 3-4 2.59 0.17 8/27/04 35 2.33 0.17 0.70 0.66 4-5 2.47 0.16 9/15/04 54 2.33 0.17 0.65 1.12 5-7 2.60 0.15 8/27/04 35 2.33 0.17 7-9 2.57 0.13 9/27/04 66 2.33 0.17
9-11 2.60 0.16 8/25/04 33 2.33 0.17
Core L4 NW 22 B lat. 33.72515338 Collected 7/23/04 long. 118.3833452
excess Th-Total Th-234 ∆ time supported Th-234 234
Depth (cm) (dpm/g) � count date (d) (dpm/g) � (dpm/g) � 0-1 4.86 0.15 9/9/04 48 2.01 0.14 11.33 0.80 1-2 3.67 0.18 9/12/04 51 2.23 0.14 6.27 0.99 2-3 2.72 0.16 9/13/04 52 2.25 0.16 2.11 1.01 3-4 2.42 0.16 9/14/04 53 2.25 0.16 0.77 1.03 4-5 2.43 0.16 9/16/04 55 2.25 0.16
Table C-2. Continued.
Core L5NW45A Collected 7/24/04
Depth (cm) Total Th-234
(dpm/g) � count date
lat. long.
∆ time (d)
33.70821074 118.3624588
supported Th-234 (dpm/g) �
excess Th-234
(dpm/g) � 0-1 4.96 1-2 3.42 2-3 2.97 3-4 2.58 4-5 2.72 5-7 2.82
0.18 0.20 0.19 0.17 0.19 0.16
8/24/04 8/26/04 8/30/04 8/27/04 9/16/04 8/27/04
31 33 37 34 54 34
2.02 2.51 2.54 2.65 2.79 2.54
0.12 0.20 0.17 0.15 0.17 0.16
7.18 2.35 1.23
0.52 0.72 0.73
Core L5 NW 45 B lat. 33.71450841 Collected 7/24/04 long. 118.3651524
excess Th-Total Th-234 ∆ time supported Th-234 234
Depth (cm) (dpm/g) � count date (d) (dpm/g) � (dpm/g) � 0-1 3.65 0.21 9/19/04 57 2.10 0.15 7.97 1.34 1-2 2.58 0.17 9/21/04 59 2.45 0.16 0.72 1.27 2-3 2.61 0.17 9/17/04 55 2.30 0.18 1.50 1.20 3-4 2.44 0.17 9/22/04 60 2.46 0.17 4-5 2.27 0.16 9/18/04 56 2.46 0.17 5-7 2.63 0.18 9/24/04 62 2.46 0.17 7-9 2.45 0.17 9/23/04 61 2.50 0.17
9-11 2.62 0.17 9/28/04 66 2.46 0.17
Core L5 NW 45 C lat. 33.71880604 Collected 7/24/04 long. 118.3746783
Total Th-234 ∆ time supported Th- excess Th-Depth (cm) (dpm/g) � count date (d) 234 (dpm/g) � 234 (dpm/g) �
0-1 5.11 0.14 9/9/04 47 2.31 0.16 10.84 0.82 1-2 3.92 0.23 9/11/04 49 2.56 0.15 5.58 1.12 2-3 3.17 0.16 9/13/04 51 2.59 0.16 2.51 1.00 3-4 2.83 0.15 9/12/04 50 2.48 0.16 1.46 0.92 4-5 2.98 0.17 9/14/04 52 2.48 0.16 5-7 2.68 0.16 9/17/04 55 2.48 0.16 7-9 2.66 0.17 9/20/04 58 2.48 0.16
9-11 3.08 0.16 9/10/04 48 2.48 0.16 11-13 2.98 0.17 9/21/04 59 2.48 0.16
Table C-2. Continued.
core 9-55-A lat 33.69083731 collected 7/14/04 long 118.3162223
Total Th-234 ∆ time supported Th-234 excess Th-Depth (cm) (dpm/g) � count date (d) (dpm/g) � 234 (dpm/g) �
0-1 6.51 0.21 8/2/04 19 1.79 0.14 8.15 0.44 1-2 3.33 0.18 7/24/04 10 2.18 0.15 1.54 0.31 2-3 2.89 0.17 7/21/04 7 2.23 0.15 0.80 0.28 3-4 2.51 0.16 7/19/04 5 2.26 0.15 0.29 0.25 4-5 2.22 0.16 7/20/04 6 2.07 0.15 0.18 0.26 5-7 2.09 0.17 7/22/04 8 2.07 0.15 0.03 0.28 7-9 2.66 0.17 7/23/04 9 2.26 0.15 0.52 0.29
Core 9 55 D lat. 33.6908297 Collected 7/15/04 long. 118.3162348
excess Depth Total Th-234 ∆ time supported Th-234 Th-234 (cm) (dpm/g) � count date (d) (dpm/g) � (dpm/g) � 0-1 4.81 0.17 8/1/04 17 1.97 0.18 4.63 0.25 1-2 2.51 0.16 8/2/04 18 1.56 0.15 1.60 0.23 2-3 1.90 0.13 7/28/04 13 1.82 0.16 0.12 0.21 3-4 2.28 0.16 7/30/04 15 1.92 0.15 0.56 0.22 4-5 2.07 0.17 7/27/04 12 1.82 0.16 0.36 0.24
Core 9 55 E lat. 33.68374793 Collected 7/15/04 long. 118.3093659
excess Th-Depth Total Th-234 ∆ time supported Th-234 234 (cm) (dpm/g) � count date (d) (dpm/g) � (dpm/g) � 0-1 3.23 0.17 8/2/04 18 2.03 0.15 2.01 0.38 1-2 6.87 0.27 7/29/04 14 2.09 0.15 7.15 0.47 2-3 2.38 0.14 7/28/04 13 1.83 0.10 0.81 0.25 3-4 2.27 0.15 7/30/04 15 2.22 0.14 4-5 2.34 0.15 7/27/04 12 2.22 0.14 5-7 2.42 0.13 8/1/04 17 2.22 0.16
Table C-2. Continued.
Core 9.5 55 H lat. 33.67602943 Collected 7/26/04 long. 118.2994201
Total Th-234 ∆ time supported Th- excess Th-Depth (cm) (dpm/g) � count date (d) 234 (dpm/g) � 234 (dpm/g) �
0-1 3.13 1-2 1.97 2-3 2.10 3-4 1.86 4-5 2.28 5-7 2.27 7-9 2.23
9-11 2.54
0.17 0.15 0.16 0.14 0.15 0.15 0.16 0.12
9/5/04 9/4/04 8/30/04 8/29/04 9/15/04 9/3/04 9/22/04 9/2/04
41 40 35 34 51 39 58 38
1.77 1.92 2.00 2.32 2.32 2.32 2.32 2.32
0.15 4.44 0.11 0.13 0.14 0.28 0.14 -1.23 0.14 -0.17 0.14 -0.15 0.14 -0.50 0.14 0.63
0.74 0.59 0.58 0.53 0.89 0.62 1.11 0.57
Core 10 55 F lat. 33.66957564 Collected 7/15/04 long. 118.2956612
excess Th-
Depth (cm) Total Th-234
(dpm/g) 0-1 4.21 1-2 2.93 2-3 2.20 3-4 2.10 4-5 2.25 5-7 2.11 7-9 2.27
� 0.18 0.18 0.16 0.16 0.17 0.21 0.16
count date 8/2/04 7/24/04 7/21/04 7/19/04 7/20/04 7/22/04 7/23/04
∆ time (d) 18 9 6 4 5 7 8
supported Th-234 (dpm/g)
2.16 1.48 1.92 1.92 1.92 2.03 2.02
� 0.17 0.15 0.16 0.16 0.16 0.18 0.14
234 (dpm/g)
3.44 1.88 0.32 0.19
� 0.42 0.30 0.27 0.25
Table C-3. Th-234 data from Comparison Stations, with the Resultant Calculated Biodiffusivities (Db, cm2/yr).
Core L3NW6B L3NW6B
Interval (cm) 0-1 1-5
Mean depth (cm) -0.5 -2
"+/-(cm) 0.25
2
Total Th-234 (dpm/g)
3.62 2.66
� 0.17 0.16
count date
8/3/04 8/2/04
∆ time (d) 15 14
Supported Th-234
1.90 2.47
� 0.14 0.15
excess Th-234 (dpm/g)
2.64 0.29
� 0.35 0.33
Db (cm2/yr)
8
L3NW6Z L3NW6Z
0-1 1-5
-0.5 -2
0.25 2
4.48 3.44
0.18 8/20/04 0.15 8/21/04
28 29
2.29 2.29
0.16 0.16
4.90 2.65
0.55 0.51 89
L3NW17 L3NW17
0-1 1-5
-0.5 -2
0.25 2
7.15 4.53
0.27 0.20
8/5/04 8/6/04
13 14
2.83 2.93
0.17 0.13
6.28 2.39
0.47 0.35 56
L3NW17Z L3NW17Z
0-1 1-5
-0.5 -2
0.25 2
4.55 2.64
0.20 8/23/04 0.16 8/22/04
31 30
2.07 2.11
0.15 0.15
6.06 1.28
0.61 0.51 18
L435D L435D
0-1 1-5
-0.5 -2
0.25 2
5.69 3.42
0.18 8/12/04 0.17 8/19/04
22 29
2.68 2.68
0.16 0.16
5.65 1.71
0.45 0.53 27
L435Z L435Z
0-1 1-5
-0.5 -2
0.25 2
7.45 4.69
0.23 8/22/04 0.00 8/23/04
30 31
2.49 2.77
0.16 0.19
11.75 4.69
0.66 0.48 63
L5NW49B L5NW49B
0-1 1-5
-0.5 -2
0.25 2
6.41 3.15
0.18 8/31/04 0.16 8/29/04
41 39
2.40 2.50
0.15 0.20
13.03 2.00
0.76 0.77 12
L5NW49C L5NW49C
0-1 1-5
-0.5 -2
0.25 2
9.18 3.44
0.25 8/12/04 0.17 8/19/04
19 26
2.01 2.26
0.16 0.15
12.38 2.50
0.51 0.49 17
L7OUT13A L7OUT13A
0-1 1-5
-0.5 -2
0.25 2
9.17 3.06
0.31 0.17
8/4/04 8/3/04
14 13
2.09 2.22
0.16 0.16
10.58 1.23
0.52 0.34 8
L7OUT13C L7OUT13C
0-1 1-5
-0.5 -2
0.25 2
7.09 2.69
0.22 8/7/04 0.15 8/20/04
14 27
1.88 2.29
0.18 0.15
7.79 0.86
0.43 0.45 8
L7OUT14A L7OUT14A
0-1 1-5
-0.5 -2
0.25 2
5.03 2.10
0.15 8/11/04 0.14 8/9/04
18 16
1.77 2.09
0.13 0.16
5.47 0.02
0.33 0.33 1
L7OUT14C L7OUT14C
0-1 1-5
-0.5 -2
0.25 2
5.18 2.30
0.15 8/11/04 0.14 8/9/04
18 16
1.63 1.74
0.14 0.16
5.97 0.90
0.35 0.34 11
L9OUT46C L9OUT46C
0-1 1-5
-0.5 -2
0.25 2
7.88 3.25
0.25 0.15
8/5/04 8/6/04
16 17
2.01 2.78
0.15 0.16
9.30 0.76
0.47 0.36 5
Table C-3. Continued.
Core Interval
(cm)
Mean depth (cm)
"+/-(cm)
Total Th-234 (dpm/g) �
count date
∆ time (d)
Supported Th-234 �
excess Th-234 (dpm/g) �
Db (cm2/yr)
L9OUT46D 0-1 -0.5 0.25 9.09 0.26 8/7/04 14 2.12 0.15 10.42 0.45 L9OUT46D 1-5 -2 2 2.30 0.13 8/21/04 28 2.24 0.13 0.13 0.42 1
L10SE47G 0-1 -0.5 0.25 4.37 0.18 8/7/04 13 1.72 0.25 3.85 0.45 L10SE47G 1-5 -2 2 2.11 0.15 8/8/04 14 1.69 0.25 0.63 0.43 13
* Bold values indicate that supported Th-234 activity is estimated.