Embed Size (px)
Citation preview

BIRD IN HAND GOLD PROJECT MINING LEASE PROPOSAL MC 4473
ABN | 66 122 765 708 Unit 7 / 202-208 Glen Osmond Road | Fullarton SA 5063
APPENDIX H4
GROUTING PROPOSAL - MULTIGROUT

MultiGrout® technology throughout Australia and the Asian continent - high performance injection grouting for
control of water inflows and ground strengthening in underground construction.
Waterproofing and rock support solutions for mining and tunnelling
Materials Engineering Support Procedures Training Equipment
MultiGrout® Australia Cemcon Pty. Ltd. ABN 44 095 806 849, trading as: MultiGrout® Australia 33/111 Lewis Road, Knoxfield Vic 3180, Australia
Post Address: PO Box 4506 Wantirna South 3152, Vic, Australia
Ph.+61 (0)3 9801 1120 Fax. +61(0)3 9801 3334 Mob. +61(0)419 890 660 Email:[email protected]
12 February 2017
To: Terramin Australia – Attention: Jack Light Re; Bird-In-Hand Gold Project – Grouting for Groundwater Control The following content represents further development from the interim notes previously issued, dated 16 December 2016, a teleconference held on 5 January 2017, subsequent discussions and receipt of additional information to date.
Hydraulic Conductivity and Groutability A summary of critical considerations; Basic water inflow definitions are;
“Fractured Zone” within and adjacent to the hanging wall, in the order of 20- 30 litre/sec
Otherwise, within the Tapley formation, typically 0.2 - 2 litre/sec Table 1 below, provided by Jason van den Akker, and used for groundwater modelling, provides information on the hydraulic conductivity of the various formations. This table has been extended to include additional units of measure, K (m/sec) and Lugeon, more commonly used in grouting analysis. Table 1. Hydraulic Conductivity
INV Bore
Tested Zone Hydraulic Conductivity K (m/d)
T (m2/d) Tested Depth (m)
Numerical model calibration K (m/d)
K converted to different units
(m/sec)
K converted to fracture permeability
in Lugeon unit
4 Tarcowie Siltstone
Fracture HW 2.5
105 (range 65-126)
125-155 2.5 2.9 x 10⁻⁵ > 200
Not drilled
Tarcowie Siltstone (beneath fracture)
not tested not tested not tested 0.25 2.9 x 10⁻⁶ 22
1 Marble 0.016 0.64 203-266 0.05 5.8 x 10⁻⁷ 4 - 5
2 Marble 0.13 8 198-238 0.05 5.8 x 10⁻⁷ 4 - 5
5 Tapley Hill (FW) 0.02 0.92 270-294 0.03 3.5 x 10⁻⁷ 2 - 3
Note
Investigation bores were drilled > 3 years ago before the fracture was modelled using RQD. Hence no bore was placed between the HW fracture and Marble- so at this stage our drilling was exploratory
I’ve attached some pdf’s showing drilling observations. Of interest is the change in airlift yield for different zones
The latest round of drilling completed last year identified caving in the marble which our inv bores didn’t intercept (In the model we’ve allocated this zone a k of 1 m/d)
The inv bores (shown as red) are spaced about 20 m apart. The locations were highly constrained by rig access, topography, services, etc, so they were drilled along the side of the hill as shown below

2
The Lugeon unit is commonly used internationally in reference to grouting issues. It is a relatively simple site based test using a drilled hole into the rock, pumping water into the rock at a defined pressure and measuring the degree to which the rock accepts water. This, in turn, provides a measure of the openness or permeability of the particular rock mass.
1 Lugeon unit is defined as a water take of 1 litre per metre of hole test length per minute at 10 bars (1,000kPa or 150 psi) above static pressure. The Lugeon scale is sensitive at low values between 1 to 5 but with higher values of 50 or more and accuracy of +/- 10 Lugeons is adequate, and at more than 100 Lugeons an accuracy of +/- 30 Lugeons is appropriate.
Houlsby, an internationally recognised grouting expert, particularly in dam foundation grouting further developed the understanding of the Lugeon values, relating groutability as follows:
1 Lugeon indicates almost no grouting is required
5 Lugeons requires some light grouting
10 Lugeons indicates heavy grouting
20 Lugeons indicates extensive grouting
Various others have also made similar contributions in this area of groutability, with an example below.
Table 2. Hydraulic conductivity groutability relationship, after Polla & Rosengren.
Hydraulic Conductivity k (m/sec) Lugeon Comments
4 x 10⁻⁸ < 0.3 Some close / tight fractures
4 x 10⁻⁸ to 2 x 10⁻⁷ 0.3 to 1.5 Only one open fracture – groutable, or, few quite tight fractures, difficult to grout
2 x 10⁻⁷ to 7 x 10⁻⁷ 1.5 to 5.0 Probably several fractures, high hydraulic conductivity, quite simple to grout
> 7 x 10⁻⁷ > 5.0 Open fractures, very high hydraulic conductivity (possibly high grout consumption)
Through referencing Tables 1 & 2 and a review of the conceptual model (Figure 1) along with investigation hole water inflow yields, it is evident that the primary focus for ground treatment will be the hanging wall (HW) and adjacent fractured zones within the Tarcownie Siltstone formation. The very high Lugeon values, above 20 and 200+ in the Tarcownie formation are indicative of highly fractured, open jointed rock of extremely high fracture permeability. Grouting will be a critical aspect of groundwater control practices. The rock conditions are likely to be very conducive to grouting and result in very significant groundwater inflow reduction. The Marble formation, with relatively low Lugeon values, may need ground treatment in a much reduced scale to the Tarcownie Siltstone fracture zone. However, subsequent additional investigation bores have identified some karstic conditions within the Marble formation that have the potential to transmit high water volumes if encountered. The Tapley Hill formation, generally appears to have low fracture permeability and typically may not require grouting. Therefore the following assumptions are made;
Decline development, said to be largely within the Tapley formation, not considered for ground
treatment (unless reassessed to be included)

3
Vertical infrastructure development, shafts and escapeways have some high risk zones where
they are developed through the HW.
Access drives and ore drives will be subject to extensive probing and grouting when in close
proximity to, and developed through, the HW fracture zone
Probe drilling and assessment will be critical to decision making in both mine development and
production
Figure 1. Conceptual Model with investigation bore hole yields
4
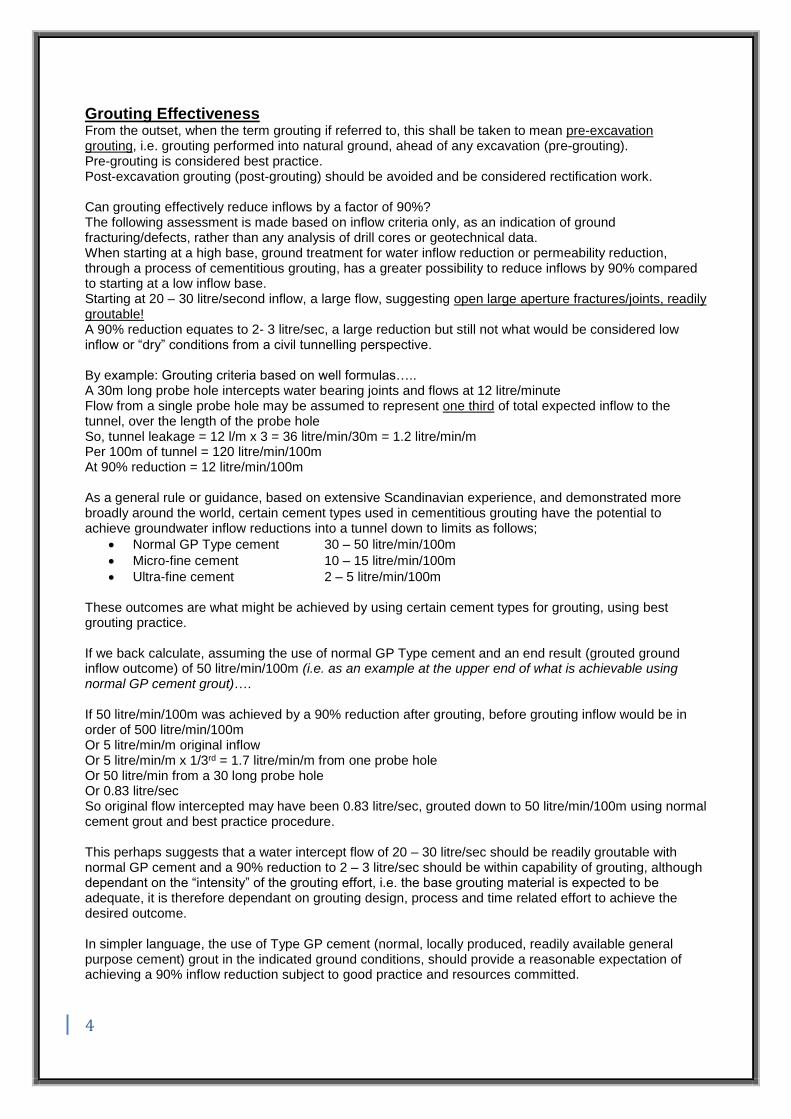
Grouting Effectiveness From the outset, when the term grouting if referred to, this shall be taken to mean pre-excavation grouting, i.e. grouting performed into natural ground, ahead of any excavation (pre-grouting). Pre-grouting is considered best practice. Post-excavation grouting (post-grouting) should be avoided and be considered rectification work. Can grouting effectively reduce inflows by a factor of 90%? The following assessment is made based on inflow criteria only, as an indication of ground fracturing/defects, rather than any analysis of drill cores or geotechnical data. When starting at a high base, ground treatment for water inflow reduction or permeability reduction, through a process of cementitious grouting, has a greater possibility to reduce inflows by 90% compared to starting at a low inflow base. Starting at 20 – 30 litre/second inflow, a large flow, suggesting open large aperture fractures/joints, readily groutable! A 90% reduction equates to 2- 3 litre/sec, a large reduction but still not what would be considered low inflow or “dry” conditions from a civil tunnelling perspective. By example: Grouting criteria based on well formulas….. A 30m long probe hole intercepts water bearing joints and flows at 12 litre/minute Flow from a single probe hole may be assumed to represent one third of total expected inflow to the tunnel, over the length of the probe hole So, tunnel leakage = 12 l/m x 3 = 36 litre/min/30m = 1.2 litre/min/m Per 100m of tunnel = 120 litre/min/100m At 90% reduction = 12 litre/min/100m As a general rule or guidance, based on extensive Scandinavian experience, and demonstrated more broadly around the world, certain cement types used in cementitious grouting have the potential to achieve groundwater inflow reductions into a tunnel down to limits as follows;
Normal GP Type cement 30 – 50 litre/min/100m
Micro-fine cement 10 – 15 litre/min/100m
Ultra-fine cement 2 – 5 litre/min/100m These outcomes are what might be achieved by using certain cement types for grouting, using best grouting practice. If we back calculate, assuming the use of normal GP Type cement and an end result (grouted ground inflow outcome) of 50 litre/min/100m (i.e. as an example at the upper end of what is achievable using normal GP cement grout)…. If 50 litre/min/100m was achieved by a 90% reduction after grouting, before grouting inflow would be in order of 500 litre/min/100m Or 5 litre/min/m original inflow Or 5 litre/min/m x 1/3rd = 1.7 litre/min/m from one probe hole Or 50 litre/min from a 30 long probe hole Or 0.83 litre/sec So original flow intercepted may have been 0.83 litre/sec, grouted down to 50 litre/min/100m using normal cement grout and best practice procedure. This perhaps suggests that a water intercept flow of 20 – 30 litre/sec should be readily groutable with normal GP cement and a 90% reduction to 2 – 3 litre/sec should be within capability of grouting, although dependant on the “intensity” of the grouting effort, i.e. the base grouting material is expected to be adequate, it is therefore dependant on grouting design, process and time related effort to achieve the desired outcome. In simpler language, the use of Type GP cement (normal, locally produced, readily available general purpose cement) grout in the indicated ground conditions, should provide a reasonable expectation of achieving a 90% inflow reduction subject to good practice and resources committed.

5
Figure 3.
From case studies, pre and post grouting in civil tunnel projects and underground mining projects, groundwater inflows can be reduced by up to 99%, typically ranging from 75-98%. However, it should be noted that the resultant inflow from a grouting program may very much be dependent on the resources committed rather than the technical capability of the methodology. For projects without a strict specified water inflow limit to be achieved, the end result may be driven by financial criteria and what can be practically achieved within a budget limit.
Probe & Grout Scenarios Access Drives: Where the HW is in close proximity to the ore drives, probe drilling (probing) would need to be undertaken from within the access drive. If not, there is high potential to mine into highly water bearing ground within the ore drives, or prior, making groundwater control grouting very difficult. A “bulkhead” of 6 – 8 m of good “tight” or grouted ground is necessary at all times, i.e. grouting needs to be performed 6-8 m prior to entering broken, water bearing ground. Therefore probing well in advance of suspected water bearing ground is critical. Probe holes can be 25 – 30m long depending on drilling capability (rod handling). The probes should be logged for defects and water intercepts. A minimum of three (3) probe holes is recommended, establish probe hole inflow criteria to be the basis for decision to grout or not grout. Optimise probing positions to include probes from lower access drive to cover ground ahead of upper or lower access drives. As the ore body runs away from HW, ground will be tighter, less grouting required but in cycle probing may be necessary until confident of ground ahead. Where HW is close to and directly influencing ore drive, initial grouting, to establish “tight” conditions for ore drive advance must be done from access drive, thereafter in a systematic grouting cycle from the ore drive face, grouting, perhaps, a 20-25m zone, mining 14-19m prior to next grouting cycle In the cases where approximate vertical distance between access drives is circa 20m, when developing access drives, probing and grouting , if necessary, can occur from upper access drive to lower access drive, for later development. Probe/grout hole length circa 25m
Min 6- 8m bulkhead
Probe and grout from upper access drives to condition ground for subsequent lower drive development
Figure 2.

6
Figure 6.
Figure 5.
Figure 4.
Ore Drives Grouting of ore drives may be;
1. Systematic – in cycle 2. Based on probes – grout as needed (or place packer(s) in
probes for later partial or full grouting after drive has been driven to length (risk assessed)
Grouting may be partial profile or full circumferential profile depending on rock properties, degree of fracturing and water flows. Probing from ore drive should be part of production cycle until HW fracture zone poses no further risk. NOTE: Potential risk of HW failure??? and loss of grouted ground, exposing ungrouted ground and high water inflows. This creates a situation of very difficult recovery, large time and cost implications!! ? Probe and grout holes, as required, can be designed to cover upper ore drive zones, within certain limits. Aid productivity wherever possible through extended coverage of both probe and grout holes, i.e. from lower drives to upper zones Innovative use of hollow groutable rock reinforcement spiles, acting as cables may significantly improve productivity by grouting and reinforcing in one pass, i.e. Mineright Packer/Spiles
HW
Grouted zone circa 5-6m outside drive profile
Probe to detect/define HW structure
Potentil risk of HW failure, exposing ungrouted ground??
HW
Grouted zone circa 5-6m outside drive profile

7
17 hole pattern- 4 x probe/check holes- 13 x primary grout holes
17 hole patternRound length 25mOverlap 6m minimum = excavation length 19m/round
Grout curtain overlap - minimum 6m
5m
5m
5m
5m
Summary production/grouting points or steps;
There are multiple scanarios that will require grouting, each must be considered to suit specific circumstances. Flexibility is a necessity. There is no one-best-fit, but multiple!
Ungrouted exploration holes – grout as many as possible/practical from surface
Mine the access drive toward ore drive, probing ahead, grouting if required
Turn east/west? for ore drives along strike
Probe the HW to ascertain potential risk and distance to the water bearing structures
Install packers in probes to control flows, OR, grout them at this stage, along with grout curtain if necessary
Mine along east & west, supporting ground as normal
Probe the HW at regular intervals as the drive is mined, depending on probe coverage, say 8m or each cut. Install packer if water encountered (&/or grout if necessary)
Once drive completed, if ungrouted, define grout plan based on probe information, also cover zones affecting upper drives, drill & grout – this would occur while production is taking place in opposite drive direction – no conflicting activities
For scheduling, grouting may be done on a 20m strike length at a time to keep cycle moving, moving from east to west & vice versa, alternating production and grouting
Decline development is said to be within low permeability Tapley Formation. However, there is likely to be intermittent intersects of water bearing features, some requiring treatment
Typical (idealised) Grouting Pattern The drill and grout pattern may vary significantly to meet the groundwater reduction demands in any given situation. However, it is prudent to define a “typical” pattern that may suit the most common or most likely scenario. From this idealised pattern, refer Figure 7, for planning purposes it is relatively simple to vary according to changing situations. Figure 7. Idealised drill & grout pattern
This “typical” pattern may apply in numerous situations, generally for systematic grouting where a continuous grouted zone is being formed through a zone of highly water bearing, faulted, sheared & fractured ground, or in the various scenarios depicted in Figures 2 – 6, where certain factors could be applied to changing situations where the number of holes or area to be grouted is altered from the “ideal”. So this scenario may apply as an “average worst case”. Productivity and Cost Factors Assumptions:
Round length 25m
Excavation length 19m
Overlap length 6m (minimum)
Drill meters 425m
Grouted rock volume 1960m3

8
Drilling rate 0.625metre/min (based on 40 minutes/25m long hole, including rod adding, coupling, pulling rods, uncoupling, 2-boom mining jumbo with mechanised rod adding)
Grout pump rate 15 litre/min (typical 20 – 30 litre/min, slowing as hole reaches refusal)
Grout materials cost $0.75/litre (based on average mix, cement & additives)
Drilling cost ? jumbo & consumables? (Terramin to assess)
Time costs ? men & machines? (Terramin to assess) NOTE: As a guide, the cost of grout materials is broadly within the range of 10-20% of the total cost of a grouting program. It is the time related costs of drilling and grouting that make up the vast majority of costs. Therefore efficiency of the works drives the cost.
Derived parameters (approximated – noting that variation could be +/- 40% to 50% through changing ground conditions);
Grout volume 45, 000 litres (based on 2.3% volume of grouted rock – EHM case study)
Grout vol/drill metre 106 litre/drill m
Grout vol/m excav. 2370 litre/m advance
Drilling time/round 11.3 hrs (add other activity & non-productive time 30%?)
Grouting pump time/round 50 hrs (add other activity & non-productive time 30%?)
NOTE: In this scenario, there may be 8-10+ shifts consumed in order to treat ground for groundwater control to facilitate the advance of 19m of excavation or production.
Additional considerations; Groundwater pressure The higher the groundwater pressure and resultant flow volume, the more difficult and time consuming the drilling and grouting process becomes. Once groundwater pressures exceed 10bar (1000kPa), the manual insertion of grouting packers into the flowing holes approaches the limit of practicality. So when high inflows are intercepted at >10 bar pressure, contingency measured need to be put in place to be able to safely stem these flows. Two options to overcome these problems are;
Installation of valved standpipes at collar prior to drilling into water bearing zone (Figure 8)
Insertion of jumbo-installed packers, with non-return valve, i.e. Mineright packer (Figure 9) Figure 8. Standpipe Installation
9
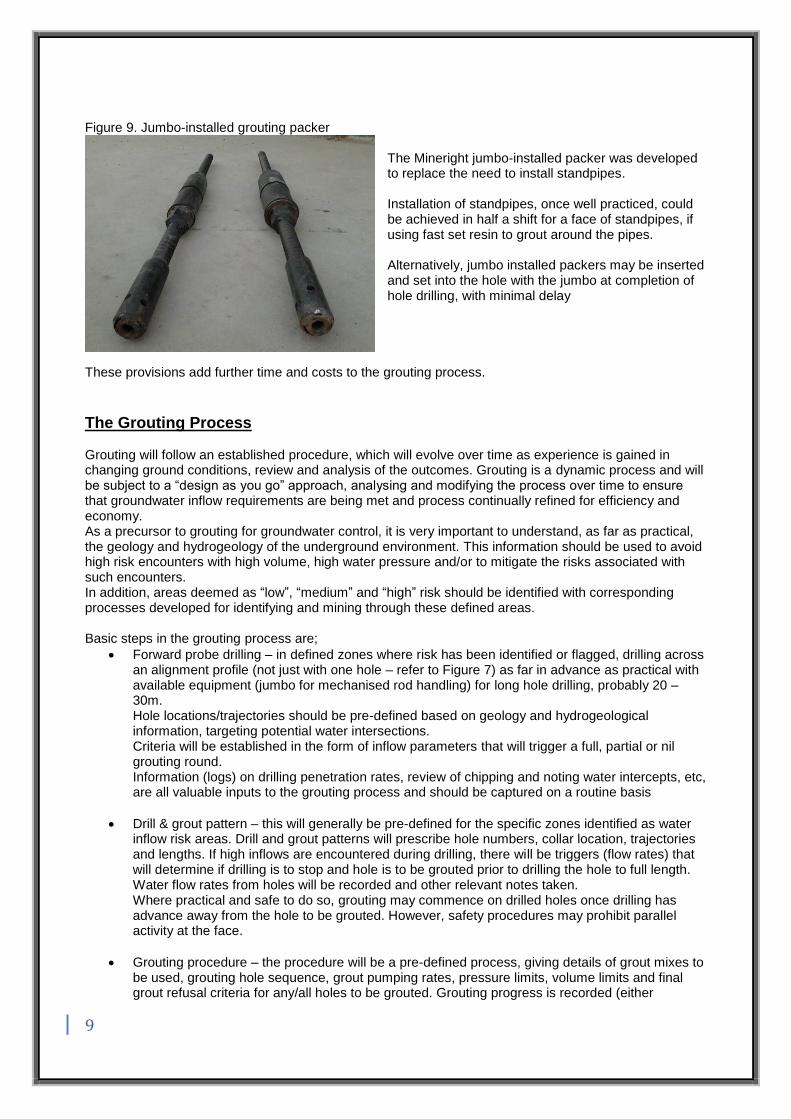
Figure 9. Jumbo-installed grouting packer
The Mineright jumbo-installed packer was developed to replace the need to install standpipes. Installation of standpipes, once well practiced, could be achieved in half a shift for a face of standpipes, if using fast set resin to grout around the pipes. Alternatively, jumbo installed packers may be inserted and set into the hole with the jumbo at completion of hole drilling, with minimal delay
These provisions add further time and costs to the grouting process.
The Grouting Process Grouting will follow an established procedure, which will evolve over time as experience is gained in changing ground conditions, review and analysis of the outcomes. Grouting is a dynamic process and will be subject to a “design as you go” approach, analysing and modifying the process over time to ensure that groundwater inflow requirements are being met and process continually refined for efficiency and economy. As a precursor to grouting for groundwater control, it is very important to understand, as far as practical, the geology and hydrogeology of the underground environment. This information should be used to avoid high risk encounters with high volume, high water pressure and/or to mitigate the risks associated with such encounters. In addition, areas deemed as “low”, “medium” and “high” risk should be identified with corresponding processes developed for identifying and mining through these defined areas. Basic steps in the grouting process are;
Forward probe drilling – in defined zones where risk has been identified or flagged, drilling across an alignment profile (not just with one hole – refer to Figure 7) as far in advance as practical with available equipment (jumbo for mechanised rod handling) for long hole drilling, probably 20 – 30m. Hole locations/trajectories should be pre-defined based on geology and hydrogeological information, targeting potential water intersections. Criteria will be established in the form of inflow parameters that will trigger a full, partial or nil grouting round. Information (logs) on drilling penetration rates, review of chipping and noting water intercepts, etc, are all valuable inputs to the grouting process and should be captured on a routine basis
Drill & grout pattern – this will generally be pre-defined for the specific zones identified as water inflow risk areas. Drill and grout patterns will prescribe hole numbers, collar location, trajectories and lengths. If high inflows are encountered during drilling, there will be triggers (flow rates) that will determine if drilling is to stop and hole is to be grouted prior to drilling the hole to full length. Water flow rates from holes will be recorded and other relevant notes taken. Where practical and safe to do so, grouting may commence on drilled holes once drilling has advance away from the hole to be grouted. However, safety procedures may prohibit parallel activity at the face.
Grouting procedure – the procedure will be a pre-defined process, giving details of grout mixes to be used, grouting hole sequence, grout pumping rates, pressure limits, volume limits and final grout refusal criteria for any/all holes to be grouted. Grouting progress is recorded (either

10
manually or by electronic data logging) on a regular time interval such that the records clearly indicate what has occurred and the outcome for each hole grouted
Check holes – at the completion of grouting, a number of check holes will be drilled at predetermined locations or revised locations where large grout takes were experienced. As the name suggests, check holes are for verification that grouting has been successful and no significant water flows encountered within the freshly grouted zone. If flows are detected, supplementary grouting will take place.
Once check holes are completed and grouted, the face may then be prepared for drill and blast, progressively advancing the face to the next defined position for probing or set grouting round.
Summary of significant issues and areas of potential risk
Prework, knowing you geology and hydrogeology – a sound understanding of the geology and hydrogeology can potentially avoid unwelcome surprises, difficult conditions and crisis management underground. Experience has shown that good knowledge and reference to early investigations greatly assists interpretation and sound decision making when encountering issues underground
Groundwater pressure – water pressure up to 10 bar (1000kPa) does not present any substantial risk or problem from a drilling and grouting perspective. Beyond 10 bar, manual interventions for grout packer placement or drill rod handling become a hazard and contingency measures such as standpiping, special jumbo installed packers and mechanised drill rod handling equipment are a necessity
Mechanisation and efficiency – the primary cost driver with drilling and grouting is time. Consequently, efficiency in operations is a very significant factor in minimising costs.
Drilling jumbos used for long hole probing and drilling should be acquired with specific detailing of the equipment to this task, i.e. long boom/drifter feeds using longest practical drill rods to minimise number of rod changes, high strength, efficient drifters with reverse hammering, for high speed drilling and withdrawal, rod handling carousel for quick rod addition and decoupling, suited to carry the number of rods needed to drill long holes, i.e. 25m+. Although computerised drilling is not a commonly purchased accessory for Australian mining jumbos, the opposite is the case in tunnelling jumbos where high speed drilling and long hole capability is called for. Where systematic grouting in hard rock is commonly practiced, i.e. Scandinavia in particular, fully computerised, multi-boom jumbos with rod handling is the norm. The dilemma or compromise for mining operations is the physical dimension of the equipment for efficient movement within the typical confines of underground mining Grouting equipment can also be tailored to optimise efficiency in the grouting operation. A typical grouting plant for an underground operation in Australia would consist of a platform with a mixer, holding tank and single grout pump. They are small in footprint, relatively easy to move in and out of small dimension drives and tuck away in cuddies. Generally the pump will have more than adequate pump rate capacity for any grouting situation since the grout pumping rate, for good grouting, is not performed at a high rate. Grout is pumped at a rate that is best suited to the ground conditions and the rate is largely determined by the rate at which the ground can accept the grout without excessive pressure. However, a single grout pump will only be used to grout one hole at a time. So, grouting efficiency can be significantly improved by the use of multiple grout pumps matched with mixers and holding tanks suited to the rate of the pumps. Compact multi-pump grout plants are now more common and available, with or without automation and electronic data logging.
Pre versus post grouting – pre-excavation grouting (pre-grouting) is best practice!
11
Post excavation grouting is rectification, very difficult to achieve the right result and substantially more time consuming, hence 10 – 50+ times the cost of pre-grouting. Avoid post-grouting by proper investigations, probe drilling, well considered and pragmatic critical decision making.
Ungrouted zones and lack of probing – when systematic grouting (continuous grouting) is not practiced or deemed unnecessary, they may be gaps of ungrouted ground between zones of grouted ground. It is not uncommon to have once dry ungrouted zones become a wet zones due to groundwater being displaced from the adjacent grouted zones. In addition, there are risks of developing into ungrouted water bearing ground, creating the need to perform rectification to get groundwater under control before preparing for pre-grouting ahead. This can often be difficult and time consuming. These situations can be avoided by careful attention to defining (and redefining) the probe drilling and inflow criteria. Continuous review and refinement of the processes is important.
Grouting intensity – it is important that grouting intensity is “overdone” in the early learning stages of grouting to ensure the water inflow reductions are achieved early. This provides the potential to progressively and pragmatically relax the intensity to find the optimum efficiency without developing a situation of needing to post-grout due to excessive inflows
Influence on development/mining – as can be seen in the section dealing with a “typical” grouting pattern, the development cycle time impact of grouting can be catastrophic, particularly where single heading development is concerned, i.e. where a full drill and grout cycle may take >10 shifts to complete before any development metres are gained. Where there are multiple heading being developed, cycle time impacts of grouting can be softened. The reality may be that grouting may be absolutely necessary in order to safely develop through a particular zone, in which case it must be performed as efficiently as possible with the correct procedures, using the best available equipment. Where grouting can be performed to target zone well in advance of development, from within a non-critical path drive, this should be done.
Grouting effectiveness – the process of grouting for groundwater control is capable of being highly effective, i.e. >95% over a wide range of ground conditions. This is conditional upon the willingness and commitment to resource the activity to achieve this outcome. Flexibility can be employed to increase or decrease grouting intensity (effort) as long as there is well considered knowledge of the implications to mine operation and water management
For review and comment.
Bruce Grant

Page 1 of 10
MultiGrout® Australia Cemcon Pty. Ltd. ABN 44 095 806 849, trading as: MultiGrout® Australia c/- Dallas Group Business Centre, 135 Bamfield Road Heidelberg Heights 3081 Victoria Australia
Ph.+61 (0)3 9458 8070 Mob. +61(0)419 890 660 Email:[email protected]
26 April 2019 Rev.3.1
Report for Terramin Australia
Questions raised by Dept of Energy & Mining in response to Mining Proposal, Bird-In-Hand Gold Project, SA
Background:
Consolidated interim comments were prepared in response to questions raised by Dept. of Energy and Mining SA in relation to grouting, and more specifically, to grouting in relation to the proposed mining method for Bird-In-Hand project. These interim responses were prepared by Bruce Grant, MultiGrout with inputs from Joe Evert, Mineright, issued to Terramin for review and discussion on 5th December 2018.
A teleconference was conducted on 6th December 2018 to review these responses.
Participants to the teleconference were; Greg Marshall – Director of Mining SA Paul Thompson – Senior Mining Assessment Officer, Mining SA Matt Daniel – Terramin Katy Fechner – Terramin Bruce Grant – MultiGrout Australia Joe Evert - Mineright The teleconference concluded with the general acceptance of issues covered under the items marked #1 - #7. Item #8 was referred to Terramin to consider further modelling.
Following the receipt, in April, of the report from the commissioned modelling, Item #8 was subsequently addressed. The items below are the edited formalised responses to items #1 - #8. 1. Please describe how groundwater inflows into the vent raises and egress system will be grouted? In general, for vertical development:
Holes are drilled outside the defined perimeter, parallel to the intended rise.
These holes are pressure grouted to form a halo around the intended excavation.
Holes are then drilled into the rise area to test or verify the extent of water exclusion.
These holes are subsequently pressure grouted.
Once grouted the area can be excavated.

Page 2 of 10
The methodology is supported by information published with a technical paper that appears on the Terramin BIH Project web site, extracts presented below: - Reference paper “Grouting for ground water control in underground mining” - P6 Pre-grouting from surface & Fig.1, P7. Relevant for conventional shaft sinking or raisebore. Pre-Grouting from Surface The use of the pre-grouting method from surface boreholes has, in the U.K. and North America at least, been restricted in general to relatively shallow depths of up to 200 to 300 metres (Jones 1979) In other parts of the world, e.g. South Africa, USSR, where particular hydrogeological conditions exist, the method has been used at considerably greater depths (Dietz 1982, Kipko 1984). Probably the main application has been when a relatively “thin” alluvial or fractured rock aquifer zone occurs at shallow depth and other processes such as dewatering, ground freezing, or cover grouting, are considered impractical or uneconomical. The main advantage is that the grouting is carried out prior to excavation and hence does not interrupt the sinking process. In addition, it is not subject to the space and environmental problems encountered when grouting in a shaft sump. However, the two methods are not usually competitive, being dependent on specific ground conditions, and it is possible for both approaches to be used in the same shaft or drift. In the case of a shaft a ring of vertical grout holes, typically six to twelve in number, are drilled around, and somewhat outside the periphery of the shaft. (Fig.1). The actual number of holes will depend on the diameter of the shaft and the results of the ground investigations. Often, and particularly for large diameter shafts, a central hole is also drilled, which may be used initially as a test hole. OR Pre-grouting from within the shaft as it advances; P6 & P9 Cover grouting & Fig.3 and Fig.4, P10-P11 Cover Grouting Probably a more common approach, and certainly that used in most U.K. coal mine development, is to grout from within the excavation and ahead of the advancing shaft sump or tunnel face. (Keeble 1981, Pocock 1982, Black 1982). This has the advantage of being a “closer” controlled grouting process than pre-grouting from surface boreholes, as the shaft sump can be taken quite close to the aquifer zone. In addition, the hole drilling requirements are not so stringent, as the hole lengths are generally much shorter. However there are a number of disadvantages as mentioned previously. On the basis of a detailed pre-sinking ground assessment and regular probe hole investigations ahead of the face, the excavation will be taken to within some 5-10m of

Page 3 of 10
the aquifer zone requiring the grout treatment. A “cone” of injection holes are then drilled through valved standpipes sealed into the shaft sump, and fanned out from the proposed excavation line of the shaft. A typical grout cover may be about 30m in length, and if an extensive aquifer is intersected, two or more overlapping covers may be required in order to achieve a full grout treatment (Fig.3). Within each cover the holes will be drilled and injected in depth stages of perhaps 3m, or in some instances extended until a certain level of “watermake” is encountered before grout is injected. In rock where the main waterflow channels may be vertical and sub-vertical fissures, it can be beneficial to “spin” the drill holes (Fig.4) in order to give a better chance of intersecting all the fissures. A central test hole will often be used to monitor the effectiveness of the grout treatment in restricting potential water inflows to the shaft.
2. What is the chemical stability of the grout/fill? Portland cement, patented in 1824, is the primary component in concrete and is the most widely used construction material throughout the world. It is known for its durability in building construction over decades and even centuries. Cementitious grouts are a common and broadly accepted material for many aspects of mining and civil tunnelling for both temporary and permanent works. Cementitious grouts, as used in pressure grouting, are incorporated into 100 year design life “structures” such as road, rail and various other types of tunnels for major public and private infrastructure. In consideration of the durability of Portland cement based products, we can consider durability to be defined as “the ability of concrete (or grout) to resist weathering action, chemical attack, and abrasion while maintaining its desired engineering properties”. Based on its long history, it is reasonable to assume and take for granted that Portland cement products are highly durable materials. That said, there are certain situations

Page 4 of 10
where such durability can be detrimentally affected. In relation to the durability of injection grout used for control of groundwater in a rock mass, it is the issue of chemical attack rather than weathering action or abrasion that may be of significance. For this chemical attack to adversely affect the durability of the concrete/grout, it is conditional upon the ease at which fluids (liquids & gases) can enter into and move through the materials, i.e. the permeability of the concrete/grout. Therefore, to minimise permeability of the grout is to enhance durability. In regard to cement based grout confined within a rock mass, any potential degradation, subject to permeability of the material, may only occur through chemical attack within the underground environment since atmospheric conditions are excluded. This chemical attack may occur through the presence of certain acids, particularly sulphuric acid, sulphates or dissolved gases (CO2) present within the groundwater. Indicatively, concrete/grout can be attacked by fluids with a pH value below 6.5 but the attack is only severe at a pH value below 5.5. As there are potentially only small areas where there is the presence of Acid and Metalliferous Drainage (AMD) material at BIH and a significant amount of neutralising material the presence of acidic conditions is considered low probability (Tonkin, 2017). Chemical attack can occur by way of decomposition of the products of cement hydration, the most vulnerable being Ca(OH)2, calcium hydroxide. There is an option to use Type SR cement (sulphate resistant) or the use of blended cements or cement with supplementary cementitious materials (pozzolans - flyash, granulated blast furnace slag and especially silica fume) which are commonly used to minimise the amount of free Ca(OH)2. These pozzolanic materials fix the Ca(OH)2 by consuming it to form secondary cementitious compounds, therefore minimising available Ca(OH)2 that may be subject to decomposition. If chemical attack is considered a real risk, “high performance” injection grout is used and we recommend inclusion of two important additives. One is a superplasticiser to minimise viscosity for a given water content. This aids the production of highly fluid, high penetration grouts at lowest possible water/cement ratio, thereby also minimising grout permeability. The other additive is a stabilising and penetration enhancing additive, the active ingredient of which is silica fume (SiO2), a highly efficient pozzolan, thereby minimising any available Ca(OH)2 and also contributing significantly to minimising grout permeability. Combined, this achieves best available durability with optimised grout penetration characteristics. 3. Please provide a description and diagram of how grouting will occur for a cut and fill stope. As the mining method is overhand cut and fill, the operation will have access to the hangingwall of the excavation for ground support and for pressure grouting during all mining cycles. On each level access the initial hangingwall drive will have cover holes drilled in front of the excavation to test for water intersects as well as into the hangingwall to test for

Page 5 of 10
water and structure. As mining progresses along strike the hangingwall will have rings drilled in a predetermined pattern and these will be pressure grouted, in cycle, to consolidate any water bearing structures in the hangingwall. The data gained and compiled as development and mining proceeds will be used to map any water bearing structures and will be used as pre-planning for each subsequent lift, i.e. the process is one of continuous improvement, adapting to the knowledge gained from previous cycles. Water mapping and pressure grouting records of each level will allow interactions between cycles to be scheduled during the mine life. The figures below provide a conceptual view of the cut & fill mine method and how grouting may occur as the strike drive approaches the hangingwall.
FIGURE: GENERIC MECHANISED CUT AND FILL MINING METHOD (ATLAS COPCO, 2016)

Page 6 of 10
FIGURE: GROUTING SCENARIO AS STRIKE DRIVE APPROACHES HANGINGWALL
In the figure, above, southern strike drive development is stopped at a pre-defined safe distance from the hangingwall fractured zone. Initial probe holes are drilled to intercept and/or identify the location of water bearing zones in the hangingwall, noting that the lower two production levels, now backfilled, have already located this zone and were grouted accordingly. A grouting array is defined in terms of length and width of coverage to ensure the grouted zone around the strike drive is in accordance with agreed parameters. Following the completion of the grouting round, production can continue within the grouted zone until the next defined face location for further probe drilling is reached. As stated previously, the information gained from probing and grouting on previous levels shall be used as inputs to the same processes on subsequent levels. 4. Ernest Henry has been used as an example, however, please provide more examples of grouting for a cut and fill mining operation Mining a decline through an aquifer presents the same dynamics for pressure grouting as does this cut and fill operation. Didipio in the Philippines is a large stope paste fill operation that uses pressure grouting in certain circumstances. Mainly for capital infrastructure development. The same principles apply. Halo drilling and pressure grouting is done in a cycle to allow advance only after cover drilling (testing QA/QC) indicates that the requirements are met. BIH cut and fill method is a narrow low lift method which allows control and access to the exposed area of the hangingwall. From a grouting perspective, grouting is a very adaptable process. Grouting is used for water control across many and varied situations whether it is for highly complex underground infrastructure or single heading development. The core principles of filling water-bearing structures with grout using injection pressure to displace the water from
A
ASection AA
Grouted zone
Plan View

Page 7 of 10
such structures, leaving them with solid grout infill remains the same. It is largely the methodology/grouting process that varies to deal with the specific situations. The previous report provided examples from multiple contexts that are comparable or encounter higher water flows and/or achieved higher than 90% grouting water reduction effectiveness. These examples were Ernest Henry, Boddington, Francoer and Gascoigne mines as well as the Baneheia tunnel project. Newmont’s Leeville Mine (part of the Carlin Complex in Nevada) is understood to utilise cut and fill and pressure grouting. Boliden’s operations in Scandinavia do similar and Sandfire’s Black Butte copper project in Montana, United States, is a proposed cut and fill operation using pressure grouting. 5. "Page 5 of the MultiGrout report states "Where the HW is in close proximity to the ore drives, probing would need to be undertaken from within the access drive. It is not clear how adequate coverage of probe and grout holes would be achieved across the strike length of the cut and fill stoping area from a single access point. This information is required to assess achievability of the groundwater outcome." This scenario was provided in the unlikely case that modelling or other risk assessment showed the potential for water intercepts to occur within close proximity of the planned ore drives. In such a case, it would be prudent to perform defined probe drilling from within the access drive toward the hangingwall prior to advancing the access drive to the ore drive intersection. Refer to Figure 2. If significant water is detected from the probe holes, then plans can be made to reassess the position of the ore drive or pre grout initially from the access drive ahead of the ore drive intersection. Thereafter an in-cycle pregrouting program can be performed along strike advancing in each direction from the already pre-grouted ore drive intersection. For the cut and fill method proposed, a strike drive (hangingwall drive) is mined the length of the ore body strike in both directions. As the length along strike is exposed and reaches a pre-determined distance from the suspected aquifer zone, probe holes are drilled based on a conservative probe hole density pattern based on the water model adjusted for in-field conditions. If encountered water flows exceed or fall under predictions, this can be used to adjust the probe hole density pattern. Before mining these drives, cover holes will be drilled in front to test for water and structure. If water is intersected, plans are then designed to pressure grout the area of concern. As the strike drive progresses probe/grout holes are drilled towards the hangingwall to test for water and structure. These holes are pressure grouted in cycle. Once this strike drive is complete the level is filled with mullock, levelled off, and then the process starts again from the entrance for the next lift. 6. "Page 11 of the MultiGrout report states "it is not uncommon to have once dry ungrouted zones become wet zones due to groundwater being displaced from the adjacent grouted zones"." Please provide more information regarding how
Page 8 of 10
this reflects the expected 90%/70% reduction of inflows and how it would be managed. This comment on P11 is an extract from the dot point titled “Ungrouted zones and lack of probing-“. This was really intended as a cautionary addition to ensure that probe hole density is not reduced below the established procedural minimum determined by the model and we draw your attention to the further comment made at the end of that dot point: - “These situations can be avoided by careful attention to defining (and redefining) the probe drilling and inflow criteria. Continuous review and refinement of the process is important.” It is also important that adjustment in the field is not taken beyond agreed minimum requirements. Further, the comment is intended to discourage shortcuts, avoid complacency, to ensure that due process is followed rather than unsupported assumptions made. We reiterate, grouting is a constantly reviewed process. Information is gathered as comprehensively as practicable in order to make initial plans and define the grouting process. Thereafter, continuous improvement cycles take place as development/mining proceeds, learning from each grouting round and excavation cycle. Every round of grouting and excavation is, in isolation, each a very small part of the overall mining operation. It provides information to enable quick responses and to vary the process, ensuring the overall target outcomes can be realised. 7. It is clear that the 90% efficiency of grouting is taken from the Multigrout report. However, it is not clear how 70% efficiency is assumed to be worst case. Provide justification. The 90% inflow reduction factor is based on replicating grouting efficiency achieved in comparable cases both in the mining and civil engineering areas which have similar cost/benefit trade-offs. As noted in our report, our comparable projects ranged from 75-98%. The Golder peer review concurred, with their experience being consistent with 95% effectiveness. Near 100% may be achievable with grouting but in many cases this is neither economic nor required for the use intended. In this context, on page 4 of the MultiGrout report, this question is reviewed based on available information at the time and concluded that the grouting …“should provide a reasonable expectation of achieving a 90% inflow reduction subject to good practice and resources committed.” . The lower boundary of 70% reduction is an arbitrary factor not considered to be a plausible scenario if Terramin maintains its systems and devotes resources effectively. The selection of 70% should be viewed as inbuilt redundancy to provide spare capacity and act as a safety factor. Since grouting intensity can, and is, routinely scaled up or down, the process has the flexibility to be adaptable to meet the defined criteria. It is a situation of balance between the cost, grouting intensity and overall water management, continually reviewed to ensure the criteria are met. The concept of grouting effectiveness cannot be viewed in isolation from cost, drill hole density and use of consumables as a particular level of grouting effectiveness can be targeted depending on the scale of intervention.

Page 9 of 10
8. Chapter 3 of MP (page 170-171) text states that the groundwater management system designed for the BIH Gold Project must provide access for post excavation grouting processes to occur to stem the flows. It is not clear how access would be facilitated for grouting the hanging wall of a mined out and filled section of the cut and fill stope to stem any increase inflows of groundwater. The potential for ground water inflows to increase post-grouting and post filling, due to distressing of the stope walls, consequent relaxation of the hanging wall and fault/joint dilation has not been assessed. This information is required to assess achievability of the groundwater outcome.
In response to Question #8, Terramin commissioned Mining One Consultants to investigate and quantify the expected extent of hangingwall relaxation and potential impact on the proposed groundwater management system. Within this Mining One report, “Hangingwall Relaxation Assessment” (annexed), they have provided a direct response to the following question; “Is the proposed hangingwall grout curtain appropriately positioned and sized to accommodate the anticipated hangingwall relaxation?” The driving motivation for posing this question is to place the emphasis on avoiding the potential requirement for post-excavation grouting by managing the pre-grouting design and installation process with an understanding of its relationship to, and influence upon, post mining relaxation of the rock mass associated with the hangingwall, i.e. to prevent, or greatly minimise the potential for increased inflows from mined and backfilled stopes, rather than the rectification of any such occurrences. The report should be read in full to provide proper context and understanding. However, on the specific question posed above, extracts from the concluding text are as follows;
The modelling has demonstrated that the proposed grout curtain design is generally appropriate for application at BIH
Very small and isolated zones of the grout curtain damage were detectable in thinly grouted sections close to the simulated fault zones, but these isolated zones are expected to have minimal impacts on the overall grout effectiveness
It is likely that by increasing the grout curtain and/or increasing the mining standoffs, the effects (i.e. the minor damage to the grout curtain) can be reduced to low or negligible levels
As previously emphasised, grouting is a very flexible, adaptive process, routinely practiced. The small and isolated zones where the design grout curtain has potential to be damaged, albeit with minimal impacts, have been identified through the modelling and can be addressed by simple and modest modification to the grout curtain design. This modification may be through increases to the grout cover depths and/or the standoff distances, thereby eliminating any adverse impacts to groundwater management that may have occurred through hangingwall relaxation. In regard to the issue, …. text states that the groundwater management system designed for the BIH Gold Project must provide access for post excavation grouting processes to occur to stem the flows….
Page 10 of 10
In the question of a case of excessive inflows and the access required for post-grouting, if all the proper processes have been followed, this situation will not occur. The most likely scenario is where excess inflows are detected during development or production, prior to any backfilling. In these cases, the working drives will be the access points for any necessary rectification grouting. It would be very unlikely to find excess water percolating through backfilled stopes/drives. Never the less, as a contingency measure, should there be inflows detected that are deemed worthy of remediation, where stoping has been completed and drives backfilled, the approach may be multi-faceted.
Control the flow through appropriate pumps, pipe systems and valves and manage within the scope of the groundwater management system
Consider the potential need for design and construction of an engineered bulkhead to be placed at the backfilled face of the relevant drive. This may be important to provide suitable confinement of a build-up of groundwater (pressure) and/or confinement for void fill grouting if deemed appropriate. A bulkhead with cast in standpipes will also assist to facilitate water management and potential grout injection points
Assess development/production records and geotechnical data to determine the most likely source, cause and location of the water flow, i.e. from where is it originating, not from where it is visibly flowing
Determine options for accessible drilling points to target origin of the defects that have channelled the excess flow. This may be from operational drives above or below the leaking drive
Where no suitable drilling points are readily available or suitable, exploratory drives may be driven to provide suitable access, or maybe drill cuddies made off production level drives could be appropriate.
Grouting targeted at origin is the best chance to reduce inflows to acceptable levels. Supplementary void filling or “tightening” can also be performed within the backfill material where control of water flow and pressures is possible via the bulkhead standpipes or similar mechanisms.
For review and further discussion and/or supplementation as required.
Bruce Grant MultiGrout Australia
REPORT
BIRD-IN-HAND GOLD PROJECT
HANGINGWALL RELAXATION ASSESSMENT
For
TERRAMIN AUSTRALIA LIMITED
Job No. 2596_G Mining One Pty Ltd Level 9, 50 Market Street
Melbourne VIC 3000 Ph: 03 9600 3588
Fax: 03 9600 3944
Doc No. 5759_V2 Date: April 2019 Prepared by: A Ford

P:\2596_G\5759_V2
BIRD IN HAND GOLD PROJECT
HANGINGWALL RELAXATION ASSESSMENT
TABLE OF CONTENTS
EXECUTIVE SUMMARY ............................................................................................................................... i
1 INTRODUCTION ................................................................................................................................ 1
1.1 Mine Setting and Project Scope ............................................................................................... 1 1.2 Assessment Methodology ........................................................................................................ 2 1.2.1 To what extent does mining cause the hangingwall to relax in the ore drives? ................... 4 1.2.2 Does mining cause appreciable surface deformation? ........................................................ 5 1.2.3 Is the proposed hangingwall grout curtain appropriately positioned and sized to accommodate the anticipated hangingwall relaxation? ..................................................................... 7 1.2.4 Does mining progressive cut-and-fill lifts pose potential relaxation issues to inaccessible regions of the hangingwall? ............................................................................................................... 7
2 MINE DESIGN, GEOLOGY AND GEOTECHNICAL BACKGROUND ............................................. 8
2.1 Mine Design .............................................................................................................................. 8 2.2 Geological Features ................................................................................................................. 8 2.2.1 Local Geology ....................................................................................................................... 8 2.2.2 Major Faulting ....................................................................................................................... 9 2.3 Ground Water ......................................................................................................................... 10 2.4 Ground Water Management ................................................................................................... 11 2.5 Geotechnical Characteristics .................................................................................................. 12 2.5.1 Intact Strength .................................................................................................................... 12 2.5.2 Rockmass Parameters ....................................................................................................... 13 2.5.3 Regional Stresses............................................................................................................... 14
3 ANALYSIS RESULTS AND KEY FINDINGS .................................................................................. 15
3.1 To what extent does mining cause the hangingwall to relax in the ore drives ....................... 15 3.1.1 Model features and mining sequence................................................................................. 15 3.1.2 General model results and findings .................................................................................... 16 3.2 Does mining cause appreciable surface deformation ............................................................ 18 3.2.1 Model features and mining sequence................................................................................. 18 3.2.2 General model results and findings .................................................................................... 18 3.3 Is the proposed hangingwall grout curtain appropriately positioned and sized to accommodate the anticipated hangingwall relaxation ..................................................................... 20 3.3.1 Model features and mining sequence................................................................................. 20 3.3.2 General model results and findings .................................................................................... 20 3.4 Does mining progressive cut-and-fill lifts poste potential relaxation issues to inaccessible regions of the hangingwall? ............................................................................................................. 21
4 SUMMARY OF KEY FINDINGS ...................................................................................................... 23
5 REFERENCES ................................................................................................................................. 25
TABLE INDEX
Table 1 Surface Damage Criteria (Harrison 2011) ....................................................................................... 5
Table 2 FLAC3D Material Parameter Summary .......................................................................................... 13
Table 3 Assumed Stress Field.................................................................................................................... 14
Table 4 General Mining Sequence ............................................................................................................. 15

P:\2596_G\5759_V2
BIRD IN HAND GOLD PROJECT
HANGINGWALL RELAXATION ASSESSMENT
FIGURE INDEX
Figure 1 Bird-in-Hand Gold Project Location
Figure 2 Example Damage Zones and characteristic permeability (ANDRA 2005)
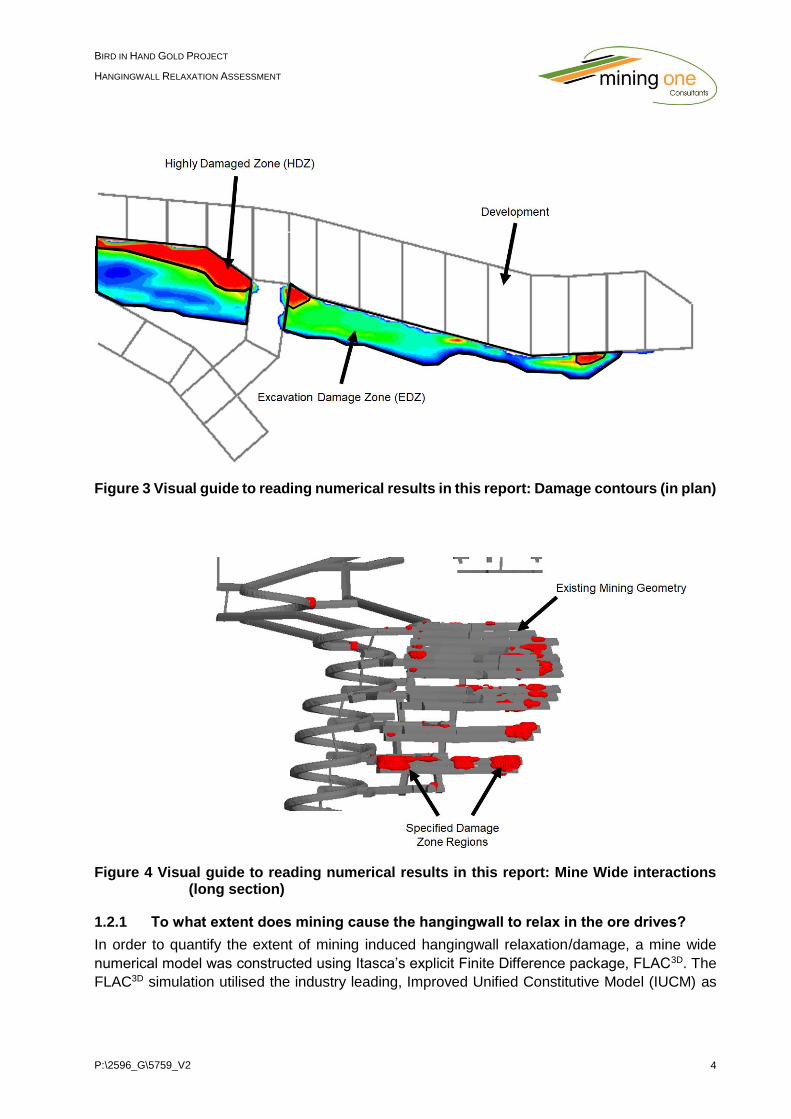
Figure 3 Visual guide to reading numerical results in this report: Damage contours (in plan)
Figure 4 Visual guide to reading numerical results in this report: Mine Wide interactions (long section)
Figure 5 Building damage chart (After Harrison 2011)
Figure 6 Bird-in-Hand Gold Project Mine Layout
Figure 7 Conceptual cross section showing major geological features and ground water (Jukic & Corbett
2017)
Figure 8 Fault locations with respect to the mine layout
Figure 9 Example grout curtain location and shape
Figure 10 Anisotropic influences in fresh country rock. Site laboratory test specimens shown
Figure 11 General mine wide FLAC3D mining sequence
Figure 12 Extent of hangingwall relaxation – ungrouted case
Figure 13 Hangingwall Damage Zone for far (left) and near (right) fault proximity – ungrouted case
Figure 14 FLAC3D Simulated Surface Displacements
Figure 15 Surface Damage Classifications showing the highest areas of damage
Figure 16 Grout curtain analysis mine sequence
Figure 17 Simulation results showing the Excavation Damage Zone extent in the most unfavourable
conditions
APPENDICES
A. Technical Details Appendix

P:\2596_G\5759_V2 i
BIRD IN HAND GOLD PROJECT
HANGINGWALL RELAXATION ASSESSMENT
EXECUTIVE SUMMARY
Mining One Consultants (Mining One), at the request of Terramin Australia Limited (Terramin),
were commissioned to investigate and quantify the expected extent of hangingwall relaxation for
the Bird-in-Hand Gold Project. This work is in response to technical queries received from
stakeholders regarding whether relaxation of the hangingwall would have any impact on the
groundwater management system proposed by the mine. The scope of this investigation was to
provide insight and recommendations for the following four questions from Terramin:
➢ To what extent does mining cause the hangingwall to relax in the ore drives?
➢ Does mining cause appreciable surface deformation?
➢ Is the proposed hangingwall grout curtain design appropriately positioned and sized to
accommodate the anticipated hangingwall relaxation?
➢ Does mining progressive cut-and-fill lifts pose potential relaxation issues to inaccessible
regions of the hangingwall?
This analysis was completed using the available geological and geotechnical information and was
assessed using Itasca’s Finite Different program, FLAC3D. Based on the completed analysis, the
following results were obtained:
To what extent does mining cause the hangingwall to relax in the ore drives?
An ungrouted case was initially simulated in order to understand the unmitigated relaxation
potential of the mine design. These results showed that the hangingwall relaxation varies as a
function of depth, and is typically greater than 4m, and at most 8m in typical ground conditions.
The depth of hangingwall relaxation increases significantly when mining through, or in close
proximity to ungrouted fault zones. The specifics controlling the hangingwall relaxation are
primarily related to four key considerations:
➢ Proximity to faulting/broken ground: The closer mining is to fault zones, the more
hangingwall relaxation / damage that occurs. Based on the FLAC3D simulations, mining within
8m of the hangingwall fault zones shows considerable interactions. These findings align with
the general grouting guidelines of having a 6 to 8m “bulkhead” of grouted or competent rock.
➢ Vertical hangingwall exposure: The largest hangingwall relaxation/damage is associated
with the floor benching (i.e. the largest unfilled span) in preparation of installing the cemented
rock fill sill pillar. Reducing the maximum unfilled vertical span will reduce the expected
relaxation / damage.
➢ Mining Depth: As the depth of mining increases, the depth of relaxation / damage in the
hangingwall increases. The depth of hangingwall relaxation/damage in the upper levels (as a
single number) is 4m.
➢ Backfilling: Backfilling provides a considerable reduction in the amount of hangingwall
relaxation.
Does mining cause appreciable surface deformation?
In general, there is no appreciable surface deformation caused by underground mining. The
highest recorded surface deformations and damage potential was associated with the surface
P:\2596_G\5759_V2 ii
BIRD IN HAND GOLD PROJECT
HANGINGWALL RELAXATION ASSESSMENT
shaft collars. The damage potential for these areas were categorised as “slight” and are not
expected to cause significant issues.
Is the proposed hangingwall grout curtain appropriately positioned and sized to
accommodate the anticipated hangingwall relaxation?
The FLAC3D results demonstrated that the proposed grout curtain design is generally appropriate
for application at the Bird-in-Hand Gold Project. It was noted that very small and isolated zones
of grout curtain damage were detectable in thinly grouted sections close to the simulated fault
zones. These isolated zones of damage are expected to have minimal impacts on the overall
grout effectiveness (i.e. it is unlikely to cause the grout effectiveness to drop below the 70%
incorporated into the mine’s water management design) as they do not “link up” with ungrouted
sections of rock. Hence there is still an appreciable undamaged grout barrier between the fault
zones, and the cut-and-fill drives. It is likely that by increasing the grout curtain and/or increasing
the mining standoffs, the effects (i.e. the minor damage to the grout curtain) can be reduced to
low or negligible levels (i.e. a minor reduction of the effectiveness of grouting).
Does mining progressive cut-and-fill lifts pose potential issues to inaccessible regions of
the hangingwall?
The FLAC3D results demonstrate that the proposed grout curtain remains generally intact over the
mining of successive lifts. It was noted that small changes in grout section close to the simulated
fault zones showed detectable changes, only on the mining of subsequent sill pillars. These
isolated zones of damage are expected to have minimal impacts on the overall grout effectiveness
(i.e. it is unlikely to cause the grout effectiveness to drop below the 70% incorporated into the
mine’s water management design) as they do not “link up” with ungrouted sections of rock. Hence,
there is still an appreciable undamaged grout barrier between the fault zones, and the cut-and-fill
drives. It is likely that by increasing the grout curtain and/or increasing the mining standoffs, the
effects (i.e. the minor damage to the grout curtain) can be reduced to low or negligible levels (i.e.
a minor reduction of the effectiveness of grouting).
Aidan Ford Senior Geotechnical Engineer
Mining One Pty Ltd

P:\2596_G\5759_V2 1
BIRD IN HAND GOLD PROJECT
HANGINGWALL RELAXATION ASSESSMENT
1 INTRODUCTION
1.1 Mine Setting and Project Scope
The Bird-in-Hand Gold Project (BiH). is located 2.7km from Woodside in the Adelaide Hills, 30km
east of Adelaide South Australia. The Historic BiH Mine (1881-1889) was the largest of the original
17 gold mines in the Woodside goldfields. Mining at the historic BiH ceased after intersecting a
water filled fracture made it uneconomical to continue mining. Recent economic and logistical
considerations have been given to “reopening” The BiH, with a recent Geotechnical Study (Bijelac
& Roache 2017) being completed in 2017. The location of the BiH is shown in Figure 1.
Figure 1 Bird-in-Hand Gold Project Location
Based on the historic water related issues, and the area’s reliance on groundwater (agriculture
and wine), local stakeholders have raised several technical queries regarding whether relaxation
of the hangingwall would have any impact on the groundwater management system proposed by
the BiH. Mining One Consultants (Mining One) were commissioned by Terramin Australia Limited
(Terramin) to investigate and provide insight to the interactions between mining, regional ground
movement, and their effect on the proposed water management pre-injection grouting. The scope
of this investigation was to provide insight and answers for the following four questions from
Terramin:
➢ To what extent does mining cause the hangingwall to relax in the ore drives?
➢ Does mining cause appreciable surface deformation?
➢ Is the proposed hangingwall grout curtain appropriately positioned and sized to accommodate
the anticipated hangingwall relaxation?
➢ Does mining progressive cut-and-fill lifts pose potential relaxation issues to inaccessible
regions of the hangingwall?

P:\2596_G\5759_V2 2
BIRD IN HAND GOLD PROJECT
HANGINGWALL RELAXATION ASSESSMENT
Note that the original agreed Scope of Works (Mining One Consultants 2019) did not include
considerations for surface interactions. This scope item was later confirmed for inclusion based
on discussions between Mining One and Terramin staff (refer to section 4).
1.2 Assessment Methodology
This section describes the general assessment methodology used to answer each of the four
main scope questions. Prior to presenting the methods used, some preliminary concepts need to
be defined which is used in this report.
The general concepts of how rockmass damage/relaxation relates to in-situ flow properties is well
documented in academic literature, with the main body of research in this area being typically
associated with the design of underground nuclear waste storage facilities. The terminology and
nomenclature used in this report is consistent with that of the general literature and is presented
in terms of “Damage Zones” around underground excavations. A general description of the four
main Damage Zones and their key characteristics is detailed below:
➢ Undisturbed Zone (UZ): The UZ defines all sections of the rockmass that are sufficiently far
enough away from an excavation to have any induced changes. Rockmass hydraulic
permeability within the UZ remain unchanged;
➢ Excavation Influence Zone (EIZ): The EIZ is defined as the region around an excavation
that is directly affected by mining but is not irreversibly damaged in the process. The EIZ is
associated with changes in stresses and strains, but has no significant changes to the
rockmass permeability (Tsang, Bernier & Davies 2005);
➢ Excavation Damage Zone (EDZ): The EDZ marks the onset of irreversible rockmass
damage which has the potential to induce significant changes in ground water flow (Perras
2014). The EDZ is typically associated with micro-cracking and is typically associated with
having a one to two orders of magnitude increase in the rockmass hydraulic permeability
(Martino & Chandler 2004);
Highly Damaged Zone (HDZ): The HDZ is the zone where visible fracturing occurs. The induced
open, unloaded fractures comprising the HDZ are highly inter-connected due to the lower
confining pressures. The changes to the rockmass permeability in the HDZ can be up to five
orders of magnitude greater than the undisturbed rockmass (Perras 2014).
These Damage Zones and their characteristic flow behaviour around an excavation is shown in
Figure 2.

P:\2596_G\5759_V2 3
BIRD IN HAND GOLD PROJECT
HANGINGWALL RELAXATION ASSESSMENT
Figure 2 Example Damage Zones and characteristic permeability (ANDRA 2005)
All the main findings within this report have a Factor of Safety (FOS) of 1.5 applied, which is a
common conservative choice for “long term” or “permanent” designs. The FOS has been applied
to the calculation of the Damage Zones, with a detailed elaboration of how the damage zones are
calculated and how the FOS is applied being provided in Appendix A.
The results in this report are generally presented using one of two visual formats; sections
showing damage contours, and three dimensional iso-surfaces (“blobs”) showing regional
damage. The recommended interpretation of these results is explained below:
➢ Sections showing damage contours: Areas shown in red indicate the HDZ, while areas
transitioning to cooler (blue) colours indicate the EDZ. The general interpretation is that
warmer colours are indicative of higher degrees of fracturing and water permeability, with
cooler colours indicating the return to undisturbed conditions. Areas not coloured indicate the
EIZ and UZ and are not affected by mining;
➢ Mine wide interactions: The red “blobs” indicate the specified damage zone over the entire
mine, that is, the entire HDZ or EDZ that has been generated from all mining up to that point.
A visual guide to each style of result is supplied Figure 3 and Figure 4.
P:\2596_G\5759_V2 4
BIRD IN HAND GOLD PROJECT
HANGINGWALL RELAXATION ASSESSMENT
Figure 3 Visual guide to reading numerical results in this report: Damage contours (in plan)
Figure 4 Visual guide to reading numerical results in this report: Mine Wide interactions (long section)
1.2.1 To what extent does mining cause the hangingwall to relax in the ore drives?
In order to quantify the extent of mining induced hangingwall relaxation/damage, a mine wide
numerical model was constructed using Itasca’s explicit Finite Difference package, FLAC3D. The
FLAC3D simulation utilised the industry leading, Improved Unified Constitutive Model (IUCM) as

P:\2596_G\5759_V2 5
BIRD IN HAND GOLD PROJECT
HANGINGWALL RELAXATION ASSESSMENT
it’s solver (Vakili 2016). The use of the IUCM was preferred for this study, as it is capable of
correctly simulating:
➢ The non-linear behaviour of rock, including before and after failure to a high accuracy;
➢ The time dependant deterioration caused by load shedding and progressive damage;
➢ The inclusion of bedding/foliations as planes of weakness within the stress analysis; and
➢ The confinement dependant behaviour including buckling, relaxation and dilation;
This mine wide numerical model was constructed using the supplied geological, geotechnical and
strength testing data. Separate material parameters were assigned to various geological and
geotechnical domains where sufficient data existed to define them. The mine wide numerical
model did not include a grout curtain, in order to estimate the worst-case hangingwall conditions
and understand the interactions of mining and near water bearing structures. The hangingwall
damage/relaxation was tracked over the entire life of mine, using the supplied mining sequence.
Changes in Damage Zone classifications, depths were then related to:
➢ The proximity of mining to zones of weakness/faults;
➢ Changes to the hangingwall relaxation/damage zone extent as a function of the mining depth;
➢ Changes to the hangingwall relaxation/damage zone over a single cut-and-fill block; and
➢ The effect of backfilling on hangingwall relaxation.
1.2.2 Does mining cause appreciable surface deformation?
Mining-induced damage to surface features is mainly caused by horizontal strain and angular
distortion, rather than total deformation (e.g. 4mm displacement). In order to provide insight if
underground mining causes appreciable surface deformation and damage or issues, the
guidelines for the classification of mining induced surface damage (Harrison 2011) were applied
to the mine wide FLAC3D model. These guidelines are supplied in Table 1 and their relation to
angular distortion and horizontal strain are shown in Figure 5.
Table 1 Surface Damage Criteria (Harrison 2011)
Class of
Damage Description of Damage Repair
Approximate
Width of
Cracks
Negligible Hairline cracks None <0.1 mm
Very
Slight
Cracks in exterior
brickwork visible upon
close inspection; possible
slight, isolated fractures in
building
Fine cracks easily treated during
normal redecoration <1 mm
Slight
Several slight fractures
inside buildings; visible
external cracks; doors and
windows may stick slightly
Cracks easily filled; redecoration
probably required; some
repointing may be required for
weather tightness
<5 mm

P:\2596_G\5759_V2 6
BIRD IN HAND GOLD PROJECT
HANGINGWALL RELAXATION ASSESSMENT
Moderate
Doors and windows
sticking; weather tightness
often impaired; utility
services may be
interrupted
Cracks may require cutting out
and patching; recurrent cracks
can be masked by suitable
linings; repointing and possibly
replacement of a small amount
of exterior brickwork may be
required.
5 – 15 mm
Severe
Windows and door frames
distorted; floor slopes
noticeably; walls lean or
bulge noticeably; some
loss of bearing in beams;
utility services disturbed
Extensive work involving removal
and replacement of sections of
walls, especially over doors and
windows
15 – 25 mm
Very
Severe
Beams lose bearing, walls
lean badly and require
shoring; windows broken
by distortion; danger of
instability
Major work involving partial or
complete reconstruction
Usually >25
mm
Figure 5 Building damage chart (After Harrison 2011)
The surface damage criterion categories in Table 1 and Figure 5 were calculated for each surface
zone in the mine wide FLAC3D. Areas of appreciable surface damage potential were then
identified, with general implications and recommendations being made based on their proximity
to key infrastructure, or local topological features.

P:\2596_G\5759_V2 7
BIRD IN HAND GOLD PROJECT
HANGINGWALL RELAXATION ASSESSMENT
1.2.3 Is the proposed hangingwall grout curtain appropriately positioned and sized to accommodate the anticipated hangingwall relaxation?
In order to assess the influence of mining and how it might impact the grouting, a local scale
FLAC3D model was used. The local scale FLAC3D model utilised a “typical” grout curtain design,
following the guidelines provided by Grant (2017), with the depth chosen to correspond with the
worst hydrogeological conditions, identified during drilling and packer testing (Jukic & Corbett
2017). Grouted material parameters were obtained by “upgrading” a zone of the country rock to
account for the grout curtain affects using the recommendations by Barton (2012). The local scale
model was simulated in approximately “cut-by-cut” steps, for the extraction of the grouted cut-
and-fill mining block. The following considerations were then addressed using the simulated
Damage Zone:
➢ Did the grout curtain change the hangingwall relaxation/damage zone classifications?
➢ Did the grout curtain change the hangingwall relaxation/damage zone depths?
➢ Does mining successive cut-and-fill lifts cause the grout curtain to crack?
➢ Was the grout curtain thick enough to provide an impervious barrier?
Did the grout curtain “survive” the entire life of mine stress path?
1.2.4 Does mining progressive cut-and-fill lifts pose potential relaxation issues to inaccessible regions of the hangingwall?
Assessment of this scope question was completed using a combination of the mine wide and
local scale FLAC3D models, using the methods previously presented. Question specific
considerations were then addressed similarly to “Question One” (Section 1.2.1) and “Question
Three” (Section 1.2.3).
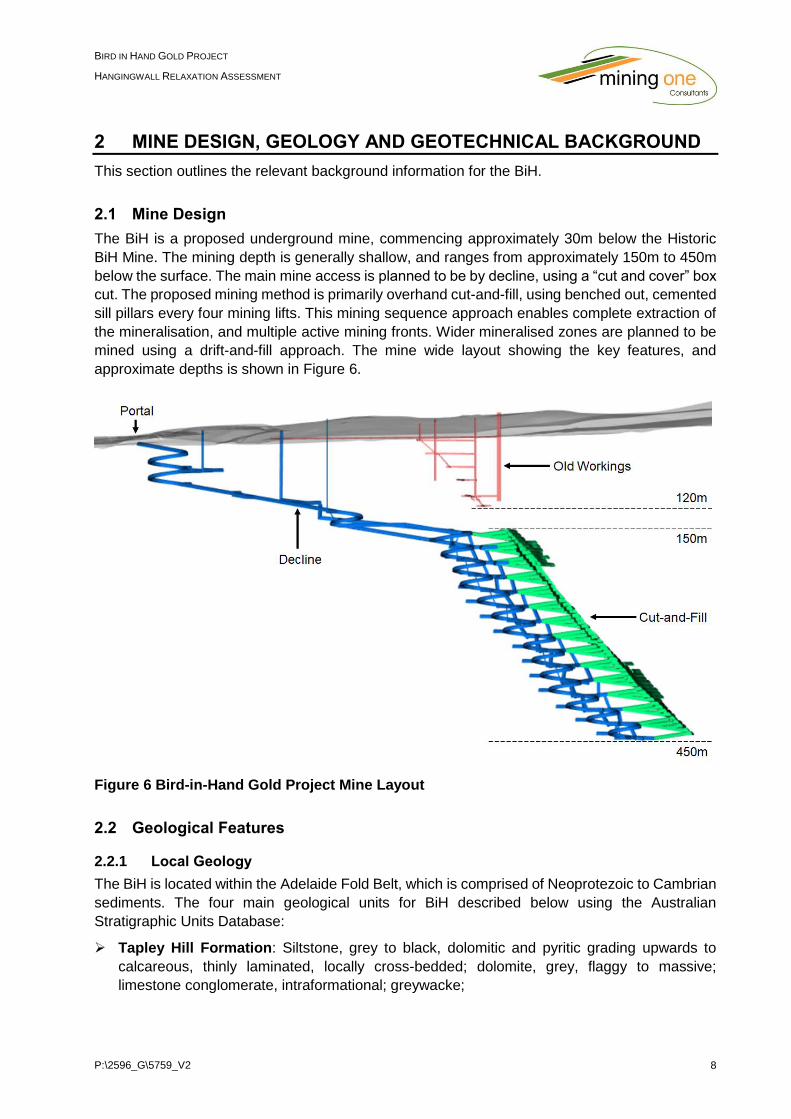
P:\2596_G\5759_V2 8
BIRD IN HAND GOLD PROJECT
HANGINGWALL RELAXATION ASSESSMENT
2 MINE DESIGN, GEOLOGY AND GEOTECHNICAL BACKGROUND
This section outlines the relevant background information for the BiH.
2.1 Mine Design
The BiH is a proposed underground mine, commencing approximately 30m below the Historic
BiH Mine. The mining depth is generally shallow, and ranges from approximately 150m to 450m
below the surface. The main mine access is planned to be by decline, using a “cut and cover” box
cut. The proposed mining method is primarily overhand cut-and-fill, using benched out, cemented
sill pillars every four mining lifts. This mining sequence approach enables complete extraction of
the mineralisation, and multiple active mining fronts. Wider mineralised zones are planned to be
mined using a drift-and-fill approach. The mine wide layout showing the key features, and
approximate depths is shown in Figure 6.
Figure 6 Bird-in-Hand Gold Project Mine Layout
2.2 Geological Features
2.2.1 Local Geology
The BiH is located within the Adelaide Fold Belt, which is comprised of Neoprotezoic to Cambrian
sediments. The four main geological units for BiH described below using the Australian
Stratigraphic Units Database:
➢ Tapley Hill Formation: Siltstone, grey to black, dolomitic and pyritic grading upwards to
calcareous, thinly laminated, locally cross-bedded; dolomite, grey, flaggy to massive;
limestone conglomerate, intraformational; greywacke;

P:\2596_G\5759_V2 9
BIRD IN HAND GOLD PROJECT
HANGINGWALL RELAXATION ASSESSMENT
➢ Brighton Limestone: Stromatolitic, oolitic and intraclast limestone; massive, partly cross-
bedded, commonly with erosional base;
➢ Tarcowie Siltstone: Grey-green siltstone with laminations of brown sandy siltstone, fine
sandstone and thin grey shale. Medium grained sandstone and grit at base;
➢ Cox Sandstone: Sandstone, coarse-grained; sandstone medium to fine grained, with
siltstone.
The BiH mineralisation is typically narrow veins, hosted within the Brighton Limestones. A
conceptual cross section showing the BiH’s regional geology is supplied in Figure 7.
Figure 7 Conceptual cross section showing major geological features and ground water (Jukic & Corbett 2017)
2.2.2 Major Faulting
Based on the supplied information, it is understood that there are three major geological structures
within the vicinity of the BiH. The orientation of all three faults generally consistent, with an
approximate strike and dip of 82° and 53° respectfully. A brief description of each major fault is

P:\2596_G\5759_V2 10
BIRD IN HAND GOLD PROJECT
HANGINGWALL RELAXATION ASSESSMENT
presented below, with a visual depiction of their position with respect to the general mine layout
shown Figure 8.
➢ Footwall Fault: A south dipping fault that bounds the orebody footwall this fault is modelled
to intercept the ore zone to the north;
➢ Hangingwall Upper Fault: One of the two south dipping hangingwall faults. The Hangingwall
Upper Fault is generally far away from the orebody; and
➢ Hangingwall Lower Fault: The closest of the two hangingwall faults to the orebody. The
Hangingwall Lower Fault appears to bound the orebody extent to the South. Drilling and
packer testing suggest (Jukic & Corbett 2017) that the Hangingwall Lower Fault and its
associated fracture zone, is a significant source of ground water.
Figure 8 Fault locations with respect to the mine layout
Based on the available RQD logs, the fault zones (particularly the Hangingwall Lower Fault) are
associated with variable degrees of fracturing and thickness over the planned mining depth. A
generally applicable estimate for the thickness of the fault zones is 10m for the Hangingwall
Faults, and 5m for the Footwall Fault.
2.3 Ground Water
As mentioned previously in, the BiH has a significant abundance of groundwater. From the
completed hydrogeological studies (Jukic & Corbett 2017), two main aquifer systems have been
identified:

P:\2596_G\5759_V2 11
BIRD IN HAND GOLD PROJECT
HANGINGWALL RELAXATION ASSESSMENT
➢ An alluvial perched aquifer, which is associated with modern day water courses. These
systems are typically thin and not extensive. The perched groundwater is typically limited to
topographical lows near the creek line, and is present seasonably (depths of 5-10m below the
ground); and
➢ A substantial fractured rock aquifer which provides the majority of ground water for the region.
The fractured rock aquifer is typically associated with the Hangingwall Faults, primarily the
Hangingwall Lower Fault. From site testing, the permeability of the fractured rock aquifers
appears to reduce with depth, due to increasing overburden pressures, forming a fracture
extinction zone. The most productive zone of the fractured rock aquafer is at depths of
approximately 150m to 200m with tests from DWIB5 showings the largest amount of water.
In summary, the fractured rock aquifer for the BiH can be broadly categorised into three zones;
an upper zone of low yield, a middle zone of high yield, and a lower zone of very low yield. A
conceptual understanding of the local ground water was previously shown in Figure 7.
2.4 Ground Water Management
In order to manage both the inflow and impact on nearby ground water, it has been proposed that
pre-injection pressure grouting will be used as required, to limit the inflow of water. The following
are the supplied grout curtain key features (Grant 2017):
➢ The preliminary intent is to probe the country and grout for groundwater control as required;
➢ Grouting will be conducted from “tight” ground, ensuring that there is always a 6 to 8m
“bulkhead” between the active area and water bearing country;
➢ Depending on the proximity and direction of water bearing country from development, the
grout coverage may only be in the hangingwall, footwall, or require full coverage;
➢ The grout curtain thickness should extend 2 to 3m beyond the ground support elements. For
BiH, this would result in a curtain thickness of typically 5m beyond the mining geometry.
➢ Grouting will be completed in “campaign” style, grouting up to 20 to 25m prior to advancing.
Campaign grouting may also be completed from existing cut-and-fill levels and cover lifts
either above or below;
Based on these grout curtain features, Figure 9 shows an example of a grout curtain design for
the BiH.

P:\2596_G\5759_V2 12
BIRD IN HAND GOLD PROJECT
HANGINGWALL RELAXATION ASSESSMENT
Figure 9 Example grout curtain location and shape
Note: the grout curtain shown in Figure 9 is an illustrative guide only.
2.5 Geotechnical Characteristics
This section summarises the available geotechnical characteristics associated with the BiH.
Mining One understand that no further geotechnical drilling or laboratory testing has been
completed since the 2017 Geotechnical Study. The information used to derive geotechnical
characteristics below is consistent with this previous study (Bijelac & Roache 2017).
2.5.1 Intact Strength
The Uniaxial Compressive Strength (UCS) is based on the eight laboratory samples. These
samples are associated with the country rock siltstones. The intact siltstone UCS is moderate,
and typically stronger than 100 MPa. From reviewing the available laboratory tests, it was evident
that the rock had an inherent weakness plane. Most laboratory samples failed along the rock
fabric, or foliation which produces a directional strength characteristic. Evidence of this is shown
in Figure 10.
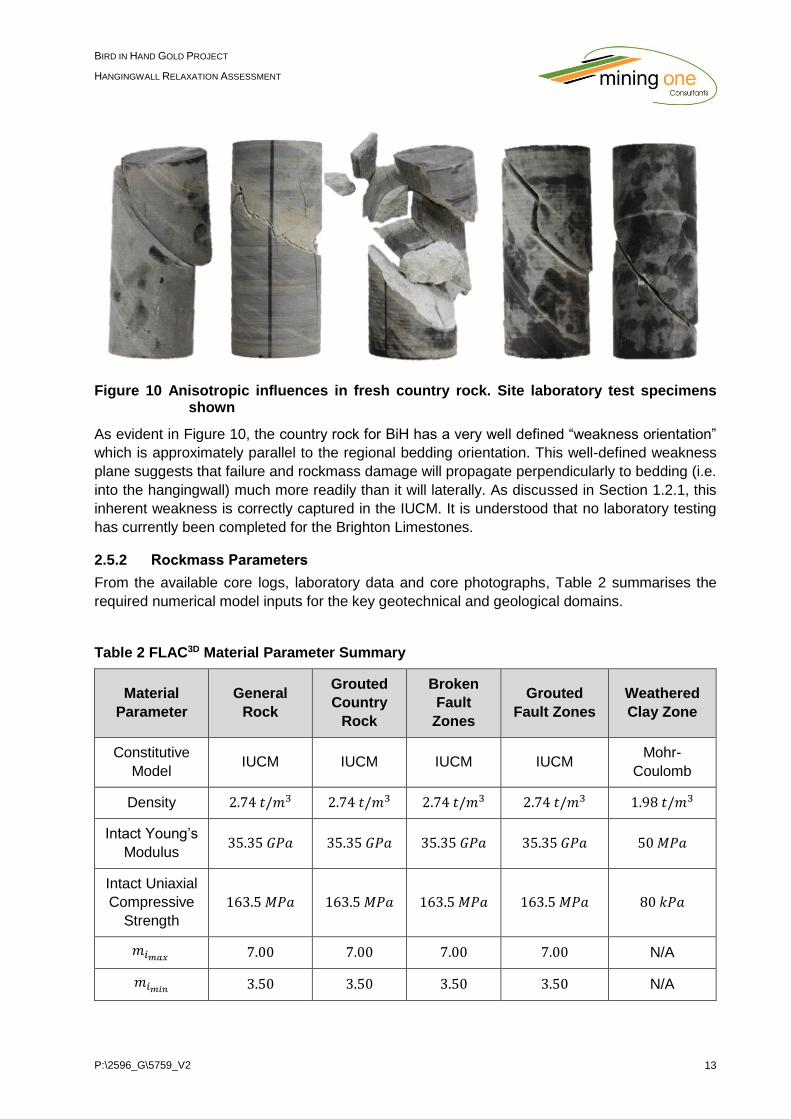
P:\2596_G\5759_V2 13
BIRD IN HAND GOLD PROJECT
HANGINGWALL RELAXATION ASSESSMENT
Figure 10 Anisotropic influences in fresh country rock. Site laboratory test specimens shown
As evident in Figure 10, the country rock for BiH has a very well defined “weakness orientation”
which is approximately parallel to the regional bedding orientation. This well-defined weakness
plane suggests that failure and rockmass damage will propagate perpendicularly to bedding (i.e.
into the hangingwall) much more readily than it will laterally. As discussed in Section 1.2.1, this
inherent weakness is correctly captured in the IUCM. It is understood that no laboratory testing
has currently been completed for the Brighton Limestones.
2.5.2 Rockmass Parameters
From the available core logs, laboratory data and core photographs, Table 2 summarises the
required numerical model inputs for the key geotechnical and geological domains.
Table 2 FLAC3D Material Parameter Summary
Material
Parameter
General
Rock
Grouted
Country
Rock
Broken
Fault
Zones
Grouted
Fault Zones
Weathered
Clay Zone
Constitutive
Model IUCM IUCM IUCM IUCM
Mohr-
Coulomb
Density 2.74 𝑡/𝑚3 2.74 𝑡/𝑚3 2.74 𝑡/𝑚3 2.74 𝑡/𝑚3 1.98 𝑡/𝑚3
Intact Young’s
Modulus 35.35 𝐺𝑃𝑎 35.35 𝐺𝑃𝑎 35.35 𝐺𝑃𝑎 35.35 𝐺𝑃𝑎 50 𝑀𝑃𝑎
Intact Uniaxial
Compressive
Strength
163.5 𝑀𝑃𝑎 163.5 𝑀𝑃𝑎 163.5 𝑀𝑃𝑎 163.5 𝑀𝑃𝑎 80 𝑘𝑃𝑎
𝑚𝑖𝑚𝑎𝑥 7.00 7.00 7.00 7.00 N/A
𝑚𝑖𝑚𝑖𝑛 3.50 3.50 3.50 3.50 N/A

P:\2596_G\5759_V2 14
BIRD IN HAND GOLD PROJECT
HANGINGWALL RELAXATION ASSESSMENT
Anisotropy
Factor 2.40 2.40 2.40 2.40 N/A
Anisotropic
Dip/Dip
Direction
46°/101° 46°/101° 46°/101° 46°/101° N/A
Geological
Strength Index 64 84 30 60 N/A
𝐶𝑟𝑒𝑠 0.00 𝑀𝑃𝑎 0.00 𝑀𝑃𝑎 0.00 𝑀𝑃𝑎 0.00 𝑀𝑃𝑎 25.60 𝑘𝑃𝑎
𝜙𝑟𝑒𝑠 41.50° 41.50° 41.50° 41.50° 24.70°
𝜎𝑡𝑟𝑒𝑠 0.00 𝑀𝑃𝑎 0.00 𝑀𝑃𝑎 0.00 𝑀𝑃𝑎 0.00 𝑀𝑃𝑎 0.00 𝑀𝑃𝑎
CritRed 1 1 1 1 N/A
Note that detailed justification for the derivation of each material parameter in Table 2 can be
found in Appendix A.
2.5.3 Regional Stresses
To Mining One’s knowledge, no stress measurements have been completed in the greater
Adelaide Hills region, or locally for the BiH. Previous work by Mining One (Bijelac & Roache 2017)
assumed an east-west major stress field orientation for the Adelaide Hills region based on work
completed for the Angas Zinc Mine. This stress field assumption was also assumed for BiH, with
the key stress field components summarised in Table 3.
Table 3 Assumed Stress Field
Stress
Component
Stress Ratio
(Horizontal: Vertical) Gradient (MPa/m) Dip/ Dip Direction (°)
Major Stress 2.0 0.0548 × 𝐷𝑒𝑝𝑡ℎ 0° / 90°
(East – West)
Intermediate Stress 1.5 0.0411 × 𝐷𝑒𝑝𝑡ℎ 0°/ 0°
(North – South)
Minor Stress 1.0 0.0274 × 𝐷𝑒𝑝𝑡ℎ 90° / 90°
(Vertical)
Note that the stress field assumptions presented in Table 3 are consistent with the assumptions
made during the 2017 Geotechnical Study (Bijelac & Roache 2017).

P:\2596_G\5759_V2 15
BIRD IN HAND GOLD PROJECT
HANGINGWALL RELAXATION ASSESSMENT
3 ANALYSIS RESULTS AND KEY FINDINGS
This section presents the analysis, key findings and recommendations associated with each of
the four key questions. The methodology used to address each question has previously been
presented in Section 1.2 and using Itasca’s explicit Finite Difference package, FLAC3D and the
IUCM as the main solver.
3.1 To what extent does mining cause the hangingwall to relax in the ore drives
3.1.1 Model features and mining sequence
The mine wide numerical model was sequenced using 18 individual mining steps, with the
sequence being supplied by Terramin. The simulated mining sequence covered the initial decline
development, through to the extraction of the final cut-and-fill drive. The simulated mining
sequence was generally ‘rolling’, that is, once established, it repeats until the end of mine life.
Within the mine wide model, a maximum of four cut-and-fill blocks were active at any given time,
each in a different stage of the mining block. A summary of the simulated mining sequence is
shown in Table 4, and a schematic is presented in Figure 11.
Table 4 General Mining Sequence
Step Block 1 Block 2 Block 3 Block 4 Block 5
1 Mine level
access Decline to level - - -
2 Mine first
double lift
Mine level
access Decline to level - -
3 Wait Mine first
Double Lift
Mine level
access
Decline to
level -
4 Mine first
overhand lift Wait
Mine first double
lift
Mine level
access
Decline to
level
5 Mine under Sill
Pillar
Mine first
overhand lift Wait
Mine first
double lift Mine SLAC
6 Block Finished Mine under Sill
Pillar
Mine First
Overhand Lift Wait
Mine first
double lift
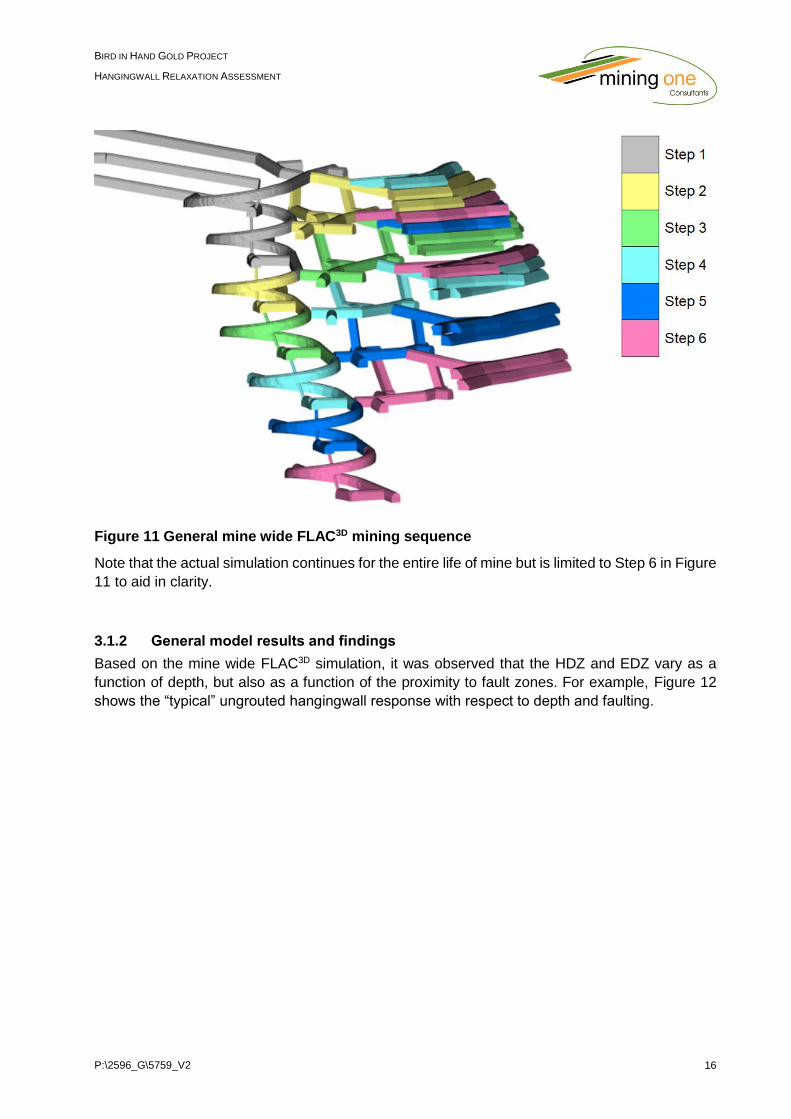
P:\2596_G\5759_V2 16
BIRD IN HAND GOLD PROJECT
HANGINGWALL RELAXATION ASSESSMENT
Figure 11 General mine wide FLAC3D mining sequence
Note that the actual simulation continues for the entire life of mine but is limited to Step 6 in Figure
11 to aid in clarity.
3.1.2 General model results and findings
Based on the mine wide FLAC3D simulation, it was observed that the HDZ and EDZ vary as a
function of depth, but also as a function of the proximity to fault zones. For example, Figure 12
shows the “typical” ungrouted hangingwall response with respect to depth and faulting.

P:\2596_G\5759_V2 17
BIRD IN HAND GOLD PROJECT
HANGINGWALL RELAXATION ASSESSMENT
Figure 12 Extent of hangingwall relaxation – ungrouted case
As shown in Figure 12, the ungrouted hangingwall EDZ increases with depth, and generally
reaches a thickness of 6 to 8m. This EDZ of 8m also corresponds with the “interaction distance”
between the development and the Hangingwall Lower fault zone. It is interesting to note how
similar these “standoff” distances are to the practical recommendations presented in Section 2.4,
requiring a 6 to 8m ‘bulkhead’ between the active area and water bearing country. This general
ungrouted hangingwall response to mining (i.e. relaxation) is also evident in sections that are
closer or further away from the Hangingwall Lower fault zone. Two “extreme” cases of the fault
proximity are shown in Figure 13.
Figure 13 Hangingwall Damage Zone for far (left) and near (right) fault proximity – ungrouted case
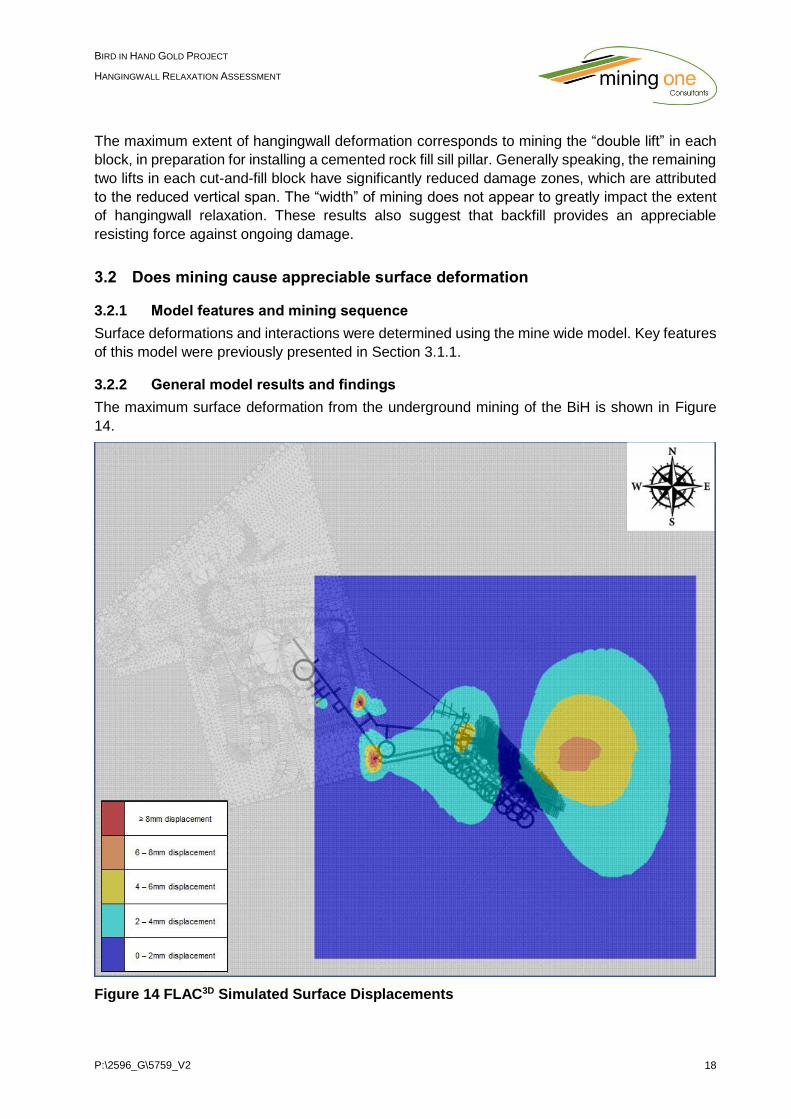
P:\2596_G\5759_V2 18
BIRD IN HAND GOLD PROJECT
HANGINGWALL RELAXATION ASSESSMENT
The maximum extent of hangingwall deformation corresponds to mining the “double lift” in each
block, in preparation for installing a cemented rock fill sill pillar. Generally speaking, the remaining
two lifts in each cut-and-fill block have significantly reduced damage zones, which are attributed
to the reduced vertical span. The “width” of mining does not appear to greatly impact the extent
of hangingwall relaxation. These results also suggest that backfill provides an appreciable
resisting force against ongoing damage.
3.2 Does mining cause appreciable surface deformation
3.2.1 Model features and mining sequence
Surface deformations and interactions were determined using the mine wide model. Key features
of this model were previously presented in Section 3.1.1.
3.2.2 General model results and findings
The maximum surface deformation from the underground mining of the BiH is shown in Figure
14.
Figure 14 FLAC3D Simulated Surface Displacements

P:\2596_G\5759_V2 19
BIRD IN HAND GOLD PROJECT
HANGINGWALL RELAXATION ASSESSMENT
Note that as previously mentioned in Section 1.2.2, surface related issues are not caused by
displacements as such but are caused by a combination of angular distortion and horizontal strain.
Figure 14 is presented to emphasise how small the surface interactions from mining have been.
Using the surface damage criterions previously presented in Table 1, an indication of the expected
surface interactions is shown in Figure 15. Note that in Figure 15, the scale has been decreased
to aid in clarity.
Figure 15 Surface Damage Classifications showing the highest areas of damage
It is shown in Figure 15 that the largest surface issues are associated with the underground shaft
collars and in general, the FLAC3D results suggest negligible surface issues. The local damage
associated with shaft collars would be quantified as “typical” and are mediated during their design
and excavation. In general, there are no anticipated surface issues.

P:\2596_G\5759_V2 20
BIRD IN HAND GOLD PROJECT
HANGINGWALL RELAXATION ASSESSMENT
3.3 Is the proposed hangingwall grout curtain appropriately positioned and sized to accommodate the anticipated hangingwall relaxation
3.3.1 Model features and mining sequence
The local scale numerical model was sequenced using 35 individual mining steps, with the
sequence being based on the mine wide sequence. Development in the proximity of the
Hangingwall Lower fault zones were limited in size to “cuts” of about 5m, to increase the load
shedding accuracy when mining through the grout curtain. The simulated mining sequence
covered the extraction of the cut-and-fill block associated with the highest water mark from site
testing and included the simulated extraction of two additional cut-and-fill blocks below. The
previous mining levels were included in the simulation to correctly account for the regional stress
abutments. The local scale numerical model is shown in Figure 16.
Figure 16 Grout curtain analysis mine sequence
3.3.2 General model results and findings
Figure 17 presents the simulated damage zone through the most affected areas and also shows
the mine wide EDZ.

P:\2596_G\5759_V2 21
BIRD IN HAND GOLD PROJECT
HANGINGWALL RELAXATION ASSESSMENT
Figure 17 Simulation results showing the Excavation Damage Zone extent in the most unfavourable conditions
Shown in Figure 17 is how the grout curtain provides a “bubble” of reduced damage, which is to
be expected. Based on the simulation results, the grout curtain appears to be strong enough to
significantly limit the extent of local hangingwall relaxation/ damage, with the EDZ “almost
vanishing” in the grouted region.
It does need to be noted that the small zones of EDZ do form within the grout curtain, that change
in size when mining the lower block sill pillar levels. It also needs to be noted that these influences
are small, generally isolated, and occur in thinly grouted sections close to the Hangingwall Lower
fault zone and are expected to have minimal impacts. These simulation EDZ zones are expected
to have minimal impacts on the overall grout effectiveness (i.e. it is unlikely to cause the grout
effectiveness to drop below the 70% incorporated into the mine’s water management design) as
they do not “link up” with ungrouted sections of rock, and hence, there is still an appreciable grout
barrier between the water baring fault zones, and the cut-and-fill drives.
If overly conservative design philosophies are used, these results suggest that the grout curtain
thickness may need to be increased beyond the recommended 5m from development when
mining in very close proximity to faulted zones or require a minor restriction in mining proximity.
It is likely that by increasing the grout curtain and/or increasing the mining standoffs, the effects
(i.e. the minor damage to the grout curtain) can be reduced to low or negligible levels (i.e. a minor
reduction of the effectiveness of grouting).
3.4 Does mining progressive cut-and-fill lifts poste potential relaxation issues to inaccessible regions of the hangingwall?
As discussed in Section 1.2.4, this question was covered using the mine wide and local scale
FLAC3D models. These areas prior to failure are similar in nature to those discussed in Section
3.3. The FLAC3D results demonstrated that the proposed grout curtain remains generally intact
over the mining of successive lifts.
P:\2596_G\5759_V2 22
BIRD IN HAND GOLD PROJECT
HANGINGWALL RELAXATION ASSESSMENT
It was noted that small changes in grout section close to the simulated fault zones showed
detectable changes, only on the mining of subsequent sill pillars for each proceeding cut-and-fill
block. These isolated zones of damage are expected to have minimal impacts on the overall grout
effectiveness (i.e. it is unlikely to cause the grout effectiveness to drop below the 70%
incorporated into the mine’s water management design) as they do not “link up” with ungrouted
sections of rock, and hence, there is still an appreciable undamaged grout barrier between the
fault zones, and the cut-and-fill drives.
If overly conservative design philosophies are used, these results suggest that the grout curtain
thickness may need to be increased beyond the recommended 5m from development when
mining in very close proximity to faulted zones or require a minor restriction in mining proximity.
It is likely that by increasing the grout curtain and/or increasing the mining standoffs, the effects
(i.e. the minor damage to the grout curtain) can be reduced to low or negligible levels (i.e. a minor
reduction of the effectiveness of grouting).

P:\2596_G\5759_V2 23
BIRD IN HAND GOLD PROJECT
HANGINGWALL RELAXATION ASSESSMENT
4 SUMMARY OF KEY FINDINGS
Mining One Consultants were commissioned by Terramin Australia Limited to investigate and
provide insight to the interactions between mining, regional ground movement, and their effect on
the proposed water management pre-injection grouting for the Bird-in-Hand Gold Project. This
investigation was in response to several technical queries regarding whether relaxation of the
hangingwall would have any impact on the groundwater management system proposed by the
mine. This investigation was able to provide insights to the interaction between mining, regional
ground movement, and their effect on the proposed water management pre-injection grouting. A
summary of the key findings relating to each scope question is detailed below:
To what extent does mining cause the hangingwall to relax in the ore drives?
The hangingwall relaxation increases as a function of depth and is typically greater than 4m, and
at most 8m in typical ground conditions. The specifics controlling the hangingwall relaxation are
primarily related to four key considerations:
➢ Proximity to faulting/broken ground: The closer mining is to fault zones, the more
hangingwall relaxation / damage that occurs. Based on the FLAC3D simulations, mining within
8m of the hangingwall fault zones shows considerable interactions. These findings do align
with the general guidelines of having a 6-8m “bulkhead” of grouted or competent rock.
➢ Vertical hangingwall exposure: The largest hangingwall relaxation/damage is associated
with the floor benching (i.e. the largest unfilled span) in preparation of installing the cemented
rock fill sill pillar.
➢ Mining Depth: as the depth of mining increases, the depth of damage / relaxation in the
hangingwall increases with depth. The depth of hangingwall relaxation/damage in the upper
levels (as a single number) is 4m.
➢ Backfilling: The results suggest that backfilling provides a considerable reduction in the
amount of hangingwall relaxation. Timely backfilling of open voids will help reduce the depth
of hangingwall relaxation.
Does mining cause appreciable surface deformation?
As a general statement, there is no appreciable surface deformation caused by underground
mining. The highest recorded surface deformations and damage potential was associated with
the surface shaft collars. The damage potential for these areas were categorised as “slight” and
are not expected to cause significant issues.
Is the proposed hangingwall grout curtain appropriately positioned and sized to
accommodate the anticipated hangingwall relaxation?
The FLAC3D results demonstrated that the proposed grout curtain design is generally appropriate
for application at the Bird-in-Hand Gold Project. It was noted that very small and isolated zones
of grout curtain damage were detectable in thinly grouted sections close to the simulated fault
zones. These isolated zones of damage are expected to have minimal impacts on the overall
grout effectiveness (i.e. it is unlikely to cause the grout effectiveness to drop below the 70%
incorporated into the mine’s water management design) as they do not “link up” with ungrouted
sections of rock, and hence, there is still an appreciable undamaged grout barrier between the
fault zones, and the cut-and-fill drives. It is likely that by increasing the grout curtain and/or
increasing the mining standoffs, the effects (i.e. the minor damage to the grout curtain) can be
reduced to low or negligible levels (i.e. a minor reduction of the effectiveness of grouting).

P:\2596_G\5759_V2 24
BIRD IN HAND GOLD PROJECT
HANGINGWALL RELAXATION ASSESSMENT
Does mining progressive cut-and-fill lifts pose potential relaxation issues to inaccessible
regions of the hangingwall?
The FLAC3D results demonstrate that the proposed grout curtain remains generally intact over the
mining of successive lifts. It was noted that small changes in grout section close to the simulated
fault zones showed detectable changes, only on the mining of subsequent sill pillars. These
isolated zones of damage are expected to have minimal impacts on the overall grout effectiveness
(i.e. it is unlikely to cause the grout effectiveness to drop below the 70% incorporated into the
mine’s water management design) as they do not “link up” with ungrouted sections of rock, and
hence, there is still an appreciable undamaged grout barrier between the fault zones, and the cut-
and-fill drives. It is likely that by increasing the grout curtain and/or increasing the mining
standoffs, the effects (i.e. the minor damage to the grout curtain) can be reduced to low or
negligible levels (i.e. a minor reduction of the effectiveness of grouting).

P:\2596_G\5759_V2 25
BIRD IN HAND GOLD PROJECT
HANGINGWALL RELAXATION ASSESSMENT
5 REFERENCES
ANDRA 2005. Evaluation of the feasibility of a geological repository in an argillaceous formation.
Dossier 2005 Argile, technical report.
Barton, N 2012. ‘Assessing Pre-Injection in Tunnelling’, Tunnelling Journal, Dec.2011/Jan. 2012,
pp. 44-50.
Bijelac, M & Roache, B 2017. ‘Bird-in-Hand Gold Project Geotechnical Assessment’, Mining One
Consultants, Document Number, 2241_G/4819.
Fechner, K 2019. Personal Communication
Grant, B 2017. ‘Bird-in-Hand Gold Project – Grouting for Groundwater Control’, MultiGrout
Australia Report.
Harrison, J 2011. ‘Mine subsidence’, in SME Mining Engineering Handbook, third edition, pp. 627-
644. (Society for Mining Metallurgy and Exploration: Littleton).
Jukic, V & Corbett, J 2017. ‘Baseline Contamination Assessment’, Golder Associates, Report
Number, 1659870-001-R-Rev1.
Martino, J & Chandler, N 2004. ‘Excavation-induced damage studies at the underground research
laboratory’, International Journal of Rock Mechanics and Mining Sciences, vol. 41, no. 8, pp.
1413-1426.
Mining One Consultants, 2019. ‘Bird-in-Hand Gold Project Numerical Modelling Proposal’,
Document Number, PM3072/5682.
Perras, M, Lam, T & Diederichs, M 2010. ‘A review of excavation damage zones in sedimentary
rocks with emphasis on numerical modelling for EDZ definition’, The Canadian Geotechnical
Society’s Annual Conference – Geo2010, Calgary, Albera, Canada, September 2010.
Perras, M. (2014). Understanding and predicting excavation damage in sedimentary rocks: A
continuum-based approach. Doctoral dissertation: Queen's University, Kingston, Ontario,
Canada.
Tsang, C. F., Bernier, F., and Davies, C. (2005). Geohydromechanical processes in the
Excavation Damaged Zone in crystalline rock, rock salt, and indurated and plastic clays—in the
context of radioactive waste disposal. International Journal of Rock Mechanics and Mining
Sciences, 42(1), 109-125).
Vakili, A 2016. ‘An improved unified constitutive model for rock material and guidelines for its
application in numerical modelling’, Computers and Geotechnics, vol. 80(2016), pp. 261-282.

P:\2596_G\5759_V2
BIRD IN HAND GOLD PROJECT
HANGINGWALL RELAXATION ASSESSMENT
Appendix A
Technical Details Appendix
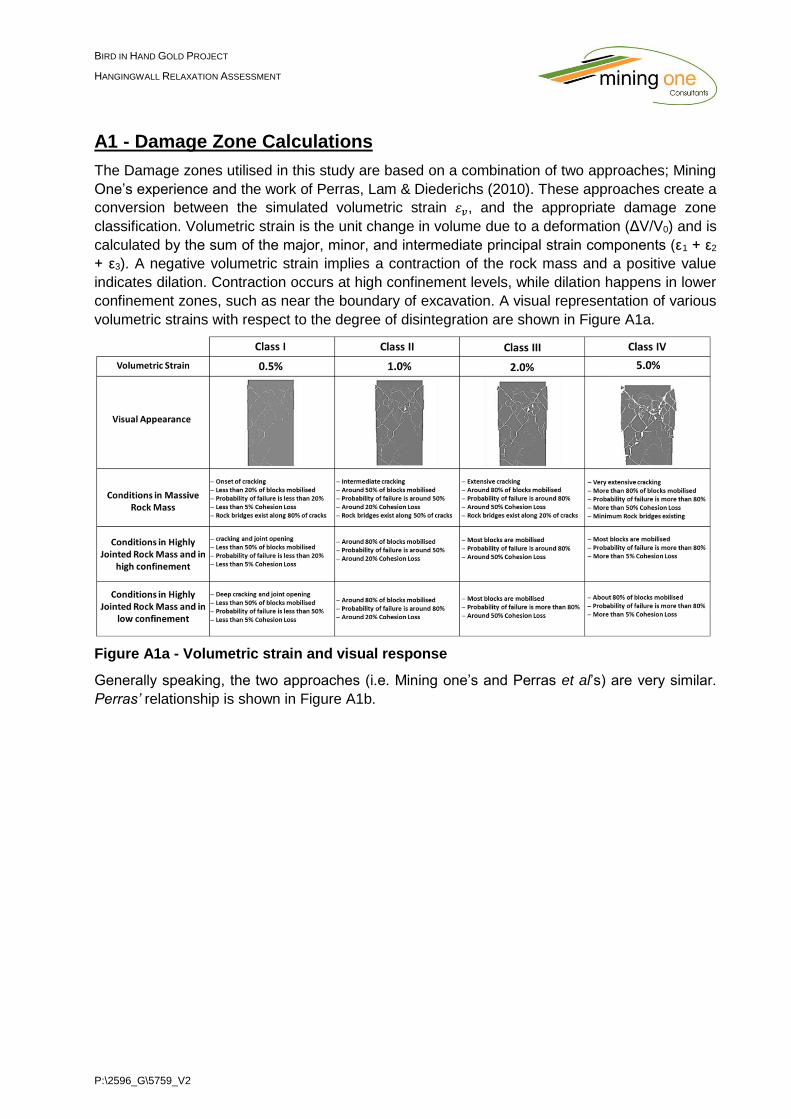
P:\2596_G\5759_V2
BIRD IN HAND GOLD PROJECT
HANGINGWALL RELAXATION ASSESSMENT
A1 - Damage Zone Calculations
The Damage zones utilised in this study are based on a combination of two approaches; Mining
One’s experience and the work of Perras, Lam & Diederichs (2010). These approaches create a
conversion between the simulated volumetric strain 𝜀𝑣, and the appropriate damage zone
classification. Volumetric strain is the unit change in volume due to a deformation (ΔV/V0) and is
calculated by the sum of the major, minor, and intermediate principal strain components (ε1 + ε2
+ ε3). A negative volumetric strain implies a contraction of the rock mass and a positive value
indicates dilation. Contraction occurs at high confinement levels, while dilation happens in lower
confinement zones, such as near the boundary of excavation. A visual representation of various
volumetric strains with respect to the degree of disintegration are shown in Figure A1a.
Figure A1a - Volumetric strain and visual response
Generally speaking, the two approaches (i.e. Mining one’s and Perras et al’s) are very similar.
Perras’ relationship is shown in Figure A1b.

P:\2596_G\5759_V2
BIRD IN HAND GOLD PROJECT
HANGINGWALL RELAXATION ASSESSMENT
Figure A1b Relationship between Damage Zones, volumetric strain and yielding. Results in the Figure relate to a 10m diameter circular excavation. (from Perras Lam & Diederichs 2010)
Based on Figure A1b it can be seen that the Highly Damaged Zone corresponds approximately
to a volumetric strain of 2.5 to 3.5%, with the Excavation Damage Zone corresponding to arguably
no volumetric strain. Perras’ findings are somewhat contradictory in how they define the
Excavation Damage Zone as the boundary spans the entire range of simulated damage (0% to
100% yielding), with no dilutional response. Based on Mining One’s previous experience, the
typical onset of damage is better approximated by a conservative volumetric strain of 0.5%.
comparisons between the damage zones for each method is shown in Table A1a.
Table A1a Relationships between Damage Zones and identification criteria
Rock Damage Zone Findings from Perras
et al.
Mining One’s
Experience
Adopted Damage
Zone Indicators
Highly Damaged
Zone ≥ 3% 𝜀𝑣 ≥ 3% 𝜀𝑣 ≥ 2% 𝜀𝑣
Excavation Damage
Zone 0% 𝑡𝑜 3% 𝜀𝑣 0.5% 𝑡𝑜 3% 𝜀𝑣 0.33% 𝑡𝑜 2% 𝜀𝑣
Excavation Influence
Zone
No yielding of
zones/elements < 0.5% 𝜀𝑣 < 0.33% 𝜀𝑣

P:\2596_G\5759_V2
BIRD IN HAND GOLD PROJECT
HANGINGWALL RELAXATION ASSESSMENT
Note the addition of an “adopted damage zone indicators” column in Table A1a. This adopted
value utilises a Factor of Safety (FOS) of 1.5 in the calculation. This has been applied to the
critical volumetric strain to “inflate” the expected damage zone beyond what would otherwise be
expected. This application of the FOS was chosen as it creates a “safety margin” associated with
the design consideration, that is, the depth of damage. The application of the concept of a FOS
in mining is typically done with respect to loads or weights. For example, A computer model would
be used to estimate the damage zone using reasonable material inputs and damage depths (e.g.
3% 𝜀𝑣), then the associated volume of material to be supported would be calculated from this
volume. The FOS is then either applied to the support weight, or the support capacity when
considering designs. As previously mentioned for this application, the important consideration is
the depth of failure, and hence, the FOS has been applied to the failure depth. In practice these
damage estimates are expected to be over estimates, but are calculated in accordance with a
FOS of 1.5.

P:\2596_G\5759_V2
BIRD IN HAND GOLD PROJECT
HANGINGWALL RELAXATION ASSESSMENT
A2 - Typical Rockmass Properties
In order to provide insight into the “typical” behaviour of the country rock at The Bird-in-Hand, the
suppled geotechnical logs were reviewed. From these logs, the weighted values corresponding
to each key rockmass parameter in the 𝑄-system was determined. The most common value was
then chosen for each key lithology or domain. A summary of these “typical” rockmass values are
shown in Table A2a.
Table A2a Typical Rockmass Q-System Parameters
Rockmass Parameter
Host Rock Limestone Broken Fault
Zones Grouted
Rock Grouted Fault
Zones
𝑅𝑄𝐷 90% - 100% 90% -100% 40% - 50% 100% 60% - 70%
𝐽𝑛 Joint Set Number
4 Two Sets
4 Two Sets
15 Four or More
Sets
4 Two Sets
15 Four or More
Sets
𝐽𝑟 Joint Roughness
Number
1.0 – 1.5 Smooth planar
Rough planar
1.0 – 1.5 Smooth planar Rough planar
1.0 – 1.5 Smooth planar Rough planar
1.0 – 1.5 Smooth planar Rough planar
1.0 – 1.5 Smooth planar Rough planar
𝐽𝑎 Joint Alteration
Number
4 Clay coating
4 Clay coating
4 Clay coating
0.75 – 1 Healed Joint
0.75 – 1 Healed Joint
𝑄′ 5.625 – 9.375
5.625 – 9.375
0.667 – 1.250 25.000 – 50.000
4.000 – 9.333
𝐺𝑆𝐼 Geological
Strength Index 56 – 65 56 – 65 30 – 40 77 – 86 57 – 71
Note that the Geological Strength index was calculated using the following relationship:
𝐺𝑆𝐼 = 52 𝐽𝑟/𝐽𝑎
1 + 𝐽𝑟/𝐽𝑎+
𝑅𝑄𝐷
2
As a double check of the appropriate GSI, the distribution of all measured GSI values was
compared to a statistical model to describe the entire range of values. From this statistical model
the most common (i.e. mode value) was identified and chosen as the input. Comparisons between
the measured GSI values and the statistical model are shown Figure A2a..

P:\2596_G\5759_V2
BIRD IN HAND GOLD PROJECT
HANGINGWALL RELAXATION ASSESSMENT
Figure A2a Comparison between modelled GSI and GSI from core logging
Also evident in both Table A2a and Figure A2a is the approximately identical geotechnical
rockmass characteristics. These similarities and the limited data associated with the Brighton
Limestones was ultimately used to justify the non-inclusion of each lithology unit. When more data
becomes available, this analysis can be repeated considering the individual lithology responses.
Furthermore, Table A2a presents the adjusted 𝑄-system parameters in accordance to the general
recommendations of Barton. Note that Barton does make reference that these adjustments are
“so conservative they can’t possibly be correct”, that is, the changes in rockmass strength are
significantly more than what is easily estimated. Based on these adjustments, the selection of
grout strength increases are expected to be conservative, but within the level of accuracy required
for this study and typical industry practices.

P:\2596_G\5759_V2
BIRD IN HAND GOLD PROJECT
HANGINGWALL RELAXATION ASSESSMENT
A3 - Modifications Made Prior to FLAC3D Simulation
The following modifications were made to the available wireframes prior to completing the
analysis. This is stated for completeness and transparency:
➢ Fault wireframes were extended at depth and along strike to ensure complete coverage;
➢ The weathered clay surface was extended to cover the area of interest;
➢ All material above the weathered clay boundary was treated as the weak clay material. This
was done due to limited information being available to define weathered characteristics to the
country rock
➢ Fault wireframes were given a “thickness” The Hangingwall Faults were given a 10m
thickness, while the Footwall Fault was given a thickness of 5m as per the general scope of
this assessment. They key fault / fault zone was the Hangingwall Lower Fault.
➢ For the local scale FLAC3D model, the Footwall Fault was not included in this simulation. The
reason for the non-inclusion was its proximity away from the key fault (Hangingwall Lower
Fault) and its proximity to the grout curtain.

P:\2596_G\5759_V2
BIRD IN HAND GOLD PROJECT
HANGINGWALL RELAXATION ASSESSMENT
A4 - Numerical Modelling Inputs
The following justifications were used to select the required numerical modelling inputs:
➢ Density: The median wet density was used as this input. This was to account for loading
conditions associated with the saturated rock mass weight;
➢ Intact Young’s Modulus: chosen using the average value from all laboratory testing data
(Triaxial and Uniaxial) there was a considerable, discrepancy noted between the Young’s
Modulus measurements between the Triaxial and Uniaxial test results, and taking the average
aligned much closer with the general estimates of Young’s Modulus for sedimentary rocks;
➢ Uniaxial Compressive Strength: the UCS value was taken from the available laboratory
testing, a separation was made between values which had a well-defined structural failure,
and intact failure. The value specified corresponds to intact failure strength;
➢ 𝑚𝑖𝑚𝑎𝑥 : similarly, to the Feasibility study the calculated 𝑚𝑖 using the site Triaxial data is
unrealistic. General estimates provided by RocLab were used;
➢ 𝑚𝑖𝑚𝑖𝑛: : this value is specified as half the 𝑚𝑖𝑚𝑎𝑥 .and is based on extensive back analysis;
➢ Anisotropy Factor: this is calculated as the ratio of the UCS of intact rock to the UCS when
failure occurs along the plane of weakness;
➢ Anisotropy Orientation: this is based on the available structural logging and lithology
wireframe orientations;
➢ Geological Strength Index: calculation of GSI is based on the statistical model previously
presented in this appendix;
➢ 𝐶𝑟𝑒𝑠: typical assumption of no cohesive strength at the final state of failed rock;
➢ 𝜙𝑟𝑒𝑠: the residual friction angle is based on the residual angle obtained from site Triaxial
testing
➢ 𝜎𝑡𝑟𝑒𝑠: typical assumption of no tensile strength after failure occurs;
➢ CritRed: this is the value recommended in the IUCM user’s manual;
Mohr-Coulomb material parameters were selected based on the completed laboratory testing.
The Mohr-Coulomb model was chosen due to the high clay content and ductile nature of this
zone.
This study was not focused on looking at designing the sill pillars and underhand exposures. In
order to reduce the number of model inputs that needed to be defined, backfill was treated as an
elastic material. The following elastic parameters were used for backfill:
➢ Density 2300 𝑘𝑔/𝑚3
➢ Young’s Modulus 200 𝑀𝑃𝑎
➢ Poisson’s Ratio 0.20
The material parameters listed above would be described as “typical” values for cemented rock
and are also representative of compacted rock fill.
P:\2596_G\5759_V2
BIRD IN HAND GOLD PROJECT
HANGINGWALL RELAXATION ASSESSMENT
DOCUMENT INFORMATION
Status Final
Version v2
Print Date 29/04/2019
Author(s) Aidan Ford
Reviewed By Kevin Dugan
Pathname P:\2596_G Terramin - Hanging Wall Relaxation
Modelling\WPO\5759_V2.docx
File Name 5759_V2
Job No 2598_G
Distribution PDF emailed to client
DOCUMENT CHANGE CONTROL
Version Description of changes/amendments Author (s) Date
1 Initial Draft for Review. Formatting to be adjusted A.Ford 12/4/19
2 Formatting completed; text amended from Richard
Taylor completed
A.Ford 15/4/19
DOCUMENT REVIEW AND SIGN OFF
Version Reviewer Position Signature Date
v1 K.Dugan Principal Geotechnical
Engineer
12/4/19
v2 K.Dugan Principal Geotechnical
Engineer
29/4/19